2019 EMPLOYEE ENGAGEMENTSURVEY RESULTS
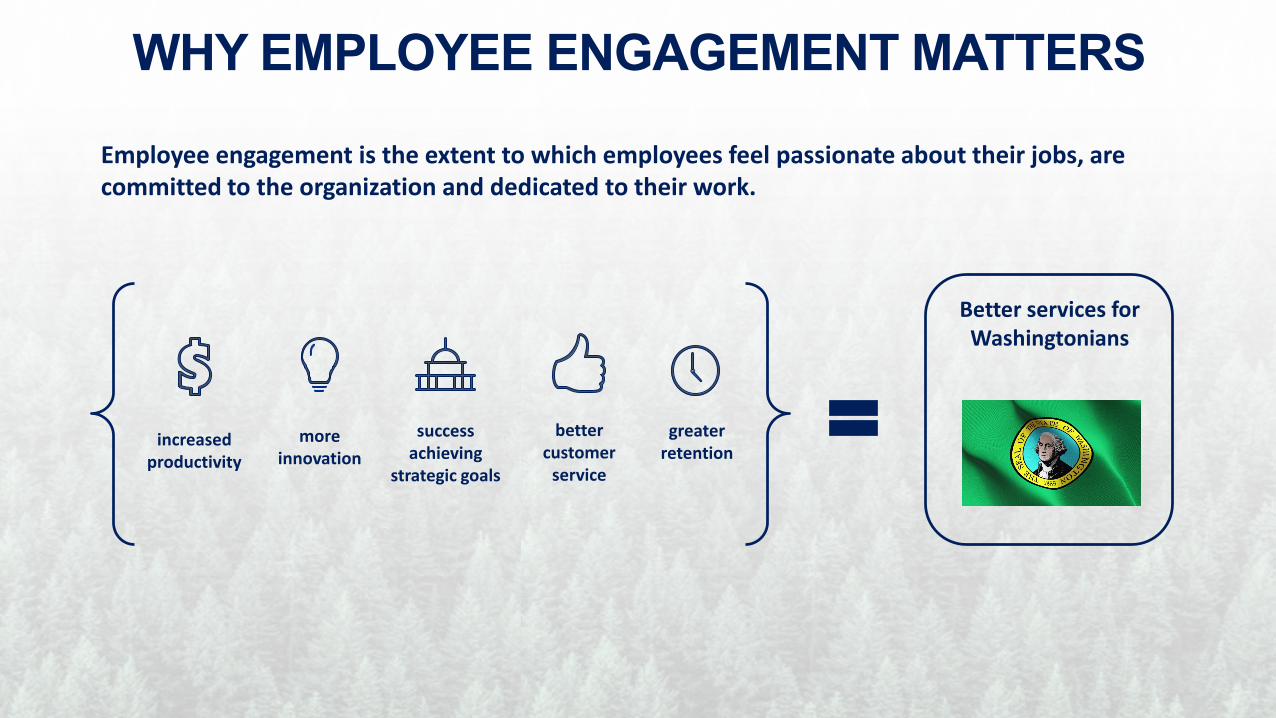
WHY EMPLOYEE ENGAGEMENT MATTERS
Employee engagement is the extent to which employees feel passionate about their jobs, are committed to the organization and dedicated to their work.
increased productivity
better customer
service
success achieving
strategic goals
greater retention
more innovation
Better services for Washingtonians
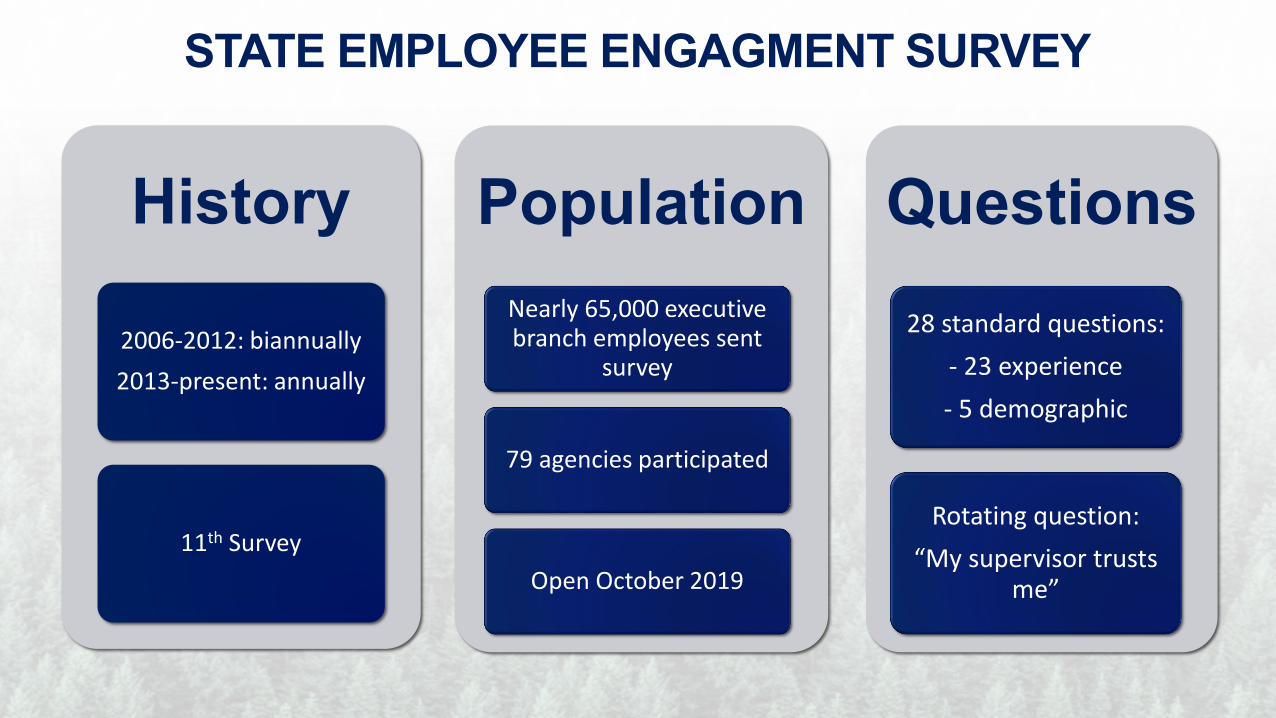
STATE EMPLOYEE ENGAGMENT SURVEY
History
2006-2012: biannually 2013-present: annually
11th Survey
Questions 28 standard questions:
- 23 experience - 5 demographic
Rotating question: “My supervisor trusts
me”
Population Nearly 65,000 executive branch employees sent
survey
79 agencies participated
Open October 2019
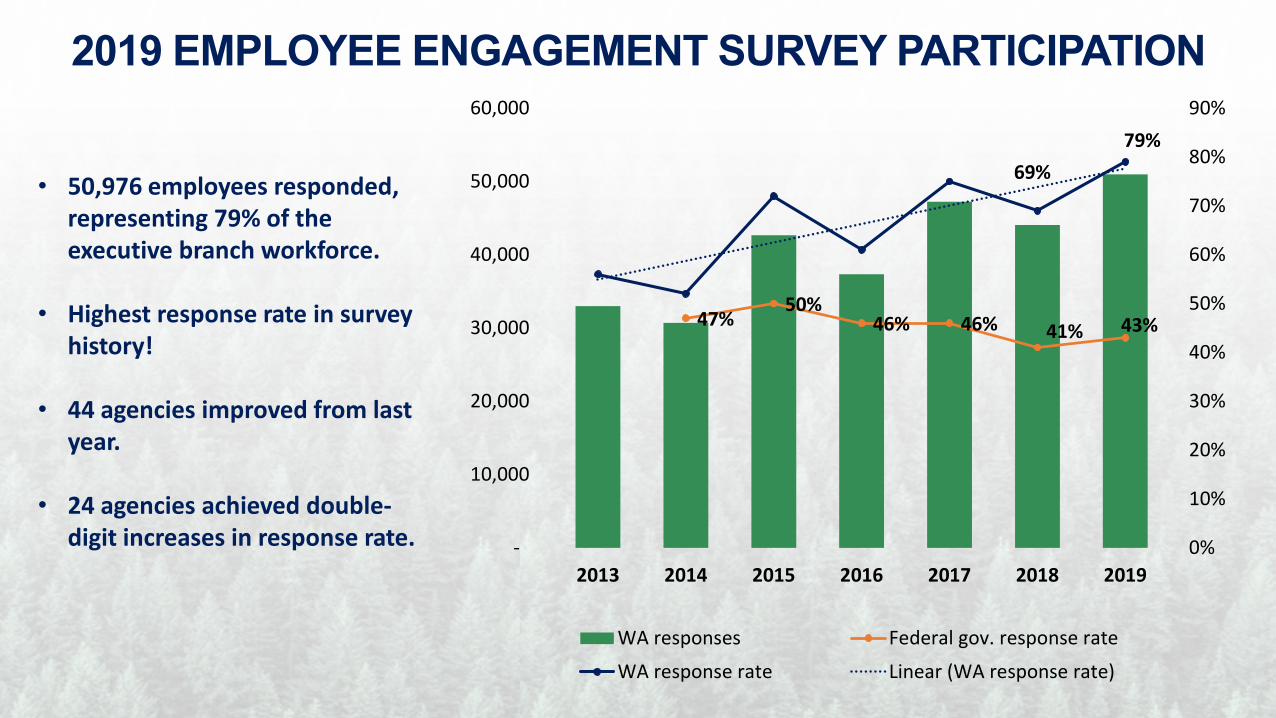
2019 EMPLOYEE ENGAGEMENT SURVEY PARTICIPATION
• 50,976 employees responded, representing 79% of the executive branch workforce.
• Highest response rate in survey history!
• 44 agencies improved from last year.
• 24 agencies achieved double-digit increases in response rate.
60,000 90% 79%
47% 50%
46% 46% 41% 43%
69%80%
50,000 70%
40,000 60%
50% 30,000
40%
20,000 30%
20% 10,000
10%
- 0% 2013 2014 2015 2016 2017 2018 2019
WA responses Federal gov. response rate
WA response rate Linear (WA response rate)
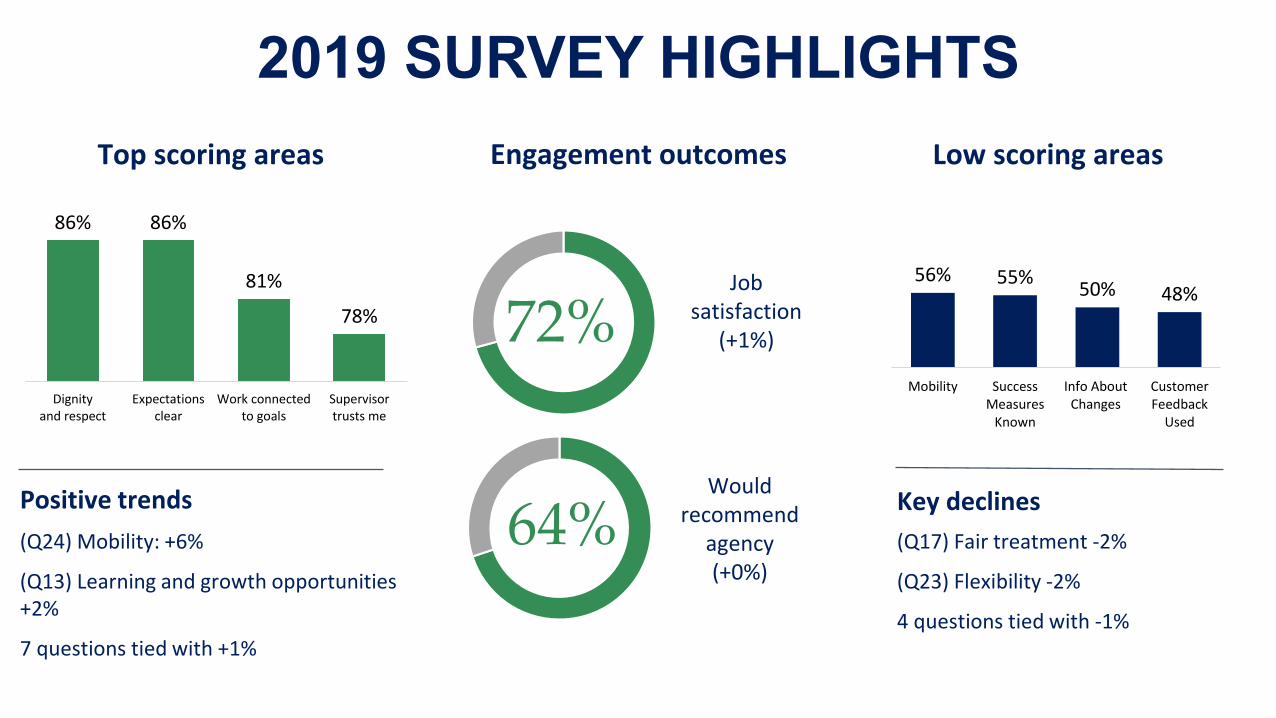
2019 SURVEY HIGHLIGHTS Top scoring areas
86% 86%
81%
78%
Dignity Expectations Work connected Supervisor and respect clear to goals trusts me
Positive trends (Q24) Mobility: +6%
(Q13) Learning and growth opportunities +2%
7 questions tied with +1%
Engagement outcomes
72% Job
satisfaction (+1%)
64% Would
recommend agency (+0%)
Low scoring areas
56% 55% 50% 48%
Mobility Success Info About Customer Measures Changes Feedback
Known Used
Key declines (Q17) Fair treatment -2%
(Q23) Flexibility -2%
4 questions tied with -1%
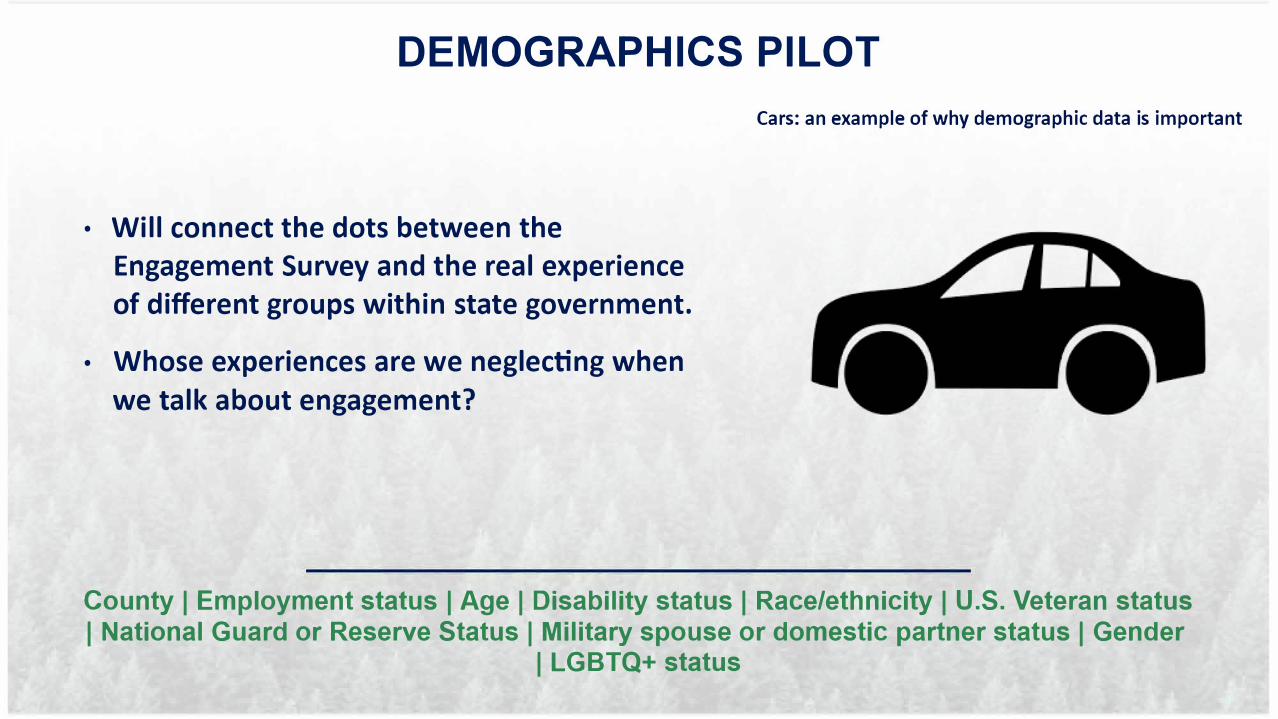
DEMOGRAPHICS PILOT
• Will connect the dots between the
Engagement Survey and the real experience
of different groups within state government.
• Whose experiences are we neglecting when
we talk about engagement?
Cars: an example of why demographic data is important
County I Employment status I Age I Disability status I Race/ethnicity I U.S. Veteran status I National Guard or Reserve Status I Military spouse or domestic partner status I Gender
I LGBTQ+ status

DEMOGRAPHICS PILOT
23 agencies {48% of the workforce) joined
the pilot.
Did not affect response rates or take much
longer to complete.
Employees generally felt comfortable
responding to these questions on the exit
and engagement surveys.
Participation in demographic questions
84%
Exit survey
74%
Engagement
survey
•
•
•
County I Employment status I Age I Disability status I Race/ethnicity I U.S. Veteran status I National Guard or Reserve Status I Military spouse or domestic partner status I Gender
I LGBTQ+ status

MOTIVATION
Relationships The drive to feel respected and connected.
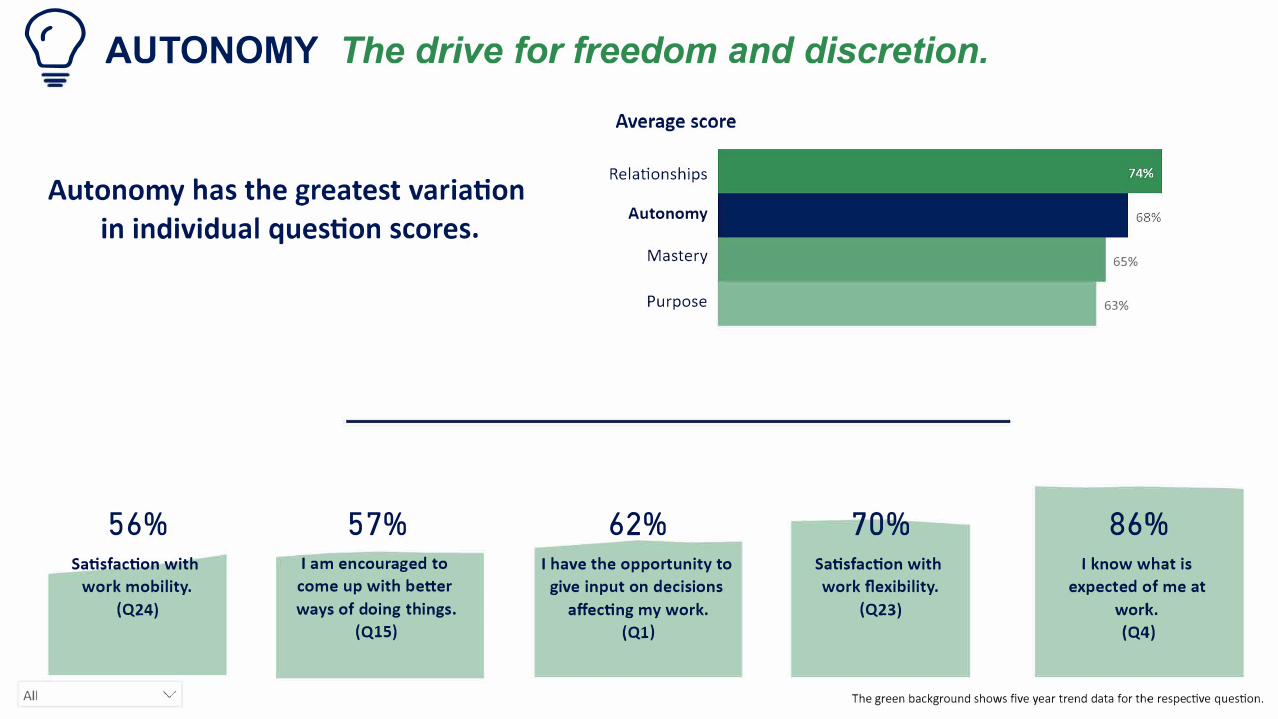
Autonomy The drive for freedom and discretion.
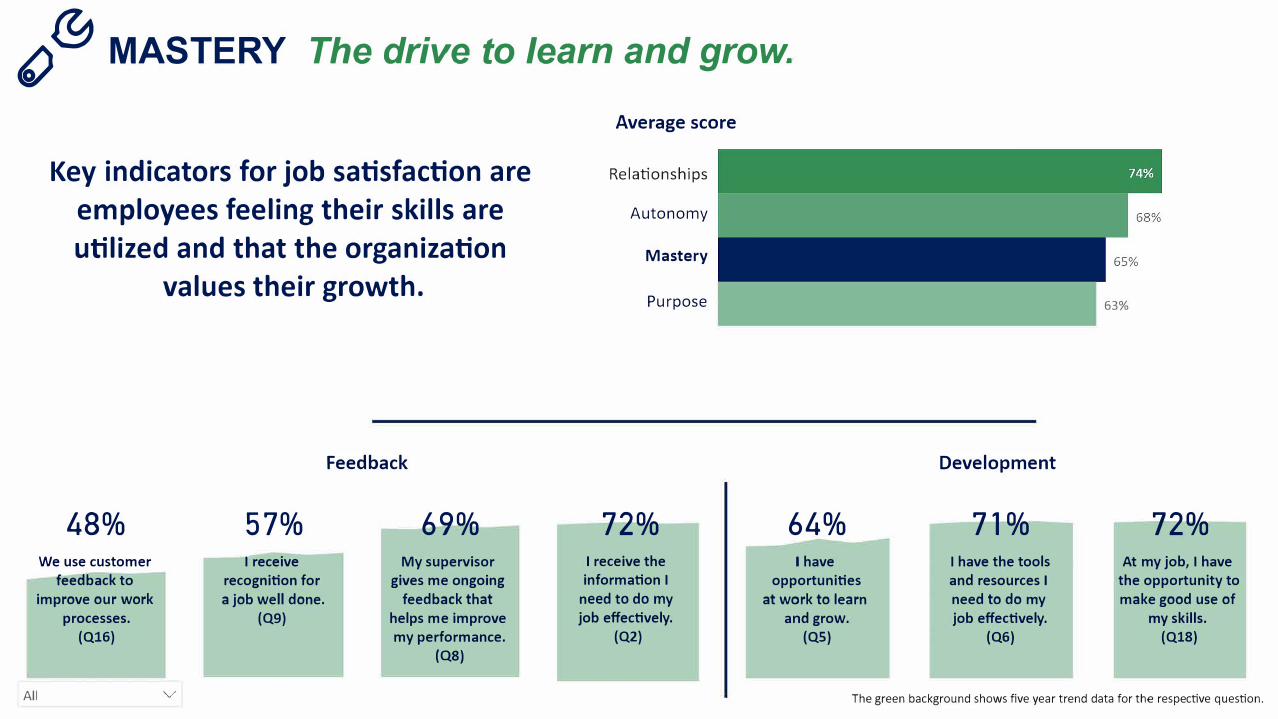
Mastery The drive to learn and grow.
Purpose The drive for meaning.
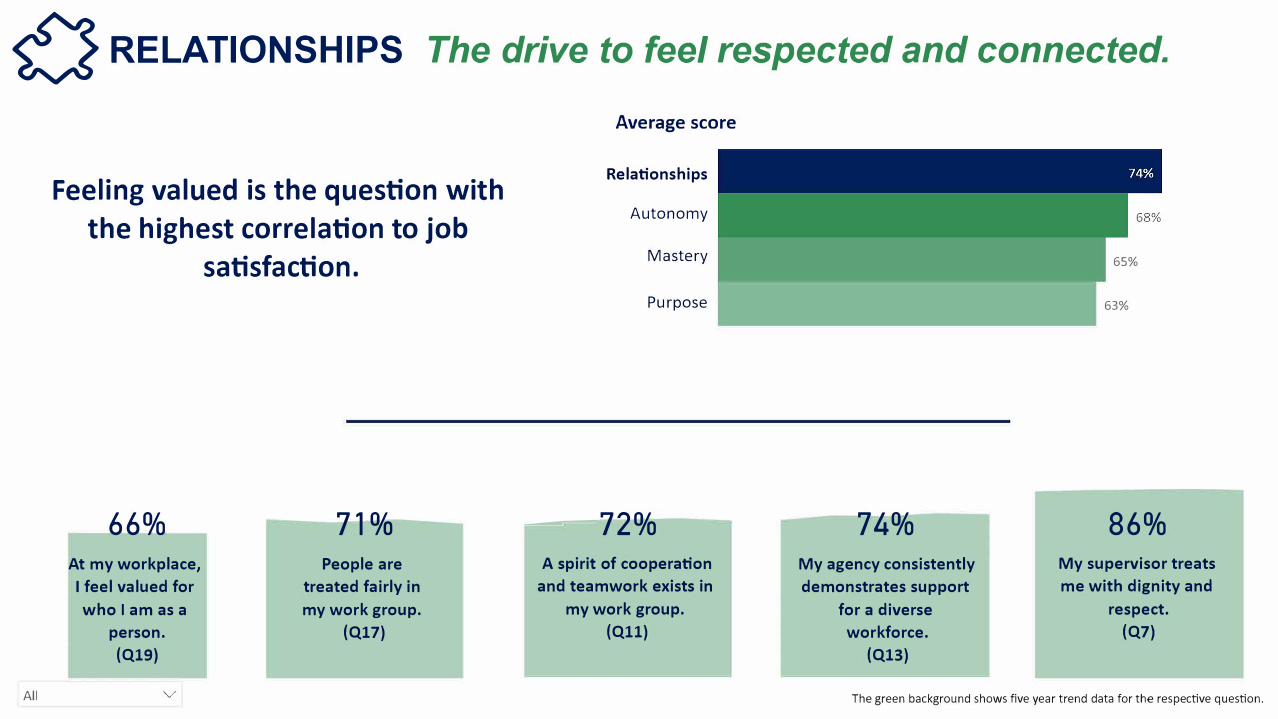
RELATIONSHIPS The drive to feel respected and connected.
Average score
Relationships
Autonomy
Mastery
Purpose
65%
63%
�
All
Feeling valued is the question with
the highest correlation to job
satisfaction.
66%
At my workplace,
I feel valued for
who I am as a
person.
(Ql9)
71%
People are
treated fairly in
my work group.
(Ql7)
V
----,2%
A spirit of cooperation
and teamwork exists in
my work group.
(Qll)
74%
My agency consistently
demonstrates support
for a diverse
workforce.
(Ql3)
86%
My supervisor treats
me with dignity and
respect.
(Q7)
The green background shows five year trend data for the respective question.
<fJ AUTONOMY The drive for freedom and discretion.
Average score
Relationships
Autonomy
Mastery
Purpose
65%
63%
Autonomy has the greatest variation
in individual question scores.
56%
Satisfaction with
work mobility.
(Q24)
57%
I am encouraged to
come up with better
ways of doing things.
(QlS)
62%
I have the opportunity to
give input on decisions
affecting my work.
(Ql)
10%
Satisfaction with
work flexibility.
(Q23)
86%
I know what is
expected of me at
work.
(Q4)
All V The green background shows five year trend data for the respective question.
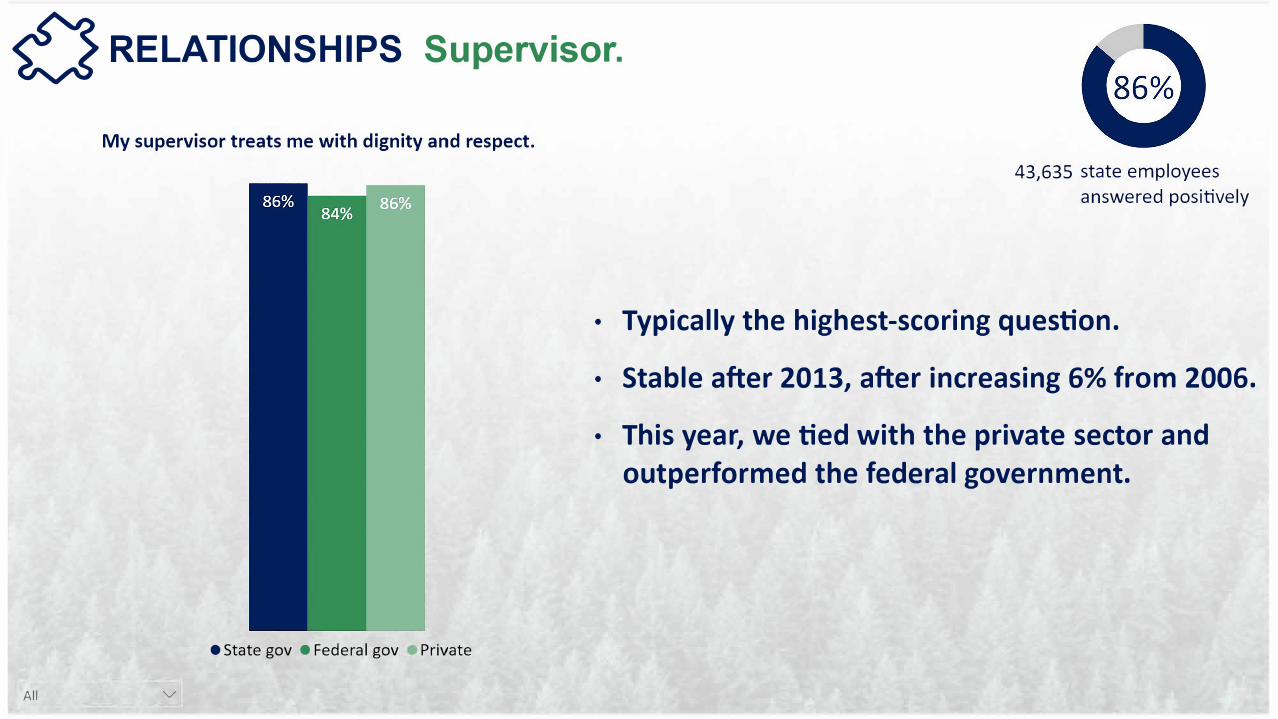
RELATIONSHIPS Supervisor.
43,635 state employees
answered positively
My supervisor treats me with dignity and respect.
estate gov • Federal gov Private
�
All V
• Typically the highest-scoring question.
Stable after 2013, after increasing 6% from 2006.
This year, we tied with the private sector and
outperformed the federal government.
•
•
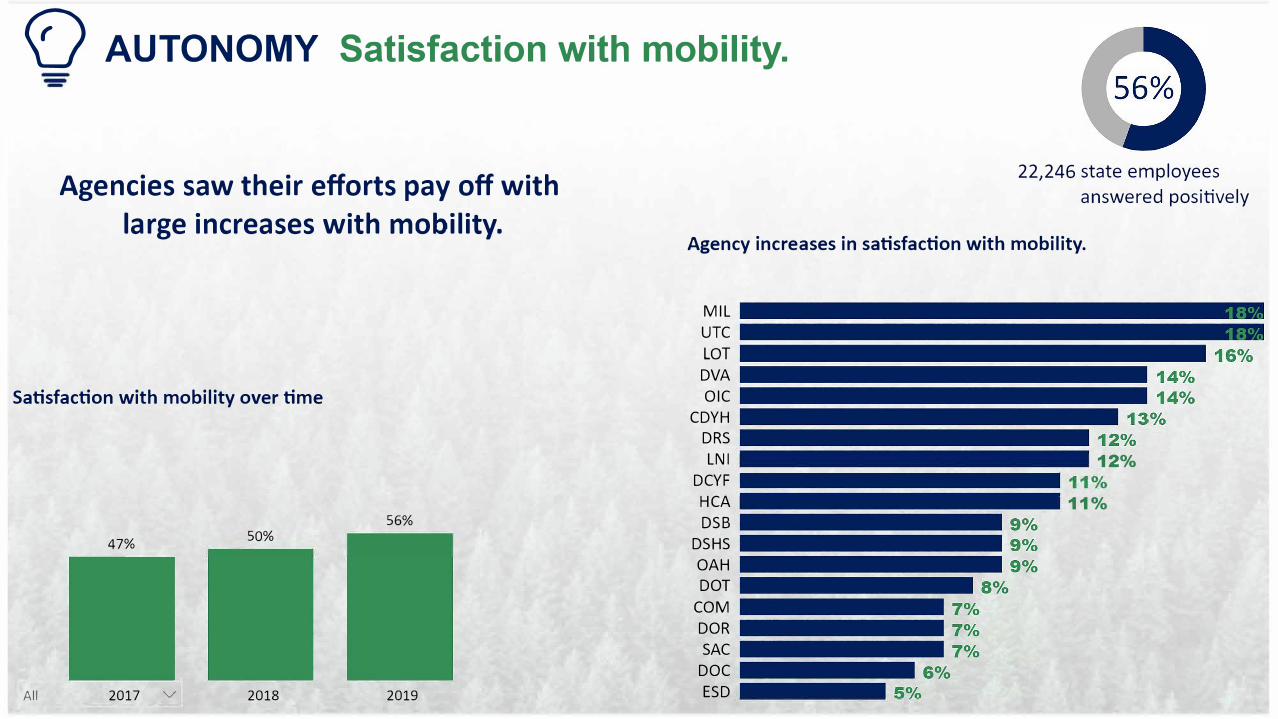
AUTONOMY Satisfaction with mobility.
22,246 state employees
answered positively Agencies saw their efforts pay off with
large increases with mobility. Agency increases in satisfaction with mobility.
MIL
UTC
LOT
DVA
OIC
CDYH
DRS
LNI 12%
DCYF
HCA 11%
DSB
DSHS
OAH
DOT
COM
DOR
SAC
DOC
ESD
Satisfaction with mobility over time
56%
47% 50%
All 2017 V 2018 2019
<f)
() & MASTERY The drive to learn and grow.
Average score
Relationships
Autonomy
Mastery
Purpose 63%
Key indicators for job satisfaction are
employees feeling their skills are
utilized and that the organization
values their growth.
Feedback
48%
We use customer
feedback to
improve our work
processes.
(Q16)
57%
I receive
recognition for
a job well done.
(Q9)
69%
My supervisor
gives me ongoing
feedback that
helps me improve
my performance.
(QS)
All V
72%
I receive the
information I
need to do my
job effectively.
(Q2)
Development
64%
I have
opportunities
at work to learn
and grow.
(QS}
71%
I have the tools
and resources I
need to do my
job effectively.
(QG}
12%
At my job, I have
the opportunity to
make good use of
my skills.
(Q18}
The green background shows five year trend data for the respective question.
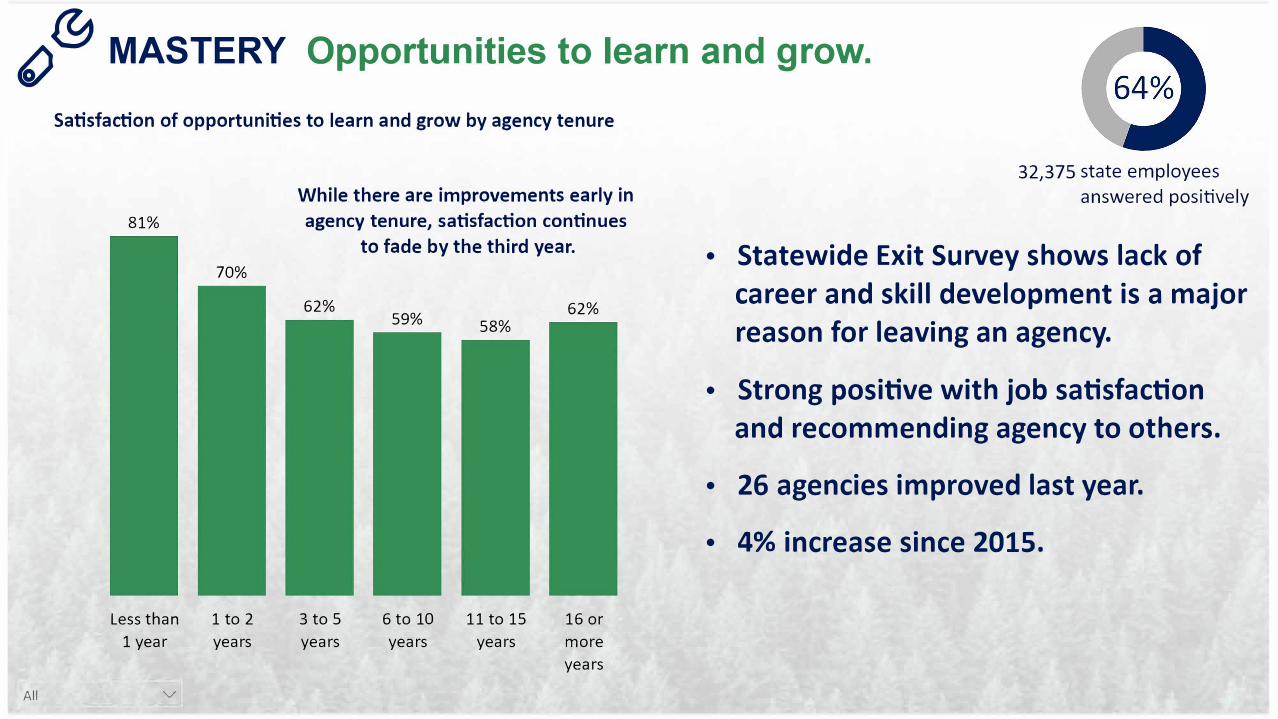
MASTERY Opportunities to learn and grow.
32,375 state employees
answered positively
Statewide Exit Survey shows lack of
career and skill development is a major
reason for leaving an agency.
Strong positive with job satisfaction
and recommending agency to others.
26 agencies improved last year.
4% increase since 2015.
Satisfaction of opportunities to learn and grow by agency tenure
81%
70%
Less than 1 to 2
1 year years
V
While there are improvements early in
agency tenure, satisfaction continues
to fade by the third year.
62%
3 to 5
years
59% 62%
58%
6 to 10 11 to 15 16 or
years years more
years
() &
All
•
•
•
•
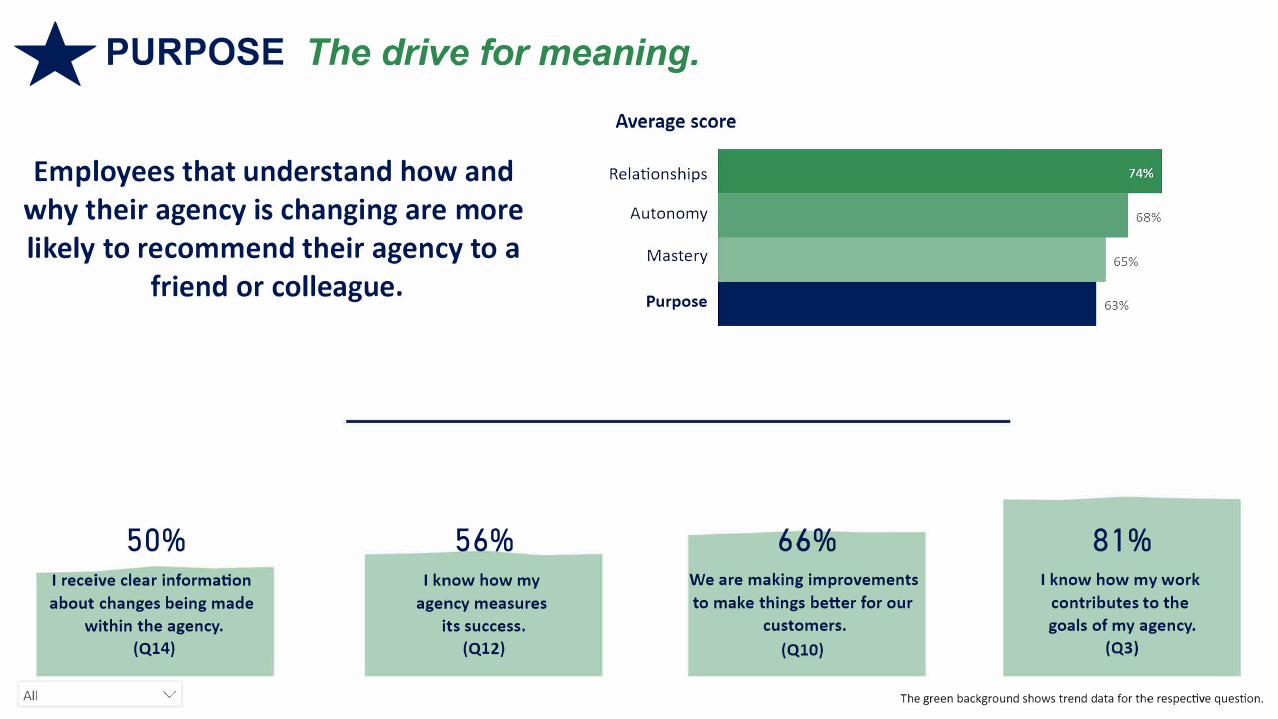
* PURPOSE The drive for meaning.
Average score
Relationships
Autonomy
Mastery
Purpose
Employees that understand how and
hy their agency is changing are more
ikely to recommend their agency to a
friend or colleague.
w
l
50%
I receive clear information
about changes being made
within the agency.
(Q14)
56%
I know how my
agency measures
its success.
(Q12)
66%
We are making improvements
to make things better for our
customers.
(QlO)
81%
I know how my work
contributes to the
goals of my agency.
(Q3)
All V The green background shows trend data for the respective question.
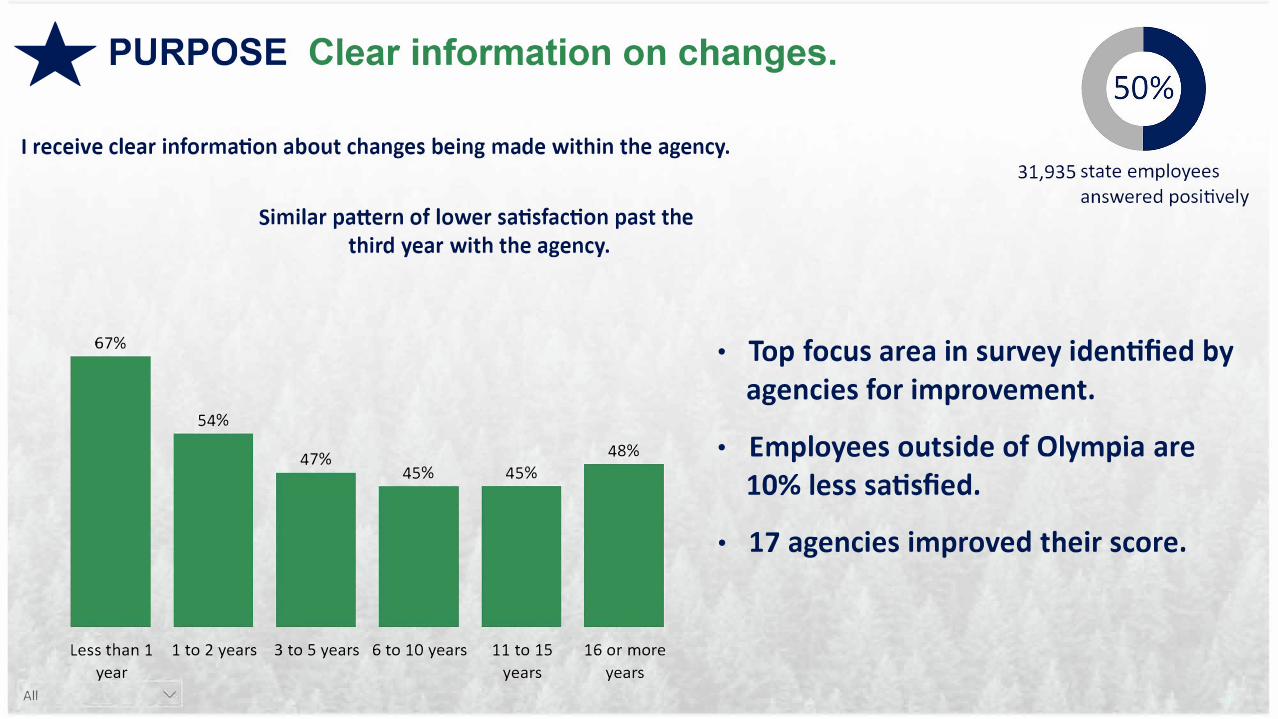
PURPOSE Clear information on changes.
31,935 state employees
answered positively
Top focus area in survey identified by
agencies for improvement.
Employees outside of Olympia are
10% less satisfied.
17 agencies improved their score.
I receive clear information about changes being made within the agency.
All
67%
54%
Similar pattern of lower satisfaction past the
third year with the agency.
47% 48%
45% 45%
Less than 1 1 to 2 years 3 to 5 years 6 to 10 years 11 to 15 16 or more
year yea rs yea rs
•
•
•
*

TAKEAWAYS Historic participation
Reflection of trust built by agencies
Highest response rate andnumber of responses ever!
44 agencies improved theirresponse rate
24 agencies had double-digit increases
Indicators of employee satisfaction
Job and agency satisfaction tied to three key areas:
Feeling valued (Q19)
Opportunities to learn andgrow (Q5)
Skills utilization (Q18)
Demographic questions
The road ahead
Nearly 50% of the workforce eligible for pilot:
Participation was notaffected
Implementation wassuccessful
Didn’t take long
Improvement opportunities in 2020:
Which questions are mostrelevant for the workforce?
Qualitative interviews
Further integration oftechnology
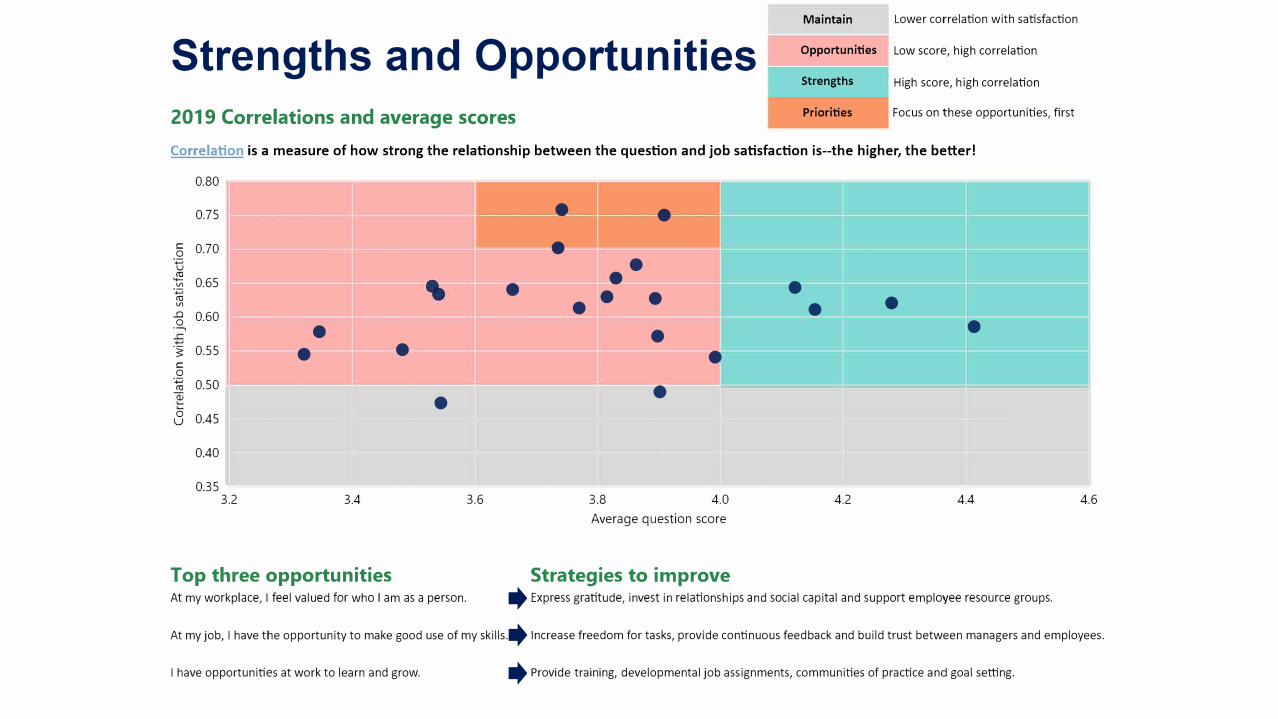
Strengths and Opportunities
2019 Correlations and average scores
Maintain Lower correlation with satisfaction
Opportunities Low score, high correlation
Strengths High score, high correlation
Priorities Focus on these opportunities, first
Correlation is a measure of how strong the relationship between the question and job satisfaction is--the higher, the better!
0.80
0.75 • •
C 0.70 0 •
·..::;
l1J '+-
0.65 VI
·..::;l1J VI
.Cl 0.60 0
·-, •
":i: 0.55 • C
•
• •
•
• • •
• •
• •
• •
0
·..::; 0.50 l1J
• •
0 0.45u
0.40
0.35
3.2 3.4 3.6 3.8 4.0 4.2 4.4
Average question score 4.6
Top three opportunities At my workplace, I feel valued for who I am as a person.
At my job, I have the opportunity to make good use of my skills .
I have opportunities at work to learn and grow.
Strategies to improve Express gratitude, invest in relationships and social capital and support employee resource groups.
Increase freedom for tasks, provide continuous feedback and build trust between managers and employees .
Provide training, developmental job assignments, communities of practice and goal setting.
•
•
•