Download - 2O21 - us.bic.com

SOCIÉTÉ BIC92611 CLICHY CEDEX (FRANCE)
www.bic.com
HALF-YEAR FINANCIAL
2O21
Report

MANAGEMENT REPORT OF THE BOARD OF DIRECTORS FOR THE 6-MONTH PERIOD ENDED JUNE 30, 2021 1
Key figures1.1 2
H1 2021 highlights1.2 3
H1 2021 Group operational trends1.3 4
H1 2021 operational trends by division1.4 7
Group Net Sales by geography1.5 10
Second half 2021 trends and 2021 outlook1.6 10
Impact of change in perimeter and currency 1.7fluctuations on net sales (excludes ARS) 11
Reconciliation with alternative performance 1.8measures 12
Share repurchase program – cancelled shares1.9 13
Related-party transactions1.10 13
Capital evolution1.11 13
Material events that occurred in H1 20211.12 14
Material events that occurred after June 30, 20211.13 14
Description of the principal risks and uncertainties 1.14for the second half 2021 14
Glossary1.15 17
HALF-YEAR CONSOLIDATED FINANCIAL STATEMENTS 19
Consolidated income statement2.1 20
Consolidated statement of comprehensive income2.2 21
Consolidated statement of financial position2.3 22
Consolidated statement of changes in equity2.4 24
Consolidated cash flow statement2.5 25
Notes to the consolidated financial statements2.6 26
STATUTORY AUDITORS’ REVIEW REPORT ON THE HALF-YEARLY FINANCIAL INFORMATION 45
STATEMENT ON THE HALF-YEARLY REPORT 2021 47

1• BIC GROUP - 2021 HALF-YEAR FINANCIAL REPORT •
MANAGEMENT REPORT OF THE BOARD OF DIRECTORS FOR THE 6-MONTH PERIOD ENDED JUNE 30, 2021
KEY FIGURES1.1 2
H1 2021 HIGHLIGHTS1.2 3
H1 2021 GROUP OPERATIONAL TRENDS1.3 4
H1 2021 OPERATIONAL TRENDS BY DIVISION1.4 7
GROUP NET SALES BY GEOGRAPHY1.5 10
SECOND HALF 2021 TRENDS AND 2021 OUTLOOK1.6 10
IMPACT OF CHANGE IN PERIMETER AND CURRENCY FLUCTUATIONS ON NET 1.7SALES (EXCLUDES ARS) 11
RECONCILIATION WITH ALTERNATIVE PERFORMANCE MEASURES1.8 12
SHARE REPURCHASE PROGRAM – CANCELLED SHARES1.9 13
RELATED-PARTY TRANSACTIONS1.10 13
CAPITAL EVOLUTION1.11 13
MATERIAL EVENTS THAT OCCURRED IN H1 20211.12 14
MATERIAL EVENTS THAT OCCURRED AFTER JUNE 30, 20211.13 14
DESCRIPTION OF THE PRINCIPAL RISKS AND UNCERTAINTIES FOR THE SECOND 1.14HALF 2021 14
GLOSSARY1.15 17
MANAGEMENT REPORT OF THE BOARD OF DIRECTORS FOR THE 6-MONTH PERIOD ENDED JUNE 30, 2021
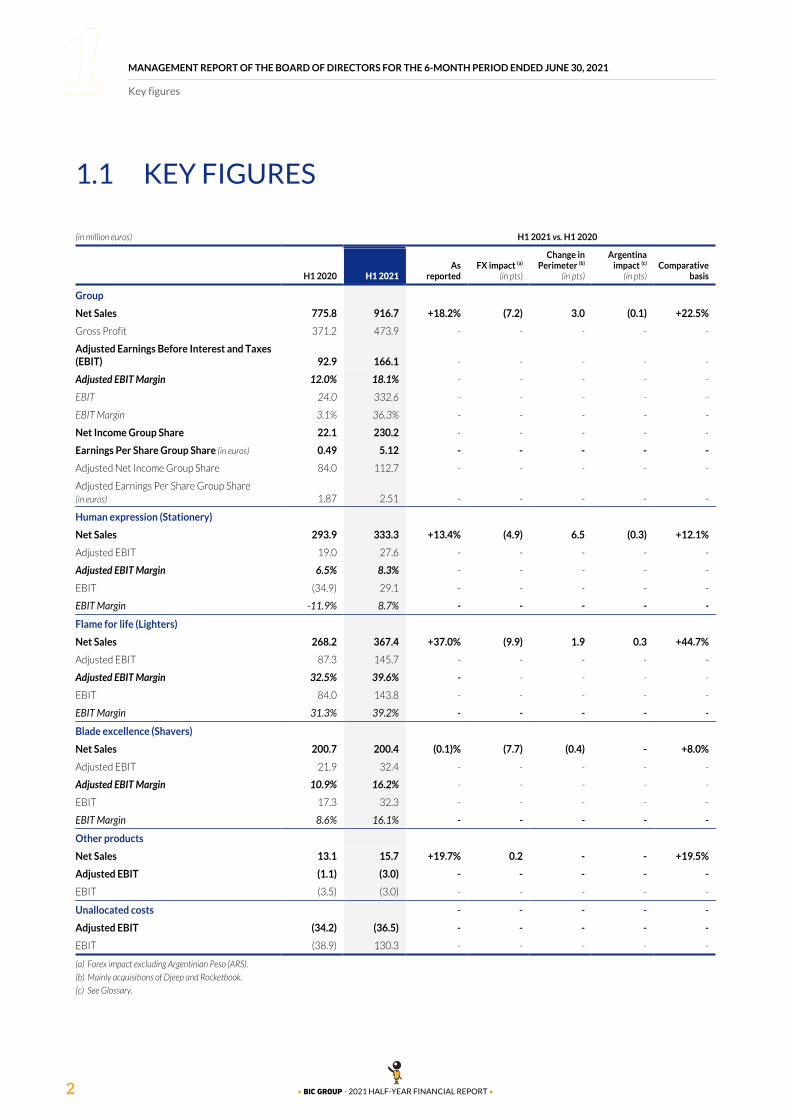
Key figures
2 • BIC GROUP - 2021 HALF-YEAR FINANCIAL REPORT •
KEY FIGURES1.1
(in million euros) H1 2021 vs. H1 2020
H1 2020 H1 2021As
reportedFX impact (a)
(in pts)
Change inPerimeter (b)
(in pts)
Argentinaimpact (c)
(in pts)Comparative
basis
Group
Net Sales 775.8 916.7 +18.2% (7.2) 3.0 (0.1) +22.5%
Gross Profit 371.2 473.9 - - - - -
Adjusted Earnings Before Interest and Taxes (EBIT) 92.9 166.1 - - - - -
Adjusted EBIT Margin 12.0% 18.1% - - - - -
EBIT 24.0 332.6 - - - - -
EBIT Margin 3.1% 36.3% - - - - -
Net Income Group Share 22.1 230.2 - - - - -
Earnings Per Share Group Share (in euros) 0.49 5.12 - - - - -
Adjusted Net Income Group Share 84.0 112.7 - - - - -
Adjusted Earnings Per Share Group Share (in euros) 1.87 2.51 - - - - -
Human expression (Stationery)
Net Sales 293.9 333.3 +13.4% (4.9) 6.5 (0.3) +12.1%
Adjusted EBIT 19.0 27.6 - - - - -
Adjusted EBIT Margin 6.5% 8.3% - - - - -
EBIT (34.9) 29.1 - - - - -
EBIT Margin -11.9% 8.7% - - - - -
Flame for life (Lighters)
Net Sales 268.2 367.4 +37.0% (9.9) 1.9 0.3 +44.7%
Adjusted EBIT 87.3 145.7 - - - - -
Adjusted EBIT Margin 32.5% 39.6% - - - - -
EBIT 84.0 143.8 - - - - -
EBIT Margin 31.3% 39.2% - - - - -
Blade excellence (Shavers)
Net Sales 200.7 200.4 (0.1)% (7.7) (0.4) - +8.0%
Adjusted EBIT 21.9 32.4 - - - - -
Adjusted EBIT Margin 10.9% 16.2% - - - - -
EBIT 17.3 32.3 - - - - -
EBIT Margin 8.6% 16.1% - - - - -
Other products
Net Sales 13.1 15.7 +19.7% 0.2 - - +19.5%
Adjusted EBIT (1.1) (3.0) - - - - -
EBIT (3.5) (3.0) - - - - -
Unallocated costs - - - - -
Adjusted EBIT (34.2) (36.5) - - - - -
EBIT (38.9) 130.3 - - - - -
Forex impact excluding Argentinian Peso (ARS).(a)Mainly acquisitions of Djeep and Rocketbook.(b)See Glossary.(c)

MANAGEMENT REPORT OF THE BOARD OF DIRECTORS FOR THE 6-MONTH PERIOD ENDED JUNE 30, 2021
H1 2021 highlights
3• BIC GROUP - 2021 HALF-YEAR FINANCIAL REPORT •
H1 2021 HIGHLIGHTS1.2
RESULTS
Solid results, driven by Net Sales growth in all divisions:
Flame for Life performance boosted by an exceptional start to●
the year in US Pocket and Utility Lighters, which we don’texpect to repeat in the second half, as well as robust growth inLatin America and the successful integration of Djeep inEurope;
Human Expression result driven by Digital Writing, while●
Core Writing Instruments markets remained challenging inLatin America and India;
Blade Excellence fueled by the success of BIC 5-blade and●
Hybrid shavers despite a challenging competitiveenvironment.
Strong growth in e-commerce in all regions, including DevelopingMarkets.
Continued manufacturing efficiencies and further savings fromthe Invent the Future transformation plan.
Sustained Free Cash Flow generation driven by strong Cash FromOperations.
(in million euros) H1 2020 H1 2021
Group Net Sales 775.8 916.7
Change as reported -19.2% +18.2%
Change on a comparative basis -18.2% +22.5%
Change on a constant currency basis -17.7% +26.2%
EBIT 24.0 332.6
EBIT Margin 3.1% 36.3%
Adjusted EBIT 92.9 166.1
Adjusted EBIT Margin 12.0% 18.1%
EPS (in euros) 0.49 5.12
Adjusted EPS (in euros) 1.87 2.51
Free Cash Flow before acquisitions and disposals 42.3 103.7
Net Cash Position 41.5 366.7
NET SALES BY DIVISION
Human Expression (Stationery): 333.3 million euros (+12.1% on a comparative basis and +19.1% at constant currency).●
Flame for Life (Lighters): 367.4 million euros (+44.7% on a comparative basis and +47.7% at constant currency).●
Blade Excellence (Shavers): 200.4 million euros (+8.0% on a comparative basis and +8.4% at constant currency).●

MANAGEMENT REPORT OF THE BOARD OF DIRECTORS FOR THE 6-MONTH PERIOD ENDED JUNE 30, 2021
H1 2021 Group operational trends
4 • BIC GROUP - 2021 HALF-YEAR FINANCIAL REPORT •
H1 2021 GROUP OPERATIONAL TRENDS1.3
H1 2021 HIGHLIGHTS
First Half 2021 Net Sales increased 26.2% at constant currencies.The unfavorable impact of currency fluctuations (–7.2 points) wasmainly due to the decrease of the US Dollar and Brazilian Realagainst the Euro (1). Excluding the impact of acquisitions anddivestitures, growth on a comparative basis was 22.5%.
Growth was fueled by the Flame for Life division, with a●
robust performance in Europe, North America, and LatinAmerica. Boosted by a strong start-to-the-year, performancein the US contributed approximately 10 points to H1 GroupNet Sales growth on a comparative basis. This was driven byimproved market trends in value (total US Lighter market grew6.2% YTD June (2)) combined with customers' order calibrationduring the first four months of the year, in response tounforeseen consumer demand. BIC outperformed the USmarket in both volume and value, propelled by distributiongains, favorable mix, and increased pricing.
In Human Expression, Rocketbook continue to show●
outstanding results, with Net Sales up more than 90% in H1.All online channels contributed to growth, with sales toAmazon driven by the success of June's Prime day. BIC's H1Core Writing Instruments performance was driven by Europe,where total Back-to-School sell-in is expected to growmid-single digit in 2021. In North America, the lack of productavailability resulting from supply chain challenges negativelyaffected shipments to customers and are expected to impactBack-to-School sell-in.
particularly in the female 3-blade segment, we continued togrow our 5-blade business in both male and female andoutpaced the fast-growing online market.
The Blade Excellence division performance was fueled by the●
success of our 3-blade products in Latin America. While the USin-store distribution remained increasingly competitive,
E-commerce (excluding Rocketbook) delivered a solid +26%●
growth compared to the same period last year, fueled by PurePlayers channels (+21%) and Omniretailers (+30%). Growth inLatin America, Middle East and Africa, and India was driven byincreased distribution and efficient promotional campaigns.
Consistent with our Sustainable Development journey, we●
launched several innovative products with environmentalbenefits in H1, including the BIC® Cristal™ Re'New, our firstrechargeable metallic Cristal Ball Pen, and the BIC® BAMBOO,our first CO2 neutral labeled shaver with a responsiblysourced bamboo handle. We also started to rollout our newsustainable “SD Hybrid” shaver range in Europe.
We achieved more than 15.0 million euros incremental●
benefit from our Invent the Future plan in H1, of whichapproximately 4.0 million euros in direct and indirectprocurement. BIC's raw materials market prices soared 10% inQ2 compared to Q1 2021, the rebound in global consumptionprompted a disruption in supply chains worldwide, resulting ina surge in sea freight costs, coupled with increased port to portlead-times. As previously communicated, we expect thecurrent market conditions to weigh on Full Year 2021 margins.
H1 2021 Free Cash Flow before acquisitions and disposals●
totaled 103.7 million euros, including 30.3 million euros ofCAPEX. Net Cash Position was 366.7 million euros, positivelyimpacted by 173.9 million euros of proceeds from ourheadquarters' sale.
This excludes the Argentinian Peso.(1)IRI data lighters 27JUN2021 (Pocket and Utility lighters).(2)

MANAGEMENT REPORT OF THE BOARD OF DIRECTORS FOR THE 6-MONTH PERIOD ENDED JUNE 30, 2021
H1 2021 Group operational trends
5• BIC GROUP - 2021 HALF-YEAR FINANCIAL REPORT •
EARNINGS BEFORE INTEREST AND TAXES (EBIT) AND ADJUSTED EBIT
(in million euros) H1 2020 H1 2021
Net Sales 775.8 916.7
Gross Profit 371.2 473.9
Gross Profit margin 47.8% 51.7%
EBITDA 115.6 382.1
EBIT 24.0 332.6
EBIT margin 3.1% 36.3%
Non-recurring items 68.9 (166.5)
Adjusted EBIT 92.9 166.1
Adjusted EBIT margin 12.0% 18.1%
H1 Gross Profit margin increased by 3.9 points to 51.7% compared procurement efficiencies. This was partly offset by adverse Forexto 47.8% in H1 2020. Excluding 2020 under-absorption of fixed from Latin American currencies against the US Dollar. costs due to the Covid-19 pandemic, the Gross Profit marginincreased by 1.7 points. The improvement was driven by the strongincrease in North America Lighter sales, a decrease in BrandSupport above Net Sales, and manufacturing and raw material
H1 Adjusted EBIT was favorably impacted by operating leveragefrom Net Sales growth. Freight and Distribution costs were higheras a result of the increase in customer demand.
KEY COMPONENTS OF THE CHANGE IN ADJUSTED EBIT MARGIN
(in points) Q1 2021 vs. Q1 2020 Q2 2021 vs. Q2 2020 H1 2021 vs. H1 2020
Change in Gross Profit (a)• +0.5 +2.6 +1.7
Brand Support• +1.2 (0.5) +0.3
OPEX and other expenses (a)• +5.9 +2.7 +4.1
TOTAL CHANGE IN ADJUSTED EBIT MARGIN +7.6 +4.8 +6.1
Excluding in 2020 under absorption of fixed costs due to Covid-19 pandemic for the Gross Profit and excluding restructuring costs, Cello impairment and non-recurring items mostly (a)commercial force underactivity for the OPEX and other expenses.
ADJUSTED EBIT RECONCILIATION
(in million euros) Q1 2020 Q1 2021 Q2 2020 Q2 2021 H1 2020 H1 2021
EBIT 23.0 227.3 1.0 105.2 24.0 332.6
Restructuring costs (Transformation plan) and Ecuador factory closure in H1 2020 2.3 3.9 5.5 0.3 7.9 4.2
Cello impairment - - 41.7 - 41.7 -
Some Expenses related to the Covid-19 epidemic mainly under absorption of fixed costs - - 19.3 - 19.3 -
Clichy Headquarters sales capital gain - (167.7) - - - (167.7)
PIMACO divestiture capital gain - (3.0) - - - (3.0)
Adjusted EBIT 25.3 60.5 67.5 105.6 92.9 166.1
H1 2021 non-recurring items included:
167.7 million euros from Clichy Headquarters sale gain in Q1 2021;●
3.0 million euros from PIMACO divestiture gain in Q1 2021;●
4.2 million euros of restructuring costs related to the transformation plan.●
MANAGEMENT REPORT OF THE BOARD OF DIRECTORS FOR THE 6-MONTH PERIOD ENDED JUNE 30, 2021
H1 2021 Group operational trends
6 • BIC GROUP - 2021 HALF-YEAR FINANCIAL REPORT •
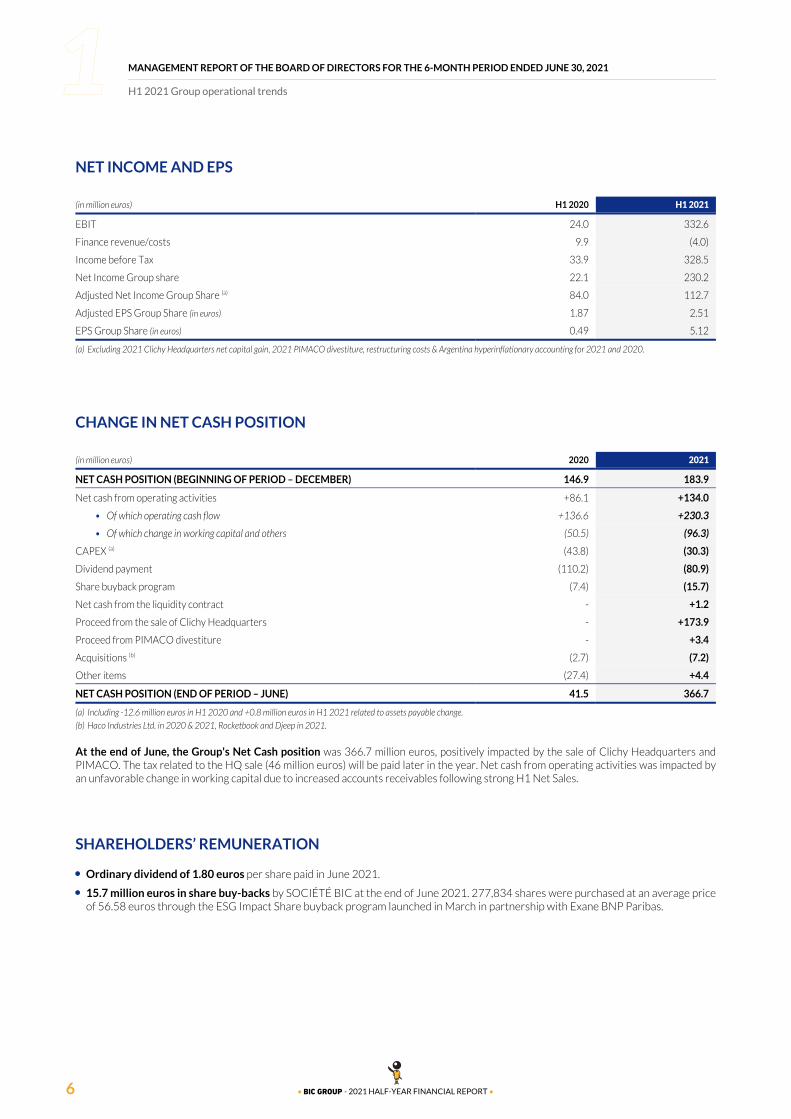
NET INCOME AND EPS
(in million euros) H1 2020 H1 2021
EBIT 24.0 332.6
Finance revenue/costs 9.9 (4.0)
Income before Tax 33.9 328.5
Net Income Group share 22.1 230.2
Adjusted Net Income Group Share (a) 84.0 112.7
Adjusted EPS Group Share (in euros) 1.87 2.51
EPS Group Share (in euros) 0.49 5.12
Excluding 2021 Clichy Headquarters net capital gain, 2021 PIMACO divestiture, restructuring costs & Argentina hyperinflationary accounting for 2021 and 2020.(a)
CHANGE IN NET CASH POSITION
(in million euros) 2020 2021
NET CASH POSITION (BEGINNING OF PERIOD – DECEMBER) 146.9 183.9
Net cash from operating activities +86.1 +134.0
Of which operating cash flow• +136.6 +230.3
Of which change in working capital and others• (50.5) (96.3)
CAPEX (a) (43.8) (30.3)
Dividend payment (110.2) (80.9)
Share buyback program (7.4) (15.7)
Net cash from the liquidity contract - +1.2
Proceed from the sale of Clichy Headquarters - +173.9
Proceed from PIMACO divestiture - +3.4
Acquisitions (b) (2.7) (7.2)
Other items (27.4) +4.4
NET CASH POSITION (END OF PERIOD – JUNE) 41.5 366.7
Including -12.6 million euros in H1 2020 and +0.8 million euros in H1 2021 related to assets payable change.(a)Haco Industries Ltd. in 2020 & 2021, Rocketbook and Djeep in 2021.(b)
At the end of June, the Group's Net Cash position was 366.7 million euros, positively impacted by the sale of Clichy Headquarters andPIMACO. The tax related to the HQ sale (46 million euros) will be paid later in the year. Net cash from operating activities was impacted byan unfavorable change in working capital due to increased accounts receivables following strong H1 Net Sales.
SHAREHOLDERS’ REMUNERATION
Ordinary dividend of 1.80 euros per share paid in June 2021.●
15.7 million euros in share buy-backs by SOCIÉTÉ BIC at the end of June 2021. 277,834 shares were purchased at an average price●
of 56.58 euros through the ESG Impact Share buyback program launched in March in partnership with Exane BNP Paribas.

MANAGEMENT REPORT OF THE BOARD OF DIRECTORS FOR THE 6-MONTH PERIOD ENDED JUNE 30, 2021
H1 2021 operational trends by division
7• BIC GROUP - 2021 HALF-YEAR FINANCIAL REPORT •
H1 2021 OPERATIONAL TRENDS 1.4BY DIVISION
HUMAN EXPRESSION (STATIONERY)
(in million euros) H1 2020 H1 2021
Volumes sold (in million units) 2,457.9 2,742.7
Change vs. prior year -29.6% +11.6%
Net Sales 293.9 333.3
Change as reported vs. prior year -26.7% +13.4%
Change on a comparative basis vs. prior year -26.5% +12.1%
Change at constant currency vs. prior year -25.6% +19.1%
Adjusted EBIT 19.0 27.6
Adjusted EBIT Margin 6.5% 8.3%
EBIT (34.9) 29.1
EBIT Margin -11.9% 8.7%
Growth in Human Expression was notably driven by robustperformance in Digital Writing with the success of Rocketbook,helped by a favorable comparable basis versus H1 2020 where thefirst wave of Covid-19 lockdowns drastically affected our keymarkets.
In Europe, sell-in performance was driven by a rebound in thetraditional channel with higher demand from Office Suppliers andgrowth in Modern Mass Channel in France, Italy and in the UK.Second Quarter Net Sales were impacted by a positive phasingimpact in Back-to-school shipments from Q3 to Q2 compared tolast year driven by customer demand.
In North America, the US Stationery market rebounded +11.5% invalue (1) vs 2020 hit by lockdowns and driven mostly by Gel segmentwhich increased +30% in value. BIC lost 0.8 points market share invalue, outperforming in Ball Pen and Correction andunderperforming in the growing Gel and Permanent Markersegments. In line with our Horizon strategy, we performed stronglyin Digital Writing as Rocketbook sales grew over 90% versus lastyear. Overall sell-in performance was negatively impacted byproduct shortage due to supply chain challenges affectingBack-to-School shipments.
While markets continued to be tough, declining double-digit inBrazil and Mexico, BIC outperformed in both markets driven byColoring and Pens segments. In South Africa, BIC gained 1.4points (2) in value driven by improved performance in Coloring,Correction and Marking. Our recent acquisition of Lucky Stationeryin Nigeria continues to perform well with H1 21 Net Sales morethan doubling, underpinning BIC's efficient route-to-marketstrategy in the region. In India, Cello Net Sales grew double-digit,with strong performance in the first quarter, driven by improveddomestic market conditions and a solid performance ine-commerce. However, the market environment in India, havingreturned to lockdowns in April, remains extremely challenging withongoing mobility disruptions and office/retail closures.
H1 2021 Human Expression division adjusted EBIT margin was8.3% compared to 6.5% in 2020. This increase was driven by higherNet Sales (including Rocketbook) and manufacturing and rawmaterial procurement efficiencies, partly offset by unfavorableForex (from Latin American currencies versus US Dollar) and higherfreight and distribution costs.
Nielsen YTD June (03-JUL-21).(1)IRI YTD May 2021.(2)
MANAGEMENT REPORT OF THE BOARD OF DIRECTORS FOR THE 6-MONTH PERIOD ENDED JUNE 30, 2021
H1 2021 operational trends by division
8 • BIC GROUP - 2021 HALF-YEAR FINANCIAL REPORT •
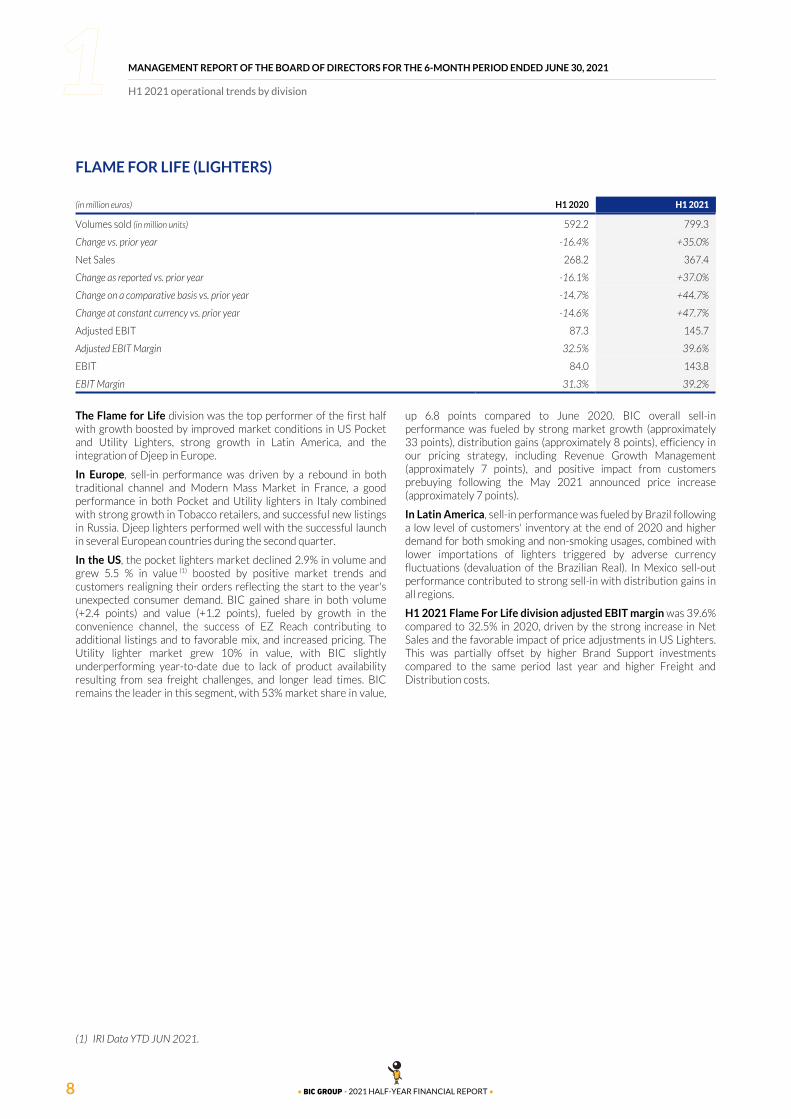
FLAME FOR LIFE (LIGHTERS)
(in million euros) H1 2020 H1 2021
Volumes sold (in million units) 592.2 799.3
Change vs. prior year -16.4% +35.0%
Net Sales 268.2 367.4
Change as reported vs. prior year -16.1% +37.0%
Change on a comparative basis vs. prior year -14.7% +44.7%
Change at constant currency vs. prior year -14.6% +47.7%
Adjusted EBIT 87.3 145.7
Adjusted EBIT Margin 32.5% 39.6%
EBIT 84.0 143.8
EBIT Margin 31.3% 39.2%
The Flame for Life division was the top performer of the first halfwith growth boosted by improved market conditions in US Pocketand Utility Lighters, strong growth in Latin America, and theintegration of Djeep in Europe.
In Europe, sell-in performance was driven by a rebound in bothtraditional channel and Modern Mass Market in France, a goodperformance in both Pocket and Utility lighters in Italy combinedwith strong growth in Tobacco retailers, and successful new listingsin Russia. Djeep lighters performed well with the successful launchin several European countries during the second quarter.
up 6.8 points compared to June 2020. BIC overall sell-inperformance was fueled by strong market growth (approximately33 points), distribution gains (approximately 8 points), efficiency inour pricing strategy, including Revenue Growth Management(approximately 7 points), and positive impact from customersprebuying following the May 2021 announced price increase(approximately 7 points).
In the US, the pocket lighters market declined 2.9% in volume andgrew 5.5 % in value (1) boosted by positive market trends andcustomers realigning their orders reflecting the start to the year'sunexpected consumer demand. BIC gained share in both volume(+2.4 points) and value (+1.2 points), fueled by growth in theconvenience channel, the success of EZ Reach contributing toadditional listings and to favorable mix, and increased pricing. TheUtility lighter market grew 10% in value, with BIC slightlyunderperforming year-to-date due to lack of product availabilityresulting from sea freight challenges, and longer lead times. BICremains the leader in this segment, with 53% market share in value,
In Latin America, sell-in performance was fueled by Brazil followinga low level of customers' inventory at the end of 2020 and higherdemand for both smoking and non-smoking usages, combined withlower importations of lighters triggered by adverse currencyfluctuations (devaluation of the Brazilian Real). In Mexico sell-outperformance contributed to strong sell-in with distribution gains inall regions.
H1 2021 Flame For Life division adjusted EBIT margin was 39.6%compared to 32.5% in 2020, driven by the strong increase in NetSales and the favorable impact of price adjustments in US Lighters.This was partially offset by higher Brand Support investmentscompared to the same period last year and higher Freight andDistribution costs.
IRI Data YTD JUN 2021.(1)

MANAGEMENT REPORT OF THE BOARD OF DIRECTORS FOR THE 6-MONTH PERIOD ENDED JUNE 30, 2021
H1 2021 operational trends by division
9• BIC GROUP - 2021 HALF-YEAR FINANCIAL REPORT •
BLADE EXCELLENCE (SHAVERS)
(in million euros) H1 2020 H1 2021
Volumes sold (in million units) 1,077.9 1,193.0
Change vs. prior year -13.7% +10.7%
Net Sales 200.7 200.4
Change as reported vs. prior year -10.6% -0.1%
Change on a comparative basis vs. prior year -8.8% +8.0%
Change at constant currency vs. prior year -8.1% +8.4%
Adjusted EBIT 21.9 32.4
Adjusted EBIT Margin 10.9% 16.2%
EBIT 17.3 32.3
EBIT Margin 8.6% 16.1%
The Blade Excellence division's overall performance was driven bythe success of our added-value products such as 5 blade shaversand hybrid ranges, despite challenging competitive environment inkey geographies.
In Europe, sell-in performance was negatively impacted bychallenging markets trends, notably in France, the UK and Italy andproduct availability issues in several countries, partially offset bysuccessful new listings in Eastern Europe.
3 blade and 1.2 points in the male segment. Despite theseheadwinds, and in line with the Horizon strategy, we continued tofocus on premium segments and successfully gained +0.7 points invalue in both men's and women's 4 and 5 blade segments. Weoutpaced the online market, gaining +0.9 points.
In the U.S., the in-store Disposable market declined 3.1% in value (1)
with continued softness in the category driven by aggressivepromotional activity and numerous new products launched bycompetition in H1 2021, including value positioning items. BIC lost2.2 points market share, 3.5 points in the female segment mostly in
In Latin America, our trade-up strategy towards the triple-bladeoffering continued to pay off and drove overall performance in bothBrazil and Mexico.
H1 2021 Blade Excellence division adjusted EBIT margin was16.2% compared to 10.9% in 2020, impacted positively byoperating leverage from Net Sales growth, and manufacturing andraw material procurement efficiencies.
OTHER PRODUCTS
(in million euros) H1 2020 H1 2021
Net Sales 13.1 15.7
Change as reported -14.1% +19.7%
Change on a comparative basis -13.4% +19.5%
Change at constant currency -13.5% +19.5%
Adjusted EBIT (1.1) (3.0)
EBIT (3.5) (3.0)
UNALLOCATED COSTS
(in million euros) H1 2020 H1 2021
Adjusted EBIT (34.2) (36.5)
EBIT (38.9) 130.3
H1 2021 unallocated costs are mainly related to Corporate headquarters costs, and Clichy Headquarters sales capital gain amounting167.7 million euros. The decrease in Adjusted EBIT is due to the costs of the implementation of the transformation plan.
IRI YTD June 2021.(1)
MANAGEMENT REPORT OF THE BOARD OF DIRECTORS FOR THE 6-MONTH PERIOD ENDED JUNE 30, 2021
Group Net Sales by geography
10 • BIC GROUP - 2021 HALF-YEAR FINANCIAL REPORT •
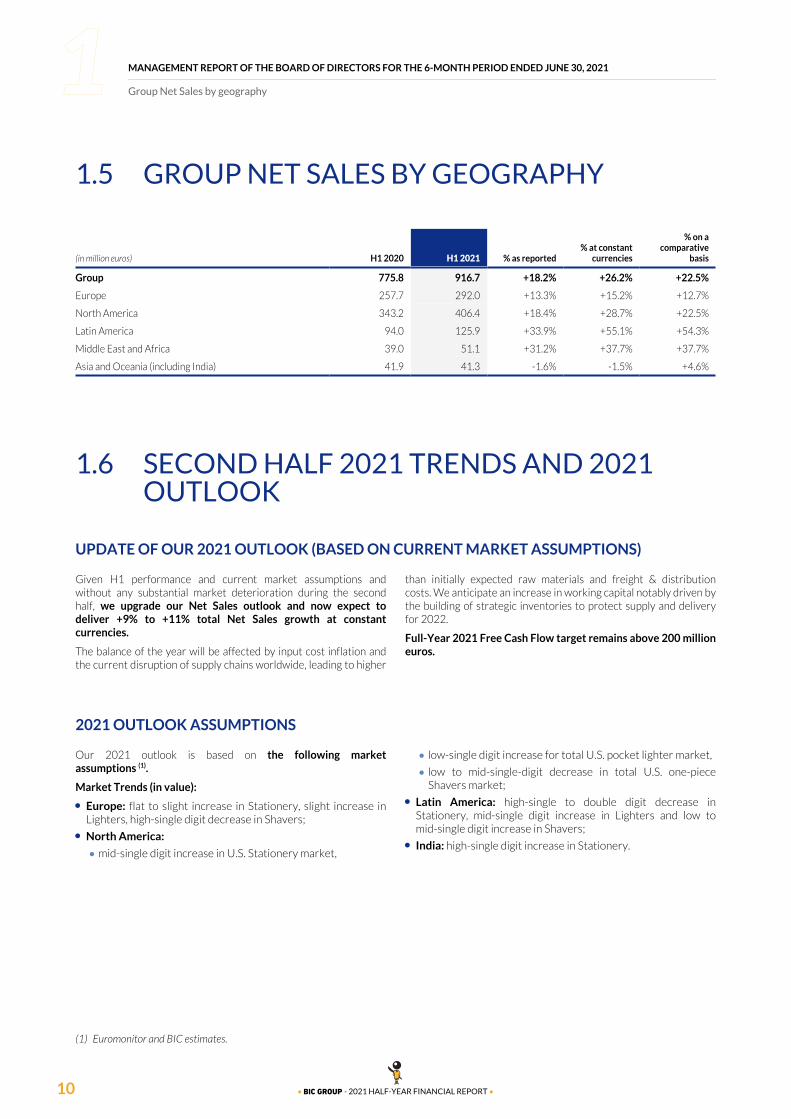
GROUP NET SALES BY GEOGRAPHY1.5
(in million euros) H1 2020 H1 2021 % as reported% at constant
currencies
% on acomparative
basis
Group 775.8 916.7 +18.2% +26.2% +22.5%
Europe 257.7 292.0 +13.3% +15.2% +12.7%
North America 343.2 406.4 +18.4% +28.7% +22.5%
Latin America 94.0 125.9 +33.9% +55.1% +54.3%
Middle East and Africa 39.0 51.1 +31.2% +37.7% +37.7%
Asia and Oceania (including India) 41.9 41.3 -1.6% -1.5% +4.6%
SECOND HALF 2021 TRENDS AND 2021 1.6OUTLOOK
UPDATE OF OUR 2021 OUTLOOK (BASED ON CURRENT MARKET ASSUMPTIONS)
Given H1 performance and current market assumptions andwithout any substantial market deterioration during the secondhalf, we upgrade our Net Sales outlook and now expect todeliver +9% to +11% total Net Sales growth at constantcurrencies.
than initially expected raw materials and freight & distributioncosts. We anticipate an increase in working capital notably driven bythe building of strategic inventories to protect supply and deliveryfor 2022.
The balance of the year will be affected by input cost inflation andthe current disruption of supply chains worldwide, leading to higher
Full-Year 2021 Free Cash Flow target remains above 200 millioneuros.
2021 OUTLOOK ASSUMPTIONS
Our 2021 outlook is based on the following marketassumptions (1).
Market Trends (in value):
Europe: flat to slight increase in Stationery, slight increase in●
Lighters, high-single digit decrease in Shavers;
North America:●
mid-single digit increase in U.S. Stationery market,•
low-single digit increase for total U.S. pocket lighter market, •low to mid-single-digit decrease in total U.S. one-piece•Shavers market;
Latin America: high-single to double digit decrease in●
Stationery, mid-single digit increase in Lighters and low tomid-single digit increase in Shavers;
India: high-single digit increase in Stationery.●
Euromonitor and BIC estimates.(1)

MANAGEMENT REPORT OF THE BOARD OF DIRECTORS FOR THE 6-MONTH PERIOD ENDED JUNE 30, 2021
Impact of change in perimeter and currency fluctuations on net sales (excludes ARS)
11• BIC GROUP - 2021 HALF-YEAR FINANCIAL REPORT •
EBIT and Free Cash Flow drivers:
flat Gross Profit Margin with increased volumes and positive●
price impact offset by higher Raw Materials costs, and adverseFX;
increase in Freight and Distribution;●
increase in Brand Support, R&D and Innovation to support Net●
Sales growth;
lower OPEX as % of Net Sales;●
approximately 100 million euros in CAPEX.●
Currency: 2021 USD-Euro hedging rate: 1.13.
IMPACT OF CHANGE IN PERIMETER AND 1.7CURRENCY FLUCTUATIONS ON NET SALES (EXCLUDES ARS)
(in %) H1 2020 H1 2021
Perimeter -0.1 3.0
Currencies -1.0 -7.2
Of which USD +0.8 -4.8
Of which BRL -1.1 -1.4
Of which MXN -0.3 -0.1
Of which AUD -0.1 +0.2
Of which ZAR -0.1 -
Of which INR - -0.2
Of which RUB and UAH -0.1 -0.4

MANAGEMENT REPORT OF THE BOARD OF DIRECTORS FOR THE 6-MONTH PERIOD ENDED JUNE 30, 2021
Reconciliation with alternative performance measures
12 • BIC GROUP - 2021 HALF-YEAR FINANCIAL REPORT •
RECONCILIATION WITH ALTERNATIVE 1.8PERFORMANCE MEASURES
ADJUSTED EBIT RECONCILIATION
(in million euros) Q2 2020 Q2 2021 H1 2020 H1 2021
EBIT 1.0 105.2 24.0 332.6
Restructuring costs (Transformation plan) and Ecuador factory closure in H1 2020 5.5 0.3 7.9 4.2
Cello impairment 41.7 - 41.7 -
Some Expenses related to the Covid-19 epidemic mainly under absorption of fixed costs 19.3 - 19.3 -
Clichy Headquarters sales capital gain - - - (167.7)
PIMACO divestiture capital gain - - - (3.0)
Adjusted EBIT 67.5 105.6 92.9 166.1
ADJUSTED EPS RECONCILATION
(in million euros) Q2 2020 Q2 2021 H1 2020 H1 2021
EPS (0.07) 1.53 0.49 5.12
Restructuring costs (Transformation plan and Ecuador factory closure in H1 2020) +0.09 +0.01 +0.12 +0.07
Cello impairment +0.93 - +0.93 -
Some Expenses related to the Covid-19 epidemic mainly under absorption of fixed costs +0.31 - +0.31 -
Argentina hyperinflationary accounting (IAS 29) +0.01 +0.01 +0.02 +0.03
Clichy Headquarters sales capital gain - - - (2.67)
PIMACO divestiture capital gain - - - (0.04)
Adjusted EPS 1.27 1.55 1.87 2.51
NET CASH RECONCILIATION
(in million euros – rounded figures) December 31, 2020 June 30, 2021
Cash and cash equivalents (1) +265.7 +450.0
Other current financial assets (2) (a) - -
Current borrowings (3) (b) (77.2) (78.4)
Non-current borrowings (4) (4.7) (4.9)
NET CASH POSITION (1) + (2) - (3) - (4) 183.9 366.7
In the balance sheet at December 31, 2020 and June 30, 2021, the “Other current financial assets and derivative instruments” line also includes respectively 26.1 million euros and (a)14.1 million euros worth of derivative instruments.Excluding financial liabilities following IFRS 16 implementation.(b)
FREE CASH FLOW RECONCILIATION
(in million euros – rounded figures) December 31, 2020 June 30, 2021
Net cash from operating activities (1) +357.6 +134.0
Capital expenditure (2) (83.1) (30.3)
FREE CASH FLOW BEFORE ACQUISITION AND DISPOSALS (1) - (2) 274.5 103.7

MANAGEMENT REPORT OF THE BOARD OF DIRECTORS FOR THE 6-MONTH PERIOD ENDED JUNE 30, 2021
Share repurchase program – cancelled shares
13• BIC GROUP - 2021 HALF-YEAR FINANCIAL REPORT •
SHARE REPURCHASE PROGRAM – 1.9CANCELLED SHARES
During the first half of 2021:
SOCIÉTÉ BIC repurchased 277,834 shares under the share●
repurchase programs authorized by the Annual Shareholders’Meeting held on May 20, 2020, excluding shares acquiredunder the liquidity agreement;
SOCIÉTÉ BIC repurchased, under the liquidity agreement●
Natixis – ODDO BHF, 276,046 shares for a total value of14.62 million euros and sold 298,246 shares for a total valueof 15.81 million euros.
SOCIÉTÉ BIC – SHARE BUYBACK PROGRAM
Number of shares
acquiredAverage weighted price
(in euros)Amount
(in million euros)
March 2021 62,600 50.46 3.2
April 2021 77,005 53.35 4.1
May 2021 65,770 62.93 4.1
June 2021 72,459 59.57 4.3
TOTAL 277,834 56.58 15.7
The number of free, performance-based shares transferred by beneficiaries by SOCIÉTÉ BIC was 18,400. Moreover, SOCIÉTÉSOCIÉTÉ BIC to beneficiaries is 136,203 during the first half 2021. BIC proceeded to 238,899 free, performance-based share grantsThe number of free, non-performance-based shares transferred to and 133,847 free, non-performance-based share grants.
RELATED-PARTY TRANSACTIONS1.10
This paragraph is aimed at ensuring transparency in the relationshipbetween the Group and its Shareholders (and theirrepresentatives), as well as in the links between the Group andrelated companies that the Group does not exclusively control (i.e.joint ventures or investments in associates).
Significant related-party transactions are described in the Note 25– Related parties on page 262 of BIC's 2020 Universal RegistrationDocument filed with the Autorité des Marchés Financiers (AMF) onApril 1, 2021. During the first half of 2021, BIC has not identifiedany significant related-party transactions.
CAPITAL EVOLUTION1.11
As of June 30, 2021, the total number of issued shares of SOCIÉTÉ BIC was 45,395,857 shares, representing:
66,774,710 voting rights;●
66,255,030 voting rights excluding shares without voting rights.●
Total number of treasury shares held at the end of June 2021: 519,680.

MANAGEMENT REPORT OF THE BOARD OF DIRECTORS FOR THE 6-MONTH PERIOD ENDED JUNE 30, 2021
Material events that occurred in H1 2021
14 • BIC GROUP - 2021 HALF-YEAR FINANCIAL REPORT •
MATERIAL EVENTS THAT OCCURRED 1.12IN H1 2021
N/A
MATERIAL EVENTS THAT OCCURRED 1.13AFTER JUNE 30, 2021
N/A
DESCRIPTION OF THE PRINCIPAL RISKS 1.14AND UNCERTAINTIES FOR THE SECOND HALF 2021
BIC pursues an active and dynamic approach to risk management.The objective of this approach is to enhance the Group’s capacity inidentifying, managing, preventing, mitigating, and monitoring keyrisks that could affect:
the Group’s employees, customers, Shareholders, assets,●
environment or reputation;
the Group’s ability to achieve its objectives, abide and defend●
its Values, ethics, or laws and regulations.
This approach is based on the identification and analysis of the mainrisks to which the Group is exposed.
A description of the main risks identified by the BIC Group isavailable in the section entitled Risk Management of the 2020Universal Registration Document (URD) (Chapter 2) filed with theAutorité des Marchés Financiers (AMF) on April 1, 2021 and which isavailable online, following this link: https://us.bic.com/en_us/investors-press-releases-presentations-publications.
MANAGEMENT REPORT OF THE BOARD OF DIRECTORS FOR THE 6-MONTH PERIOD ENDED JUNE 30, 2021
Description of the principal risks and uncertainties for the second half 2021
15• BIC GROUP - 2021 HALF-YEAR FINANCIAL REPORT •
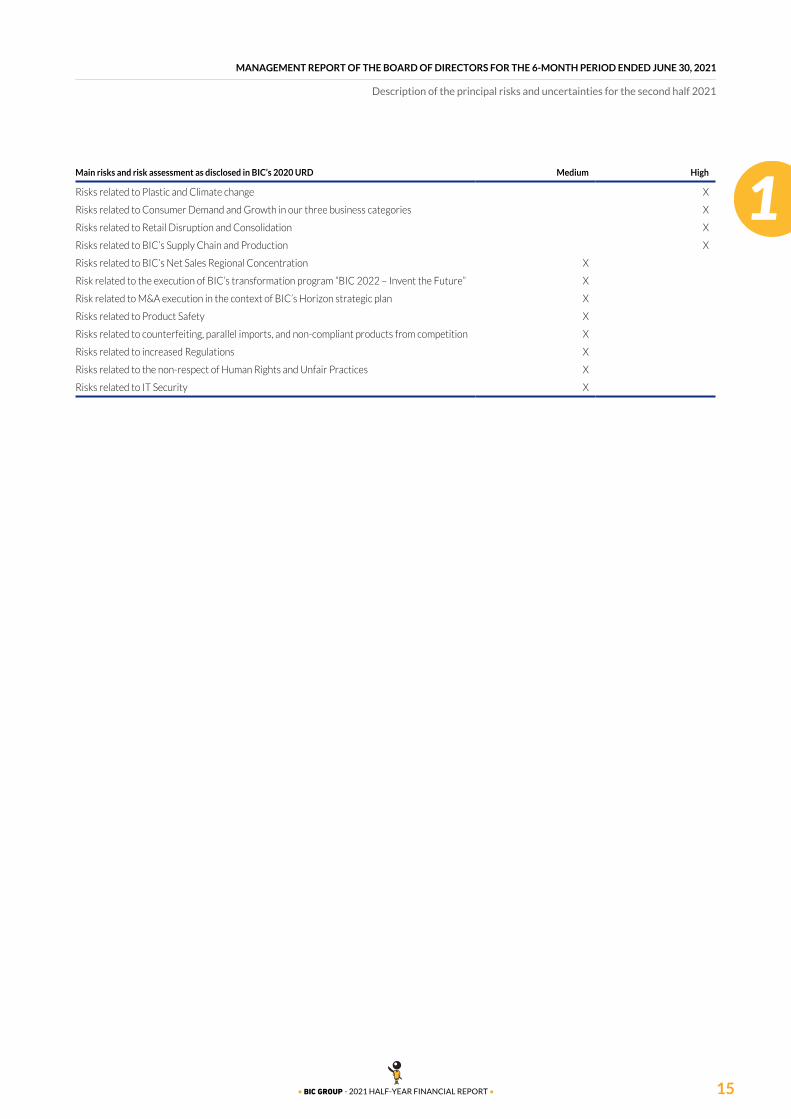
Main risks and risk assessment as disclosed in BIC’s 2020 URD Medium High
Risks related to Plastic and Climate change X
Risks related to Consumer Demand and Growth in our three business categories X
Risks related to Retail Disruption and Consolidation X
Risks related to BIC’s Supply Chain and Production X
Risks related to BIC’s Net Sales Regional Concentration X
Risk related to the execution of BIC’s transformation program “BIC 2022 – Invent the Future” X
Risk related to M&A execution in the context of BIC’s Horizon strategic plan X
Risks related to Product Safety X
Risks related to counterfeiting, parallel imports, and non-compliant products from competition X
Risks related to increased Regulations X
Risks related to the non-respect of Human Rights and Unfair Practices X
Risks related to IT Security X

MANAGEMENT REPORT OF THE BOARD OF DIRECTORS FOR THE 6-MONTH PERIOD ENDED JUNE 30, 2021
Description of the principal risks and uncertainties for the second half 2021
16 • BIC GROUP - 2021 HALF-YEAR FINANCIAL REPORT •
RISK ASSOCIATED TO THE COVID-19 CRISIS
Worldwide disruption in freight and distribution following the Covid-19 crisis could increase the risks related to BIC’s Supply Chain andProduction (see below 2020 Universal Registration Document).
Risks related to BIC’s Supply Chain and Production
As a consumer products manufacturing, distribution and sales-oriented organization, BIC is exposed to the risk of production interruptions and internaland external supply chains issues related to potential raw materials shortages, operational interruptions at suppliers (repetition), particularly duringcritical seasonal purchasing periods such as “back-to-school” in Stationery.
BIC operates several manufacturing and warehousing sites throughout the world; however, certain products may be concentrated within specificgeographic, which may be impacted in the event of a catastrophic event.
BIC is exposed to specific risks linked to the storage and use of hazardous substances. Among these are:
gas for lighters;•
solvents for permanent markers and dry-wipe markers;•
solvents for industrial cleaning processes.•
Level of risks: medium
Potential impact on BIC:
Reliance on outside vendor’s supply chain could lead to a shortage of raw materials if the vendor suffers a catastrophic event.
A lengthy supplier qualification timeframe of 1-2 years may impact the availability of potential suppliers.
Risks of losing supply of key input materials, if a supplier changes a formulation.
A significant supply chain disruption could lead to BIC’s inability to meet consumer demand and/or commitments.
Certain plastics used within BIC products may be subject to material competition from other sectors, which may diminish the availability of raw materials and eventual stock.
Reliance on specific raw materials and a significant cut in plastic from suppliers due to environmental regulations may impact product development.
Interdependencies between BIC facilities could be impaired in the event a peril causes an inability to ship product from a manufacturing site to distribution, which would impair the ability to supply goods to consumers, particularly during critical seasonal periods such as “back to school”, etc.
The Covid-19 crisis impacted BIC’s Global Supply Chain with higher absenteeism, some temporary factory closures and supply chain disruptions due notably to border closures, as well as the discontinuation of the activity of some of our suppliers and subcontractors.
Examples of Risk Mitigation:
BIC has formed a Procurement group to focus on supplier acquisition, supplier qualification, and onboarding, as well as alternative sourcing and materials.
Mitigating controls are in place to look for multi-supplier sourcing. Working with R&D to qualify additional suppliers.
Utilization of an enhanced communication platform (Control Tower) between sales and production teams to “right-size” product quantities and locations.
In all BIC factories:
constant attention is paid to the implementation and monitoring of •preventive measures and safety systems for gas and solvent storage areas. Suitable control devices and equipment are in place to minimize physical and chemical risks posed by hazardous substances. Priority is given to the use of appropriate fire prevention systems and appropriate fire detection and control equipment;
hazard and risk assessments are conducted; procedures are established •to identify, assess, and prevent incidents and accidents;
the workforce is trained to recognize potential hazards, as well as to take •preventive and corrective actions;
compliance with local regulatory requirements is an integral part of the •daily management of the sites;
strategic inventories defined in all factories to cover key materials and •components;
training programs in place in all factories to back up the critical processes •and secure the flexibility to cover market needs;
maintenance programs in place in all factories to protect key equipment •and technical processes.
In particular, certain Group factories are subject to the European Union SEVESO Directive, which identifies industrial sites that could pose significant accident risks and requires the manufacturers to carry out risk studies to identify possible accident scenarios, evaluate their potential consequences and implement preventive measures.
The SEVESO plants have emergency procedure protocols (plan d’opération interne and plan particulier d’intervention) and a major hazard prevention policy. For the two SEVESO plants, BIC has also implemented a safety management system. Outside of France, some plants have equivalent Emergency Plans that address Risks with potential off-site consequences.

MANAGEMENT REPORT OF THE BOARD OF DIRECTORS FOR THE 6-MONTH PERIOD ENDED JUNE 30, 2021
Glossary
17• BIC GROUP - 2021 HALF-YEAR FINANCIAL REPORT •
GLOSSARY1.15
Constant currency basis: constant currency figures are●
calculated by translating the current year figures at prior yearmonthly average exchange rates.
Organic change or Comparative basis: at constant currencies●
and constant perimeter. Figures at constant perimeter excludethe impact of acquisitions and/or disposals that occurredduring the current year and/or during the previous year, untiltheir anniversary date. All Net Sales category comments aremade on a comparative basis. Organic change excludesArgentina Net Sales for both 2019 and 2020.
EBITDA: EBIT before Depreciation and Amortization●
(excluding amortization of right of use under IFRS 16 standard),and impairment.
Adjusted EBIT: adjusted means excluding normalized items.●
Adjusted EBIT margin: adjusted EBIT as a percentage of Net●
Sales.
Net Cash from operating activities: cash generated from●
principal activities of the entity and other activities that are notinvesting or financing activities.
Free Cash Flow: net cash flow from operating activities less●
capital expenditures (CAPEX). Free cash flow does not includeacquisitions and proceeds from the sale of businesses.
Net cash position: cash and cash equivalents + Other current●
financial assets - Current borrowings - Non-currentborrowings (except financial liabilities following IFRS 16implementation).

MANAGEMENT REPORT OF THE BOARD OF DIRECTORS FOR THE 6-MONTH PERIOD ENDED JUNE 30, 2021
18 • BIC GROUP - 2021 HALF-YEAR FINANCIAL REPORT •

19• BIC GROUP - 2021 HALF-YEAR FINANCIAL REPORT •
HALF-YEAR CONSOLIDATED FINANCIAL STATEMENTS
CONSOLIDATED INCOME STATEMENT2.1 20
CONSOLIDATED STATEMENT OF COMPREHENSIVE INCOME2.2 21
CONSOLIDATED STATEMENT OF FINANCIAL POSITION2.3 22
CONSOLIDATED STATEMENT OF CHANGES IN EQUITY2.4 24
CONSOLIDATED CASH FLOW STATEMENT2.5 25
NOTES TO THE CONSOLIDATED FINANCIAL STATEMENTS2.6 26

HALF-YEAR CONSOLIDATED FINANCIAL STATEMENTS
Consolidated income statement
20 • BIC GROUP - 2021 HALF-YEAR FINANCIAL REPORT •
CONSOLIDATED INCOME STATEMENT2.1
(Consolidated financial statements)
(in thousand euros) Notes June 30, 2020 June 30, 2021
Net sales 2-2 775,832 916,716
Cost of goods 3 (404,639) (442,842)
Gross profit (a) 371,192 473,874
Distribution costs 3 (124,173) (131,095)
Administrative expenses 3 (104,663) (111,654)
Other operating expenses 3 (67,256) (67,775)
Other income 4 2,950 175,104
Other expenses 4 (54,060) (5,884)
Earnings before interest and taxes (EBIT) 23,991 332,570
Income from cash and cash equivalents 5 2,058 1,253
Net finance income/(net finance costs) 5 7,832 (5,299)
Income before tax 33,881 328,524
Income tax expense 6 (11,797) (98,360)
Consolidated income of which: 22,084 230,164
Non-controlling interests - -
Net income Group share 7 22,084 230,164
Earnings per share Group share (in euros) 0.49 5.12
Diluted earnings per share Group share (in euros) (b) 0.49 5.14
Gross profit is the margin that the Group realizes after deducting its manufacturing costs.(a)The dilutive elements taken into account are stock options and free shares.(b)

HALF-YEAR CONSOLIDATED FINANCIAL STATEMENTS
Consolidated statement of comprehensive income
21• BIC GROUP - 2021 HALF-YEAR FINANCIAL REPORT •
CONSOLIDATED STATEMENT 2.2OF COMPREHENSIVE INCOME
(Consolidated financial statements)
(in thousand euros) Notes June 30, 2020 June 30, 2021
GROUP NET INCOME A 22,084 230,164
OTHER COMPREHENSIVE INCOME
Actuarial differences on post-employment benefits not recyclable to the income statement (a) (39,882) 31,331
Deferred tax on actuarial differences on post-employment benefits 8,377 (5,221)
Other comprehensive income not recyclable to the income statement - Net of tax B (31,505) 26,110
Gain/(Loss) on cash flow hedge 7,267 (15,174)
Exchange differences arising on translation of overseas operations (103,710) 30,375
Other (5) 3
Deferred tax and current tax recognized on other comprehensive income 6-2 (606) 2,495
Other comprehensive income recyclable to the income statement - Net of tax C (97,054) 17,699
TOTAL COMPREHENSIVE INCOME D = A + B + C (106,475) 273,974
Attributable to:
BIC Group• (106,475) 273,974
Non-controlling interests• - -
TOTAL (106,475) 273,974
(a) The impact of actuarial differences is mainly due to U.S. plans.
HALF-YEAR CONSOLIDATED FINANCIAL STATEMENTS
Consolidated statement of financial position
22 • BIC GROUP - 2021 HALF-YEAR FINANCIAL REPORT •
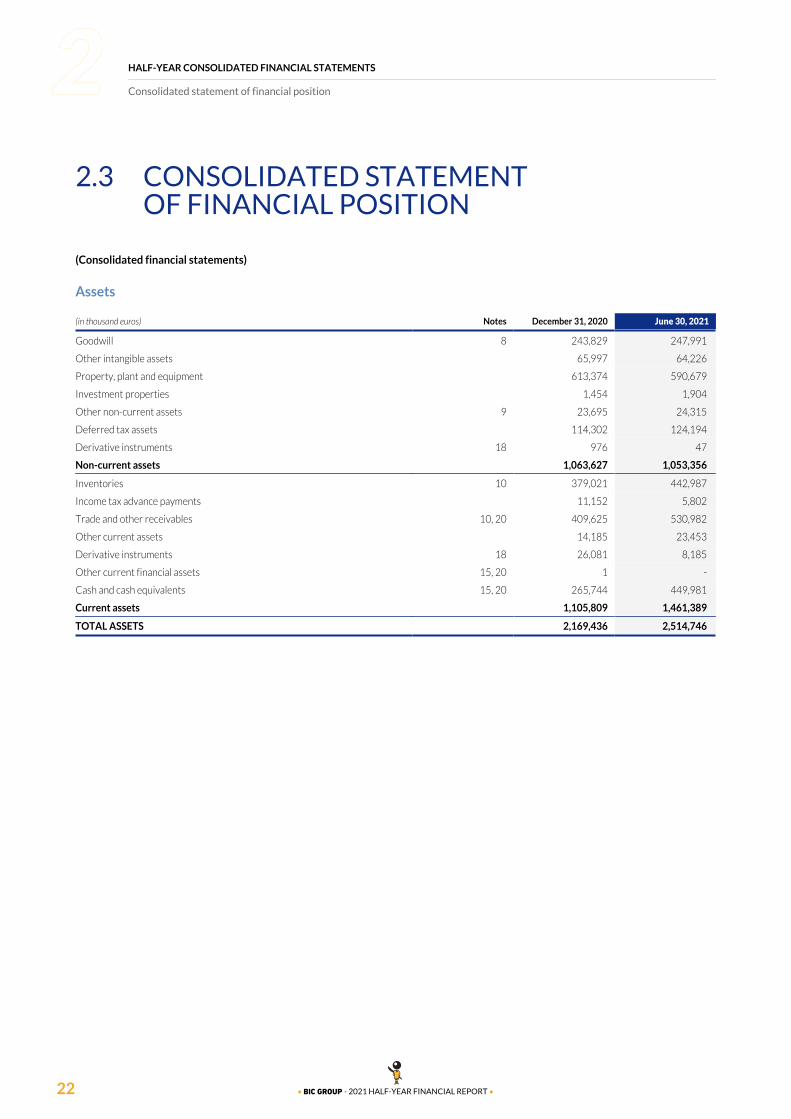
CONSOLIDATED STATEMENT 2.3OF FINANCIAL POSITION
(Consolidated financial statements)
Assets
(in thousand euros) Notes December 31, 2020 June 30, 2021
Goodwill 8 243,829 247,991
Other intangible assets 65,997 64,226
Property, plant and equipment 613,374 590,679
Investment properties 1,454 1,904
Other non-current assets 9 23,695 24,315
Deferred tax assets 114,302 124,194
Derivative instruments 18 976 47
Non-current assets 1,063,627 1,053,356
Inventories 10 379,021 442,987
Income tax advance payments 11,152 5,802
Trade and other receivables 10, 20 409,625 530,982
Other current assets 14,185 23,453
Derivative instruments 18 26,081 8,185
Other current financial assets 15, 20 1 -
Cash and cash equivalents 15, 20 265,744 449,981
Current assets 1,105,809 1,461,389
TOTAL ASSETS 2,169,436 2,514,746

HALF-YEAR CONSOLIDATED FINANCIAL STATEMENTS
Consolidated statement of financial position
23• BIC GROUP - 2021 HALF-YEAR FINANCIAL REPORT •
Equity and liabilities
(in thousand euros) Notes December 31, 2020 June 30, 2021
Share capital 11-1 171,809 171,427
Reserves and retained earnings 1,284,399 1,470,037
Shareholders’ equity Group share 1,456,208 1,641,464
Non-controlling interests - -
Shareholders’ equity SHEQ 1,456,208 1,641,464
Non-current borrowings 12, 20 27,985 24,802
Other non-current liabilities 12,707 14,508
Employee benefits obligation 122,964 98,244
Provisions 13 25,560 21,715
Deferred tax liabilities 60,914 64,877
Derivative instruments 18 53 -
Non-current liabilities 250,183 224,146
Trade and other payables 10 99,470 167,265
Current borrowings 12 89,976 90,898
Current tax due 18,801 89,573
Other current liabilities 14 251,504 297,293
Derivative instruments 18 3,294 4,108
Current liabilities 463,045 649,137
TOTAL EQUITY AND LIABILITIES 2,169,436 2,514,746
SHEQ: See consolidated statement of changes in equity.

HALF-YEAR CONSOLIDATED FINANCIAL STATEMENTS
Consolidated statement of changes in equity
24 • BIC GROUP - 2021 HALF-YEAR FINANCIAL REPORT •
CONSOLIDATED STATEMENT OF CHANGES 2.4IN EQUITY
(in thousand euros) NotesShare
capitalAccumulated
profits
Additionalpaid incapital
Actuarialdifferencesrecognized
in equityTranslation
reserve
Cash flowhedge
derivatives
Cost ofhedgingthrough
OCI
Share-holders’
equityGroupshare
Non-controlling
interests
Share-holders’
equity
At January 1, 2020 171,869 1,642,195 12,342 (101,231) (113,183) (3,909) - 1,608,082 - 1,608,082
Dividends paid 16 - (110,214) - - - - - (110,214) - (110,214)Decrease in share capital (a) - - - - - - - - - -Increase in share capital - - - - - - - - - -Treasury shares (45) (7,266) - - - - - (7,311) - (7,311)Recognition of share-based payments 17 - - 2,185 - - - - 2,185 - 2,185Hyperinflation impact in Argentina - 938 - - - - - 938 - 938Other - (17) - - - - - (17) - (17)Total transactions with Shareholders (45) (116,559) 2,185 - - - - (114,419) - (114,419)Net income for the period - 22,084 - - - - - 22,084 - 22,084Other comprehensive income - 1,678 - (31,505) (103,710) 4,977 - (128,560) - (128,560)Total comprehensive income - 23,762 - (31,505) (103,710) 4,977 - (106,476) - (106,476)
At June 30, 2020 171,824 1,549,398 14,527 (132,736) (216,893) 1,068 - 1,387,187 - 1,387,187
At January 1, 2021 171,809 1,621,415 17,786 (111,979) (255,486) 12,663 - 1,456,208 - 1,456,208
Dividends paid 16 - (80,919) - - - - - (80,919) - (80,919) Decrease in share capital (a) - - - - - - - - - -Increase in share capital - - - - - - - - - - Treasury shares (382) (14,263) - - - - - (14,646) - (14,646)Recognition of share-based payments 17 - - 5,037 - - - - 5,037 - 5,037 Hyperinflation impact in Argentina - 1,782 - - - - - 1,782 - 1,782 Other - 28 - - - 1 - 26 - 26 Total transactions with Shareholders (382) (93,372) 5,037 - - 1 - (88,719) - (88,719) Net income for the period - 230,164 - - - - - 230,164 - 230,164 Other comprehensive income - (27) - 26,110 30,375 (12,648) - 43,810 - 43,810 Total comprehensive income - 230,137 - 26,110 30,375 (12,648) - 273,974 - 273,974
At June 30, 2021 171,427 1,758,180 22,823 (85,869) (225,111) 13 - 1,641,464 - 1,641,464
(a) No shares were canceled during the first half of 2021.

HALF-YEAR CONSOLIDATED FINANCIAL STATEMENTS
Consolidated cash flow statement
25• BIC GROUP - 2021 HALF-YEAR FINANCIAL REPORT •
CONSOLIDATED CASH FLOW STATEMENT2.5
(in thousand euros) Notes June 30, 2020 June 30, 2021
Operating activities
Net income Group share IS 22,084 230,164
Elimination of expenses and income with no impact on cash flows or non-business related expenses:Argentina hyperinflationary accounting 768 1,420
Depreciation and amortization of intangible and tangible assets and investment properties 2 57,908 56,345
Impairment loss on tangible and non-tangible assets 15 (a), 2 42,291 838
Provision for employee benefits 8,313 5,328
Other provisions (excluding provisions on current assets) 13 2,768 (2,351)
Unrealized foreign currency gain/loss 15 (b) (12,550) 571
Hedging and derivative instruments (907) 4,119
Option premium expense 783 531
Recognition of share-based payments 17, SHEQ 2,185 5,037
Financial expense/(income) 643 (55)
Income tax expense 40,407 104,592
Deferred tax variation (28,070) (6,232)
(Gain)/loss from disposal of fixed assets 4, 15 (c) 63 735
Gain on sale of Clichy headquarters 4, 15 (c) - (167,711)
Gain on disposal of PIMACO 4, 15 (c) - (3,027)
Cash flow from operations 136,687 230,306
(Increase)/decrease in net working capital 10, 15 (d) (31,211) (62,592)
Payments related to employee benefits 15 (e) (4,955) (4,485)
Income tax paid (14,385) (29,194)
NET CASH FROM OPERATING ACTIVITIES 86,135 134,035
Investing activities
Disposal of PIMACO - 3,445
Sale of Clichy headquarters - 173,854
Disposal of fixed assets 15 (c) 496 1,608
Purchases of property, plant and equipment 15 (g), 2 (41,071) (26,514)
Purchases of intangible assets 15 (g), 2 (2,726) (3,772)
(Increase)/decrease in other investments (59) 282
Sale of other current financial assets 15 (h) 3,861 -
Acquisition of subsidiaries 15 (i) (2,721) (7,154)
NET CASH FROM INVESTING ACTIVITIES (42,220) 141,749
Financing activities
Dividends paid SHEQ, 15 (j) (110,214) (80,919)
Borrowings/(repayments) 12, 15 (k) 105,000 906
Interest (paid)/received (443) 47
Payments of obligations under leases (7,900) (8,535)
Purchase of financial instruments (501) (241)
Increase in treasury shares 15 (l) (7,384) (14,528)
NET CASH FROM FINANCING ACTIVITIES (21,441) (103,269)
Net cash variation 22,474 172,515
Opening cash and cash equivalents net of bank overdrafts BS, 12, 20 146,846 264,733
Exchange difference (18,885) 11,294
CLOSING CASH AND CASH EQUIVALENTS NET OF BANK OVERDRAFTS BS, 12, 20 150,435 448,542
IS: See consolidated income statement.SHEQ: See consolidated statement of changes in equity.BS: See consolidated balance sheet.References from (a) to (l) explained in Note 15.
HALF-YEAR CONSOLIDATED FINANCIAL STATEMENTS
Notes to the consolidated financial statements
26 • BIC GROUP - 2021 HALF-YEAR FINANCIAL REPORT •
NOTES TO THE CONSOLIDATED FINANCIAL 2.6STATEMENTS
General
MAIN RULES AND ACCOUNTING POLICIESNOTE 1 27
Accounting policies1-1 27Change in Group structure1-2 27Significant events1-3 27Subsequent events1-4 27
OPERATING SEGMENTSNOTE 2 28
General information2-1 28Information on income statement and assets by 2-2activity 28Informations by geography2-3 30
Income statement
OPERATING EXPENSESNOTE 3 30
OTHER INCOME AND EXPENSESNOTE 4 31
FINANCE INCOMENOTE 5 31
INCOME TAXNOTE 6 32
Income tax expense6-1 32Deferred and current tax recognized on other 6-2comprehensive income 32
EARNINGS PER SHARE GROUP SHARENOTE 7 33
Balance sheet – Assets
GOODWILLNOTE 8 33
OTHER NON-CURRENT ASSETSNOTE 9 35
CHANGE IN NET WORKING CAPITALNOTE 10 35
Balance sheet – Liabilities
SHARE CAPITALNOTE 11 35
Share capital11-1 35SOCIÉTÉ BIC owned shares and repurchase of 11-2shares of the Company as of June 30, 2021 36
BORROWINGS AND FINANCIAL LIABILITIESNOTE 12 36
PROVISIONSNOTE 13 38
OTHER CURRENT LIABILITIESNOTE 14 38
Additional information
COMMENTS ON THE CONSOLIDATED CASH FLOW NOTE 15STATEMENT 39
DIVIDENDSNOTE 16 39
SHARE-BASED PAYMENTSNOTE 17 40
FINANCIAL INSTRUMENTSNOTE 18 40
Impact of interest rate and foreign exchange 18-1risks’ hedging on consolidated financial statements as of June 30, 2021 40Impact of interest rate and foreign exchange 18-2risks’ hedging on consolidated financial statements as of December 31, 2020 41
CONTINGENT LIABILITIESNOTE 19 41
EXPOSURE TO MARKET RISKSNOTE 20 42
Credit risk20-1 42Fair value of financial assets and liabilities20-2 43

HALF-YEAR CONSOLIDATED FINANCIAL STATEMENTS
Notes to the consolidated financial statements
27• BIC GROUP - 2021 HALF-YEAR FINANCIAL REPORT •
MAIN RULES AND ACCOUNTING POLICIESNOTE 1
Accounting policies1-1
General1-1-1Pursuant to European regulation no.1606/2002 of July 19, 2002concerning international accounting standards, the consolidatedfinancial statements of the BIC Group have been prepared inaccordance with accounting principles as defined by theInternational Accounting Standards Board (IASB) as adopted by theEuropean Union. International Financial Reporting Standards areavailable on the European Union website.
The international standards include the IFRS (InternationalFinancial Reporting Standards), the IAS (International AccountingStandards), as well as their SIC (Standing InterpretationCommittee) and IFRIC (International Financial ReportingInterpretations Committee) interpretations.
The condensed consolidated financial statements as of June 30,2020 and June 30, 2021 have been prepared in compliance withIAS 34 “Interim financial reporting”. The financial statements havebeen prepared on the historical cost basis, except for the valuationof certain financial instruments.
IAS 34 allows presentation of a selection of notes to the condensedconsolidated financial statements that should be read inconjunction with the consolidated financial statements ofDecember 31, 2020.
The measurement procedures used for the interim condensedconsolidated financial statements are as follows:
interim period income tax expense results from the estimated●
annual Group effective income tax rate applied to the pre-taxresult of the interim period excluding non-recurring materialitems. The income tax charge related to any non-recurring itemin the period is accrued using its actual tax expense;
regarding the main pension plans and other employee benefits●
(United States, Canada, France, United Kingdom), actuarialvaluations are performed every six months. Amountsrecognized in the interim statement of financial position arebased on estimates made at the end of the previous year andon the discount rates as of June 30. Regarding share-basedpayments and other benefits plans, expenses are recognized inthe period on a pro rata basis of the estimated costs for theyear.
The principal accounting policies remain unchanged compared tolast year except for adoption of the following standard, effectivesince January 1, 2021.
Adoption of new and revised International Financial 1-1-2Reporting Standards, interpretations and amendments
New standards, amendments and interpretations of mandatory application for financial years beginning on or after January 1, 2021
The following standards and amendments are effective sinceJanuary 1, 2021 and have been applied to the consolidated financialstatement as of June 30, 2021:
amendments to IFRS 4 – Temporary exemption from IFRS 9;●
amendments to IFRS 9, IAS 39, IFRS 7, IFRS 4 and IFRS 16 –●
Interest Rate Benchmark Reform – Phase 2.
The application of these standards and amendments did not haveany material impact on the Group’s accounts.
New standards, interpretations and amendments that may be applied early for financial years beginning on or after January 1, 2021
As of June 30, 2021, the Group did not elect to early apply anystandard, interpretation or amendment.
Standards, interpretations and amendments that may not be applied early for financial years beginning on or after January 1, 2021
amendments to IAS 1 – Presentation of Financial Statements:●
Classification of Liabilities as Current or Non-current;
amendments to IAS 8 – Accounting Policy Changes;●
amendments to IAS 12 – Recognition of Deferred Tax Assets●
for Unrealised Losses;
amendments to IAS 16 – Property, Plant and Equipment -●
Proceeds before Intended Use;
amendments to IAS 37 – Provisions, Contingent Liabilities and●
Contingent Assets – Onerous contracts – Cost of Fulfilling aContract;
annual improvements – 2018-2020;●
amendments to IFRS 3 – Business Combinations – References●
to the conceptual framework;
amendments to IFRS 16 – Leases – Covid-19 rent relief●
beyond June 30, 2021.
Analysis on the practical consequences of these new regulations isin progress.
Change in Group structure1-2
On February 26, 2021 – BIC announced the closing of the sale of itsBrazilian adhesive label business, PIMACO, to Grupo CCRR for40 million Brazilian Real (approximately 6.0 million euros). Thetransaction has been approved by the Brazilian antitrustauthorities.
Significant events1-3
On February 11, 2021 – BIC announced that it has signed withBNP Paribas Real Estate and CITALLIOS the sale of itsClichy-la-Garenne-based (France) Headquarters and BICTechnologies sites for an amount of 175 million euros, representinga 167.7 million euros gross capital gain.
Subsequent events1-4
No other subsequent event occurred between July 1, 2021 and thereporting date.

HALF-YEAR CONSOLIDATED FINANCIAL STATEMENTS
Notes to the consolidated financial statements
28 • BIC GROUP - 2021 HALF-YEAR FINANCIAL REPORT •
OPERATING SEGMENTSNOTE 2
General information2-1
According to IFRS 8, BIC Group operating segments have beendetermined based on the reports regularly provided to themanagement and used to make strategic decisions.
The measurement policies that the Group uses for segmentalreporting under IFRS 8 are the same as those used in its financialstatements.
The Management, composed of operational representativesresponsible for the continents, representatives of the categoriesand cross-functional areas, considers the business from a productcategory perspective, knowing that each category can be reviewedfor a specific geographic area if necessary.
These operating segments receive their revenues from theproduction and distribution of each product category.
Following the new organization announced at the time of BIC’stransformation plan launched in February 2019, a new reportingstructure has been put in place starting in 2020.
The unallocated costs have been removed from Categories’ IncomeFrom Operations and Normalized Income From Operations, andwill be presented separately:
stationery;●
lighters;●
shavers;●
other products;●
unallocated costs.●
Unallocated costs include:
net costs (balance of income and expenses):●
of Corporate headquarters including IT, finance, legal and•HR costs,
of shared services center;•other net costs that can’t be allocated to Categories, notably●
restructuring costs, gains or losses on assets’ divestiture, etc.
Information on income statement and assets 2-2by activity
As of Q1 2021, BIC has evolved its financial communication andKPIs to adapt to the Horizon plan.
Normalized income from operations is replaced by Adjusted EBIT.
All indicators are determined according to IFRS, except for:
adjusted income from operations, which is the EBIT restated●
for non-recurring items (in particular real estate gains, the gainor loss on the sale of businesses and restructuring costs).
It constitutes the key financial metric used within the Group;
capital additions, which are the purchases and internal●
generation of property, plant and equipment and intangiblefixed assets for the period.

HALF-YEAR CONSOLIDATED FINANCIAL STATEMENTS
Notes to the consolidated financial statements
29• BIC GROUP - 2021 HALF-YEAR FINANCIAL REPORT •
(in million euros)
At June 30, 2020 At June 30, 2021
Stationery Lighters ShaversOther
ProductsUnallocated
costs Total Stationery Lighters ShaversOther
ProductsUnallocated
costs Total
Income statement
Net sales• 294 268 201 13 - 776 333 368 200 16 - 917
Depreciation and •amortization (17) (13) (17) (11) - (58) (16) (14) (16) (10) - (56)
Impairment loss• (42) - - - - (42) - - - - - (1)
EBIT• (35) 84 17 (3) (39) 24 29 144 32 3 131 333
Restatements made to obtain adjusted EBIT
Cello impairment on •property, plant & equipment and trademark impairment in 2020
42 - - - - 42 - - - - - -
Restructuring costs• - - - 2 5 8 1 2 - - 1 4
Some expenses •related to the Covid-19 epidemic, mainly underabsorption of fixed costs
12 3 4 - - 19 - - - - - -
Clichy headquarters •sales capital gain
- - - - - - - - - - (168) (168)
PIMACO divestiture •capital gain - - - - - - (3) - - - - (3)
Adjusted EBIT 19 87 22 (1) (34) 93 28 146 32 (3) (37) 166
As of June 30, 2021, the BIC Group had identified Walmart group as a major customer with which it realized 10% of its net sales over theperiod.
(in million euros)
At June 30, 2020 At June 30, 2021
Stationery Lighters ShaversOther
Products Total Stationery Lighters ShaversOther
Products Total
Capital additions (a) (b) 7 18 11 7 44 6 11 8 5 30
Net inventories 234 140 102 9 485 221 116 98 7 443
Excluding 2021 capital additions not cashed out end of June 2021 and including capital additions cashed out in 2021 related to 2020 for a net amount of -0.8 million euros.(a)Excluding 2020 capital additions not cashed out end of June 2020 and including capital additions cashed out in 2020 related to 2019 for a net amount of 12.6 million euros.(b)

HALF-YEAR CONSOLIDATED FINANCIAL STATEMENTS
Notes to the consolidated financial statements
30 • BIC GROUP - 2021 HALF-YEAR FINANCIAL REPORT •
Informations by geography2-3
The geographies identified by the management are: France, Europe (excluding France), North America and Developing markets.
(in million euros)
At June 30, 2020 At June 30, 2021
France
Europeexcl-
udingFrance
NorthAmerica
LatinAmerica
MiddleEast and
Africa
Asia andOceania
(incl-udingCello) Total France
Europeexcl-
udingFrance
NorthAmerica
LatinAmerica
MiddleEast and
Africa
Asia andOceania
(incl-udingCello) Total
Net sales 84 174 343 94 39 42 776 103 189 406 126 51 41 917
The Group may grant year-end rebates. These rebates are booked in net sales and amounted 51 millions euros as of June 30, 2021compared to 47 million euros as of June 30, 2020.
(in million euros)
At December 31, 2020 At June 30, 2021
France
Europeexcluding
FranceNorth
AmericaDeveloping
Markets Total France
Europeexcluding
FranceNorth
AmericaDeveloping
Markets Total
Non-current assets (a) 322 187 243 196 948 313 182 247 184 926
Other than financial instruments (0.1 million euros in 2021 and 2.9 million euros in 2020), deferred tax assets (124.2 million euros in 2021 and 114.2 million euros in 2020).(a)
OPERATING EXPENSESNOTE 3
(in thousand euros) June 30, 2020 June 30, 2021
Raw materials, consumables used and change in inventory 188,271 235,047
Staff costs 245,853 249,531
Depreciation and amortization expenses 57,908 56,113
Other operating expenses 208,354 219,453
Impairment loss on manufacturing equipment 184 403
Profit/(loss) on operational foreign currency translation 131 (7,181)
TOTAL 700,731 753,366
Other income and expenses are not included in the total amountand are disclosed in Note 4.
Other operating expenses mainly include outside services.
Research and development costs recognized under other operatingexpenses for the first half of 2021 amounted to 11.1 million euros,versus 9.6 million euros during the first half of 2020.
They include the French research tax credit for 1.5 million euros,same as 2020.

HALF-YEAR CONSOLIDATED FINANCIAL STATEMENTS
Notes to the consolidated financial statements
31• BIC GROUP - 2021 HALF-YEAR FINANCIAL REPORT •
OTHER INCOME AND EXPENSESNOTE 4
(in thousand euros) June 30, 2020 June 30, 2021
Royalties income 57 (1)
Gain on sale of Clichy’s Headquarters - 167,711
Gain on disposal of fixed assets - 509
PIMACO divestiture gain - 3,027
Other 2,893 3,858
Other income 2,950 175,104
Loss on disposal of fixed assets (63) -
Impairment on property, plant & equipement and trademark – Cello (41,729) -
Cost reduction plans (7,873) (4,248)
Other (4,395) (1,636)
Other expenses (54,060) (5,884)
TOTAL (51,110) 169,220
Other income and expenses incurred in the first half 2021 mainlyinclude:
167.7 million euros from Clichy Headquarters sale;●
PIMACO divestiture gain for 3 million euros;●
4.2 million euros of restructuring costs, of which the●
transformation plan, is the main driver.
Other income and expenses incurred in the first half 2020 mainlyincluded:
property, plant and equipement along with trademark●
impairment of Cello for 41.7 million euros;
the restructuring costs amounting to 7.9 million euros mainly●
related to “BIC 2022 – Invent the Future” transformation planexpenses;
the expenses linked to the Covid-19 impact during the first●
half of 2020 for 2.1 million euros.
FINANCE INCOMENOTE 5
(in thousand euros) June 30, 2020 June 30, 2021
Interest income from cash and cash equivalents 1,211 425
Interest on bank deposits 847 827
Income from cash and cash equivalents 2,058 1,253
Interest expense (1,948) (884)
Cost of financial debt – IFRS 16 (752) (527)
Argentina hyperinflation accounting - IAS 29 (1,377) (2,957)
Net financial foreign exchange difference 11,910 (931)
Net finance income/(net finance costs) 7,832 (5,299)
FINANCE (COSTS)/REVENUE 9,890 (4,046)
Financial income decreased in the first half 2021 compared to2020. It comes from several factors:
during the first half of 2020, the depreciation of Mexican peso●
and Brazilian real against the U.S. dollar generated a muchfavorable impact on the valuation of financial assetsdenominated in U.S. dollars;
first half of 2021 was more impacted by Argentina●
hyperinflation accounting than in 2020;
income from cash and cash equivalents decreased compared●
to the previous period due to lower interest rates.
HALF-YEAR CONSOLIDATED FINANCIAL STATEMENTS
Notes to the consolidated financial statements
32 • BIC GROUP - 2021 HALF-YEAR FINANCIAL REPORT •
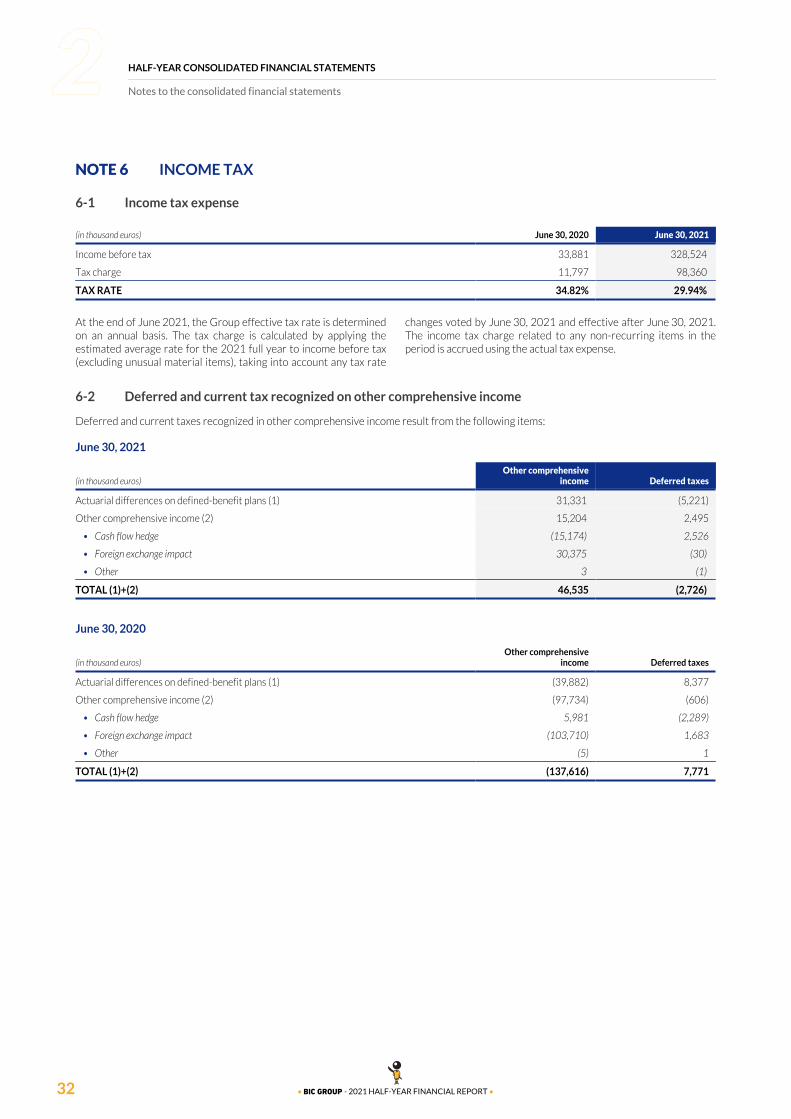
INCOME TAXNOTE 6
Income tax expense6-1
(in thousand euros) June 30, 2020 June 30, 2021
Income before tax 33,881 328,524
Tax charge 11,797 98,360
TAX RATE 34.82% 29.94%
At the end of June 2021, the Group effective tax rate is determined changes voted by June 30, 2021 and effective after June 30, 2021.on an annual basis. The tax charge is calculated by applying the The income tax charge related to any non-recurring items in theestimated average rate for the 2021 full year to income before tax period is accrued using the actual tax expense.(excluding unusual material items), taking into account any tax rate
Deferred and current tax recognized on other comprehensive income6-2
Deferred and current taxes recognized in other comprehensive income result from the following items:
June 30, 2021
(in thousand euros)Other comprehensive
income Deferred taxes
Actuarial differences on defined-benefit plans (1) 31,331 (5,221)
Other comprehensive income (2) 15,204 2,495
Cash flow hedge• (15,174) 2,526
Foreign exchange impact• 30,375 (30)
Other• 3 (1)
TOTAL (1)+(2) 46,535 (2,726)
June 30, 2020
(in thousand euros)Other comprehensive
income Deferred taxes
Actuarial differences on defined-benefit plans (1) (39,882) 8,377
Other comprehensive income (2) (97,734) (606)
Cash flow hedge• 5,981 (2,289)
Foreign exchange impact• (103,710) 1,683
Other• (5) 1
TOTAL (1)+(2) (137,616) 7,771
HALF-YEAR CONSOLIDATED FINANCIAL STATEMENTS
Notes to the consolidated financial statements
33• BIC GROUP - 2021 HALF-YEAR FINANCIAL REPORT •
EARNINGS PER SHARE GROUP SHARENOTE 7
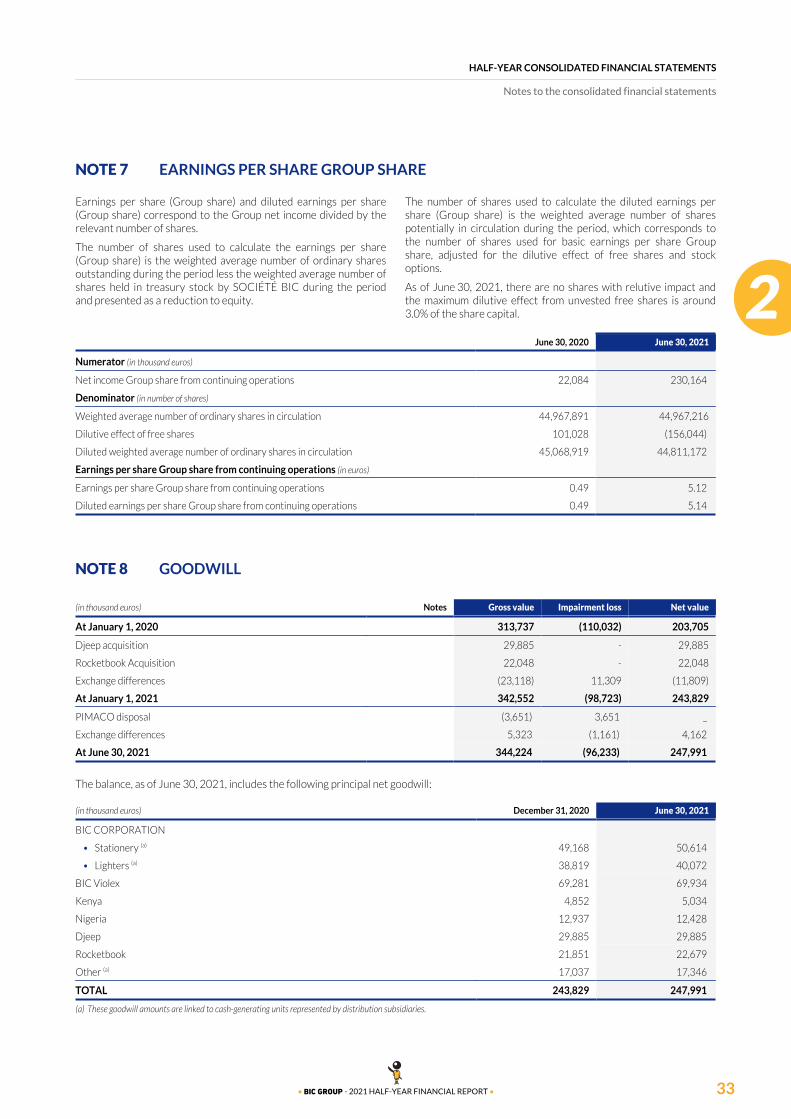
Earnings per share (Group share) and diluted earnings per share(Group share) correspond to the Group net income divided by therelevant number of shares.
The number of shares used to calculate the earnings per share(Group share) is the weighted average number of ordinary sharesoutstanding during the period less the weighted average number ofshares held in treasury stock by SOCIÉTÉ BIC during the periodand presented as a reduction to equity.
The number of shares used to calculate the diluted earnings pershare (Group share) is the weighted average number of sharespotentially in circulation during the period, which corresponds tothe number of shares used for basic earnings per share Groupshare, adjusted for the dilutive effect of free shares and stockoptions.
As of June 30, 2021, there are no shares with relutive impact andthe maximum dilutive effect from unvested free shares is around3.0% of the share capital.
June 30, 2020 June 30, 2021
Numerator (in thousand euros)
Net income Group share from continuing operations 22,084 230,164
Denominator (in number of shares)
Weighted average number of ordinary shares in circulation 44,967,891 44,967,216
Dilutive effect of free shares 101,028 (156,044)
Diluted weighted average number of ordinary shares in circulation 45,068,919 44,811,172
Earnings per share Group share from continuing operations (in euros)
Earnings per share Group share from continuing operations 0.49 5.12
Diluted earnings per share Group share from continuing operations 0.49 5.14
GOODWILLNOTE 8
(in thousand euros) Notes Gross value Impairment loss Net value
At January 1, 2020 313,737 (110,032) 203,705
Djeep acquisition 29,885 - 29,885
Rocketbook Acquisition 22,048 - 22,048
Exchange differences (23,118) 11,309 (11,809)
At January 1, 2021 342,552 (98,723) 243,829
PIMACO disposal (3,651) 3,651 _
Exchange differences 5,323 (1,161) 4,162
At June 30, 2021 344,224 (96,233) 247,991
The balance, as of June 30, 2021, includes the following principal net goodwill:
(in thousand euros) December 31, 2020 June 30, 2021
BIC CORPORATION
Stationery (a)• 49,168 50,614
Lighters (a)• 38,819 40,072
BIC Violex 69,281 69,934
Kenya 4,852 5,034
Nigeria 12,937 12,428
Djeep 29,885 29,885
Rocketbook 21,851 22,679
Other (a) 17,037 17,346
TOTAL 243,829 247,991
These goodwill amounts are linked to cash-generating units represented by distribution subsidiaries.(a)

HALF-YEAR CONSOLIDATED FINANCIAL STATEMENTS
Notes to the consolidated financial statements
34 • BIC GROUP - 2021 HALF-YEAR FINANCIAL REPORT •
To perform the impairment tests, the Group used the following discount and perpetual growth rates:
Weighted average cost of capital
(WACC) before taxPerpetual growth
rate
2020 2021 2020 2021
BIC CORPORATION
Stationery• 8.5% 9.9% 1.5% 1.5%
Lighters• 8.4% 9.6% 1.5% 1.5%
Cello Pens 14.7% 14.2% 3.4% 4.0%
BIC Violex 12.05% 13.8% 1.9% 1.9%
Kenya 18.7% 17.9% 6.0% 5.0%
Nigeria 24.6% 28.2% 8.1% 10.3%
Djeep - 9.2% - 0%
Rocketbook - 9.1% - 1.5%
As every year, as of June 30, 2021, the Group performed annualimpairment tests on these goodwill amounts.
Each goodwill item has been allocated to a cash-generating unit(“CGU”) representing the lowest level at which goodwill ismonitored by the Group.
The goodwill on BIC CORPORATION is thus mainly allocated tocash-generating units linked to the distribution by BICCORPORATION of stationery products and lighters.
The goodwill on Cello Pens is allocated to the cash-generating unitslinked to the production and distribution of stationery products byCello.
The remaining goodwill on BIC Violex is allocated to thecash-generating unit linked to shavers developed and/or producedby BIC Violex and sold all over the world. This cash-generating unitalso includes the portion of BIC CORPORATION goodwill allocatedto shavers.
The goodwill on the Kenya subsidiary is allocated to thecash-generating unit linked to the production and distribution ofstationery products by BIC East Africa.
The goodwill on the Nigeria subsidiary is allocated to thecash-generating unit linked to the production and distribution ofstationery products by Lucky Stationary Limited.
The goodwill on Djeep is allocated to the cash-generating unitlinked to the production and distribution of lighters by Djeep.
The goodwill on Rocketbook is allocated to the cash-generating unitlinked to the distribution of the Core and Fusion notebooks,reusable notebooks used with erasable pens by Rocketbook.
The goodwill impairment test methodology is based on acomparison between the recoverable amount of each of theGroup’s cash-generating units and the corresponding assets’ netbook value (including goodwill).
Such recoverable amounts correspond to the value in use and aredetermined using discounted future cash flow projections over amaximum of five years and a terminal value using the perpetualannuity method, including notably the following:
the discount rate before taxes used is the weighted average●
cost of capital. Particular attention has been paid to theanalysis of the main market items used for the calculation ofthe discount rates;
the perpetual growth rates were determined based on external●
(inflation rate) and internal (business growth) sources. Perpetualgrowth rates above 2% take into account market specifics.
Considering the impairment on part of the assets on the CGU Cello,any negative variance of drivers (discount rate, performance andperpetual growth rates) would lead to an additional impairment ofother assets.
The sensitivity of the other impairment tests to changes in the keyassumptions indicates that no reasonably likely change would leadto impairment, taking into account the observed headroom on theother tests conducted.
HALF-YEAR CONSOLIDATED FINANCIAL STATEMENTS
Notes to the consolidated financial statements
35• BIC GROUP - 2021 HALF-YEAR FINANCIAL REPORT •
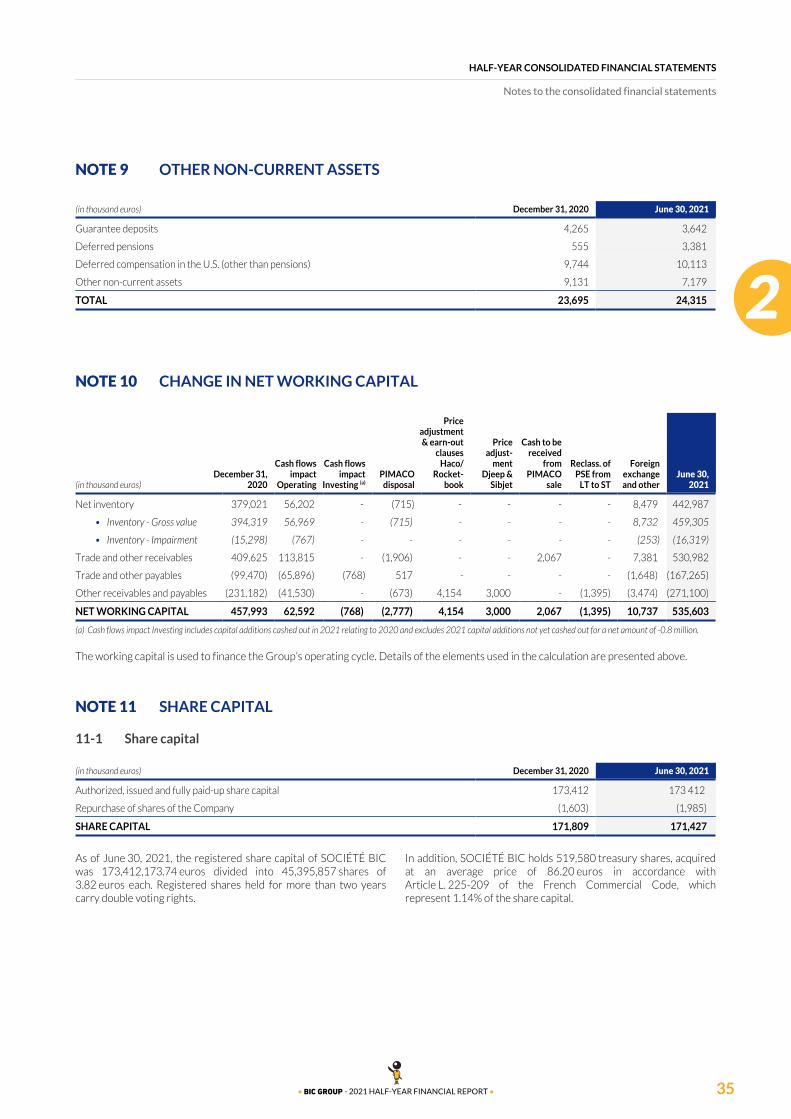
OTHER NON-CURRENT ASSETSNOTE 9
(in thousand euros) December 31, 2020 June 30, 2021
Guarantee deposits 4,265 3,642
Deferred pensions 555 3,381
Deferred compensation in the U.S. (other than pensions) 9,744 10,113
Other non-current assets 9,131 7,179
TOTAL 23,695 24,315
CHANGE IN NET WORKING CAPITALNOTE 10
(in thousand euros)December 31,
2020
Cash flowsimpact
Operating
Cash flowsimpact
Investing (a)PIMACO
disposal
Priceadjustment& earn-out
clausesHaco/
Rocket-book
Priceadjust-
mentDjeep &
Sibjet
Cash to bereceived
fromPIMACO
sale
Reclass. ofPSE from
LT to ST
Foreignexchangeand other
June 30,2021
Net inventory 379,021 56,202 - (715) - - - - 8,479 442,987
Inventory - Gross value• 394,319 56,969 - (715) - - - - 8,732 459,305
Inventory - Impairment• (15,298) (767) - - - - - - (253) (16,319)
Trade and other receivables 409,625 113,815 - (1,906) - - 2,067 - 7,381 530,982
Trade and other payables (99,470) (65,896) (768) 517 - - - - (1,648) (167,265)
Other receivables and payables (231,182) (41,530) - (673) 4,154 3,000 - (1,395) (3,474) (271,100)
NET WORKING CAPITAL 457,993 62,592 (768) (2,777) 4,154 3,000 2,067 (1,395) 10,737 535,603
Cash flows impact Investing includes capital additions cashed out in 2021 relating to 2020 and excludes 2021 capital additions not yet cashed out for a net amount of -0.8 million.(a)
The working capital is used to finance the Group’s operating cycle. Details of the elements used in the calculation are presented above.
SHARE CAPITALNOTE 11
Share capital11-1
(in thousand euros) December 31, 2020 June 30, 2021
Authorized, issued and fully paid-up share capital 173,412 173 412
Repurchase of shares of the Company (1,603) (1,985)
SHARE CAPITAL 171,809 171,427
As of June 30, 2021, the registered share capital of SOCIÉTÉ BICwas 173,412,173.74 euros divided into 45,395,857 shares of3.82 euros each. Registered shares held for more than two yearscarry double voting rights.
In addition, SOCIÉTÉ BIC holds 519,580 treasury shares, acquiredat an average price of 86.20 euros in accordance withArticle L. 225-209 of the French Commercial Code, whichrepresent 1.14% of the share capital.

HALF-YEAR CONSOLIDATED FINANCIAL STATEMENTS
Notes to the consolidated financial statements
36 • BIC GROUP - 2021 HALF-YEAR FINANCIAL REPORT •
SOCIÉTÉ BIC owned shares and repurchase of shares of the Company as of June 30, 202111-2
Purpose of the repurchase Number of shares
Average acquisitionprice
(in euros) % of the share capital
Liquidity agreement (a) 15,506 48.32 0.03%
Free share grants (a) 504,174 87.36 1.11%
TOTAL 519,680 86.20 1.14%
Article L. 225-209 of the French Commercial Code.(a)
In accordance with the liquidity agreement, transferred by Natixisto ODDO on June 27, 2018, in respect of SOCIÉTÉ BIC shares, asof June 30, 2021, the liquidity account contained the following:
15,506 BIC shares;●
749,209.70 euros.●
At initial set-up, the liquidity account contained the following:
2,312 BIC shares;●
912,744.48 euros.●
SOCIÉTÉ BIC obtained authorization from the AnnualShareholders’ Meeting on May 19, 2021, to renew its sharerepurchase program (see 2020 Universal Registration Document,chapter 8 p. 310).
Number of shares purchased in 2021 (a)
Share repurchase program authorized by the Annual Shareholders’ Meeting held on May 20, 2020 277,834
Share repurchase program authorized by the Annual Shareholders’ Meeting held on May 19, 2021 -
Average share repurchase price for the purchases during the first half of 2021 (in euros) 56.58
Excluding shares repurchased under the liquidity contract.(a)
To the best of the Company’s knowledge, as of June 30, 2021, Shareholders holding more than 5%, 10%, 15%, 20%, 25%, 33.33%, 50%,66.66%, 90% or 95% of the share capital and/or of the voting rights of the Company were as follows:
At December 31, 2020
% of shares
(approx.)% of voting rights
(approx.)
SOCIÉTÉ M.B.D. 28.39% 38.70%
Bich family 17.22% 23.42%
BORROWINGS AND FINANCIAL LIABILITIESNOTE 12
(in thousand euros)Bank
overdraftsShort-termborrowings
Currentborrowings
and financialliabilities
Non-currentborrowings
and financialliabilities
Current leaseliability
Non-currentlease liability Total
At January 1, 2021 1,011 75,000 1,174 4,710 12,792 23,275 117,961
Cash Flows 422 - 906 - (8,282) (507) (7,461)
“Non-cash” changes 6 - (116) 184 7,986 (2,861) 5,199
Variations in obligations under leases• - - - - 7,482 (3,134) 4,348
PIMACO disposal• - - - - (20) (3) (23)
Exchange difference• 6 - (116) 184 308 494 875
At June 30, 2021 1,438 75,000 1,964 4,894 12,496 19,908 115,699
Bank overdrafts are due within one year.

HALF-YEAR CONSOLIDATED FINANCIAL STATEMENTS
Notes to the consolidated financial statements
37• BIC GROUP - 2021 HALF-YEAR FINANCIAL REPORT •
Bank loans and financial liabilities have the following maturities:
(in thousand euros) December 31, 2020 June 30, 2021
On demand or within one year 76,174 76,964
In the 2nd year - -
In the 3rd year - 4,894
In the 4th year 4,710 -
In the 5th year - -
After five years - -
TOTAL 80,884 81,858
Main bank loans/credit lines and financial liabilities are as follows:
Borrowing country Euro equivalents
(in thousand euros) Currency December 31, 2020 June 30, 2021
France• EUR 75,000 75,000
Turkey• TRY 1,042 1,864
Kenya• KES 4,710 4,894
Other• 132 100
TOTAL 80,884 81,858
Information on interest ratesAs of June 30, 2021, outstanding loans and credit lines werecontracted with floating rates ranging between 10% and 20%.
The borrowings indicated for France consist exclusively of NeuCPissues, which were issued on average at -0.08%.
Relative exposure, deemed not significant, has not been hedged.
Information on covenantsNone of the current loans contains any covenant that could triggerearly repayment of the debt.
IFRS 16 LiabilityThe BIC Group has opted to use an incremental borrowing rate fordiscounting debt. The rate used for each lessee is the rate he wouldhave to pay to borrow, over a similar period and with similarsecurity, the funds necessary to obtain an asset of similar value tothe leased asset in a similar economic environment.
The term used at the transition date is the residual term of thecontracts.

HALF-YEAR CONSOLIDATED FINANCIAL STATEMENTS
Notes to the consolidated financial statements
38 • BIC GROUP - 2021 HALF-YEAR FINANCIAL REPORT •
PROVISIONSNOTE 13
(in thousand euros)
Tax and socialrisks andlitigation Liitigation Product liability
Other risksand charges Total
At January 1, 2021 3,845 13,375 311 8,029 25,560
Additional provisions 279 1,928 - 424 2,632
Reversals of provisions utilized (1,013) (758) - (2,921) (4,692)
Reversals of provisions not utilized (2) (184) - (107) (292)
Exchange differences 49 333 12 7 401
PIMACO disposal (8) (492) - 1 (500)
Reclassification - - - (1,395) (1,395)
At June 30, 2021 3,149 14,202 323 4,039 21,714
As of June 30, 2021, it was not deemed necessary to bookprovisions for the risks described in Part 1 “Group Presentation”that could affect:
the Company’s personnel, assets, environment or reputation;●
the Group’s ability to reach its objectives and abide by its●
Values, ethics or the laws and regulations.
Tax (excluding income tax) and social risks and litigationProvisions for tax (excluding income tax) and social risks andlitigation relate mainly to:
tax risks;●
U.S. workers’ compensation.●
LitigationAs of June 30, 2021, the litigation provision mainly representsdistributor and commercial agent risks for 2.1 million euros(1.9 million euros as at December 31, 2020).
Other risks and chargesAs of June 30, 2021, other provisions for risks and charges aremainly related to the restructuring provisions for an amount of2.1 million euros.
Product liabilityProduct liability mainly relates to the U.S.
OTHER CURRENT LIABILITIESNOTE 14
(in thousand euros) December 31, 2020 June 30, 2021
Social liabilities 86,766 95,084
Other tax liabilities 10,132 19,625
Accrued Business Development Fund 75,516 93,179
Provision for restructuring 17,252 13,024
Other current liabilities 61,512 76,381
OTHER CURRENT LIABILITIES 251,178 297,293

HALF-YEAR CONSOLIDATED FINANCIAL STATEMENTS
Notes to the consolidated financial statements
39• BIC GROUP - 2021 HALF-YEAR FINANCIAL REPORT •
COMMENTS ON THE CONSOLIDATED CASH FLOW STATEMENTNOTE 15
References from (a) to (l) refer to the consolidated cash flowstatement on page 25.
As of June 30, 2021 cash and cash equivalents amounted to450.0 million euros and bank overdrafts to 1.4 million euros.
Net cash from operating activitiesH1 2021 net cash from operating activities amounted to134.0 million euros.
As of June 30, 2020 property, plant and equipment of Cello Penswere impaired for 26.8 million euros and the trademark for14.9 million euros (a).
The Group recorded foreign exchange (gains)/losses with no cashimpact in financial income and restated these in the consolidatedcash flow statement (b).
In the first half of 2021, the sale of Clichy headquarters generated acapital gain of 167.7 million euros.
The divestiture of PIMACO generated a capital gain of 3.0 millioneuros (c).
There was no individually significant disposal of fixed assets duringthe first half of 2020 (c).
The working capital (see Note 10 for the definition) increaseamounted to 62.6 million euros compared to an increase, during thefirst half 2020, of 31.2 million euros. The 2021 variance is mainlyexplained by an increase in trade receivables and inventories, partlyoffset by an increase in trade payables (d).
The 2020 variance was mainly explained by an increase ininventories (d).
The payments related to employee benefits were mainly driven bythe U.S. and United Kingdom (e).
Net cash from investing activitiesNet cash from investing activities amounted to 141.7 million eurosduring the first half 2021 compared to -42.2 million euros duringthe first half 2020.
During the first half 2021, the headquarters of Clichy were sold fora net amount of 173.9 million euros that represent the proceed ondisposal net of related costs.
During the first half 2021, PIMACO was disposed of for a netamount of 3.4 million euros that represents the proceed on disposalnet of cash & cash equivalent of the divested entity, related costsand also income tax paid on the capital gain.
During the first half 2020, there was no disposal of individuallysignificant fixed assets (c).
During the first half 2021, the BIC Group disbursed 30.3 millioneuros on property, plant and equipement and intangible assets(including -0.8 million euros related to the change in fixed assetsupplier accounts) (g).
Purchases of property, plant and equipment do not include financeleases booked as a counterpart to a financial debt, as thesetransactions do not have any impact on cash (g).
During the first half of 2021, payments were made in respect of theHaco Kenya earn-out for 2.7 million dollars, Rocketbook priceadjustment for 2.2 million dollars and Djeep price adjustment for3 million euros (i).
An additional amount of 2.7 million euros related to the acquisitionof Haco Industries Kenya was disbursed in the first half 2020 (i).
“Other current financial assets” referred to investments not eligiblefor classification as cash & cash equivalents under IAS 7. Theseinvestments consisted of units of UCITS and negotiable debtsecurities, all of which are liquid within 5 days. They were soldduring 2020 (h).
Net cash from financing activitiesNet cash from financing activities amounted to -103.3 million eurosduring the first half 2021 compared to -21.4 million euros in thefirst half 2020.
The dividends paid represent the dividends paid by SOCIÉTÉ BIC toits Shareholders (see Note 16) (j).
As of June 30, 2021, new borrowings amounted to 0.9 millioneuros, compared to 105.0 million euros in the first half 2020 (k).
During the first half 2021, 277,834 shares were repurchased bySOCIÉTÉ BIC for 15.7 million euros. Under the liquidity agreement,SOCIÉTÉ BIC bought 276,046 shares for 14.6 million euros, andsold 298,246 shares for 15.8 million euros (l).
During the first half 2020, 136,383 shares were repurchased bySOCIÉTÉ BIC for 7.4 million euros. Under the liquidity agreement,SOCIÉTÉ BIC bought 215,239 shares for 11.2 million euros, andsold 213,872 shares for 11.2 million euros (l).
DIVIDENDSNOTE 16
For the 2020 fiscal year, an ordinary dividend of 1.80 euros per share was distributed to Shareholders on June 2, 2021.
For the 2019 fiscal year, an ordinary dividend of 2.45 euros per share was distributed to Shareholders on June 3, 2020.

HALF-YEAR CONSOLIDATED FINANCIAL STATEMENTS
Notes to the consolidated financial statements
40 • BIC GROUP - 2021 HALF-YEAR FINANCIAL REPORT •
SHARE-BASED PAYMENTSNOTE 17
As of June 30, 2021, the fair value of options and shares grantedamounts to 5,037 thousand euros and is booked in staff costs.
The Board of Directors of February 16, 2021 decided to grant244,181 free shares to 162 beneficiaries subject to performanceconditions and 137,322 free shares to 672 beneficiaries withoutperformance conditions. The plans’ unit fair value is 42.93 euros.
The Board of Directors of May 19, 2021 decided exceptionally togrant 1,224,500 stock options to 14 beneficiaries subject toperformance conditions. The plans’ unit fair value is 7.54 euros.
FINANCIAL INSTRUMENTSNOTE 18
Impact of interest rate and foreign exchange risks’ hedging on consolidated financial statements 18-1as of June 30, 2021
The following amounts have been booked as the fair value of derivatives as of June 30, 2021 (in thousand euros):
Derivative instruments and revaluation
Hedge qualification/hedged risk
Net financialIncome/
(expense)before tax –
Note 5
Incomefrom
operations– Note 3
Othercomprehensive
income beforetax (a)
Currentassets (b)
Non-currentassets
Currentliabilities
Non-currentliabilities
Hedging revaluation impact
Commercial flows Cash flow hedge/foreign exchange risk
(290) (1,461) (14,526) 8,043 47 (3,946) -
Dividends Net investment/foreign exchange risk
- - (648) 139 - (122) -
Subtotal (1) (290) (1,461) (15,174) 8,182 47 (4,068) -
Revaluation of cross-currency swaps backed by cash positions in foreign currencies
At fair value through P&L/foreign exchange risk
(130) - - 3 - (41) -
Subtotal (2) (130) - - 3 - (41) -
TOTAL (1)+(2) (421) (1,461) (15,174) 8,185 47 (4,108) -
This corresponds to mark-to-market of hedging instruments in the portfolio at June 30, 2021 restated for the reversal of the mark-to-market of the portfolio of hedging instruments as of (a)December 31, 2020.Including options not yet exercised held by SOCIÉTÉ BIC representing current assets for 245 thousand euros.(b)

HALF-YEAR CONSOLIDATED FINANCIAL STATEMENTS
Notes to the consolidated financial statements
41• BIC GROUP - 2021 HALF-YEAR FINANCIAL REPORT •
Impact of interest rate and foreign exchange risks’ hedging on consolidated financial statements as of 18-2December 31, 2020
The following amounts have been booked as the fair value of derivatives as of December 31, 2020 (in thousand euros):
Derivative instruments and revaluation
Hedge income qualification/hedged risk
Net financialIncome/
(expense)before tax –
Note 5
Incomefrom
operations –Note 3
Othercomprehensive
income beforetax (a)
Currentassets (b)
Non-currentassets
Currentliabilities
Non-currentliabilities
Hedging revaluation impact
Commercial flows Cash flow hedge/foreign exchange risk
(398) 5,148 21,470 25,236 976 (3,214) (53)
Dividends Net investment/foreign exchange risk
- - 1,914 664 - - -
Subtotal (1) (398) 5,148 23,384 25,900 976 (3,214) (53)
Revaluation of cross-currency swaps backed by cash positions in foreign currencies
At fair value through P&L/oreign exchange risk
166 - - 173 - (80) -
Subtotal (2) 166 - - 173 - (80) -
TOTAL (1)+(2) (232) 5,148 23,384 26,073 976 (3,294) (53)
This corresponds to mark-to-market of hedging instruments in the portfolio at December 31, 2020, restated for the reversal of the mark-to-market of the portfolio of hedging (a)instruments as of December 31, 2019.Including options not yet exercised held by SOCIÉTÉ BIC representing current assets for 528 thousand euros.(b)
CONTINGENT LIABILITIESNOTE 19
As of June 30, 2021, neither SOCIÉTÉ BIC nor its subsidiaries wereaware of any contingent liabilities.
Contingent liabilities are defined by IAS 37 as follows:
possible obligations whose existence will be confirmed by●
uncertain future events that are not wholly within the controlof the entity;
actual obligations resluting from previous events and that are●
not recognized because:
settlement, involving an outflow representing economic•benefits, is not probable, or
their amount cannot be measured reliably.•
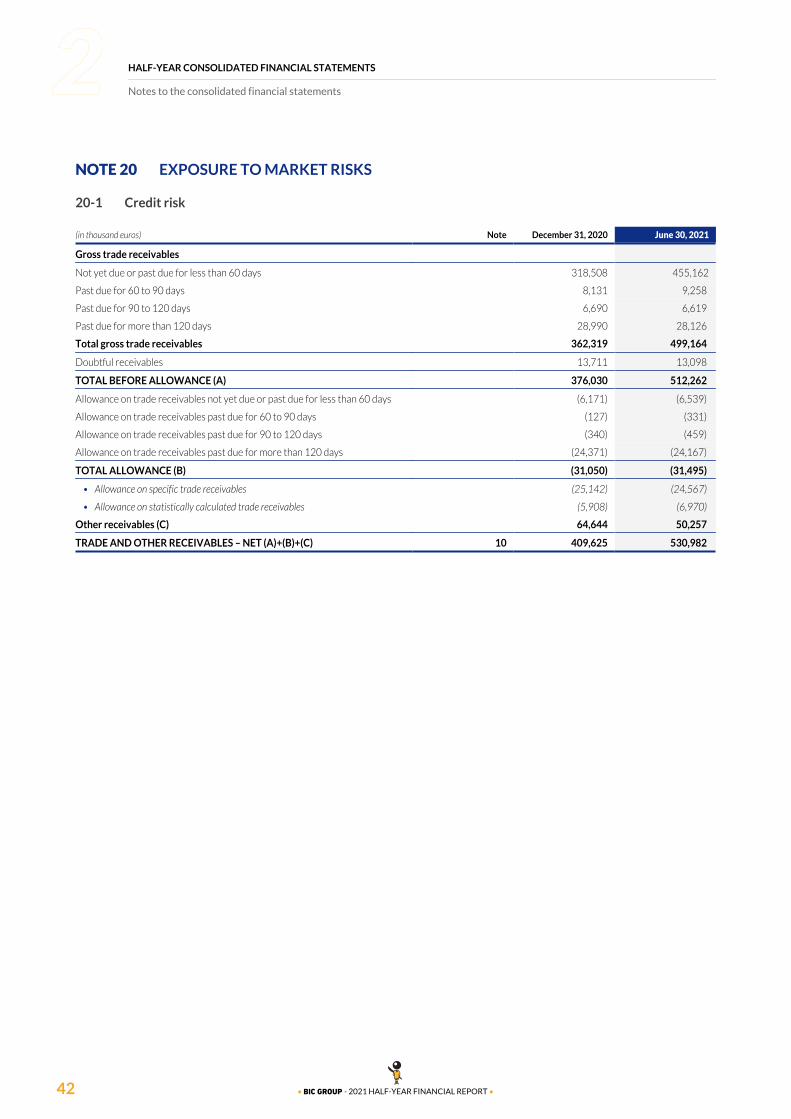
HALF-YEAR CONSOLIDATED FINANCIAL STATEMENTS
Notes to the consolidated financial statements
42 • BIC GROUP - 2021 HALF-YEAR FINANCIAL REPORT •
EXPOSURE TO MARKET RISKSNOTE 20
Credit risk20-1
(in thousand euros) Note December 31, 2020 June 30, 2021
Gross trade receivables
Not yet due or past due for less than 60 days 318,508 455,162
Past due for 60 to 90 days 8,131 9,258
Past due for 90 to 120 days 6,690 6,619
Past due for more than 120 days 28,990 28,126
Total gross trade receivables 362,319 499,164
Doubtful receivables 13,711 13,098
TOTAL BEFORE ALLOWANCE (A) 376,030 512,262
Allowance on trade receivables not yet due or past due for less than 60 days (6,171) (6,539)
Allowance on trade receivables past due for 60 to 90 days (127) (331)
Allowance on trade receivables past due for 90 to 120 days (340) (459)
Allowance on trade receivables past due for more than 120 days (24,371) (24,167)
TOTAL ALLOWANCE (B) (31,050) (31,495)
Allowance on specific trade receivables• (25,142) (24,567)
Allowance on statistically calculated trade receivables• (5,908) (6,970)
Other receivables (C) 64,644 50,257
TRADE AND OTHER RECEIVABLES – NET (A)+(B)+(C) 10 409,625 530,982

HALF-YEAR CONSOLIDATED FINANCIAL STATEMENTS
Notes to the consolidated financial statements
43• BIC GROUP - 2021 HALF-YEAR FINANCIAL REPORT •
Fair value of financial assets and liabilities20-2
Accounting categories and fair value of financial instruments
June 30, 2021
Balance sheet items (in thousand euros) Note
Balancesheet value Fair value
Breakdown by category of instruments
At fair valuethrough the
incomestatement
Derivativehedging
instruments
Receivablesat amortized
cost
Debts atamortized
cost
At fair valuethrough
equity
Financial assets 989,233 989,233 256,544 8,233 724,457 - -
Non-current
Derivative financial instruments• 18 47 47 - 47 - - -
Other investments• 38 38 38 - - - -
Current
Trade and other receivables• 10 530,982 530,982 16,910 - 514,072 - -
Derivative financial instruments• 18 8,185 8,185 - 8,185 - - -
Other current financial assets• - - - - - - -
Cash and cash equivalents• 15 449,981 449,981 239,596 - 210,385 - -
Financial liabilities 298,047 298,047 10,974 4,108 - 282,965 -
Non-current
Borrowings• 12 24,802 24,802 - - - 24,802 -
Derivative instruments• 18 - - - - - - -
Djeep earn-out clause• 3,961 3,961 3,961 - - - -
Rocketbook earn-out clause• 5,603 5,603 5,603 - - - -
Current
Borrowings• 12 90,898 90,898 - - - 90,898 -
Derivative instruments• 18 4,108 4,108 - 4,108 - - -
Rocketbook earn-out clause• 1,410 1,410 1,410 - - - -
Trade and other payables 10 167,265 167,265 - - - 167,265 -

HALF-YEAR CONSOLIDATED FINANCIAL STATEMENTS
Notes to the consolidated financial statements
44 • BIC GROUP - 2021 HALF-YEAR FINANCIAL REPORT •
December 31, 2020
Balance sheet items (in thousand euros) Note
Balancesheet value Fair value
Breakdown by category of instruments
At fair valuethrough the
incomestatement
Derivativehedging
instruments
Receivablesat amortized
cost
Debts atamortized
cost
At fair valuethrough
equity
Financial assets 702,460 702,460 128,509 27,057 546,894 - -
Non-current
Derivatives financial instruments• 18 976 976 - 976 - - -
Other investments• 34 34 34 - - - -
Current
Trade and other receivables• 10 409,625 409,625 10,268 - 399,357 - -
Derivative financial instruments• 18 26,081 26,081 - 26,081 - - -
Other current financial assets• 1 1 1 - - - -
Cash and cash equivalents• 15 265,744 265,744 118,206 - 147,537 - -
Financial liabilities 231,497 231,497 10,718 3,347 - 217,432 -
Non-current
Borrowings• 12 27,985 27,985 - - - 27,985 -
Derivative instruments• 18 53 53 - 53 - - -
Djeep earn-out clause• 3,961 3,961 3,961 - - - -
Rocketbook earn-out clause• 5,398 5,398 5,398 - - - -
Current
Borrowings• 12 89,976 89,976 - - - 89,976 -
Derivative instruments• 18 3,294 3,294 - 3,294 - - -
Rocketbook earn-out clause• 1,358 1,358 1,358 - - - -
Trade and other payables 10 99,470 99,470 - - - 99,470 -
The valuation methods adopted for financial instruments are asfollows:
financial instruments other than derivatives recorded in the●
balance sheet:
The book values used are reasonable estimates of their marketvalue except for marketable securities whose carrying valuesare determined based on the last known net asset values as ofJune 30, 2021;
derivative financial instruments:●
Market values are either those of the financial institutions orhave been calculated by an external third-party on the basis ofthe last known closing prices as of June 30, 2021. They areconsistent with the valuation reports provided by the financialinstitutions.
Fair value valuation methodThe tables below set out the fair value method for valuing financialinstruments, using the following three levels:
level 1 (quoted prices in active markets): money market UCITS●
and other current financial assets;
level 2 (observable inputs): derivatives - hedge accounting;●
level 3 (non-observable inputs): no such instruments are held●
as of June 30, 2021.
June 30, 2021
Category of instruments (in thousand euros) Total Level 1 Level 2 Level 3
At fair value through the income statement – Assets 256,544 256,544 - -
Derivative hedges – Assets 8,233 - 8,233 -
Derivative hedges – Liabilities 4,108 - 4,108 -

45• BIC GROUP - 2021 HALF-YEAR FINANCIAL REPORT •
STATUTORY AUDITORS’ REVIEW REPORT ON THE HALF-YEARLY FINANCIAL INFORMATION
STATUTORY AUDITORS’ REVIEW REPORT ON THE HALF-YEARLY FINANCIAL INFORMATION
46 • BIC GROUP - 2021 HALF-YEAR FINANCIAL REPORT •
For the period from January 1 to June 30, 2021
This is a free translation into English of the statutory auditors’ review report on the half-yearly financial information issued in French and is providedsolely for the convenience of English-speaking users. This report includes information relating to the specific verification of information given in theGroup’s half-yearly management report. This report should be read in conjunction with, and construed in accordance with, French law andprofessional standards applicable in France.
To the Shareholders of SOCIÉTÉ BIC,
In compliance with the assignment entrusted to us by our Annual General Meeting and in accordance with the requirements ofarticle L. 451-1-2-III of the French monetary and financial Code ("Code monétaire et financier"), we hereby report to you on:
the review of the accompanying condensed half-yearly consolidated financial statements of SOCIÉTÉ BIC, for the period from●
January 1 to June 30, 2021;
the verification of the information presented in the half-yearly management report.●
Due to the global crisis related to the Covid-19 pandemic, the condensed half-yearly consolidated financial statements of this period havebeen prepared and reviewed under specific conditions. Indeed, this crisis and the exceptional measures taken in the context of the state ofsanitary emergency have had numerous consequences for companies, particularly on their operations and their financing, and have led togreater uncertainties on their future prospects. Those measures, such as travel restrictions and remote working, have also had an impact onthe companies’ internal organization and the performance of our procedures.
These condensed half-yearly consolidated financial statements are the responsibility of the Board of Directors. Our role is to express aconclusion on these financial statements based on our review.
I - Conclusion on the financial statementsWe conducted our review in accordance with professional standards applicable in France. A review of interim financial information consistsof making inquiries, primarily of persons responsible for financial and accounting matters, and applying analytical and other reviewprocedures. A review is substantially less in scope than an audit conducted in accordance with professional standards applicable in Franceand consequently does not enable us to obtain assurance that we would become aware of all significant matters that might be identified inan audit. Accordingly, we do not express an audit opinion.
Based on our review, nothing has come to our attention that causes us to believe that the accompanying condensed half-yearly consolidatedfinancial statements are not prepared, in all material respects, in accordance with IAS 34, standard of the IFRSs as adopted by the EuropeanUnion applicable to interim financial information.
II - Specific verificationWe have also verified the information presented in the half-yearly management report on the condensed half-yearly consolidated financialstatements subject to our review.
We have no matters to report as to its fair presentation and consistency with the condensed interim consolidated financial statements.
Neuilly-sur-Seine and Paris-La Défense, July 29, 2021
The Statutory Auditors
French original signed by
Grant Thornton
French member of Grant Thornton International
Vianney MARTIN
Deloitte & Associés
Jean-Pierre AGAZZI

47• BIC GROUP - 2021 HALF-YEAR FINANCIAL REPORT •
STATEMENT ON THE HALF-YEARLY REPORT 2021
STATEMENT ON THE HALF-YEARLY REPORT 2021
48 • BIC GROUP - 2021 HALF-YEAR FINANCIAL REPORT •
I hereby declare that, to the best of my knowledge, the condensed consolidated financial statements for the half-year ended June 30, 2020have been prepared in accordance with applicable accounting standards and give a true and fair view of the assets, liabilities, financialposition and the profit of the Company and the entities included in the scope of consolidation of the Group and that the First HalfManagement Report includes a faithful representation of the major events which occurred during the first six months of the financial year,their impact on the financial statements, of the main related-party transactions, as well as a description of the major risks and uncertaintiesfor the remaining six months of the year.
On July 29, 2021
Gonzalve Bich
Chief Executive Officer


SOCIÉTÉ BIC92611 CLICHY CEDEX (FRANCE)
www.bic.com
HALF-YEAR FINANCIAL
2O21
Report


