Download - 3Q11 Disclosure and Results

1
Earnings Release | Conference Call – 3Q11November 11th, 2011

2
Summary
Ricardo Ribeiro
COO
Roberto Senna
CEO
Carlos Wollenweber
CFO | IR
3Q11 Highlights
Operational Highlights
Financial Highlights

3Q11 9M11
Launched PSV% Direcional
R$ million 377 1,019
Contracted PSV% Direcional
R$ million 430 863
Sales Over Supply % PSV 36.7% 50.4%
Net Revenues R$ million 298 776
Adjusted Net Income² R$ million 59 151
Adjusted Net Margin² % 20% 19%
Highlights
31. Considering the acquisition of 60% of the residential towers of Parque Ponta Negra project in 2Q11;
2. Adjusted by non-cash expenses (Stock-Options Program).
1
1
4
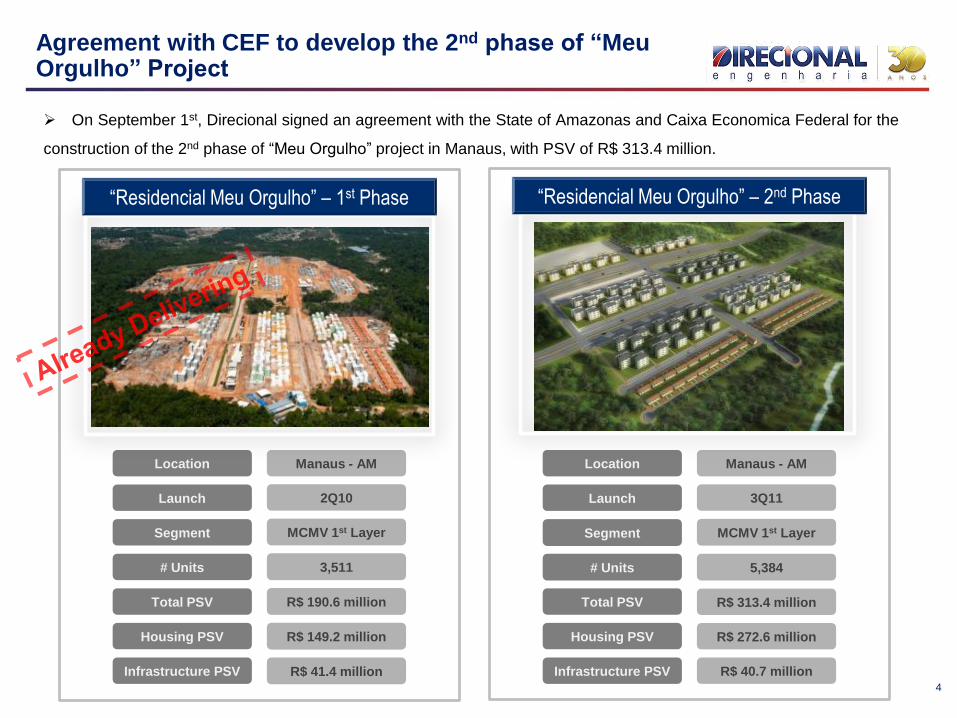
On September 1st, Direcional signed an agreement with the State of Amazonas and Caixa Economica Federal for the
construction of the 2nd phase of “Meu Orgulho” project in Manaus, with PSV of R$ 313.4 million.
# Units
Segment
Housing PSV
Infrastructure PSV
3,511
MCMV 1st Layer
R$ 149.2 million
R$ 41.4 million
Total PSV R$ 190.6 million
Location Manaus - AM
“Residencial Meu Orgulho” – 1st Phase
Launch 2Q10
# Units
Segment
Housing PSV
Infrastructure PSV
5,384
MCMV 1st Layer
R$ 272.6 million
R$ 40.7 million
Total PSV R$ 313.4 million
Location Manaus - AM
“Residencial Meu Orgulho” – 2nd Phase
Launch 3Q11
Agreement with CEF to develop the 2nd phase of “MeuOrgulho” Project

1st Phase “MCMV”
5
The most relevant player in the very low income segment in Brazil
PAR 2nd Phase “MCMV” RET1+ + +
# of projects: 5
# of Units: 3,602
Total PSV: R$ 153.7 million
Previous to “MCMV”
Program
# of projects: 3
# of Units: 7,391
Total PSV: R$ 380.3 million
# of projects: 2
# of Units: 6,724
Total PSV: R$ 392.5 million
# of projects: 5
# of Units: 2,540
Total PSV: R$ 149.2 million
Units under R$ 75.0
thousand
RET 1% Projects:
# of projects: 5
# of Units: .2,540
PSV: R$ 149.2 million
Very Low Income Projects:
# of projects: 10
# of Units: .17,717
Total PSV: R$ 926.6 million
Large Scale Projects + Industrialized construction process
Petrópolis - AM Meu Orgulho 1st Phase Meu Orgulho 2nd Phase Total Ville Macaé - RJ
Direcional as Contractor Direcional as Developer+
6
Operational Highlights
Launches
Sales
Land Bank
Inventory
Ricardo Ribeiro Operational Highlights

7
Launches
+133%
CAGR 07-10: 82%+56%
Launched PSV
(R$ million)
Launched PSV – Track Record
(R$ million)
162 63
461 575
313
191
313
131
3Q10 3Q11 9M10 9M11
Development MCMV 1st Layer Project Acquisition
1,019
652
377
162
176
710 783
1,067 888
131
2007 2008 2009 2010 9M11
Development Project Acquisition
1,019
Total
(R$'000)
% Direcional
(R$'000)
1 Portal Vistas do Horizonte September Belo Horizonte - MG 95,878 47,939 376 1,172 Medium
2 Total Ville Macaé - 3rd Phase - RET 1 September Macaé - RJ 31,010 15,505 402 1,145 Low-Income
3 Residencial Meu Orgulho - 2nd Phase September Manaus - AM 313,395 313,395 5,384 8,895 MCMV 1 st Layer
440,283 376,839 6,162 11,212
# of Units
Launched
Total Units
(All Phases)Segment
Total
PSV
3Q11 Projects Date City - State

3Q103Q11
9M109M11
60.1%83.2%
58.6% 67.7%
25.7%34.8%
5.6%
14.2% 16.8% 6.7%
26.7%
North Midwest Southeast
3Q103Q11
9M109M11
83.2%
29.2% 35.3%
95.6%
4.1%
46.3%22.4%
4.4%12.7%
21.2%
25.4%
3.2%
5.4%11.5%
MCMV 1st Layer Low-Income Medium Upper-Middle Commercial
Launches Breakdown
Launches
(Segment Breakdown – % PSV)
Launches
(Geographic Breakdown - % PSV)
8
Meu Orgulho 2nd Phase - AM
PSV R$ 313.4 Million
Portal Vistas do Horizonte - MG
PSV R$ 47.9 Million
Total Ville Macaé 3rd Phase - RJ
PSV R$ 15.5 Million
3Q103Q11
9M109M11
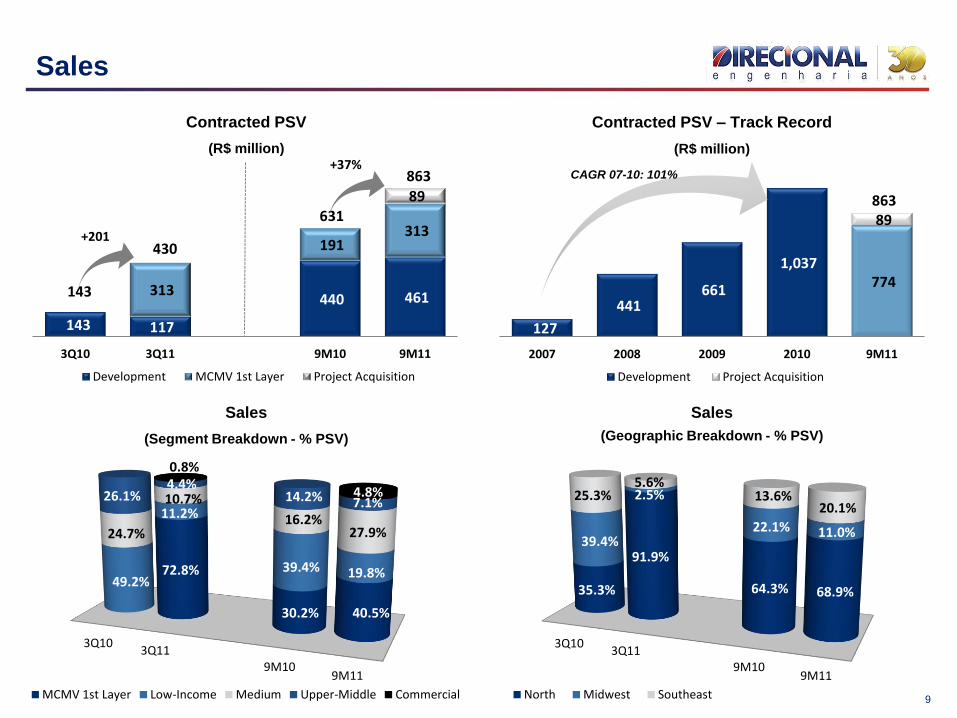
35.3%
91.9%
64.3% 68.9%
39.4%
2.5%
22.1% 11.0%
25.3%5.6%
13.6%20.1%
North Midwest Southeast
3Q103Q11
9M109M11
72.8%
30.2% 40.5%
49.2%
11.2%
39.4% 19.8%
24.7%
10.7%
16.2%27.9%
26.1%4.4%
14.2% 7.1%
0.8%
4.8%
MCMV 1st Layer Low-Income Medium Upper-Middle Commercial
143 117
440 461 313
191 313
89
3Q10 3Q11 9M10 9M11
Development MCMV 1st Layer Project Acquisition
143
430
631
863
127
441 661
1,037 774
89
2007 2008 2009 2010 9M11
Development Project Acquisition
863
9
Sales
CAGR 07-10: 101%
+201
+37%
Contracted PSV
(R$ million)
Contracted PSV – Track Record
(R$ million)
Sales
(Geographic Breakdown - % PSV)
Sales
(Segment Breakdown - % PSV)

Units Launched in 2Q11 1.732
Contracted Units 700
Contracted in 2Q11 253
Contracted in 3Q11 368
Contracted on October 79
Units to be sold* 1.032
Sales Status: RET1
38.3%
22.1%
36.7%
20.8%
27.6%
18.5%16.0%
3Q10 4Q10 1Q11 2Q11 3Q11
With MCMV 1st Layer project Ex MCMV 1st Layer project
10
Sales Over Supply
(Total PSV)
Sales Speed (%)
(Units)
Sales Status of RET1 Projects (launched in the 2Q11)
Impacted by the lower
launched PSV in the
3Q11
Sales Speed
17%
87%
48%
20%
90%
27%
4%
21%
20%
14%
1%
9%
9% 2%3Q10
4Q10
1Q11
2Q11
3Q11
3M 6M 9M 12M 15M
40%
78%
93%
70%
90%
40%
60%Contracted Units
Units to be sold*
* RET1 sales are subject to the mortgage facility approval by CEF
11
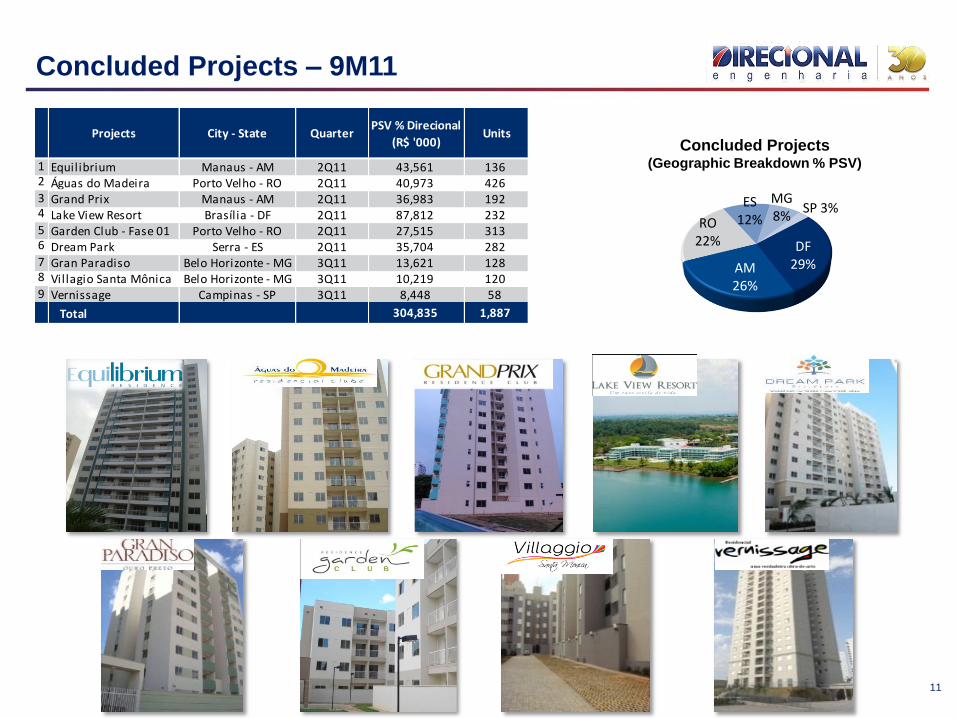
Concluded Projects – 9M11
DF 29%AM
26%
RO 22%
ES 12%
MG 8%
SP 3%
Concluded Projects(Geographic Breakdown % PSV)1 Equilibrium Manaus - AM 2Q11 43,561 136
2 Águas do Madeira Porto Velho - RO 2Q11 40,973 4263 Grand Prix Manaus - AM 2Q11 36,983 1924 Lake View Resort Brasília - DF 2Q11 87,812 2325 Garden Club - Fase 01 Porto Velho - RO 2Q11 27,515 3136 Dream Park Serra - ES 2Q11 35,704 2827 Gran Paradiso Belo Horizonte - MG 3Q11 13,621 1288 Villagio Santa Mônica Belo Horizonte - MG 3Q11 10,219 1209 Vernissage Campinas - SP 3Q11 8,448 58
Total 304,835 1,887
Projects City - StatePSV % Direcional
(R$ '000)UnitsQuarter

Low-Income, 52.4%
Commercial, 4.8% Medium,
36.0%
Upper-Middle,
6.8%
6,757 6,991 581 229
575
4Q10 ACQUIRED LANDSON 9M11
REVIEW OFASSUMPTIONS
LAUNCHES IN9M11
9M1112
Land Bank
59.2% large scale projects (more than 1,000 units);
53.5% in the North and Midwest regions;
52.4% projects in the low-income segment;
45.6% are eligible for the MCMV program.
Geographic Distribution
(PSV % Direcional)
“MINHA CASA, MINHA VIDA”
49.9 thousand units are eligible for the
program, equal to 73.4% of total land bank
Segment Breakdown
(PSV)
ES1.5%
AM13.7%
MG37.6%
RO3.9%
SP6.5%
PA13.4%
DF22.5%
RJ0.9%
Land Bank Evolution 9M11
(PSV - R$ million)
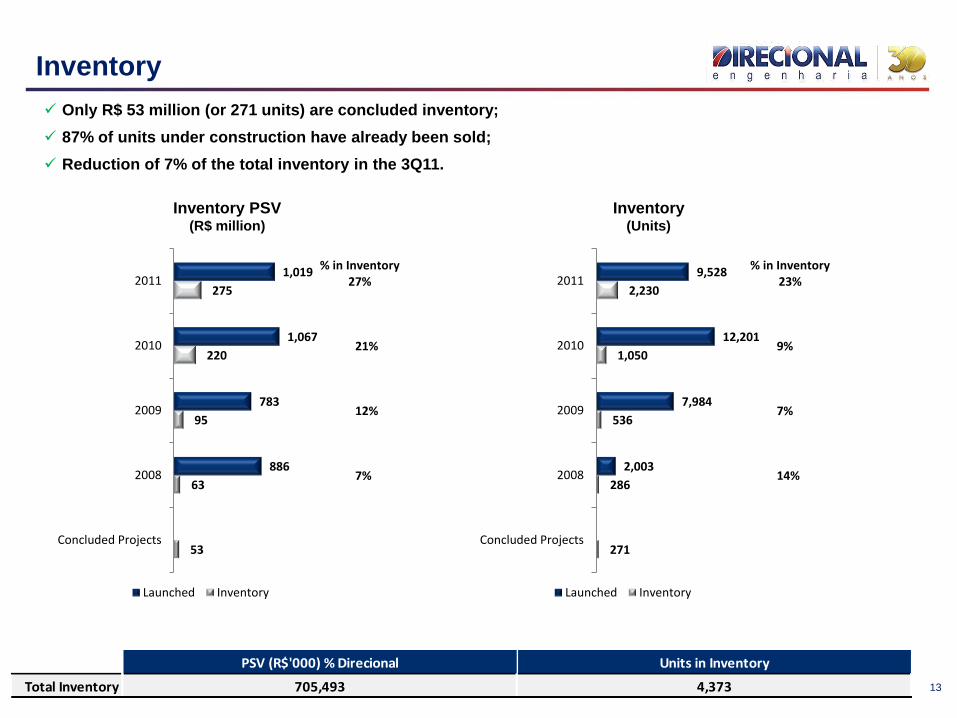
271
286
536
1,050
2,230
2,003
7,984
12,201
9,528
14%
7%
9%
% in Inventory23%
Concluded Projects
2008
2009
2010
2011
Launched Inventory
53
63
95
220
275
886
783
1,067
1,019
7%
12%
21%
% in Inventory27%
Concluded Projects
2008
2009
2010
2011
Launched Inventory
13
Inventory
Inventory(Units)
Inventory PSV(R$ million)
Only R$ 53 million (or 271 units) are concluded inventory;
87% of units under construction have already been sold;
Reduction of 7% of the total inventory in the 3Q11.
PSV (R$'000) % Direcional Units in Inventory
Total Inventory 705,493 4,373

14
Financial Highlights
Financial Performance
Liquidity Ratios
Deferred Results
DIRR3 Stock Analysis
Carlos Wollenweber Financial Highlights
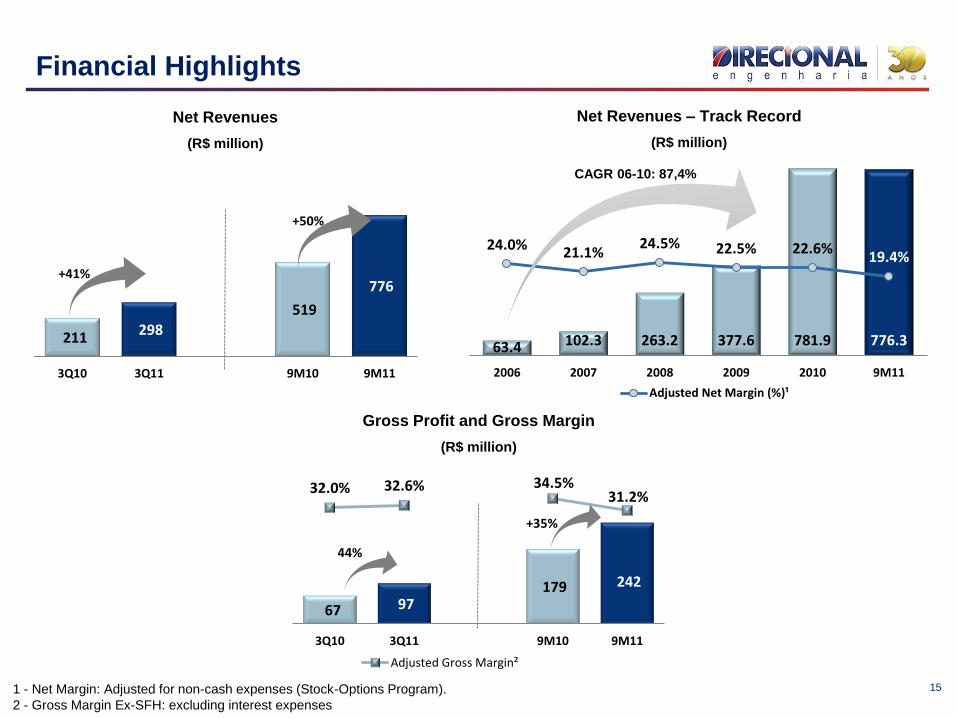
67 97 179 242
32.0% 32.6% 34.5%31.2%
3Q10 3Q11 9M10 9M11
Adjusted Gross Margin²
211 298
519
776
3Q10 3Q11 9M10 9M11
63.4 102.3 263.2 377.6 781.9 776.3
24.0% 21.1%24.5% 22.5% 22.6%
19.4%
2006 2007 2008 2009 2010 9M11
Adjusted Net Margin (%)¹
+41%
+50%
15
Financial Highlights
1 - Net Margin: Adjusted for non-cash expenses (Stock-Options Program).
2 - Gross Margin Ex-SFH: excluding interest expenses
Net Revenues
(R$ million)
CAGR 06-10: 87,4%
Net Revenues – Track Record
(R$ million)
44%
+35%
Gross Profit and Gross Margin
(R$ million)

47 59
126 151
22.4% 20.0%
24.2%
19.4%
3Q10 3Q11 9M10 9M11
Adjusted Net Margin (%)
33 72 69
187
15.2%23.7%
12.8%
23.5%
3Q10 3Q11 9M10 9M11
% Gross Revenue
16
Financial Highlights
Gross Revenues Breakdown 9M11
Adjusted Net Income and Net Margin¹
(R$ million)
Service Revenues
(R$ million)
+120%
+173%
1. Adjusted by non-cash expenses (Stock-Options Program).
+26%
+20%
Development, 76.5%
Management Fee, 0.7%
MCMV 1st Layer, 22.3%
Brokerage Fee, 0.4%

5 6 14 18
2.9%1.3% 1.8% 2.1%
3Q10 3Q11 9M10 9M11
% Sales
13 23
33
57
6.3% 7.8% 6.3% 7.3%
3Q10 3Q11 9M10 9M11
% Net Revenues
51 73
138 179
24.3% 24.6%
26.7%
23.1%
3Q10 3Q11 9M10 9M11
Adjusted EBITDA Margin (%)17
Financial Highlights
Adjusted EBITDA and EBITDA Margin¹
(R$ million)
Adjusted G&A¹
(R$ million)
Commercial Expenses
(R$ million)
+43%
+29%
1. Adjusted by non-cash expenses (Stock-Options Program).
+75%
+74%
+10%
+33%

18
Cash, Debt and Cash Burn
Cash Burn¹ (R$’000)
Loans and Financing
(ex- securitization)
1. Cash Burn: measured by the variation of Net Debt
* 1Q11: Adjusted by R$ 223.8 million of follow-on and R$ 40.3 million of dividends payment
* 3T11: Adjusted in the amount of R$ 15.6 million, from the Share Repurchase Plan
14,52225,312 22,468
32,65741,236
73,695
86,301
100,873
64,967
33,965
51,609
1Q09 2Q09 3Q09 4Q09 1Q10 2Q10 3Q10 4Q10 1Q11* 2Q11 3Q11*
Moving Average of Last 4 Quarters
3Q11 2Q11 3Q10 D % D %
(R$'000) (a) (b) (c) (a/b) (a/c)
Loans and Financing 437,708 408,630 245,724 7.1% 78.1%
SFH 372,640 341,303 184,243 9.2% 102.3%
Receivables Securitization 35,273 37,216 53,097 -5.2% -33.6%
FINAME and others 9,480 9,149 8,384 3.6% 13.1%
Working Capital 20,315 20,962 0 -3.1% n/a
Cash and Cash Equivalents 343,618 381,768 235,075 -10.0% 46.2%
Net debt 94,090 26,862 10,649
Net debt / Equity 7.9% 2.3% 1.4%
SFH, 92.6%
FINAME and others,
2.4%
Working Capital,
5.0%

19
Deferred Results
REF Recognition Schedule
16.9%
44.5%38.6%
2011 2012 after 2012
Deferred Results Consolidated (R$'000) 3Q11 2Q11 3Q10 D % D %
(a) (b) (c) (a/b) (a/c)
Deferred results Consolidated (1+2) 499,703 413,476 380,825 20.9% 31.2%
Deferred revenues 1,325,614 1,076,829 979,936 23.1% 35.3%
Deferred results - Margin 37.7% 38.4% 38.9% -0.7 p.p. -1.2 p.p.
Deferred results Development (1) 328,803 312,496 278,536 5.2% 18.0%
Deferred revenues 773,964 723,042 673,976 7.0% 14.8%
Deferred results - Margin 42.5% 43.2% 41.3% -0.7 p.p. 1.2 p.p.
Deferred results MCMV 1st Layer projects (2) 170,899 100,979 102,289 69.2% 67.1%
Deferred revenues 551,651 353,787 305,960 55.9% 80.3%
Deferred results - Margin 31.0% 28.5% 33.4% 2.4 p.p. -2.5 p.p.

1,151
1,651
1,345
500
Book Value 3Q11 REF Book Value + REF Market Cap20
Share Repurchase Plan
Market Cap = 82%BV + REF
Date: 11/09/2011
Term 60 days 180 days
Starting date 8/12/2011 10/24/2011
Expiring date 10/11/2011 4/20/2012
Status finished active
# of shares approved by the Board (a) 4,500,000 4,000,000
# of repurchased shares (b) 1,633,800 -
% (b/a) 36.3% 0.0%
Buy back Approved (c) 35,000,000.00 30,000,000.00
Total Expenses 15,618,904.00 0.00
% (d/c) 44.6% 0.0%
Average price 9.56 0.00
Share Repurchase Plan - Details Plan 1 Plan 2

0
20
40
60
80
100
120
140
160
-
1,000
2,000
3,000
4,000
5,000
6,000
7,000
8,000
9,000
10,000
19
-No
v-0
9
7-D
ec-0
9
22
-De
c-0
9
12
-Jan
-10
28
-Jan
-10
12
-Fe
b-1
0
3-M
ar-1
0
18
-Mar
-10
5-A
pr-
10
20
-Ap
r-1
0
6-M
ay-1
0
21
-May
-10
9-J
un
-10
25
-Ju
n-1
0
13
-Ju
l-1
0
30
-Ju
l-1
0
17
-Au
g-1
0
6-S
ep
-10
30
-Se
p-1
0
18
-Oct
-10
3-N
ov-
10
23
-No
v-1
0
8-D
ec-1
0
28
-De
c-1
0
13
-Jan
-11
31
-Jan
-11
15
-Fe
b-1
1
2-M
ar-1
1
21
-Mar
-11
5-A
pr-
11
20
-Ap
r-1
1
9-M
ay-1
1
24
-May
-11
8-J
un
-11
24
-Ju
n-1
1
11
-Ju
l-1
1
26
-Ju
l-1
1
10
-Au
g-1
1
25
-Au
g-1
1
12
-Se
p-1
1
27
-Se
p-1
1
13
-Oct
-11
28
-Oct
-11
Pre
ço d
a A
ção
Vo
lum
e (
R$
mil)
Volume (R$ '000)
0
20
40
60
80
100
120
140
160
-
1,000
2,000
3,000
4,000
5,000
6,000
7,000
8,000
9,000
10,000
18
-No
v-0
9
4-D
ec-0
9
21
-De
c-0
9
11
-Jan
-10
27
-Jan
-10
11
-Fe
b-1
0
2-M
ar-1
0
17
-Mar
-10
1-A
pr-
10
19
-Ap
r-1
0
5-M
ay-1
0
20
-May
-10
8-J
un
-10
24
-Ju
n-1
0
12
-Ju
l-1
0
29
-Ju
l-1
0
16
-Au
g-1
0
3-S
ep
-10
29
-Se
p-1
0
15
-Oct
-10
1-N
ov-
10
22
-No
v-1
0
7-D
ec-1
0
27
-De
c-1
0
12
-Jan
-11
28
-Jan
-11
14
-Fe
b-1
1
1-M
ar-1
1
18
-Mar
-11
4-A
pr-
11
19
-Ap
r-1
1
6-M
ay-1
1
23
-May
-11
7-J
un
-11
22
-Ju
n-1
1
8-J
ul-
11
25
-Ju
l-1
1
9-A
ug-
11
24
-Au
g-1
1
9-S
ep
-11
26
-Se
p-1
1
11
-Oct
-11
27
-Oct
-11
Sto
ck P
erf
orm
ace
Vo
lum
e (
R$
'00
0)
Average Volume (21 days) Ibovespa IMOB Direcional
21
Shares Performance Since IPO
Since IPO
DIRR3: -14.0%
IBOVESPA: -13.5%
IMOB: -11.5%
22
Disclosure
This presentation contains certain forward-looking statements concerning the business prospects,
projections of operating and financial results and growth potential of the Company, which are based on
management’s current expectations and estimates of the future performance of the Company. Although the
Company believes such forward-looking statements are based on reasonable assumptions, it can give no
assurance that its expectations will be achieved. Expectations and estimates that are based on the future
prospects of the Company are highly dependent upon market behavior, Brazil’s political and economic
situation, existing and future regulations of the industry and international markets and, therefore, are
subject to changes outside the Company’s and management’s control. The Company undertakes no
obligation to update any information contained herein or to revise any forward-looking statement as a result
of new information, future events or other information.

23
Contacts
Carlos WollenweberCFO | IR Officer
Jose Francisco DutraTreasurer | IR
Lucas BousasIR Analyst
Paulo SousaIR Analyst
www.direcional.com.br
+55 (31) 3214-6200
+55 (31) 3214-6450


