401(K) PARTICIPANT BEHAVIOR IN A VOLATILE ECONOMY
Barbara A. Butrica and Karen E. Smith
CRR WP 2012-24 Submitted: October 2012 Released: November 2012
Center for Retirement Research at Boston College Hovey House
140 Commonwealth Avenue Chestnut Hill, MA 02467
Tel: 617-552-1762 Fax: 617-552-0191 http://crr.bc.edu
Barbara A. Butrica and Karen E. Smith are senior research associates in the Income and Benefits Policy Center at the Urban Institute. The research reported herein was pursuant to a grant from the U.S. Social Security Administration (SSA), funded as part of the Retirement Research Consortium (RRC). The findings and conclusions expressed are solely those of the authors and do not represent the views of SSA, any agency of the federal government, the RRC, the Urban Institute, or Boston College. © 2012, Barbara A. Butrica and Karen E. Smith. All rights reserved. Short sections of text, not to exceed two paragraphs, may be quoted without explicit permission provided that full credit, including © notice, is given to the source.

About the Center for Retirement Research The Center for Retirement Research at Boston College, part of a consortium that includes parallel centers at the University of Michigan and the National Bureau of Economic Research, was established in 1998 through a grant from the Social Security Administration. The Center’s mission is to produce first-class research and forge a strong link between the academic community and decision-makers in the public and private sectors around an issue of critical importance to the nation’s future. To achieve this mission, the Center sponsors a wide variety of research projects, transmits new findings to a broad audience, trains new scholars, and broadens access to valuable data sources.
Center for Retirement Research at Boston College Hovey House
140 Commonwealth Avenue Chestnut Hill, MA 02467
phone: 617-552-1762 fax: 617-552-0191 e-mail: [email protected]
crr.bc.edu
Affiliated Institutions: The Brookings Institution
Massachusetts Institute of Technology Syracuse University
Urban Institute
Abstract
The booms and busts of the late 1990s and 2000s have taken 401(k) plan participants on a
rollercoaster ride. Using data from administrative tax records and household surveys, this paper
examines how participants responded to these periods of economic expansions and contractions
by documenting changes in 401(k) participation, contributions, and investment allocation from
1990 through 2010. Controlling for earnings, job changes, and other household factors, we show
that 401(k) participation and contributions decline during recessions. The Great Recession could
lower the 401(k) assets of the typical 30-year-old by as much as 9 percent at age 62.

1
Introduction
Over the past 25 years, employment-based pensions have been shifting from traditional
defined benefit (DB) plans in which employers bear most investment risks to defined
contribution (DC) plans that place the investment responsibility on workers. Consequently, the
number of households with retirement account assets has soared along with the number of
households owning stocks inside those accounts— increasing from 12 percent in 1989 to 31
percent in 2008 (Investment Company Institute [ICI] and the Securities Industry and Financial
Markets Association [SIFMA] 2008). About two-thirds of participants’ assets in 401(k) plans—
the most widely used type of employer-sponsored DC plan—were invested in equities in 2007
(ICI 2008).
As 401(k) plans were becoming increasingly popular, the economy experienced
significant booms and busts. Between March 1991 and March 2001, the economy prospered for
an unprecedented 10 years (NBER 2011). Then in 2000, the dot-com bubble burst and stock
prices fell by double digits for three straight years. This triggered a relatively short recession in
March 2001. The economy bounced back and expanded again for more than six years.
Retirement account balances (defined contribution plans and IRAs) peaked at $8.7 trillion in the
third quarter of 2007 before plummeting $2.7 trillion (31 percent) through the first quarter of
2009 as the stock market crashed (Butrica and Issa 2011). Although retirement account balances
have now recovered much of their value, they would have been significantly higher had the
market not crashed and instead continued on its pre-crash path. The 2008 stock market crash
coincided with the Great Recession, the longest of any recession since World War II (NBER
2011), with the highest unemployment rates in nearly three decades and record-long
unemployment spells.
While it’s clear that the economy has taken investors on a rollercoaster ride of ups and
downs during the past two decades, it is not clear how they have responded. Smith, Johnson, and
Muller (2004) suggest that many plan participants adjust their contributions in response to life
events, contrary to the popular perception that 401(k) contributions do not change much over
time. Although the authors did not consider the effects of economic expansions and
contractions, participants might increase their contributions and shift their investments into
equities when the economy is expanding and the stock market booming, and decrease their
contributions and shift away from equities when the economy is contracting and the market is

2
falling. The state of the economy is also likely to influence 401(k) participation. Unemployed
workers cannot participate, and financial pressures may lead some workers whose spouses lost
their jobs to reduce 401(k) contributions even if they remain employed themselves. Indeed,
Malmendier and Nagel (2007) find that individual experience with stock market returns and
inflation influence investment behaviors with cohorts that experienced high inflation less willing
to invest in long-term bonds and cohorts that experienced high stock market returns more willing
to invest in equities.
This paper uses data from the Survey of Income and Program Participation linked to
Social Security administrative data on earnings and contributions for 1990 through 2010. A
major advantage of these data is that they are not subject to the same measurement error as
workers’ self-reported information because they come from actual tax records (Dushi, Iams, and
Tamborini 2011). They also provide 21-year longitudinal measures of participation and
contributions independent of workers’ employers. We use these data to document changes in
DC plan participation, contributions, and investment allocation between the late 1990s and late
2000s and examine how they correspond to changes in the economy. Do 401(k) participants stop
contributing or reduce their contributions during economic downturns? Do participants react
similarly to all economic downturns or do certain downturns, because of their severity, induce
different or more dramatic behavioral responses? Do 401(k) participants respond more to busts
than booms? Are retirement account portfolios more heavily invested in stocks when the
economy is booming and less invested in stocks when the economy is failing? Although the
analysis will not directly measure the impact of booms and busts on retirement account assets,
the results will enable us to infer likely implications for account balances.
Background
Many Americans choose not to save for retirement and the reason may be related to the
changing pension landscape. The percentage of workers covered by a traditional defined benefit
pension plan that pays a lifetime annuity, often based on years of service and final salary, has
been steadily declining over the past 25 years. Between 1989 and 2012, the proportion of private
industry full-time workers participating in DB pension plans declined from 42 to 20 percent,
while the share participating in defined contribution plans—investment accounts established and
3
often subsidized by employers, but owned and controlled by employees—increased from 40 to
51 percent (Wiatrowski 2011; U.S. Bureau of Labor Statistics 2012).
Because DB pensions are tied to employers, workers do not have to think about
retirement savings. They are automatically enrolled, contributions are automatically deducted,
and benefits are automatically paid when workers retire. With DB pensions, employers bear the
responsibility for ensuring that employees receive pension benefits. In contrast, DC retirement
accounts are owned by employees. Workers have to actively decide to participate in the plan,
how much to contribute, which investments to put their money in, and whether to take benefits as
an annuity or lump sum payment at retirement. With DC retirement accounts, workers bear the
responsibility for their own financial security. This requires that individuals make informed and
forward-looking decisions at every step of the way. Moreover, in recent decades both the array
of financial instruments and their complexity have increased—obligating investors to evaluate
and understand many new and more sophisticated financial products. How well-equipped
individuals are at making their savings decisions determines, at least in part, the amount of
income in retirement they get to enjoy. But recent studies have revealed less than encouraging
information about retirees’ ability to adequately plan for retirement. While DC plans have the
potential to provide retirees with substantial retirement wealth, a typical household approaching
retirement had 401(k)/IRA balances of only $42,000 in 2010 (Munnell 2012).
Moreover, differences in pension wealth across gender and racial groups are substantial
(Butrica and Johnson 2010). While some of the differential is driven by factors beyond the
individual’s control, others such as participation, contribution level, and portfolio allocation are
usually the result of the individual’s decisions. If offered a plan, blacks and Hispanics are less
likely to participate as compared to whites, they also tend to contribute a lower share of their
earnings to the plan and are more likely to withdraw funds from their accounts or borrow from
them. In addition, some evidence suggests that blacks, Hispanics, and women are often
conservative investors and less willing to take on financial risk. However, it’s not clear whether
these conservative investment tendencies reflect innate preferences or merely blacks’ and
women’s relatively limited wealth holdings (Bajtelsmit and Bernasek 2001; Schubert et al.
1999). Blacks and women are also less likely than others to invest their 401(k) funds in equities,
which historically have had higher rates of return than other investment types (Ariel Investments
and Hewitt Associates 2009).
4
With all this in mind, it is not particularly surprising that participation rates among
private wage and salary workers in 2012 who were offered an employer retirement plan were 89
percent in DB pensions but only 70 percent in DC plans (U.S. Bureau of Labor Statistics 2012).
Even among full-time workers—whose participation rates are typically higher—participation
rates were 91 percent in DB pensions but only 74 percent in DC plans (U.S. Bureau of Labor
Statistics 2012). Do workers not participate because of inertia—which automatic enrollment can
fix? Or do they not participate because they are scared off by the financial decisions and
responsibilities that go hand-in-hand with DC plans?
If the policy goal is to help retirees be financially independent and minimize poverty at
older ages, it is important to understand how individuals think about retirement planning and
how they make their financial decision every step of the way. Are individuals well equipped to
make their own sound financial decisions in an environment where the responsibility of
retirement saving is increasingly shifting from employers to workers and financial products are
becoming ever more complex? Assuming they are, how are their decisions influenced by life-
course events or the economy?
A number of studies have examined the impact of stock market crashes and economic
downturns on older workers’ retirement decisions (Coile and Levine 2011; Coile and Levine
2006; Goda, Shoven, and Slavov 2010). Other studies have analyzed the impact of stock market
and labor market conditions on retirement income and assets (Brady 2009; Burtless 2009; Coile
and Levine 2010; Engen, Gale, and Uccello 2004; Gustman, Steinmeier, and Tabatabai 2009).
Butrica, Smith, and Toder (2010) considered the impact of the 2008 stock market crash and
alternative recovery scenarios on future retirement savings. The authors assumed that 401(k)
participants would continue making the same total contributions to retirement accounts and
would rebalance their portfolios to maintain the target allocation for their age. Their
assumptions about how participants would behave in response to a stock market crash were
necessary to isolate the effects of the stock market crash itself on retirement savings.
The current paper recognizes that retirement account assets depend not only on market
performance, but also on individuals’ behavior—whether individuals contribute, how much they
contribute, and how they allocate their investment portfolio. It builds upon prior research by
Smith, Johnson, and Muller (2004), which found that key lifecourse events, such as the birth of a
child and the purchase of a home, influence contributions in defined contribution plans. It also
5
builds upon research by Muller and Turner (2011), which used survey data and found that 401(k)
participation is influenced by the performance of the stock market. Utkus and Young (2009),
using Vanguard DC plan data, found that 16 percent of plan participants changed their asset
allocation during 2008 (only slightly higher than the trading rates in the prior two years), but 4
percent of assets were shifted from equities to fixed income investments (the largest net shift in
over 10 years).
However, the recent rise in automatic enrollment and diversified investment options
including target date funds may dampen expected changes in worker contribution behavior
surrounding the recessions and market fluctuations (BLS 2011b). Among workers participating
in their employer’s DC plans, the share with plans that included automatic enrollment increased
from 5 percent in 2003 to 21 percent in 2010 (Costo 2006; Bureau of Labor Statistics 2011c).
Many of these workers will be assigned a default contribution rate and default investment fund
because they did not make their own elections. Given these trends, it is not surprising that a
2012 Morningstar industry survey found a fivefold increase in target date fund assets in the last
six years, increasing from $71 billion in 2005 to $378 billion in 2011 (Charlson and Lutton
2012).
This analysis extends previous studies by using more recent data and focusing on the
extent to which workers adjust their participation, contributions, and asset portfolios during
economic booms and busts.
Methodology
We examine contributions to employer–sponsored retirement plans over time and how
they interact with key lifecourse events for a large sample of workers. The data come from the
1996, 2001, 2004, and 2008 panels of the Survey of Income and Program Participation (SIPP)
pooled together and linked to administrative data from the Social Security Administration’s
(SSA) Detailed Earnings Record (DER) and Summary Earnings Record (SER).
The SIPP provides basic demographic data, including age, race, gender, marital status,
and education, as well as information about employment status, income, and earnings. Special
topical modules provide additional information on marital histories, fertility histories,
employment histories, disability, asset holdings, and employer–sponsored pension participation.
In particular, the survey asked respondents with work limitations about when their health
problems started, and asked homeowners about when they purchased their homes. Thus, the data
6
allow us to identify the timing of key lifecourse events, including marriages, divorces,
widowhood, the birth of a child, the onset of health problems that limit the ability to work, and
the purchase of a home. Because the survey interviewed all adult members of the household, it
also provides information about key transitions in the spouse’s life.
The DER contains information collected from the Internal Revenue Service’s Form W–2,
which employers must file to report salaries and benefits they pay to their employees, as well as
self-employment income from Schedule SE (Olsen and Hudson 2009). The DER provides
annual information on total earnings, earnings covered by Social Security and Medicare, taxable
earnings from 1978 to 2010, and worker contributions to employer–sponsored retirement
accounts from 1990 to 2010.1 The DER file also includes employer identification codes that
enable users to calculate job tenure and identify respondents who change jobs over time.
The SIPP topical modules provide contemporaneous information, as well as retrospective
data for marriage histories, fertility histories, and disability histories. The DER match provides
both retrospective and prospective earnings and DC contributions relative to the SIPP interview
period. Our analyses use two samples: one that includes both retrospective and prospective DER
earnings and contributions, and one that includes only retrospective DER data. The former
sample allows us to examine DC participation and contribution patterns over the 21-year period
from 1990 to 2010 and relate them to non-changing demographic characteristics observed on the
SIPP (for example, sex, birth year, race, and educational attainment). The latter sample allows
us to examine DC participation and contribution patterns from 1990 to the SIPP interview year
and relate them to characteristics known from the SIPP retrospective data (for example, marital
status, number of dependents, disability and health status, homeownership, and pension
characteristics).
We restrict the sample to wage and salary workers ages 20 to 69 who report positive
earnings in the given year.2 We exclude workers younger than 20 because many employers do
1Administrative match rates vary by SIPP panel. The match rate was 79 percent for the 1996 SIPP, 47 percent for the 2001 SIPP, 73 percent for the 2004 SIPP, and 80 percent for the 2008 SIPP. Czajka, Mabli, and Cody (2008) examined attrition and match bias in the SIPP data. They found that the nonmatched cases in the 2001 panel appeared fairly similar to matched cases on a number of important dimensions, and that nonmatch bias did not appear to differ greatly from that present for the 1996 SIPP. 2The DER provides annual wage reports for all employers in each calendar year. For workers with multiple employers, we do not know if the jobs were held sequentially or concurrently. We pool earnings from all jobs in each calendar year.

7
not allow them to participate in retirement plans, and we exclude workers older than 69 because
people must begin withdrawing funds from defined contribution plans at age 70 ½. Our sample
includes 902,344 person-year observations between 1990 and 2010 for over 168,000 individuals.
We express all dollar amounts in constant 2011 dollars (indexed to changes in the Consumer
Price Index).
We define wage and salary workers as individuals with positive earnings from any job in
a calendar year and with at least half of their total annual earnings from wage and salary
employment.3 Workers are offered DC plans if: 1) they report on the SIPP pension topical
module that their employer offered a DC plan and that they were eligible to participate in the
plan; or 2) they made a DC contribution in any year while on the pension job up to and including
the SIPP pension topical module year.4 Workers participate in DC plans if they make a
contribution to any DC plan, excluding employer-only contributions, personal IRA contributions,
or self-employed Keogh contributions. We sum all worker contributions (as reported in Box 12
of workers’ W-2 forms) from all jobs in a calendar year to create our measure of total annual
contributions, and we divide this amount by total annual earnings to create our measure of
contribution rates.5
We begin our analyses by showing how DC offer rates have changed over time. We then
show participation rates, contribution levels, and contribution rates by year, age, and earnings
level. We then estimate logit models of the participation decision and linear regression models
of the level of contributions for workers contributing to their retirement plans. Predictors in the
models include age and its square (to capture nonlinear effects of age), age splines with kinks at
age 30, 40, 50, and 60, marital status, log of own earnings, number of work years since age 20,
unemployment (measured as a full calendar year with no earnings), the number of children under
age 18, the presence of a work limitation, the presence of a working spouse, and indicators
3 The DER separately reports self-employment and wage and salary earnings. 4 For 1996 SIPP respondents, we look at DC contributions for all years on the pension job (identified by the employer identification number) from 1990 to 1998 (the year of the pension topical module). For 2001 SIPP respondents, we look at DC contributions on the pension job through 2003. For 2004 SIPP respondents, we look at DC contributions on the pension job through 2006. For 2008 SIPP respondents, we look at DC contributions on the pension job through 2009. 5Total earnings are the sum of wage and salary earnings, including the deferred earnings, and self-employment earnings.

8
(during the current year) of the onset of work limitations, the purchase of a home, the birth of a
child, the death of a spouse, the dissolution of a marriage through divorce, and a job change.6
We also examine retirement asset allocation using self-reported data from the SIPP
pension and asset topical modules and measure how asset allocation has changed over time.
We
also experiment with lagging these indicators, to explore whether the impact on retirement
contributions persists a few years after the event. We also include SIPP panel dummies and year
dummies to capture changes in 401(k) behavior over time. We are particularly interested in the
sign and magnitude of the year dummies and their relationship to macro-economic conditions
including the unemployment rate and gross domestic product (GDP).
7
For workers contributing to their DC pensions, the SIPP asks if workers invest assets in
company stocks, stock funds, corporate bonds or bond funds, long term interest bearing
securities, diversified stock and bond funds, government securities, money market funds, or other
investments. The 2008 SIPP panel added “evenly split between types” to their list of DC
investment types. These workers are then asked “of the types of investments just mentioned,
which type is where the largest share of current contributions are being invested?” While we
know the majority investment type, we do not know the specific share of each investment type.
This data is limited to the SIPP interview years. The pension module collects information about
the flows into retirement accounts among workers contributing to DC pensions. The asset
module collects information about the stock of retirement account assets among individuals with
retirement accounts. Unfortunately, neither the pension nor the asset topical module provides
information on the share of investments by investment type. Instead, they provide only
indicators of the type of investments owned. We exploit these indicators to examine people’s
willingness to invest in equities and whether this has changed over time given the dual 2001 and
2008 stock market crashes.
6 A job change is a worker working for an employer in year t who was not working for that employer in year t-1 identified by the employer identification numbers on the DER. Number of work years includes all years with positive earnings from the DER or SER starting at age 20. The SER includes annual Social Security covered earnings from 1951 to 2010. 7 The 1996 SIPP panel asks the pension module in wave 7 (1998) and wealth module in waves 3, 6, 9, and 12. The 2001 SIPP panel asks the pension module in wave 7 (2003) and wealth modules in wave 3, 6, and 9. The 2004 SIPP panel asks the pension module in wave 7 (2006) and the wealth modules in waves 3, and 6. The 2008 SIPP panel asks the pension module in wave 3 (2009) and the wealth modules in waves 4 and 7. We examine the wealth module asked nearest to the pension module (waves 6 and 7 for the 1996, 2001, and 2004 panels and waves 3 and 4 for the 2008 panel).
9
For individuals reporting retirement account assets in IRA, Keoghs, and DC plans
(401(k), 403(b), or thrift plans), the SIPP asks how these accounts are allocated. Respondents
can choose certificate of deposit or other saving certificates, money market funds, U.S.
government securities, municipal or corporate bonds, stock or mutual fund shares, or other
assets. The SIPP collects up to four investment types for IRA, Keogh, and DC balances (12
possible reports). While we can measure the share of account holders with retirement account
balances invested in different types of investments, we do not know the amount invested in each
type. Unlike the pension topical module that asks about the majority investment type, this is not
asked about account balances. This limited information, however, does allow us to measure
workers willingness to invest in stocks and other asset types and how this has changed over time.
Results
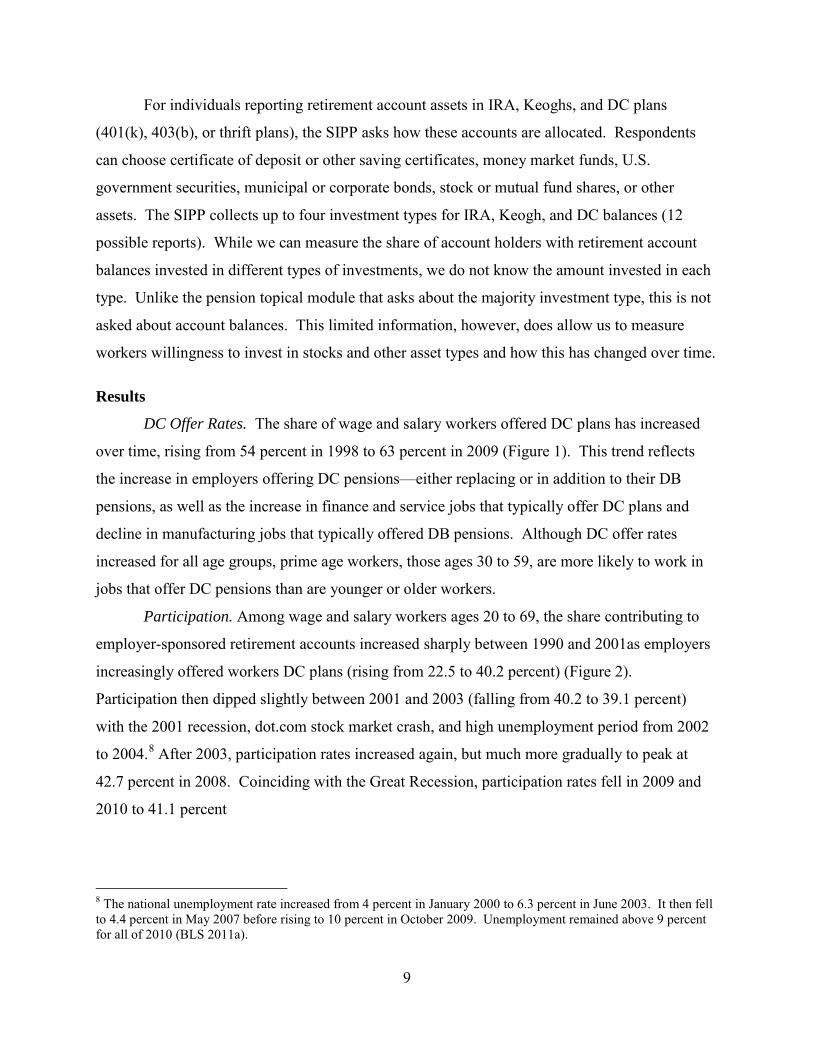
DC Offer Rates. The share of wage and salary workers offered DC plans has increased
over time, rising from 54 percent in 1998 to 63 percent in 2009 (Figure 1). This trend reflects
the increase in employers offering DC pensions—either replacing or in addition to their DB
pensions, as well as the increase in finance and service jobs that typically offer DC plans and
decline in manufacturing jobs that typically offered DB pensions. Although DC offer rates
increased for all age groups, prime age workers, those ages 30 to 59, are more likely to work in
jobs that offer DC pensions than are younger or older workers.
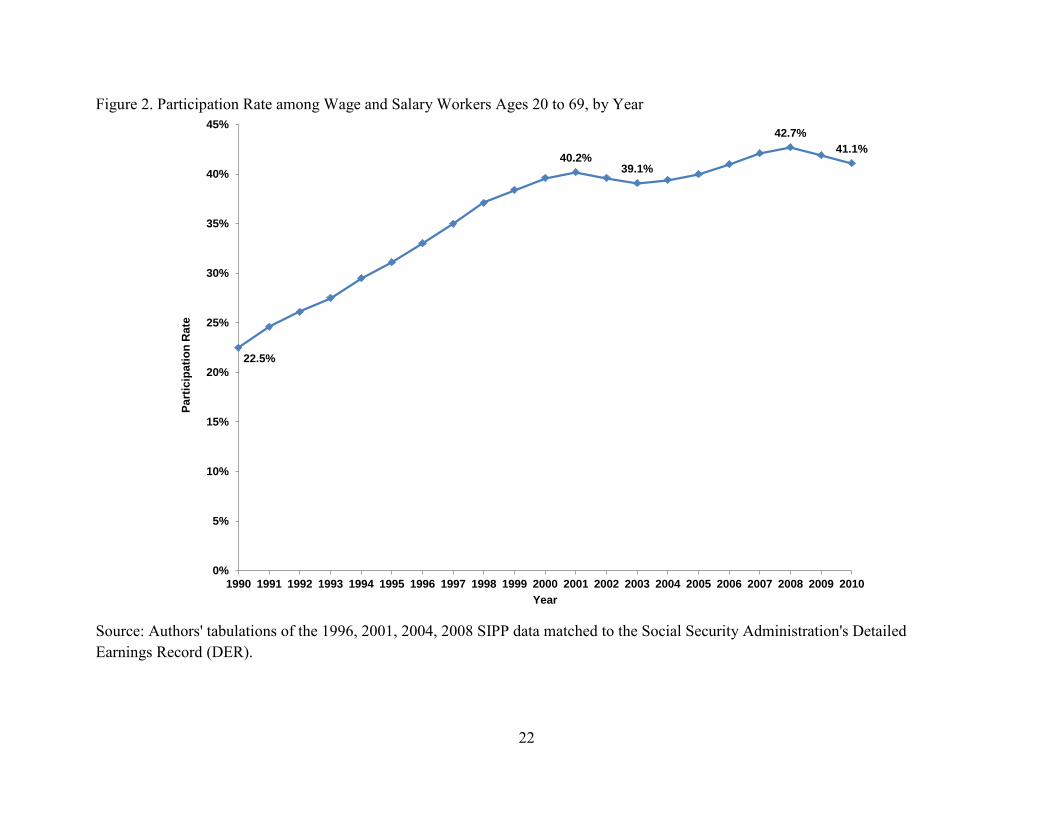
Participation. Among wage and salary workers ages 20 to 69, the share contributing to
employer-sponsored retirement accounts increased sharply between 1990 and 2001as employers
increasingly offered workers DC plans (rising from 22.5 to 40.2 percent) (Figure 2).
Participation then dipped slightly between 2001 and 2003 (falling from 40.2 to 39.1 percent)
with the 2001 recession, dot.com stock market crash, and high unemployment period from 2002
to 2004.8 After 2003, participation rates increased again, but much more gradually to peak at
42.7 percent in 2008. Coinciding with the Great Recession, participation rates fell in 2009 and
2010 to 41.1 percent
8 The national unemployment rate increased from 4 percent in January 2000 to 6.3 percent in June 2003. It then fell to 4.4 percent in May 2007 before rising to 10 percent in October 2009. Unemployment remained above 9 percent for all of 2010 (BLS 2011a).

10
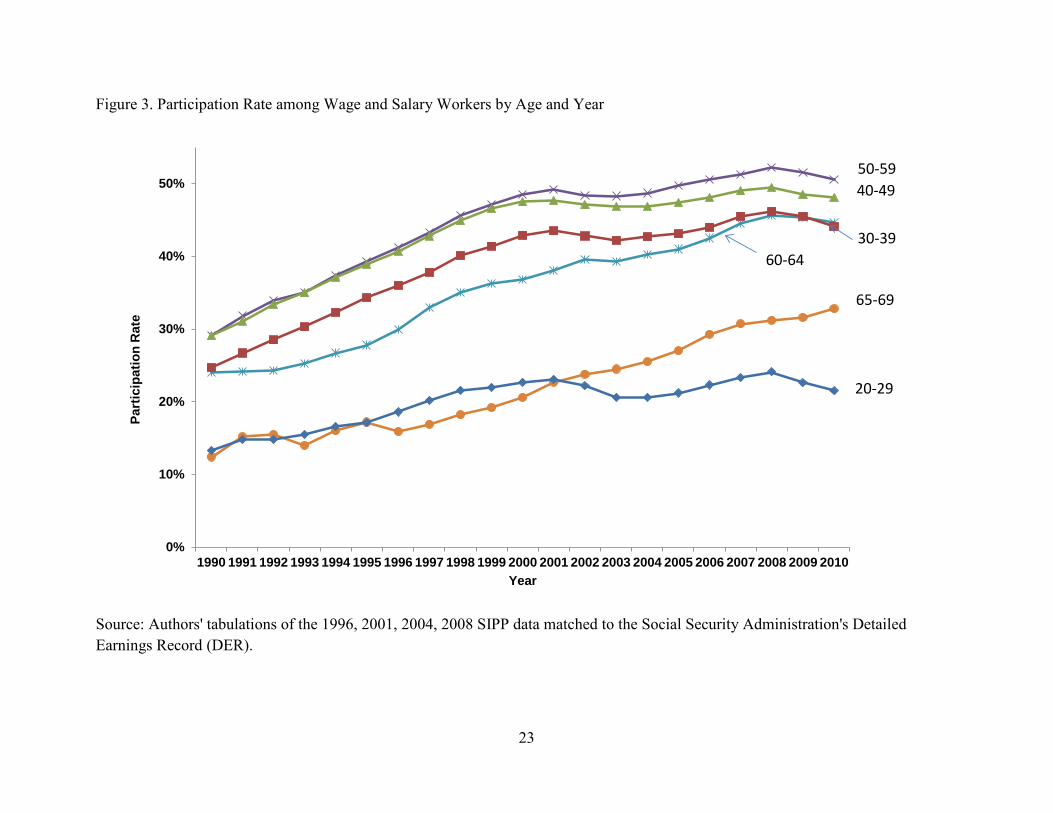
As DC plans became more common, participation rates at all ages increased between
1990 and 2001 (Figure 3). Since 2001, participation rates leveled off for workers under age 50
but continued to rise for workers over age 50. Note, however, that participation rates have
distinct recession dips between 2001 and 2003 and between 2008 and 2010. The recession dips
are bigger for younger workers than for older workers, but participation rates declined for all
workers under age 60 during both recessions. Although participation rates for each cohort are
higher at every age than for the preceding cohort at the same age; participation rates at ages 40 to
49 appear to have plateaued for cohorts born after 1946 (Figure 4). Furthermore, participation
rates are lower for workers after age 59. Because these workers had DC offers and participated
at younger ages, their lower participation at older ages is not solely due to lack of offers.
Much of the observed changes in historic DC participation rates reflect changes in
employer offer rates. Only workers offered a DC plan can participate and offer rates have
increased over time as employers increasingly offer these types of plans. Unfortunately, we do
not know historic offer rates from the administrative data. The SIPP pension topical module asks
workers if their employer offers a DC-type pension plan, but this is only known at the SIPP
interview. About 40 percent of wage and salary workers in 2006 did not participate in a DC plan
because their employer did not offer a plan (Figure 5). Around a third of workers ages 30 to 59
did not participate because their employer did not offer a plan in 2006, compared with 61 percent
of workers ages 20 to 29 and 50 percent of workers ages 65 to 69.
Participation rates among workers offered a DC plan are higher than participation rates
among all workers. About 69 percent of workers offered a DC plan in 2006 made contributions
to their plan (Figure 6). Participation rates rise among those offered a plan with age until age 59
and decline at older ages. Younger and older workers are both less likely to be offered a DC
plan and less likely to participate when they are offered a plan compared with workers in their
50s.
Conditional on having a DC plan offer, we still see a significant drop in DC participation
between 2006 (based on the 2004 SIPP panel) and 2009 (based on the 2008 SIPP panel) in
response to the Great Recession. Among all workers offered a DC plan, participation fell from
69.1 percent in 2006 to 66.3 percent in 2009. While participation rates are highest among 40-49
year-olds and 50-59 year-olds, these groups also experienced the largest drops in participation
between 2006 and 2009.
11
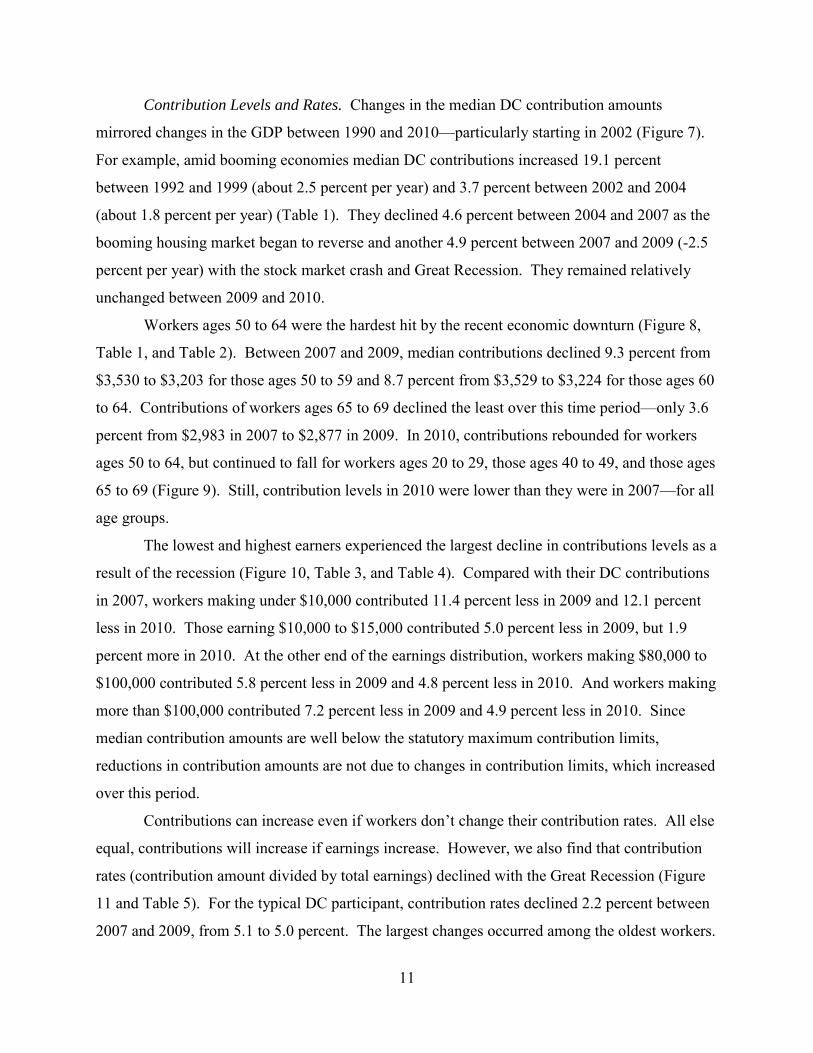
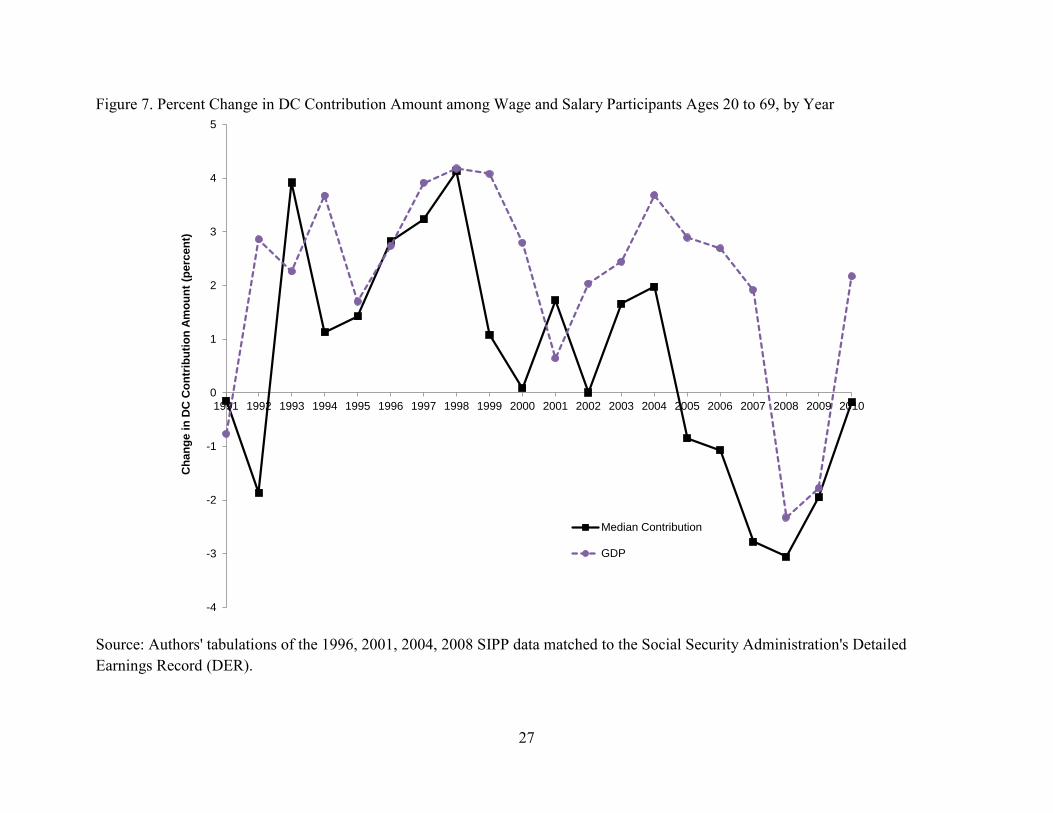
Contribution Levels and Rates. Changes in the median DC contribution amounts
mirrored changes in the GDP between 1990 and 2010—particularly starting in 2002 (Figure 7).
For example, amid booming economies median DC contributions increased 19.1 percent
between 1992 and 1999 (about 2.5 percent per year) and 3.7 percent between 2002 and 2004
(about 1.8 percent per year) (Table 1). They declined 4.6 percent between 2004 and 2007 as the
booming housing market began to reverse and another 4.9 percent between 2007 and 2009 (-2.5
percent per year) with the stock market crash and Great Recession. They remained relatively
unchanged between 2009 and 2010.
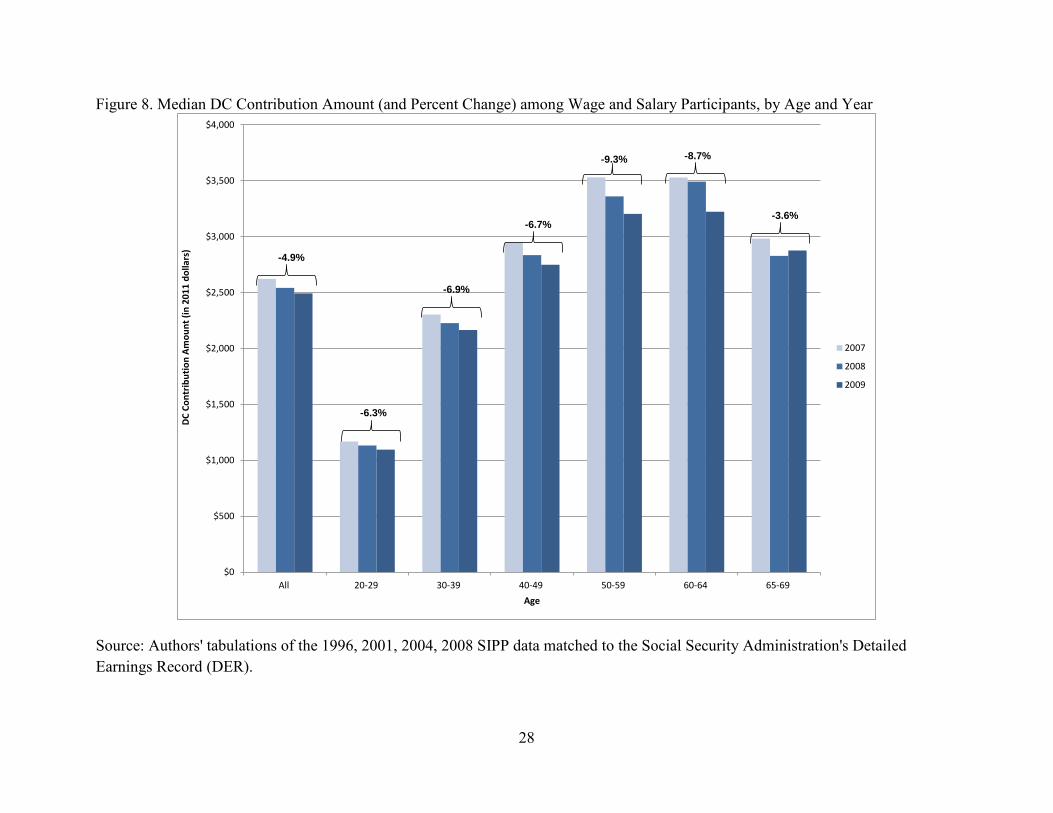
Workers ages 50 to 64 were the hardest hit by the recent economic downturn (Figure 8,
Table 1, and Table 2). Between 2007 and 2009, median contributions declined 9.3 percent from
$3,530 to $3,203 for those ages 50 to 59 and 8.7 percent from $3,529 to $3,224 for those ages 60
to 64. Contributions of workers ages 65 to 69 declined the least over this time period—only 3.6
percent from $2,983 in 2007 to $2,877 in 2009. In 2010, contributions rebounded for workers
ages 50 to 64, but continued to fall for workers ages 20 to 29, those ages 40 to 49, and those ages
65 to 69 (Figure 9). Still, contribution levels in 2010 were lower than they were in 2007—for all
age groups.
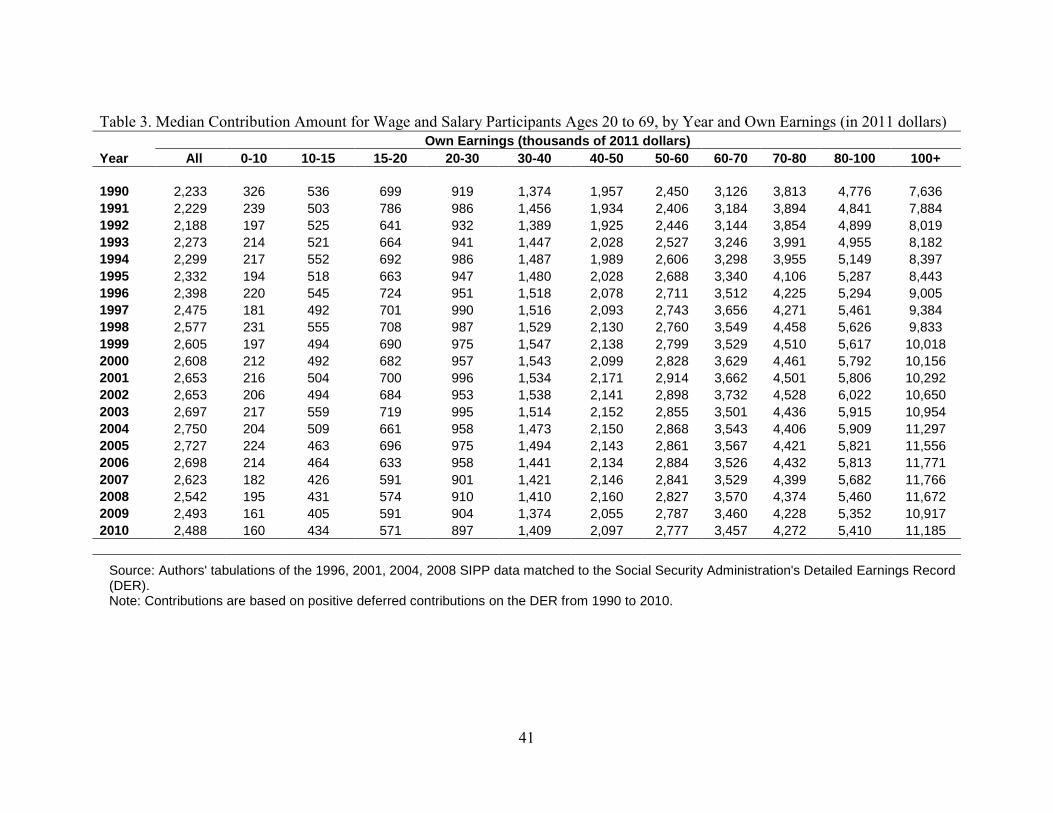
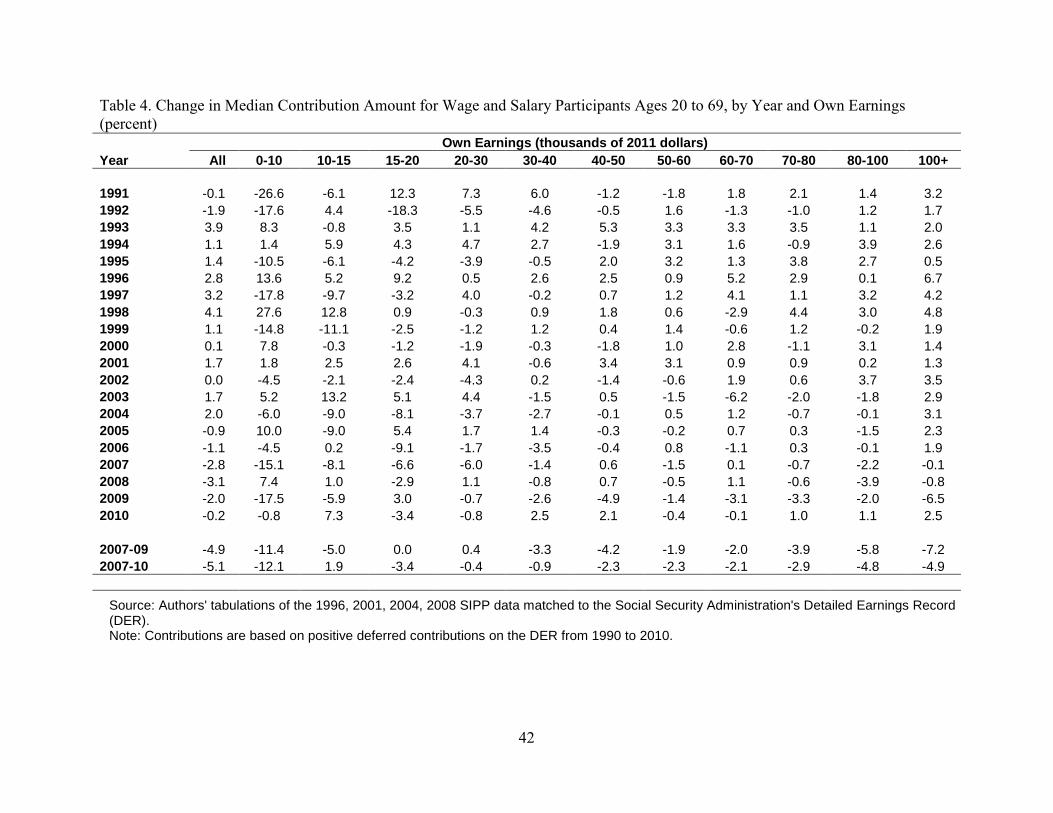
The lowest and highest earners experienced the largest decline in contributions levels as a
result of the recession (Figure 10, Table 3, and Table 4). Compared with their DC contributions
in 2007, workers making under $10,000 contributed 11.4 percent less in 2009 and 12.1 percent
less in 2010. Those earning $10,000 to $15,000 contributed 5.0 percent less in 2009, but 1.9
percent more in 2010. At the other end of the earnings distribution, workers making $80,000 to
$100,000 contributed 5.8 percent less in 2009 and 4.8 percent less in 2010. And workers making
more than $100,000 contributed 7.2 percent less in 2009 and 4.9 percent less in 2010. Since
median contribution amounts are well below the statutory maximum contribution limits,
reductions in contribution amounts are not due to changes in contribution limits, which increased
over this period.
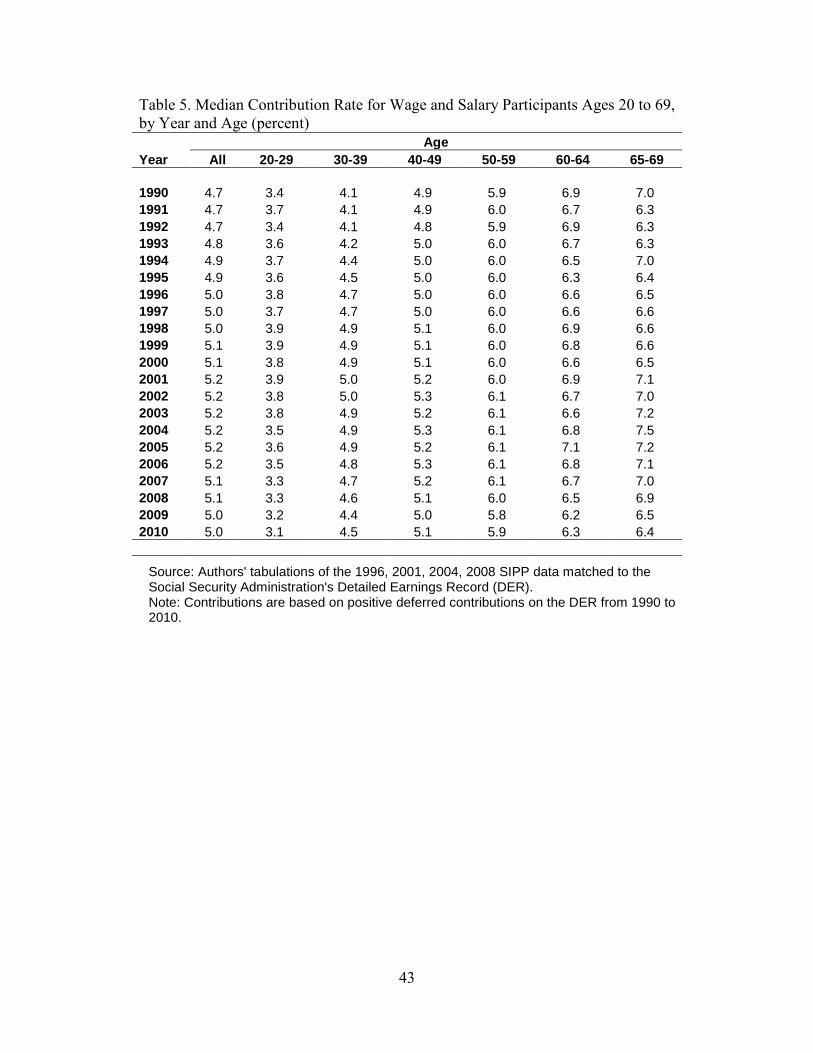
Contributions can increase even if workers don’t change their contribution rates. All else
equal, contributions will increase if earnings increase. However, we also find that contribution
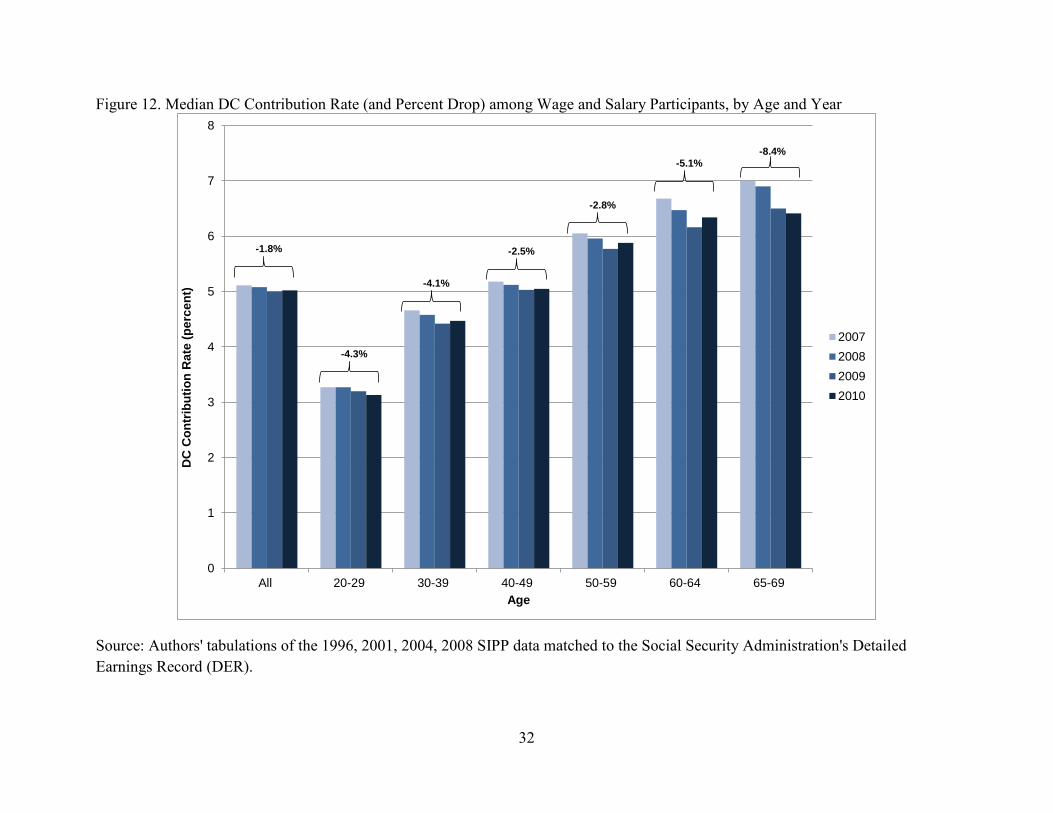
rates (contribution amount divided by total earnings) declined with the Great Recession (Figure
11 and Table 5). For the typical DC participant, contribution rates declined 2.2 percent between
2007 and 2009, from 5.1 to 5.0 percent. The largest changes occurred among the oldest workers.
12
Between 2007 and 2009, median contribution rates declined 7.8 percent for workers ages 60 to
64 and 7.1 percent for those ages 65 to 69. In contrast, they declined only 2.1 percent for
workers ages 20 to 29. Contribution rates declined further in 2010 for workers ages 20 to 29 and
those ages 65 to 69 (Figure 12). By 2010, their median contribution rates were 4.3 and 8.4
percent lower, respectively, than in 2007. In contrast, contribution rates increased slightly for
workers ages 50 to 59 and those ages 60 to 64. Still, their median contribution rates in 2010
were 2.8 and 5.1 percent lower, respectively, than in 2007.
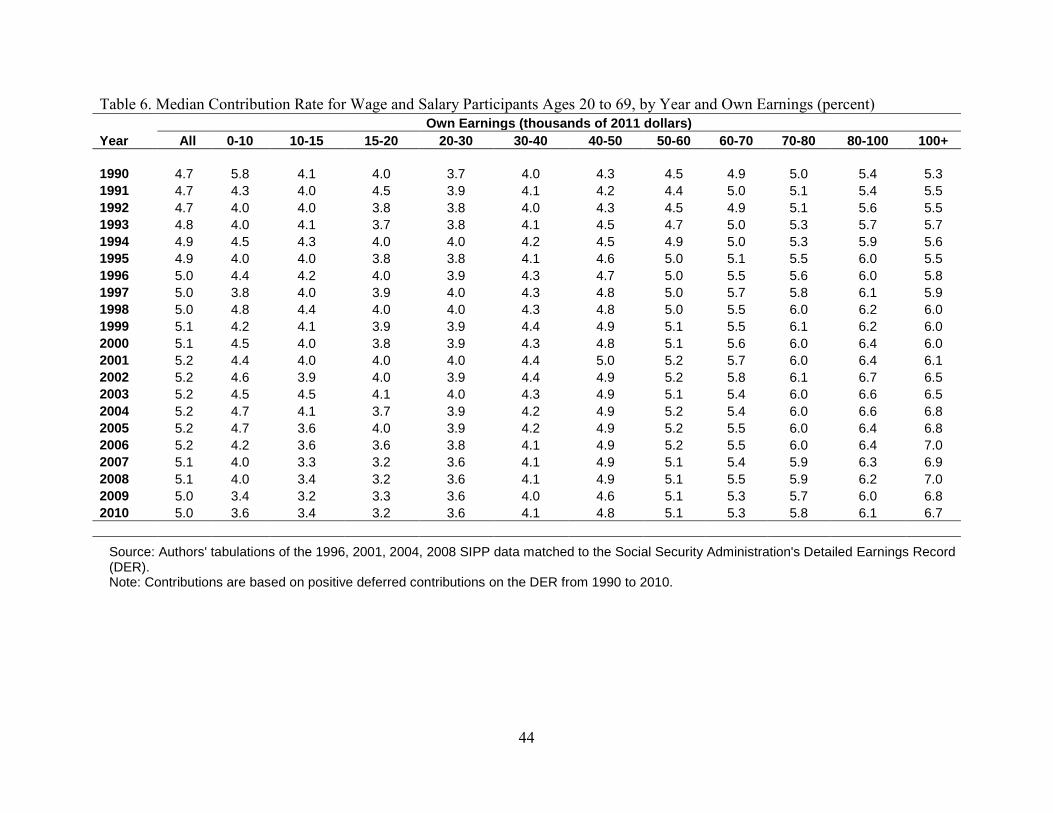
Among participants, median contribution rates for the lowest earners declined 15.8
percent between 2007 and 2009 from 4.0 to 3.4 percent (Figure 13 and Table 6). They declined
6.9 percent for workers earning $40,000 to $50,000 from 4.9 to 4.6 percent. Median contribution
rates also declined 3.7 percent from 6.3 to 6.0 percent for workers making $80,000 to $100,000.
Multivariate Analysis of Participation. Table 7 reports logistic regression coefficients of
DC participation among workers from 1991 to 2010. Models 1 and 2 vary only in the age
specification: model 1 includes age and age squared and model 2 includes age spines. Both
models show that workers’ probability of participating increased with earnings, more work years,
and age (but at a decreasing rate). Workers who changed jobs or returned to work after a spell of
unemployment were less likely to participate in a DC plan surrounding their job change. This
may reflect waiting periods for new workers or failure to initially enroll in offered plans with
new employers. Our key variables of interest here are the year dummies. The probability that a
worker contributed to a DC plan increased every year between 1991 and 2001, but then declined
between 2001 and 2003 as the recession progressed and unemployment rates increased.
Participation probabilities increased again between 2004 and 2008 and then declined after 2008
as the recession progressed and unemployment rates increased. The impact of the 2001 and 2008
recessions on participation probabilities continued past the official end of both recessions.
We see similar declines in DC participation associated with the 2001 and 2008 recessions
using the retrospective sample that is limited to wage and salary workers offered a DC plan
(Table 8). We expand the set of explanatory variables to include characteristics known from the
SIPP retrospective data including spouses’ earnings and DC contributions, health, and pension
characteristics. We also limit the sample to include only years the worker was with the employer
that offered the DC plan in the SIPP pension topical module. The models in Table 8 control for
many of the same variables as in Smith, Johnson, and Muller (2004), but also include year

13
dummies.9 Models 1 and 2 vary only in the age specification: model 1 includes age and age
squared and model 2 includes age splines. Again, we see a decline in participation following the
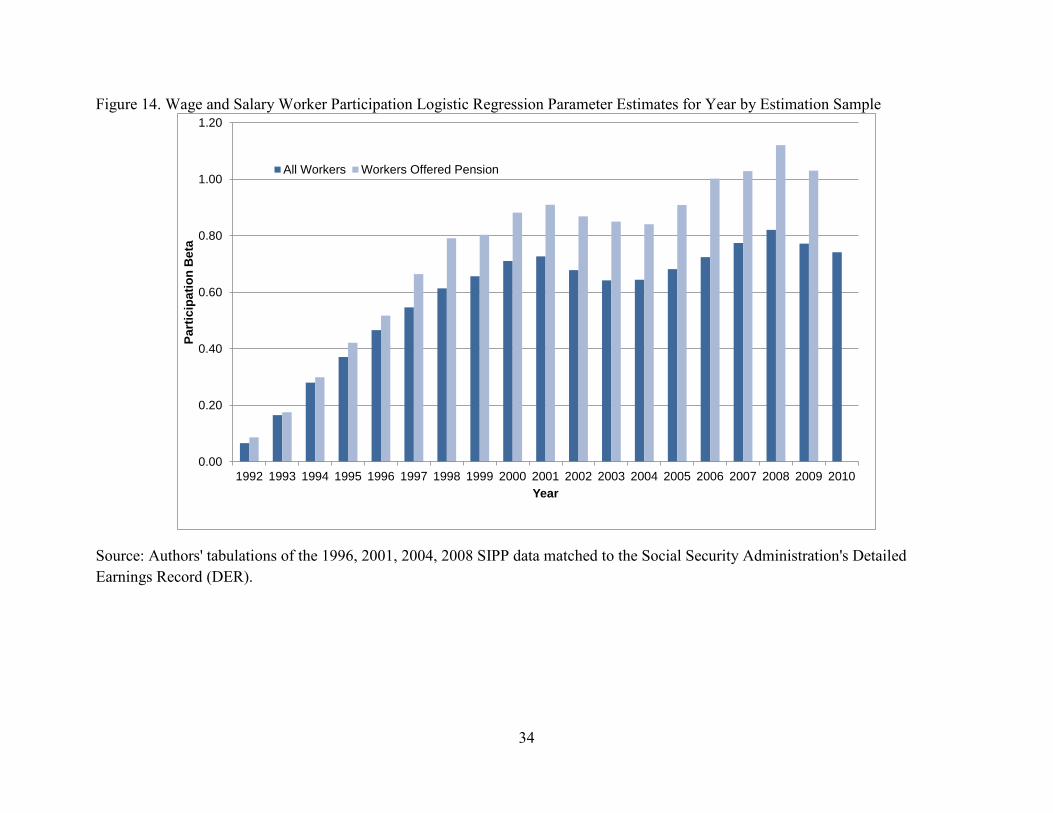
2001 and 2008 recessions. Figure 14 graphically compares the unadjusted logistic parameter
estimates for the year dummies using both the sample of all workers and the sample of workers
offered a plan (omitted year is 1991). The coefficients in the model of all workers represent a
1.9 percentage point reduction between 2001 and 2003 and a 1.7 percentage point reduction
between 2008 and 2010 due to the recessions.10
Multivariate Analysis of Contribution Amount. Table 9 reports the results from our OLS
regression of 401(k) retirement contributions for participating workers. Holding other factors
constant, contributions increased from 1995 through 1998, declined until 2000, and then
increased until 2006 where they leveled off until 2007. After 2007, contributions
declined until 2009 and leveled off until 2010. Models 1 and 2 are identical except for
the age specification, and both models find nearly identical contribution patterns by year.
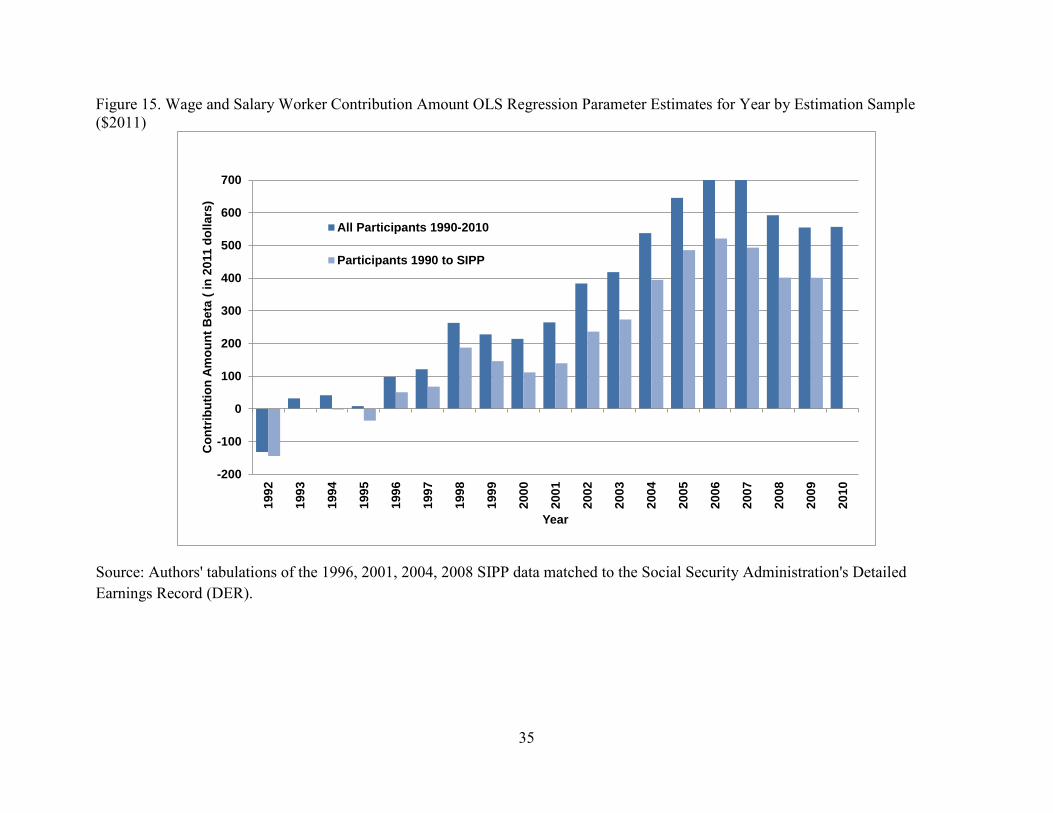
Table 10 reports the results from a similar regression based on the retrospective sample
(1990 to SIPP interview period only). This sample allows us to add additional explanatory
variables available from the SIPP data but not known after the SIPP panel. This model controls
for many of the same variables as in Smith, Johnson, and Muller (2004) and also includes year
dummies. Despite these differences, many of the relationships shown in this table are similar to
those in the original study. Although the coefficients on the year dummies are lower in this
model than in the model reported in Table 9, the pattern of contributions over time is identical
(shown graphically in Figure 15).
Unfortunately, our data do not include information about automatic enrollment. They
also do not include information about changes in employer contributions in years other than the
SIPP pension topical module year. Participation and contribution behaviors are likely affected
by these and other factors we cannot control for. Despite these limitations, our results strongly
suggest that economic forces, beyond just their effects on earnings and employment, influence
workers’ retirement saving behavior.
9 Because the models include lagged terms, we exclude 1990 from the sample and omit 1991 from the models. 10 For workers offered a DC plan, the recessions lowered their probability of participating1.2 percentage points between 2001 and 2003 and 1.7 percentage points between 2008 and 2009.

14
Workers, concerned about a future job loss, may stop contributing to their DC plan to not
tie up saving in DC accounts that face tax penalties for withdrawals before age 59 ½. To test
this hypothesis, we included forward-looking unemployment dummies in the participation and
contribution functions for those under age 59 who face penalties and those over age 59 who do
not face penalties. Results (not shown) find no significant effect of future unemployment on
younger worker’s participation, but a positive and significant effect for older workers where
unemployment (no earnings in the next calendar year) include both retirement and full-year
unemployment. Future unemployment increased contributions modestly for both younger and
older participants. In all cases, including forward-looking indicators did not change our
measured recession effects, nor did adding controls for whether the DC plan was a 401(k),
403(b), or other type DC plan.11
Investments
This section first examines how wage and salary workers allocate their DC
contributions—that is the flows into retirement accounts. It then examines how individuals with
retirement accounts have invested those assets—that is the stock of assets. This analysis is based
on self-reported SIPP data and is limited to the pension and asset topical module years.
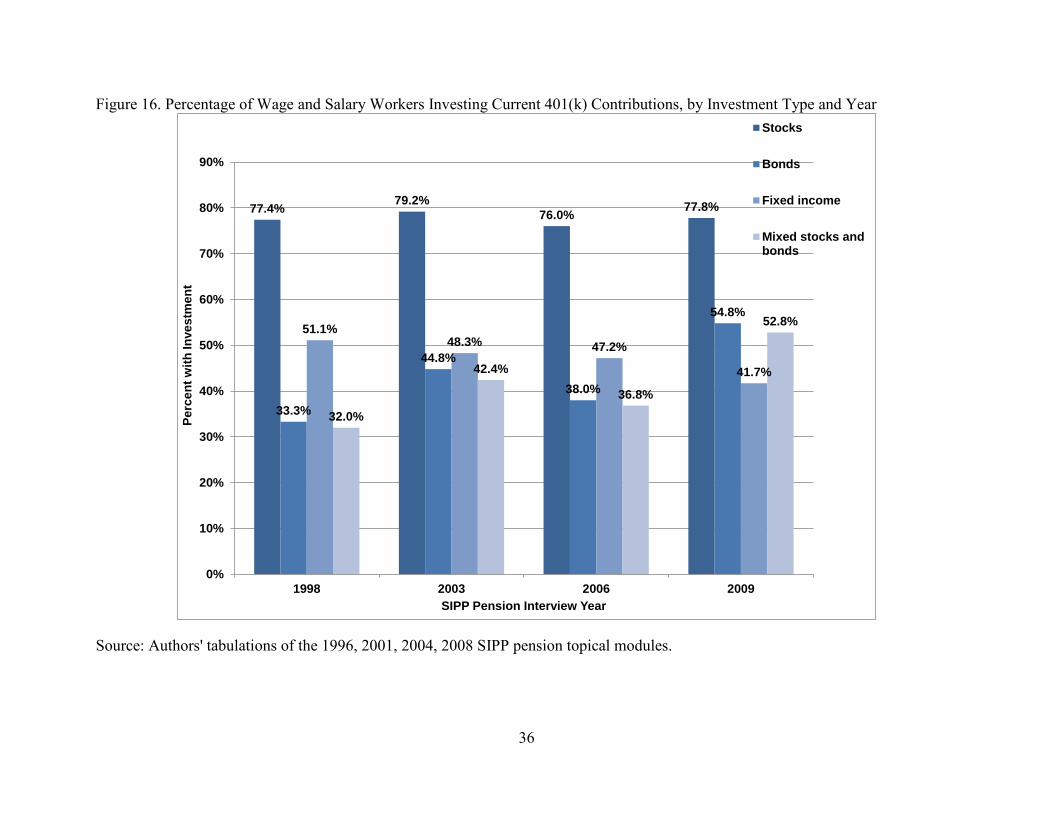
The percentage of workers investing their DC contributions in bonds increased
dramatically with the recession from 38.0 percent in 2006 to 54.8 percent in 2009 (Figure 16).
Similarly, those investing in mixed stocks and bonds increased from 36.8 to 52.8 percent.12
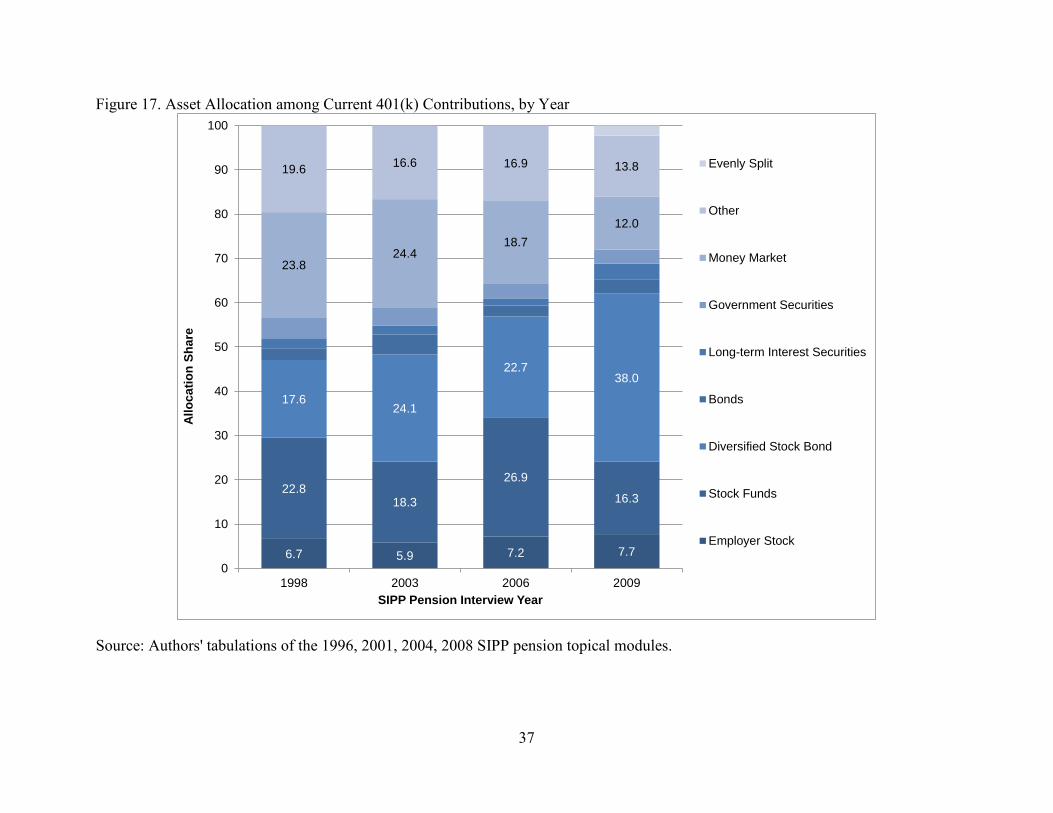
Between 1998 and 2009, workers shifted their primary 401(k) investment type away from
money markets accounts to diversified stock and bond investments (Figure 17). Participant’s
primary DC investment type shifted away from stock funds with both the 2001-2003 and 2008-
2009 stock market crashes. Despite the volatile stock market fluctuations over this period, DC
participants have not abandoned equities but have shifted assets into more diversified
investments. In 2006, 34.1 percent of DC participants invested primarily in employer stock or
stock funds and 22.7 percent invested primarily in diversified stock bonds. In 2009, only 24.1
percent primarily invested their DC contributions in employer stock or stock funds, but 38.0 11 Beginning in 2004, the DER reports the DC plan type for DC contributions. 12 Workers are invested in stocks if they report contributions to company stocks, stock funds, or diversified stock and bond funds. They are invested in bonds if they report contributions to bond funds or diversified stock and bond funds, and they are invested in fixed income accounts if the invest in long-term interest securities, government securities, money market, or other investments.
15
percent invested primarily in diversified stock bonds. The share investing their DC contributions
primarily in money market accounts declined from 23.8 percent in 1998 to only 12.0 percent in
2009.
Next we use multivariate analysis to consider the probability that workers invest their DC
contributions in stocks and how that has changed over time (Table 11). Workers whose
employers contribute to the plan are 55 percent more likely to invest in stocks than those whose
employers do not contribute. In addition, having a plan that permits borrowing increases the
likelihood of investing in stocks by 56 percent. However, we find no evidence that the
likelihood of investing 401(k) contributions in stocks has changed between 2001, 2003, 2006,
and 2009.
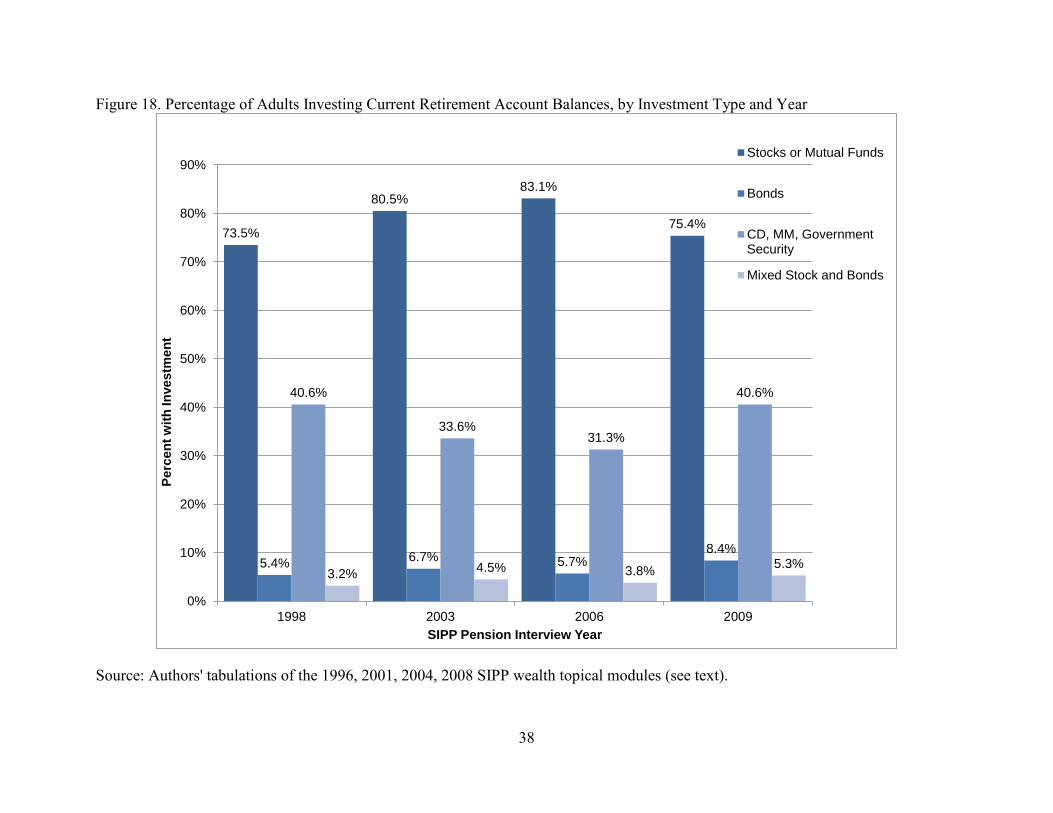
Among all adults with retirement accounts, the share with stocks or mutual funds
declined between 2006 and 2009 from 83.1 to 75.4 percent, and the share with certificates of
deposit, money market accounts, or government securities increased from 31.3 to 40.6 percent
(Figure 18).
Table 12 reports the results from a multivariate analysis that considers the probability that
retirement account owners invest their balances in stocks and how that has changed over time.
In addition to those variables reported in Table 11 to be correlated with investing in stocks,
homeownership, earnings, and work experience are all correlated all increase the likelihood that
retirement account balances are invested in stocks. We also find that the probability of holding
retirement account assets in stocks has changed over time. Compared with 1998, retirement
account owners were 58.7 percent more likely to invest in stocks in 2003 and 63.7 percent more
likely to invest in stocks 2006. However, they were only 52.9 percent more likely to invest in
stocks in 2009 (a 10.8 percentage point decline relative to 2006).
Some of the changes in investment allocations over time reflect employers’ adoption of
target date funds as their default investment type, but the fluctuation in and out of stock funds
around the stock market crashes suggests that some workers do adjust their investment portfolio
in response to how the market performs. However, the observed behavior is contrary to wise
investment advice. Instead of buying equities when the price is low and selling equities when
the price is high, some investors appear to do the opposite. The correlation between the DC
investment behavior reported in the SIPP pension topical module and the retirement account
allocation reported in the SIPP wealth topical module is poor.

16
Discussion
If the typical worker had done nothing in 2007 and kept his contributions in 2008 and
2009 at the 2007 level, instead of reducing them, his account balances would have been at least
$210 higher at the end of 2009 (Table 13). If he had increased his contributions just 1 percent
each year after 2007, his account balances would have been at least $289 higher at the end of
2009. The long-run impacts are even greater, especially when compounded over many years.
The typical 30-year-old worker reduced his contributions by $138 or 6 percent between
2007 and 2010 (see Figure 9). His retirement account balance at age 62 is projected to be just
under $134,000 (Table 14). (This assumes contributions begin increasing 1 percent per year
after 2010 and that accumulated balances earn a 3 percent annual rate of return). If instead of
reducing his contributions starting in 2007, he increased them just 1 percent each year, his
account balance at age 62 would be $145,572—a difference of $11,907 or 8.9 percent. The
further individuals were from retirement when the recession occurred and the higher their
contributions before the recession, the larger the potential negative impact on their retirement
savings. Of course, workers can recoup some or all of their investment losses by increasing their
future contributions. For example, our hypothetical worker could recoup all of his losses from
the recession by increasing his baseline contribution $232 plus making a one-time catch-up
contribution of $520 all in 2011, and then continuing future contributions at the higher level
under the alternative scenario. The regression results in Table 8 show that participation is lower
immediately following a spell of unemployment, suggesting it is difficult to get back on track
after losing a job. But for workers who do contribute after an unemployment spell (see Table
10), they tend to contribute higher amounts on average in an attempt to catch up. For those who
don’t catch up, the recession will amount to a real loss in retirement savings.
Conclusions
With the erosion of DB pensions and the growth in DC plans, sound retirement planning
increasingly depends on the commitment of individuals to invest in retirement accounts
throughout their work lives. A better understanding of the factors influencing workers’ 401(k)
behavior could help policymakers design policies that encourage higher participation and
contribution levels throughout workers’ careers, thus enhancing private retirement savings so
that retirees may rely less on Social Security benefits.
17
We find that the Great Recession, more than each of the previous two recessions, had a
large negative impact on DC participants’ behavior. Participation dropped off slightly, while
contribution amounts and contribution rates declined dramatically – even after controlling for
other factors. The decline in worker participation after the 2001 and 2008 recessions occurred
despite the increased adoption of automatic enrollment. The decline in participation is especially
sharp for younger workers who were more likely to be new employees and automatically
enrolled in their employers’ retirement plans. This suggests that economic forces outweigh
inertia in participation decisions.
Furthermore, those with retirement accounts were much more likely to invest in bonds
after the recession than they were before the recession. The increased prevalence of target date
funds can help unsophisticated investors make better investment choices, but this only works if
the default investments are good choices. While automatic enrollment and target date funds
were established largely to help fight inertia, there is rising concern that defaults may lower
retirement savings (Tergesen 2011).
Although the typical worker reduced his contributions only $130 as a result of the Great
Recession, this represented a decline of 4.9 percent. This is especially troubling when one
considers that the median contribution amount before the recent recession began was only about
$2,600—far less than the 2007 legislated contribution limits of $15,500 for workers under age 50
and $20,500 for those ages 50 and older. Workers were already contributing to their retirement
savings far less than permitted, and now they are contributing even less.
Finally, our results suggest that workers’ participation and contribution decisions are not
always made simultaneously, at least with regard to their response to recessions. As the
economy falters, workers first lower their contribution amounts and later change their decision to
participate. Lower contributions precede recessions, while lower participation follows
recessions.

18
References
Ariel Investments and Hewitt Associates. 2009. “401(k) Plans in Living Color: A Study of 401(k) Plans Across Racial and Ethnic Groups.” Chicago, IL: Ariel Investments.
Bajtelsmit, Vickie L., and Alexandra Bernasek. 2001. “Risk Preferences and the Investment
Decisions of Older Americans.” Washington, DC: AARP. Brady, Peter. 2009. “What Does the Market Crash Mean for the Ability of 401(k) Plans to
Provide Retirement Income? National Tax Journal, 62(3): 455-476. Bureau of Labor Statistics. 2012. “Employer Costs for Employee Compensation – June 2012”.
http://www.bls.gov/news.release/ecec.nr0.htm, accessed September 2012.
Bureau of Labor Statistics. 2011a. “Labor Force Statistics from the Current Population Survey.” Washington, DC: U.S. Department of Labor. http://data.bls.gov/timeseries/LNS14000000.
Bureau of Labor Statistics. 2011b. “Defined-Contribution Investment Choices: Employees Given Range of Investment Options in 401(k) Plans.” Washington, DC: U.S. Department of Labor. Program Perspectives. Volume 3. Issue 5. http://www.bls.gov/opub/perspectives/program_perspectives_vol3_issue5.pdf.
Bureau of Labor Statistics. 2011c. “Table 23. Savings and Thrift Plans: Automatic Enrollment, Private Industry Workers, National Compensation Survey, 2010.” http://www.bls.gov/ncs/ebs/detailedprovisions/2010/ownership/private/table23a.pdf.
Burtless, Gary. 2009. “Financial Market Turbulence and Social Security Reform.” In M. A. Orenstein (Ed.), Pensions, Social Security, and the Privatization of Risk (pp. 72–85). New York, NY: Columbia University Press.
Butrica, Barbara A., and Philip Issa. 2011. “Retirement Account Balances.” Fact Sheet on
Retirement Policy. Washington, DC: Urban Institute. Butrica, Barbara A. and Richard W. Johnson. 2010. “Racial, Ethnic, and Gender Differentials in
Employer-Sponsored Pensions.” Testimony to the ERISA Advisory Council, U.S. Department of Labor, June 30, 2010.
Butrica, Barbara A., Karen E. Smith, and Eric J. Toder. 2010. “What the 2008 Stock Market
Crash Means for Retirement Security.” Journal of Aging & Social Policy. 22(4): 339-359. Charlson, Josh and Laura Lutton. 2012. “Target-Date Series Research Paper: 2012 Industry
Survey.” Morningstar Research Fund. Coile, Courtney C. and Phillip B. Levine. 2006. “Bulls, Bears, and Retirement Behavior.”
Industrial and Labor Relations Review. 59(3): 408-429.
19
–––––. 2010. “Recessions, Reeling Markets, and Retiree Well-Being.” NBER Working Paper No. 16066. Cambridge, MA: National Bureau of Economic Research.
–––––. 2011. "The Market Crash and Mass Layoffs: How the Current Economic Crisis May
Affect Retirement." The B.E. Journal of Economic Analysis & Policy. 11(1): Article 22. Costo, Stephanie. 2006. “Trends in Retirement Plan Coverage over the Last Decade.” Monthly
Labor Review. February: 58-64.
Czajka, John L., James Mabli, and Scott Cody. 2008. “Sample Loss and Survey Bias in Estimates of Social Security Beneficiaries: A Tale of Two Surveys.” Report to SSA. Washington, D.C.: Mathematica Policy Research, Inc.
Dushi, Irena, Howard M. Iams, and Christopher R. Tamborini. 2011. “Defined Contribution Pension Participation and Contributions by Earnings Levels Using Administrative Data.” Social Security Bulletin 71(2): 67-76.
Engen, Eric M., William G. Gale, and Cori E. Uccello. 2004. “Effects of Stock Market
Fluctuations on the Adequacy of Retirement Wealth Accumulation.” Working Paper No. 2004-16. Chestnut Hill, MA: Center for Retirement Research at Boston College.
Goda, Gopi Shah, John B. Shoven, and Sita Nataraj Slavov. 2010. “Does Stock Market
Performance Influence Retirement Expectations?” NBER Working Paper No. 16211. Cambridge, MA: National Bureau of Economic Research.
Gustman, Alan L., Thomas L. Steinmeier, and Nahid Tabatabai. 2009. “What the Stock Market
Decline Means for the Financial Security and Retirement Choices of the Near-Retirement Population.” NBER Working Paper No. 15435. Cambridge, MA: National Bureau of Economic Research.
Investment Company Institute (ICI). 2008. “401(k) Plan Asset Allocation, Account Balances,
and Loan Activity in 2007.” Research Perspective No. 14(3). Washington, DC: ICI. Investment Company Institute (ICI) & the Securities Industry and Financial Markets Association
(SIFMA). 2008. “Equity and Bond Ownership in America.” Washington, DC: ICI & SIFMA.
Malmendier, Ulrike and Stefan Nagel. 2007. “Depression Babies: Do Macroeconomic
Experiences Affect Risk-Taking?” Cambridge, MA: National Bureau of Economic Research.
Muller, Leslie A, and John A. Turner. 2011. "The Persistence of Employee 401(k) Contributions
Over a Major Stock Market Cycle: Evidence on the Limited Power of Inertia on Savings Behavior." Upjohn Institute Working Paper 11-174. Kalamazoo, MI: W.E. Upjohn Institute for Employment Research.
20
Munnell, Alicia H. 2012. “401(k) Plans in 2010: An Update from the SCF.” Issue in Brief No. 12-13. Chestnut Hill, MA: Center for Retirement Research at Boston College.
National Bureau of Economic Research. 2011. “US Business Cycle Expansions and
Contractions.” http://www.nber.org/cycles/cyclesmain.html. Olsen, Anya, and Russell Hudson. 2009. “Social Security Administration’s Master Earnings File:
Background Information.” Social Security Bulletin 69(3): 29–45.
Schubert, Renate, Martin Brown, Matthias Gysler, and Hans Wolfgang Brachinger. 1999. “Financial Decision-Making: Are Women Really More Risk-Averse?” American Economic Review 89(2): 381–85.
Smith, Karen E, Richard W. Johnson, and Leslie Muller. 2004. “Deferring Income in Employer-
Sponsored Retirement Plans: The Dynamics of Participant Contributions.” National Tax Journal. 57(3): 639-670.
Utkus, Stephen, and Jean Young. 2009. “Inertia and Retirement Savings: Participant Behavior in
2008.” Valley Forge, PA: Vanguard Center for Retirement Research. Tergesen, Anne. 2011. “401(k) Law Suppresses Saving for Retirement.” Wall Street Journal.
July 7, 2011. Wiatrowski, William J. 2011. “Changing Landscape of Employer-Based Retirement Benefits.”
Bureau of Labor Statistics. Available: http://www.bls.gov/opub/cwc/print/cm20110927ar01p1.htm.

21
Figure 1. DC Offer Rate among Wage and Salary Workers by Age and Year
Source: Authors' tabulations of the 1996, 2001, 2004, 2008 SIPP pension topical modules matched to the Social Security Administration's Detailed Earnings Record (DER).
54%
36%
59%
62% 62%
53%
36%
59%
38%
63%
67%69%
61%
46%
60%
39%
66%68% 69%
63%
50%
63%
41%
67%
70%72%
69%
55%
0%
10%
20%
30%
40%
50%
60%
70%
All 20-29 30-39 40-49 50-59 60-64 65-69
DC
Offe
r Rat
e
Age
1998200320062009
22
Figure 2. Participation Rate among Wage and Salary Workers Ages 20 to 69, by Year
Source: Authors' tabulations of the 1996, 2001, 2004, 2008 SIPP data matched to the Social Security Administration's Detailed Earnings Record (DER).
22.5%
40.2%39.1%
42.7%41.1%
0%
5%
10%
15%
20%
25%
30%
35%
40%
45%
1990 1991 1992 1993 1994 1995 1996 1997 1998 1999 2000 2001 2002 2003 2004 2005 2006 2007 2008 2009 2010
Part
icip
atio
n R
ate
Year
23
Figure 3. Participation Rate among Wage and Salary Workers by Age and Year
Source: Authors' tabulations of the 1996, 2001, 2004, 2008 SIPP data matched to the Social Security Administration's Detailed Earnings Record (DER).
0%
10%
20%
30%
40%
50%
1990 1991 1992 1993 1994 1995 1996 1997 1998 1999 2000 2001 2002 2003 2004 2005 2006 2007 2008 2009 2010
Part
icip
atio
n R
ate
Year
20-29
65-69
60-6430-39
40-4950-59

24
Figure 4. Participation Rate among Wage and Salary Workers by Age and Cohort
Source: Authors' tabulations of the 1996, 2001, 2004, 2008 SIPP data matched to the Social Security Administration's Detailed Earnings Record (DER).
52%
29%
0%
10%
20%
30%
40%
50%
20-29 30-39 40-49 50-59 60-64 65-69
Part
icip
atio
n R
ate
Age
1966-1970
1961-1965
1956-1960
1951-1955
1946-1950
1941-1945
1936-1940
1931-1935
1926-1930
1921-1925

25
Figure 5. Distribution of DC Offer and Participation among Wage and Salary Workers Ages 20 to 69 by Age in 2006
Source: Authors' tabulations of the 1996, 2001, 2004, 2008 SIPP data matched to the Social Security Administration's Detailed Earnings Record (DER).
42%
23%
45%49% 50%
42%
28%
19%
16%
21%19% 18%
20%
22%
40%
61%
35% 32% 31%37%
50%
0%
10%
20%
30%
40%
50%
60%
70%
80%
90%
100%
All 20-29 30-39 40-49 50-59 60-64 65-69
Perc
ent o
f Wor
kers
Age
Not Offer
Offer Do NotParticipate
Offer andParticipate

26
Figure 6. Participation Rate among Wage and Salary Workers Offered a DC Plan by Age and Year
Source: Authors' tabulations of the 1996, 2001, 2004, 2008 SIPP data matched to the Social Security Administration's Detailed Earnings Record (DER).
69.1%
60.0%
68.0%
72.3% 73.4%
67.5%
55.5%
66.3%
56.5%
66.8%68.5% 69.8%
67.5%
55.0%
0%
10%
20%
30%
40%
50%
60%
70%
80%
All 20-29 30-39 40-49 50-59 60-64 65-69
Part
cipa
tion
Rat
e
Age
20062009
27
Figure 7. Percent Change in DC Contribution Amount among Wage and Salary Participants Ages 20 to 69, by Year
Source: Authors' tabulations of the 1996, 2001, 2004, 2008 SIPP data matched to the Social Security Administration's Detailed Earnings Record (DER).
-4
-3
-2
-1
0
1
2
3
4
5
1991 1992 1993 1994 1995 1996 1997 1998 1999 2000 2001 2002 2003 2004 2005 2006 2007 2008 2009 2010
Cha
nge
in D
C C
ontr
ibut
ion
Amou
nt (p
erce
nt)
Median Contribution
GDP
28
Figure 8. Median DC Contribution Amount (and Percent Change) among Wage and Salary Participants, by Age and Year
Source: Authors' tabulations of the 1996, 2001, 2004, 2008 SIPP data matched to the Social Security Administration's Detailed Earnings Record (DER).
$0
$500
$1,000
$1,500
$2,000
$2,500
$3,000
$3,500
$4,000
All 20-29 30-39 40-49 50-59 60-64 65-69
DC
Cont
ribu
tion
Am
ount
(in
2011
dol
lars
)
Age
2007
2008
2009
-4.9%
-6.3%
-6.9%
-6.7%
-9.3% -8.7%
-3.6%

29
Figure 9. Median DC Contribution Amount (and Percent Change) among Wage and Salary Participants, by Age and Year
Source: Authors' tabulations of the 1996, 2001, 2004, 2008 SIPP data matched to the Social Security Administration's Detailed Earnings Record (DER).
$0
$500
$1,000
$1,500
$2,000
$2,500
$3,000
$3,500
$4,000
All 20-29 30-39 40-49 50-59 60-64 65-69
DC
Cont
ribu
tion
Am
ount
(in
2011
dol
lars
)
Age
2007
2008
2009
2010
-5.1%
-11.9%
-6.9%
-8.2%
-6.3%-4.3%
-4.6%

30
Figure 10. Percent Loss in Median DC Contribution Amount among Wage and Salary Participants Ages 20 to 69, by Earnings
Source: Authors' tabulations of the 1996, 2001, 2004, 2008 SIPP data matched to the Social Security Administration's Detailed Earnings Record (DER).
-11.4
-5.0
0.00.4
-3.3
-4.2
-1.9 -2.0
-3.9
-5.8
-7.2
-12.1
1.9
-3.4
-0.4
-2.3 -2.3 -2.1-2.9
-4.8 -4.9
-14
-12
-10
-8
-6
-4
-2
0
2
4
0-10 10-15 15-20 20-30 30-40 40-50 50-60 60-70 70-80 80-100 100+
Loss
in M
edia
n D
C C
ontr
ibut
ion
Amou
nt (p
erce
nt)
Earnings (thousands of 2011 dollars)
2007-09
2007-10

31
Figure 11. Median DC Contribution Rate (and Percent Drop) among Wage and Salary Participants, by Age and Year
Source: Authors' tabulations of the 1996, 2001, 2004, 2008 SIPP data matched to the Social Security Administration's Detailed Earnings Record (DER).
0
1
2
3
4
5
6
7
8
All 20-29 30-39 40-49 50-59 60-64 65-69
DC
Con
trib
utio
n R
ate
(per
cent
)
Age
200720082009
-2.2%
-2.1%
-5.2%
-2.9%
-4.6%
-7.8%
-7.1%
32
Figure 12. Median DC Contribution Rate (and Percent Drop) among Wage and Salary Participants, by Age and Year
Source: Authors' tabulations of the 1996, 2001, 2004, 2008 SIPP data matched to the Social Security Administration's Detailed Earnings Record (DER).
0
1
2
3
4
5
6
7
8
All 20-29 30-39 40-49 50-59 60-64 65-69
DC
Con
trib
utio
n R
ate
(per
cent
)
Age
2007200820092010
-1.8%
-4.3%
-4.1%
-2.5%
-2.8%
-5.1%-8.4%

33
Figure 13. Percent Decline in Median DC Contribution Rate among Wage and Salary Participants Ages 20 to 69, by Earnings
Source: Authors' tabulations of the 1996, 2001, 2004, 2008 SIPP data matched to the Social Security Administration's Detailed Earnings Record (DER).
-15.8
-3.1
1.9
-0.8
-3.1
-6.9
-0.6
-2.9 -3.0-3.7
-1.9
-9.0
2.4
-0.6 -0.3-1.2
-3.3
-0.6
-2.6 -2.7 -2.7 -2.6
-20
-15
-10
-5
0
5
0-10 10-15 15-20 20-30 30-40 40-50 50-60 60-70 70-80 80-100 100+
Dec
line
in M
edia
n D
C C
ontr
ibut
ion
Rat
e (p
erce
nt)
Earnings (thousands of 2011 dollars)
2007-09 2007-10
34
Figure 14. Wage and Salary Worker Participation Logistic Regression Parameter Estimates for Year by Estimation Sample
Source: Authors' tabulations of the 1996, 2001, 2004, 2008 SIPP data matched to the Social Security Administration's Detailed Earnings Record (DER).
0.00
0.20
0.40
0.60
0.80
1.00
1.20
1992 1993 1994 1995 1996 1997 1998 1999 2000 2001 2002 2003 2004 2005 2006 2007 2008 2009 2010
Part
icip
atio
n B
eta
Year
All Workers Workers Offered Pension
35
Figure 15. Wage and Salary Worker Contribution Amount OLS Regression Parameter Estimates for Year by Estimation Sample ($2011)
Source: Authors' tabulations of the 1996, 2001, 2004, 2008 SIPP data matched to the Social Security Administration's Detailed Earnings Record (DER).
-200
-100
0
100
200
300
400
500
600
700
1992
1993
1994
1995
1996
1997
1998
1999
2000
2001
2002
2003
2004
2005
2006
2007
2008
2009
2010
Con
trib
utio
n Am
ount
Bet
a ( i
n 20
11 d
olla
rs)
Year
All Participants 1990-2010
Participants 1990 to SIPP
36
Figure 16. Percentage of Wage and Salary Workers Investing Current 401(k) Contributions, by Investment Type and Year
Source: Authors' tabulations of the 1996, 2001, 2004, 2008 SIPP pension topical modules.
77.4% 79.2%76.0% 77.8%
33.3%
44.8%
38.0%
54.8%51.1%
48.3% 47.2%
41.7%
32.0%
42.4%
36.8%
52.8%
0%
10%
20%
30%
40%
50%
60%
70%
80%
90%
1998 2003 2006 2009
Perc
ent w
ith In
vest
men
t
SIPP Pension Interview Year
Stocks
Bonds
Fixed income
Mixed stocks andbonds
37
Figure 17. Asset Allocation among Current 401(k) Contributions, by Year
Source: Authors' tabulations of the 1996, 2001, 2004, 2008 SIPP pension topical modules.
6.7 5.9 7.2 7.7
22.818.3
26.9
16.3
17.624.1
22.738.0
23.824.4
18.712.0
19.6 16.6 16.9 13.8
0
10
20
30
40
50
60
70
80
90
100
1998 2003 2006 2009
Allo
catio
n Sh
are
SIPP Pension Interview Year
Evenly Split
Other
Money Market
Government Securities
Long-term Interest Securities
Bonds
Diversified Stock Bond
Stock Funds
Employer Stock
38
Figure 18. Percentage of Adults Investing Current Retirement Account Balances, by Investment Type and Year
Source: Authors' tabulations of the 1996, 2001, 2004, 2008 SIPP wealth topical modules (see text).
73.5%
80.5%83.1%
75.4%
5.4% 6.7% 5.7%8.4%
40.6%
33.6%31.3%
40.6%
3.2% 4.5% 3.8% 5.3%
0%
10%
20%
30%
40%
50%
60%
70%
80%
90%
1998 2003 2006 2009
Perc
ent w
ith In
vest
men
t
SIPP Pension Interview Year
Stocks or Mutual Funds
Bonds
CD, MM, GovernmentSecurity
Mixed Stock and Bonds

39
Table 1. Median Contribution Amount for Wage and Salary Participants Ages 20 to 69, by Year and Age (in 2011 dollars) Age Year All 20-29 30-39 40-49 50-59 60-64 65-69 1990 2,233 1,247 2,007 2,722 3,606 4,028 3,595 1991 2,229 1,293 1,980 2,644 3,545 3,717 3,259 1992 2,188 1,179 1,957 2,646 3,574 3,849 2,405 1993 2,273 1,209 2,021 2,730 3,684 3,429 2,473 1994 2,299 1,227 2,056 2,721 3,605 3,300 2,550 1995 2,332 1,200 2,090 2,693 3,496 3,303 2,622 1996 2,398 1,236 2,183 2,724 3,502 3,450 2,731 1997 2,475 1,247 2,251 2,761 3,570 3,383 2,584 1998 2,577 1,377 2,362 2,875 3,643 3,608 3,201 1999 2,605 1,386 2,394 2,929 3,529 3,599 2,601 2000 2,608 1,394 2,419 2,901 3,545 3,287 2,362 2001 2,653 1,393 2,443 2,942 3,482 3,448 2,403 2002 2,653 1,386 2,448 2,993 3,570 3,402 2,520 2003 2,697 1,392 2,407 2,958 3,518 3,319 2,712 2004 2,750 1,290 2,402 3,042 3,603 3,570 2,974 2005 2,727 1,273 2,392 2,990 3,597 3,645 3,074 2006 2,698 1,236 2,360 2,978 3,577 3,580 2,922 2007 2,623 1,168 2,304 2,946 3,530 3,529 2,983 2008 2,542 1,132 2,226 2,835 3,360 3,492 2,829 2009 2,493 1,095 2,165 2,748 3,203 3,224 2,877 2010 2,488 1,030 2,166 2,705 3,309 3,378 2,845 Source: Authors' tabulations of the 1996, 2001, 2004, 2008 SIPP data matched to the
Social Security Administration's Detailed Earnings Record (DER). Note: Contributions are based on positive deferred contributions on the DER from 1990 to 2010.

40
Table 2. Change in Median Contribution Amount Ages 20 to 69, by Year and Age (percent)
for Wage and Salary Participants
Year
Age All 20-29 30-39 40-49 50-59 60-64 65-69
1991 1992 1993 1994 1995 1996 1997 1998 1999 2000 2001 2002 2003 2004 2005 2006 2007 2008 2009 2010 2007-09 2007-10
-0.1 -1.9 3.9 1.1 1.4 2.8 3.2 4.1 1.1 0.1 1.7 0.0 1.7 2.0 -0.9 -1.1 -2.8 -3.1 -2.0 -0.2
-4.9 -5.1
3.7 -8.8 2.6 1.4 -2.2 3.0 0.8 10.5 0.6 0.6 -0.1 -0.5 0.4 -7.3 -1.3 -2.9 -5.5 -3.1 -3.3 -5.9
-6.3 -11.9
-1.3 -1.2 3.3 1.7 1.7 4.4 3.1 4.9 1.4 1.1 1.0 0.2 -1.7 -0.2 -0.4 -1.3 -2.4 -3.4 -2.7 0.1
-6.0 -6.0
-2.9 0.1 3.2 -0.3 -1.0 1.2 1.3 4.1 1.9 -1.0 1.4 1.7 -1.2 2.9 -1.7 -0.4 -1.1 -3.8 -3.1 -1.6
-6.7 -8.2
-1.7 0.8 3.1 -2.1 -3.0 0.2 1.9 2.1 -3.1 0.4 -1.8 2.5 -1.4 2.4 -0.2 -0.6 -1.3 -4.8 -4.7 3.3
-9.3 -6.3
-7.7 3.6
-10.9 -3.8 0.1 4.4 -1.9 6.7 -0.2 -8.7 4.9 -1.3 -2.4 7.6 2.1 -1.8 -1.4 -1.1 -7.7 4.8
-8.7 -4.3
-9.3 -26.2 2.8 3.1 2.8 4.2 -5.4 23.9 -18.7 -9.2 1.8 4.9 7.6 9.7 3.4 -4.9 2.1 -5.2 1.7 -1.1
-3.6 -4.6
Source: Authors' tabulations of the 1996, 2001, 2004, 2008 SIPP data matched to the
Social Security Administration's Detailed Earnings Record (DER). Note: Contributions are based on positive deferred contributions on the DER from 1990 to 2010.
41
Table 3. Median Contribution Amount for Wage and Salary Participants Ages 20 to 69, by Year and Own Earnings (in 2011 dollars) Year All 0-10 10-15 15-20
Own Earnings (thousands of 2011 dollars) 20-30 30-40 40-50 50-60
60-70 70-80 80-100 100+
1990 1991 1992 1993 1994 1995 1996 1997 1998 1999 2000 2001 2002 2003 2004 2005 2006 2007 2008 2009 2010 Source:
(DER). Note: C
2,233 2,229 2,188 2,273 2,299 2,332 2,398 2,475 2,577 2,605 2,608 2,653 2,653 2,697 2,750 2,727 2,698 2,623 2,542 2,493 2,488
Authors' ta
ontributions
326 239 197 214 217 194 220 181 231 197 212 216 206 217 204 224 214 182 195 161 160
bulations o
are based
536 503 525 521 552 518 545 492 555 494 492 504 494 559 509 463 464 426 431 405 434
f the 1996,
on positive
699 786 641 664 692 663 724 701 708 690 682 700 684 719 661 696 633 591 574 591 571
2001, 2004,
deferred c
919 986 932 941 986 947 951 990 987 975 957 996 953 995 958 975 958 901 910 904 897
2008 SIPP
ontributions o
1,374 1,456 1,389 1,447 1,487 1,480 1,518 1,516 1,529 1,547 1,543 1,534 1,538 1,514 1,473 1,494 1,441 1,421 1,410 1,374 1,409
data matched
n the DER fr
1,957 1,934 1,925 2,028 1,989 2,028 2,078 2,093 2,130 2,138 2,099 2,171 2,141 2,152 2,150 2,143 2,134 2,146 2,160 2,055 2,097
om 1990 to
2,450 2,406 2,446 2,527 2,606 2,688 2,711 2,743 2,760 2,799 2,828 2,914 2,898 2,855 2,868 2,861 2,884 2,841 2,827 2,787 2,777
to the Social Security 2010.
A
3,126 3,184 3,144 3,246 3,298 3,340 3,512 3,656 3,549 3,529 3,629 3,662 3,732 3,501 3,543 3,567 3,526 3,529 3,570 3,460 3,457
dministr
3,813 3,894 3,854 3,991 3,955 4,106 4,225 4,271 4,458 4,510 4,461 4,501 4,528 4,436 4,406 4,421 4,432 4,399 4,374 4,228 4,272
ation's De
4,776 4,841 4,899 4,955 5,149 5,287 5,294 5,461 5,626 5,617 5,792 5,806 6,022 5,915 5,909 5,821 5,813 5,682 5,460 5,352 5,410
tailed Earni
7,636 7,884 8,019 8,182 8,397 8,443 9,005 9,384 9,833 10,018 10,156 10,292 10,650 10,954 11,297 11,556 11,771 11,766 11,672 10,917 11,185
ngs Record
42
Table 4. Change in Median Contribution Amount for Wage and Salary Participants Ages 20 to 69, by Year and Own Earnings (percent) Own Earnings (thousands of 2011 dollars) Year All 0-10 10-15 15-20 20-30 30-40 40-50 50-60 60-70 70-80 80-100 100+ 1991 -0.1 -26.6 -6.1 12.3 7.3 6.0 -1.2 -1.8 1.8 2.1 1.4 3.2 1992 -1.9 -17.6 4.4 -18.3 -5.5 -4.6 -0.5 1.6 -1.3 -1.0 1.2 1.7 1993 3.9 8.3 -0.8 3.5 1.1 4.2 5.3 3.3 3.3 3.5 1.1 2.0 1994 1.1 1.4 5.9 4.3 4.7 2.7 -1.9 3.1 1.6 -0.9 3.9 2.6 1995 1.4 -10.5 -6.1 -4.2 -3.9 -0.5 2.0 3.2 1.3 3.8 2.7 0.5 1996 2.8 13.6 5.2 9.2 0.5 2.6 2.5 0.9 5.2 2.9 0.1 6.7 1997 3.2 -17.8 -9.7 -3.2 4.0 -0.2 0.7 1.2 4.1 1.1 3.2 4.2 1998 4.1 27.6 12.8 0.9 -0.3 0.9 1.8 0.6 -2.9 4.4 3.0 4.8 1999 1.1 -14.8 -11.1 -2.5 -1.2 1.2 0.4 1.4 -0.6 1.2 -0.2 1.9 2000 0.1 7.8 -0.3 -1.2 -1.9 -0.3 -1.8 1.0 2.8 -1.1 3.1 1.4 2001 1.7 1.8 2.5 2.6 4.1 -0.6 3.4 3.1 0.9 0.9 0.2 1.3 2002 0.0 -4.5 -2.1 -2.4 -4.3 0.2 -1.4 -0.6 1.9 0.6 3.7 3.5 2003 1.7 5.2 13.2 5.1 4.4 -1.5 0.5 -1.5 -6.2 -2.0 -1.8 2.9 2004 2.0 -6.0 -9.0 -8.1 -3.7 -2.7 -0.1 0.5 1.2 -0.7 -0.1 3.1 2005 -0.9 10.0 -9.0 5.4 1.7 1.4 -0.3 -0.2 0.7 0.3 -1.5 2.3 2006 -1.1 -4.5 0.2 -9.1 -1.7 -3.5 -0.4 0.8 -1.1 0.3 -0.1 1.9 2007 -2.8 -15.1 -8.1 -6.6 -6.0 -1.4 0.6 -1.5 0.1 -0.7 -2.2 -0.1 2008 -3.1 7.4 1.0 -2.9 1.1 -0.8 0.7 -0.5 1.1 -0.6 -3.9 -0.8 2009 -2.0 -17.5 -5.9 3.0 -0.7 -2.6 -4.9 -1.4 -3.1 -3.3 -2.0 -6.5 2010 -0.2 -0.8 7.3 -3.4 -0.8 2.5 2.1 -0.4 -0.1 1.0 1.1 2.5 2007-09 -4.9 -11.4 -5.0 0.0 0.4 -3.3 -4.2 -1.9 -2.0 -3.9 -5.8 -7.2 2007-10 -5.1 -12.1 1.9 -3.4 -0.4 -0.9 -2.3 -2.3 -2.1 -2.9 -4.8 -4.9 Source: Authors' tabulations of the 1996, 2001, 2004, 2008 SIPP data matched to the Social Security Administration's Detailed Earnings Record (DER).
Note: Contributions are based on positive deferred contributions on the DER from 1990 to 2010.
43
Table 5. Median Contribution Rate for Wage and Salary Participants Ages 20 to 69, by Year and Age (percent) Age Year All 20-29 30-39 40-49 50-59 60-64 65-69 1990 4.7 3.4 4.1 4.9 5.9 6.9 7.0 1991 4.7 3.7 4.1 4.9 6.0 6.7 6.3 1992 4.7 3.4 4.1 4.8 5.9 6.9 6.3 1993 4.8 3.6 4.2 5.0 6.0 6.7 6.3 1994 4.9 3.7 4.4 5.0 6.0 6.5 7.0 1995 4.9 3.6 4.5 5.0 6.0 6.3 6.4 1996 5.0 3.8 4.7 5.0 6.0 6.6 6.5 1997 5.0 3.7 4.7 5.0 6.0 6.6 6.6 1998 5.0 3.9 4.9 5.1 6.0 6.9 6.6 1999 5.1 3.9 4.9 5.1 6.0 6.8 6.6 2000 5.1 3.8 4.9 5.1 6.0 6.6 6.5 2001 5.2 3.9 5.0 5.2 6.0 6.9 7.1 2002 5.2 3.8 5.0 5.3 6.1 6.7 7.0 2003 5.2 3.8 4.9 5.2 6.1 6.6 7.2 2004 5.2 3.5 4.9 5.3 6.1 6.8 7.5 2005 5.2 3.6 4.9 5.2 6.1 7.1 7.2 2006 5.2 3.5 4.8 5.3 6.1 6.8 7.1 2007 5.1 3.3 4.7 5.2 6.1 6.7 7.0 2008 5.1 3.3 4.6 5.1 6.0 6.5 6.9 2009 5.0 3.2 4.4 5.0 5.8 6.2 6.5 2010 5.0 3.1 4.5 5.1 5.9 6.3 6.4 Source: Authors' tabulations of the 1996, 2001, 2004, 2008 SIPP data matched to the
Social Security Administration's Detailed Earnings Record (DER). Note: Contributions are based on positive deferred contributions on the DER from 1990 to 2010.
44
Table 6. Median Contribution Rate for Wage and Salary Participants Ages 20 to 69, by Year and Own Earnings (percent) Own Earnings (thousands of 2011 dollars) Year All 0-10 10-15 15-20 20-30 30-40 40-50 50-60 60-70 70-80 80-100 100+ 1990 4.7 5.8 4.1 4.0 3.7 4.0 4.3 4.5 4.9 5.0 5.4 5.3 1991 4.7 4.3 4.0 4.5 3.9 4.1 4.2 4.4 5.0 5.1 5.4 5.5 1992 4.7 4.0 4.0 3.8 3.8 4.0 4.3 4.5 4.9 5.1 5.6 5.5 1993 4.8 4.0 4.1 3.7 3.8 4.1 4.5 4.7 5.0 5.3 5.7 5.7 1994 4.9 4.5 4.3 4.0 4.0 4.2 4.5 4.9 5.0 5.3 5.9 5.6 1995 4.9 4.0 4.0 3.8 3.8 4.1 4.6 5.0 5.1 5.5 6.0 5.5 1996 5.0 4.4 4.2 4.0 3.9 4.3 4.7 5.0 5.5 5.6 6.0 5.8 1997 5.0 3.8 4.0 3.9 4.0 4.3 4.8 5.0 5.7 5.8 6.1 5.9 1998 5.0 4.8 4.4 4.0 4.0 4.3 4.8 5.0 5.5 6.0 6.2 6.0 1999 5.1 4.2 4.1 3.9 3.9 4.4 4.9 5.1 5.5 6.1 6.2 6.0 2000 5.1 4.5 4.0 3.8 3.9 4.3 4.8 5.1 5.6 6.0 6.4 6.0 2001 5.2 4.4 4.0 4.0 4.0 4.4 5.0 5.2 5.7 6.0 6.4 6.1 2002 5.2 4.6 3.9 4.0 3.9 4.4 4.9 5.2 5.8 6.1 6.7 6.5 2003 5.2 4.5 4.5 4.1 4.0 4.3 4.9 5.1 5.4 6.0 6.6 6.5 2004 5.2 4.7 4.1 3.7 3.9 4.2 4.9 5.2 5.4 6.0 6.6 6.8 2005 5.2 4.7 3.6 4.0 3.9 4.2 4.9 5.2 5.5 6.0 6.4 6.8 2006 5.2 4.2 3.6 3.6 3.8 4.1 4.9 5.2 5.5 6.0 6.4 7.0 2007 5.1 4.0 3.3 3.2 3.6 4.1 4.9 5.1 5.4 5.9 6.3 6.9 2008 5.1 4.0 3.4 3.2 3.6 4.1 4.9 5.1 5.5 5.9 6.2 7.0 2009 5.0 3.4 3.2 3.3 3.6 4.0 4.6 5.1 5.3 5.7 6.0 6.8 2010 5.0 3.6 3.4 3.2 3.6 4.1 4.8 5.1 5.3 5.8 6.1 6.7 Source: Authors' tabulations of the 1996, 2001, 2004, 2008 SIPP data matched to the Social Security Administration's Detailed Earnings Record (DER).
Note: Contributions are based on positive deferred contributions on the DER from 1990 to 2010.

45
Table 7. Logistic Regression of the Likelihood of Wage and Salary Workers Ages 20 to 69 Participating in 401(k) Plans, 1991 to 2010 Model 1 Model 2
Parameter Standard Parameter Standard Estimate Error Estimate Error Intercept -14.696 0.031 ** -14.036 0.027 ** Log earnings ($2011) 1.199 0.002 ** 1.189 0.002 ** Gets a job this year after unemployment -0.728 0.020 ** -0.732 0.020 ** Change jobs this year -0.440 0.004 ** -0.435 0.004 ** Change jobs last year -0.422 0.004 ** -0.419 0.004 ** Number of work years since age 20 0.021 0.000 ** 0.021 0.000 ** Age 0.056 0.001 ** Age Squared -0.001 0.000 ** Age Spline 20-29 0.062 0.001 ** Age Spline 30-39 -0.085 0.001 ** Age Spline 40-49 0.012 0.001 ** Age Spline 50-59 -0.007 0.001 ** Age Spline 60-69 -0.038 0.002 ** Year 1992 0.066 0.011 ** 0.067 0.011 ** Year 1993 0.165 0.011 ** 0.166 0.011 ** Year 1994 0.280 0.011 ** 0.282 0.011 ** Year 1995 0.371 0.011 ** 0.374 0.011 ** Year 1996 0.466 0.011 ** 0.470 0.011 ** Year 1997 0.547 0.011 ** 0.551 0.011 ** Year 1998 0.614 0.011 ** 0.619 0.011 ** Year 1999 0.657 0.010 ** 0.663 0.010 ** Year 2000 0.711 0.010 ** 0.718 0.010 ** Year 2001 0.727 0.010 ** 0.735 0.010 ** Year 2002 0.679 0.010 ** 0.686 0.010 ** Year 2003 0.642 0.010 ** 0.650 0.010 ** Year 2004 0.645 0.010 ** 0.652 0.010 ** Year 2005 0.682 0.010 ** 0.690 0.010 ** Year 2006 0.725 0.010 ** 0.732 0.010 ** Year 2007 0.775 0.010 ** 0.781 0.010 ** Year 2008 0.821 0.010 ** 0.827 0.010 ** Year 2009 0.772 0.010 ** 0.778 0.010 ** Year 2010 0.742 0.011 ** 0.746 0.011 ** SIPP 2001 0.011 0.005 0.010 0.005 SIPP 2004 0.026 0.004 ** 0.025 0.004 ** SIPP 2008 -0.012 0.004 -0.014 0.004 N (person-years) 2406035 2406035 -2 Log Likelihood 2473126 2470566 Source: Authors' tabulations of the 1996, 2001, 2004, 2008 SIPP data matched to the Social
Security Administration's Detailed Earnings Record (DER). Note: Table includes all workers in all years 1991-2010. ** indicates p<0.001, * indicates p<0.01

46
Table 8. Logistic Regression Estimates of Whether a Wage and Salary Worker Offered a DC Plan Contributes to Their Plan (1996, 2001, 2004, 2008 SIPP)
Model 1 Parameter Standard Estimate Error
Model 2
Parameter Standard Estimate Error
Intercept Married Two earners Number of dependents Have a baby this year Have a baby last year Purchase a home this year Purchase a home last year Own a home Become work limited this year Become work limited last year Log of total earnings Become divorced this year Become widowed this year Get married this year Spouse contributes to a DC plan Spouse's contribution rate (contribution/earnings) Employer contributes to plan Have a DB plan Have a CB plan Currently work limited Spouse currently work limited Gets a job this year after unemployment Spouse gets a job this year after unemployment Change jobs this year Spouse changes jobs this year Change jobs last year Spouse changes jobs last year Spouses loses a job this year Spouse begins to contribute to DC plan this year Can borrow from pension plan Number of work years since age 20 Age Age squared Age Spline 20-29 Age Spline 30-39 Age Spline 40-49 Age Spline 50-59 Age Spline 60-69
-9.310 -0.059 -0.540 -0.055 0.146 0.082
-0.041 -0.027 0.176 0.373 0.223 0.789
-0.122 -0.016 0.011 0.219
1.786 -0.047 0.344 0.213
-0.171 -0.025
-1.102
0.267 -0.331 0.062
-0.374 0.041
-0.040
-0.059 0.480
0.019 0.020 0.000
0.068 0.009 0.009 0.003 0.018 0.017 0.017 0.016 0.007 0.066 0.064 0.005 0.029 0.074 0.019 0.011
0.114 0.007 0.007 0.015 0.022 0.018
0.041
0.026 0.008 0.008 0.008 0.009 0.024
0.022 0.007
0.001 0.002 0.000
** ** ** ** ** ** ** ** * ** ** **
** ** ** ** **
**
** ** ** ** **
**
** ** **
-9.206 -0.068 -0.534 -0.059 0.119 0.055
-0.052 -0.039 0.180 0.371 0.221 0.782
-0.134 -0.027 0.013 0.219
1.798 -0.046 0.347 0.213
-0.176 -0.023
-1.103
0.264 -0.326 0.062
-0.371 0.040
-0.041
-0.061 0.478
0.019
0.041
-0.058 0.007 0.010
-0.037
0.060 0.009 0.009 0.004 0.018 0.017 0.017 0.016 0.007 0.066 0.064 0.005 0.029 0.074 0.020 0.011
0.114 0.007 0.007 0.015 0.022 0.018
0.041
0.026 0.008 0.008 0.008 0.009 0.024
0.022 0.007
0.001
0.002 0.003 0.002 0.003 0.005
** ** ** ** ** ** ** * ** ** **
** ** ** ** **
**
** ** ** ** **
**
**
** ** ** **
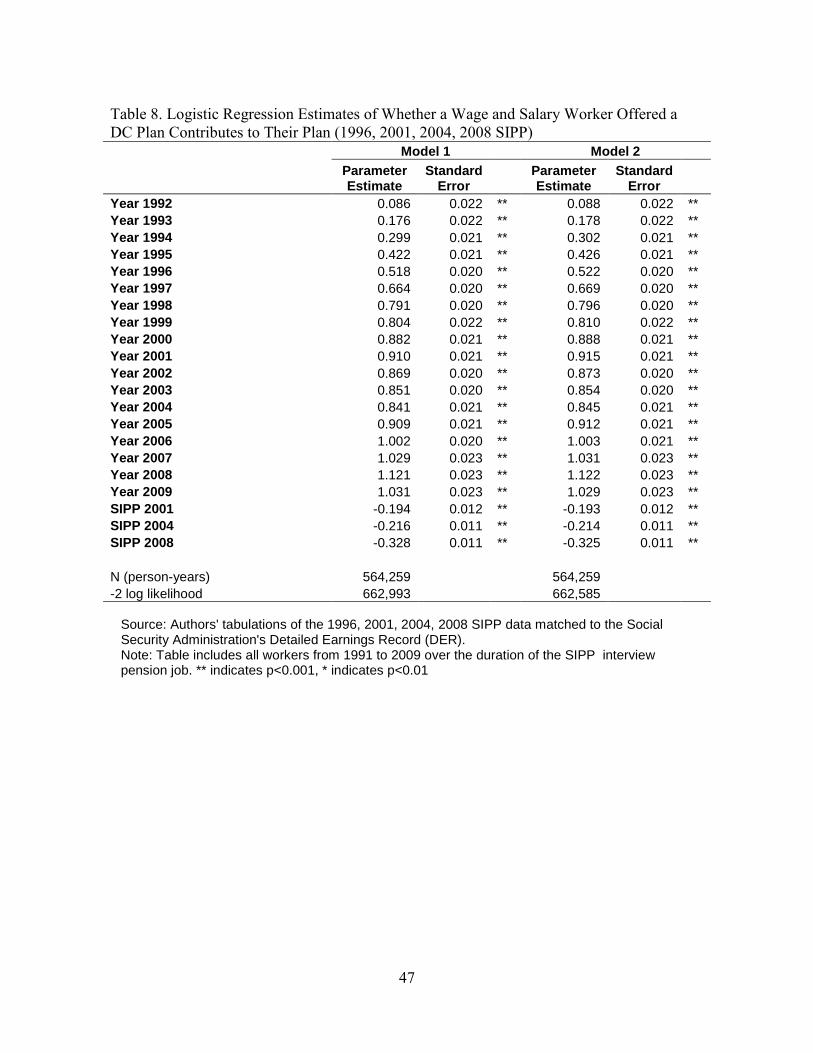
47
Table 8. Logistic Regression Estimates of Whether a Wage and Salary Worker Offered a DC Plan Contributes to Their Plan (1996, 2001, 2004, 2008 SIPP)
Model 1 Model 2
Parameter Estimate
Standard Error
Parameter Estimate
Standard Error
Year 1992 0.086 0.022 ** 0.088 0.022 ** Year 1993 0.176 0.022 ** 0.178 0.022 ** Year 1994 0.299 0.021 ** 0.302 0.021 ** Year 1995 0.422 0.021 ** 0.426 0.021 ** Year 1996 0.518 0.020 ** 0.522 0.020 ** Year 1997 0.664 0.020 ** 0.669 0.020 ** Year 1998 0.791 0.020 ** 0.796 0.020 ** Year 1999 0.804 0.022 ** 0.810 0.022 ** Year 2000 0.882 0.021 ** 0.888 0.021 ** Year 2001 0.910 0.021 ** 0.915 0.021 ** Year 2002 0.869 0.020 ** 0.873 0.020 ** Year 2003 0.851 0.020 ** 0.854 0.020 ** Year 2004 0.841 0.021 ** 0.845 0.021 ** Year 2005 0.909 0.021 ** 0.912 0.021 ** Year 2006 1.002 0.020 ** 1.003 0.021 ** Year 2007 1.029 0.023 ** 1.031 0.023 ** Year 2008 1.121 0.023 ** 1.122 0.023 ** Year 2009 1.031 0.023 ** 1.029 0.023 ** SIPP 2001 -0.194 0.012 ** -0.193 0.012 ** SIPP 2004 -0.216 0.011 ** -0.214 0.011 ** SIPP 2008 -0.328 0.011 ** -0.325 0.011 **
N (person-years) 564,259
564,259 -2 log likelihood 662,993 662,585
Source: Authors' tabulations of the 1996, 2001, 2004, 2008 SIPP data matched to the Social Security Administration's Detailed Earnings Record (DER). Note: Table includes all workers from 1991 to 2009 over the duration of the SIPP interview pension job. ** indicates p<0.001, * indicates p<0.01

Table 9. OLS Regression Estimates of Contribution Amount Among Wage and Salary Participants Ages 20 to 69, 1991 to 2010 Model 1 Model 2
Parameter Standard Parameter Standar Estimate Error Estimate d Error Intercept -35574.00 79.694 ** -36765.00 65.646 ** Log earnings ($2011) 3778.09 5.671 ** 3786.65 5.682 **
Gets a job this year after unemployment 3315.92 64.965 ** 3302.55 64.934 ** Change jobs this year -519.54 10.008 ** -530.51 10.011 ** Change jobs last year -226.59 11.397 ** -234.82 11.396 ** Number of work years since age 20 -28.18 0.996 ** -29.61 0.999 ** Age -127.51 2.776 ** Age Squared 2.37 0.031 Age Spline 20-29 -85.33 3.136 Age Spline 30-39 157.52 4.197 ** Age Spline 40-49 4.32 2.841 Age Spline 50-59 70.85 3.066 ** Age Spline 60-69 -41.23 6.148 ** Year 1992 -131.56 30.909 -129.10 30.893 ** Year 1993 32.12 30.382 34.58 30.367 Year 1994 41.71 29.775 43.75 29.760 Year 1995 8.64 29.317 9.49 29.303 Year 1996 97.99 28.885 * 97.97 28.871 * Year 1997 121.24 28.450 ** 120.55 28.435 ** Year 1998 263.41 28.059 ** 261.99 28.046 ** Year 1999 227.99 27.832 ** 225.40 27.818 ** Year 2000 214.20 27.617 ** 211.48 27.603 ** Year 2001 264.72 27.520 ** 260.95 27.507 ** Year 2002 383.79 27.598 ** 379.09 27.585 ** Year 2003 418.14 27.671 ** 413.96 27.657 ** Year 2004 537.60 27.626 ** 533.28 27.613 ** Year 2005 645.29 27.543 ** 640.33 27.530 ** Year 2006 700.78 27.408 ** 695.57 27.396 ** Year 2007 700.49 27.269 ** 695.71 27.256 ** Year 2008 592.37 27.223 ** 587.55 27.210 ** Year 2009 554.62 27.425 ** 551.66 27.411 ** Year 2010 556.56 27.579 ** 554.59 27.565 ** SIPP 2001 9.06 12.420 10.00 12.414 SIPP 2004 47.94 10.453 ** 48.64 10.448 ** SIPP 2008 63.54 10.352 ** 64.71 10.348 **
N (person-years) 878,618 878,618 R-Squared 0.3864 0.3871 Source: Authors' tabulations of the 1996, 2001, 2004, 2008 SIPP data matched to the Social Security Administration's Detailed Earnings Record (DER).
Note: Table includes all workers in all years 1991-2010. ** indicates p<0.001, * indicates p<0.01
48
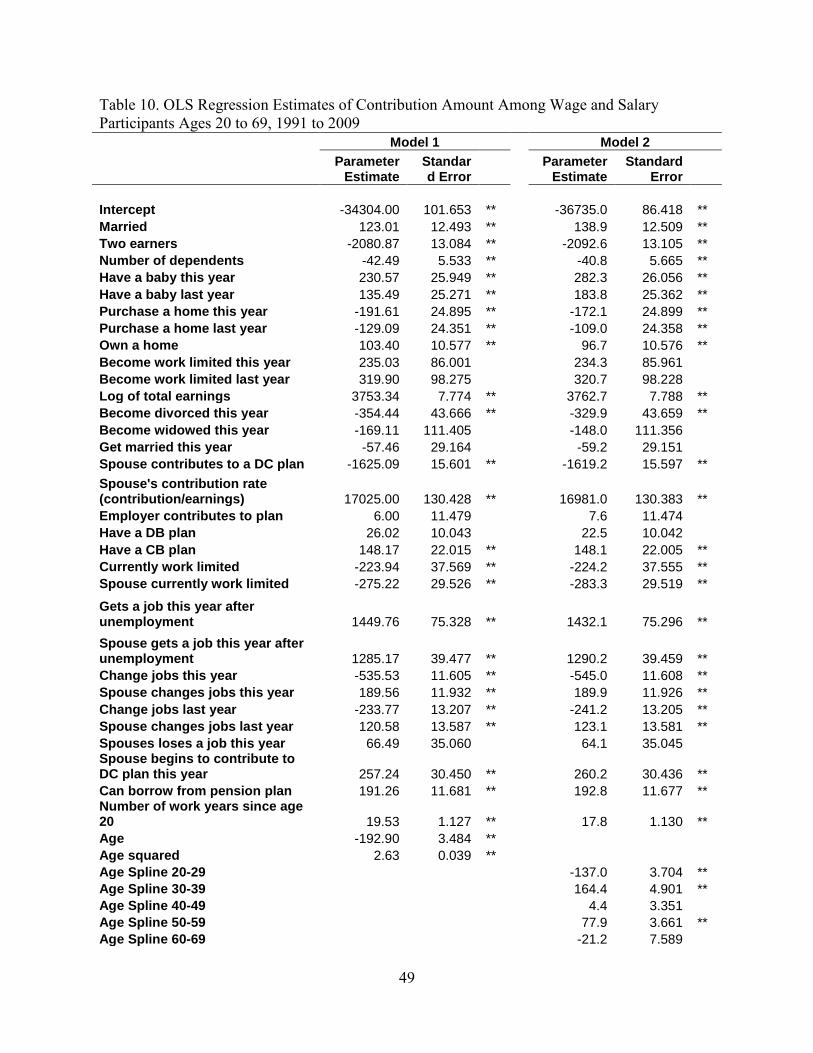
49
Table 10. OLS Regression Estimates of Contribution Amount Among Wage and Salary Participants Ages 20 to 69, 1991 to 2009
Model 1 Model 2
Parameter Standar Estimate d Error
Parameter Standard Estimate Error
Intercept Married Two earners Number of dependents Have a baby this year Have a baby last year Purchase a home this year Purchase a home last year Own a home Become work limited this year Become work limited last year Log of total earnings Become divorced this year Become widowed this year Get married this year Spouse contributes to a DC plan Spouse's contribution rate (contribution/earnings) Employer contributes to plan Have a DB plan Have a CB plan Currently work limited Spouse currently work limited Gets a job this year after unemployment Spouse gets a job this year after unemployment Change jobs this year Spouse changes jobs this year Change jobs last year Spouse changes jobs last year Spouses loses a job this year Spouse begins to contribute to DC plan this year Can borrow from pension plan Number of work years since age 20 Age Age squared Age Spline 20-29 Age Spline 30-39 Age Spline 40-49 Age Spline 50-59 Age Spline 60-69
-34304.00
123.01 -2080.87
-42.49 230.57 135.49
-191.61 -129.09 103.40 235.03 319.90
3753.34 -354.44 -169.11
-57.46 -1625.09
17025.00 6.00
26.02 148.17
-223.94 -275.22
1449.76
1285.17 -535.53 189.56
-233.77 120.58 66.49
257.24 191.26
19.53 -192.90
2.63
101.653 12.493 13.084 5.533
25.949 25.271 24.895 24.351 10.577 86.001 98.275 7.774
43.666 111.405 29.164 15.601
130.428 11.479 10.043 22.015 37.569 29.526
75.328
39.477 11.605 11.932 13.207 13.587 35.060
30.450 11.681
1.127 3.484 0.039
** ** ** ** ** ** ** ** ** ** ** **
** ** ** **
**
** ** ** ** **
** **
** ** **
-36735.0 138.9 -2092.6 -40.8 282.3 183.8 -172.1 -109.0 96.7 234.3 320.7 3762.7 -329.9 -148.0 -59.2 -1619.2
16981.0 7.6 22.5 148.1 -224.2 -283.3
1432.1
1290.2 -545.0 189.9 -241.2 123.1 64.1
260.2 192.8
17.8 -137.0 164.4 4.4 77.9 -21.2
86.418 12.509 13.105 5.665
26.056 25.362 24.899 24.358 10.576 85.961 98.228 7.788
43.659 111.356 29.151 15.597
130.383 11.474 10.042 22.005 37.555 29.519
75.296
39.459 11.608 11.926 13.205 13.581 35.045
30.436 11.677
1.130
3.704
4.901 3.351 3.661 7.589
** ** ** ** ** ** ** ** ** ** ** **
** ** ** **
**
** ** ** ** **
** **
** ** ** **
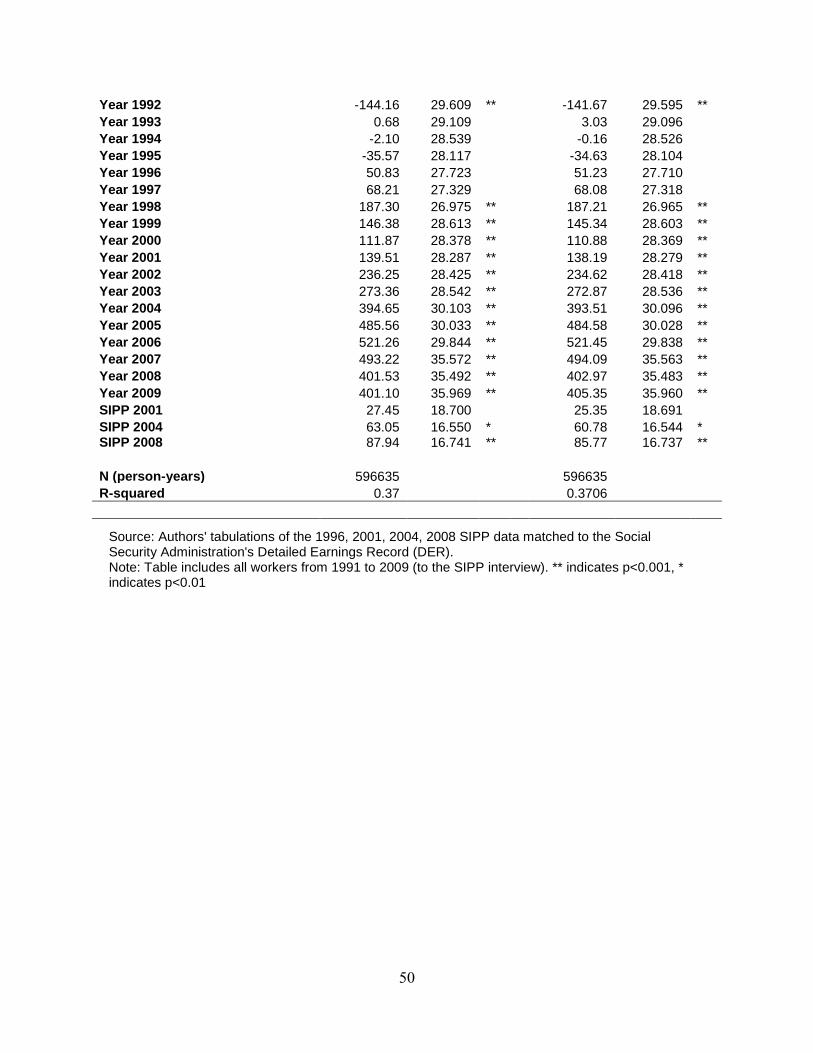
50
Year 1992 Year 1993 Year 1994 Year 1995 Year 1996 Year 1997 Year 1998 Year 1999 Year 2000 Year 2001 Year 2002 Year 2003 Year 2004 Year 2005 Year 2006 Year 2007 Year 2008 Year 2009 SIPP 2001 SIPP 2004 SIPP 2008
-144.16 0.68
-2.10 -35.57 50.83 68.21
187.30 146.38 111.87 139.51 236.25 273.36 394.65 485.56 521.26 493.22 401.53 401.10 27.45 63.05 87.94
29.609 29.109 28.539 28.117 27.723 27.329 26.975 28.613 28.378 28.287 28.425 28.542 30.103 30.033 29.844 35.572 35.492 35.969 18.700 16.550 16.741
** ** ** ** ** ** ** ** ** ** ** ** ** * **
-141.67 3.03
-0.16 -34.63 51.23 68.08
187.21 145.34 110.88 138.19 234.62 272.87 393.51 484.58 521.45 494.09 402.97 405.35 25.35 60.78 85.77
29.595 29.096 28.526 28.104 27.710 27.318 26.965 28.603 28.369 28.279 28.418 28.536 30.096 30.028 29.838 35.563 35.483 35.960 18.691 16.544 16.737
** ** ** ** ** ** ** ** ** ** ** ** ** * **
N (person-years) R-squared
596635
0.37
596635 0.3706
Source: Authors' tabulations of the 1996, 2001, 2004, 2008 SIPP data matched to the Social
Security Administration's Detailed Earnings Record (DER). Note: Table includes all workers from 1991 to 2009 (to the SIPP interview). ** indicates p<0.001, * indicates p<0.01

51
Table 11. Logistic Regression of the Likelihood of Wage Workers Investing DC Contributions in Stocks
and Salary
Parameter Estimate
Standard Error
Intercept Married Two earners Number of dependents Own a home Log of total earnings Become divorced this year Become widowed this year Get married this year Spouse contributes to a DC plan Spouse's contribution rate (contribution/earnings) Employer contributes to plan Have a DB plan Have a CB plan Currently work limited Spouse currently work limited Spouse begins to contribute to DC plan this year Can borrow from pension plan Number of work years since age 20 Age Age squared Year 2003 Year 2006 Year 2009 N -2 Log Likelihood
0.724
-0.051 -0.010 -0.007 0.023 0.060
-0.146 0.053 0.087 0.002
0.307 0.203
-0.047 -0.056 -0.002 -0.047
-0.087 0.239 0.007
-0.016 0.000 0.095
-0.048 0.002
42,294 44811
0.260 0.039 0.037 0.013 0.029 0.020 0.121 0.304 0.088 0.042
0.332 0.031 0.025 0.051 0.071 0.061
0.083 0.025 0.003 0.009 0.000 0.039 0.033 0.034
**
**
Source: Authors' tabulations of the 1996, 2001, 2004, 2008 SIPP data matched to the Social Security Administration's Detailed Earnings Record (DER). Note: Table includes all workers in the pension job who contributed to their 401(k) accounts in the SIPP pension interview year. ** indicates p<0.001, *
indicates p<0.01

52
Table 12. Logistic Regression of the Account Balances in Stocks
Likelihood of Investing Retirement
Parameter Estimate
Standard Error
Intercept Married Two earners Number of dependents Own a home Log of total earnings Become divorced this year Become widowed this year Get married this year Spouse contributes to a DC plan Spouse's contribution rate (contribution/earnings) Employer contributes to plan Have a DB plan Have a CB plan Currently work limited Spouse currently work limited Spouse begins to contribute to DC plan this year Can borrow from pension plan Number of work years since age 20 Age Age squared Year 2003 Year 2006 Year 2009 N -2 Log Likelihood
0.667
-0.006 -0.059 -0.017 0.242 0.029 0.042 0.394
-0.135 0.090
0.823 0.193
-0.048 0.172
-0.078 -0.026
-0.068 0.163 0.014
-0.003 -0.0002
0.341 0.549 0.107
58,993 60128
0.157 0.032 0.029 0.012 0.027 0.004 0.117 0.226 0.077 0.036
0.311 0.026 0.024 0.056 0.047 0.051
0.078 0.027 0.002 0.007
0.0001 0.035 0.029 0.028
** ** **
**
** ** ** ** *
Source: Authors' tabulations of the 1996, 2001, 2004, 2008 SIPP data matched to the Social Security Administration's Detailed Earnings Record (DER). Note: Table includes all workers with retirement account assets in the SIPP asset interview year. ** indicates p<0.001, * indicates p<0.01

53
Table 13. The Short-Run Impact of the Recession on Retirement Account Balances for Participants Ages 20 to 69 (in 2011 dollars) Accumulated Contributions 2007 through 2009 Baseline $7,658 Alternative Scenario 1 $7,868 Alternative Scenario 2 $7,947
Difference in Accumulated Contributions Between Baseline and Alternative Scenario ($) Alternative Scenario 1 $210 Alternative Scenario 2 $289 Difference in Accumulated Contributions Between Baseline and Alternative Scenario (%) Alternative Scenario 1 2.7% Alternative Scenario 2 3.8% Source: Authors' tabulations of the 1996, 2001, 2004, 2008 SIPP data matched to the Social
Security Administration's Detailed Earnings Record (DER). Note: Contributions are based on positive deferred contributions on the DER from 1990 to 2010. Alternative scenario 1 assumes that contributions in 2008 and 2009 remain at the 2007 level. Alternative scenario 2 assumes that contributions increase 1 percent each year after 2007.
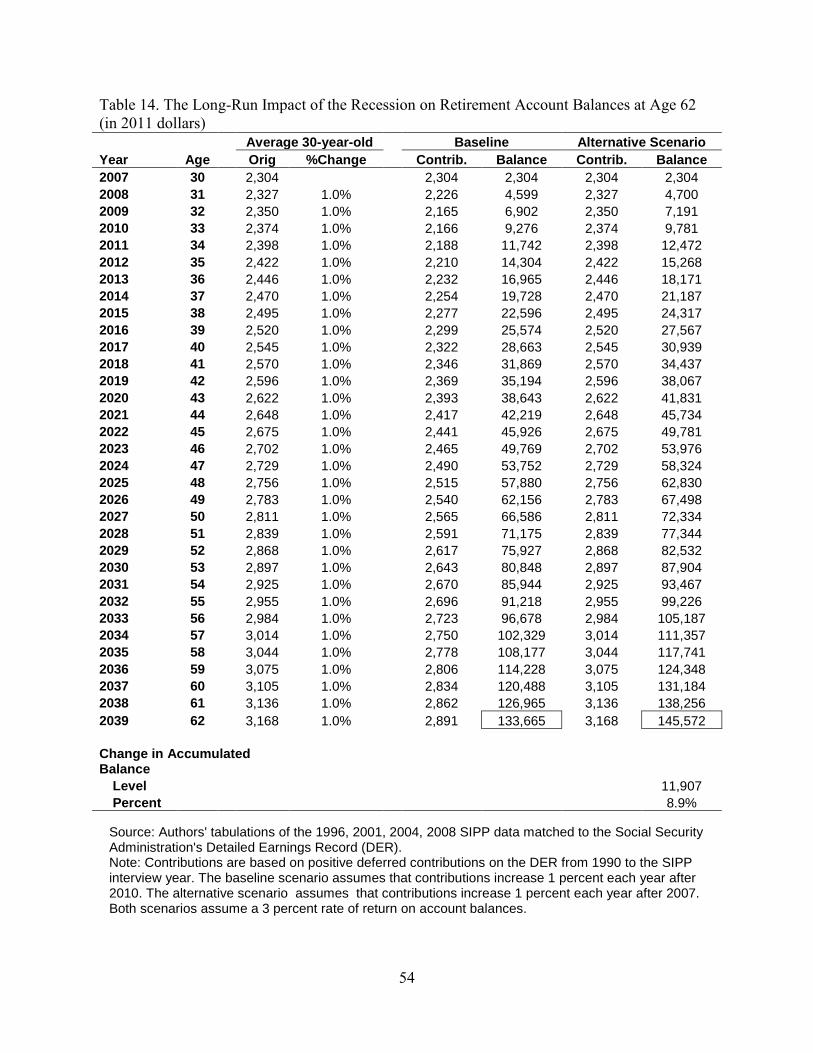
54
Table 14. The Long-Run Impact of the Recession on Retirement Account Balances at Age 62 (in 2011 dollars) Average 30-year-old Baseline Alternative Scenario Year Age Orig %Change Contrib. Balance Contrib. Balance 2007 30 2,304 2,304 2,304 2,304 2,304 2008 31 2,327 1.0% 2,226 4,599 2,327 4,700 2009 32 2,350 1.0% 2,165 6,902 2,350 7,191 2010 33 2,374 1.0% 2,166 9,276 2,374 9,781 2011 34 2,398 1.0% 2,188 11,742 2,398 12,472 2012 35 2,422 1.0% 2,210 14,304 2,422 15,268 2013 36 2,446 1.0% 2,232 16,965 2,446 18,171 2014 37 2,470 1.0% 2,254 19,728 2,470 21,187 2015 38 2,495 1.0% 2,277 22,596 2,495 24,317 2016 39 2,520 1.0% 2,299 25,574 2,520 27,567 2017 40 2,545 1.0% 2,322 28,663 2,545 30,939 2018 41 2,570 1.0% 2,346 31,869 2,570 34,437 2019 42 2,596 1.0% 2,369 35,194 2,596 38,067 2020 43 2,622 1.0% 2,393 38,643 2,622 41,831 2021 44 2,648 1.0% 2,417 42,219 2,648 45,734 2022 45 2,675 1.0% 2,441 45,926 2,675 49,781 2023 46 2,702 1.0% 2,465 49,769 2,702 53,976 2024 47 2,729 1.0% 2,490 53,752 2,729 58,324 2025 48 2,756 1.0% 2,515 57,880 2,756 62,830 2026 49 2,783 1.0% 2,540 62,156 2,783 67,498 2027 50 2,811 1.0% 2,565 66,586 2,811 72,334 2028 51 2,839 1.0% 2,591 71,175 2,839 77,344 2029 52 2,868 1.0% 2,617 75,927 2,868 82,532 2030 53 2,897 1.0% 2,643 80,848 2,897 87,904 2031 54 2,925 1.0% 2,670 85,944 2,925 93,467 2032 55 2,955 1.0% 2,696 91,218 2,955 99,226 2033 56 2,984 1.0% 2,723 96,678 2,984 105,187 2034 57 3,014 1.0% 2,750 102,329 3,014 111,357 2035 58 3,044 1.0% 2,778 108,177 3,044 117,741 2036 59 3,075 1.0% 2,806 114,228 3,075 124,348 2037 60 3,105 1.0% 2,834 120,488 3,105 131,184 2038 61 3,136 1.0% 2,862 126,965 3,136 138,256 2039 62 3,168 1.0% 2,891 133,665 3,168 145,572 Change in Accumulated Balance
Level 11,907 Percent 8.9%
Source: Authors' tabulations of the 1996, 2001, 2004, 2008 SIPP data matched to the Social Security
Administration's Detailed Earnings Record (DER). Note: Contributions are based on positive deferred contributions on the DER from 1990 to the SIPP interview year. The baseline scenario assumes that contributions increase 1 percent each year after 2010. The alternative scenario assumes that contributions increase 1 percent each year after 2007. Both scenarios assume a 3 percent rate of return on account balances.
RECENT WORKING PAPERS FROM THE CENTER FOR RETIREMENT RESEARCH AT BOSTON COLLEGE
Immigrant Networks and the Take-Up of Disability Programs: Evidence from U.S. Census Data Delia Furtado and Nikolaos Theodoropoulos, October 2012 Will Delayed Retirement by the Baby Boomers Lead to Higher Unemployment Among Younger Workers? Alicia H. Munnell and April Yanyuan Wu, October 2012 Growth in Health Consumption and Its Implications for Financing OASDI: An International Perspective Barry P. Bosworth and Gary Burtless, September 2012 Using Participant Data to Improve 401(k) Asset Allocation Zhenyu Li and Anthony Webb, September 2012 Job Demand and Early Retirement Sepideh Modrek and Mark R. Cullen, August 2012 Changes in Labor Force Participation of Older Americans and Their Pension Structures: A Policy Perspective Frank W. Heiland and Zhe Li, July 2012 How Would GASB Proposals Affect State and Local Pension Reporting? Alicia H. Munnell, Jean-Pierre Aubry, Joshua Hurwitz and Laura Quinby, June 2012 Borrow Less Tomorrow: Behavioral Approaches to Debt Reduction Dean Karlan and Jonathan Zinman, May 2012 Spousal Labor Market Effects from Government Health Insurance: Evidence from A Veterans Affairs Expansion Melissa A. Boyle and Joanna N. Lahey, April 2012 Measuring Social Security Proposals by More than Solvency: Impacts on Poverty, Progressivity, Horizontal Equity, and Work Incentives Melissa M. Favreault and C. Eugene Steuerle, April 2012 How Important Is Asset Allocation to Financial Security in Retirement? Alicia H. Munnell, Natalia Sergeyevna Orlova, and Anthony Webb, April 2012 Great Recession-Induced Early Claimers: Who Are They? How Much Do They Lose? Matthew S. Rutledge and Norma B. Coe, April 2012
All working papers are available on the Center for Retirement Research website (http://crr.bc.edu) and can be requested by e-mail ([email protected]) or phone (617-552-1762).


