6
8-Band Image Data Processing of the Worldview-2 Satellite in a Wide
Area of Applications
Cristina Tarantino, Maria Adamo, Guido Pasquariello, Francesco Lovergine, Palma Blonda and Valeria Tomaselli
National Council of Researches (CNR), Italy
1. Introduction
Recent years have seen advances in remote sensing in many fields with applications at a spatial scale which range from global to local. As a consequence, the need to observe the Earth with more specialized and sophisticated sensors and data analysis techniques to obtain more accurate information has increased. On the 8th October 2009 a new second next-generation Worldview-2 satellite was launched by DigitalGlobe: it represents the latest innovation among sensors for the acquisition of remote sensed imagery. It has an advanced agility due to control moment gyros (like Worldview-1) and combines an average revisiting time of 1.1 days around the globe with a large scale collection capacity. Moreover, it is also the first commercial satellite able to provide panchromatic imagery at 46 cm of spatial resolution and 8-band multispectral imagery at 1.84 m spatial resolution. In addition to the standard panchromatic and multispectral BLUE, GREEN, RED and NEAR INFRARED (NIR1) bands the Worldview-2 sensor has:
1. a shorter wavelength blue band, COASTAL, ranging from 400 to 450 nm, planned for bathymetric studies, for water color analyses and substantially influenced by atmospheric scattering;
2. a YELLOW band, ranging from 585 to 625 nm, significant for the “Yellowness” of vegetation both on land and water;
3. a RED EDGE band, ranging from 705 to 745 nm, strategically centered at the onset of the high reflectivity portion of vegetation response so potentially significant in the measurement of plant health;
4. a longer wavelength NEAR INFRARED band (NIR2), ranging from 860 to 1040 nm, partially overlapping the NIR1 band and sensitive to atmospheric water vapor absorption.
In literature, many studies deal with the use of the add on bands of the Worldview-2 sensor with respect to the traditional bands of the most common commercial satellites searching for new indexes in different application fields such as bathymetry [1], or vegetation and agricultural purposes ([2], [3]). In [4] the authors analyze the high correlation among some bands of the Worldview-2, like COASTAL and BLUE bands or
www.intechopen.com

Earth Observation
138
NIR1 and NIR2 bands which could mean redundant and useless information associated with some of the add on bands.
The aim of this work is the study of the performance of the whole spectral information
offered by the Worldview-2 sensor for the characterization and the classification of some
selected land cover targets. Three main land cover targets were recognized: "Water”, “Bare
lands” and “Vegetated lands”. The Worldview-2 image was, firstly, used for a finer
discrimination of different sub-classes on the ground belonging to the land cover targets
with the application of an unsupervised approach and the help of a certified CORINE-like
Land Use Map, at a 1:10.000 scale. A hyperspectral image acquired by the airborne MIVIS
sensor was used to analyze the spectral profiles characterizing each distinct sub-class. Then
a standard Maximum Likelihood classifier was applied to the Worldview-2 image with
different input configurations as below:
1. the 4 bands (R,G,B,NIR1) common to the standard commercial multispectral sensors at
very high spatial resolution;
2. the 4 bands R,G,B,NIR1 adding on, one at a time, the new bands;
3. the new complete configuration with 8 spectral bands.
The accuracy of the classification map was estimated using a set of test fields randomly
selected on the ground truth map.
ITT ENVI© and GRASS software were used to analyze and process data.
2. The Worldview-2 data
The data set analyzed was a Worldview-2 image granted by DigitalGlobe over an area of
100 km2 chosen by the authors among the available archive acquisitions. The scene, acquired
on the 13th June 2010, includes the region known as the “Natural Oasis of Lago Salso”, an
area essentially wet and marshy, sited in the south-east of the Capitanata in the Apulia
Region, Italy. The Natural Oasis of Lago Salso is characterized by the presence of a wetland
of considerable importance (one of the most important in southern Italy) as a breeding and
step birds station. The area falls in the Natura 2000 network, found within the boundaries of
the Site of Community Interest (SCI) IT 9110005 “Zone umide della Capitanata” and of the
Special Protection Area (SPA) IT9110038 “Paludi presso il Golfo di Manfredonia”. The
Natural Oasis of Lago Salso falls also within the Gargano National Park. The Natural Oasis
has an extent of about 1040 ha and only 500 ha are wetland “sensu strictu”, the remaining
part is covered by cultivated or partially abandoned areas. Agricultural areas cover a wide
surface formerly occupied by coastal lagoons (until the 1950s) and subsequently buried and
used for agricultural purposes. SCI and SPA have an extent, respectively, of 14,109 ha and
14,437 ha. Water bodies are subject to fluctuations of water levels over the year, creating
ecological gradients due to the variation of salt rates and moisture in soil. Soil salinity
gradually increases with soil elevation, reaching a maximum just above mean high sea level
(MHSL). Above the MHSL, the salinity tends to decrease due to progressively less frequent
flooding. The zonation of the vegetation of salt marshes is typically associated with the
tolerance to these ecological gradients.
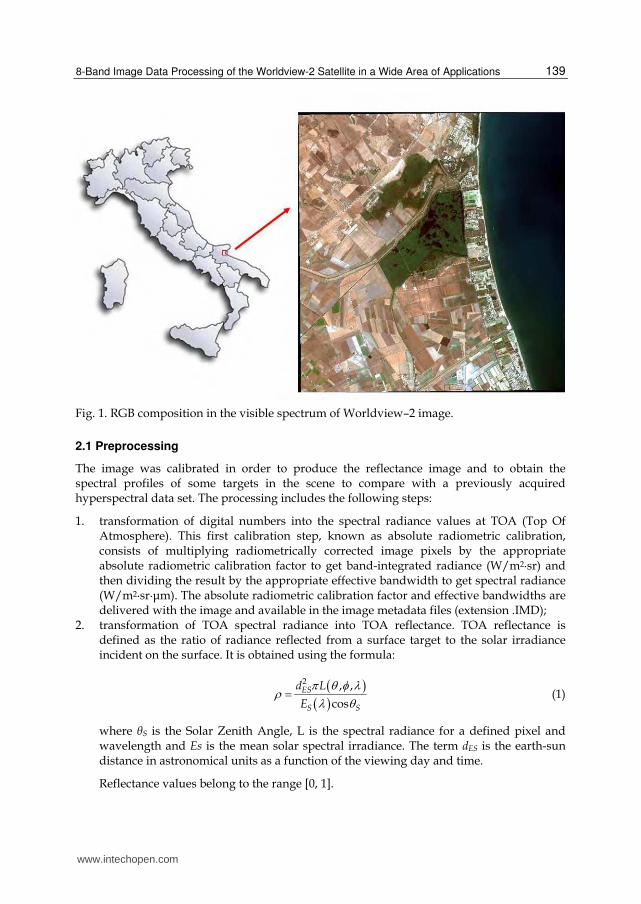
Figure 1 shows an RGB composition in the visible spectrum of the Worldview-2 image.
www.intechopen.com
8-Band Image Data Processing of the Worldview-2 Satellite in a Wide Area of Applications
139
Fig. 1. RGB composition in the visible spectrum of Worldview–2 image.
2.1 Preprocessing
The image was calibrated in order to produce the reflectance image and to obtain the spectral profiles of some targets in the scene to compare with a previously acquired hyperspectral data set. The processing includes the following steps:
1. transformation of digital numbers into the spectral radiance values at TOA (Top Of Atmosphere). This first calibration step, known as absolute radiometric calibration, consists of multiplying radiometrically corrected image pixels by the appropriate absolute radiometric calibration factor to get band-integrated radiance (W/m2·sr) and then dividing the result by the appropriate effective bandwidth to get spectral radiance (W/m2·sr·μm). The absolute radiometric calibration factor and effective bandwidths are delivered with the image and available in the image metadata files (extension .IMD);
2. transformation of TOA spectral radiance into TOA reflectance. TOA reflectance is defined as the ratio of radiance reflected from a surface target to the solar irradiance incident on the surface. It is obtained using the formula:
2 , ,
cosES
S S
d L
E
(1)
where θS is the Solar Zenith Angle, L is the spectral radiance for a defined pixel and wavelength and Es is the mean solar spectral irradiance. The term dES is the earth-sun distance in astronomical units as a function of the viewing day and time.
Reflectance values belong to the range [0, 1].
www.intechopen.com

Earth Observation
140
3. Selection and characterization of targets
An existing certified CORINE-like land use map at 1:10000 scale [5] was considered as ground truth. The map was produced in 2006. It originally showed a set of 40 land use thematic classes: after a first screening only land cover classes were selected. An unsupervised analysis was used to cluster the EO data into a certain number of spectrally different signatures. To accomplish this task the “K-Means” algorithm was considered and the 8 bands of the Worldview-2 image were used as input. After a few attempts, a number of 20 unlabelled classes (with a maximum number of 50 iterations until the convergence and 1% as the change threshold to end the iterative process) were selected. Comparing the clusters with the ground truth information resulted in the splitting/merging of certain classes, for a total number of 18 land cover classes. As shown in Figure 2 where a bathymetry map of the test site is represented, the 8 band segmented map reports 3 differentiated clusters in correspondence with the ground truth class labeled as “Sea”. These three different signatures could be associated with different depth values of the sea.
Fig. 2. Bathymetric map (a) and 8-band segmented map (b).
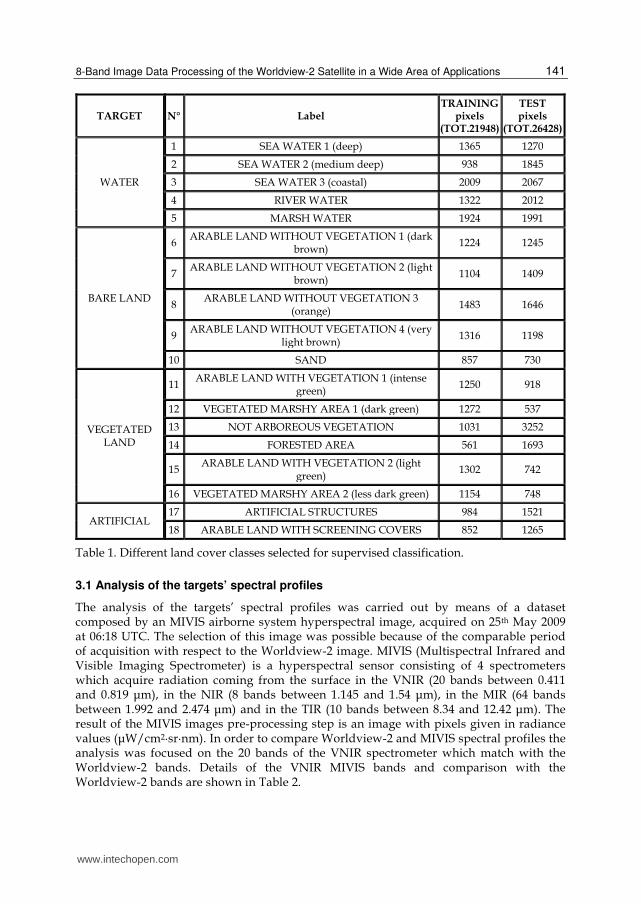
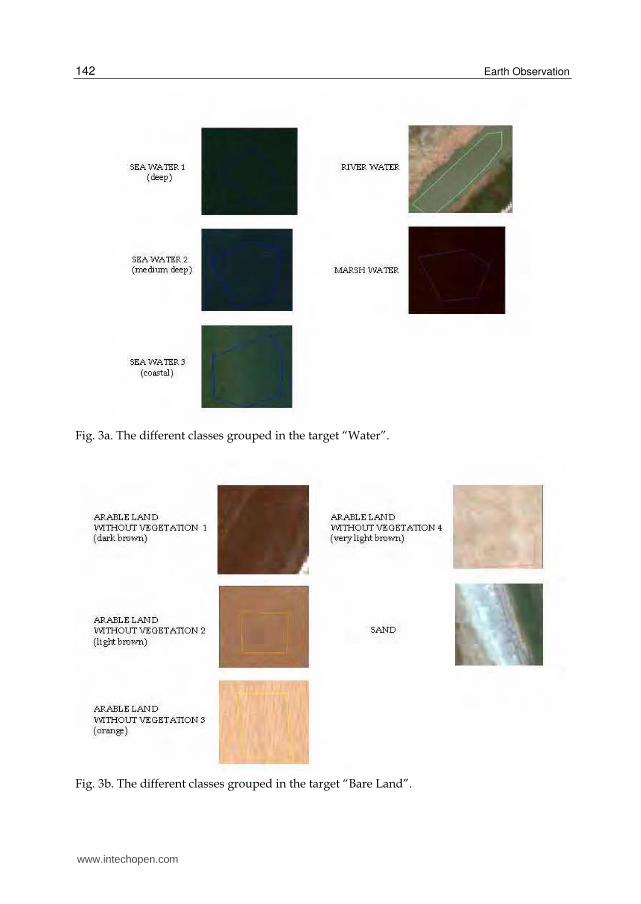
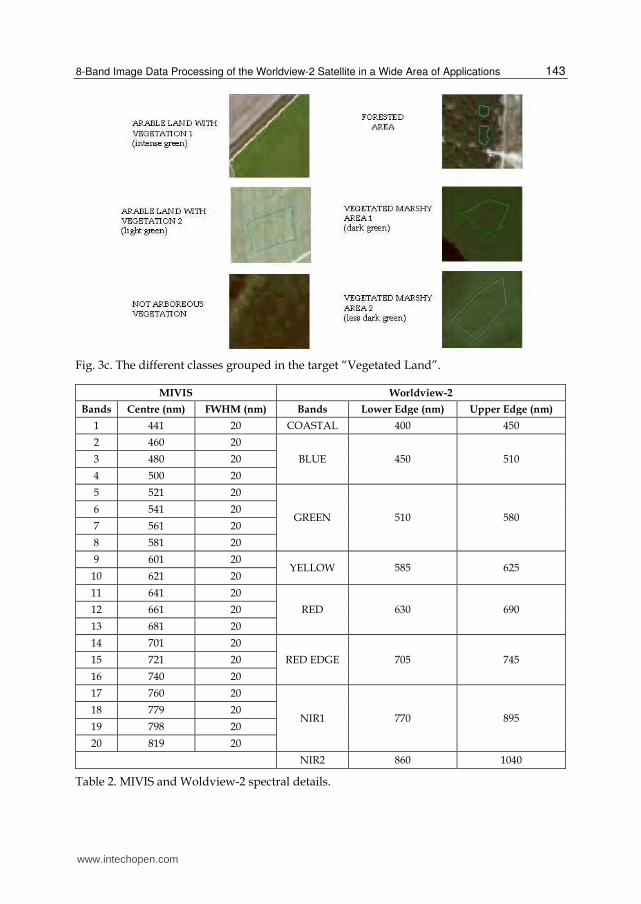
The 18 selected classes, grouped into 4 main land cover targets of interest were “Water”, “Bare lands”, “Vegetated lands” and “Artificial”, as shown in Table 1. The target “Artificial” was eliminated due to its poor presence in the scene. A sample of each considered class is shown in Figure 3.
www.intechopen.com
8-Band Image Data Processing of the Worldview-2 Satellite in a Wide Area of Applications
141
TARGET N° Label TRAINING
pixels (TOT.21948)
TEST pixels
(TOT.26428)
WATER
1 SEA WATER 1 (deep) 1365 1270
2 SEA WATER 2 (medium deep) 938 1845
3 SEA WATER 3 (coastal) 2009 2067
4 RIVER WATER 1322 2012
5 MARSH WATER 1924 1991
BARE LAND
6ARABLE LAND WITHOUT VEGETATION 1 (dark
brown) 1224 1245
7ARABLE LAND WITHOUT VEGETATION 2 (light
brown)1104 1409
8ARABLE LAND WITHOUT VEGETATION 3
(orange)1483 1646
9ARABLE LAND WITHOUT VEGETATION 4 (very
light brown)1316 1198
10 SAND 857 730
VEGETATED LAND
11ARABLE LAND WITH VEGETATION 1 (intense
green) 1250 918
12 VEGETATED MARSHY AREA 1 (dark green) 1272 537
13 NOT ARBOREOUS VEGETATION 1031 3252
14 FORESTED AREA 561 1693
15ARABLE LAND WITH VEGETATION 2 (light
green) 1302 742
16 VEGETATED MARSHY AREA 2 (less dark green) 1154 748
ARTIFICIAL 17 ARTIFICIAL STRUCTURES 984 1521
18 ARABLE LAND WITH SCREENING COVERS 852 1265
Table 1. Different land cover classes selected for supervised classification.
3.1 Analysis of the targets’ spectral profiles
The analysis of the targets’ spectral profiles was carried out by means of a dataset composed by an MIVIS airborne system hyperspectral image, acquired on 25th May 2009 at 06:18 UTC. The selection of this image was possible because of the comparable period of acquisition with respect to the Worldview-2 image. MIVIS (Multispectral Infrared and Visible Imaging Spectrometer) is a hyperspectral sensor consisting of 4 spectrometers which acquire radiation coming from the surface in the VNIR (20 bands between 0.411 and 0.819 μm), in the NIR (8 bands between 1.145 and 1.54 μm), in the MIR (64 bands between 1.992 and 2.474 μm) and in the TIR (10 bands between 8.34 and 12.42 μm). The result of the MIVIS images pre-processing step is an image with pixels given in radiance values (μW/cm2·sr·nm). In order to compare Worldview-2 and MIVIS spectral profiles the analysis was focused on the 20 bands of the VNIR spectrometer which match with the Worldview-2 bands. Details of the VNIR MIVIS bands and comparison with the Worldview-2 bands are shown in Table 2.
www.intechopen.com
Earth Observation
142
Fig. 3a. The different classes grouped in the target “Water”.
Fig. 3b. The different classes grouped in the target “Bare Land”.
www.intechopen.com
8-Band Image Data Processing of the Worldview-2 Satellite in a Wide Area of Applications
143
Fig. 3c. The different classes grouped in the target “Vegetated Land”.
MIVIS Worldview-2
Bands Centre (nm) FWHM (nm) Bands Lower Edge (nm) Upper Edge (nm)
1 441 20 COASTAL 400 450
2 460 20
BLUE 450 510 3 480 20
4 500 20
5 521 20
GREEN 510 580 6 541 20
7 561 20
8 581 20
9 601 20YELLOW 585 625
10 621 20
11 641 20
RED 630 690 12 661 20
13 681 20
14 701 20
RED EDGE 705 745 15 721 20
16 740 20
17 760 20
NIR1 770 895 18 779 20
19 798 20
20 819 20
NIR2 860 1040
Table 2. MIVIS and Woldview-2 spectral details.
www.intechopen.com
Earth Observation
144
Because of its flexible airborne platform for remote sensing, the MIVIS system is able to acquire images with a good spatial resolution. The MIVIS acquisition used for this analysis was made at a height of 1.5 Km so the spatial resolution is 3 m at nadir. In order to compare MIVIS spectra with those produced by Worldview-2, the pixel values of MIVIS images were also converted into reflectance.
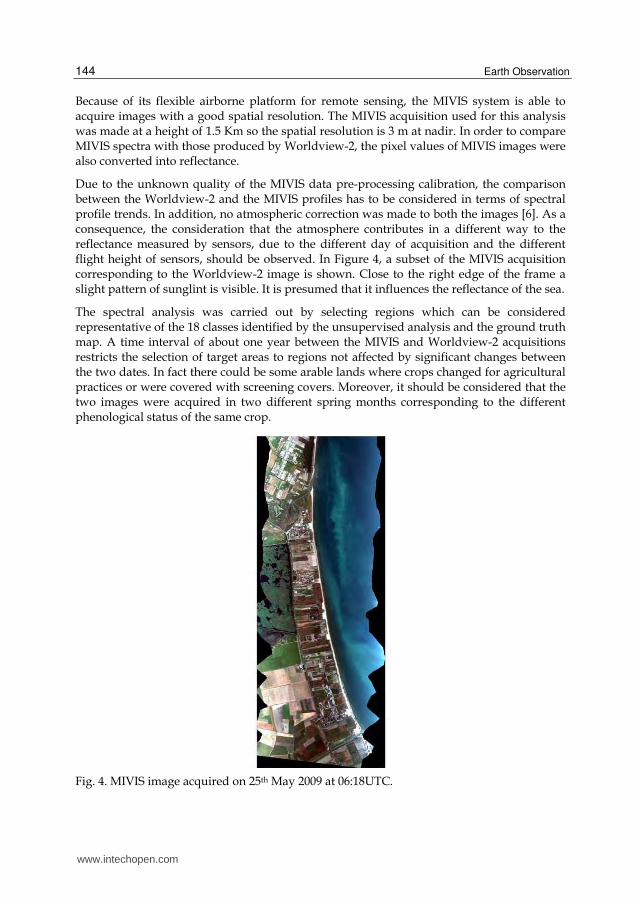
Due to the unknown quality of the MIVIS data pre-processing calibration, the comparison between the Worldview-2 and the MIVIS profiles has to be considered in terms of spectral profile trends. In addition, no atmospheric correction was made to both the images [6]. As a consequence, the consideration that the atmosphere contributes in a different way to the reflectance measured by sensors, due to the different day of acquisition and the different flight height of sensors, should be observed. In Figure 4, a subset of the MIVIS acquisition corresponding to the Worldview-2 image is shown. Close to the right edge of the frame a slight pattern of sunglint is visible. It is presumed that it influences the reflectance of the sea.
The spectral analysis was carried out by selecting regions which can be considered representative of the 18 classes identified by the unsupervised analysis and the ground truth map. A time interval of about one year between the MIVIS and Worldview-2 acquisitions restricts the selection of target areas to regions not affected by significant changes between the two dates. In fact there could be some arable lands where crops changed for agricultural practices or were covered with screening covers. Moreover, it should be considered that the two images were acquired in two different spring months corresponding to the different phenological status of the same crop.
Fig. 4. MIVIS image acquired on 25th May 2009 at 06:18UTC.
www.intechopen.com

8-Band Image Data Processing of the Worldview-2 Satellite in a Wide Area of Applications
145
In Figure 5, Worldview-2 (top) and MIVIS (bottom) water target spectral profiles are shown. As it can be noticed for all the target profiles, there is an atmospheric contribution to the Worldview-2 reflectance. In particular, in the range of shorter wavelengths of the COASTAL and the BLUE bands, the Rayleigh scattering is the prevailing contribution while for the longer wavelengths, like the NIR2 band, the water vapor absorption is dominant. The gaseous absorption results as visible also for the MIVIS profiles. It can be noted that:
- “Sea Water 1”, “Sea Water 2” and “Sea Water 3” correspond to: deep water (far from the coast), intermediate deep water and coastal water, respectively. The Worldview-2 reflectance profiles, which tend to converge at shorter wavelengths due to atmospheric effects, show increasing reflectance values for sea regions closer to the coast due to the increasing contribution of suspended sediments [7];
- this behavior is not evident in MIVIS spectral profiles because of the presence of a slight sunglint contribution which implies an increase of reflectance values in the eastern part of the image. This portion of the image corresponds to a sea region with a high and intermediate depth. The presence of glint is also evident when considering the spectral profiles which show the typical solar irradiance trend;
Fig. 5. Worldview-2 (top) and MIVIS (bottom) spectral profiles of water classes.
- “Sea Water 3” and “River Water” MIVIS spectral profiles are characterized by particulate material and/or a land-derived yellow substance which can influence the reflectance [8];
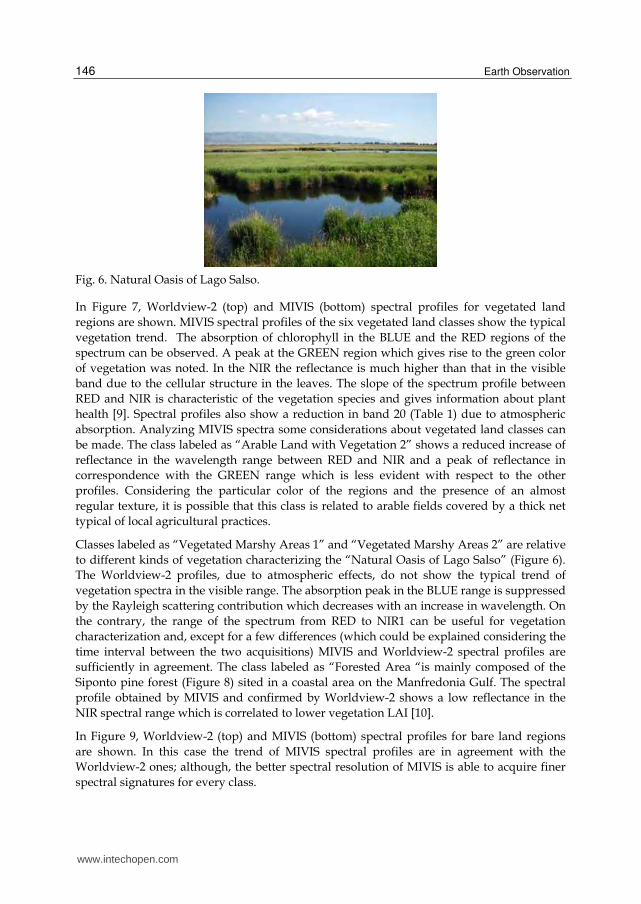
- with regard to the “Marsh Water” classified regions, they are relative to a series of waterbodies alternating with different kinds of vegetated areas belonging to the Natural Oasis of Lago Salso (Figure 6). Specifically, it encompasses three waterbodies with depths ranging from 50 to 170 cm, depending on the seasonal level and the regional operational necessities which are fed by a small river. This class shows a spectral profile which starts to be strongly affected by the bottom vegetation contribution.
www.intechopen.com
Earth Observation
146
Fig. 6. Natural Oasis of Lago Salso.
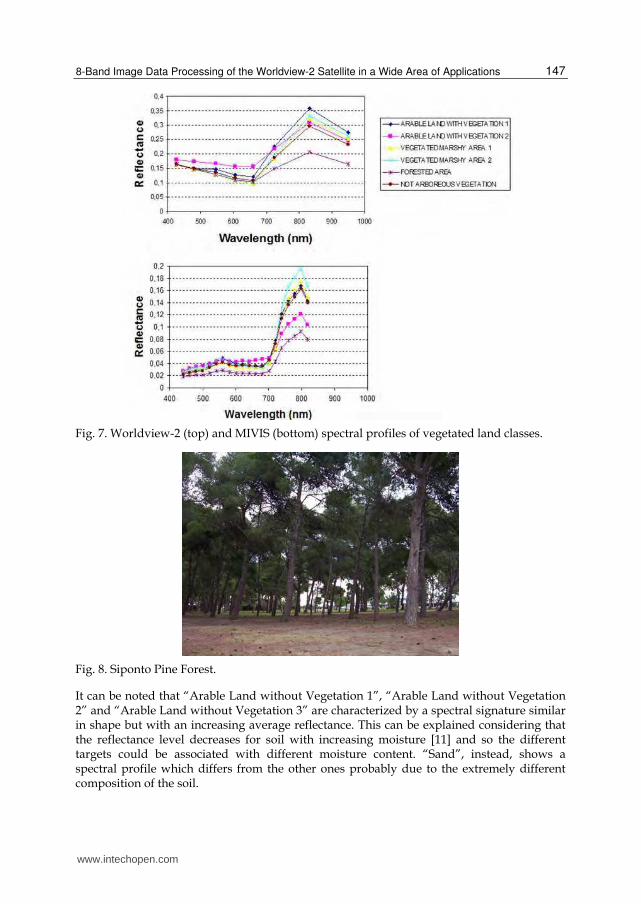
In Figure 7, Worldview-2 (top) and MIVIS (bottom) spectral profiles for vegetated land
regions are shown. MIVIS spectral profiles of the six vegetated land classes show the typical
vegetation trend. The absorption of chlorophyll in the BLUE and the RED regions of the
spectrum can be observed. A peak at the GREEN region which gives rise to the green color
of vegetation was noted. In the NIR the reflectance is much higher than that in the visible
band due to the cellular structure in the leaves. The slope of the spectrum profile between
RED and NIR is characteristic of the vegetation species and gives information about plant
health [9]. Spectral profiles also show a reduction in band 20 (Table 1) due to atmospheric
absorption. Analyzing MIVIS spectra some considerations about vegetated land classes can
be made. The class labeled as “Arable Land with Vegetation 2” shows a reduced increase of
reflectance in the wavelength range between RED and NIR and a peak of reflectance in
correspondence with the GREEN range which is less evident with respect to the other
profiles. Considering the particular color of the regions and the presence of an almost
regular texture, it is possible that this class is related to arable fields covered by a thick net
typical of local agricultural practices.
Classes labeled as “Vegetated Marshy Areas 1” and “Vegetated Marshy Areas 2” are relative
to different kinds of vegetation characterizing the “Natural Oasis of Lago Salso” (Figure 6).
The Worldview-2 profiles, due to atmospheric effects, do not show the typical trend of
vegetation spectra in the visible range. The absorption peak in the BLUE range is suppressed
by the Rayleigh scattering contribution which decreases with an increase in wavelength. On
the contrary, the range of the spectrum from RED to NIR1 can be useful for vegetation
characterization and, except for a few differences (which could be explained considering the
time interval between the two acquisitions) MIVIS and Worldview-2 spectral profiles are
sufficiently in agreement. The class labeled as “Forested Area “is mainly composed of the
Siponto pine forest (Figure 8) sited in a coastal area on the Manfredonia Gulf. The spectral
profile obtained by MIVIS and confirmed by Worldview-2 shows a low reflectance in the
NIR spectral range which is correlated to lower vegetation LAI [10].
In Figure 9, Worldview-2 (top) and MIVIS (bottom) spectral profiles for bare land regions
are shown. In this case the trend of MIVIS spectral profiles are in agreement with the
Worldview-2 ones; although, the better spectral resolution of MIVIS is able to acquire finer
spectral signatures for every class.
www.intechopen.com
8-Band Image Data Processing of the Worldview-2 Satellite in a Wide Area of Applications
147
Fig. 7. Worldview-2 (top) and MIVIS (bottom) spectral profiles of vegetated land classes.
Fig. 8. Siponto Pine Forest.
It can be noted that “Arable Land without Vegetation 1”, “Arable Land without Vegetation 2” and “Arable Land without Vegetation 3” are characterized by a spectral signature similar in shape but with an increasing average reflectance. This can be explained considering that the reflectance level decreases for soil with increasing moisture [11] and so the different targets could be associated with different moisture content. “Sand”, instead, shows a spectral profile which differs from the other ones probably due to the extremely different composition of the soil.
www.intechopen.com

Earth Observation
148
Fig. 9. Worldview-2 (top) and MIVIS (bottom) spectral profiles of Bare Land classes.
4. Processing, results and discussion
For the supervised analysis, the standard statistic “Maximum Likelihood” (ML) algorithm was considered. The 18 classes of table 1, recognized on the scene with the guide of the segmentation step and better characterized with the help of MIVIS data, were selected. Randomly selected training (TR) and test (TE) sets were used respectively to train the algorithm and to assess the accuracy of the produced maps. For the accuracy of all the classes, the Overall Accuracy percentage (OA%) (i.e. number of correctly classified pixels divided by the total of pixels) with the estimation of the relative confidence interval with a significance of 95% [12] as computed. For the accuracy of each class, the Mapping Accuracy percentage (MA%), [13], [14], was computed. It is defined as:
% 100correctlyclassified
correctlyclassified omission commission
pixelsMA
pixels pixels pixels (2)
where:
pixelsomission is the number of pixels assigned to other classes along the row of the confusion matrix relevant to the class considered;
pixelscommission is the number of pixels assigned to other classes along the column of the confusion matrix relevant to the class considered.
According to [15], many input configurations to the classifier were tested considering, firstly, the standard 4 spectral bands of the image and then adding a fifth band among the 4 add on bands of Worldview-2 in order to analyze the specific contribution of each band.
www.intechopen.com
8-Band Image Data Processing of the Worldview-2 Satellite in a Wide Area of Applications
149
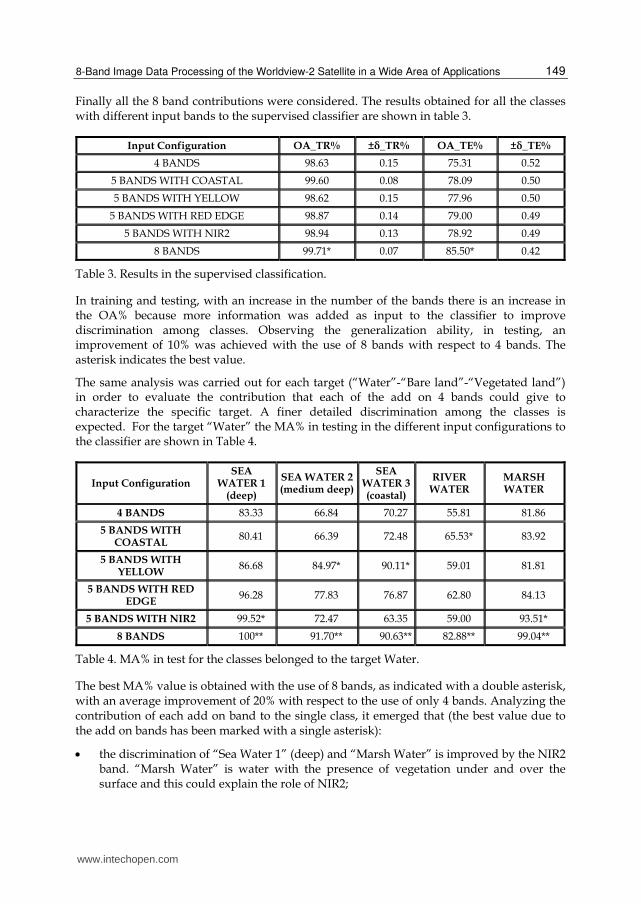
Finally all the 8 band contributions were considered. The results obtained for all the classes with different input bands to the supervised classifier are shown in table 3.
Input Configuration OA_TR% ±δ_TR% OA_TE% ±δ_TE%
4 BANDS 98.63 0.15 75.31 0.52
5 BANDS WITH COASTAL 99.60 0.08 78.09 0.50
5 BANDS WITH YELLOW 98.62 0.15 77.96 0.50
5 BANDS WITH RED EDGE 98.87 0.14 79.00 0.49
5 BANDS WITH NIR2 98.94 0.13 78.92 0.49
8 BANDS 99.71* 0.07 85.50* 0.42
Table 3. Results in the supervised classification.
In training and testing, with an increase in the number of the bands there is an increase in the OA% because more information was added as input to the classifier to improve discrimination among classes. Observing the generalization ability, in testing, an improvement of 10% was achieved with the use of 8 bands with respect to 4 bands. The asterisk indicates the best value.
The same analysis was carried out for each target (“Water”-“Bare land”-“Vegetated land”) in order to evaluate the contribution that each of the add on 4 bands could give to characterize the specific target. A finer detailed discrimination among the classes is expected. For the target “Water” the MA% in testing in the different input configurations to the classifier are shown in Table 4.
Input Configuration SEA
WATER 1 (deep)
SEA WATER 2(medium deep)
SEA WATER 3(coastal)
RIVER WATER
MARSH WATER
4 BANDS 83.33 66.84 70.27 55.81 81.86
5 BANDS WITH COASTAL
80.41 66.39 72.48 65.53* 83.92
5 BANDS WITH YELLOW
86.68 84.97* 90.11* 59.01 81.81
5 BANDS WITH RED EDGE
96.28 77.83 76.87 62.80 84.13
5 BANDS WITH NIR2 99.52* 72.47 63.35 59.00 93.51*
8 BANDS 100** 91.70** 90.63** 82.88** 99.04**
Table 4. MA% in test for the classes belonged to the target Water.
The best MA% value is obtained with the use of 8 bands, as indicated with a double asterisk, with an average improvement of 20% with respect to the use of only 4 bands. Analyzing the contribution of each add on band to the single class, it emerged that (the best value due to the add on bands has been marked with a single asterisk):
the discrimination of “Sea Water 1” (deep) and “Marsh Water” is improved by the NIR2 band. “Marsh Water” is water with the presence of vegetation under and over the surface and this could explain the role of NIR2;
www.intechopen.com

Earth Observation
150
the discrimination of “Sea Water2 ” (medium deep) and “Sea Water 3” (coastal) is improved by the YELLOW band that appears to be able to recognize water with hanging deposits;
the discrimination of “River Water”, substantially muddy water, is improved by the COASTAL band which appears able to recognize a mixture of water and mud.
For the target “Bare land”, the MA% in testing in the different input configurations to the classifier are shown in Table 5.
Input Configuration
ARABLE LAND WITHOUT
VEGETATION 1(dark brown)
ARABLE LAND WITHOUT
VEGETATION 2(light brown)
ARABLE LAND WITHOUT
VEGETATION 3(orange)
ARABLE LAND WITHOUT
VEGETATION 4 (very light brown)
SAND
4 BANDS 80.84 38.62 48.72 55.20 39.10
5 BANDS WITH
COASTAL 75.05 38.08 49.48 58.74 41.40*
5 BANDS WITH
YELLOW 81.31* 50.53* 48.51 56.31 39.07
5 BANDS WITH RED
EDGE 78.71 49.78 55.96* 60.28 40.71
5 BANDS WITH NIR2
80.55 50.17 55.99* 65.01** 39.16
8 BANDS 86.15** 57.67** 61.17** 64.10 44.24**
Table 5. MA% in test for the classes belonged to the target Bare Land.
For all the different spectral signatures, the best MA% value is obtained with the use of 8 bands, as indicated with a double asterisk, with an average improvement of 10% with respect to the use of only 4 bands. The class “Arable Land without Vegetation 4” is an exception which can be justified by a high misclassification with the class “Arable Land without Vegetation 3”. Analyzing the contribution of each add on band to the single class, it emerged that (the best value due to the add on bands has been marked with a single asterisk):
the discrimination of “Arable Land without Vegetation 1" (dark brown) and “Arable Land without Vegetation 2" (light brown) is improved by the YELLOW band;
the discrimination of “Arable Land without Vegetation 3” (orange) is improved by the NIR2 band and by the RED EDGE, whereas “Arable Land without Vegetation 4” (very light brown) is improved only by the NIR2 band;
the discrimination of “Sand” is improved by the COASTAL band.
The different spectral profiles could be explained by the different pedological composition of soil or its different water content. For the “Vegetated land” target, the MA% test classification values obtained with different input bands are shown in Table 6.
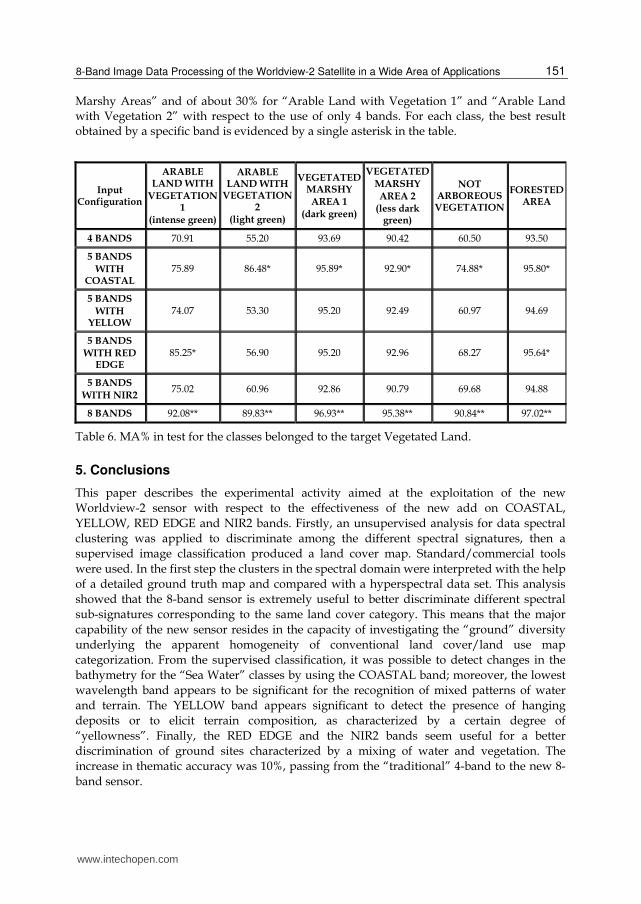
The best MA% value is obtained with 8 bands, as evidenced by a double asterisk in the table, with an average improvement of about 3% for “Forested Area” and “Vegetated
www.intechopen.com
8-Band Image Data Processing of the Worldview-2 Satellite in a Wide Area of Applications
151
Marshy Areas” and of about 30% for “Arable Land with Vegetation 1” and “Arable Land with Vegetation 2” with respect to the use of only 4 bands. For each class, the best result obtained by a specific band is evidenced by a single asterisk in the table.
Input Configuration
ARABLE LAND WITH
VEGETATION1
(intense green)
ARABLE LAND WITH
VEGETATION2
(light green)
VEGETATED MARSHY AREA 1
(dark green)
VEGETATED MARSHY AREA 2
(less dark green)
NOT ARBOREOUS VEGETATION
FORESTED AREA
4 BANDS 70.91 55.20 93.69 90.42 60.50 93.50
5 BANDS WITH
COASTAL 75.89 86.48* 95.89* 92.90* 74.88* 95.80*
5 BANDS WITH
YELLOW 74.07 53.30 95.20 92.49 60.97 94.69
5 BANDS WITH RED
EDGE 85.25* 56.90 95.20 92.96 68.27 95.64*
5 BANDS WITH NIR2
75.02 60.96 92.86 90.79 69.68 94.88
8 BANDS 92.08** 89.83** 96.93** 95.38** 90.84** 97.02**
Table 6. MA% in test for the classes belonged to the target Vegetated Land.
5. Conclusions
This paper describes the experimental activity aimed at the exploitation of the new
Worldview-2 sensor with respect to the effectiveness of the new add on COASTAL,
YELLOW, RED EDGE and NIR2 bands. Firstly, an unsupervised analysis for data spectral
clustering was applied to discriminate among the different spectral signatures, then a
supervised image classification produced a land cover map. Standard/commercial tools
were used. In the first step the clusters in the spectral domain were interpreted with the help
of a detailed ground truth map and compared with a hyperspectral data set. This analysis
showed that the 8-band sensor is extremely useful to better discriminate different spectral
sub-signatures corresponding to the same land cover category. This means that the major
capability of the new sensor resides in the capacity of investigating the “ground” diversity
underlying the apparent homogeneity of conventional land cover/land use map
categorization. From the supervised classification, it was possible to detect changes in the
bathymetry for the “Sea Water” classes by using the COASTAL band; moreover, the lowest
wavelength band appears to be significant for the recognition of mixed patterns of water
and terrain. The YELLOW band appears significant to detect the presence of hanging
deposits or to elicit terrain composition, as characterized by a certain degree of
“yellowness”. Finally, the RED EDGE and the NIR2 bands seem useful for a better
discrimination of ground sites characterized by a mixing of water and vegetation. The
increase in thematic accuracy was 10%, passing from the “traditional” 4-band to the new 8-
band sensor.
www.intechopen.com
Earth Observation
152
6. Acknowledgements
This work was supported by the project “Flight Risks Mitigation and Nowcasting at Airports” (RIVONA) funded by the Apulia Region, POFESR 2007-2013.
The authors want to thank DigitalGlobe for having offered the opportunity to analyze images from the newest Worldview-2 sensor.
Special acknowledgements to Planetek Italia s.r.l. for supplying the MIVIS data set.
7. References
[1] Bramante, J. F.; Raju, D. K. & Tsai Min S., Derivation of bathymetry from multispectral imagery in the highly turbid waters of Singapore’s south islands: A comparative study, DigitalGlobe 8-Band Research Challenge 2010, Available from: http://www.digitalglobe.com/downloads/8bc/8band_Challenge_TMSI.pdf.
[2] Ozdemir, I.; Karnieli, A. (2011), Predicting forest structural parameters using the image texture derived from WorldView-2 multispectral imagery in a dryland forest, Israel, Int. Journal of Appl. Earth Observation and Geoinformation, Volume 13, Issue 5, Pages 701-710.
[3] Borel, C. C., Vegetative canopy parameter retrieval using 8-band data, DigitalGlobe 8-Band Research Challenge 2010, Available from: http://www.digitalglobe.com/downloads/8bc/borel_8band_paper_12_14_10.pdf.
[4] Peroni, G.; Gachelin, J.P.; Saint-Pol, M., Legoff, V.; Fontanot, F. & Sannier C. (2010), New spectral data available for the controls in agriculture (CWRS) and for vegetation monitoring, Proc. Of the 16th GeoCAP Annual Conference.
[5] GIS Apulia Region, Italy, , Available from: http://www.sit.Apulia.it/ [6] Baraldi, A. (2009), Impact of radiometric calibration and specifications of spaceborne
optical imaging sensors on the development of operational automatic remote sensing image understanding systems, IEEE Journal of Selected Topics in Applied Earth Observations and Remote Sensing, Vol. 2, No.2.
[7] Stramski, D.; Wozniak, S. B. & Flatau, P. J. (2004), Optical properties of Asian mineral dust suspended in seawater, Limnol. Oceanogr.
[8] Robinson, I.S. (2004), Measuring the Oceans from Space - The principles and methods of satellite oceanography, Springer.
[9] Govender, M.; Chetty, K. & Bulcock, H. (2007), A review of hyperspectral remote sensing and its application in vegetation and water resource studies, Water SA, 33(2), 1–8.
[10] Schlerf, M.; Atzberger, C. & Hill J. (2005), Remote sensing of forest biophysical variables using HyMap imaging spectrometer data, Remote Sens. Environ. 95, 177-194.
[11] Bowers, S.A. & Hanks, A.J. , Reflection of radiant energy from soil, Soil Science, 100: 130. [12] Baraldi, A.; Puzzolo, V.; Blonda, P.; Bruzzone, L. & Tarantino C. (2006), Automatic
Spectral Rule-based Preliminary Mapping of Calibrated Landsat TM and ETM+ Images, IEEE Trans. On Geoscience and Remote Sensing, Vol. 44, No. 9.
[13] Short, N.M., The Remote Sensing Tutorial, NASA, Available from http://rst.gsfc.nasa.gov.
[14] Congalton, R. & Green K. (1999), Assessing the Accuracy of Remotely Sensed Data: Principles and Practices, CRC/Lewis Press, Boca Raton.
[15] Puetz, A.M.; Lee, K. & Olsen R.C. (2009), Worldview-2 data simulation and analysis results, Proc. of SPIE, Vol. 7334.
www.intechopen.com
Earth ObservationEdited by Dr. Rustam Rustamov
ISBN 978-953-307-973-8Hard cover, 254 pagesPublisher InTechPublished online 27, January, 2012Published in print edition January, 2012
InTech EuropeUniversity Campus STeP Ri Slavka Krautzeka 83/A 51000 Rijeka, Croatia Phone: +385 (51) 770 447 Fax: +385 (51) 686 166www.intechopen.com
InTech ChinaUnit 405, Office Block, Hotel Equatorial Shanghai No.65, Yan An Road (West), Shanghai, 200040, China
Phone: +86-21-62489820 Fax: +86-21-62489821
Today, space technology is used as an excellent instrument for Earth observation applications. Data iscollected using satellites and other available platforms for remote sensing. Remote sensing data collectiondetects a wide range of electromagnetic energy which is emitting, transmitting, or reflecting from the Earth'ssurface. Appropriate detection systems are needed to implement further data processing. Space technologyhas been found to be a successful application for studying climate change, as current and past data can bedynamically compared. This book presents different aspects of climate change and discusses spacetechnology applications.
How to referenceIn order to correctly reference this scholarly work, feel free to copy and paste the following:
Cristina Tarantino, Maria Adamo, Guido Pasquariello, Francesco Lovergine, Palma Blonda and ValeriaTomaselli (2012). 8-Band Image Data Processing of the Worldview-2 Satellite in a Wide Area of Applications,Earth Observation, Dr. Rustam Rustamov (Ed.), ISBN: 978-953-307-973-8, InTech, Available from:http://www.intechopen.com/books/earth-observation/8-band-image-data-processing-of-the-worldview-2-satellite-in-a-wide-area-of-applications

© 2012 The Author(s). Licensee IntechOpen. This is an open access articledistributed under the terms of the Creative Commons Attribution 3.0License, which permits unrestricted use, distribution, and reproduction inany medium, provided the original work is properly cited.


