Journal of Automatic Chemistry, Volume 6, Number 3 (July-September 1984), pages 155-157
A computer program forintra-laboratory quality controlCecilia Zuppi, Giuliano Barbaresi, Maria Luisa Gozzo and Bruno ZappacostaIstituto di Chimica Biologica, Laboratorio di Chimica Clinica, Policlinico Universitario A. Gemelli, Universit2 Cattolica del Sacro Cuore,Laro A. Gemelli 8, 00168 Roma, Italy
Introduction
Intra-laboratory quality-control (intra-lab QC) is the best wayof checking the performance of single components of analyticalsystems (methods, instruments, technicians) [1]. However, thetime-consuming and tedious statistical methods necessary, ifmanually performed, provide late information that reduces thevalidity of intra-lab QC.
In order to make this type of quality control more useful, aminicomputer program, which automates mathematical andgraphical procedures, has been developed. The program assuresrapid, unique and unequivocal interpretation ofresults by usinga reliability index (RI) I-2 and 3-1.
cumulative sum of RIs. Its value progressively increases if thereis no variation in the RI sign; it begins again from zero if a signvariation appears.
The statistical parameters are calculated monthly to allowretrospective quality-control. Monthly means and standarddeviations on untruncated, truncated, and the cumulated resultsof two control materials are calculated. Truncated data meansand related standard deviations are obtained after an iterativetruncation deletes outliers (+ 3 SD). The truncated data aresummed with those from the previous months and are used tocalculate cumulative means and standard deviations. Controlcharts [7], and two sample plots [8] are printed by means oftheP6060’s printer.
Materials and methods
HardwareA P6060 minicomputer (Ing. C. Olivetti & C., S.p.A., Ivrea,Italy) was used with a 32 Kbyte ROM and a 400 Kbyte RAM onfloppy disks.
SoftwareThe program was written in BASIC; a complete listing of theprogram is available from the authors.
Control seraCommercially available control sera with two known levels ofanalyte concentration were used. The control sera are alter-natively analysed every 15 to 20 samples.
Statistical methodsThe reliability index and RI cusum (Q) [4] are used to evaluateanalytical results in real time; the RI is derived from Whitehead’sformulae for precision (PI) and accuracy (AI) indexes [5]. Theseindexes express, in terms of standard deviation, the differencesbetween the previously observed and the obtained value (PI) andbetween the observed value and the expected one (AI). In orderto obtain an index representative ofboth precision and accuracythe following formula was used:
100
where x, is the found value, 2c is the cumulative mean, and SDc isthe cumulative standard deviation. The cumulative mean isconsidered to be the best estimate of a quantity for a particularmaterial using a defined analytical method, and the cumulativestandard deviation the best expression ofmethod variability [6].Statistically, RI is equivalent to the Z-score or to the standarddeviation interval (SDI) multiplied by 100. Cusum is the
,.oo.,.I
,.,.l k. ,.,.1
Same testYes
Two-sample plot]e Yes
,ot
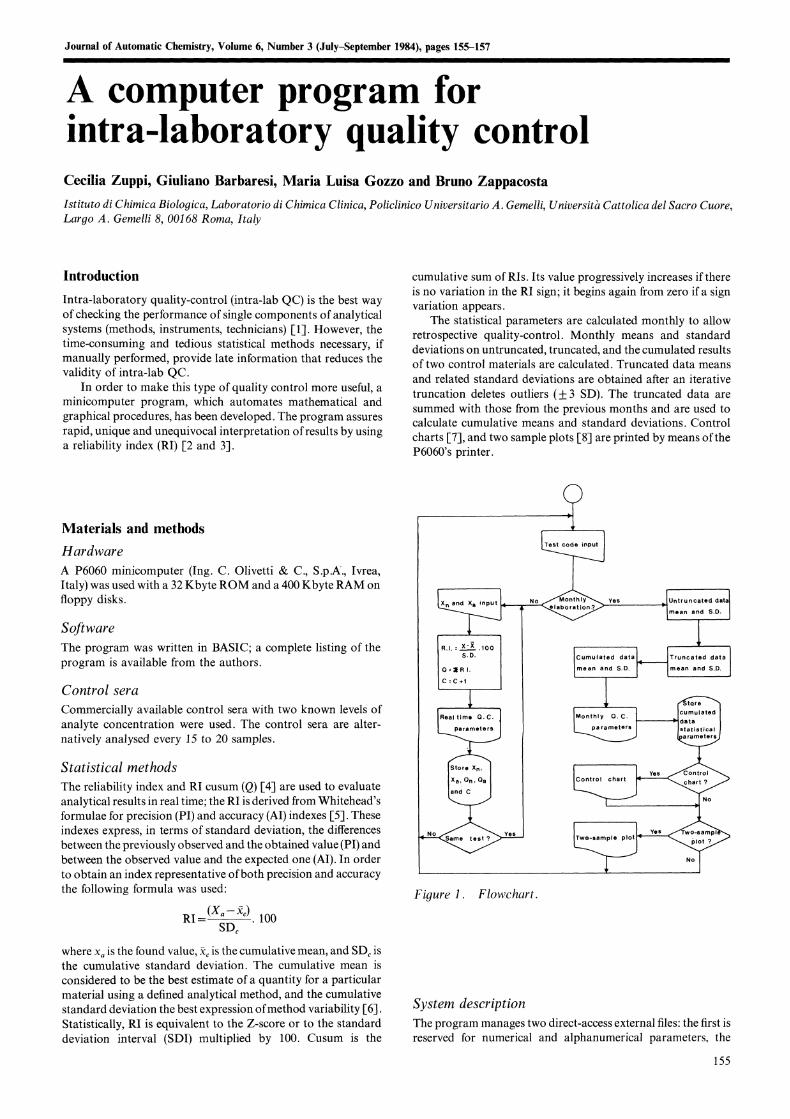
Figure 1. Flowchart.
System descriptionThe program manages two direct-access external files: the first isreserved for numerical and alphanumerical parameters, the
155
C. Zuppi et al. A computer program for intra-laboratory quality control
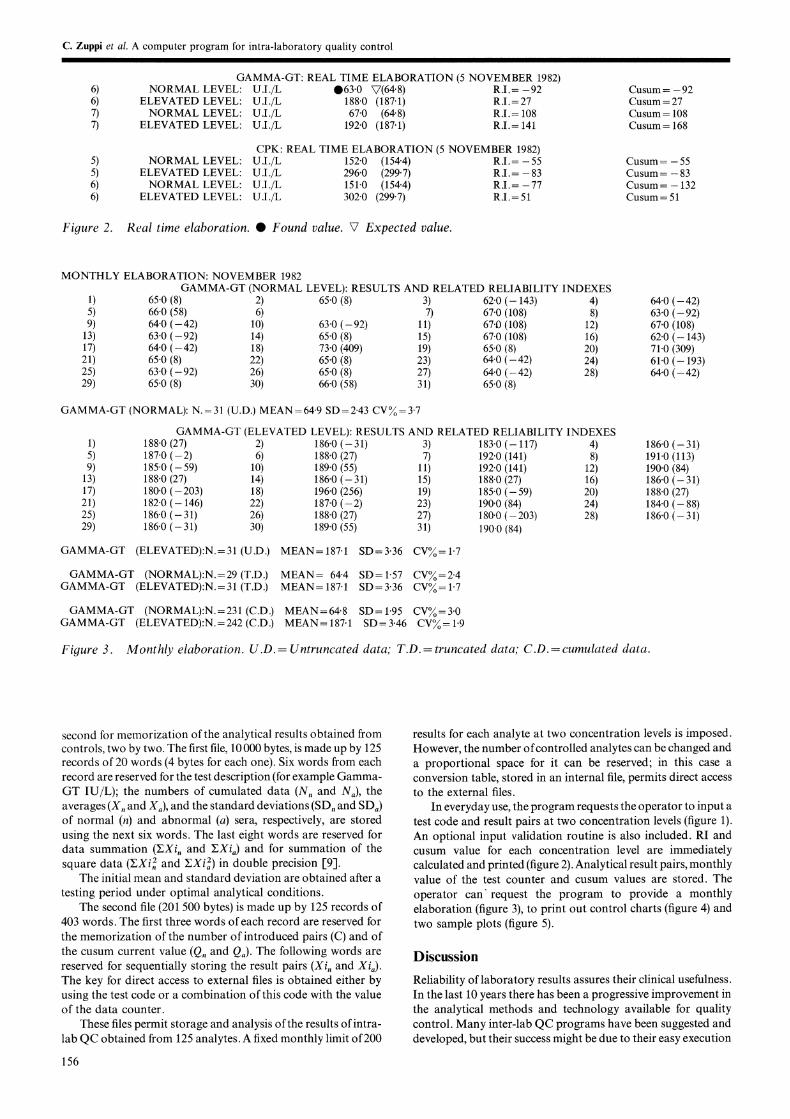
GAMMA-GT: REAL TIME ELABORATION (5 NOVEMBER 1982)NORMAL LEVEL: U.I./L 063"0 V(64"8) R.I.=-92
ELEVATED LEVEL: U.I./L 188.0 (187.1) R.I.=27NORMAL LEVEL: U.I./L 67.0 (64.8) R.I.= 108
ELEVATED LEVEL: U.I./L 192"0 (187-1) R.I.= 141
CPK: REAL TIME ELABORATION (5 NOVEMBER 1982)NORMAL LEVEL: U.I./L 152.0 (154.4) R.I.=-55
ELEVATED LEVEL: U.I./L 296.0 (299.7) R.I.= -83NORMAL LEVEL: U.I./L 151.0 (154.4) R.I.=-77
ELEVATED LEVEL: U.I./L 302.0 (299.7) R.I.=51
Figure 2. Real time elaboration. Found value. V Expected value.
Cusum -92Cusum 27Cusum 108Cusum 168
Cusum 55Cusum 83Cusum 132Cusum 51
MONTHLY ELABORATION: NOVEMBER 1982GAMMA-GT (NORMAL LEVEL): RESULTS AND RELATED RELIABILITY INDEXES
1) 65’0 (8) 2) 65.0 (8) 3) 62.0 (- 143) 4)5) 66.0 (58) 6) 7) 67.0 (108) 8)9) 64.0 (-42) 10) 63.0 (-92) 11) 67.1) (108) 12)
13) 63.0 (-92) 14) 65"0 (8) 15) 67.0 (108) 16)17) 64.0 (-42) 18) 73.0 (409) 19) 65.0 (8) 20)21) 65.0 (8) 22) 65"0 (8) 23) 64.0 (-42) 24)25) 63.0 (-92) 26) 65"0 (8) 27) 64.0 (-42) 28)29) 65.0 (8) 30) 66"0 (58) 31) 65.0 (8)
GAMMA-GT (NORMAL): N.=31 (U.D.) MEAN=64.9 SD=2.43 CV%=3.7
GAMMA-GT (ELEVATED LEVEL): RESULTS AND RELATED RELIABILITY INDEXES1) 188.0 (27) 2) 186.0 (-31) 3) 183"0 (-117) 4)5) 187.0 (-2) 6) 188.0 (27) 7) 192.0 (141) 8)9) 185.0 (-59) 10) 189.0 (55) 11) 192"0 (141) 12)
13) 188.0 (27) 14) 186.0 (- 31) 15) 188.0 (27) 16)17) 180.0 (- 203) 18) 196.0 (256) 19) 185.0 (- 59) 20)21) 182.0 (- 146) 22) 187.0 (-2) 23) 190.0 (84) 24)25) 186"0 (- 31) 26) 188"0 (27) 27) 180.0 (- 203) 28)29) 186.0 (-31) 30) 189.0 (55) 31) 190.0 (84)
GAMMA-GT (ELEVATED):N.=31 (U.D.) MEAN= 187.1 SD= 3.36 CV%= 1.7
GAMMA-GT (NORMAL):N.=29 (T.D.)GAMMA-GT (ELEVATED):N.= 31 (T.D.)
MEAN= 64.4 SD=1"57 CV=2.4MEAN= 187.1 SD 3.36 CV= 1.7
GAMMA-GT (NORMAL):N.=231(C.D.) MEAN=64.8 SD=1’95 CVo=3"0GAMMA-GT (ELEVATED):N. 242 (C.D.) MEAN-- 187.1 SD 3.46 CVo 1"9
Fiyure 3. Monthly elaboration. U.D.= Untruncated data; T.D.=truncated data; C.D.--cumulated data.
64.0 (-42)63.0 (- 92)67.0 (108)62.0 (- 143)71.0 (309)61.0 (- 193)64.0 (-42)
186.0(-31)191.0 (113)190.0 (84)186.0 (- 31)188.0 (27)184.0 (- 88)186.0 (- 31)
second for memorization of the analytical results obtained fromcontrols, two by two. The first file, 10000 bytes, is made up by 125records of 20 words (4 bytes for each one). Six words from eachrecord are reserved for the test description (for example Gamma-GT IU/L); the numbers of cumulated data (N,, and Na), theaverages (X,, and Xa), and the standard deviations (SD,, and SDa)of normal (n) and abnormal (a) sera, respectively, are storedusing the next six words. The last eight words are reserved fordata summation (EXi, and EXia) and for summation of thesquare data (EXiZ, and EXi2) in double precision [9].
The initial mean and standard deviation are obtained after atesting period under optimal analytical conditions.
The second file (201 500 bytes) is made up by 125 records of403 words. The first three words ofeach record are reserved forthe memorization of the number of introduced pairs (C) and ofthe cusum current value (Q,, and Qa). The following words arereserved for sequentially storing the result pairs (Xi,, and Xi).The key for direct access to external files is obtained either byusing the test code or a combination of this code with the valueof the data counter.
These files permit storage and analysis ofthe results ofintra-lab QC obtained from 125 analytes. A fixed monthly limit of200
156
results for each analyte at two concentration levels is imposed.However, the number ofcontrolled analytes can be changed anda proportional space for it can be reserved; in this case aconversion table, stored in an internal file, permits direct accessto the external files.
In everyday use, the program requests the operator to input atest code and result pairs at two concentration levels (figure 1).An optional input validation routine is also included. RI andcusum value for each concentration level are immediatelycalculated and printed (figure 2). Analytical result Pairs, monthlyvalue of the test counter and cusum values are stored. Theoperator can" request the program to provide a monthlyelaboration (figure 3), to print out control charts (figure 4) andtwo sample plots (figure 5).
Discussion
Reliability of laboratory results assures their clinical usefulness.In the last 10 years there has been a progressive improvement inthe analytical methods and technology available for qualitycontrol. Many inter-lab QC programs have been suggested anddeveloped, but their success might be due to their easy execution
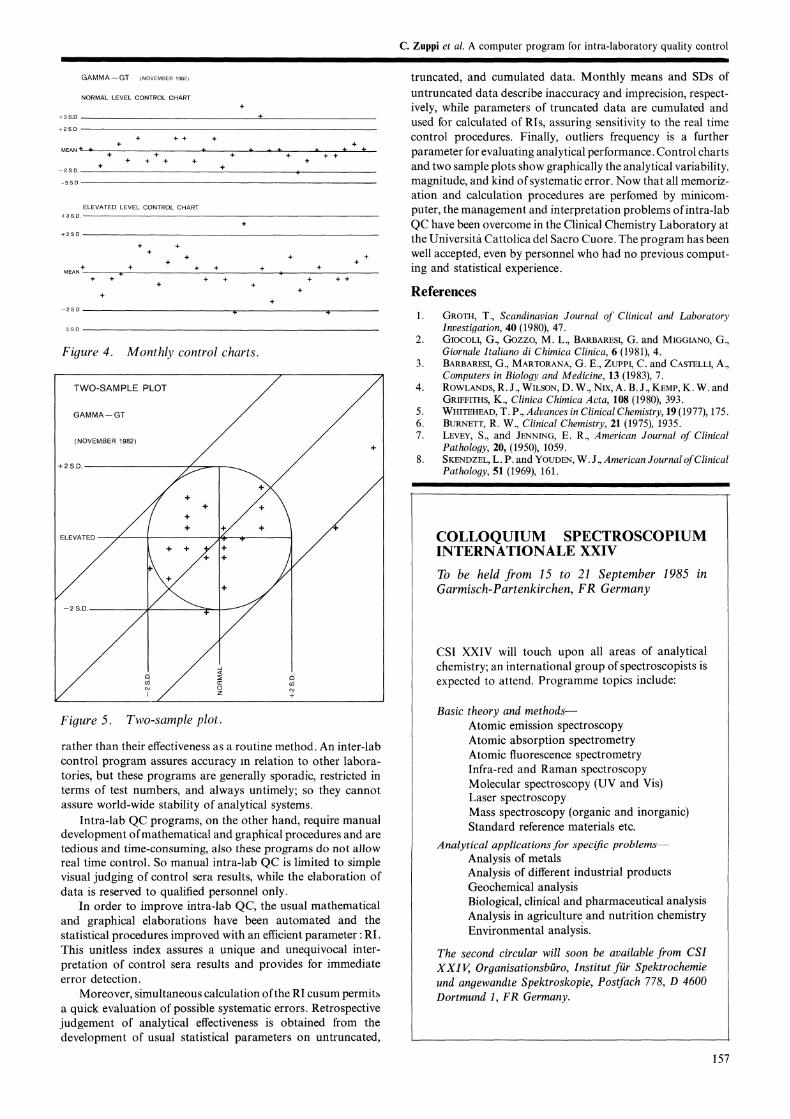
GAMMA--GT (NOVEMBER 1982
NORMAL LEVEL CONTROL CHART
ELEVATED LEVEL CONTROL CHART
Figure 4. Monthly control charts.
TWO-SAMPLE PLOT
GAMMA GT
(NOVEMBER 1982)
+2 S.D.
ELEVATED
++
+4-
Figure 5. Two-sample plot.
rather than their effectiveness as a routine method. An inter-labcontrol program assures accuracy in relation to other labora-tories, but these programs are generally sporadic, restricted interms of test numbers, and always untimely; so they cannotassure world-wide stability of analytical systems.
Intra-lab QC programs, on the other hand, require manualdevelopment ofmathematical and graphical procedures and aretedious and time-consuming, also these programs do not allowreal time control. So manual intra-lab QC is limited to simplevisual judging of control sera results, while the elaboration ofdata is reserved to qualified personnel only.
In order to improve intra-lab QC, the usual mathematicaland graphical elaborations have been automated and thestatistical procedures improved with an efficient parameter :RI.This unitless index assures a unique and unequivocal inter-pretation of control sera results and provides for immediateerror detection.
Moreover, simultaneous calculation ofthe RI cusum permitba quick evaluation of possible systematic errors. Retrospectivejudgement of analytical effectiveness is obtained from thedevelopment of usual statistical parameters on untruncated,
C. Zuppi et al. A computer program for intra-laboratory quality control
truncated, and cumulated data. Monthly means and SDs ofuntruncated data describe inaccuracy and imprecision, respect-ively, while parameters of truncated data are cumulated andused for calculated of RIs, assuring sensitivity to the real timecontrol procedures. Finally, outliers frequency is a furtherparameter for evaluating analytical performance. Control chartsand two sample plots show graphically the analytical variability,magnitude, and kind ofsystematic error. Now that all memoriz-ation and calculation procedures are perfomed by minicom-puter, the management and interpretation problems ofintra-labQC have been overcome in the Clinical Chemistry Laboratory atthe Universitfi. Cattolica del Sacro Cuore. The program has beenwell accepted, even by personnel who had no previous comput-ing and statistical experience.
References
1. GROTH, T., Scandinavian Journal of Clinical and LaboratoryInvestigation, 40 (1980), 47.
2. GIOCOLI, G., Gozzo, M. L., BARBARESI, G. and MIGGIANO, G.,Giornale Italiano di Chimiea Clinica, 6 (1981), 4.
3. BARBARESI, G., MARa’ORANn, G. E., ZuPPI, C. and CASTELLI, A.,Computers in Biology and Medicine, 13 (1983), 7.
4. ROWLANDS, R. J., WILSON, D. W., NIX, A. B. J., KEMP, K. W. andGRIFFITHS, K., Clinica Chimica Acta, 108 (1980), 393.
5. WHITEHEAD, T. P., Advances in Clinical Chemistry, 19 (1977), 175.6. BURNETT, R. W., Clinical Chemistry, 21 (1975), 1935.7. LEVE, S., and JEYYIYG, E. R., American Journal of Clinical
Pathology, 20, (1950), 1059.8. SKEYOZEL, L. P. and YOUDEY, W. J., American Journal ofCfinical
Pathology, 51 (1969), 161.
COLLOQUIUM SPECTROSCOPIUMINTERNATIONALE XXIV
To be held from 15 to 21 September 1985 inGarmisch-Partenkirchen, FR Germany
CSI XXIV will touch upon all areas of analyticalchemistry; an international group of spectroscopists isexpected to attend. Programme topics include:
Basic theory and methods--Atomic emission spectroscopyAtomic absorption spectrometryAtomic fluorescence spectrometryInfra-red and Raman spectroscopyMolecular spectroscopy (UV and Vis)Laser spectroscopyMass spectroscopy (organic and inorganic)Standard reference materials etc.
Analytical applications for specific problems--Analysis of metalsAnalysis of different industrial productsGeochemical analysisBiological, clinical and pharmaceutical analysisAnalysis in agriculture, and nutrition chemistryEnvironmental analysis.
The second circular will soon be available from CSIXXIV, Organisationsbiiro, Institut fiir Spektrochemieund angewandte Spektroskopie, Postfach 778, D 4600Dortmund 1, FR Germany.
157

Submit your manuscripts athttp://www.hindawi.com
Hindawi Publishing Corporationhttp://www.hindawi.com Volume 2014
Inorganic ChemistryInternational Journal of
Hindawi Publishing Corporation http://www.hindawi.com Volume 2014
International Journal ofPhotoenergy
Hindawi Publishing Corporationhttp://www.hindawi.com Volume 2014
Carbohydrate Chemistry
International Journal of
Hindawi Publishing Corporationhttp://www.hindawi.com Volume 2014
Journal of
Chemistry
Hindawi Publishing Corporationhttp://www.hindawi.com Volume 2014
Advances in
Physical Chemistry
Hindawi Publishing Corporationhttp://www.hindawi.com
Analytical Methods in Chemistry
Journal of
Volume 2014
Bioinorganic Chemistry and ApplicationsHindawi Publishing Corporationhttp://www.hindawi.com Volume 2014
SpectroscopyInternational Journal of
Hindawi Publishing Corporationhttp://www.hindawi.com Volume 2014
The Scientific World JournalHindawi Publishing Corporation http://www.hindawi.com Volume 2014
Medicinal ChemistryInternational Journal of
Hindawi Publishing Corporationhttp://www.hindawi.com Volume 2014
Chromatography Research International
Hindawi Publishing Corporationhttp://www.hindawi.com Volume 2014
Applied ChemistryJournal of
Hindawi Publishing Corporationhttp://www.hindawi.com Volume 2014
Hindawi Publishing Corporationhttp://www.hindawi.com Volume 2014
Theoretical ChemistryJournal of
Hindawi Publishing Corporationhttp://www.hindawi.com Volume 2014
Journal of
Spectroscopy
Analytical ChemistryInternational Journal of
Hindawi Publishing Corporationhttp://www.hindawi.com Volume 2014
Journal of
Hindawi Publishing Corporationhttp://www.hindawi.com Volume 2014
Quantum Chemistry
Hindawi Publishing Corporationhttp://www.hindawi.com Volume 2014
Organic Chemistry International
ElectrochemistryInternational Journal of
Hindawi Publishing Corporation http://www.hindawi.com Volume 2014
Hindawi Publishing Corporationhttp://www.hindawi.com Volume 2014
CatalystsJournal of


