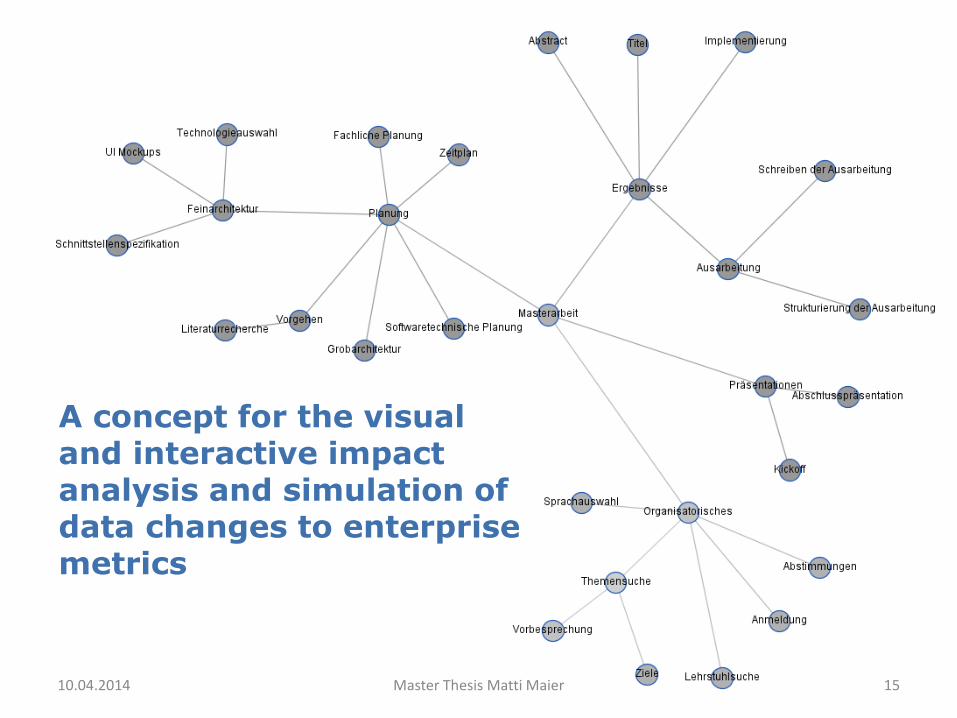
A concept for the visual and interactive impact analysis and simulationof data changes to enterprise metrics
Kickoff Presentation
10.04.2014 Master Thesis Matti Maier 1
Index
• Example
– Problem
– Databasis
– Model
• Components
– Requirements
• Technology
• Goals
• Methodology
• Roadmap
10.04.2014 Master Thesis Matti Maier 2
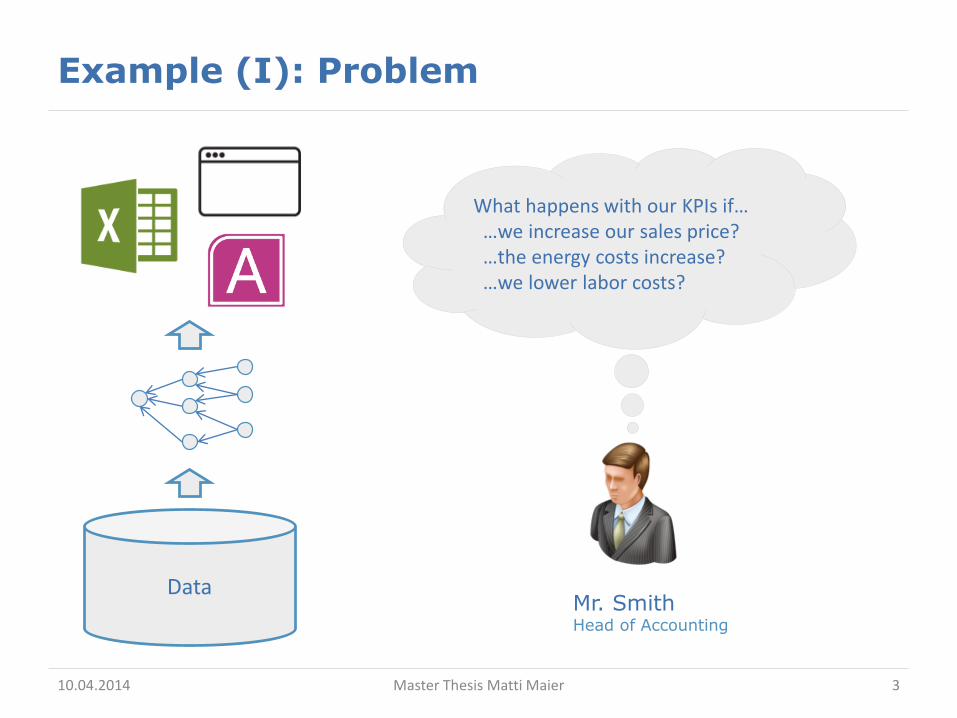
Example (I): Problem
10.04.2014 Master Thesis Matti Maier 3
Mr. SmithHead of Accounting
What happens with our KPIs if……we increase our sales price?…the energy costs increase?…we lower labor costs?
Data
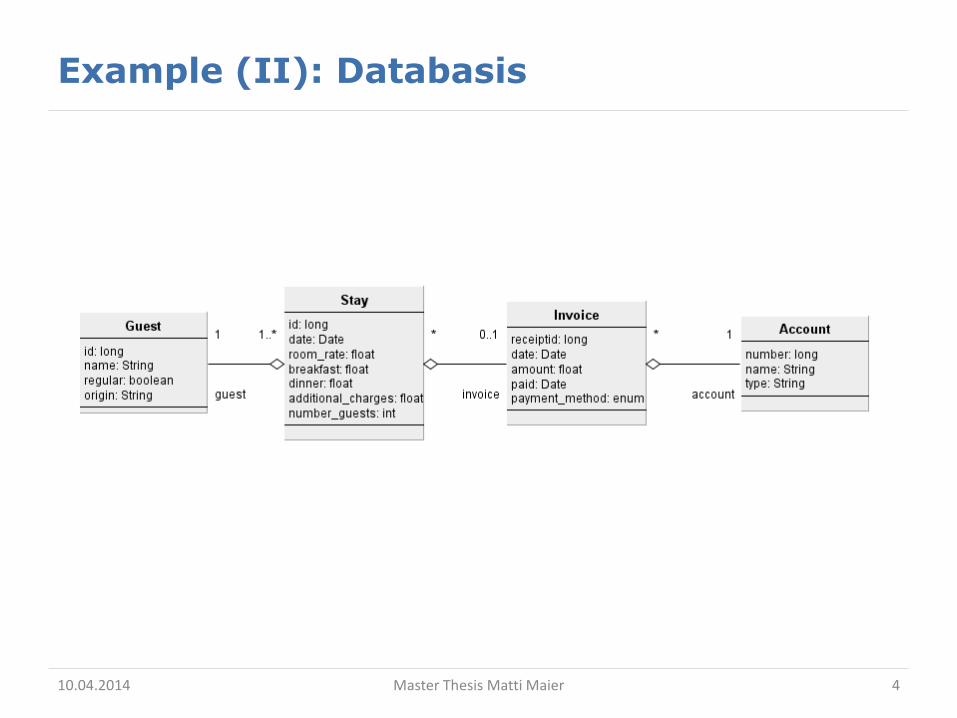
Example (II): Databasis
10.04.2014 Master Thesis Matti Maier 4
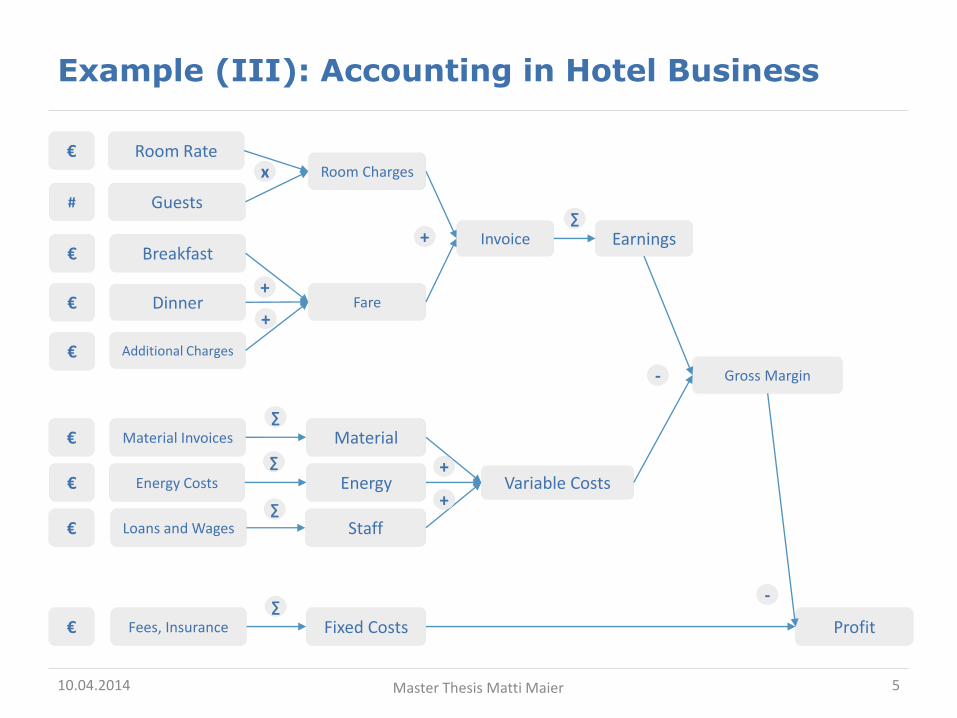
Example (III): Accounting in Hotel Business
10.04.2014 Master Thesis Matti Maier 5
Room Rate
Breakfast
Dinner
Additional Charges
Material
Staff
Fixed Costs
Fare
Guests
Earnings
Variable Costs
Gross Margin
Profit
€
€
€
€
€
€
€
+
x
+
-
-
Energy€+
#
+
Room Charges
Invoice+∑
Material Invoices
Energy Costs
Loans and Wages
Fees, Insurance
∑
∑
∑
∑
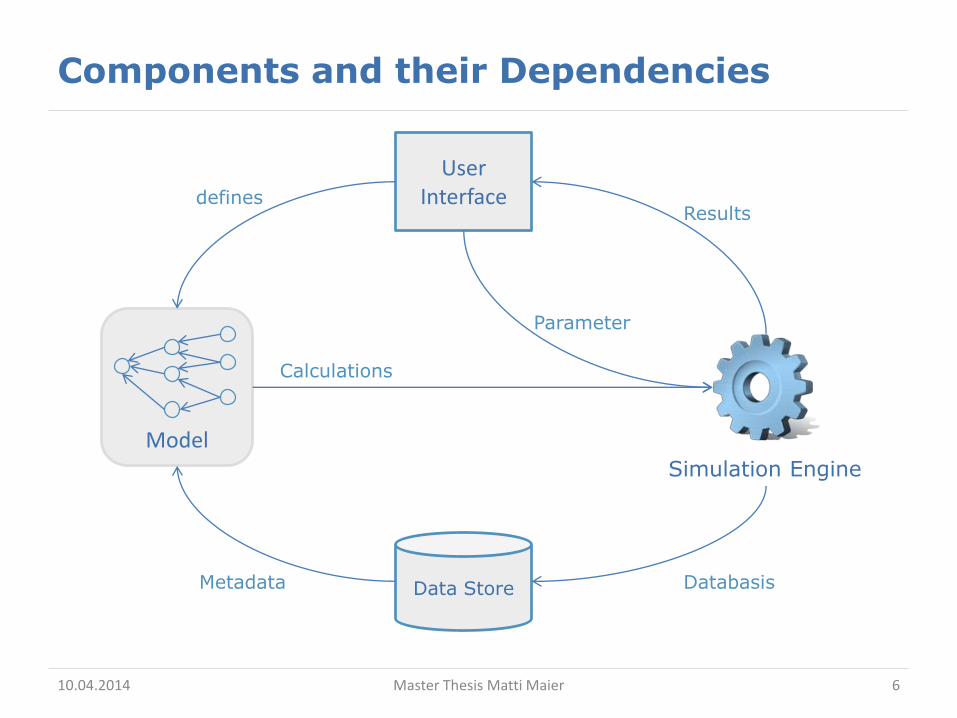
Components and their Dependencies
10.04.2014 Master Thesis Matti Maier
Model
6
Data Store
User Interface
Simulation Engine
definesResults
Parameter
Calculations
Metadata Databasis
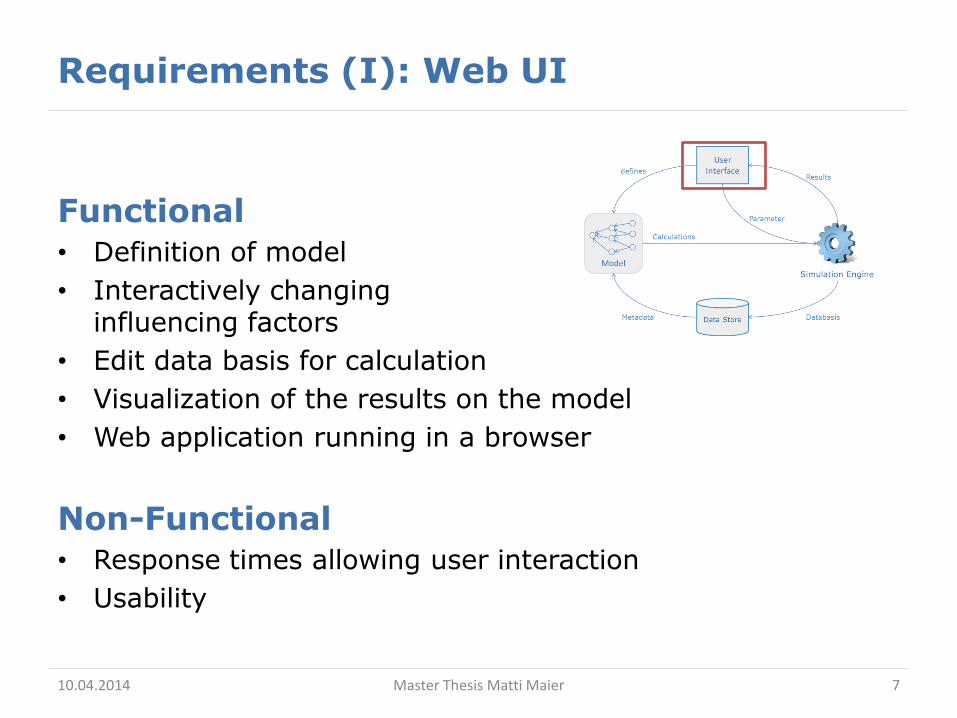
Requirements (I): Web UI
Functional
• Definition of model
• Interactively changinginfluencing factors
• Edit data basis for calculation
• Visualization of the results on the model
• Web application running in a browser
Non-Functional
• Response times allowing user interaction
• Usability
10.04.2014 Master Thesis Matti Maier 7
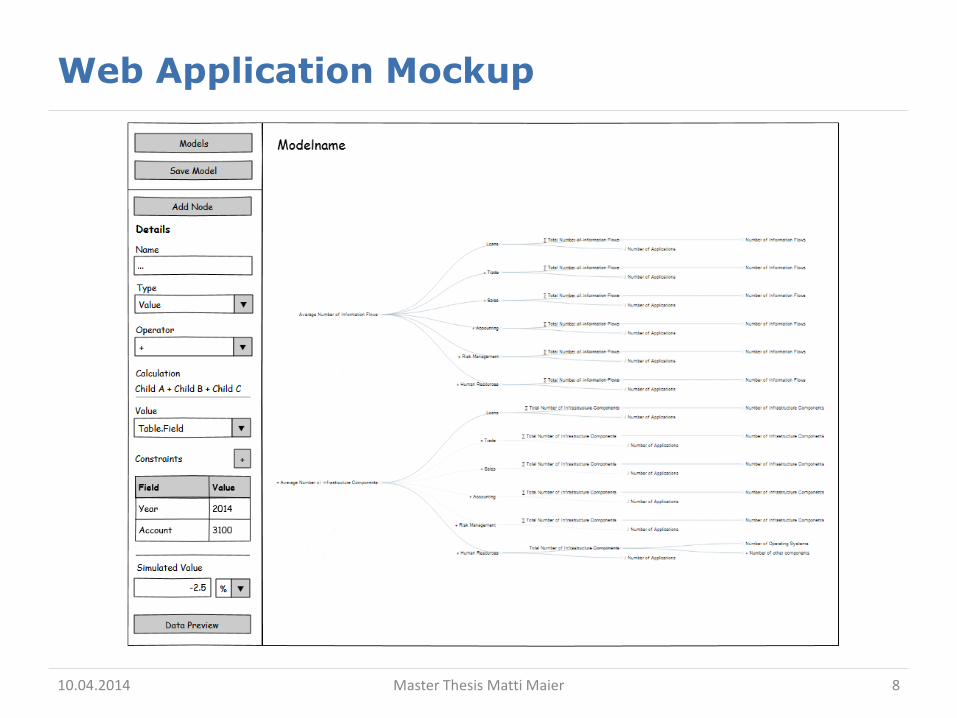
Web Application Mockup
10.04.2014 Master Thesis Matti Maier 8
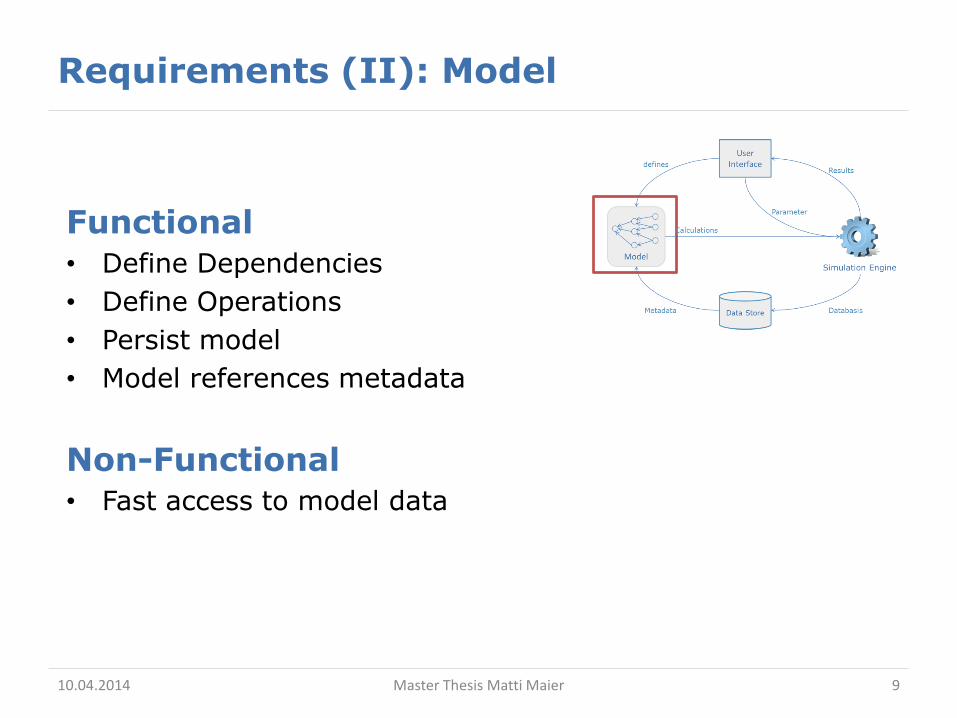
Requirements (II): Model
Functional
• Define Dependencies
• Define Operations
• Persist model
• Model references metadata
Non-Functional
• Fast access to model data
10.04.2014 Master Thesis Matti Maier 9
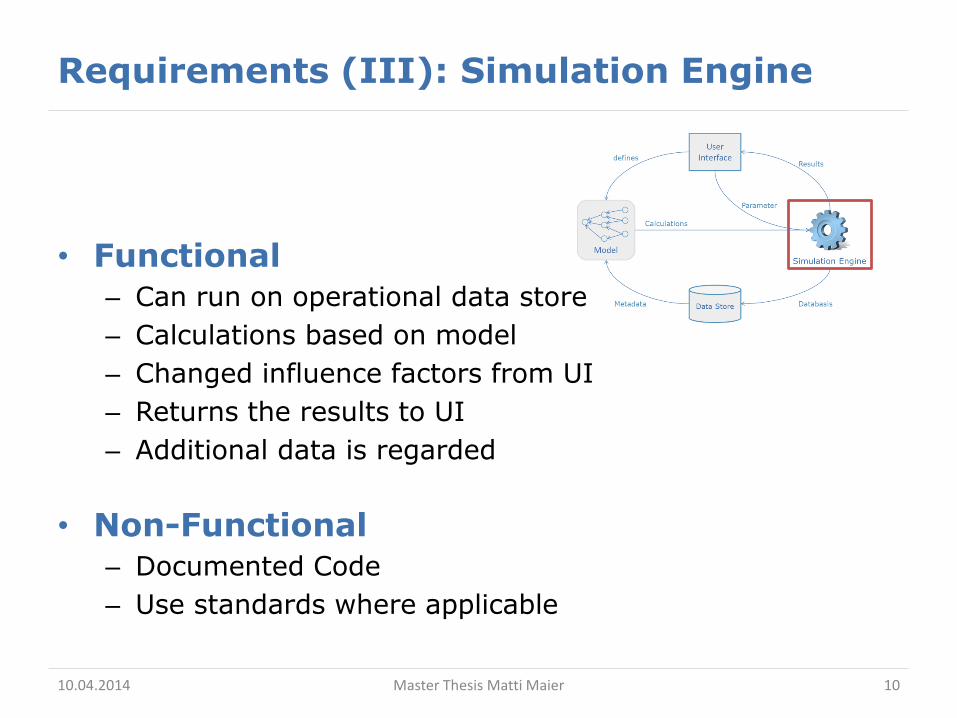
Requirements (III): Simulation Engine
• Functional
– Can run on operational data store
– Calculations based on model
– Changed influence factors from UI
– Returns the results to UI
– Additional data is regarded
• Non-Functional
– Documented Code
– Use standards where applicable
10.04.2014 Master Thesis Matti Maier 10
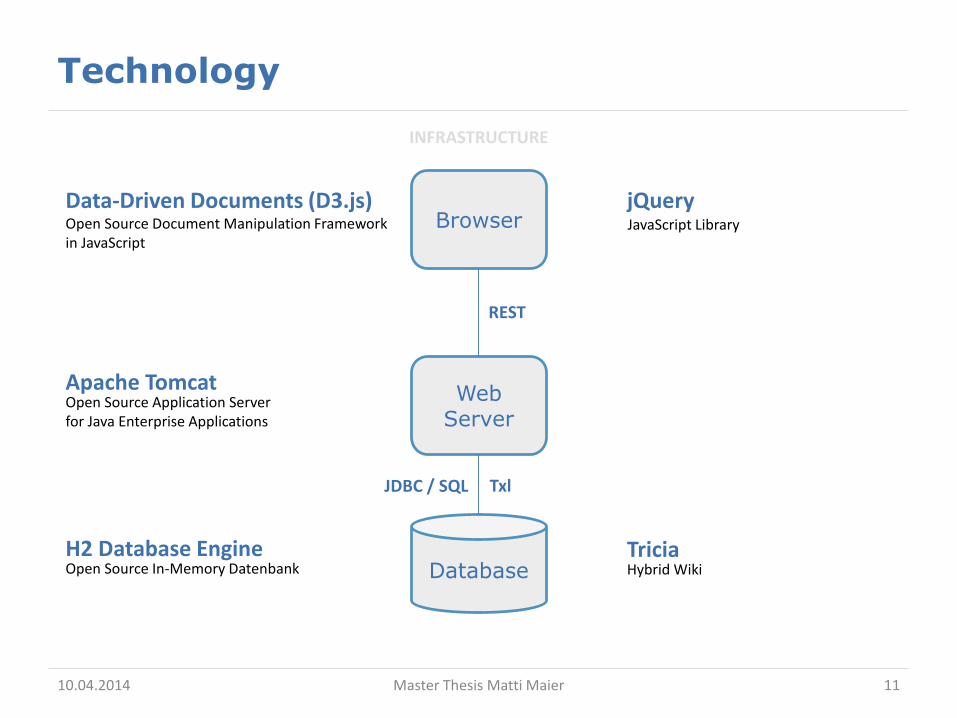
Technology
10.04.2014 Master Thesis Matti Maier 11
Database
Web Server
Browser
INFRASTRUCTURE
H2 Database EngineOpen Source In-Memory Datenbank
Apache TomcatOpen Source Application Serverfor Java Enterprise Applications
REST
Data-Driven Documents (D3.js)Open Source Document Manipulation Frameworkin JavaScript
JDBC / SQL Txl
TriciaHybrid Wiki
jQueryJavaScript Library
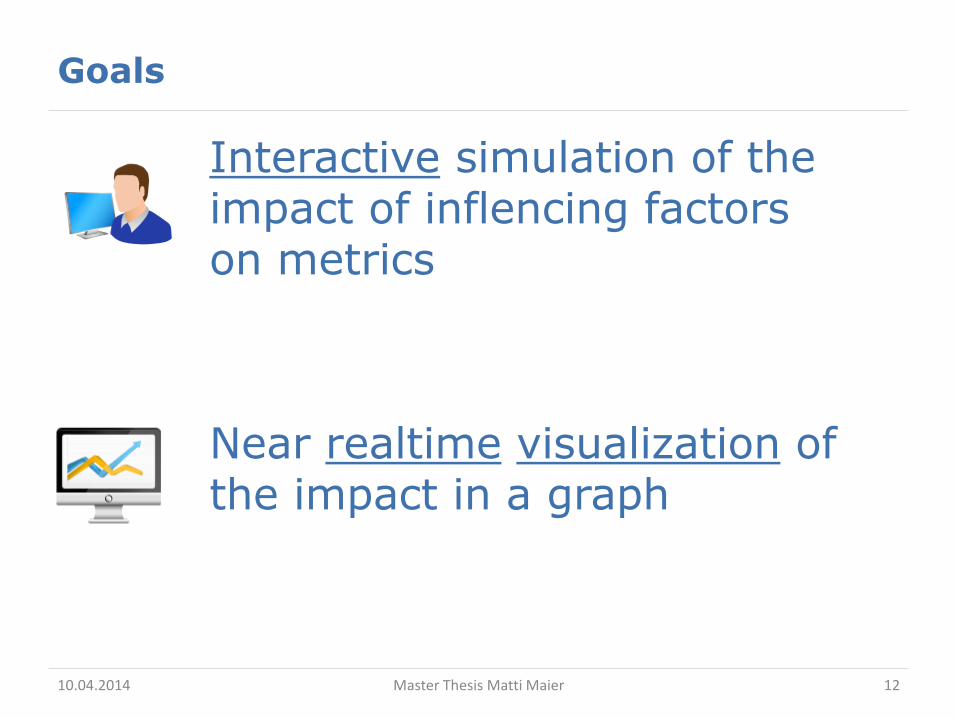
Goals
Interactive simulation of theimpact of inflencing factorson metrics
Near realtime visualization ofthe impact in a graph
10.04.2014 Master Thesis Matti Maier 12
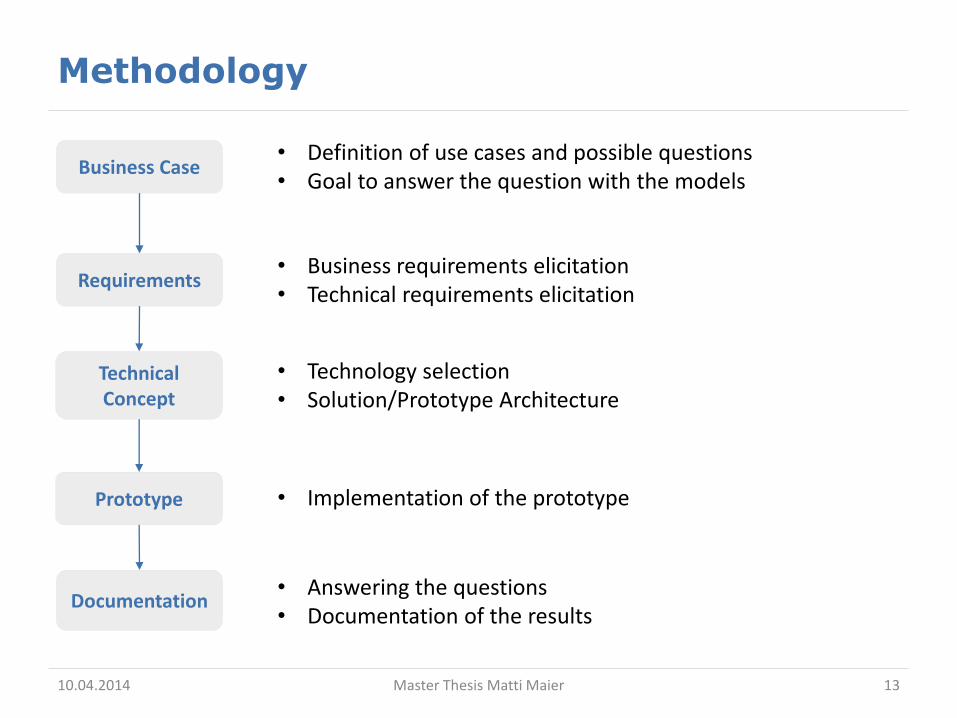
Methodology
10.04.2014 Master Thesis Matti Maier 13
Business Case
Requirements
Technical Concept
Prototype
Documentation
• Definition of use cases and possible questions• Goal to answer the question with the models
• Business requirements elicitation• Technical requirements elicitation
• Technology selection• Solution/Prototype Architecture
• Implementation of the prototype
• Answering the questions• Documentation of the results
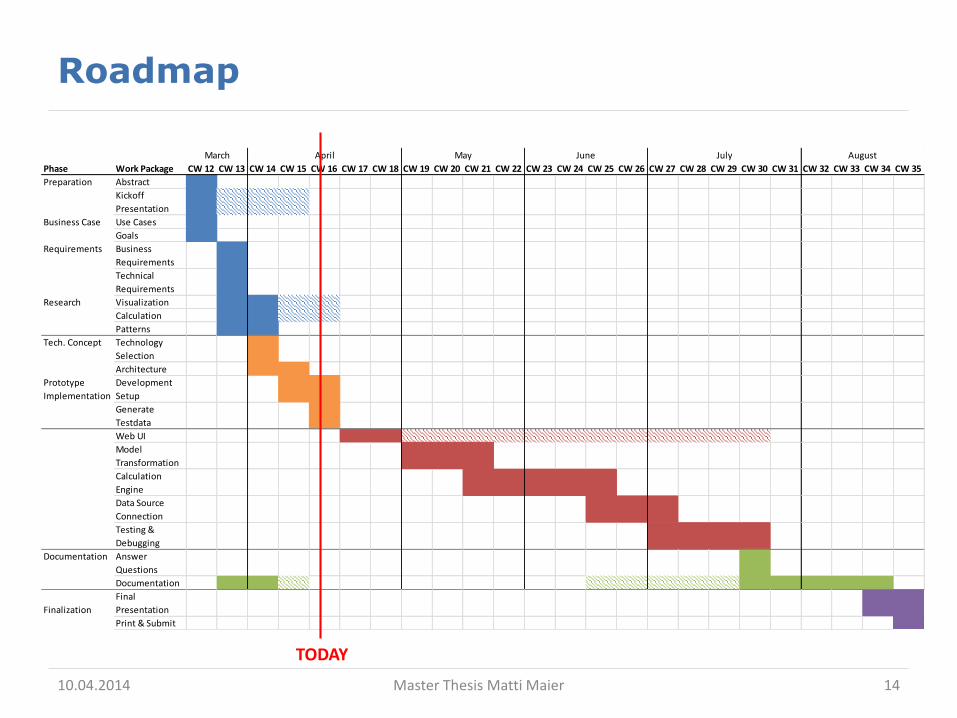
Phase Work Package CW 12 CW 13 CW 14 CW 15 CW 16 CW 17 CW 18 CW 19 CW 20 CW 21 CW 22 CW 23 CW 24 CW 25 CW 26 CW 27 CW 28 CW 29 CW 30 CW 31 CW 32 CW 33 CW 34 CW 35
Preparation Abstract
Kickoff
Presentation
Business Case Use Cases
Goals
Requirements Business
Requirements
Technical
Requirements
Research Visualization
Calculation
Patterns
Tech. Concept Technology
Selection
Architecture
Prototype
Implementation
Development
Setup
Generate
Testdata
Web UI
Model
Transformation
Calculation
Engine
Data Source
Connection
Testing &
Debugging
Documentation Answer
Questions
Documentation
Finalization
Final
Presentation
Print & Submit
March April May June July August
Roadmap
10.04.2014 Master Thesis Matti Maier 14
TODAY
10.04.2014 Master Thesis Matti Maier 15
A concept for the visual and interactive impact analysis and simulation of data changes to enterprise metrics
BACKUP
10.04.2014 Master Thesis Matti Maier 16
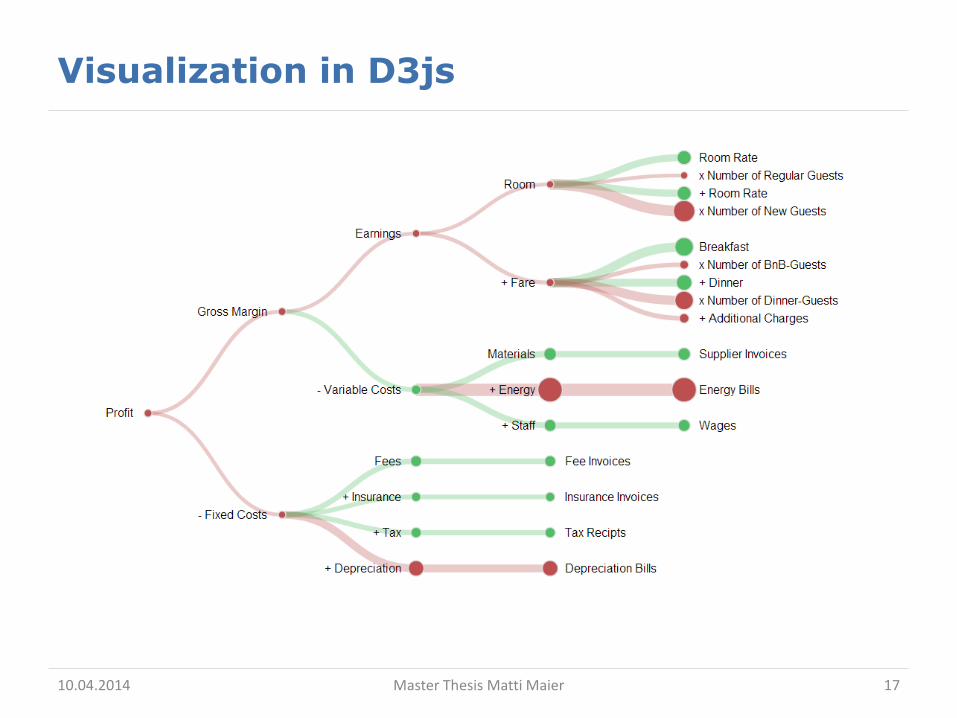
Visualization in D3js
10.04.2014 Master Thesis Matti Maier 17
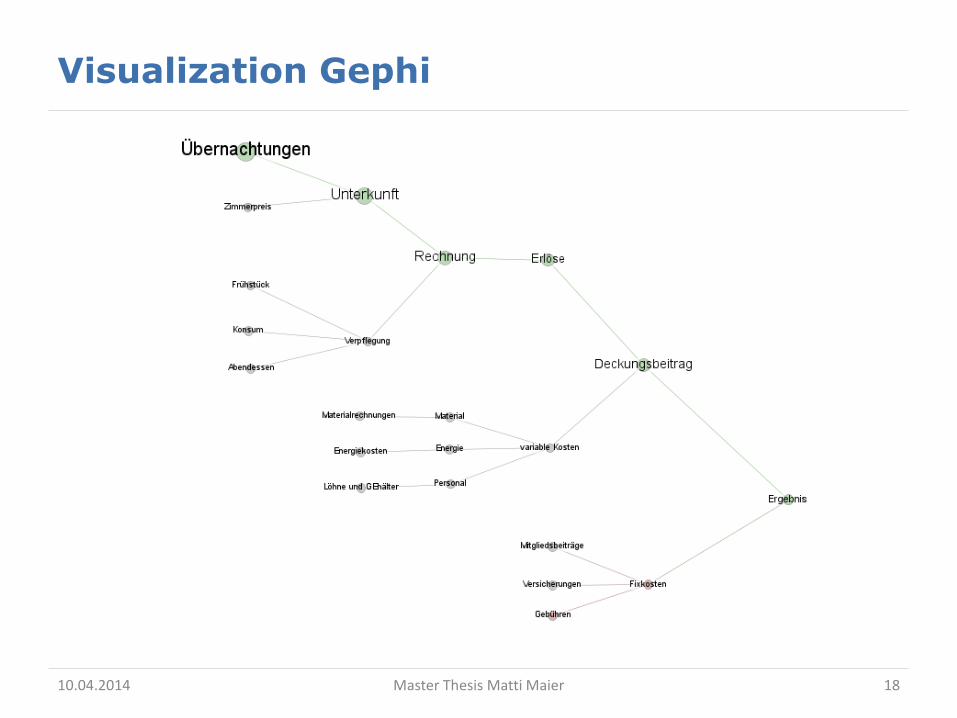
Visualization Gephi
10.04.2014 Master Thesis Matti Maier 18
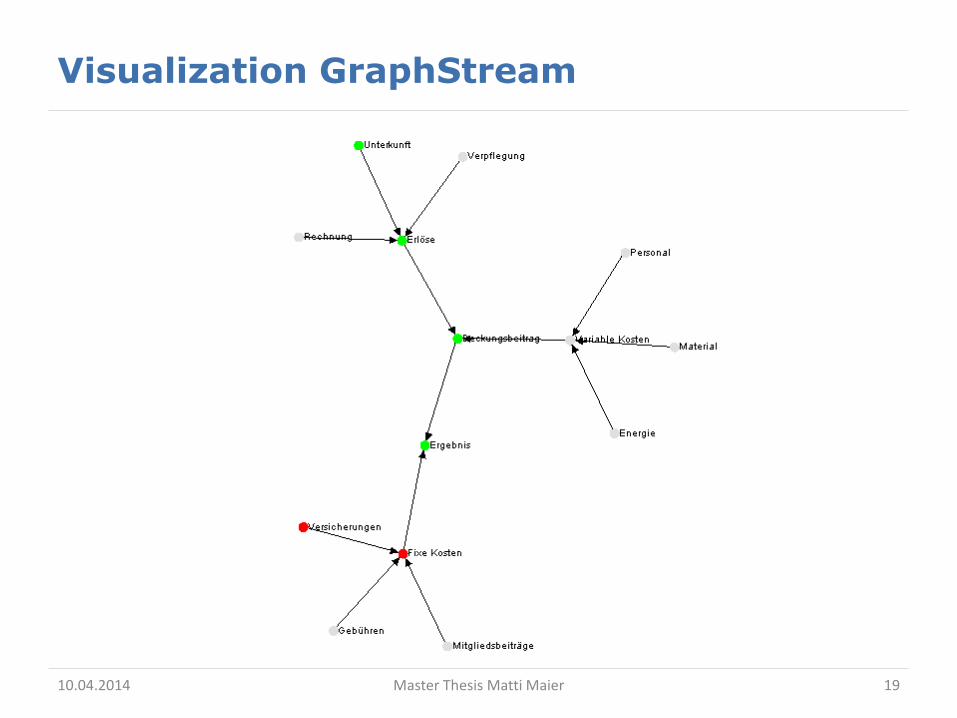
Visualization GraphStream
10.04.2014 Master Thesis Matti Maier 19
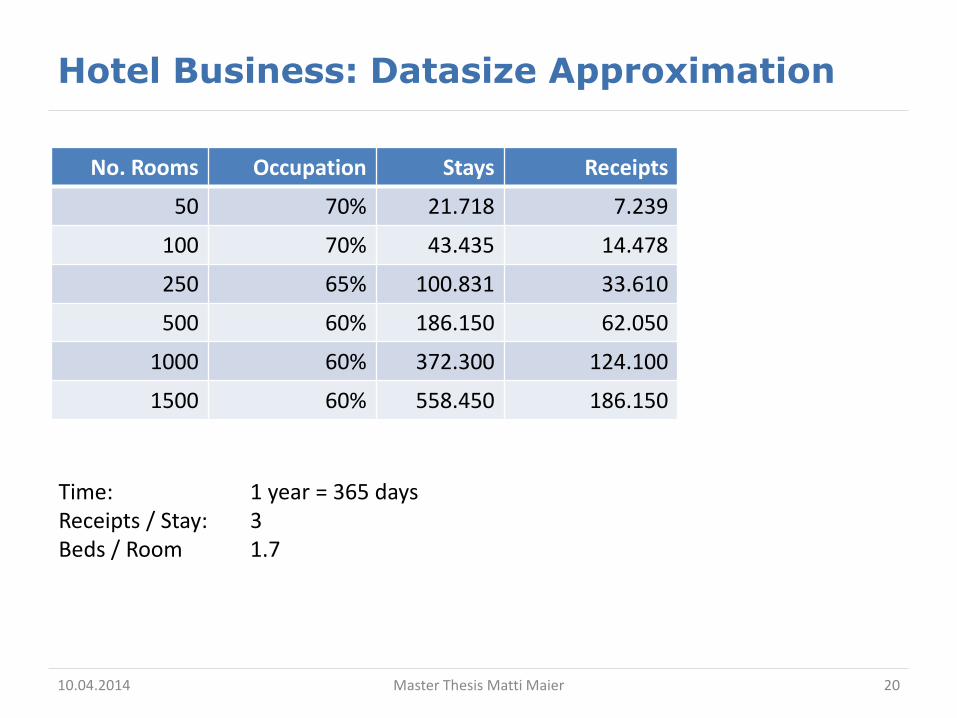
Hotel Business: Datasize Approximation
No. Rooms Occupation Stays Receipts
50 70% 21.718 7.239
100 70% 43.435 14.478
250 65% 100.831 33.610
500 60% 186.150 62.050
1000 60% 372.300 124.100
1500 60% 558.450 186.150
10.04.2014 Master Thesis Matti Maier 20
Time: 1 year = 365 daysReceipts / Stay: 3Beds / Room 1.7
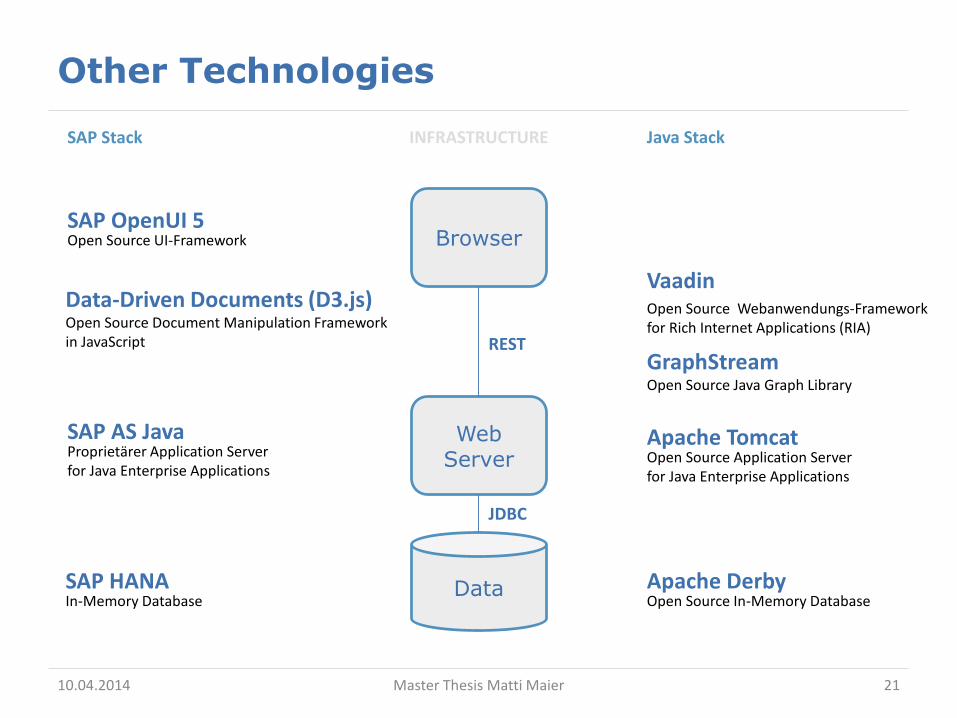
Other Technologies
10.04.2014 Master Thesis Matti Maier 21
Data
Web Server
Browser
INFRASTRUCTURESAP Stack Java Stack
SAP HANAIn-Memory Database
Apache DerbyOpen Source In-Memory Database
JDBC
SAP AS JavaProprietärer Application Serverfor Java Enterprise Applications
Apache TomcatOpen Source Application Serverfor Java Enterprise Applications
REST
SAP OpenUI 5Open Source UI-Framework
Data-Driven Documents (D3.js)Open Source Document Manipulation Frameworkin JavaScript
GraphStreamOpen Source Java Graph Library
VaadinOpen Source Webanwendungs-Frameworkfor Rich Internet Applications (RIA)
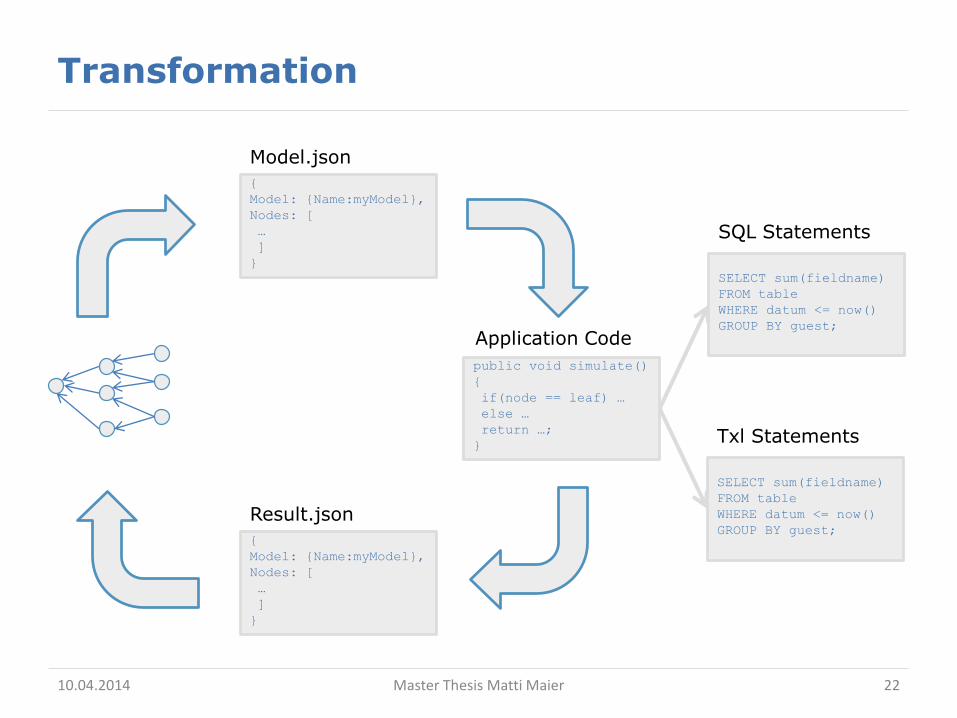
Transformation
10.04.2014 Master Thesis Matti Maier 22
{
Model: {Name:myModel},
Nodes: [
…
]
}
Model.json
SELECT sum(fieldname)
FROM table
WHERE datum <= now()
GROUP BY guest;
SQL Statements
public void simulate()
{
if(node == leaf) …
else …
return …;
}
Application Code
{
Model: {Name:myModel},
Nodes: [
…
]
}
Result.json
SELECT sum(fieldname)
FROM table
WHERE datum <= now()
GROUP BY guest;
Txl Statements
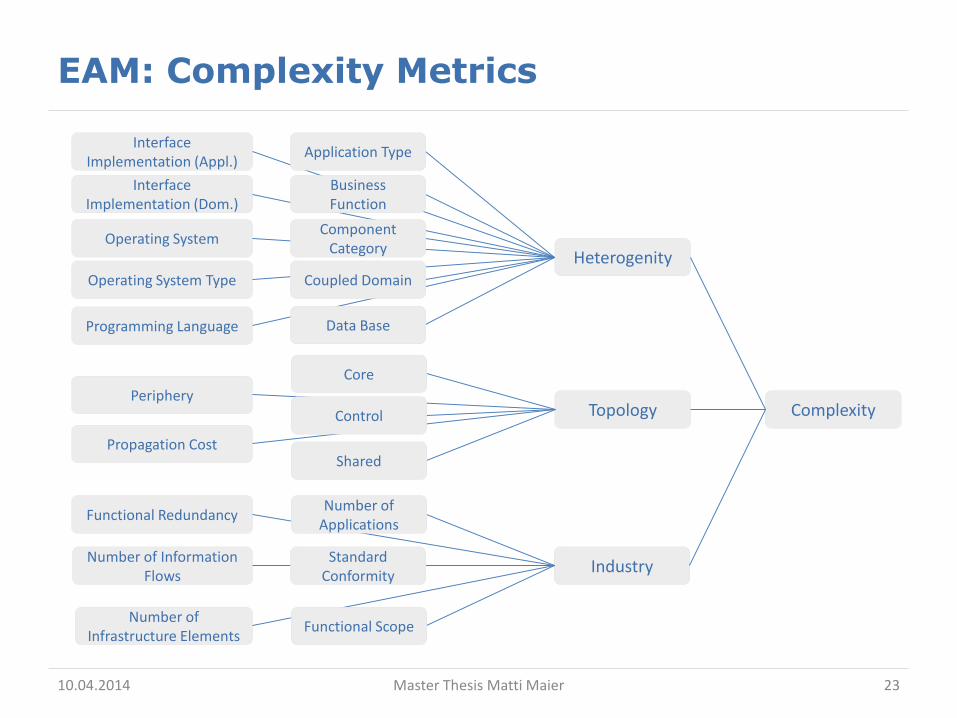
EAM: Complexity Metrics
10.04.2014 Master Thesis Matti Maier 23
Complexity
Heterogenity
Topology
Industry
Interface Implementation (Appl.)
Interface Implementation (Dom.)
Operating System
Operating System Type
Programming Language
Number of Information Flows
Number ofInfrastructure Elements
Functional Redundancy
Periphery
Propagation Cost
Number ofApplications
Standard Conformity
Functional Scope
Application Type
Business Function
ComponentCategory
Coupled Domain
Data Base
Core
Control
Shared
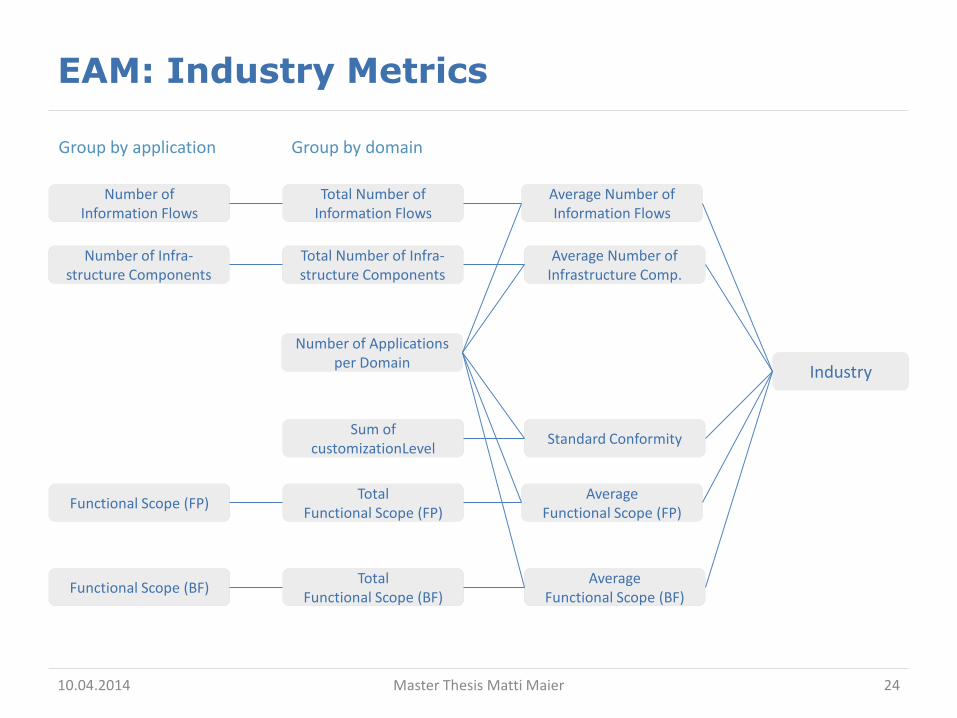
EAM: Industry Metrics
10.04.2014 Master Thesis Matti Maier 24
Industry
Number of Applicationsper Domain
Number ofInformation Flows
Standard Conformity
Number of Infra-structure Components
Functional Scope (FP)
Functional Scope (BF)
Total Number ofInformation Flows
Average Number ofInformation Flows
Total Number of Infra-structure Components
Average Number ofInfrastructure Comp.
Group by application Group by domain
Sum ofcustomizationLevel
TotalFunctional Scope (FP)
AverageFunctional Scope (FP)
TotalFunctional Scope (BF)
AverageFunctional Scope (BF)
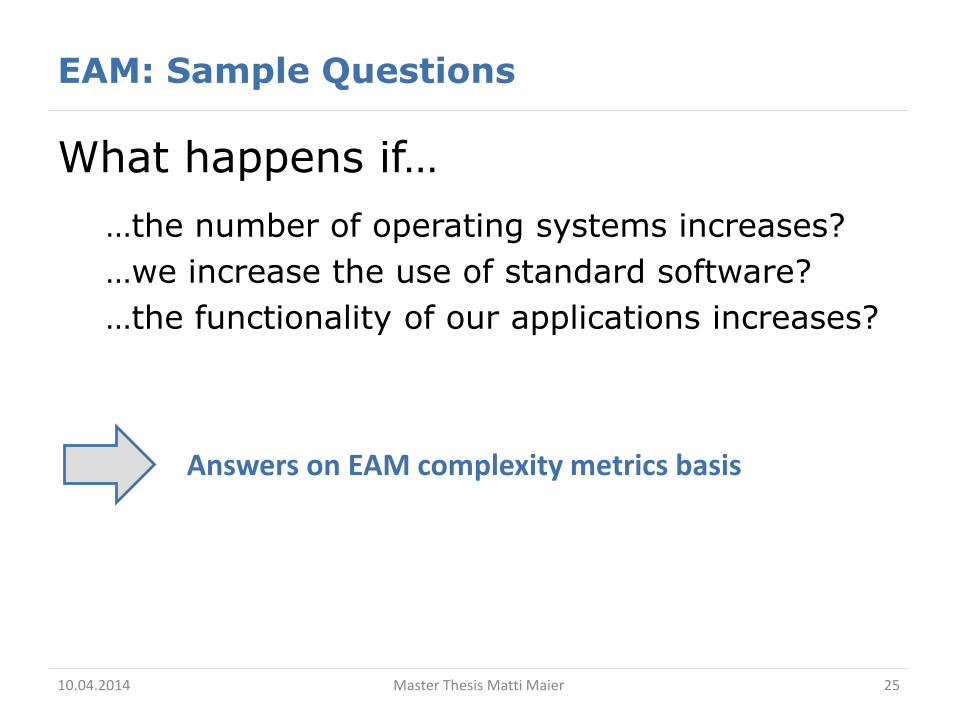
EAM: Sample Questions
What happens if…
…the number of operating systems increases?
…we increase the use of standard software?
…the functionality of our applications increases?
10.04.2014 Master Thesis Matti Maier 25
Answers on EAM complexity metrics basis
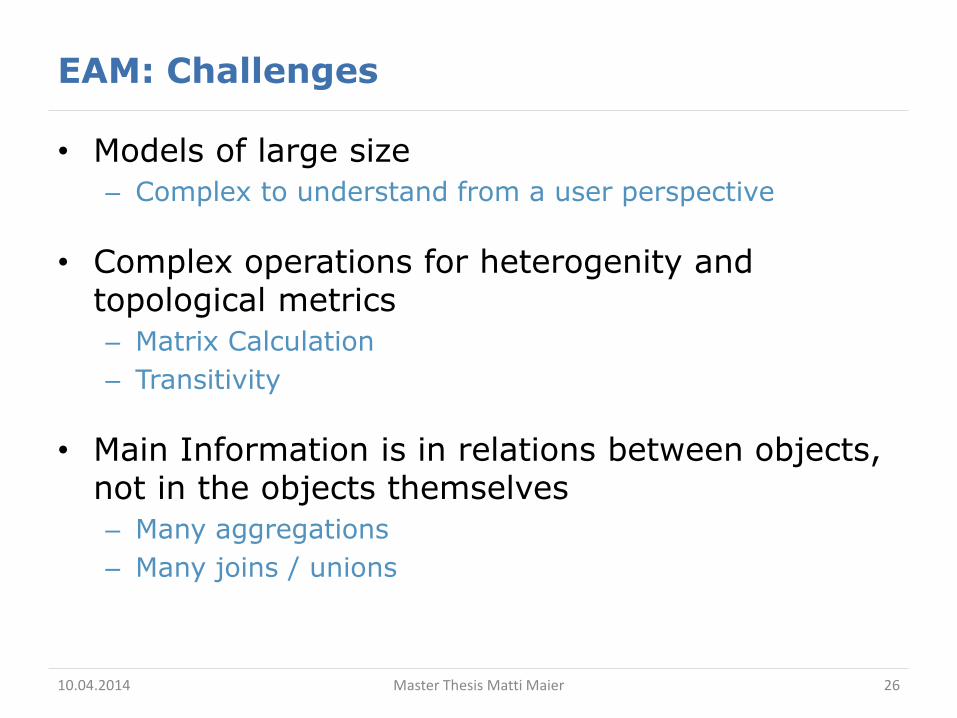
EAM: Challenges
• Models of large size
– Complex to understand from a user perspective
• Complex operations for heterogenity andtopological metrics
– Matrix Calculation
– Transitivity
• Main Information is in relations between objects, not in the objects themselves
– Many aggregations
– Many joins / unions
10.04.2014 Master Thesis Matti Maier 26
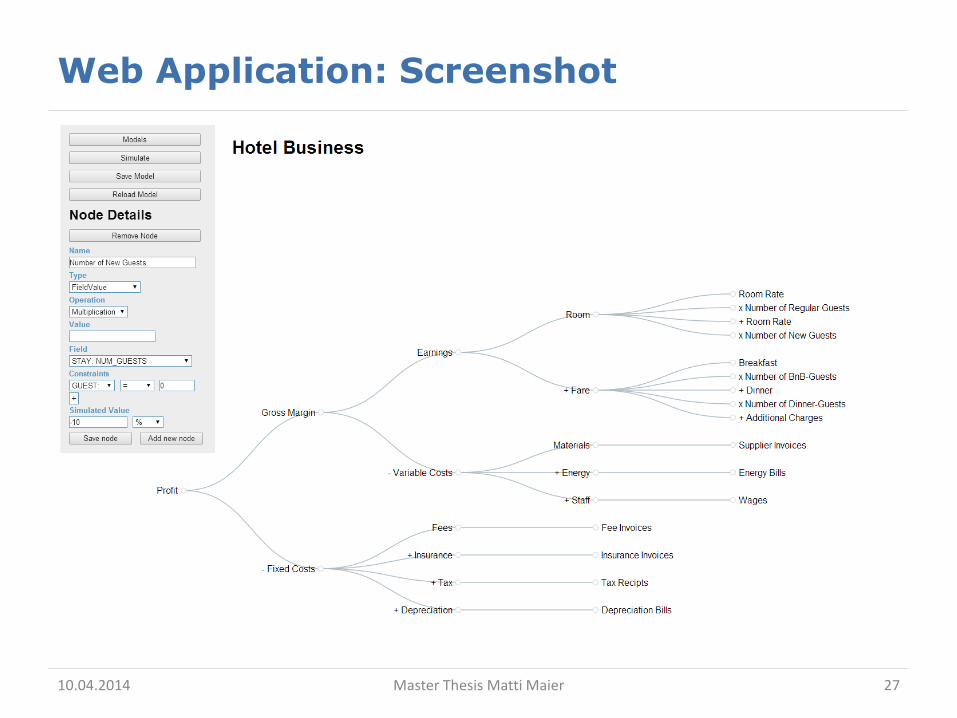
Web Application: Screenshot
10.04.2014 Master Thesis Matti Maier 27
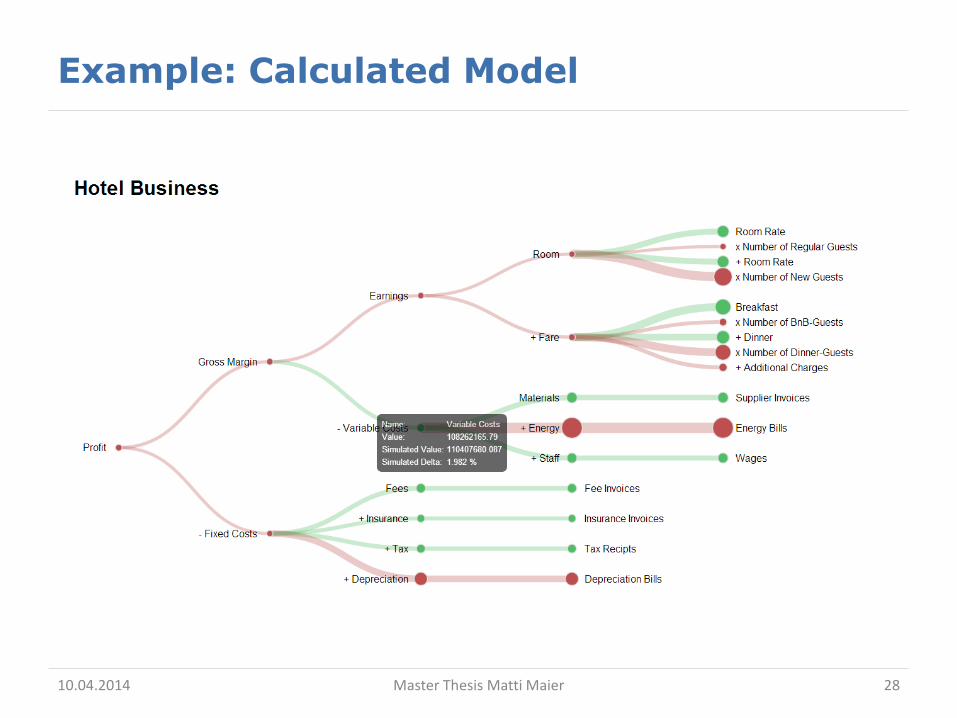
Example: Calculated Model
10.04.2014 Master Thesis Matti Maier 28
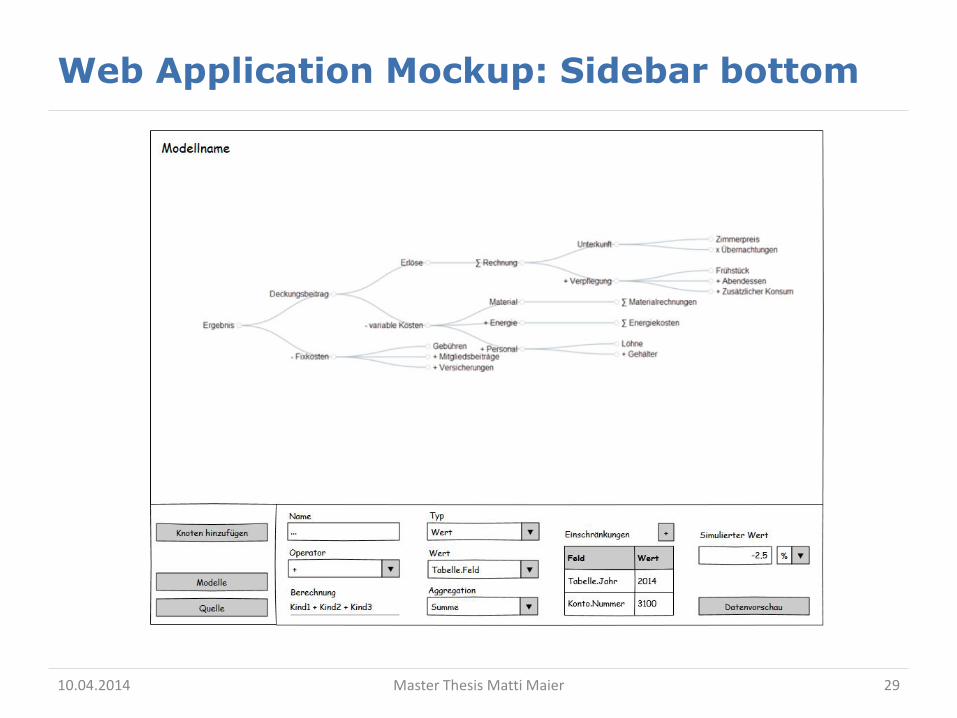
Web Application Mockup: Sidebar bottom
10.04.2014 Master Thesis Matti Maier 29
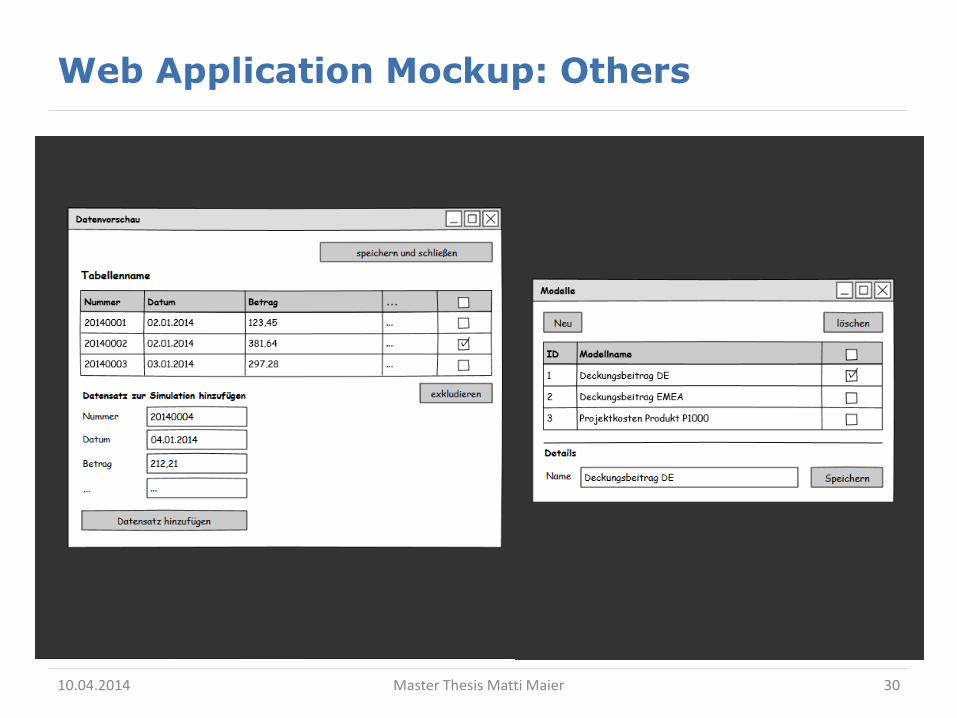
Web Application Mockup: Others
10.04.2014 Master Thesis Matti Maier 30


