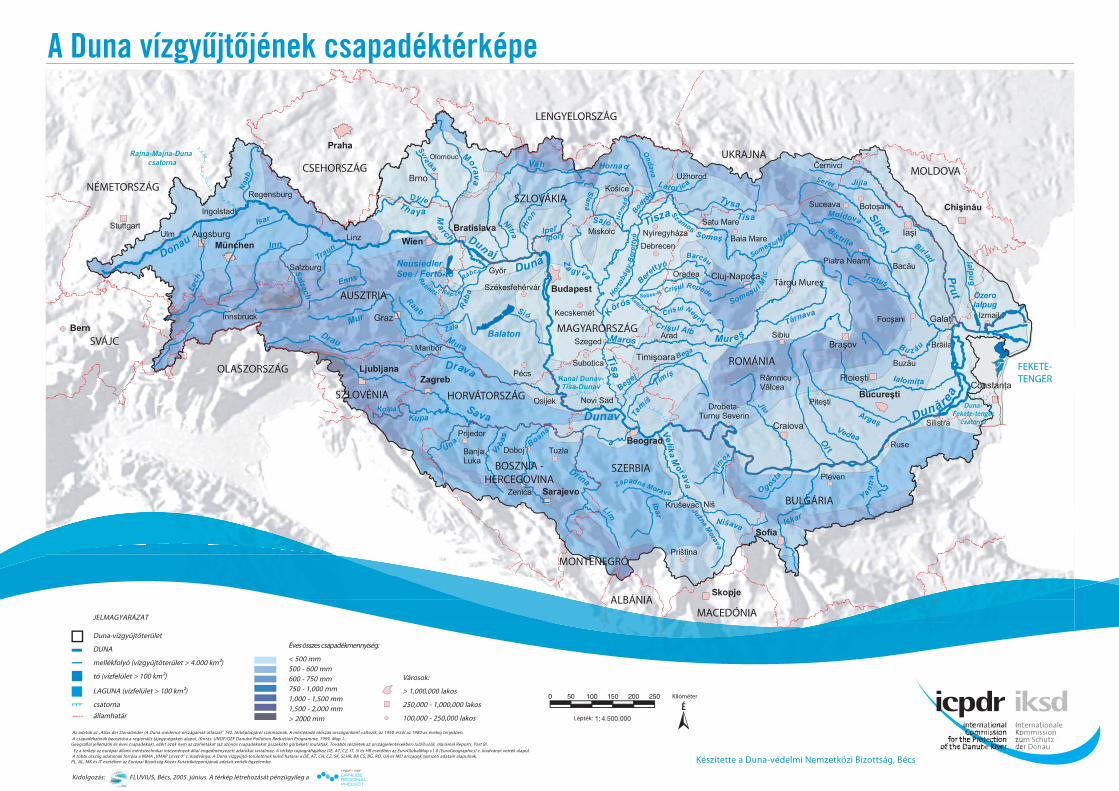
A Duna vízgyűjtőjének csapadéktérképe
This product includes geographical data licensed from European National Mapping Agencies. EuroGlobalMap v1.0 (EuroGeographics) was used as the basic topographic AT, CZ, IT, SI and HR. The data for the other countries is based on VMAP Level 0 data from NIMA. The outer border of the DRBD is based on national information from DE, AT, CH, CZ, SK, SI, HR, BA, CS, BG, RO, UA and MD. For PL, AL, MK the European Commission (Joint Research Centre) was used.
Prepared by FLUVIUS, Vienna, June 2005; The production of this map was financially supported by
Product of ICPDR, ViennaThe data was derived from the 'Atlas of the Danubian Countries' (Map 142: Annual Rainfall, 1980). The time series varies betwee
The data was derived from the 'Atlas of the Danubian Countries' (Map 142: Annual Rainfall, 1980). The time series varies betweeThe data was derived from the 'Atlas of the Danubian Countries' (Map 142: Annual Rainfall, 1980). The time series varies betwee
n countries, covering periods from the 1950s to the 1980s. The precipitation regioáce: UNDP/GEF Danube Pollution Reduction Programme, 1999, M ap 1: Geographical indicators: Geomorphological Regions and Annual Precipitation) and do not represent precipitation isolines. Further details are contained in the National reports (Part B).
This product includes geographical data licensed from European National Mapping Agencies. EuroGlobalMap v1.0 (EuroGeographics) was used as the basic topographic AT, CZ, IT, SI and HR. The data for the other countries is based on VMAP Level 0 data from NIMA. The outer border of the DRBD is based on national information from DE, AT, CH, CZ, SK, SI, HR, BA, CS, BG, RO, UA and MD. For PL, AL, MK the European Commission (Joint Research Centre) was used.
Prepared by FLUVIUS, Vienna, June 2005; The production of this map was financially supported by
n countries, covering periods from the 1950s to the 1980s. The precipitation regions are based on regional landscape units (source: UNDP/GEF Danube Pollution Reduction Programme, 1999, M ap 1: Geographical indicators: Geomorphological Regions and Annual Precipitation) and do not represent precipitation isolines. Further details are contained in the National reports (Part B).
Târgu Mureş
Duna-Fekete-tenger
csatorna
NÉMETORSZÁG
SVÁJC
OLASZORSZÁG
CSEHORSZÁG
AUSZTRIA
SZLOVÉNIA HORVÁTORSZÁG
MAGYARORSZÁG
BOSZNIA - HERCEGOVINA
SZERBIA
ROMÁNIA
MOLDOVAUKRAJNA
LENGYELORSZÁG
SZLOVÁKIA
BULGÁRIA
FEKETE-TENGER
MACEDÓNIAALBÁNIA
MONTENEGRÓ
Product of ICPDR, ViennaThe data was derived from the 'Atlas of the Danubian Countries' (Map 142: Annual Rainfall, 1980). The time series varies betwee
TheThe datadata waswas derivedderived fromfrom thethe 'Atlas'Atlas ofof thethe DanubianDanubian Countries'Countries' (Map(Map 142:142: AnnualAnnual Rainfall,Rainfall, 1980).1980). TheThe timetime seriesseries variesvaries betwebetweee
regioáce: UNDP/GEF Danube Pollution Reduction Programme, 1999,
ThisThisThisThis productproductproductproduct includesincludesincludesincludes geographicalgeographicalgeographicalgeographical datadatadatadata licensedlicensedlicensedlicensed fromfromfromfrom EuropeanEuropeanEuropeanEuropean NationalNationalNationalNational MappingMappingMappingMappingiiii Agencies.Agencies.Agencies.Agencies.AAAAAAA EuroGlobalMapEuroGlobalMapEuroGlobalMapEuroGlobalMap v1.0v1.0v1.0v1.0 (EuroGeographics)(EuroGeographics)(EuroGeographics)(EuroGeographics) waswaswaswas usedusedusedused asasasas thethethethe basicbasicbasicbasic topographictopographictopographictopographic AAAATTTTAAAAAAAAA ,,,,TTTTTT CZ,CZ,CZ,CZ, IIIITTTT,,,,TTTTTT SISISISI andandandand HR.HR.HR.HR. TheTheTheThe datadatadatadata forforforfor thethethethe otherotherotherother countriescountriescountriescountries isisisis basedbasedbasedbased ononononVMAPVMAPVMAPVMAP LevelLevelLevelLevel 0000 datadatadatadata fromfromfromfrom NIMA.NIMA.NIMA.NIMA. TheTheTheThe outerouterouterouter borderborderborderborder ofofofof thethethethe DRBDDRBDDRBDDRBD isisisis basedbasedbasedbased onononon nationalnationalnationalnational informationinformationinformationinformation fromfromfromfrom DE,DE,DE,DE, AAAATTTTAAAAAAAAA ,,,,TTTTTT CH,CH,CH,CH, CZ,CZ,CZ,CZ, SK,SK,SK,SK, SI,SI,SI,SI, HR,HR,HR,HR, BABABABA,,,, CS,CS,CS,CS, BG,BG,BG,BG, RO,RO,RO,RO, UAUAUAUA andandandand MD.MD.MD.MD. ForForForFor PL,PL,PL,PL, AL,AL,AL,AL, MKMKMKMK thethethethe EuropeanEuropeanEuropeanEuropean CommissionCommissionCommissionCommission (Joint(Joint(Joint(Joint ResearchResearchResearchResearch Centre)Centre)Centre)Centre) waswaswaswas usedusedusedused....
PreparedPreparedPreparedPrepared bybybyby LUVIUS,LUVIUS,LUVIUS,LUVIUS, VVVVienna,ienna,ienna,ienna, JuneJuneJuneJune 2005;2005;2005;2005; TheTheTheThe productionproductionproductionproduction ofofofof thisthisthisthis mapmapmapmap waswaswaswas financiallyfinanciallyfinanciallyfinancially supportedsupportedsupportedsupported bbbbyyyy
nnnn countries,countries,countries,countries, coveringcoveringcoveringcovering periodsperiodsperiodsperiods fromfromfromfrom thethethethe 1950s1950s1950s1950s totototo thethethethe 1980s.1980s.1980s.1980s.TheTheTheThe precipitationprecipitationprecipitationprecipitation rrregioáceregioáceregioáceregioácearearee:e:e:e: UUUU b db dNDP/GNDP/GNDP/GNDP/G nnEFEFEFEF regionalegionalDanubeDanubeDanubeDanube PPPPlandscapeandscapePollutionPollutionPollutionPollution ReReReReeductieductieductieducti(source:(souonononon ProgrProgrProgrProgrUNDP/GEFUNDP/GEFramme,ramme,ramme,ramme, 199199199199DanubeDanube99,99,99,99, MMMM PollutionPollution ReductionReduction Programme,Programme, 1999,1999, MM apapapap 1:1:1:1: GeographicalGeographicalGeographicalGeographical indicators:indicators:indicators:indicators: GeomorphologicalGeomorphologicalGeomorphologicalGeomorphological RegionsRegionsRegionsRegions andandandandAnnualAnnualAnnualAnnual Precipitation)Precipitation)Precipitation)Precipitation) andandandand dodododo notnotnotnot representrepresentrepresentrepresent precipitationprecipitationprecipitationprecipitation isolines.isolines.isolines.isolines. FurtherFurtherFurtherFurther detailsdetailsdetailsdetails areareareare containedcontainedcontainedcontained inininin thethethethe NationalNationalNationalNational reportsreportsreportsreports (Part(Part(Part(Part B)B)B)B)....
, ,
Ez a térkép az európai állami méréstechnikai intézmények által engedményezett adatokat tartalmaz. A térkép topográfiájához DE, AT, CZ, IT, SI és HR esetében az EuroGlobalMap v1.0 (EuroGeographics) c. kiadványt vették alapul.A többi ország adatainak forrása a NIMA „VMAP Level 0” c. kiadványa. A Duna vízgyűjtő-területének külső határai a DE, AT, CH, CZ, SK, SI,HR, BA CS, BG, RO, UA és MD országok nemzeti adatain alapulnak.
PL, AL, MK és IT esetében az Európai Bizottság Közös Kutatóközpontjának adatait vették figyelembe.
Kidolgozás: FLUVIUS, Bécs, 2005. június. A térkép létrehozását pénzügyileg a
A csapadékzónák beosztása a regionális tájegységeken alapul, (forrás: UNDP/GEF Danube Pollution Reduction Programme, 1999, Map 1.: Geográfiai jellemzők és éves csapadékok), ezért azok nem az izohiétákat (az azonos csapadékokat összekötő görbéket) mutatják. További részletek az országjelentésekben találhatók, (National Reports, Part B).
Az adatok az „Atlas der Donaländer (A Duna-medence országainak atlasza)” 142. térképlapjáról származnak. A mértékadó időszak országonként változik, az 1950-estől az 1980-as évekig terjedően.
Rajna-Majna-Duna csatorna
Kilométer
Lépték: É
Készítette a Duna-védelmi Nemzetközi Bizottság, Bécs
JELMAGYARÁZAT
Duna-vízgyűjtőterület
DUNA
mellékfolyó (vízgyűjtőterület > 4.000 km2)
tó (vízfelület > 100 km2)
LAGUNA (vízfelület > 100 km2)
csatornaállamhatár
Városok:
> 1,000,000 lakos
250,000 - 1,000,000 lakos
100,000 - 250,000 lakos
Éves összes csapadékmennyiség:
< 500 mm500 - 600 mm600 - 750 mm750 - 1,000 mm1,000 - 1,500 mm1,500 - 2,000 mm> 2000 mm


