Download - A grid-based model for developing regional water scenarios – applications in Europe and elsewhere

A grid-based model for developing regional water scenarios – applications in Europe and elsewhereFrank Farquharson

1. What is going on in Europe on topics related to “European water Scenarios” ?1. What is going on in Europe on topics related to “European water Scenarios” ?
European river flow regimes (Report to European Environment Agency), Arnell et al., 1993
The impact of Climate and other Hydrological events on European Water Supply (CHEWS), Farquharson et al, 1997 (ENV4-CT95-0138)
Estimation of Renewable water resources in the European Union (ERASM), Rees & Cole, 1997 (EUROSTAT for the European Environment Agency)
Advances in Regional Hydrology through East European Cooperation, Gustard & Cole, 1997 (ERB CIPA CT92-4018)
Groundwater and River Resources Action Programme on a European scale (GRAPES), Acreman et al, 2000 (ENV4-CT96-0186)
Assessment of the Regional Impact of Droughts in Europe (ARIDE), Demuth & Stahl (Eds), 2001 (ENV4–CT97-0553)
Establishment of a Regional Data Centre of the European Water Archive for the European territory of the former Soviet Union, 1999 (INTAS 94-4451)
European FRIEND Programme (CEH maintains a database of daily mean flows from 5000 stations from 30 countries in Europe) (UNESCO IHP)
Hydrological and hydrodynamic studies and predictions of Caspian Sea level rise; Impact of Climate and Man’s activities, Farquharson et al, 2000 (INCO-COPERNICUS IC15-CT97-0101)
Grid-based model of the Caspian Sea Basin, Meigh & Tate, 2001 (TACIS, ENVREG 9504)
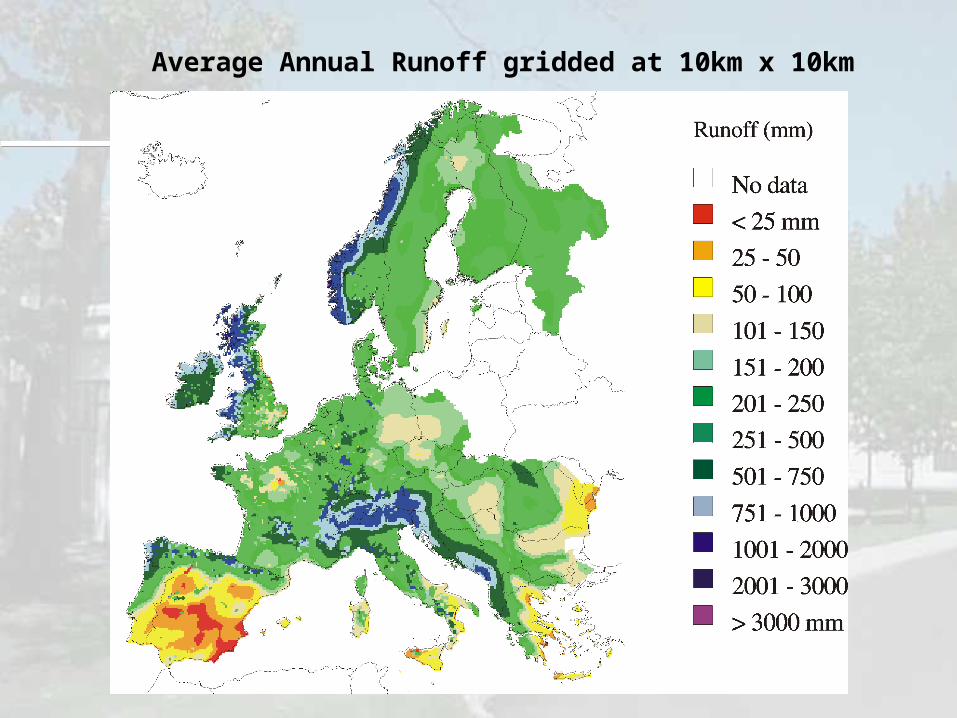
Average Annual Runoff gridded at 10km x 10km
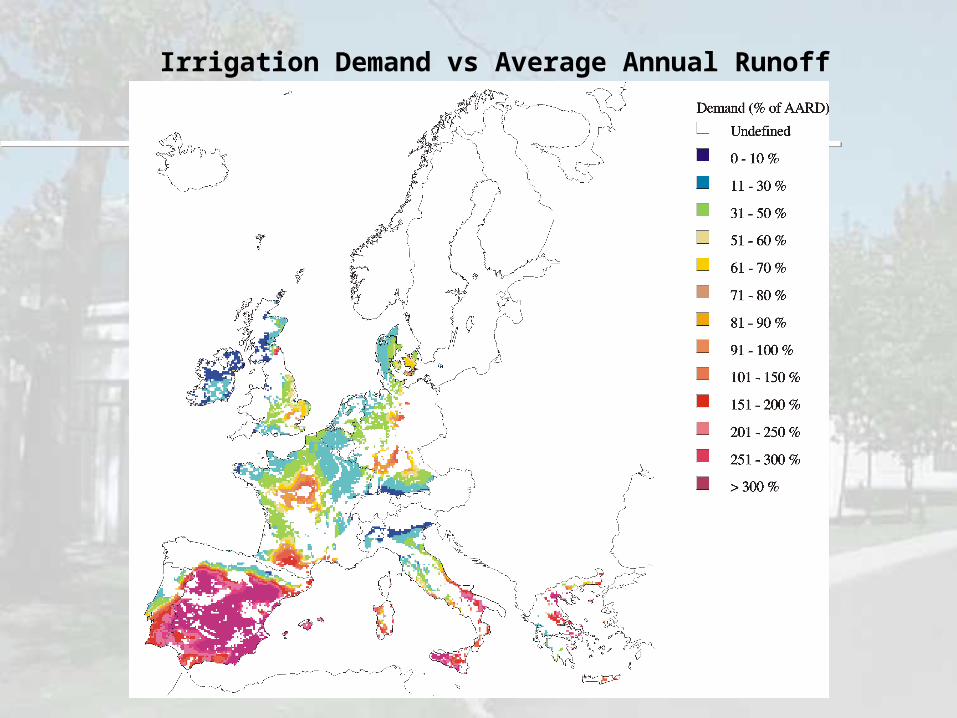
Irrigation Demand vs Average Annual Runoff

Urban Demand vs Average Annual Runoff

2. Projection of possible scenarios on a 25-50 years scale2. Projection of possible scenarios on a 25-50 years scale
Much of CEH’s experience has been restricted to impacts of climate change scenarios
However, we have also considered socio-economic factors: Changing demand Water Poverty Index Climate Vulnerability Index
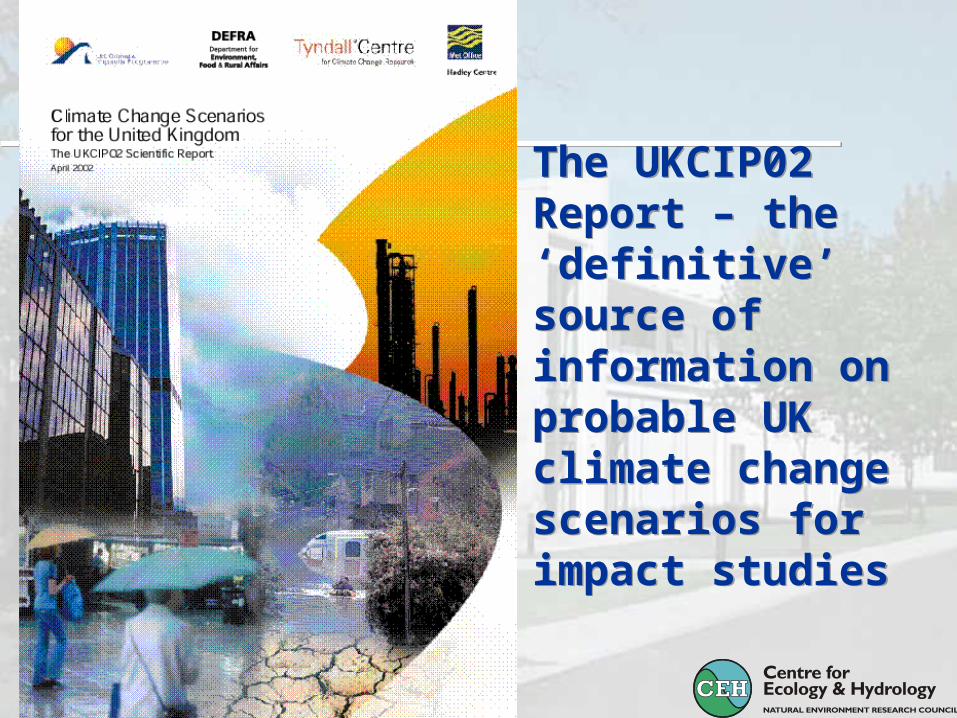
The UKCIP02 Report – the ‘definitive’ source of information on probable UK climate change scenarios for impact studies
The UKCIP02 Report – the ‘definitive’ source of information on probable UK climate change scenarios for impact studies
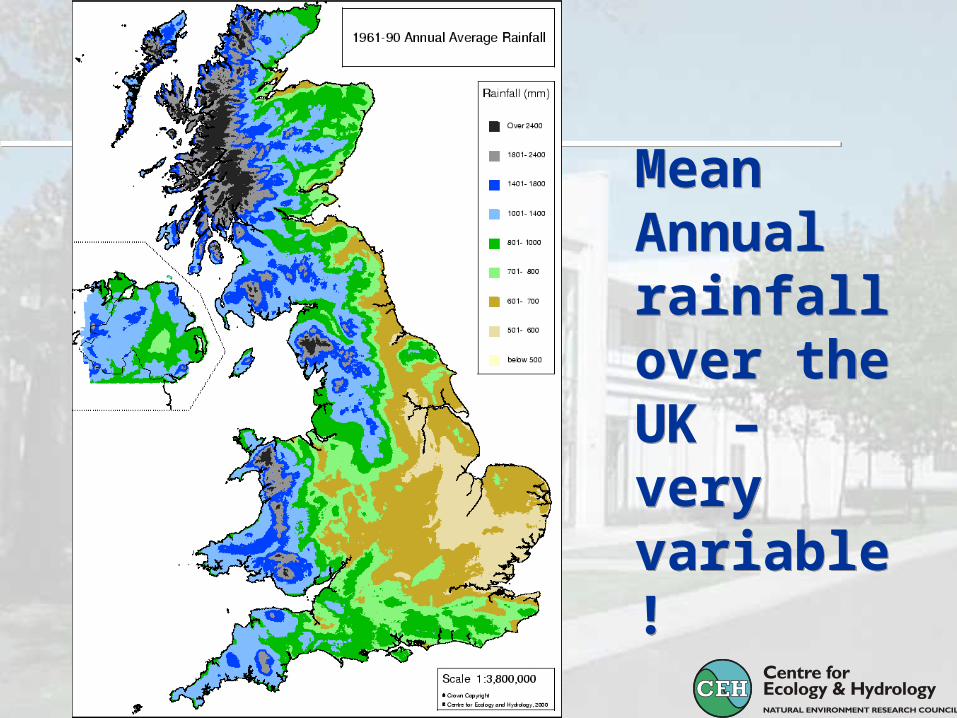
Mean Annual rainfall over the UK – very variable !
Mean Annual rainfall over the UK – very variable !
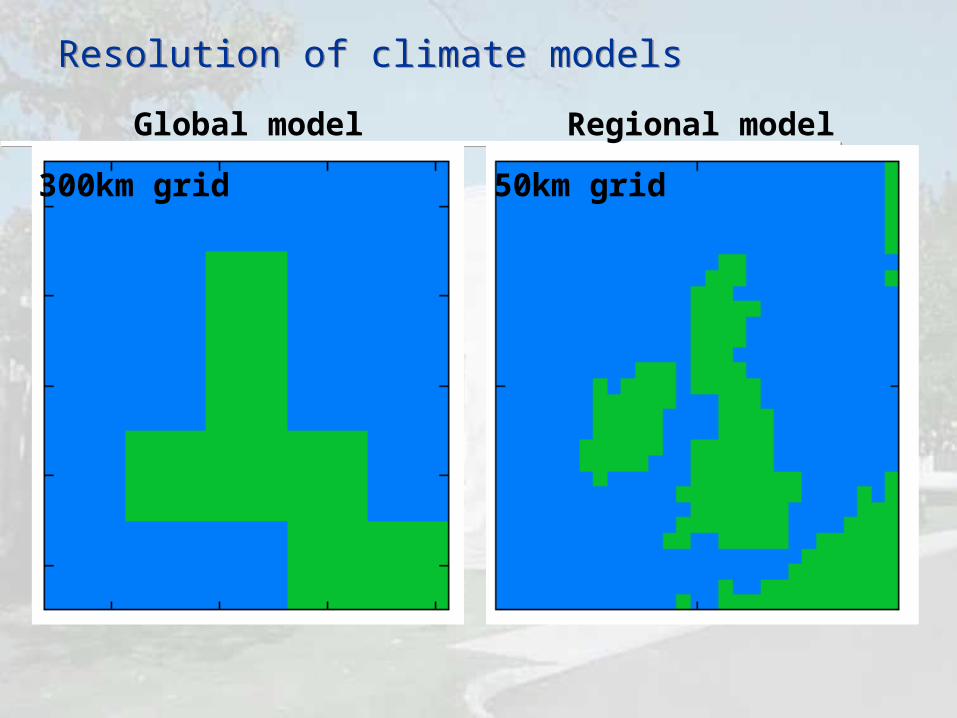
Resolution of climate modelsResolution of climate models
Global model Regional model
300km grid 50km grid

Present day winter precipitation over BritainObserved, and simulated with RCM and GCMPresent day winter precipitation over BritainObserved, and simulated with RCM and GCM
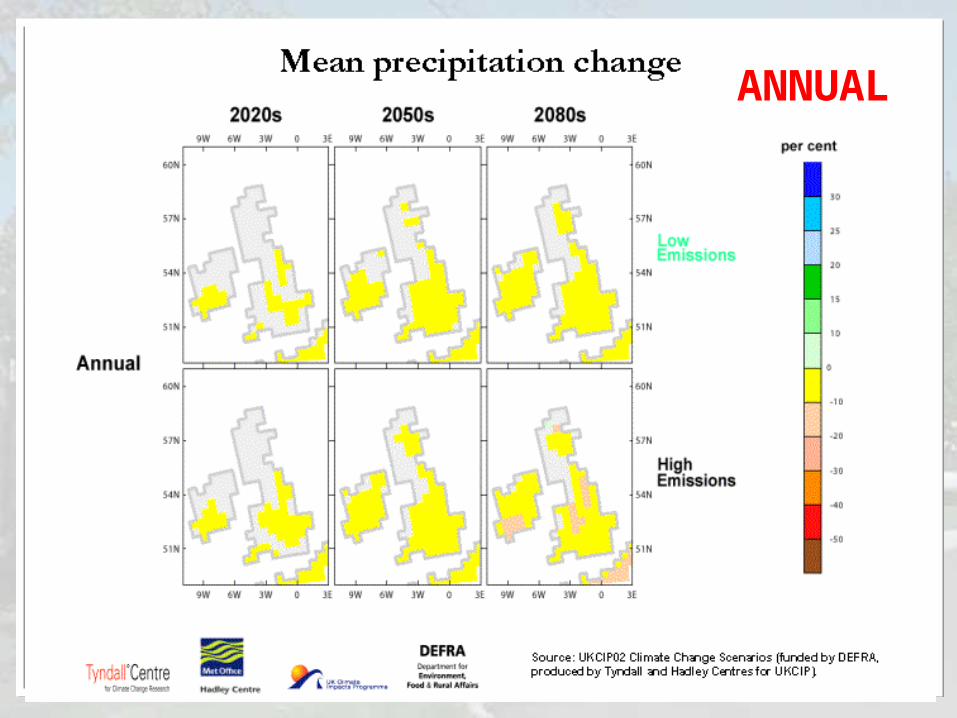
ANNUAL

WINTER
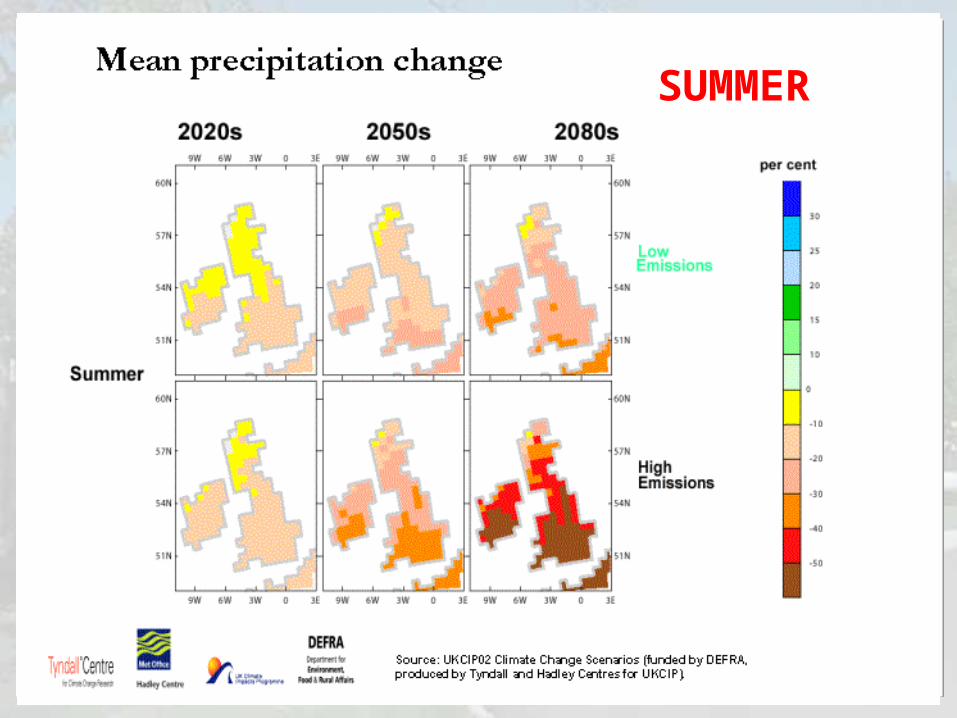
SUMMER
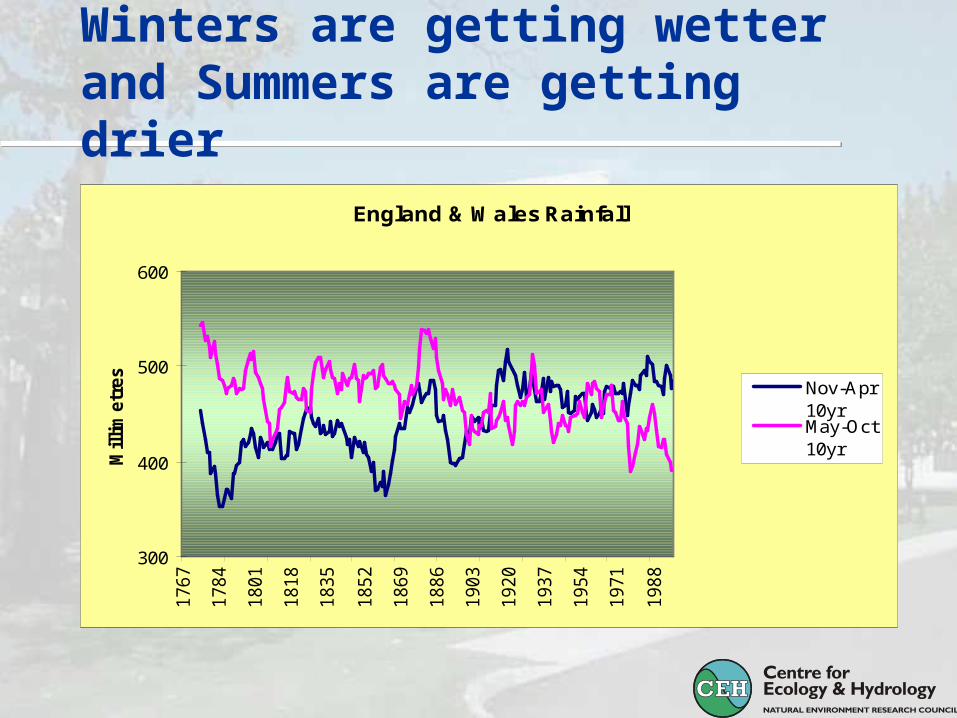
Winters are getting wetter and Summers are getting drier
England & Wales Rainfall
300
400
500
600
1767
1784
1801
1818
1835
1852
1869
1886
1903
1920
1937
1954
1971
1988
Millim
etr
es
Nov-Apr10yrMay-Oct10yr

UK Summer daily rainfall (showing ability to simulate extremes)UK Summer daily rainfall (showing ability to simulate extremes)
0.001
0.01
0.1
1
10
10mm 20mm 30mm
observations regional model global model
Pro
bab
ilit
y %
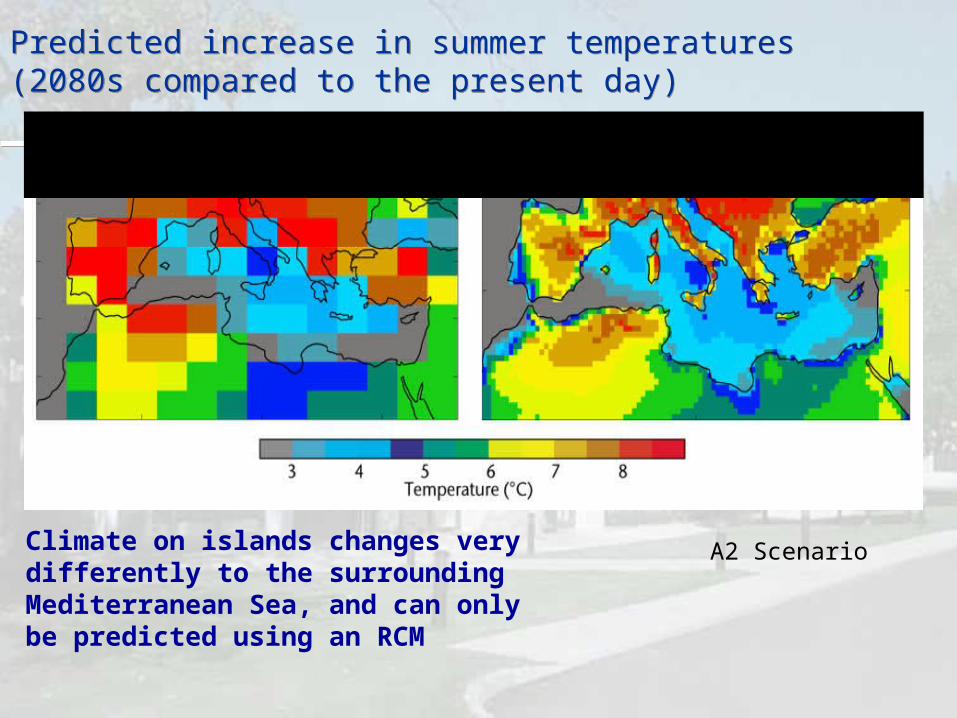
Predicted increase in summer temperatures (2080s compared to the present day)Predicted increase in summer temperatures (2080s compared to the present day)
Climate on islands changes very differently to the surrounding Mediterranean Sea, and can only be predicted using an RCM
Global climate model Regional climate model
A2 Scenario
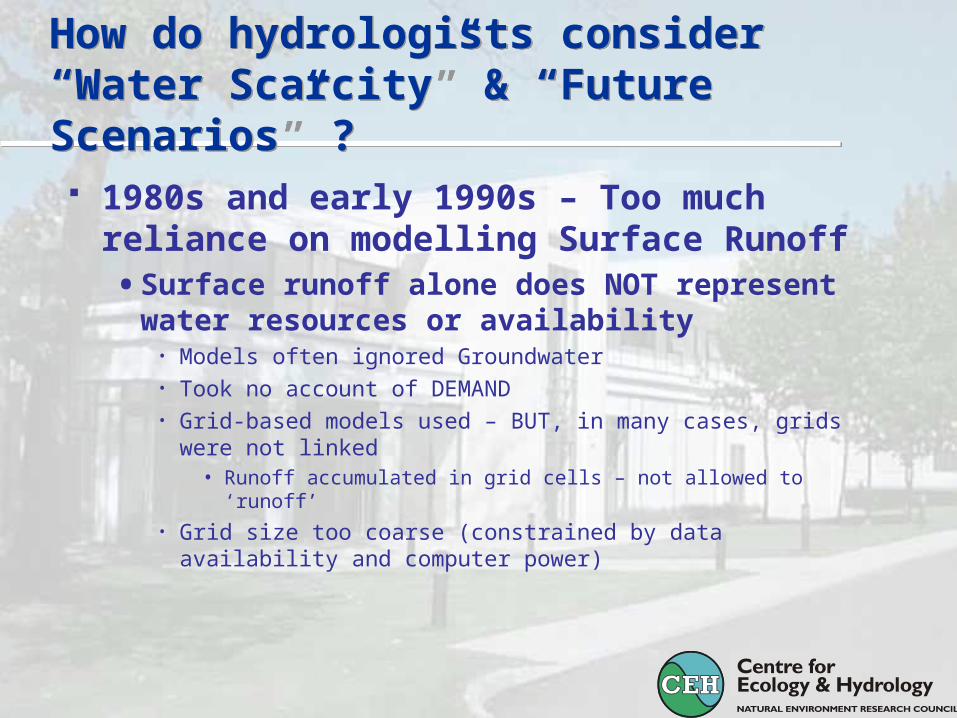
How do hydrologists consider “Water Scarcity” & “Future Scenarios” ?How do hydrologists consider “Water Scarcity” & “Future Scenarios” ?
1980s and early 1990s – Too much reliance on modelling Surface Runoff• Surface runoff alone does NOT represent water
resources or availability • Models often ignored Groundwater• Took no account of DEMAND• Grid-based models used – BUT, in many cases, grids were not
linked• Runoff accumulated in grid cells – not allowed to ‘runoff’
• Grid size too coarse (constrained by data availability and computer power)
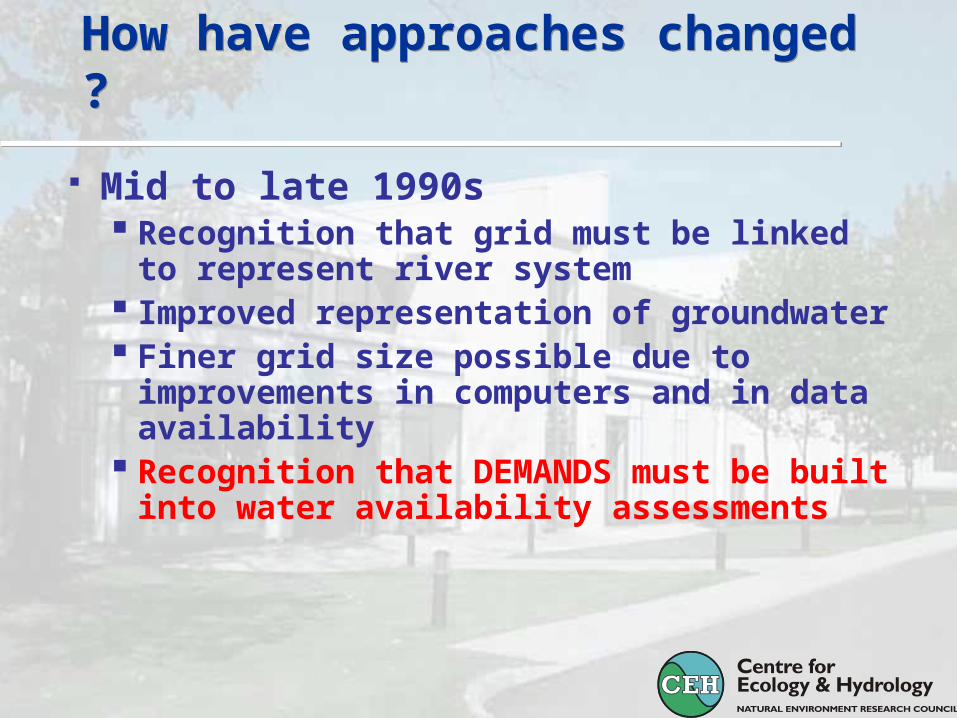
How have approaches changed ?How have approaches changed ?
Mid to late 1990s Recognition that grid must be linked to
represent river system Improved representation of groundwater Finer grid size possible due to
improvements in computers and in data availability
Recognition that DEMANDS must be built into water availability assessments
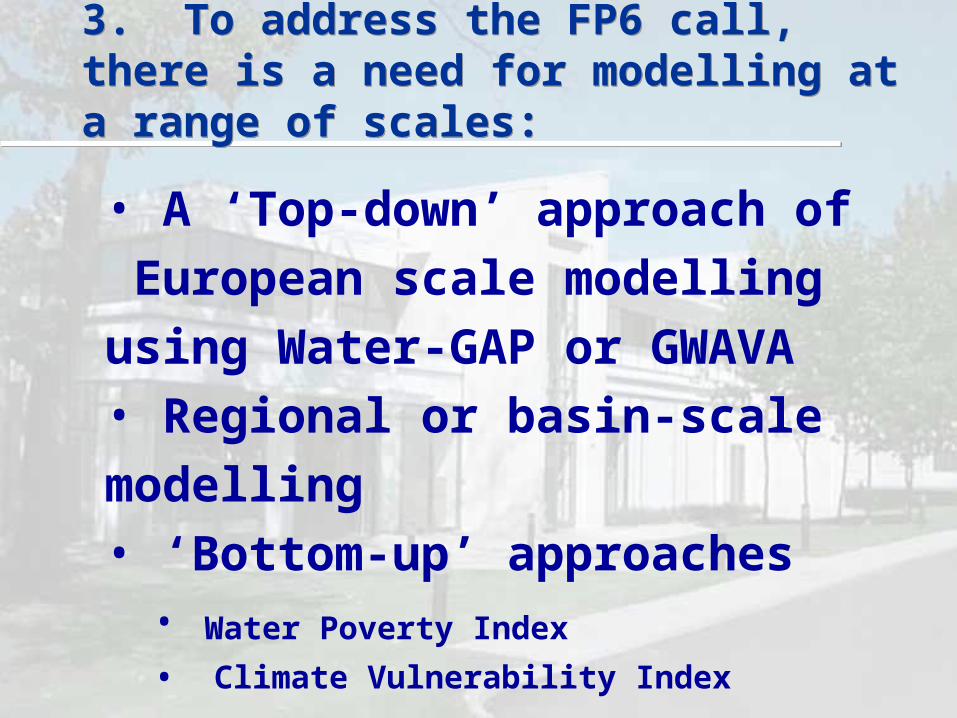
3. To address the FP6 call, there is a need for modelling at a range of scales:
3. To address the FP6 call, there is a need for modelling at a range of scales:
• A ‘Top-down’ approach of European scale modelling using Water-GAP or GWAVA• Regional or basin-scale modelling• ‘Bottom-up’ approaches
• Water Poverty Index
• Climate Vulnerability Index

GWAVA ModelGWAVA Model Global Water AVailability
Assessment
Not yet applied Globally
Developed and applied to 20
countries in Eastern and
Southern Africa (1994-98)
Applied to Volga Basin
(Russia) and Caspian Sea
basin (1999-2000) (INCO-
COPERNICUS & TACIS funding)
Also applied to 20 countries
in West Africa (2001-02) (FP5)
Studying impacts of climate
change on Bangladesh (2003-
05)

GWAVA ModelGWAVA Model
10N
20N
0N0W
10W
10E
20ET U R K E Y
I R A N
R U S S I A
U K R A IN E
I R A Q
S Y R I A
G E O R G I A
K A Z A K H S T A N
U Z B E K I S T A N
T U R K M E N I S T A N
Bla c k Se a
Ara l Se a
Ca
spia
n S ea
Vo lga
K u m a
S am ur
S afid R
ud
A trek
Kura
Terek
S u lak
Araks
Ural
Em
ba
B a k u
Te h ran
Vo lgo g rad
M o sco wO ka
M a h ab e t
Ve tlu g a
S u ra
Sta ritsaB e la ya
V iatka
S a m a ra
T b lis i
65 No
30 Eo
65 Eo
33 No
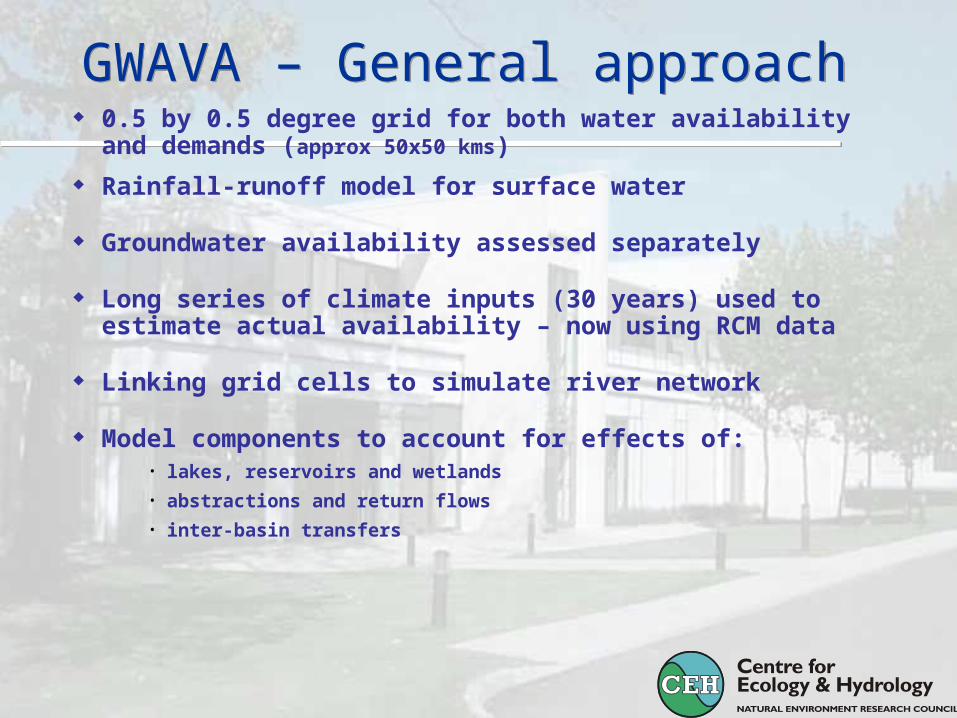
GWAVA – General approachGWAVA – General approach 0.5 by 0.5 degree grid for both water availability and
demands (approx 50x50 kms)
Rainfall-runoff model for surface water
Groundwater availability assessed separately
Long series of climate inputs (30 years) used to estimate actual availability – now using RCM data
Linking grid cells to simulate river network
Model components to account for effects of:• lakes, reservoirs and wetlands
• abstractions and return flows
• inter-basin transfers

APPROACH – contd.APPROACH – contd.
Groundwater availability based on aquifer properties (areal extent, transmissivity, specific yield etc.) and recharge estimates
Water demands based on current and projected population and livestock numbers, information on irrigation and industrial use (i.e. socio-economic factors)
Indices of water availability versus demand derived at the grid cell scale
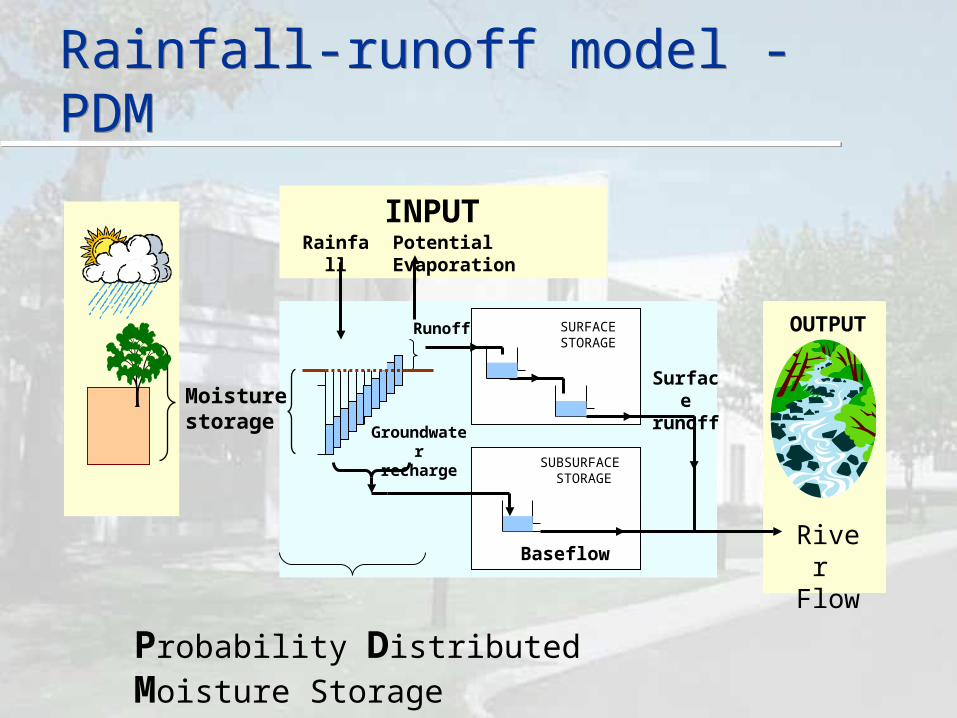
Rainfall-runoff model - PDMRainfall-runoff model - PDM
Moisture storage
Runoff
SUBSURFACE STORAGE
Surfacerunoff
River Flow
SURFACE STORAGE
Potential EvaporationRainfall
INPUT
OUTPUT
Baseflow
Groundwaterrecharge
Probability Distributed Moisture Storage
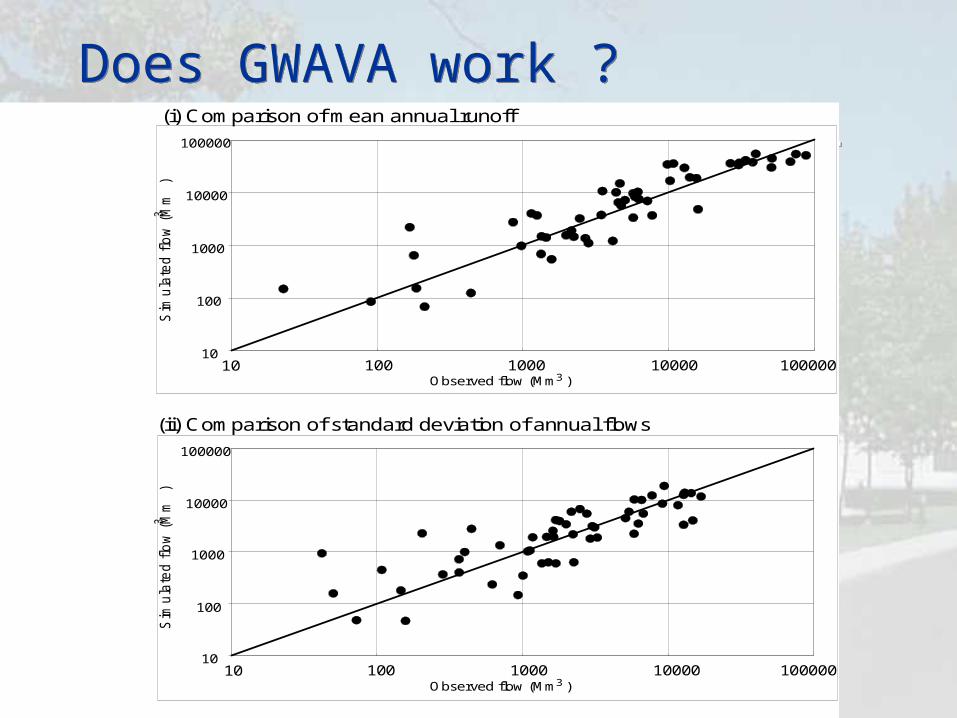
Does GWAVA work ?Does GWAVA work ?
45
44
43
42
41
40
39
38
37
36
35
34
33
32
31
30
29
28
27
26
25
24
23
22
21
20
19
18
17
16
15
14
13
12
11
10
9
8
7
6
5
4
3
2
1
45
44
43
42
41
40
39
38
37
36
35
34
33
32
31
30
29
28
27
26
25
24
23
22
21
20
19
18
17
16
15
14
13
12
11
10
9
8
7
6
5
4
3
2
1
45
44
31
30
29
20
16
15
14
13
12
11
10
9
8
7
6
5
4
3
2
1
54
53
52
51
50
49
48
47
46
45
44
43
42
41
40
39
38
37
36
3534
33
32
31
30
29
28
27
26
25
2423
22
21
20
19
18
1716
15
1413
12
11
10
9
8
7
6
5
4
3
2
1
54
53
51
49
48
45
44
43
42
40
39
38
37
36
35
34
33
32
31
30
29
28
27
26
25
24
23
20
19
18
17
16
15
14
13
12
9
8
7
6
5
4
3
2
1
54
53
52
51
50
49
48
4746
45
44
43
42
41
40
39
38
37
36
3534
33
32
31
30
29
28
27
26
25
24
23
22
21
20
19
18
17
16
15
1413
12
11
10
9
8
7
6
5
43
2
1
0.1
1
10
100
1000
10000
0.1 1 10 100 1000 10000Observed flow (Mm )3
Sim
ula
ted
flo
w (
Mm
)
3
0.1
1
10
100
1000
10000
0.1 1 10 100 1000 10000
Sim
ula
ted
flo
w (
Mm
)
3
Observed flow (Mm )3
43424140393837363534333228272625242322211918170.001
0.01
0.1
1
10
100
0.001 0.01 0.1 1 10 100
Sim
ula
ted
flo
w (
Mm
)
3
Observed flow (Mm )3
Observed flow (Mm )3
Sim
ula
ted
flo
w (
Mm
)
3
10
100
1000
10000
100000
10 100 1000 10000 100000
Sim
ula
ted
flo
w (
Mm
)
3
Observed flow (Mm )3
5250474641222111100.1
1
10
100
1000
10000
0.1 1 10 100 1000 10000
(i) Comparison of mean annual runoff
(ii) Comparison of standard deviation of annual flows
(ii) Comparison of 90% reliable dry month flows
(i) Comparison of mean annual runoff
(iii) Comparison of 90% reliable dry month flows
(ii) Comparison of standard deviation of annual flows
Sim
ula
ted
flo
w (
Mm
)
3
Observed flow (Mm )3
10
100
1000
10000
100000
10 100 1000 10000 100000
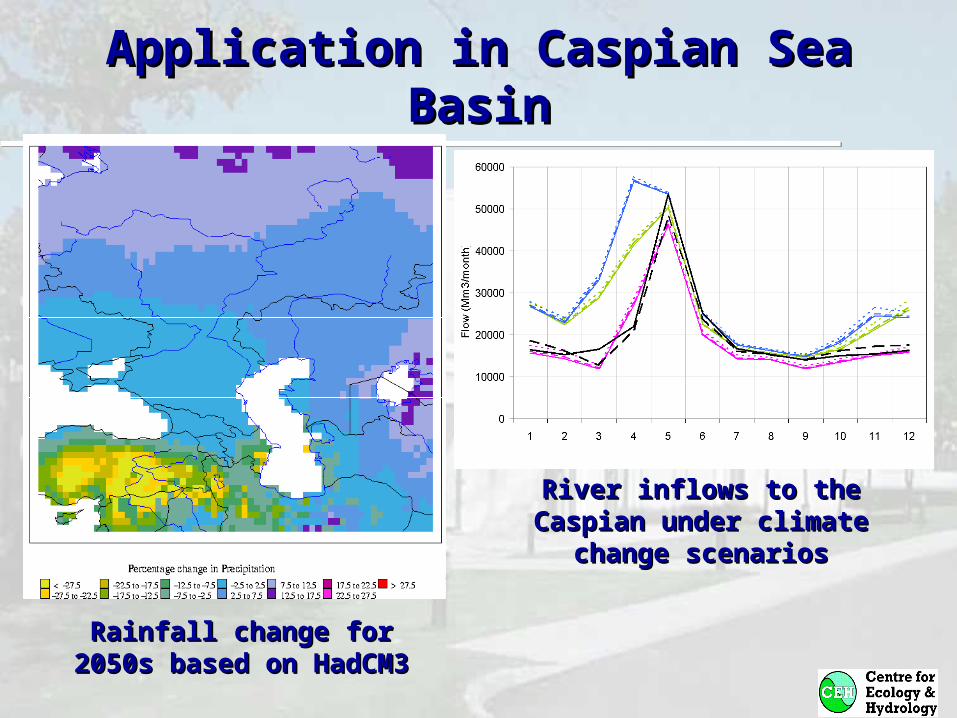
Application in Caspian Sea Application in Caspian Sea BasinBasin
River inflows to the River inflows to the Caspian under climate Caspian under climate
change scenarioschange scenarios
Rainfall change for Rainfall change for 2050s based on 2050s based on
HadCM3HadCM3
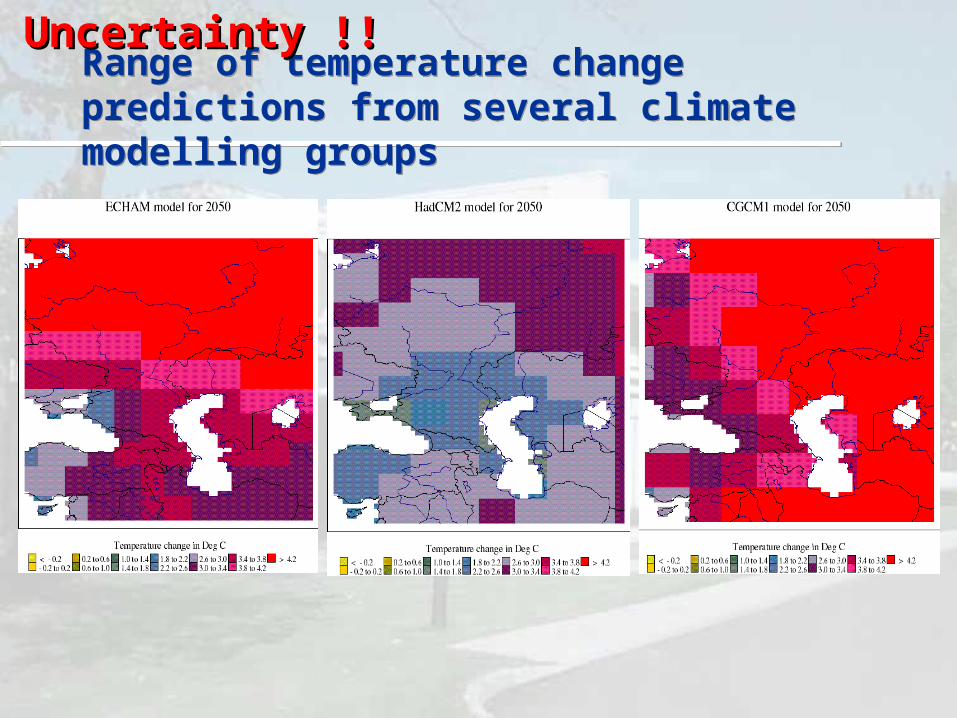
Range of temperature change predictions from several climate modelling groups
Range of temperature change predictions from several climate modelling groups
Uncertainty !!Uncertainty !!

Uncertainty !!Uncertainty !!Runoff changes for 2050s estimated from 3 GCMsRunoff changes for 2050s estimated from 3 GCMs
HadCM2
CGCM1 Echam4
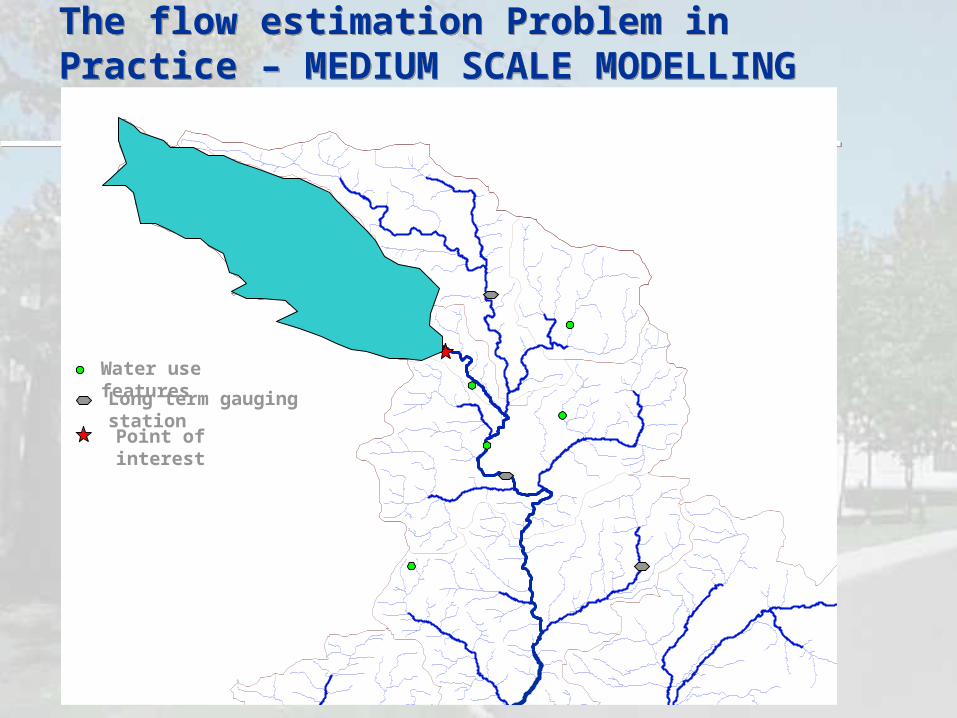
The flow estimation Problem in Practice – MEDIUM SCALE MODELLINGThe flow estimation Problem in Practice – MEDIUM SCALE MODELLING
Water use features
Long term gauging station
Point of interest
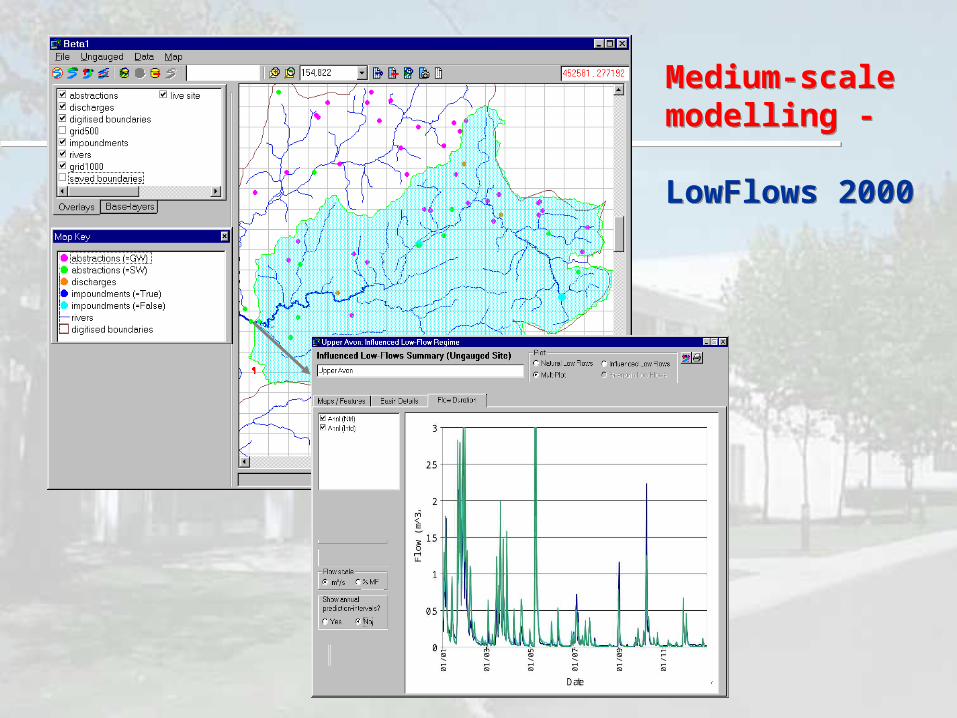
Medium-scale modelling -
LowFlows 2000
Medium-scale modelling -
LowFlows 2000
“Bottom-up”, Semi-qualitative approach“Bottom-up”, Semi-qualitative approach
Use techniques developed at
Wallingford by Caroline Sullivan and
Jeremy Meigh
Water Poverty Index
Climate Vulnerability Index
CONCLUSIONSCONCLUSIONS
Problems need to be tackled at a variety of scales – both in space and time
Data availability is more of a constraint than models/tools
The challenge is to bring together a range of uncertain future scenarios, derived from a variety of sources; some of which are quantified, others just quality descriptors
Natural scientists must continue to learn how to collaborate with social and economic specialists

Thank You !


