Int. J. Peptide Protein Res 24, 1984,219-296
A potential function for conformational analysis of proteins
G.M. CRIPPEN a d Y.N. VISWANADHAN
Department of Chemistry, Texas A & M University, College Station, Texas, USA
Received 15 November 1983, accepted for publication 15 March 1984
We have devised a residue-residue potential function for low resolution protein conformational calculations. The interactions between residues near in sequence maintain correct secondary structure, while the long-range terms in the poten- tial govern the larger packing features and overall globularity. The short-range terms were calculated by comparing the observed distributions of distances between Ca atomsin 35 protein crystal structures to the expected distributions and assigning the discrepancies to a Boltzmann distribution due to an effective potential. Long-range terms were adjusted to ensure that the crystal structure of bovine pancreatic trypsin inhibitor has a lower total energy than perturbed conformations of the same molecule. Thus the empirical potential function implicity contains solvation and conformational entropy effects along with the usual Van der Waals and electrostatic energies. Extensive testing of the potential on trypsin inhibitor and other proteins establishes that it is generally applicable to small proteins, it does not attempt to compress or expand the conformations found by X-ray crystallography, standard secondary structural features are maintained under the potential, and there are so many local minima that local minimization can be trusted to return a perturbed structure to the native conformation only if they differ initially by less then 1 A. Key words: amino acid residue; conformation; energy embedding; potential energy; protein
One of the standard approaches for attempting to calculate the tertiary structure of a globular protein, given only its sequence, is to search for conformations of low calculated energy. Recent advances in the distance geometry approach, called energy embedding (1, 2), enable us to find very rare, low energy conformations possibly subject to additional distance con- straints. For general application of energy embedding to protein conformational calcu- lations, the energy function must have the following characteristics: (i) the molecule must be represented as a collection of points in space, where each point may represent a single atom
or some group of atoms; (ii) the energy is calculated as a sum of pairwise interaction terms between all pairs of points; (iii) each term depends isotropically on the distance between the points and on which points they are; and (iv) each term’s functional dependence on distance may have only a single minimum (unimodality). The need for each of these requirements is clear from an examination of the energy embedding algorithm (l), and will not be discussed here. In order for the potential to be applied successfully to many different proteins, we must further require that (v) the identity of the interacting points in the
279
G.M. Crippen and V.N. Viswanadhan
third requirement can only be specified on the basis of chemical type (atom type, residue type, etc.) and/or relative position in the amino acid sequence.
The purpose of this paper is to present a generally useful methodology for finding a potential of the above form given crystal structures of a number of proteins, and to examine the suitability of the potential we have produced for protein conformational calcu- lations. A number of potential functions for protein energy calculations have been published, but none fulfill all the design criteria listed above. The one point per atom potentials, such as that of Momany et al. (3), are not strictly sums of pairwise interactions because of the torsional terms they employ. We are also interested in speeding up the calculations by adopting a considerably simplified model of the protein. The function of Pincus & Scheraga (4) takes a step in that direction by maintaining an all-atom representation only for residues near each other in space. Unfortunately, even the one point per residue polyvaline potential of McCammon ( 5 ) and its predecessor (6) have torsional terms about the virtual bonds. Our earlier effort along these lines (7) does not foster good secondary structure, and some of the terms are not unimodal functions of the distance between the interacting residues. Thus we have been forced to devise a new potential adhering strictly to the design criteria.
The first requirement concerns the precision of representation of the protein molecule. Since all pairwise interactions must be included in the calculation of the energy for a given confor- mation, it is obviously much faster to deal with fewer points. Also, the fewer the points, the fewer the local minima in the potential, as an empirical rule. Therefore we have chosen not an all-atom representation, or a sidechain point and a backbone point per residue, but simply one point per amino acid residue, centered at the C". The penalty is that fine details of struc- ture will not be represented, and there may be errors on a scale even larger than the size of the atom clusters used. Without some explicit sidechain points, the isotropic interpoint terms depending only on distance (according to the third requirement) cannot distinguish between a right-handed and a left-handed a helix, for
example. The potential could, however, show a preference for two right-handed helices packed together over the packing of a right-handed one and a left-handed one. Thus it would be possible to arrive at the native conformation except for an overall mirror inversion of the entire mol- ecule, but the relative chirality of the various parts of the molecule could be correctly deduced, in principle. Since our present interest lies in calculating terthry structure of proteins, we do not anticipate that lumping all the atoms of an entire residue together will be too great an approximation.
The fourth requirement forced us to abandon the Oobatake & Crippen (7) potential, because some terms had as many as three minima with respect to the distance between the interacting (2"'s. Energy embedding with this potential nevertheless gave such encouraging results (2) that we felt obliged to devise a more suitable function.
The second requirement turns out to cause a great deal of trouble. We conjecture that whenever the number of pairwise unimodal interaction terms in the potential exceeds the number of conformational degrees of freedom, there will be many local minima. In our experi- ence, the number of local minima rises very rapidly with the number of points (and hence energy terms). For example, consider points labeled 1 and 2 constrained to lie on the x-axis. If the potential F consists simply of quadratic terms, then
and there is clearly only a single minimum (at Ixl -x2 I = l ) , a single interaction term, and one degree of conformational freedom. If we now add a third point and change F to
+ (2 - d d 2
then there are three terms in F and two confor- mational degrees of freedom. In all there are three minima: F(0, 1 , 2) = 0, F(0, 513, 413) = 413, and F(0, - 113, 413) = 413. The situation quickly becomes more complicated in three dimensions, but we have observed a high density of local minima for systems of many
280
Protein conformational energy
sequentially adjacent quartets of residue points) for all i . Physically it is clear that there must be some sort of energy term for residues with greater sequence separation, although such effects could be built into possibly complicated functional forms for the short-range inter- action terms, in principle. We instead chose to keep all interaction terms in the energy in spite of there being insufficient conformational degrees of freedom to make a one-to-one assignment between terms and conformational parameters. That left us with considerable ambiguity as to how the total energy should be apportioned among the many terms, and we have used that latitude to keep the functional forms of the terms simple and unimodal. .
points with even the simplest of unimodal interaction terms.
A second difficulty with having more interaction terms than degrees of freedom arises when trying to deduce the “energy” function causing observed conformations. Suppose the set of conformational parameters, (@i}, i = 1, . . . , N (representing bond lengths, angles, dihedral angles, etc.), are a necessary and sufficient set of parameters to completely describe a molecule’s conformation. Further suppose that the 9’s are mutually independent in the global sense that any particular & can assume its full range of values regardless of the values of the other $ii+k. This would not be true, for example, if the 9’s represented inter- point distances. Then suppose we can make a large number of observations on the molecule in an equilibrium system. Estimating for all i the probability of q5i taking on its various possible values, p(&), by the observed normal- ized frequency, we can use standard equilibrium statistical mechanics to conclude
N
i = l p(conformation) = n p(&)
where Z is the partition function. Because of the simple correspondence between statistically independent p(+i)’s and additive energy terms, e(@Js, it is easy to calculate the total probability of any particular conformation, p(confor- mation), and ascribe its frequency of occurrence to a Boltzmann distribution over the energy function. Given a sufficiently large, unbiased set of observations, each q can be deduced for all values of &, for all i. Unfortunately, we are obliged to work with interpoint (interresidue) distances as our conformational variables. Not only are there fundamental geometric inter- dependencies on the values the distances may assume, but there are now many more pairwise interaction terms in the energy sum than there are degrees of conformational freedom. For a polypeptide chain at the single point per residue level, a necessary and sufficient set of conformational parameters would be the di , i+l , d i , f+z , and di,i+j (plus the chirality of
METHOD
We proceed from the assumptions that even lOA diameter regions in protein crystal struc- tures are in thermal equilibrium and that large separation implies weak interaction. Exami- nation of the X-ray diffraction data over the years has led many workers to notice a multi- tude of features in the structures of globular proteins. I t is, however, not immediately obvious which are energetically important, which reveal the fundamental energetics, and which are more complicated consequences of the fundamental interactions. Our general plan of attack is to look at groups of residues that lie very close together in the crystal structures, assume they have a Boltzmann distribution of the unknown energy, and then deduce what the energy must be in order to give such a distri- bution. Then we can consider slightly larger groups of residues, asking whether the “known” parts of the potential are sufficient to give the observed clusters a Boltzmann distribution, and if not, deduce whatever additional energy contributions are needed.
Using the same data set of 35 protein crystal structures employed by Oobatake & Crippen (7), we begin with the obvious. As before, we are assuming we can represent each amino acid residue by a single point located at the CQ. The strongest difference between a protein and a gas is that the residues have sequence number- ing, and ,re distance of closest approach is always found between all sequentially adjacent
28 1
G.M. Crippen and V.N. Viswanadhan
residues, i and i + 1. Given the resolution of the data, about all we can say is that di,i+l = 3.8 f 0.07 A. Some residue type pairs have slight statistical tendencies to deviate more than the given overall standard deviation, but the only justifiable conclusion is to take the i to i + 1 distance to be fued at 3.8A. As an illustration of our formal procedure, we could fit the observed distribution of distances to the gaussian
exp (-0.5 (M)(di,i+ 1 - 3 .8)2 1, (4)
whch is the form for a Boltzmann distribution on a harmonic potential with 14 = k f / R T . That would amount to a force constant k f = 8.3 kcal/A2. In all that follows, we take the force constant t o be so large that di.i+l remains fued at 3.8 A.
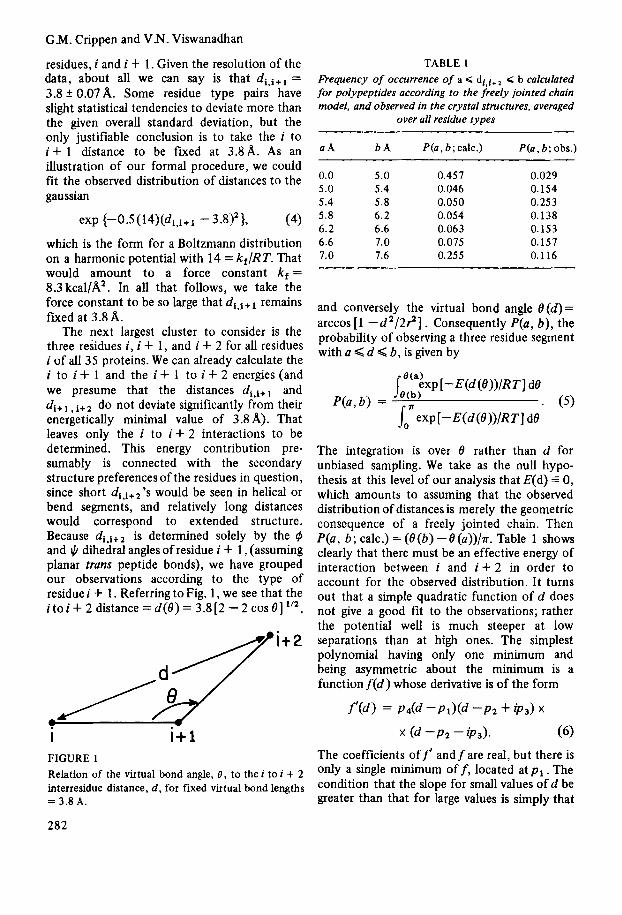
The next largest cluster to consider is the three residues i, i + 1, and i + 2 for all residues i of all 35 proteins. We can already calculate the i to i + 1 and the i + 1 to i + 2 energies (and we presume that the distances diei+, and di+ , i+ do not deviate significantly from their energetically minimal value of 3.8A). That leaves only the i to i + 2 interactions to be determined. This energy contribution pre- sumably is connected with the secondary structure preferences of the residues in question, since short di4i+z’s would be seen in helical or bend segments, and relatively long distances would correspond to extended structure. Because di,i+z is determined solely by the 4 and I) dihedral angles of residue i + 1, (assuming planar trans peptide bonds), we have grouped our observations according to the type of residue i + 1. Referring to Fig. 1, we see that the i t o i + 2 d i s t a n c e = d ( 6 ) = 3 . 8 [ 2 - 2 c o ~ B ] ” ~ ,
I 1+1 FIGURE 1 Relation of the virtual bond angle, 0, to the i to i + 2 interresidue distance, d , for fixed virtual bond lengths = 3.8 A.
282
TABLE 1 Frequency of occurrence of a < diOi,* 6 b calculated for polypeptides according to the freely jointed chain model, and observed in the crystal structures, averaged
over all residue types
a h b h P(a ,b;calc . ) P ( a , b ; obs.)
0.0 5.0 0.457 0.029 5.0 5.4 0.046 0.154 5.4 5.8 0.050 0.25 3 5.8 6.2 0.054 0.138 6.2 6.6 0.063 0.153 6.6 7.0 0.075 0.157 7.0 7.6 0.255 0.116
and conversely the virtual bond angle 0 (d) = arccos [ l - d 2 / 2 ? ] . Consequently P(a, b ) , the probability of observing a three residue segment with a < d Q b , is given by
The integration is over 0 rather than d for unbiased sampling. We take as the null hypo- thesis at this level of our analysis that E(d) = 0, which amounts to assuming that the observed distribution of distances is merely the geometric consequence of a freely jointed chain. Then P(a, b ; calc.) = (B(b) -B(u))/a. Table 1 shows clearly that there must be an effective energy of interaction between i and i + 2 in order to account for the observed distribution. It turns out that a simple quadratic function of d does not give a good fit to the observations; rather the potential well is much steeper at low separations than at high ones. The simplest polynomial having only one minimum and being asymmetric about the minimum is a function f(d) whose derivative is of the form
f’W = P‘dd -PI)@ -P2 + iP3) x
x (d -P2 - iP3) . ( 6 )
The coefficients off andfare real, but there is only a single minimum off , located at p l . The condition that the slope for small values of d be greater than that for large values is simply that
Protein conformational energy
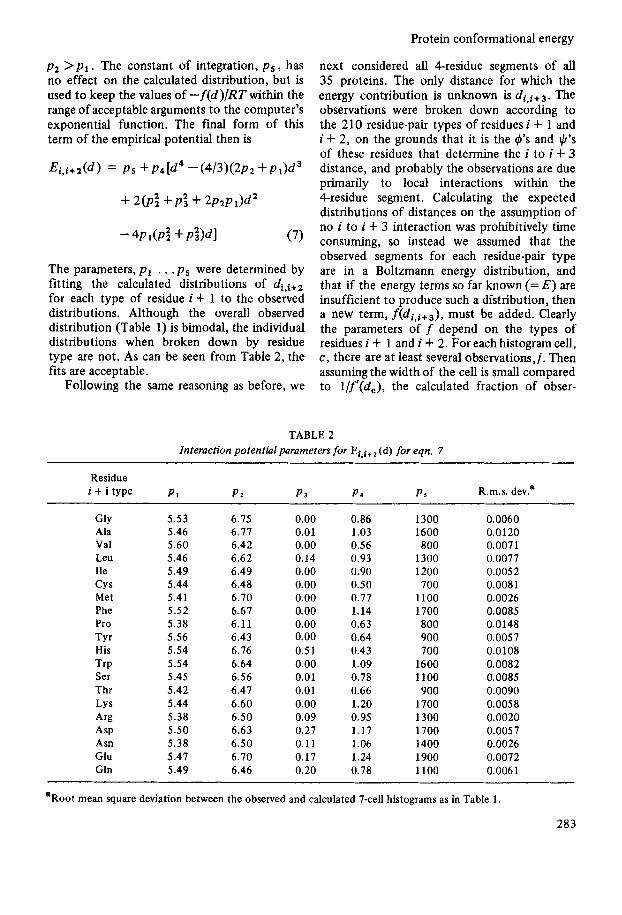
p z > p l . The constant of integration, p s , has no effect on the calculated distribution, but is used to keep the values of -f(d)/RT within the range of acceptable arguments to the computer’s exponential function. The final form of this term of the empirical potential then is
Ei,i+z(d) = PS +p4[d4 - ( 4 / 3 ) ( 2 ~ ~ +p1)d3
The parameters, p 1 . . . p s were determined by fitting the calculated distributions of di,i+p for each type of residue i + 1 to the observed distributions. Although the overall observed distribution (Table 1) is bimodal, the individual distributions when broken down by residue type are not. As can be seen from Table 2, the fits are acceptable.
Following the same reasoning as before, we
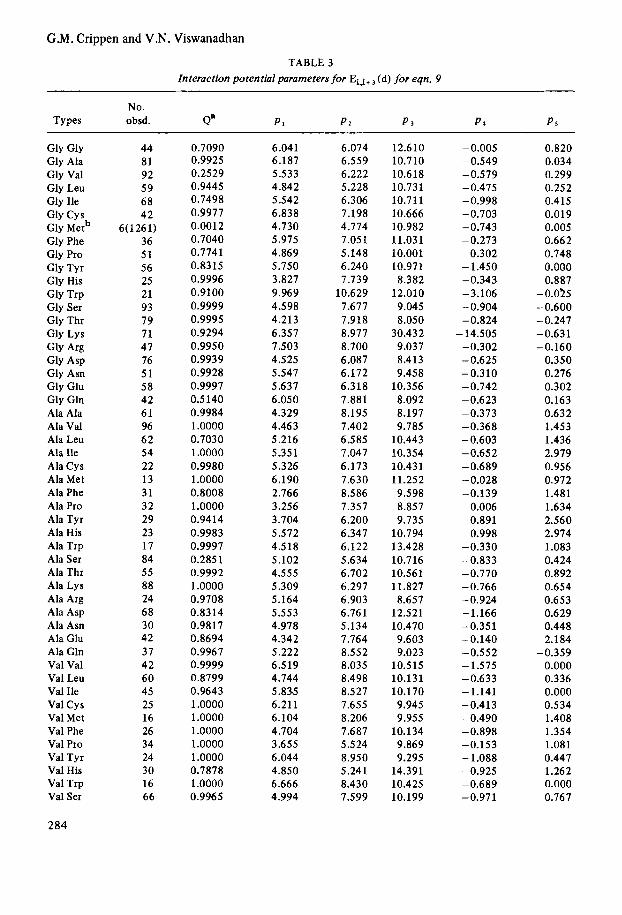
next considered all 4-residue segments of all 35 proteins. The only distance for which the energy contribution is unknown is dj,i+3. The observations were broken down according to the 210 residue-pair types of residues i + 1 and i + 2, on the grounds that it is the $’s and $‘s of these residues that determine the i to i + 3 distance, and probably the observations are due primarily to local interactions within the 4-residue segment. Calculating the expected distributions of distances on the assumption of no i to i + 3 interaction was prohibitively time consuming, so instead we assumed that the observed segments for each residue-pair type are in a Boltzmann energy distribution, and that if the energy terms so far known (= E ) are insufficient to produce such a distribution, then a new term, f ( d i , i + 3 ) , must be added. Clearly the parameters o f f depend on the types of residues i + 1 and i + 2. For each histogram cell, c , there are at least several observations,j. Then assuming the width of the cell is small compared to l / f ’ (dc) , the calculated fraction of obser-
TABLE 2 Interaction potential parameters for Ei , i+ (d) for eqn, 7
Residue i + i type PI P l P 3 P 4 P a R.m.s. dev.’
GlY Ala Val Leu Ile CY s Met Phe Pro Tyr His TrP Ser Thr LY s ‘4% ASP A sn Glu Gln
5.53 5.46 5.60 5.46 5.49 5.44 5.41 5.52 5.38 5.56 5.54 5.54 5.45 5.42 5.44 5.38 5.50 5.38 5.47 5.49
6.75 6.71 6.42 6.62 6.49 6.48 6.70 6.67 6.11 6.43 6.76 6.64 6.56 6.47 6.60 6.50 6.63 6.50 6.70 6.46
0.00 0.86 0.01 1.03 0.00 0.56 0.14 0.93 0.00 0.90 0.00 0.50 0.00 0.77 0.00 1.14 0.00 0.63 0.00 0.64 0.5 1 0.43 0.00 1.09 0.01 0.78 0.01 0.66 0.00 1.20 0.09 0.95 0.27 1.17 0.11 1.06 0.17 1.24 0.20 0.78
1300 1600 800
1300 1200 700
1100 1700 800 900 700
1600 1100 900
1700 1300 1700 1400 1900 1100
0.0060 0.0120 0.0071 0.0077 0.005 2 0.0081 0.0026 0.0085 0.0148 0.0057 0.0108 0.0082 0.0085 0.0090 0.0058 0.0020 0.0057 0.0026 0.0072 0.006 1
~~ ~ ~
‘Root mean square deviation between the observed and calculated 7-cell histograms as in Table 1.
283
GM. Crippen and V.N. Viswanadhan
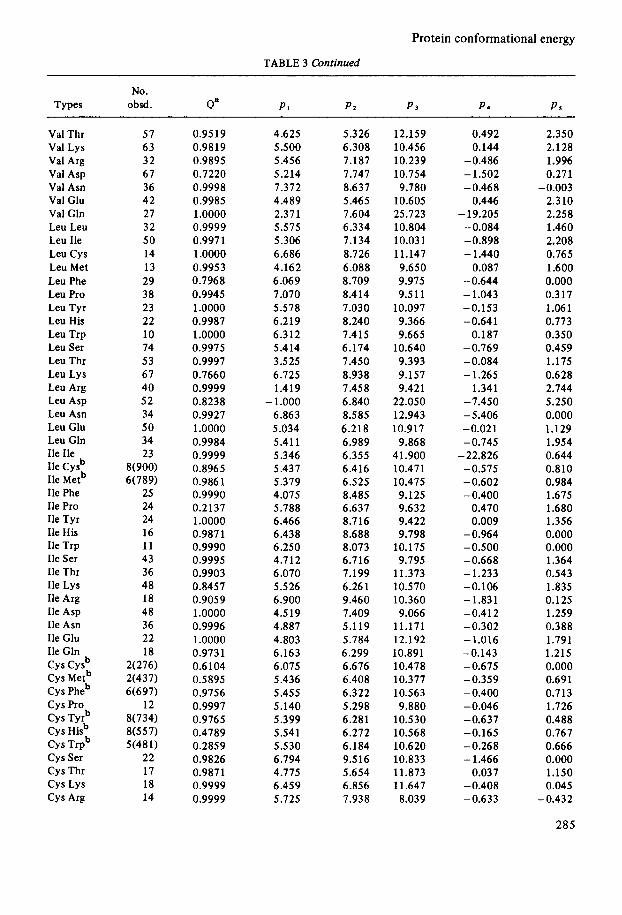
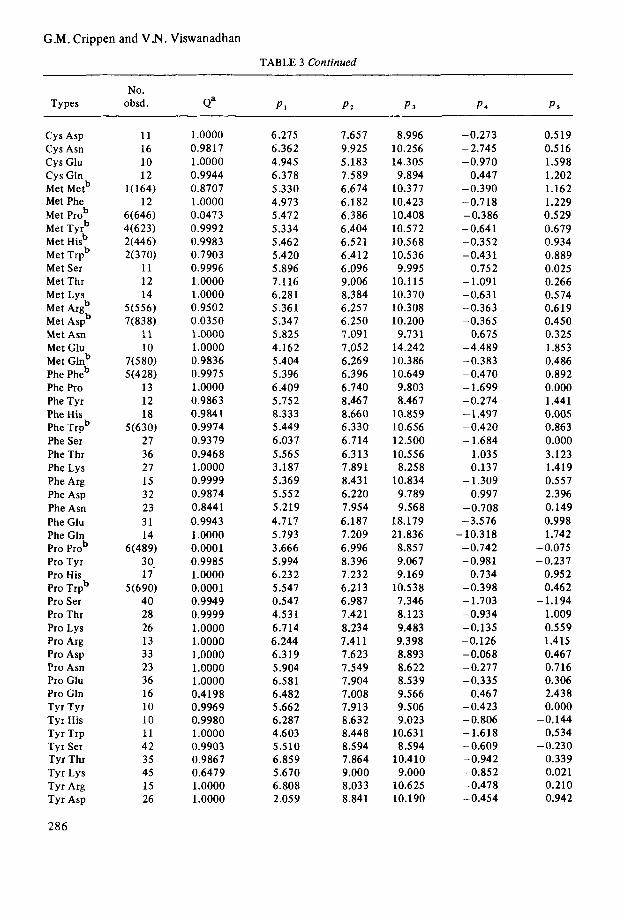
TABLE 3 Interaction potential parameters for Ei,i+ (d) for eqn. 9
No. Types obsd. a" PI P I P s P 4 PS
Gly Gly Gly Ala Gly Val Gly Leu Gly Ile Gly Cys Gly Metb Gly Phe Gly Pro Gly Tyr Gly His Gly Trp Gly Ser Gly Thr Gly Lys Gly Arg Gly Asp Gly Asn Gly Glu Gly Gln Ala Ala Ala Val Ala Leu Ala Ile Ala Cys Ala Met Ala Phe Ala Pro Ala Tyr Ala His Ala Trp Ala Ser Ala Thr Ala Lys Ala Arg Ala Asp Ala Asn Ala Glu Ala Gln Val Val Val Leu Val Ile Val Cys Val Met Val Phe Val Pro Val Tyr Val His Val Trp Val Ser
284
44 81 92 59 68 42
6(1261) 36 51 56 25 21 93 79 71 47 76 51 58 42 61 96 62 54 22 13 3 1 32 29 23 17 84 55 88 24 68 30 42 37 42 60 45 25 16 26 34 24 30 16 66
0.7090 0.9925 0.2529 0.9445 0.7498 0.9977 0.0012 0.7040 0.7741 0.8315 0.9996 0.9100 0.9999 0.9995 0.9294 0.9950 0.9939 0.9928 0.9997 0.5140 0.9984 1 .oooo 0.7030 1 .oooo 0.9980 1.0000 0.8008 1.0000 0.9414 0.9983 0.9997 0.2851 0.9992 1 .oooo 0.9708 0.8314 0.9817 0.8694 0.9967 0.9999 0.8799 0.9643 1.0000 1.0000 1 .oooo 1.0000 1 .oooo 0.7878 1.0000 0.9965
6.04 1 6.187 5.533 4.842 5.542 6.838 4.730 5.975 4.869 5.750 3.827 9.969 4.598 4.213 6.357 7.503 4.525 5.547 5.637 6.050 4.329 4.463 5.216 5.351 5.326 6.190 2.766 3.256 3.704 5.572 4.518 5.102 4.555 5.309 5.164 5.553 4.978 4.342 5.222 6.519 4.744 5.835 6.211 6.104 4.704 3.655 6.044 4.850 6.666 4.994
6.074 6.559 6.222 5.228 6.306 7.198 4.774 7.051 5.148 6.240 7.739
10.629 7.677 7.918 8.977 8.700 6.087 6.172 6.318 7.881 8.195 7.402 6.5 85 7.047 6.173 7.630 8.586 7.357 6.200 6.347 6.122 5.634 6.702 6.297 6.903 6.76 1 5.134 7.764 8.552 8.035 8.498 8.527 7.655 8.206 7.687 5 .5 24 8.950 5.241 8.430 7.599
12.610 10.710 10.618 10.731 10.711 10.666 10.982 11.031 10.001 10.971 8.382
12.010 9.045 8.050
30.432 9.037 8.413 9.458
10.356 8.092 8.197 9.785
10.443 10.354 10.431 11.252 9.598 8.857 9.735
10.794 13.428 10.716 10.561 11.827 8.657
12.521 10.470 9.603 9.023
10.515 10.131 10.170 9.945 9.955
10.134 9.869 9.295
14.391 10.425 10.199
-0.005 -0.549 -0.579 -0.475 -0.998 -0.703 -0.743 -0.273
0.302 - 1.450 -0.343 -3.106 -0.904 -0.824 - 14.505 -0.302 - 0.625 -0.310 -0.742 -0.623 -0.373 -0.368 -0.603 -0.652 -0.689 -0.028 -0.139
0.006 0.891 0.998
-0.330 -0.833 -0.770 -0.766 -0.924 -1.166 -0.351 -0.140 -0.552 - 1.575 -0.633 - 1.141 -0.413 -0.490 -0.898 -0.153 - 1.088 -0.925 -0.689 -0.971
0.820 0.034 0.299 0.252 0.415 0.019 0.005 0.662 0.748 0.000 0.887
- 0.025 -0.600 -0.247 -0.631 -0.160
0.350 0.276 0.302 0.163 0.632 1.453 1.436 2.979 0.956 0.972 1.481 1.634 2.560 2.974 1.083 0.424 0.892 0.654 0.653 0.629 0.448 2.184
-0.359 0.000 0.336 0.000 0.534 1.408 1.354 1.081 0.447 1.262 0.000 0.767
Protein conformational energy
TABLE 3 Continued
No. Types obsd. Qa PI Pa P 3 P S PS
Val Thr Val Lys Val Arg Val Asp Val Asn Val Glu Val Gln Leu Leu Leu Ile Leu Cys Leu Met Leu Phe Leu Pro Leu Tyr Leu His Leu Trp Leu Ser Leu Thr Leu Lys Leu Arg Leu Asp Leu Asn Leu Clu Leu Gln Ile Ile Ile c y P Ile Metb Ile Phe Ile Pro Ile Tyr Ile His Ile Trp Ile Ser Ile Thr Ile Lys Ile Arg Ile Asp Ile Asn Ile Glu Ile Gln
Cys Metb Cys Pheb c y s Pro Cys Tyrb Cys Hisb Cys Trpb Cys Ser Cys Thr c y s Lys Cys Arg
c y s Cysb
57 63 32 67 36 42 27 32 50 14 13 29 38 23 22 10 74 53 67 40 52 34 50 34 23
8(900) 6(789)
25 24 24 16 11 43 36 48 18 48 36 22 18
2(276) 2(437) 6(697)
12 8(734) 8(557) 5(481)
22 17 18 14
0.9519 0.9819 0.9895 0.7220 0.9998 0.9985 1.0000 0.9999 0.997 1 1 .oooo 0.9953 0.7968 0.9945 1 .oooo 0.9987 1.0000 0.9975 0.9997 0.7660 0.9999 0.8238 0.9927 1 .oooo 0.9984 0.9999 0.8965 0.986 1 0.9990 0.2137 1 .oooo 0.9871 0.9990 0.9995 0.9903 0.8457 0.9059 1.0000 0.9996 1.0000 0.9731 0.6104 0.5895 0.9756 0.9997 0.9765 0.4789 0.2859 0.9826 0.9871 0.9999 0.9999
4.625 5.500 5.456 5.214 7.372 4.489 2.371 5.575 5.306 6.686 4.162 6.069 7.070 5.578 6.219 6.312 5.414 3.5 25 6.725 1.419
- 1 .ooo 6.863 5.034 5.411 5.346 5.437 5.379 4.075 5.788 6.466 6.438 6.250 4.712 6.070 5.526 6.900 4.519 4.887 4.803 6.163 6.075 5.436 5.455 5.140 5.399 5.541 5.5 30 6.794 4.775 6.459 5.725
5.3 26 6.308 7.187 7.747 8.637 5.465 7.604 6.334 7.134 8.726 6.088 8.709 8.414 7.030 8.240 7.415 6.174 7.450 8.938 7.458 6.840 8.585 6.218 6.989 6.355 6.416 6.525 8.485 6.637 8.716 8.688 8.073 6.716 7.199 6.261 9.460 7.409 5.119 5.784 6.299 6.676 6.408 6.322 5.298 6.281 6.272 6.184 9.516 5.654 6.856 7.938
12.159 10.456 10.239 10.754 9.180
10.605 25.723 10.804 10.031 11.147 9.650 9.975 9.5 11
10.097 9.366 9.665
10.640 9.393 9.157 9.421
22.050 12.943 10.917
9.868 41.900 10.471 10.475 9.125 9.632 9.422 9.798
10.175 9.795
11.373 10.570 10.360 9.066
11.171 12.192 10.891 10.478 10.377 10.563 9.880
10.530 10.568 10.620 10.833 11.873 11.647 8.039
0.492 0.144
-0.486 - 1.502 -0.468
0.446 - 19.205
-0.084 -0.898 - 1.440
0.087 -0.644 - 1.043 -0.153 -0.641
0.187 -0.769 -0.084 - 1.265
1.341 -7.450 -5.406 -0.021 -0.745
-22.826 -0.575 -0.602 -0.400
0.470 0.009
-0.964 -0.500 -0.668 - 1.233 -0.106 -1.831 -0.412 -0.302 -1.016 -0.143 -0.675 -0.359 - 0.400 -0.046 -0.637 -0.165 - 0.268 - 1.466
0.037 -0.408 -0.633
2.350 2.128 1.996 0.271
2.310 2.258 1.460 2.208 0.765 1.600 0.000 0.317 1.061 0.773 0.350 0.459 1.175 0.628 2.744 5.250 0.000 1.129 1.954 0.644 0.810 0.984 1.675 1.680 1.356 0.000 0.000 1.364 0.543 1.835 0.125 1.259 0.388 1.791 1.215 0.000 0.691 0.7 13 1.726 0.488 0.767 0.666 0.000 1.150 0.045
-0.003
-0.432
285
G.M. Crippen and V.N. Viswanadhan
TABLE 3 Continued
No. Types obsd. Qa PI P3 P 3 P 4 PS
Cys Asp Cys Asn c y s Glu c y s Gln Met Metb Met Phe Met Prob Met Tyrb Met Hisb Met Trpb Met Ser Met Thr Met Lys Met Argb Met Aspb Met Asn Met Glu Met Glnb Phe Pheb Phe Pro Phe Tyr Phe His Phe Trpb Phe Ser Phe Thr Phe Lys Phe Arg Phe Asp Phe Asn Phe Glu Phe Gln Pro prob Pro Tyr Pro His Pro Trpb Pro Ser Pro Thr Pro Lys Pro Arg Pro Asp Pro Asn Pro Glu Pro Gln Tyr Tyr Tyr His Tyr Trp Tyr Ser Tyr Thr Tyr Lys Tyr Arg Tyr Asp
286
11 16 10 12
l(164) 12
6(646) 4(623) 2(446) 2(370)
11 12 14
5(556) 7(838)
11 10
7(580) 5(428)
13 12 18
5(630) 27 36 27 15 32 23 31 14
6(489) 3 0. 17
40 28 26 13 33 23 36 16 10 10 11 42 35 45 15 26
5(690)
1 .oooo 0.9817 1.0000 0.9944 0.8707 1 .oooo 0.0473 0.9992 0.9983 0.7903 0.9996 1 .oooo 1.0000 0.9502 0.0350 1 .oooo 1 .oooo 0.9836 0.9975 1 .oooo 0.9863 0.9841 0.9974 0.9379 0.9468 1 .oooo 0.9999 0.9874 0.8441 0.9943 1 .oooo 0.0001 0.9985 1.0000 0.0001 0.9949 0.9999 1.0000 1.0000 1.0000 1.0000 1.0000 0.4198 0.9969 0.9980 1 .oooo 0.9903 0.9867 0.6479 1.0000 1.0000
6.275 6.362 4.945 6.378 5.330 4.973 5.472 5.334 5.462 5.420 5.896 7.1 16 6.281 5.361 5.347 5.825 4.162 5.404 5.396 6.409 5.752 8.333 5.449 6.03 7 5.565 3.187 5.369 5.552 5.219 4.717 5.793 3.666 5.994 6.232 5.547 0.547 4.53 1 6.714 6.244 6.319 5.904 6.581 6.482 5.662 6.287 4.603 5.510 6.859 5.670 6.808 2.059
7.657 9.925 5.183 7.589 6.674 6.182 6.386 6.404 6.521 6.412 6.096 9.006 8.384 6.257 6.250 7.09 1 7.05 2 6.269 6.396 6.740 8.46 7 8.660 6,330 6.714 6.313 7.891 8.431 6.220 7.954 6.187 7.209 6.996 8.396 7.232 6.213 6.987 7.421 8.234 7.411 7.623 7.549 7.904 7.008 7.913 8.632 8.448 8.594 7.864 9.000 8.033 8.841
8.996 10.256 14.305 9.894
10.377 10.423 10.408 10.572 10.568 10.536 9.995
10.115 10.370 10.308 10.200 9.731
14.242 10.386 10.649 9.803 8.46 7
10.859 10.656 12.500 10.556 8.258
10.834 9.789 9.568
18.179 21.836
8.857 9.067 9.169
10.538 7.346 8.123 9.483 9.398 8.893 8.622 8.539 9.566 9.506 9.023
10.631 8.594
10.410 9.000
10.625 10.190
-0.273 - 2.745 -0.970
0.447 -0.390 -0.718 -0.386 - 0.64 1 -0.352 -0.431
0.752 -1.091 -0.631 -0.363 -0.365 -0.675 -4.489 -0.383 - 0.470 -1.699 -0.274 - 1.497 -0.420 - 1.684
1.035 0.137
0.997 - 1.309
-0.708 -3.576 - 10.318 -0.742 -0.981
0.734 -0.398 - 1.703 -0.934 -0.135 -0.126 -0.068 -0.277 -0.335
0.467 -0.423 - 0.806 -1.618 - 0.609 -0.942 -0.852 -0.478 -0.454
0.519 0.516 1.598 1.202 1.162 1.229 0.529 0.679 0.934 0.889 0.025 0.266 0.574 0.619 0.450
1.853 0.486 0.892 0.000 1.44 1 0.005 0.863 0.000 3.123 1.419 0.557 2.396
0.998 1.742
-0.325
-0.149
-0.075 -0.237
0.952 0.462
1.009 0.559 1.415 0.467 0.716 0.306 2.438 0.000
-0.144 0.534
-0.230 0.339 0.021 0.210 0.942
-1.194
Protein conformational energy
TABLE 3 Continued
No. Types obsd. d P1 P2 P 3 P* PS
Tyr Asn Tyr Glu Tyr Gtn His Hisb His Trpb His Ser His Thr His Lys His Argb His Aspb His Asnb His Glu His Glnb Trp Trpb Trp Ser Trp Thr Trp Lysb Trp Argb Trp Asp Trp Asn Trp Glu Trp Glnb Ser Ser Ser Thr Ser Lys Ser Arg Ser Asp Ser Asn Ser Glu Ser Gln Thr Thr Thr Lys Thr Arg Thr Asp Thr Asn Thr Glu Thr Gln Lys Lys Lys Arg Lys Asp Lys Asn Lys Glu Lys Gln
'4% ASP Arg Asn Arg Glu Arg Gln Asp Asp Asp Asn Asp Glu
& pugb
19 16 21
2(285) 4(490)
15 20 22
7(676) 7(958) 7(811)
7(700) 2(209)
24 12
9(997) 9(600)
12 16 12
4(624) 42 62 57 32 42 41 41 34 23 54 22 40 36 36 27 34 26 38 28 34 21
5 (398) 12 22 21 14 20 29 31
21
0.9916 0.9999 0.7489 0.8636 0.5198 0.8404 0.9999 0.9997 0.9960 0.0322 0.5884 1.0000 0.9991 0.7693 0.9942 1.0000 0.2416 0.9852 0.9890 0.7505 0.8470 0.9230 0.9084 0.9999 0.9990 1.0000 0.9824 0.9993 0.9994 0.9611 0.9982 0.9888 0.9999 0.0174 0.8196 0.9961 0.9962 0.9597 0.9966 0.7737 0.9995 0.9825 0.9980 1.0000 0.8888 0.8137 0.9730 0.9996 0.9959 0.9942 0.9967
6.138 3.322 6.500 5.536 5.523 5.559 5.619 0.897 5.46 0 5.418 5.441 6.120 5.479 5.500 5.638 6.228 5.426 5.408 6.106 6.871 4.630 5.375 6.300 3.937 7.013 5.348 5.550 5.825 6.413 5.606 5.356 4.582 6.679 4.626 4.651 5.343 5.178 5.475 5.043 7.423 6.150 4.991 6.630 5.314 7.025 6.430 5.444 7.224 4.663 5.129 4.662
7.926 7.233 6.860 6.368 6.313 6.325 8.925 7.886 6.253 6.277 6.150 7.397 6.349 6.216 6.313 7.668 6.238 6.112 6.188 7.293 7.983 6.033 8.268 9.000 8.938 7.837 6.960 7.548 7.853 7.799 5.370 5.266 7.170 5.116 5.278 6.570 6.075 8.715 6.344 9.093 8.1 10 7.272 9.286 5.992 8.898 7.592 6.752 9.294 5.328 6.402 6.912
9.886 32.978 16.315 10.711 10.669 30.550 10.135 8.142
10.462 10.327 10.389 8.665
10.498 10.707 10.722 11.184 10.425 10.470 9.913 9.907 9.072
10.490 10.06 1 9.010 9.006
10.595 8.370 8.292 8.533
26.979 12.170 10.845 10.265 9.739
10.471 9.458 9.614
12.517 9.652
10.764 11.533 9.767 9.286
10.298 9.079
10.212 38.1 15 10.255 16.394 9.208 7.297
- 1.088 - 12.022
-0.015 -0.218 -0.271 -5.219 -0.550
0.916 -0.331 -0.349 -0.327
0.803 -0.367 -0.395
0.230 -0.663 -0.353 -0.424
0.235 0.112 1.162
-0.447 0.166
-0.534 - 0.46 7 -0.867 -0.689 -0.975 -0.350 -3.905 - 1.078
0.477 -0.287
0.119 1.045
-0.155 0.109
-0.750 -0.071 -0.951 - 2.025 -0.508 -0.662 - 0.406 -0.313 -0.388
-41.630 - 1.073 - 1.020 -0.603 -0.375
0.000 1.366 0.800 0.903 0.847 0.447
1.761 0.574 0.446 0.398 1.503 0.569 0.707 1.048 1.994 0.459 0.473 1.043 0.425 0.189 0.380
0.402
0.679 0.676
-0.012 -0.075 -0.433
0.000 1.117 0.063 1.030 2.235 1.416 0.597
1.094 0.177 0.000 0.524 0.632 0.4 13 0.177 0.216 1.194
1.141 0.218 1.135
28 7
-0.326
-0.480
-0.089
-0.175
-0.042
G.M. Crippen and V.N. Viswanadhan
TABLE 3 Continued
No. Types obsd. Qa p , P1 P 3 P4 PI
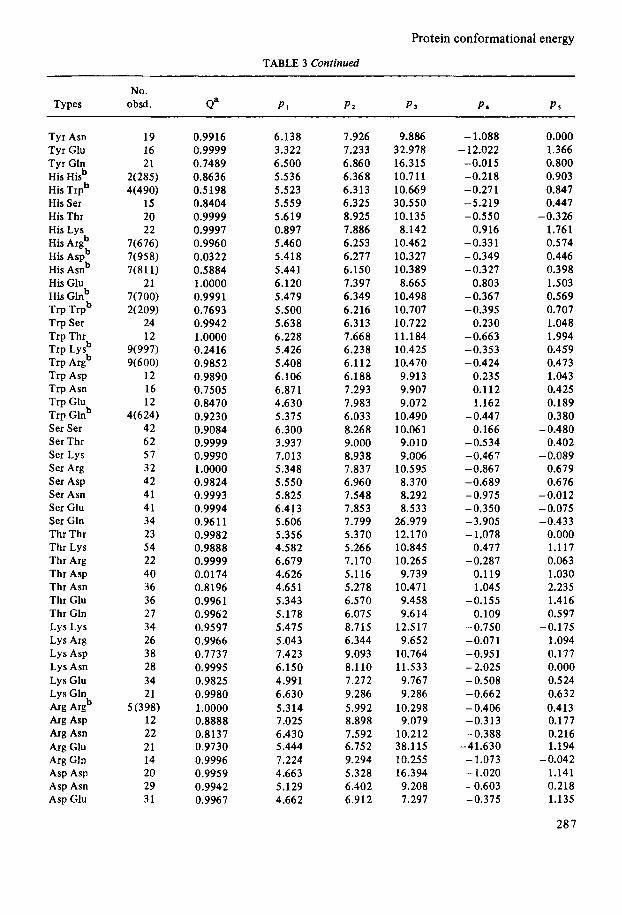
Asp Gln 24 0.9941 5.560 7.886 9.527 -0,699 1.049 Asn Asn 15 0.9936 5.603 6.315 8.491 -0.341 1.451 Asn Glu 27 0.9941 5.511 7.517 8.203 -0.773 0.360 Asn Gln 28 0.7415 6.495 8.224 8.224 -0.693 0.102 Glu Glu 22 1.0000 5.424 7.247 8.581 -0.278 1.296 Glu Gln 21 1 .oooo 5.497 7.032 11.757 - 0.484 1.841 Gln Glnb 9(426) 0.9984 5.368 6.112 10.562 -0.357 0.427
aThe x2 probability that the observed distribution of distances does not differ from the calculated one. bThe number of observations is so small for the A-B pair, that we used instead the composite distribution of A-X and X-B pairs (number of observations in parentheses), where X stands for all types.
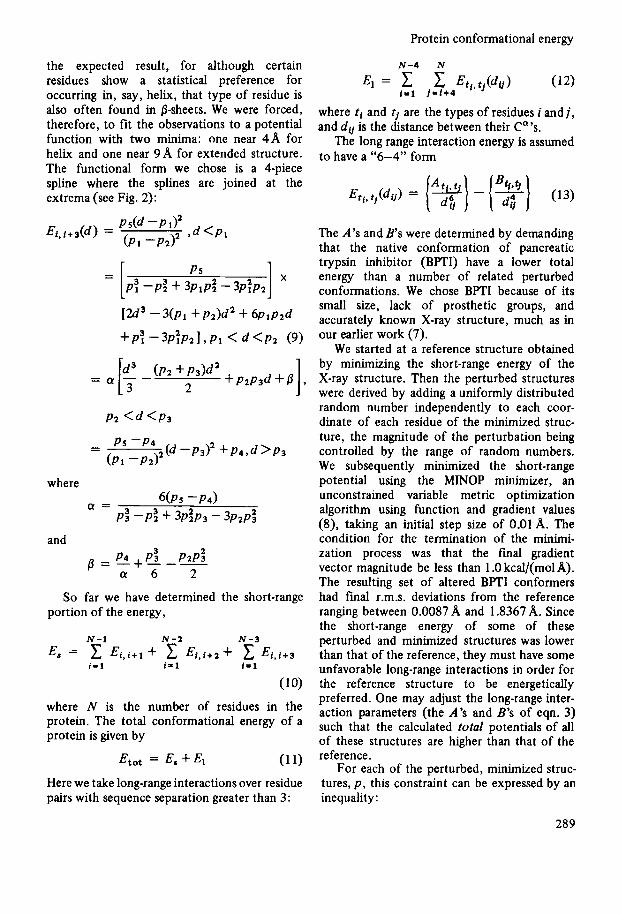
vations having di.i+3 within a given cell, c , is given by
$exp[-(E +f)/RTI
Zzexp[-(E + f)/RT] P(c) =
C J
(8) - - exp [-f(~,)/RTI w,
~ex~[--f(d,)/RTI w,
where
w, = zexp(-Ej/RT). J
The parameters of the function f are then adjusted empirically for a best fit of the calcu- lated histogram P(c) to the observed histogram. The observations for each pair of residue types, A-B, fell into six equally wide bins covering the range 4.5-10.5A. As Table 3 shows, even breaking the data down into 210 type-pairs allows over 30 observations for most histograms, permitting a bin occupancy of over 5 obser- vations in most cases. By the usual rule of thumb, this is enough to sensibly employ the x2 test for the significance of agreement between the fitted distribution and the observed one. If type A or B is rather rare, x2 tests are not justifiable statistically, and indeed a wide range of calculated distributions could have given rise to the observed one when it consists of just a few occurrences. A maximum entropy approach would give a flat calculated distribution in such cases, but we felt sure this would not be correct
288
if only the data set were larger. Our approach was that if there were only 10 or fewer obser- vations for type pair A-B, we constructed instead the composite histogram of A-X and X-B, where X ranged over all residue types. The fit to this histogram, usually consisting of hundreds of observations, was then attributed to type-pair A-B. Unfortunately, the observed histograms for nearly every residue-type-pair were distinctly bimodal, one maximum corre- sponding to ct-helix or bend structure, and the other for extended structure. This is actually
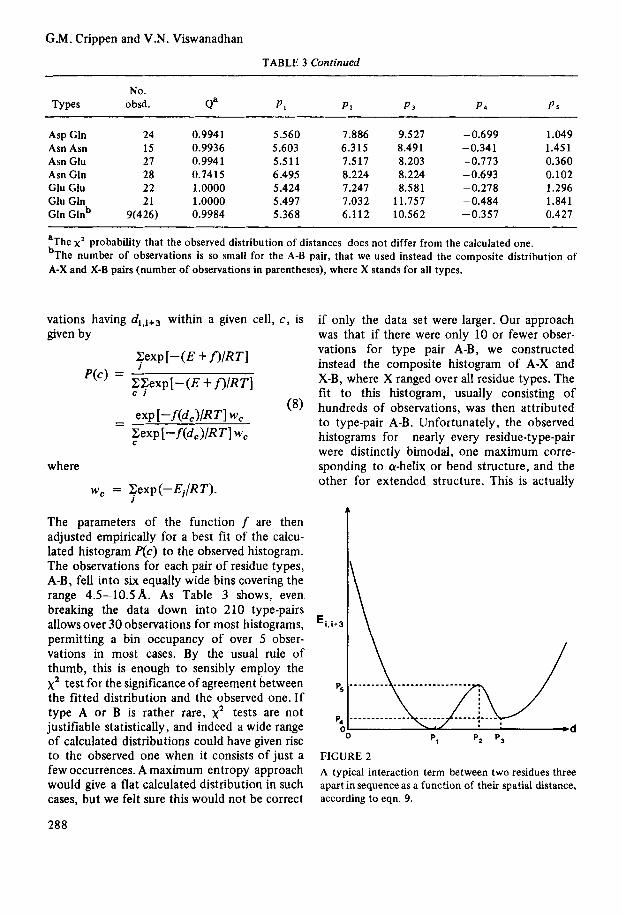
FIGURE 2 A typical interaction term between two residues three apart in sequence as a function of their spatial distance, according to eqn. 9.
Protein conformational energy
N-4 N the expected result, for although certain residues show a statistical preference for occurring in, say, helix, that type of residue is also often found in 0-sheets. We were forced, therefore, to fit the observations to a potential function with two minima: one near 4 A for helix and one near 9 A for extended structure. The functional form we chose is a 4-piece spline where the splines are joined at the extrema (see Fig. 2):
P 2 < d < P 3
P s - P 4 2 (d - P3I2 + P 4 , d > P 3
- - ( P 1 - P 2 )
where
and
So far we have determined the short-range portion of the energy,
N-1 N-2 N - 3
i l l i = l i = 1 Ea = 1 Ei,i+l + 1 Ei,i+2 + 1 Ei.i+3
(10)
where N is the number of residues in the protein. The total conformational energy of a protein is given by
E m = E* + El (1 1)
Here we take long-range interactions over residue pairs with sequence separation greater than 3:
where t i and ti are the types of residues i and j , and d, is the distance between their ( 2 ’ s .
The long range interaction energy is assumed to have a “6-4” form
The A’s and B s were determined by demanding that the native conformation of pancreatic trypsin inhibitor (BPTI) have a lower total energy than a number of related perturbed conformations. We chose BPTI because of its small size, lack of prosthetic groups, and accurately known X-ray structure, much as in our earlier work (7) .
We started at a reference structure obtained by minimizing the short-range energy of the X-ray structure. Then the perturbed structures were derived by adding a uniformly distributed random number independently to each coor- dinate of each residue of the minimized struc- ture, the magnitude of the perturbation being controlled by the range of random numbers. We subsequently minimized the short-range potential using the MINOP minimizer, an unconstrained variable metric optimization algorithm using function and gradient values (8), taking an initial step size of 0.01 A. The condition for the termination of the minimi- zation process was that the final gradient vector magnitude be less than 1 .O kcal/(mol A). The resulting set of altered BPTI conformers had final r.m.s. deviations from the reference ranging between 0.0087 A and 1 A367 A. Since the short-range energy of some of these perturbed and minimized structures was lower than that of the reference, they must have some unfavorable long-range interactions in order for the reference structure to be energetically preferred. One may adjust the long-range inter- action parameters (the A’s and B’s of eqn. 3) such that the calculated total potentials of all of these structures are higher than that of the reference.
For each of the perturbed, minimized struc- tures, p , this constraint can be expressed by an inequality :
289
G.M. Crippen and V.N. Viswanadhan
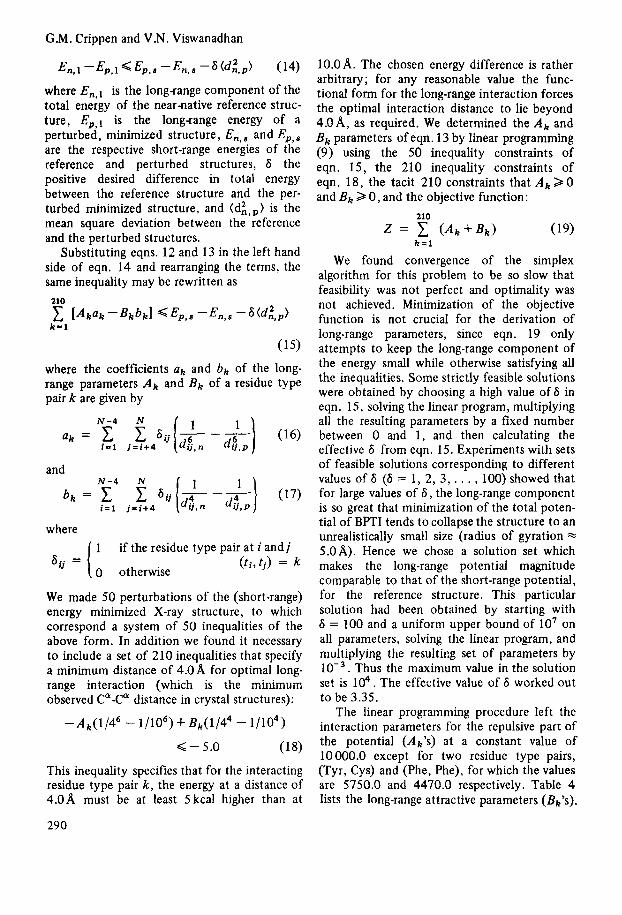
&,I -Ep,1 <Ep.* -En,# -6 (d ; f ,p ) (14)
where En,l is the long-range component of the total energy of the near-native reference struc- ture, Ep,l is the long-range energy of a perturbed, minimized structure, En,8 and Ep,s are the respective short-range energies of the reference and perturbed structures, 6 the positive desired difference in total energy between the reference structure and the per- turbed minimized structure, and (d:.,) is the mean square deviation between the reference and the perturbed structures.
Substituting eqns. 12 and 13 in the left hand side of eqn. 14 and rearranging the terms, the same inequality may be rewritten as
211)
k=l
(15)
where the coefficients ak and bk of the long- range parameters A k and Bk of a residue type pair k are given by
and
where 1
0 otherwise
if the residue type pair at i and j (ti, r j ) = k 6 , =
We made 50 perturbations of the (short-range) energy minimized X-ray structure, to which correspond a system of 50 inequalities of the above form. In addition we found it necessary to include a set of 210 inequalities that specify a minimum distance of 4.0A for optimal long- range interaction (which is the minimum observed CQ-Ca distance in crystal structures):
-Ak(1/46 - 1/106) + Bk(1/44 - 1/104)
<-5.0 (18)
This inequality specifies that for the interacting residue type pair k, the energy at a distance of 4.OA must be at least 5 kcal higher than at
290
lO.OA. The chosen energy difference is rather arbitrary; for any reasonable value the func- tional form for the long-range interaction forces the optimal interaction distance to lie beyond 4.08 , as required. We determined the A, and Bk parameters of eqn. 13 by linear programming (9) using the 50 inequality constraints of eqn. 15, the 210 inequality constraints of eqn. 18, the tacit 210 constraints that Ak > 0 and B k 2 0, and the objective function:
210
= 1 (AkfBk) (19) k = l
We found convergence of the simplex algorithm for this problem to be so slow that feasibility was not perfect and optimality was not achieved. Minimization of the objective function is not crucial for the derivation of long-range parameters, since eqn. 19 only attempts to keep the long-range component of the energy small while otherwise satisfying all the inequalities. Some strictly feasible solutions were obtained by choosing a high value of 6 in eqn. 15, solving the linear program, multiplying all the resulting parameters by a fixed number between 0 and 1 , and then calculating the effective 6 from eqn. 15. Experiments with sets of feasible solutions corresponding to different values of 6 (8 = 1 , 2, 3, . . . , 100) showed that for large values of 6 , the long-range component is so great that minimization of the total poten- tial of BPTI tends to collapse the structure to an unrealistically small size (radius of gyration * 5.0W). Hence we chose a solution set which makes the long-range potential magnitude comparable to that of the short-range potential, for the reference structure. This particular solution had been obtained by starting with 6 = 100 and a uniform upper bound of lo’ on all parameters, solving the linear program, and multiplying the resu1tir.g set of parameters by lo-’. Thus the maximum value in the solution set is lo4. The effective value of 6 worked out to be 3.35.
The linear programming procedure left the interaction parameters for the repulsive part of the potential ( A k ’ S ) at a constant value of 10 000.0 except for two residue type pairs, (Tyr, Cys) and (Phe, Phe), for which the values are 5750.0 and 4470.0 respectively. Table 4 lists the long-range attractive parameters (Bk’s).
Protein conformational energy
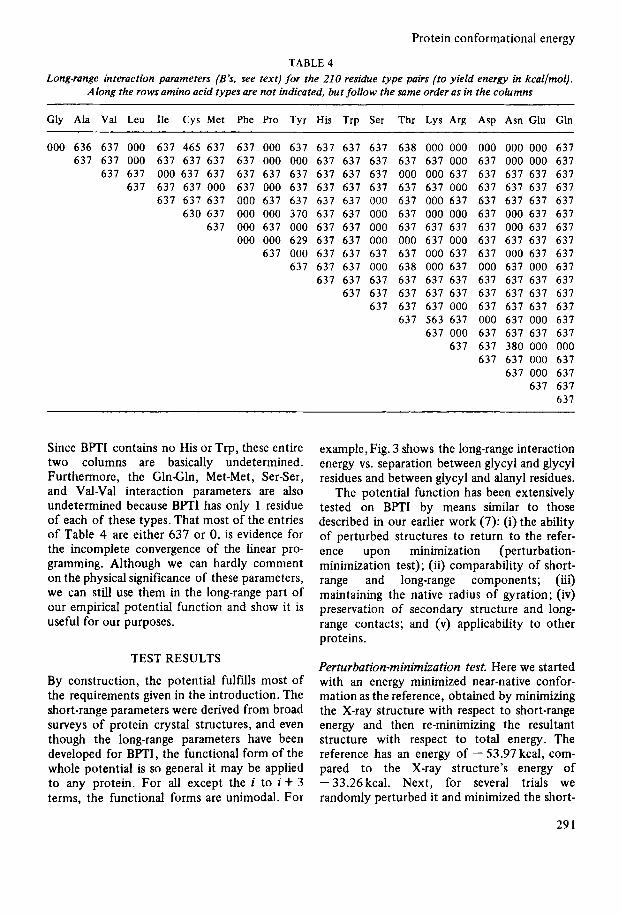
TABLE 4 Long-range interaction parameters (B’s, see text) for the 210 residue type pairs (to yield energy in kcallmol).
Along the rows amino acid types are not indicated, but follow the same order as in the columns
Gly Ala Val Leu Ile Cys Met Phe Pro Tyr His Trp Ser Thr Lys Arg Asp Asn Glu Gln
000 636 637 000 637 465 637 637 000 637 637 637 637 638 000 000 000 000 000 6 3 1 6 3 1 637 000 637 637 637 637 000 000 637 637 637 637 637 000 637 000 000 6 3 1
637 637 000 637 637 637 637 637 637 637 637 000 000 637 6 3 1 637 637 6 3 1 637 6 3 1 6 3 1 000 637 000 637 6 3 1 637 637 637 637 000 6 3 1 637 637 6 3 1
637 637 637 000 637 637 637 637 000 637 000 637 637 637 637 637 630 637 000 000 370 637 637 000 637 000 000 637 000 637 637
637 000 637 000 637 637 000 637 637 637 6 3 1 000 637 6 3 1 000 000 629 637 637 000 000 637 000 637 637 637 637
637 000 637 637 637 637 000 637 637 000 637 637 637 637 6 3 1 000 638 000 637 000 637 000 637
637 637 637 637 637 637 637 637 637 637 637 637 637 637 637 637 637 637 631
637 637 637 000 637 637 637 637 637 563 637 000 637 000 637
637 000 637 637 637 637 637 637 380 000 000
637 637 000 637 637 000 637
637 637 637
Since BPTI contains no His or Trp, these entire two columns are basically undetermined. Furthermore, the GlnGln, Met-Met, Ser-Ser, and Val-Val interaction parameters are also undetermined because BPTI has only 1 residue of each of these types. That most of the entries of Table 4 are either 637 or 0, is evidence for the incomplete convergence of the linear pro- gramming. Although we can hardly comment on the physical significance of these parameters, we can still use them in the long-range part of our empirical potential function and show it is useful for our purposes.
TEST RESULTS
By construction, the potential fulfills most of the requirements given in the introduction. The short-range parameters were derived from broad surveys of protein crystal structures, and even though the long-range parameters have been developed for BPTI, the functional form of the whole potential is so general it may be applied to any protein. For all except the i to i + 3 terms, the functional forms are unimodal. For
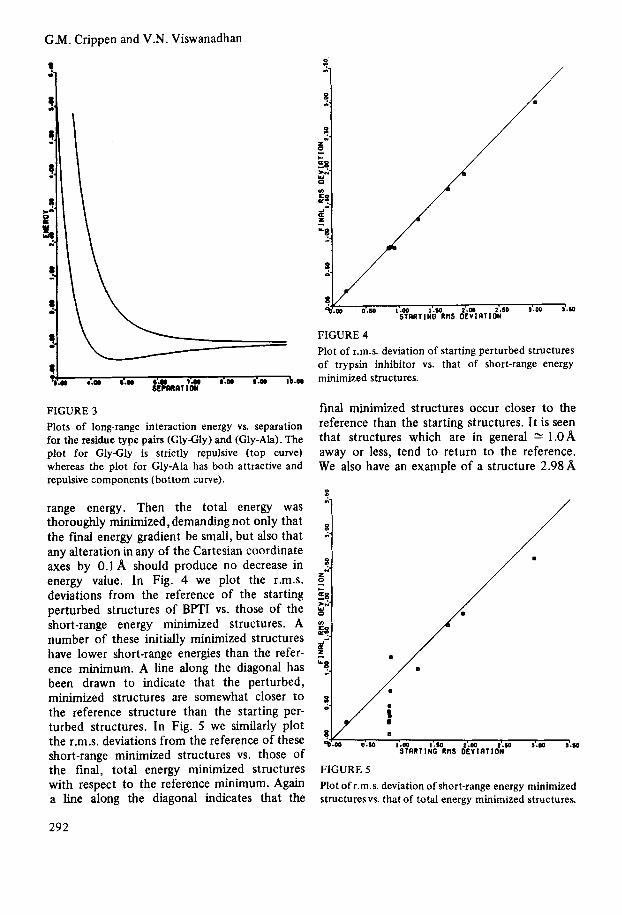
example, Fig. 3 shows the long-range interaction energy vs. separation between glycyl and glycyl residues and between glycyl and alanyl residues.
The potential function has been extensively tested on BPTI by means similar to those described in our earlier work (7): (i) the ability of perturbed structures to return to the refer- ence upon minimization (perturbation- minimization test); (ii) comparability of short- range and long-range components; (iii) maintaining the native radius of gyration; (iv) preservation of secondary structure and long- range contacts; and (v) applicability to other proteins.
Perturbation-minimization test. Here we started with an energy minimized near-native confor- mation as the reference, obtained by minimizing the X-ray structure with respect to short-range energy and then re-minimizing the resultant structure with respect to total energy. The reference has an energy of - 53.97 kcal, com- pared to the X-ray structure’s energy of - 33.26 kcal. Next, for several trials we randomly perturbed it and minimized the short-
29 1
G.M. Crippen and V.N. Viswanadhan 0
7
FIGURE 3 Plots of long-range interaction energy vs. separation for the residue type pairs (GlyGly) and (Gly-Ah). The plot for GlyGly is strictly repulsive (top curve) whereas the plot for Gly-Ala has both attractive and repulsive components (bottom curve).
range energy. Then the total energy was thoroughly minimized, demanding not only that the final energy gradient be small, but also that any alteration in any of the Cartesian coordinate axes by 0.1 A should produce no decrease in energy value. In Fig. 4 we plot the r.m.s. deviations from the reference of the starting perturbed structures of BPTI vs. those of the short-range energy minimized structures. A number of these initially minimized structures have lower short-range energies than the refer- ence minimum. A line along the diagonal has been drawn to indicate that the perturbed, minimized structures are somewhat closer to the reference structure than the starting per- turbed structures. In Fig. 5 we similarly plot the r.m.s. deviations from the reference of these short-range minimized structures vs. those of the final, total energy minimized structures with respect to the reference minimum. Again a line along the diagonal indicates that the
?.
?. 2 0 58 c
>2 Y 0
v)
C?.
P '?.
a- -
FIGURE 4 Plot of r.m.s. deviation of starting perturbed structures of trypsin inhibitor vs. that of short-range energy minimized structures.
final minimized structures occur closer to the reference than the starting structures. It is seen that structures which are in general 2: l.OA away or less, tend to return to the reference. We also have an example of a structure 2.98A
0
"1 8.
?. z 0 9. w 0
'n E?.
y?.
-1-
z
I / 8
?1/ B
"$RRT I:'Q'RHS C$E?lAT 1tN5' '"0° 4.00 d.w
FIGURE 5 Plot of r.m.s. deviation of short-range energy minimized structures vs. that of total energy minimized structures.
292
Protein conformational energy
One may conclude that in spite of the above shortcomings, the potential cab guide structures starting less than 1 .O A away from the reference back toward it.
?
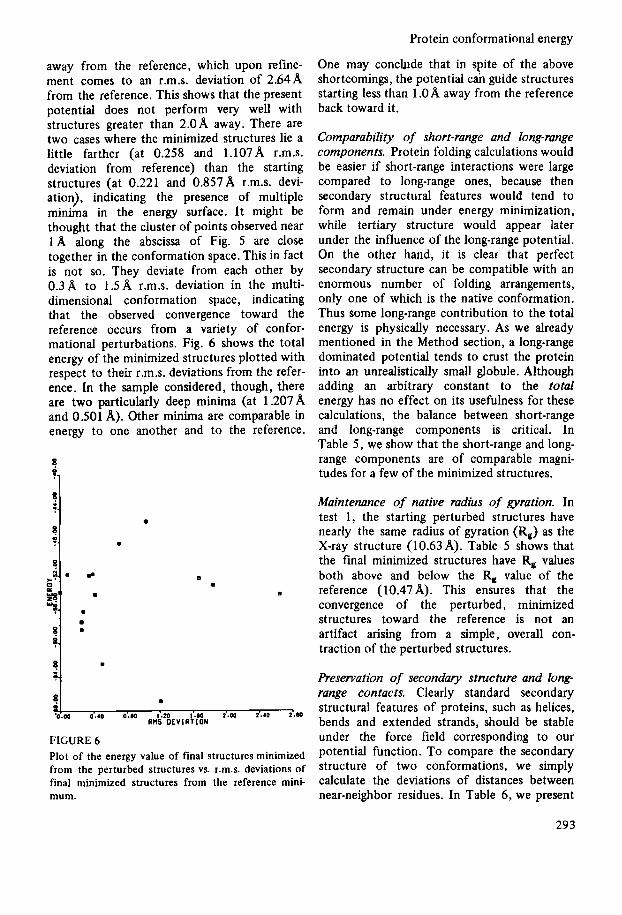
away from the reference, which upon refine- ment comes to an r.m.s. deviation of 2.64A from the reference. This shows that the present potential does not perform very well with structures greater than 2.0 away. There are two cases where the minimized structures lie a little farther (at 0.258 and 1.107A r.m.s. deviation from reference) than the starting structures (at 0.221 and 0.857A r.m.s. devi- ation), indicating the presence of multiple minima in the energy surface. I t might be thought that the cluster of points observed near 1 A along the abscissa of Fig. 5 are close together in the conformation space. This in fact is not so. They deviate from each other by 0.3A to 1.5A r.m.s. deviation in the multi- dimensional conformation space, indicating that the observed convergence toward the reference occurs from a variety of confor- mational perturbations. Fig. 6 shows the total energy of the minimized structures plotted with respect to their r.m.s. deviations from the refer- ence. In the sample considered, though, there are two particularly deep minima (at 1.207 A and 0.501 A). Other minima are comparable in energy to one another and to the reference.
W
8
'1
I / : sl D
0
m
FIGURE 6 Plot of the energy value of final structures minimized from the perturbed structures vs. r.m.s. deviations of final minimized structures from the reference mini- mum.
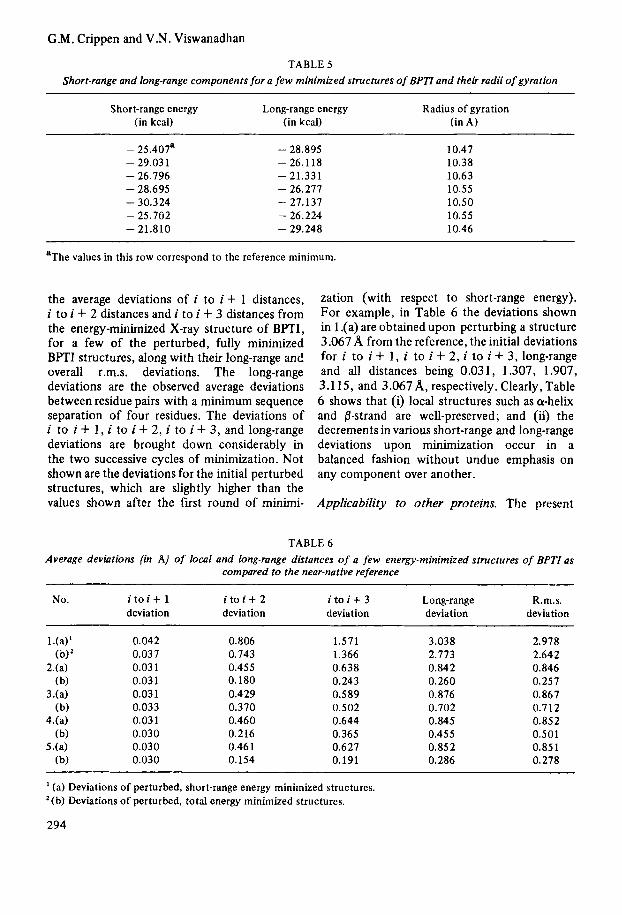
Comparability of short-range and long-range components. Protein folding calculations would be easier if short-range interactions were large compared to long-range ones, because then secondary structural features would tend to form and remain under energy minimization, while tertiary structure would appear later under the influence of the long-range potential. On the other hand, it is clear that perfect secondary structure can be compatible with an enormous number of folding arrangements, only one of wluch is the native conformation. Thus some long-range contribution to the total energy is physically necessary. As we already mentioned in the Method section, a long-range dominated potential tends to crust the protein into an unrealistically small globule. Although adding an arbitrary constant to the total energy has no effect on its usefulness for these calculations, the balance between short-range and long-range components is critical. In Table 5, we show that the short-range and long- range components are of comparable magni- tudes for a few of the minimized structures.
Maintenance of native radius of gyration. In test 1, the starting perturbed structures have nearly the same radius of gyration (R,) as the X-ray structure (10.63A). Table 5 shows that the final minimized structures have R, values both above and below the R, value of the reference (10.47 A). This ensures that the convergence of the perturbed, minimized structures toward the reference is not an artifact arising from a simple, overall con- traction of the perturbed structures.
Preservation of s e c o n h y stmc&re and long- range contacts. Clearly standard secondary structural features of proteins, such as helices, bends and extended strands, should be stable under the force field corresponding to our potential function. To compare the secondary structure of two conformations, we simply calculate the deviations of distances between near-neighbor residues. In Table 6, we present
293
G.M. Crippen and V.N. Viswanadhan
TABLE 5 Short-range and long-range components for a few minimized structures of BPTI and their radii of gyration
Short-range energy Long-range energy Radius of gyration (in kcal) (in kcal) (in A)
- 25.407' - 28.895 10.47 - 29.03 1 - 26.118 10.38 - 26.796 - 21.331 10.63 - 28.695 - 26.277 10.55 - 30.324 - 27.137 10.50 - 25.702 - 26.224 10.55 - 21.810 - 29.248 10.46
aThe values in this row correspond to the reference minimum.
the average deviations of i to i + 1 distances, i to i + 2 distances and i to i + 3 distances from the energy-minimized X-ray structure of BPTI, for a few of the perturbed, fully minimized BPTI structures, along with their long-range and overall r.m.s. deviations. The long-range deviations are the observed average deviations between residue pairs with a minimum sequence separation of four residues. The deviations of i to i + 1, i to i + 2 , i to i+ 3 , and long-range deviations are brought down considerably in the two successive cycles of minimization. Not shown are the deviations for the initial perturbed structures, which are slightly higher than the values shown after the first round of minimi-
zation (with respect to short-range energy). For example, in Table 6 the deviations shown in 1 .(a) are obtained upon perturbing a structure 3.067 A from the reference, the initial deviations for i to i + 1, i to i + 2 , i to i + 3, long-range and all distances being 0.031, 1.307, 1.907, 3.1 15, and 3.067A, respectively. Clearly, Table 6 shows that (i) local structures such as a-helix and 8-strand are well-preserved; and (ii) the decrements in various short-range and long-range deviations upon minimization occur in a balanced fashion without undue emphasis on any component over another.
Applicability to other proteins. The present
TABLE 6 Average deviations (in A) of local and long-range distances of a few energy-minimized structures of BPTI as
compared to the near-native reference
No. i t o i + 1 i t o i + 2 i t o i + 3 Long-range R.m.s. deviation deviation deviation deviation deviation
0.042 0.037 0.03 1 0.031 0.031 0.033 0.031 0.030 0.030 0.030
0.806 0.743 0.455 0.180 0.429 0.370 0.460 0.216 0.461 0.154
1.571 1.366 0.638 0.243 0.589 0.502 0.644 0.365 0.627 0.191
3.038 2.773 0.842 0.260 0.876 0.702 0.845 0.455 0.852 0.286
2.978 2.642 0.846 0.25 7 0.867 0.712 0.852 0.501 0.851 0.278
~ ~~ ~
I (a) Deviations of perturbed, short-range energy minimized structures. ' (b) Deviations of perturbed, total energy minimized structures.
294
Protein conformational energy
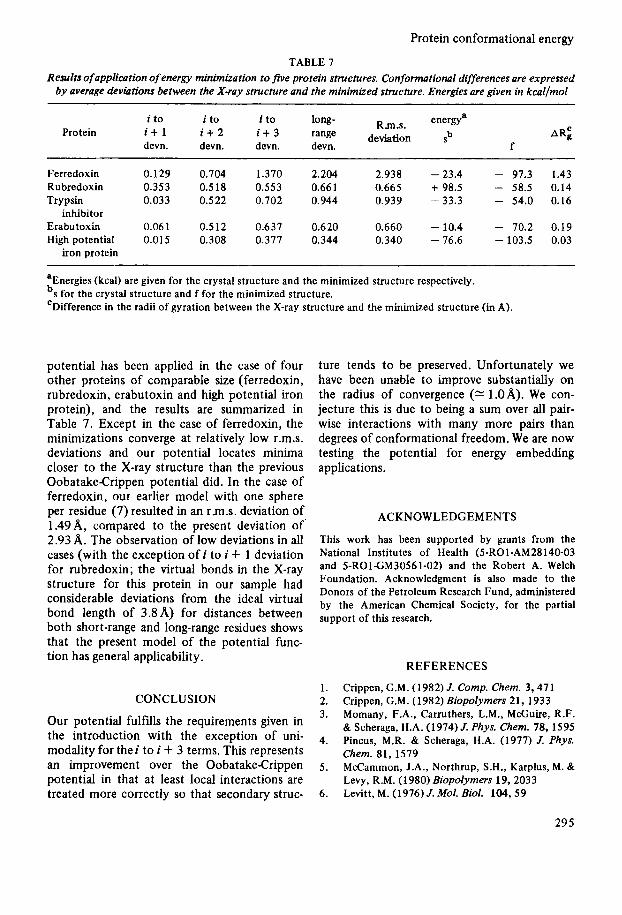
TABLE 7 Results of application of energy minimitation to jive protein structures. Conformational differences are expressed
by average deviations between the X-ray structure and the minimized structure. Energies are given in kcal/mol
i to i to i to long- Rm.s. energya A R:
f deviation Sb
Protein i + 1 i + 2 i + 3 range devn. devn. devn. devn.
Ferredoxin 0.129 0.704 1.370 2.204 2.938 - 23.4 - 97.3 1.43 Ru bredoxin 0.353 0.518 0.553 0.661 0.665 + 98.5 - 58.5 0.14
- 54.0 0.16 Trypsin 0.033 0.522 0.702 0.944 0.939 - 33.3
Erabu toxin 0.061 0.512 0.637 0.620 0.660 - 10.4 - 70.2 0.19 High potential 0.015 0.308 0.377 0.344 0.340 - 76.6 - 103.5 0.03
inhibitor
iron protein
'Energies (kcal) are given for the crystal structure and the minimized structure respectively. bs for the crystal structure and f for the minimized structure. 'Difference in the radii of gyration between the X-ray structure and the minimized structure (in A).
potential has been applied in the case of four other proteins of comparabIe size (ferredoxin, rubredoxin, erabutoxin and high potential iron protein), and the results are summarized in Table 7. Except in the case of ferredoxin, the minimizations converge at relatively low r.m.s. deviations and our potential locates minima closer to the X-ray structure than the previous Oobatake-Crippen potential did. In the case of ferredoxin, our earlier model with one sphere per residue (7) resulted in an rm.s. deviation of 1.49 A, compared to the present deviation of' 2.93 A. The observation of low deviations in all cases (with the exception of i to i + 1 deviation for rubredoxin; the virtual bonds in the X-ray structure for this protein in our sample had considerable deviations from the ideal virtual bond length of 3.8A) for distances between both short-range and long-range residues shows that the present model of the potential func- tion has general applicability.
CONCLUSION
Our potential fulfills the requirements given in the introduction with the exception of uni- modality for the i to i + 3 terms. This represents an improvement over the Oobatake-Crippen potential in that at least local interactions are treated more correctly so that secondary struc-
ture tends to be preserved. Unfortunately we have been unabIe to improve substantially on the radius of convergence (% 1.OA). We con- jecture this is due to being a sum over all pair- wise interactions with many more pairs than degrees of conformational freedom. We are now testing the potential for energy embedding applications.
ACKNOWLEDGEMENTS
This work has been supported by grants from the National Institutes of Health (5-RO1-AM28140-03 and 5-R016M30561-02) and the Robert A. Welch Foundation. Acknowledgment is also made to the Donors of the Petroleum Research Fund, administered by the American Chemical Society, for the partial support of this research.
1. 2. 3.
4.
5.
6.
REFERENCES
Crippen, G.M. (1982) J. Comp. Chem. 3,471 Crippen, G.M. (1982) Biopolymers 21, 1933 Momany, F.A., Carruthers, L.M., McGuire, R.F. & Scheraga, H.A. (1974) J. Phys. Chem. 78, 1595 Pincus, M.R. & Scheraga, H.A. (1977) J. Phys. Chem. 81,1579 McCammon, J.A., Northrup, S.H., Karplus, M. & Levy, R.M. (1980) Biopolymers 19, 2033 Levitt, M. (1976)J. Mol. Biol. 104,59
29 5
G Y . Crippen and V.N. Viswanadhan
7. Oobatake, M. & Crippen, G Y . (1981) J. Phys. Address:
8. Qlern. 85,1187 G.M. Crippen Dennis, J.E. & Mei, H.H.W. (1975) Techniml Report TR(75-246). Department of Computer Texas A M university Science, Cornell University, Ithaca, New York
Techniques with Forfrun, pp. 106- 119, McGraw- Hill, New York
Department of Chemistry
college Station, T~~~~ 77843 9. Kuester, J.L. & Mize, J.H. (1973) Optimization USA
296


