© Created & Copyrighted by Shivang Chaudhary
STEP GUIDE FOR DESIGNING OF EXPERIMENTS
FOR PHARMACEUTICAL PRODUCT DEVELOPMENT AS PER QbD
SHIVANG CHAUDHARY
© Copyrighted by Shivang Chaudhary
Quality Risk Manager & Intellectual Property Sentinel- CIIE, IIM Ahmedabad MS (Pharmaceutics)- National Institute of Pharmaceutical Education & Research (NIPER), INDIA
PGD (Patents Law)- National academy of Legal Studies & Research (NALSAR), INDIA
+91 -9904474045, +91-7567297579 [email protected]
https://in.linkedin.com/in/shivangchaudhary
facebook.com/QbD.PAT.Pharmaceutical.Development
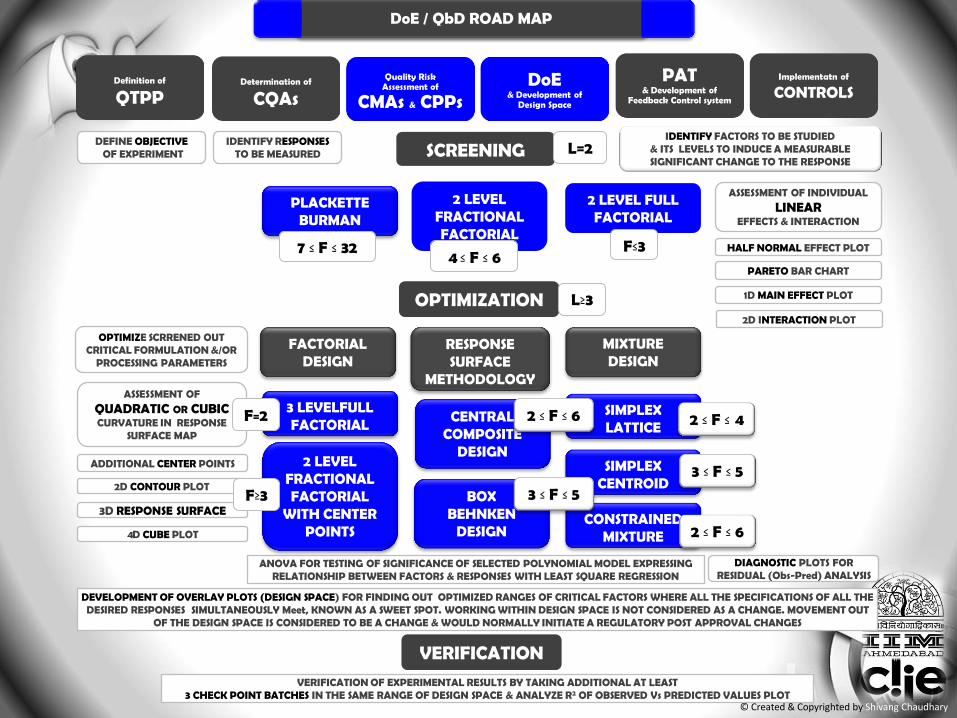
IDENTIFY FACTORS TO BE STUDIED & ITS LEVELS TO INDUCE A MEASURABLE SIGNIFICANT CHANGE TO THE RESPONSE
Implementatn of
CONTROLS PAT
& Development of Feedback Control system
DoE & Development of
Design Space
Quality Risk Assessment of
CMAs & CPPs Determination of
CQAs Definition of QTPP
DoE / QbD ROAD MAP
SCREENING
OPTIMIZATION
PLACKETTE BURMAN
FACTORIAL DESIGN
RESPONSE SURFACE
METHODOLOGY
MIXTURE DESIGN
3 LEVELFULL FACTORIAL
CENTRAL COMPOSITE
DESIGN
BOX BEHNKEN
DESIGN
SIMPLEX LATTICE
SIMPLEX CENTROID
CONSTRAINED MIXTURE
2 LEVEL FRACTIONAL FACTORIAL
2 LEVEL FRACTIONAL FACTORIAL
WITH CENTER POINTS
2 ≤ F ≤ 4
2 LEVEL FULL FACTORIAL
4 ≤ F ≤ 6 F≤3
L=2
2 ≤ F ≤ 6
L≥3
7 ≤ F ≤ 32
ASSESSMENT OF
QUADRATIC OR CUBIC CURVATURE IN RESPONSE
SURFACE MAP
2D CONTOUR PLOT
ADDITIONAL CENTER POINTS
VERIFICATION OF EXPERIMENTAL RESULTS BY TAKING ADDITIONAL AT LEAST 3 CHECK POINT BATCHES IN THE SAME RANGE OF DESIGN SPACE & ANALYZE R2 OF OBSERVED Vs PREDICTED VALUES PLOT
DEVELOPMENT OF OVERLAY PLOTS (DESIGN SPACE) FOR FINDING OUT OPTIMIZED RANGES OF CRITICAL FACTORS WHERE ALL THE SPECIFICATIONS OF ALL THE DESIRED RESPONSES SIMULTANEOUSLY Meet, KNOWN AS A SWEET SPOT. WORKING WITHIN DESIGN SPACE IS NOT CONSIDERED AS A CHANGE. MOVEMENT OUT
OF THE DESIGN SPACE IS CONSIDERED TO BE A CHANGE & WOULD NORMALLY INITIATE A REGULATORY POST APPROVAL CHANGES
ANOVA FOR TESTING OF SIGNIFICANCE OF SELECTED POLYNOMIAL MODEL EXPRESSING RELATIONSHIP BETWEEN FACTORS & RESPONSES WITH LEAST SQUARE REGRESSION
ASSESSMENT OF INDIVIDUAL
LINEAR EFFECTS & INTERACTION
2D INTERACTION PLOT
HALF NORMAL EFFECT PLOT
3D RESPONSE SURFACE
4D CUBE PLOT
IDENTIFY RESPONSES TO BE MEASURED
DEFINE OBJECTIVE OF EXPERIMENT
1D MAIN EFFECT PLOT
PARETO BAR CHART
OPTIMIZE SCRRENED OUT CRITICAL FORMULATION &/OR
PROCESSING PARAMETERS
VERIFICATION
F=2
F≥3
DIAGNOSTIC PLOTS FOR RESIDUAL (Obs-Pred) ANALYSIS
3 ≤ F ≤ 5
2 ≤ F ≤ 6
3 ≤ F ≤ 5
© Created & Copyrighted by Shivang Chaudhary
VALIDATION ANOVA VALIDATION
MODEL GRAPHS
MODEL SELECTION
EFFECT SELECTION
DESIGN SELECTION
SUMMARY
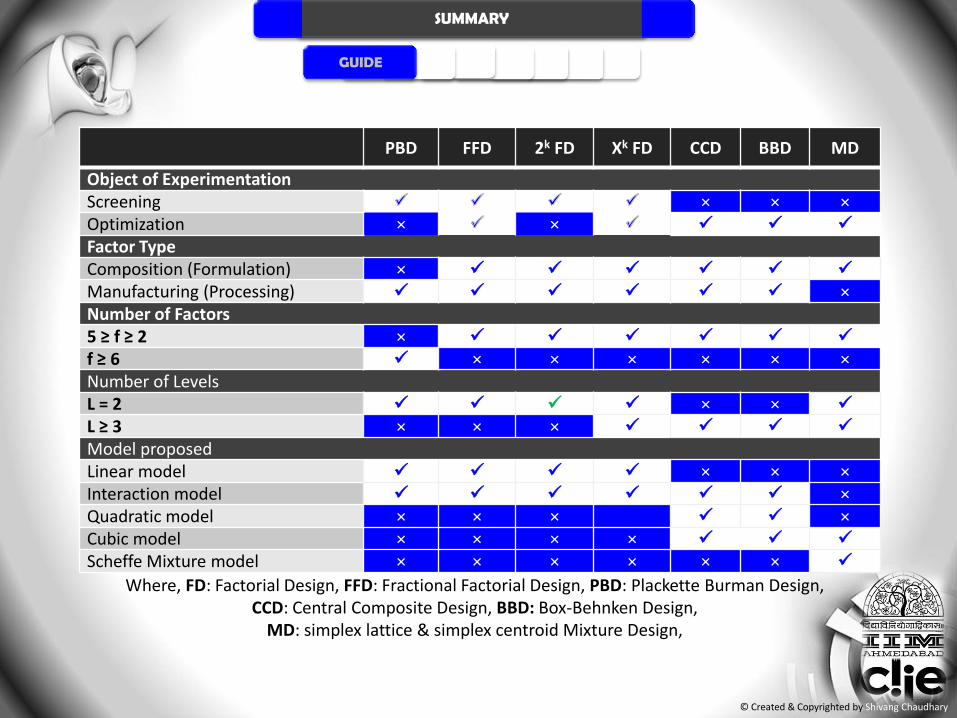
Where, FD: Factorial Design, FFD: Fractional Factorial Design, PBD: Plackette Burman Design, CCD: Central Composite Design, BBD: Box-Behnken Design,
MD: simplex lattice & simplex centroid Mixture Design,
PBD FFD 2k FD Xk FD CCD BBD MD
Object of Experimentation Screening × × × Optimization × × Factor Type Composition (Formulation) × Manufacturing (Processing) × Number of Factors 5 ≥ f ≥ 2 × f ≥ 6 × × × × × × Number of Levels L = 2 × × L ≥ 3 × × × Model proposed Linear model × × × Interaction model × Quadratic model × × × × Cubic model × × × × Scheffe Mixture model × × × × × ×
GUIDE
© Created & Copyrighted by Shivang Chaudhary

VALIDATION ANOVA VALIDATION
MODEL GRAPHS
SUMMARY
During Selection of any Design for experimentation, OBJECTIVE (goal) of the experiment & NUMBERS of the factors involved are the primary two most important factors to be considered
Res IV Factorial Designs are appropriate when: • Numerous unknown factors are involved • The goal is SCREENING of critical factors • Emphasis is on identifying important factor effects • Time & Resources are limited • If F>6 use Plackette Burman, if 4 ≤ F ≤ 6 then use fFD
Res V Factorial Designs are appropriate when: • The goal is EVALUATION OF MAIN EFFECTS &
INTERACTIONS between factors (2 ≤ F ≤ 4) • Have Sufficient time & resources for development • Res V Fractional or Full Factorial Design can be augmented
with axial star points to create CCD RSM for optimization.
RSM designs are appropriate when: • Vital factors are known & limited (2 ≤ F ≤ 5) • The goal is OPTIMIZATION of critical factors • Emphasis is on the fitted surface representing true behavior • detect non-linear significant curvature in response surface • Ranges of factors are defined (definite knowledge space)
Use MIXTURE Designs (SIMPLEX LATTICE or SIMPLEX CENTROID or CONSTRAINED MIXTURE) when: • Factors are components of a mixture • Emphasizing ratios of ingredients in formulations • Response is a function of proportions • Ingredients must total to 1 (100%)
PLACKETTE BURMAN or FRACTIONAL FACTORIAL
FRACTIONAL WITH CP & FULL FACTORIAL
RESPONSE SURFACE DESIGNS (CCD or BBD)
MIXTURE DESIGNS (SIMPLEX or CONSTRAINED)
MODEL SELECTION
EFFECT SELECTION GUIDE DESIGN
SELECTION
© Created & Copyrighted by Shivang Chaudhary

VALIDATION ANOVA VALIDATION
MODEL GRAPHS
SUMMARY
MODEL SELECTION GUIDE DESIGN
SELECTION EFFECT
SELECTION
EFFECT HALF NORMAL PROBABILITY PLOT
PARETO BAR CHART
Normal probability plot indicates whether the residuals (noise
factors) follow a normal distribution, which will follow a straight
line. Half-Normal Probability Plot can be used to choose significant
effects. It follows the same principle as the full normal probability
plot, except the sign of the effect is ignored in plotting.
Thus, LARGE ABSOLUTE VALUES SHOW UP AS OUTLIERS AT
NOTICEABLE GAP FROM RIGHT TO LEFT IN THE UPPER RIGHT-HAND
SECTION OF THE GRAPH. A distinct inflection point or "dogleg"
indicates the transition between significant and insignificant effects.
The Pareto chart may be more comfortable viewing as the Pareto
Chart has the significant effects selected. There are two different t
limits plotted on the graph - based on the Bonferroni corrected t and
a standard t.
EFFECTS THAT ARE NOW ABOVE THE BONFERRONI LIMIT ARE
ALMOST CERTAINLY SIGNIFICANT. Effects that are now above the
T-Value Limit are possibly significant and should be added
if they are not already selected.
, Effect Half Normal Probability plot reveals vital few from trivial many & Pareto bar chart puts all the effects in perspective during Selection of Significant Main Effects from Non significant Errors
REVEALS VITAL FEW SIGNIFICANT CRITICAL FACTORS OUT OF NONCRTICAL NONSIGNIFICANT TRIVIAL MANY
PUTS EFFECTS IN PERSPECTIVE FOR EASY UNDERSTANDING OF RELATIVE IMPORTANCE OF FACTORS
Use Stepwise Regression, Forward Selection or Backward Elimination on the basis of corresponding Coefficient values to identify important variables; when selecting variables for inclusion in the model, follow the
HIEARCHY PRINCIPLE & keep all main effects that are part of significant higher order terms or interactions, even if the main effect p-value is larger than you would like. © Created & Copyrighted by Shivang Chaudhary

VALIDATION ANOVA VALIDATION GUIDE DESIGN
SELECTION
SUMMARY
EFFECT SELECTION
LINEAR MODEL QUADRATIC MODEL
CUBIC MODEL SCHEFFE MODEL
The order of polynomial: MODEL (A mathematical relationship between factors & response assisting in calculations & predictions) for any design depends on the expected response behavior.
FIRST Order (LINEAR) terms modeling SLOPEs of a STRAIGHT LINE or FLAT PLANE
Used for SCREENING of Significant Factors for Identification of Main Effects & Interactions
SECOND Order (QUADRATIC) terms modeling CURVATUREs of an ECLIPSE.
Used for OPTIMIZATION of Factors for development of Design Space from Knowledge Space
THIRD Order (CUBIC) terms: modeling Inflected ASSYMETRY like “S” curve in response eclipse
Reduced Polynomial Scheffe Model characterized by LACK of intercept & LACK of square & cube terms
During Selection of Model for Analysis of Response; ANOVA should be carried out thoroughly for testing of SIGNIFICANCE of each MODEL TERMS (p<0.05), insignificant LACK OF FIT (p>0.1) with MODEL GRAPHS
MODEL GRAPHS
MODEL SELECTION
© Created & Copyrighted by Shivang Chaudhary
VERIFICATION GUIDE DESIGN
SELECTION
SUMMARY
EFFECT SELECTION
MODEL SELECTION
MODEL GRAPHS
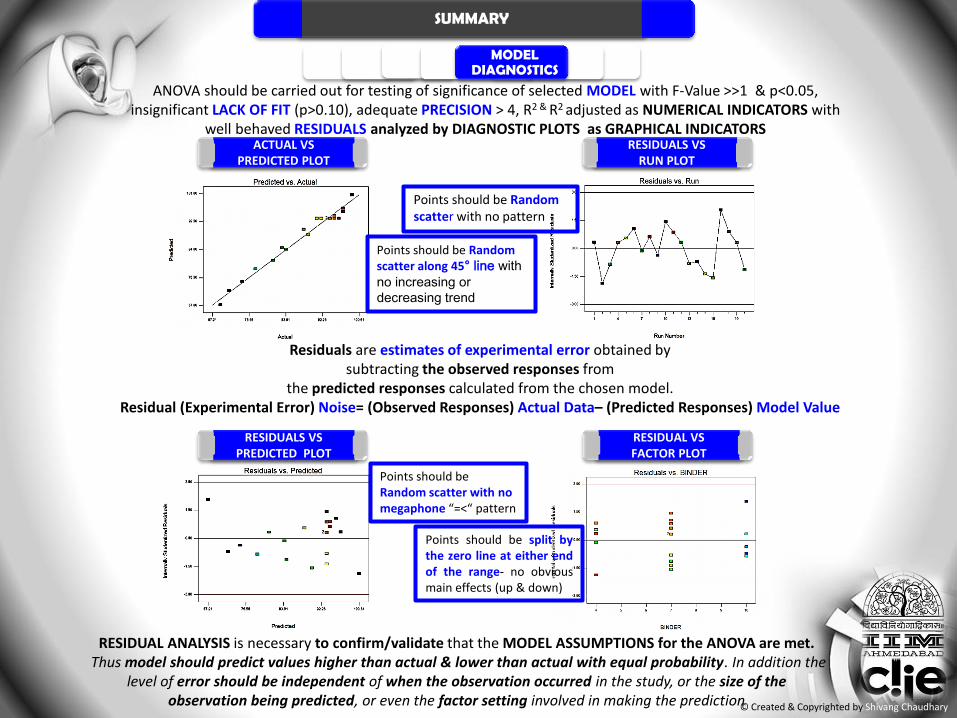
ANOVA should be carried out for testing of significance of selected MODEL with F-Value >>1 & p<0.05, insignificant LACK OF FIT (p>0.10), adequate PRECISION > 4, R2 & R2 adjusted as NUMERICAL INDICATORS with
well behaved RESIDUALS analyzed by DIAGNOSTIC PLOTS as GRAPHICAL INDICATORS
RESIDUAL ANALYSIS is necessary to confirm/validate that the MODEL ASSUMPTIONS for the ANOVA are met. Thus model should predict values higher than actual & lower than actual with equal probability. In addition the
level of error should be independent of when the observation occurred in the study, or the size of the observation being predicted, or even the factor setting involved in making the prediction
MODEL DIAGNOSTICS
ACTUAL VS PREDICTED PLOT
RESIDUALS VS RUN PLOT
RESIDUALS VS PREDICTED PLOT
RESIDUAL VS FACTOR PLOT
Residuals are estimates of experimental error obtained by subtracting the observed responses from
the predicted responses calculated from the chosen model. Residual (Experimental Error) Noise= (Observed Responses) Actual Data– (Predicted Responses) Model Value
Points should be Random scatter along 45° line with
no increasing or
decreasing trend
Points should be Random scatter with no pattern
Points should be Random scatter with no megaphone “=<“ pattern
Points should be split by the zero line at either end of the range- no obvious main effects (up & down)
© Created & Copyrighted by Shivang Chaudhary
VALIDATION GUIDE DESIGN SELECTION
SUMMARY
EFFECT SELECTION
MODEL SELECTION
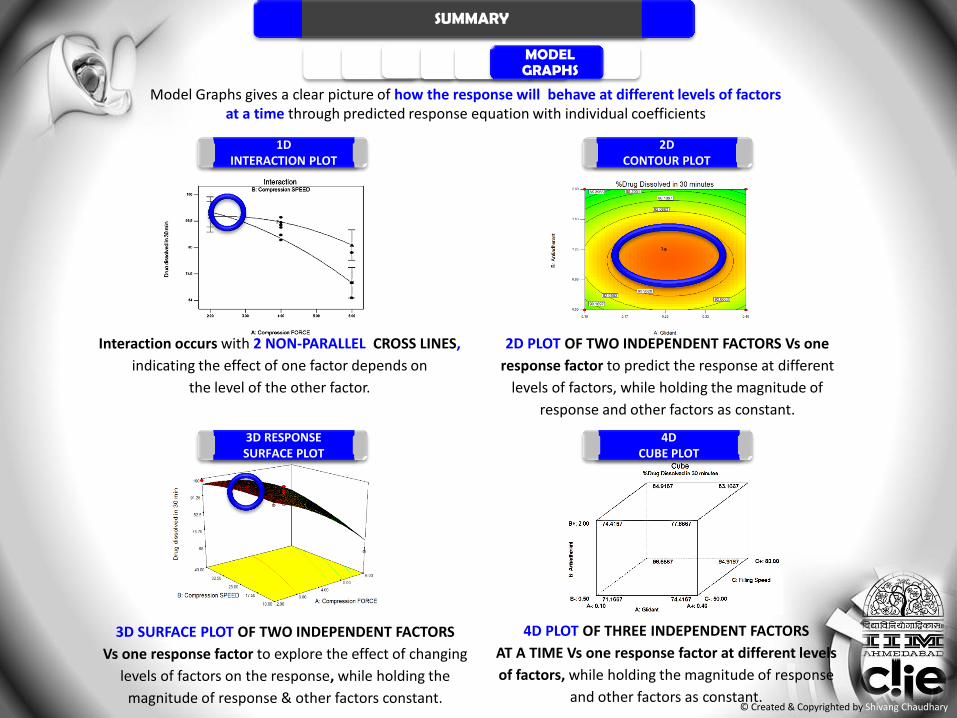
Interaction occurs with 2 NON-PARALLEL CROSS LINES,
indicating the effect of one factor depends on
the level of the other factor.
2D PLOT OF TWO INDEPENDENT FACTORS Vs one
response factor to predict the response at different
levels of factors, while holding the magnitude of
response and other factors as constant.
3D SURFACE PLOT OF TWO INDEPENDENT FACTORS
Vs one response factor to explore the effect of changing
levels of factors on the response, while holding the
magnitude of response & other factors constant.
4D PLOT OF THREE INDEPENDENT FACTORS
AT A TIME Vs one response factor at different levels
of factors, while holding the magnitude of response
and other factors as constant.
MODEL DIAGNOSTICS
1D INTERACTION PLOT
2D CONTOUR PLOT
3D RESPONSE SURFACE PLOT
4D CUBE PLOT
Model Graphs gives a clear picture of how the response will behave at different levels of factors at a time through predicted response equation with individual coefficients
MODEL GRAPHS
© Created & Copyrighted by Shivang Chaudhary
GUIDE DESIGN SELECTION
SUMMARY
EFFECT SELECTION
MODEL SELECTION
DIAGNOSTIC PLOTS
ANOVA VALIDATION
VERIFICATION
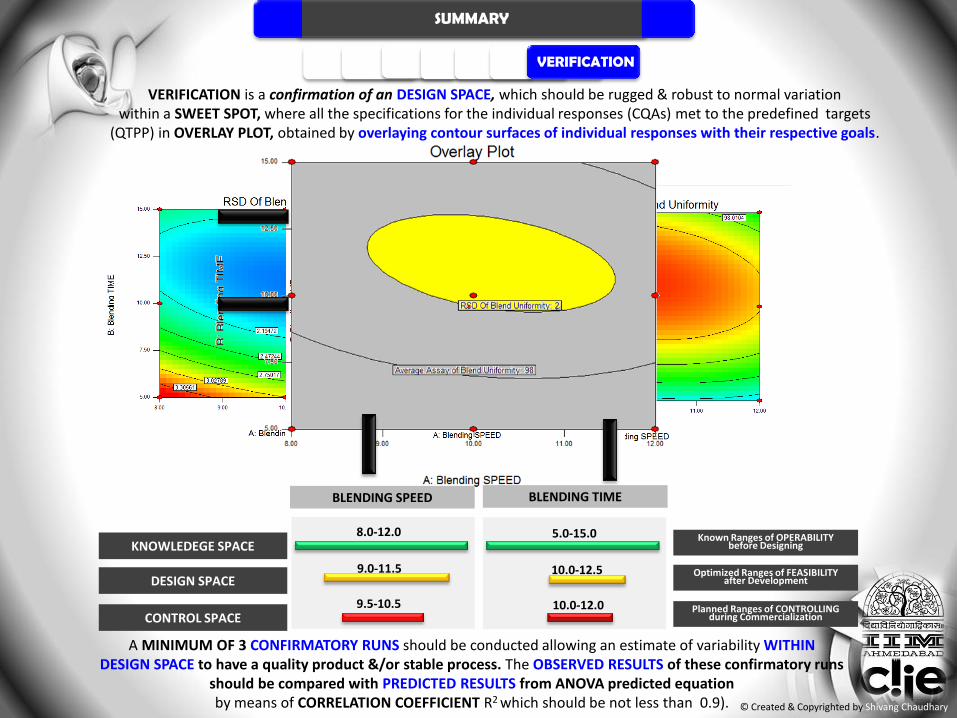
VERIFICATION is a confirmation of an DESIGN SPACE, which should be rugged & robust to normal variation within a SWEET SPOT, where all the specifications for the individual responses (CQAs) met to the predefined targets
(QTPP) in OVERLAY PLOT, obtained by overlaying contour surfaces of individual responses with their respective goals.
8.0-12.0
9.0-11.5
9.5-10.5
5.0-15.0
10.0-12.5
10.0-12.0
A MINIMUM OF 3 CONFIRMATORY RUNS should be conducted allowing an estimate of variability WITHIN DESIGN SPACE to have a quality product &/or stable process. The OBSERVED RESULTS of these confirmatory runs
should be compared with PREDICTED RESULTS from ANOVA predicted equation by means of CORRELATION COEFFICIENT R2 which should be not less than 0.9).
BLENDING SPEED BLENDING TIME
KNOWLEDEGE SPACE
DESIGN SPACE
CONTROL SPACE
Known Ranges of OPERABILITY before Designing
Optimized Ranges of FEASIBILITY after Development
Planned Ranges of CONTROLLING during Commercialization
© Created & Copyrighted by Shivang Chaudhary

THANK YOU SO MUCH FROM
DESIGN IS A JOURNEY OF DISCOVERY…
© Created & Copyrighted by Shivang Chaudhary
SHIVANG CHAUDHARY
© Copyrighted by Shivang Chaudhary
Quality Risk Manager & Intellectual Property Sentinel- CIIE, IIM Ahmedabad MS (Pharmaceutics)- National Institute of Pharmaceutical Education & Research (NIPER), INDIA
PGD (Patents Law)- National academy of Legal Studies & Research (NALSAR), INDIA
+91 -9904474045, +91-7567297579 [email protected]
https://in.linkedin.com/in/shivangchaudhary
facebook.com/QbD.PAT.Pharmaceutical.Development


