A Value Menu for McDonald’s
Pershing SquareCapital Management

1
DISCLAIMER
Pershing Square Capital Management's ("Pershing") analysis and conclusions regarding McDonald's Corporation ("McDonald's") are based on publicly available information. Pershing recognizes that there may be confidential information in the possession of the Company and its advisors that could lead them to disagree with the approach Pershing is advocating.
The analyses provided include certain estimates and projections prepared with respect to, among other things, the historical and anticipated operating performance of the Company. Such statements, estimates, and projections reflect various assumptions by Pershing concerning anticipated results that are inherently subject to significant economic, competitive, and other uncertainties and contingencies and have been included solely for illustrative purposes. No representations, express or implied, are made as to the accuracy or completeness of such statements, estimates or projections or with respect to any other materials herein. Actual results may vary materially from the estimates and projected results contained herein.
Pershing manages funds that are in the business of trading - buying and selling - public securities. It is possible that there will be developments in the future that cause Pershing to change its position regarding the Company and possibly reduce, dispose of, or change the form of its investment in the Company. Pershing recognizes that the Company has a stock market capitalization of approximately $42bn, and that, accordingly it could be more difficult to exert influence over its Board than has been the case with smaller companies.

2
Table of Contents
C. McOpCo Financial Analysis 74
B. PF McDonald's Financial Analysis 66
A. Pershing’s Proposal: Assumptions 59
Appendix 58
V. Developing a Response to the Company 43
IV. Company Response to Pershing 39
III. Pershing’s Proposal to McDonald's: McOpCo IPO 23
II. Pershing’s View of McDonald's 11
I. Overview of McDonald's 3

I. Overview of McDonald's

4
Pershing’s Involvement with McDonald’s
On September 22nd, Pershing Square Capital Management (“Pershing”) presented a proposal for increasing shareholder value (“the Proposal”) to McDonald’s management
Pershing commends McDonald’s management for its strong operational execution over the past two years
Pershing appreciates the willingness and openness of McDonald’s management to discuss the Proposal
Management has taken our Proposal seriously – our Proposal was presented to McDonald’s Board of Directors
Pershing had a follow-up meeting with McDonald’s management on October 31 when the Company communicated its response to our Proposal
Pershing is pleased to have the opportunity to share the details of our Proposal with the broader investment community
I. Overview of McDonald’s
5
Review of McDonald’s
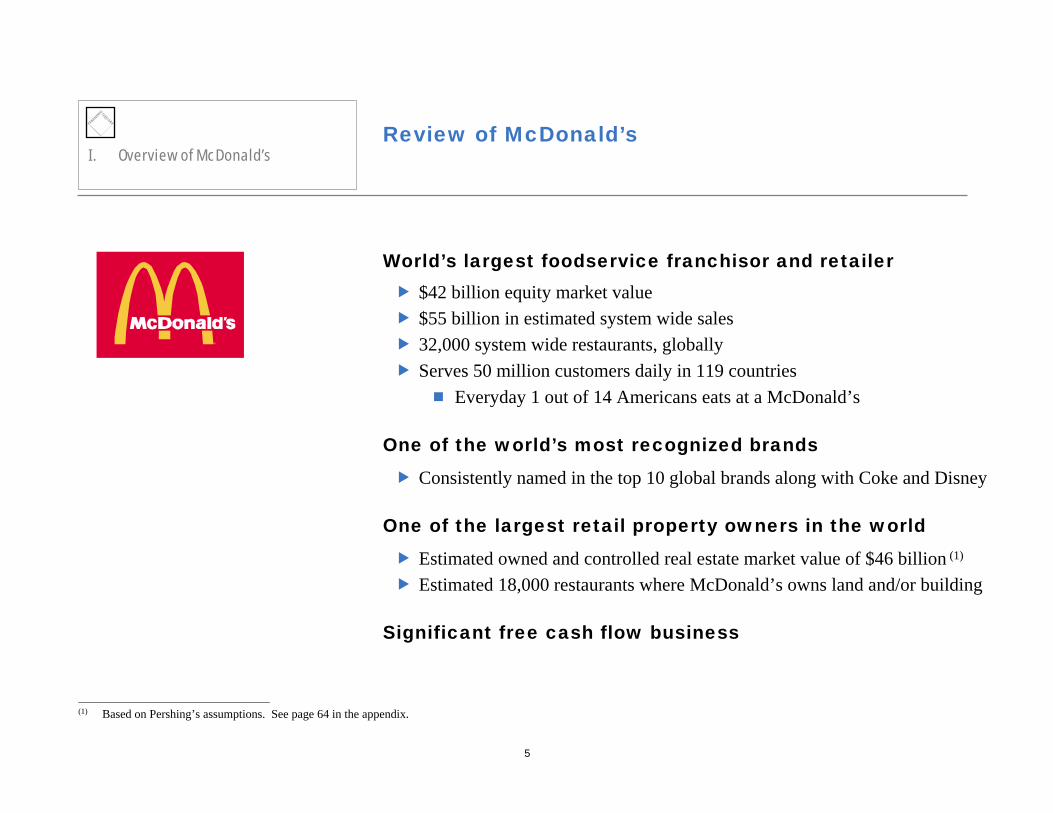
World’s largest foodservice franchisor and retailer$42 billion equity market value$55 billion in estimated system wide sales32,000 system wide restaurants, globallyServes 50 million customers daily in 119 countries
Everyday 1 out of 14 Americans eats at a McDonald’s
One of the world’s most recognized brands
Consistently named in the top 10 global brands along with Coke and Disney
One of the largest retail property owners in the world
Estimated owned and controlled real estate market value of $46 billion (1)
Estimated 18,000 restaurants where McDonald’s owns land and/or building
Significant free cash flow business
________________________________________________(1) Based on Pershing’s assumptions. See page 64 in the appendix.
I. Overview of McDonald’s

6
Historical Financial Performance
McDonald’s Historical Revenue and EBITDA Performance (1)
($ in millions)
Following declines in same-store sales and profitability in 2001 and 2002, Management has improved operations through product innovation, capital discipline and strong execution. As a result, the Company’s profitability has increased.
Same-store Sales Growth 0.6% (1.3%) (2.1%) 2.4% 6.9%
I. Overview of McDonald’s
$5,183$4,512$3,997$4,041$4,144
$19,065$17,141
$15,406$14,870$14,243
$0
$5,000
$10,000
$15,000
$20,000
2000 2001 2002 2003 2004
Reve
nue /
EBI
TDA
24.0%
25.5%
27.0%
28.5%
30.0%
EBITDA Margin
EBITDA Revenue EBITDA Margin________________________________________________(1) EBITDA is adjusted for certain non-recurring and non-cash items.
7
Historical Financial Performance (Cont’d)
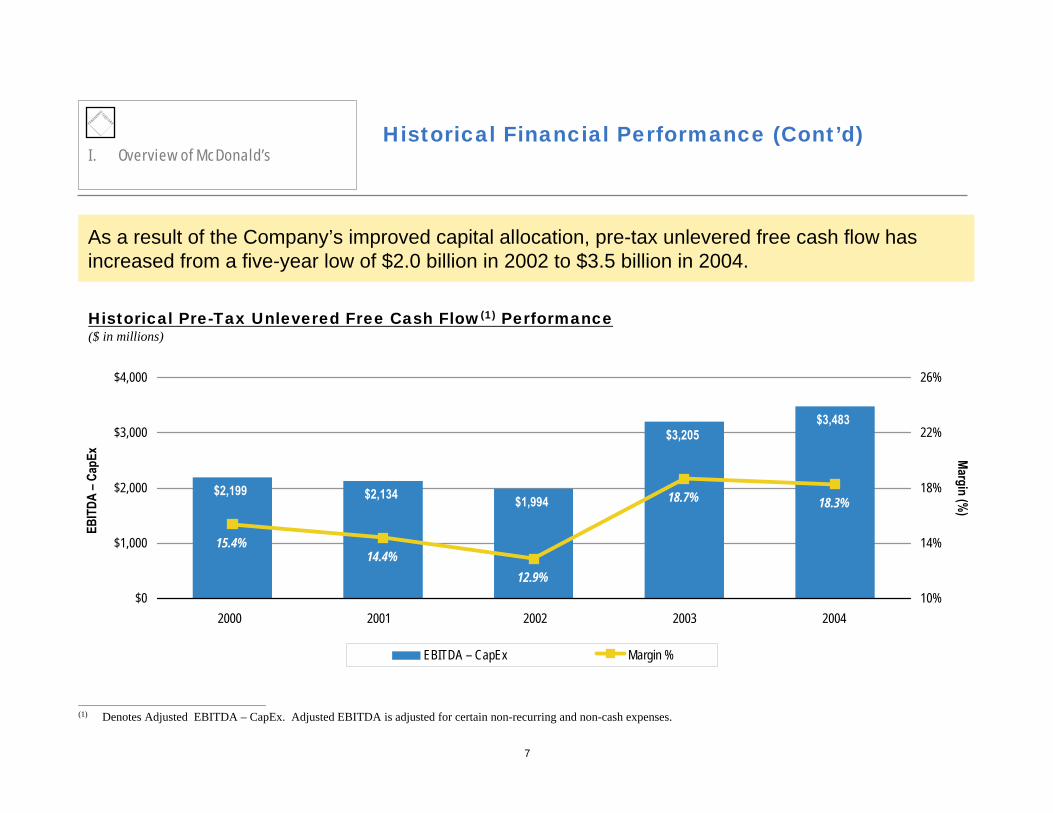
Historical Pre-Tax Unlevered Free Cash Flow(1) Performance($ in millions)
As a result of the Company’s improved capital allocation, pre-tax unlevered free cash flow has increased from a five-year low of $2.0 billion in 2002 to $3.5 billion in 2004.
_______________________________________________(1) Denotes Adjusted EBITDA – CapEx. Adjusted EBITDA is adjusted for certain non-recurring and non-cash expenses.
$2,199$1,994
$3,205$3,483
$2,134
15.4%14.4%
12.9%
18.7% 18.3%
$0
$1,000
$2,000
$3,000
$4,000
2000A 2001A 2002A 2003A 2004A
EBIT
DA –
CapE
x
10%
14%
18%
22%
26%
Margin (%)
EBITDA – CapEx Margin %
I. Overview of McDonald’s
2000 2001 2002 2003 2004

8
Stock Price Performance
McDonald’s Stock Price Performance($ per share)
Although McDonald's stock has rebounded from its 2003 lows, it has been range bound in the low $30s for the past five years and is significantly off of its high of $48 per share reached in 1999.
High of $48.3211/12/99
$10.00
$20.00
$30.00
$40.00
$50.00
11/12/99 07/12/00 03/12/01 11/10/01 07/11/02 03/11/03 11/09/03 07/09/04 03/09/05 11/07/05
I. Overview of McDonald’s

9
0
50
100
150
200
250
300
350
11/10/00 06/01/01 12/21/01 07/12/02 01/31/03 08/22/03 03/12/04 10/01/04 04/22/05 11/11/05
McDonald's QSR Comp S&P 500(1)
5-Year Indexed Stock Performance
5-Year Indexed Stock Performance
Over the past five years, McDonald’s has only slightly outperformed the S&P 500 while its QSR peer group has vastly outperformed the index.
________________________________________________(1) Includes YUM and WEN.
QSR
MCDS&P
McDonald's S&P 500 QSR Index5 Year Indexed Performance 2.4% (9.6%) 177.3%
I. Overview of McDonald’s

10
1 5 .6 x
2 0 .4 x
1 6 .7 x
0 .0 x
5 .0 x
1 0 .0 x
1 5 .0 x
2 0 .0 x
2 5 .0 x
3 0 -D a y A v e ra g e T ra ilin g W E N Y U M(1 )
8.7x
9.3x
8.9x
7.5x
8.0x
8.5x
9.0x
9.5x
10.0x
30-Day Average Trailing WEN YUM(1)
McDonald’s versus its Peers
________________________________________________(1) McDonald’s stock price is based on a 30-day average trailing price as of 11/11/05.
EV / ’06E EBITDA
P / ‘06E EPS
Despite McDonald’s strong real estate assets, number one QSR market position and leading brand, McDonald’s trades at a discount to its peers.
We believe this discount is due to a fundamental misconception about McDonald’s business.
Long-TermEPS Growth 9% 12% 12%
I. Overview of McDonald’s

II. Pershing’s View of McDonald's

12
McDonald’s: How the System Works…II. Pershing’s View of McDonald's
Franchisor: Franchises brand and collects feeOperator: Operates 9,000 McDonald’s restaurantsLandlord: Buys and develops real estate and leases to its franchiseesReal Estate and Franchise estimated pre-tax ROI of 17.5%(1):
Franchise Fee: 4% of restaurant sales
Rent: greater of a minimum rent or a percentage of restaurant sales (current avg. ~9% of sales)
Franchisee bears all maintenance capital costs
________________________________________________
(1) Illustrative return based on Pershing’s assumptions for the cost of land and building and approximate average unit sales in 2004.
Landlord, Franchisor, Restaurant Operator Franchisees
Cost of Land $650kCost of Building 650kTotal Cost $1,300k
Est. Average Unit Sales $1,750kRent as a % of Sales 9.0%Franchise Income as % of sales 4.0%Rental Income $158Franchise Income 70Total Income $228Unlevered Pre Tax ROIC 17.5%

13
A Landlord, Franchisor and Restaurant Operator
McDonald’s controls substantially all of its systemwide real estateEstimated 11,700 restaurants where McDonald’s owns both the land and buildings and 7,000 restaurants where McDonald’s owns only the buildings (1)
Estimated $1.3 billion of income generated from subleasesEstimated real estate value: $46 billion or ~94% of current Enterprise Value (2)
Approximately 32,000 restaurants where McDonald’s receives 4% of unit sales Reported financials have
overstated margins due to a lack of transfer pricing
Currently not charged a franchise fee Currently not charged a market rent
________________________________________________
(1) Assumes that McDonald’s owns the land and buildings of 37% of its system wide units and owns the buildings of 22% of its system wide units.(2) Valuation based on Pershing estimates. See page 64 for more detail on real estate valuation.
Franchisor Restaurant OperatorLandlord
Real Estate and Franchise Business McOpCo
II. Pershing’s View of McDonald's
Approximately 9,000 Company-operated restaurants
14
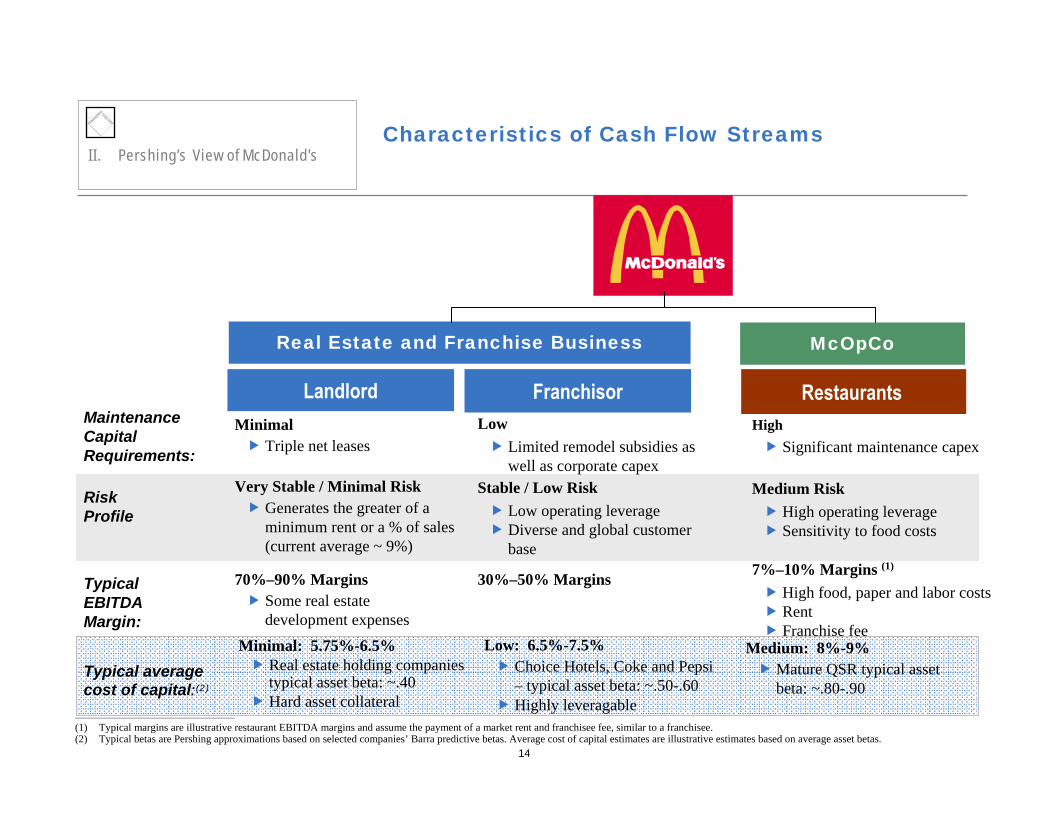
Characteristics of Cash Flow Streams
Franchisor RestaurantsLandlord
Real Estate and Franchise Business
MinimalTriple net leases
LowLimited remodel subsidies as well as corporate capex
HighSignificant maintenance capex
MaintenanceCapital Requirements:
Very Stable / Minimal RiskGenerates the greater of a minimum rent or a % of sales (current average ~ 9%)
Stable / Low RiskLow operating leverageDiverse and global customer base
Medium RiskHigh operating leverageSensitivity to food costs
RiskProfile
70%–90% MarginsSome real estate development expenses
30%–50% Margins 7%–10% Margins (1)
High food, paper and labor costsRentFranchise fee
Typical EBITDA Margin:
Typical average cost of capital:(2)
________________________________________________
(1) Typical margins are illustrative restaurant EBITDA margins and assume the payment of a market rent and franchisee fee, similar to a franchisee.(2) Typical betas are Pershing approximations based on selected companies’ Barra predictive betas. Average cost of capital estimates are illustrative estimates based on average asset betas.
Minimal: 5.75%-6.5%Real estate holding companies typical asset beta: ~.40 Hard asset collateral
Low: 6.5%-7.5%Choice Hotels, Coke and Pepsi – typical asset beta: ~.50-.60Highly leveragable
McOpCo
Medium: 8%-9%Mature QSR typical asset beta: ~.80-.90
II. Pershing’s View of McDonald's
15
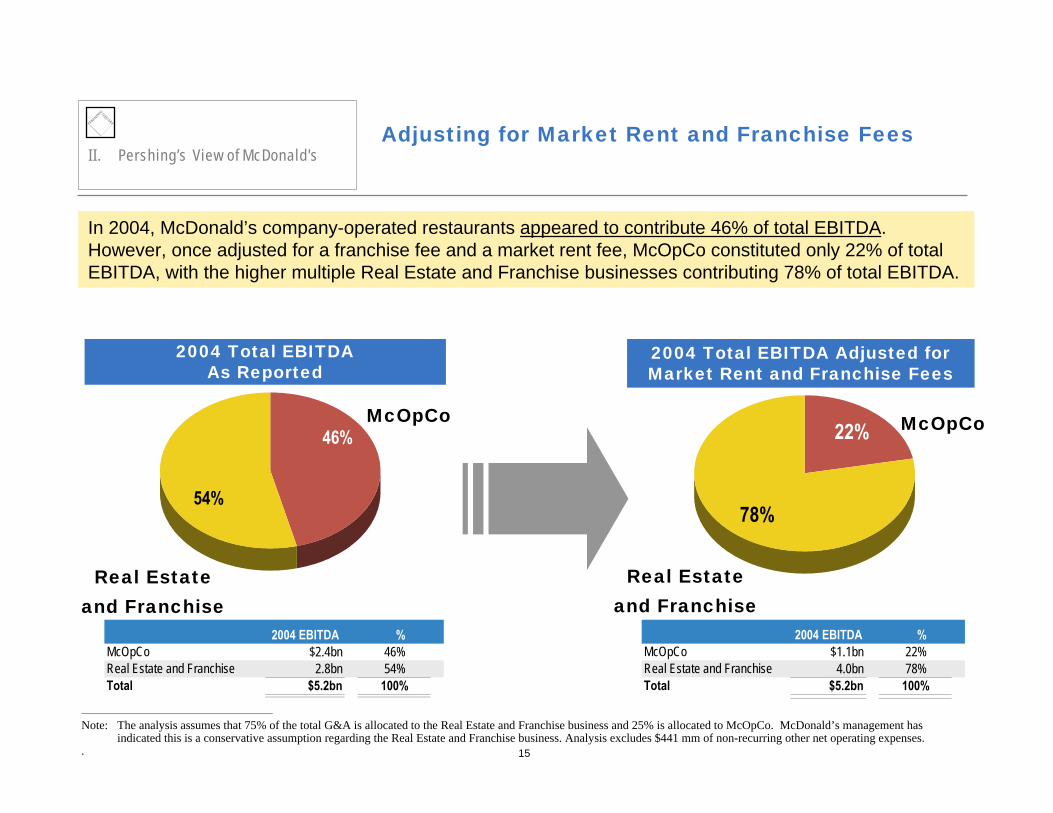
Adjusting for Market Rent and Franchise Fees
2004 Total EBITDA Adjusted for Market Rent and Franchise Fees
55%
2004 Total EBITDA As Reported
In 2004, McDonald’s company-operated restaurants appeared to contribute 46% of total EBITDA. However, once adjusted for a franchise fee and a market rent fee, McOpCo constituted only 22% of total EBITDA, with the higher multiple Real Estate and Franchise businesses contributing 78% of total EBITDA.
________________________________________________
Note: The analysis assumes that 75% of the total G&A is allocated to the Real Estate and Franchise business and 25% is allocated to McOpCo. McDonald’s management has indicated this is a conservative assumption regarding the Real Estate and Franchise business. Analysis excludes $441 mm of non-recurring other net operating expenses.
.
78%
22% McOpCo
Real Estate and Franchise
2004 EBITDA %McOpCo $2.4bn 46%Real Estate and Franchise 2.8bn 54%Total $5.2bn 100%
2004 EBITDA %McOpCo $1.1bn 22%Real Estate and Franchise 4.0bn 78%Total $5.2bn 100%
46%
54%
McOpCo
Real Estateand Franchise
II. Pershing’s View of McDonald's

16
Adjusting for Market Rent and Franchise Fees (Cont’d)
2005E Total EBITDA – Capex Adjusted for Market Rent and Franchise Fees
2005E Total EBITDA – CapexAs Reported
Once adjusted for market rent and franchise fees, McOpCo would be contributing only 14% of total EBITDA-Maintenance Capex, with the Real Estate and Franchise business contributing 86% of total EBITDA-Maintenance Capex ,based on FY 2005E projections.
________________________________________________
The analysis assumes that 75% of the total G&A is allocated to the Real Estate and Franchise business and 25% is allocated to McOpCo. McDonald’s management has indicated this is a conservative assumption regarding the real estate and franchise business. In addition, we note that 2005E maintenance capexincludes certain one-time capital expenditures related to systemwide remodeling program. Please see appendix for full reconciliation
.
'05 EBITDA- Maint. Capex %
McOpCo $1.9bn 47%PF McDonald's 2.2bn 53%Total $4.1bn 100%
'05 EBITDA- Maint. Capex %
McOpCo $0.6bn 14%PF McDonald's 3.5bn 86%Total $4.1bn 100%
II. Pershing’s View of McDonald's
53% 47%
McOpCo
Real Estate andFranchise
86%
14%McOpCoReal Estate and
Franchise

17
Reconciling McDonald’s 2004A P&L
Set forth below is a table which reconciles McOpCo’s, the Real Estate and Franchise businesses’ and stand-alone McDonald’s FY 2004A income statements, assuming McOpCo pays a market rent and franchise fee. The analysis demonstrates that the Real Estate and Franchise business contributed approximately 78% of total EBITDA.
________________________________________________
The analysis assumes that 75% of the total G&A is allocated to the Real Estate and Franchise business and 25% is allocated to McOpCo. McDonald’s management has indicated this is a conservative assumption regarding the real estate and franchise business.Note: Analysis excludes $441 mm of non-recurring other net operating expenses.
.
II. Pershing’s View of McDonald's
(U.S. $ in millions)Real Estate 2004
2004 McOpCo and Franchise Inter-Company ConsolidatedIncome Statement P&L P&L Eliminations Sum of Parts
Sales by Company Operated Restaurants $14,224 $14,224 $14,224Rent from Franchise and Affiliate Rest. 3,336 3,336 3,336 Rent From Company Operated Rest. - 1,280 (1,280) - Franchise Fees From Franchise and Affiliate Rest. 1,505 1,505 1,505 Franchise Fees From Company Operated Rest. - 569 (569) - Total Revenue $19,065 $14,224 $6,690 ($1,849) $19,065
Company Operated Expenses: Food and Paper 4,853 4,853 - - 4,853 Compensation & Benefits 3,726 3,726 - - 3,726 Non-Rent Occupancy and Other Expenses (excl. D&A) 2,164 2,164 - - 2,164 Company Operated D&A 774 427 347 774 Company-Operated Rent Expense 583 583 583 (583) 583 Additional Rent Payable to PropCo - 697 - (697) - Franchise Fee Payable to FranCo - 569 - (569) - Total Company Operated Expenses $12,100 $13,019 $930 ($1,849) $12,100
Franchised Restaurant Occupancy Costs 576 - 576 - 576 Franchise PPE D&A 427 427 427 Corporate G&A 1,980 495 1,485 1,980 EBIT 3,982 710 3,272 - 3,982
Depreciation & Amortization 1,201 427 774 - 1,201 EBITDA $5,183 $1,137 $4,046 $0 $5,183% of Total EBITDA 100% 22% 78% 100%

18
Historical EBITDA by Business Type:As Currently Reported
Assuming 75% of G&A is allocated to the Real Estate and Franchise business, an allocation that McDonald’s management indicates is conservative, we indicate below the EBITDA for McOpCo and the Real Estate and Franchise businesses, as depicted in the reported financials. We note that McOpCo has historically appeared to contribute approximately ~45% of consolidated EBITDA.
McDonald’s Consolidated EBITDA($ in millions)
________________________________________________
Assumes McOpCo G&A to be 25% of consolidated G&A and Real Estate and Franchise G&A to be 75% of consolidated G&A. Management has indicated this is a conservative assumption regarding the Real Estate and Franchise business.
Real Estate and Franchise
~55%
McOpCo~45%
$2,780$2,440$2,156$2,148$2,149
$2,403$2,072$1,841$1,893$1,995
$5,183$4,512
$3,997$4,041$4,144
$0.0
$1.0
$2.0
$3.0
$4.0
$5.0
$6.0
2000 2001 2002 2003 2004
Real Estate and Franchise McOpCo
II. Pershing’s View of McDonald's

19
(1.1%) (10.6%) (7.9%) 14.0% 20.4%
0.6% (1.3%) (2.1%) 2.4% 6.9%Same-store sales
Historical EBITDA by Business Type:Adjusted for a Market Rent and Franchise Fee
Despite an economic recession in 2001-2003, significant dips in McDonald’s system wide same-store sales growth and declines in McDonald’s stock prices, the Real Estate and Franchise business has grown every year over the last five years.
McDonald’s Consolidated EBITDA($ in millions)
________________________________________________
Notes:Assumes McOpCo G&A to be 25% of consolidated G&A and Real Estate and Franchise G&A to be 75% of consolidated G&A.Assumes McOpCo pays franchise fees of 4% of sales and rent of 9% of sales.
(0.5)% 0.1% 0.9% 12.6% 13.4%RE/Franchise Growth
Real Estate and Franchise
~80%
McOpCo Growth
II. Pershing’s View of McDonald's
$3,138 $3,142 $3,169 $3,568 $4,046
$1,006
$1,137
$900 $828$944
$4,144 $4,041 $3,997$4,512
$5,183
$0.000
$1.000
$2.000
$3.000
$4.000
$5.000
$6.000
2000 2001 2002 2003 2004
Real Estate and Franchise McOpCo

20
$1.5 $1.6 $1.8 $1.9 $2.1 $2.5 $2.6 $2.7 $2.9 $3.2 $3.1 $3.1 $3.2 $3.6 $4.0$0.5 $0.5 $0.6 $0.6 $0.7$0.7 $0.8 $0.8 $1.0 $1.0 $1.0 $0.9 $0.8
$0.9$1.1
$0.0
$1.0
$2.0
$3.0
$4.0
$5.0
$6.0
1990 1991 1992 1993 1994 1995 1996 1997 1998 1999 2000 2001 2002 2003 2004
McOpCo
Real Estate andFranchise
Real Estate and Franchise Business:Stable and Growing
McDonald’s Consolidated EBITDA($ in billions)
(15.6%) 30.5% 28.3% 16.9% 2.6% 54.3% 0.6% 5.2% 60.9% 5.0% (15.7%) (22.1%) (39.3%) 54.4% 29.1%Change in Year-End Stock Price:
2.3% 18.1% (2.2%) 17.0% 14.1% 3.6% 6.3% 18.0% 5.1% (1.1%) (10.6%) (7.9%) 14.0% 20.4%McOpCo EBITDA Growth
Real Estate & Franchise EBITDA Growth: 4.9% 11.7% 8.5% 10.4% 15.3% 4.0% 4.3% 10.1% 7.4% (0.5%) 0.1% 0.9% 12.6% 13.4%
Based on Reported FinancialsBased on Pershing Assumptions
________________________________________________
Notes:Assumes McOpCo G&A to be 25% of consolidated G&A and Real Estate and Franchise G&A to be 75% of consolidated G&A.Assumes McOpCo pays franchise fees of 4% of sales and rent of 9% of sales.
II. Pershing’s View of McDonald's

21
Historical Perspectives on McOpCo
McDonald’s did not historically operate restaurants
The Company initially entered the business of operating restaurants only as a defensive measure
Limited number of restaurants“The idea emerged that we should operate a base of ten or so stores as a company. This would give us a firm base of income in the event the McDonald brothers claimed default on our contract…” (1)
--Ray Kroc / Founder
Expansion of McOpCo units first occurred in the late 1960sVeteran franchisees were approaching retirement and needed liquidityMcDonald’s stock was provided as a tax-free exchange for the restaurants
“Some of our operators had tremendous wealth but no money. And we were using McDonald’s stock that was trading at 25 times earnings to buy restaurants for seven times earnings” (2)
--Fred Turner / Former President and CEO
Turner realized in the mid 70s that owning too many McOpCounits was not in the best interest of the Company
________________________________________________
(1) From Grinding It Out: The Making of McDonald’s, p. 108.(2) From McDonald’s: Behind the Golden Arches, pgs. 288 - 291.
II. Pershing’s View of McDonald's

22
Superior Franchisee EconomicsII. Pershing’s View of McDonald's
“Running a McDonald’s is a 363-day-a-year business and an owner/operator, with his personal interests and incentives, can inherently do a better job than a chain manager.” (1)
--Fred Turner / Former President and CEO
Company Operated Franchisee Operated
Structure C-Corporation LLC / Partnership
Taxes Corporate level tax No corporate level tax
Leverage 10% - 30% 75% - 90%
Levered Returns Low teens 40% and higher
General manager Salaried employee/ Owner / Entrepreneurcorporate manager
Illustrative Characteristics of Company Operated versus Franchisee Operated Restaurants (2)
________________________________________________
(1) From McDonald’s: Behind the Golden Arches, pgs. 288 - 291.(2) Illustrative leverage and equity return figures. Not based on company data.
III. Pershing’s Proposal to McDonald's: McOpCo IPO

24
Pershing’s Proposal: McOpCo IPO
Step 1: IPO of 65% McOpCo Step 2: Issue Debt and Pursue Leveraged Self Tender
IPO 65% of McOpCo
IPO generates estimated $3.27bn of after tax proceeds
Assumes a 7x EV/FY’06E EBITDA multiple
Assumes $1.35 bn of Net Debt allocated to McOpCo
Issue $14.7bn of financing secured against PF McDonald’s real estate
Debt financing and IPO proceeds used to
Refinance all of the existing $5 bnof net debt at Pro Forma McDonald’s
Repurchase 316mm shares at $40 per share
Pay $300mm in fees and transaction costs
III. Pershing’s Proposal to McDonald's: McOpCo IPO
25
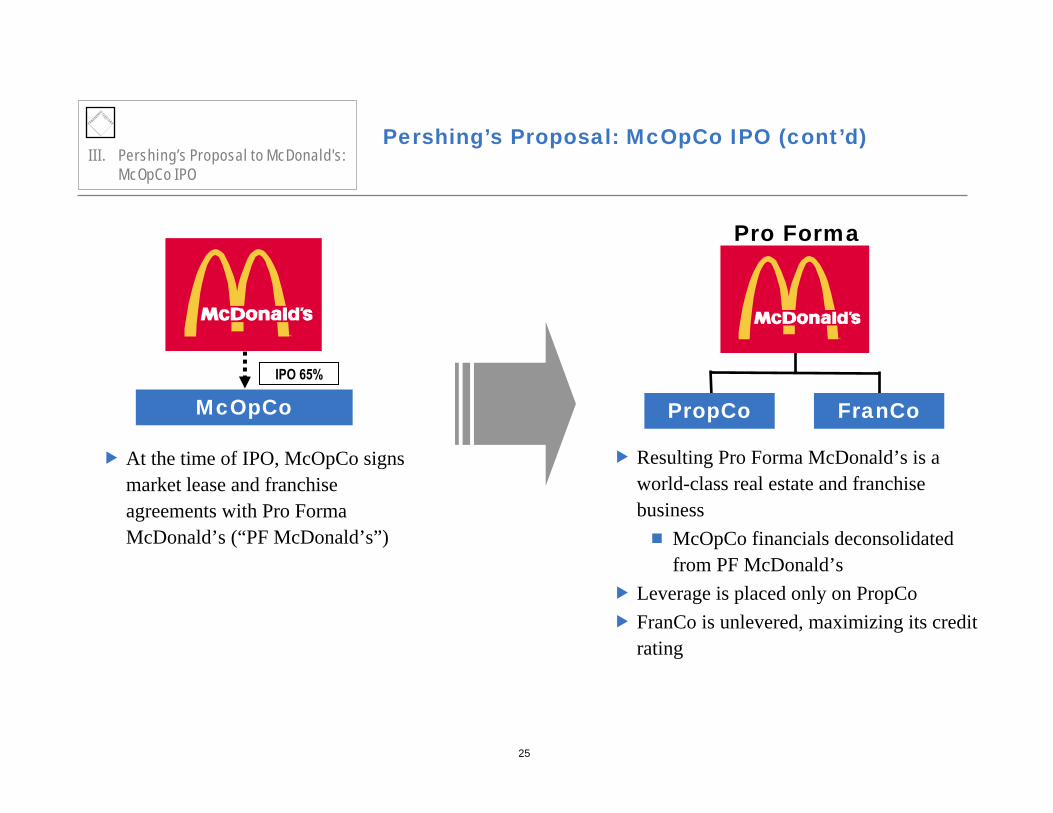
Pershing’s Proposal: McOpCo IPO (cont’d)
McOpCo
At the time of IPO, McOpCo signs market lease and franchise agreements with Pro Forma McDonald’s (“PF McDonald’s”)
Resulting Pro Forma McDonald’s is a world-class real estate and franchise business
McOpCo financials deconsolidated from PF McDonald’s
Leverage is placed only on PropCoFranCo is unlevered, maximizing its credit rating
PropCo FranCo
Pro Forma
IPO 65%
III. Pershing’s Proposal to McDonald's: McOpCo IPO

26
McOpCo IPO: A Transformational Transaction
Significant value creation for shareholders
PF McDonald’s would trade at an approximate 37%–52% premium over where it trades today, in the range of approximately $45–50 per share (1)
Creates investor transparency
Deconsolidation provides investors with transparent insight into PF McDonald’s profitability (60% EBITDA margins), attractive FCF profile (35% levered FCF margins) and world-class real estate/franchise assets
Separation of McOpCo highlights the significant value of rental income and franchise fees currently eliminated in consolidation
Enhances management focus and incentives at both entities
Enhances ability to attract and retain top McOpCo management
Allows PF McDonald’s management team to focus on new product innovation, improved marketing efforts, stronger real estate development programs and higher quality franchisee performance monitoring / training
An IPO of McOpCowould have several positive strategic and financial implications for both Pro Forma McDonald’s as well as McOpCo.
III. Pershing’s Proposal to McDonald's: McOpCo IPO
________________________________________________(1) Based on recent stock price of $33 per share.

27
TypicalStandalone Pro Forma Mature
$ in millions FY 2006E FY 2006E QSR
Revenue $20,816 $7,393EBITDA 5,594 4,464
EBITDA Margin 26.9% 60.4% 15% - 20%
EBITDA-Capex 4,335 3,739EBITDA-Capex Margin 20.8% 50.6% 7.5% - 12.5%
EBITDA-Maintenance Capex 4,651 4,025EBITDA - Maint. Capex Margin 22.3% 54.4% 10% - 15%
FCF (1) 3,059 2,440FCF Margin 14.7% 33.0% 5% - 10%
A Transformational Transaction (Cont'd)
Improves operating and financial metrics at every levelSignificantly improves PF McDonald’s EBITDA and free cash flow marginsEnhances return on capital and overall capital allocation for the PF McDonald’sImproves ability of PF McDonald’s to pay significant ongoing dividends
________________________________________________
We note that CapEx projections are net of proceeds obtained from store closures.(1) Typical QSR margin based on Wall Street estimates for YUM! Brands and Wendy’s.
III. Pershing’s Proposal to McDonald's: McOpCo IPO

28
A Transformational Transaction (Cont'd)
Will likely lead to improved operating margins at McOpCoSeparation from PF McDonald’s will make margin improvement an imperative
Improves capital structure while maintaining investment grade credit rating
Low-cost secured debt to replace current debt or issued incrementally on current structure
Cheap CMBS structured financing issued at PropCo could judiciously utilize strong real estate collateralCMBS financing is non-recourse to McDonald’s (parent)FranCo remains unlevered and is at least a AA creditPF McDonald’s, the holding company, remains investment grade
Improves alignment with franchisees (1)
Allows for share buybacks of higher return businessSeparation of McOpCo allows for share buybacks to be targeted predominantly at PF McDonald’s, the stronger free cash flow business
An IPO of McOpCowould have several positive strategic and financial implications for both Pro Forma McDonald’s as well as McOpCo.
________________________________________________(1) Will be discussed at length later in the presentation.
III. Pershing’s Proposal to McDonald's: McOpCo IPO

29
A Transformational Transaction (Cont'd)
Allows for a voice in McOpCo through governanceGiven its 35% stake in McOpCo post spin-off, PF McDonald’s will be able to elect several Board seats to the new entityGovernance affords visibility in McOpCo operations, which will help in:
managing the McDonald’s brand extending new products through the franchisee systemremaining in touch with unit-level economics and issues
Supported by highly similar, successful precedent transactions
Coca Cola Company carved-out its owned bottling operations in 1986 in what is widely viewed as one of the most successful restructurings of all timePepsiCo followed suit in a similar transaction in 1999, with unanimous support from the Wall Street research analyst community
Allows for an accelerated McOpCo refranchising program
Increases overall size of PF McDonald’s investor base
Strong potential to attract both dividend / income-focused investors and real estate-focused investors
An IPO of McOpCowould have several positive strategic and financial implications for both McDonald’s as well as McOpCo.
III. Pershing’s Proposal to McDonald's: McOpCo IPO
30
Pro FormaTypical Mature
QSR (1)
TypicalReal Estate
C-CorpChoice Hotels
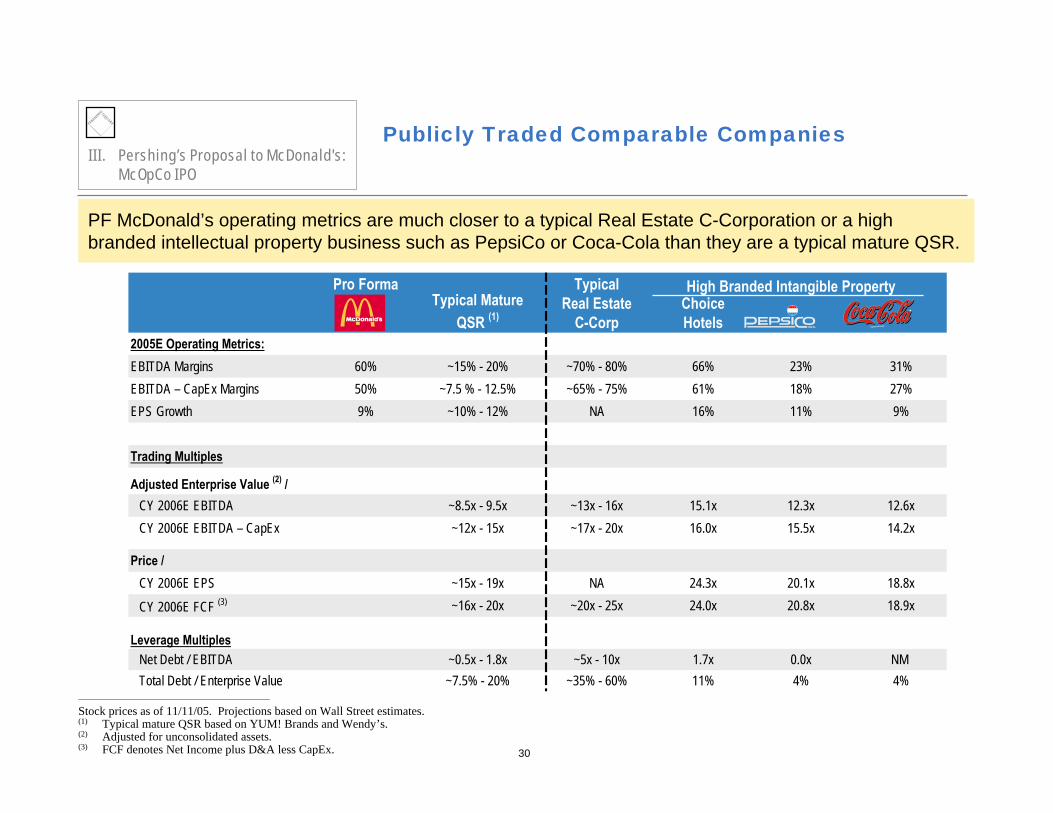
2005E Operating Metrics:EBITDA Margins 60% ~15% - 20% ~70% - 80% 66% 23% 31%EBITDA – CapEx Margins 50% ~7.5 % - 12.5% ~65% - 75% 61% 18% 27%EPS Growth 9% ~10% - 12% NA 16% 11% 9%
Trading Multiples
Adjusted Enterprise Value (2) / CY 2006E EBITDA ~8.5x - 9.5x ~13x - 16x 15.1x 12.3x 12.6xCY 2006E EBITDA – CapEx ~12x - 15x ~17x - 20x 16.0x 15.5x 14.2x
Price /CY 2006E EPS ~15x - 19x NA 24.3x 20.1x 18.8x
CY 2006E FCF (3) ~16x - 20x ~20x - 25x 24.0x 20.8x 18.9x
Leverage MultiplesNet Debt / EBITDA ~0.5x - 1.8x ~5x - 10x 1.7x 0.0x NM Total Debt / Enterprise Value ~7.5% - 20% ~35% - 60% 11% 4% 4%
High Branded Intangible Property
Publicly Traded Comparable Companies
PF McDonald’s operating metrics are much closer to a typical Real Estate C-Corporation or a high branded intellectual property business such as PepsiCo or Coca-Cola than they are a typical mature QSR.
________________________________________________
Stock prices as of 11/11/05. Projections based on Wall Street estimates.(1) Typical mature QSR based on YUM! Brands and Wendy’s.(2) Adjusted for unconsolidated assets.(3) FCF denotes Net Income plus D&A less CapEx.
III. Pershing’s Proposal to McDonald's: McOpCo IPO

31
REITs: Typical Trading Multiples
We believe REITs trade in the range of 13x-17x EV/’06E EBITDA, depending on the type of real estate and the businesses the properties support.
________________________________________________Based on Wall Street research estimates at the time of Pershing’s initial Proposal to the Company.
EV / '06E Div. P / '06E P / '06ECompany EBITDA Yield FFO AFFOHealth Care 14.7x 6.3% 12.6x 13.3xIndustrial 16.3x 4.2% 13.9x 17.2xMultifamily 17.0x 4.8% 16.6x 19.4xOffice 15.2x 4.7% 13.8x 19.6xRegional Mall 16.3x 3.8% 14.2x 16.9xSelf Storage 17.5x 3.8% 16.7x 18.3xStrip Center 15.5x 4.5% 14.4x 16.5xTriple Net Lease 13.1x 6.4% 12.8x 13.4x
REIT Industry Total / Wtd. Avg. 15.7x 4.8% 14.4x 16.8x
III. Pershing’s Proposal to McDonald's: McOpCo IPO

32
Significant Value Creation for Shareholders
Based on relevant publicly traded comparable companies, including several real estate holding C-Corporations, Pro Forma McDonald’s would trade in the range of 12.5x–13.5x EV/CY ’06E EBITDA. We believe PF McDonald’s would trade at a 37%–52% premium over where it trades today.
________________________________________________(1) Assumes $1.35 bn of net debt allocated to McOpCo and $5.0 bn of net debt allocated to PF McDonald’s. In addition, assumes $9.7 bn of incremental leverage placed on
PF McDonald’s.(2) Represents 35% of the market equity value of McOpCo.(3) Assumes incremental leverage and the after-tax proceeds from McOpCo IPO (net of fees and expenses) are used to buy back approximately 316 mm shares at an average price of $40.(4) Assumes a recent stock price of $33.(5) P / FY ’06E FCF multiple adjusted for Pro Forma McDonald’s 35% stake in McOpCo.
III. Pershing’s Proposal to McDonald's: McOpCo IPO
$ in millions Low HighEV/'06E EBITDA Multiple Range 12.5x 13.5xEnterprise Value $55,799 $60,263Less: Net Debt (12/31/05E) (1) 14,650 14,650Plus: Remaining Stake in McOpCo (2) 2,097 2,493Equity Value $43,247 $48,106Ending Shares Outstanding (12/31/05E) (3)
957.3 957.3
Price Per Share $45 $50Premium to recent price (4) 36.9% 52.3%Implied P/FY 2006 EPS Multiple 19.9x 22.2xImplied P/FY 2006 FCF Multiple (5) 19.8x 21.9x
Implied FCF / Dividend Yield 5.1% 4.6%

33
McOpCo Valuation Summary and Potential IPO Proceeds
McOpCo would likely be valued at $6.0 billion to $7.1 billion of equity market value or 6.5x–7.5x EV/’06E EBITDA.
________________________________________________(1) See appendix for McOpCo IPO after-tax proceeds schedule.
III. Pershing’s Proposal to McDonald's: McOpCo IPO
McOpCo Financial Summary$ in millions
McOpCo Financial Summary FY 2006ECompany operated revenues $15,429Segment EBITDA, pre G&A 1,690
EBITDA Margin, pre G&A 11.0%Assumed G&A for McOpCo 560
Assumed G&A as a Percentage of Total G&A 25.0%EBITDA post G&A $1,130
EBITDA Margins 7.3%Net Income $308EPS $0.24
McOpCo Valuation Summary$ in millions Low HighEV/'06E EBITDA Multiple Range 6.5x 7.5xMcOpCo Enterprise Value $7,343 $8,472Net Debt (12/31/05) 1,350 1,350
Equity Value of McOpCo $5,993 $7,122Ending Shares Outstanding 1,274 1,274
Price per share $4.70 $5.59
Estimated After-Tax IPO Proceeds (1) $3,042 $3,497See appendix for after-tax IPO proceeds schedule
34
Pro Forma McDonald’s: Valuation Summary
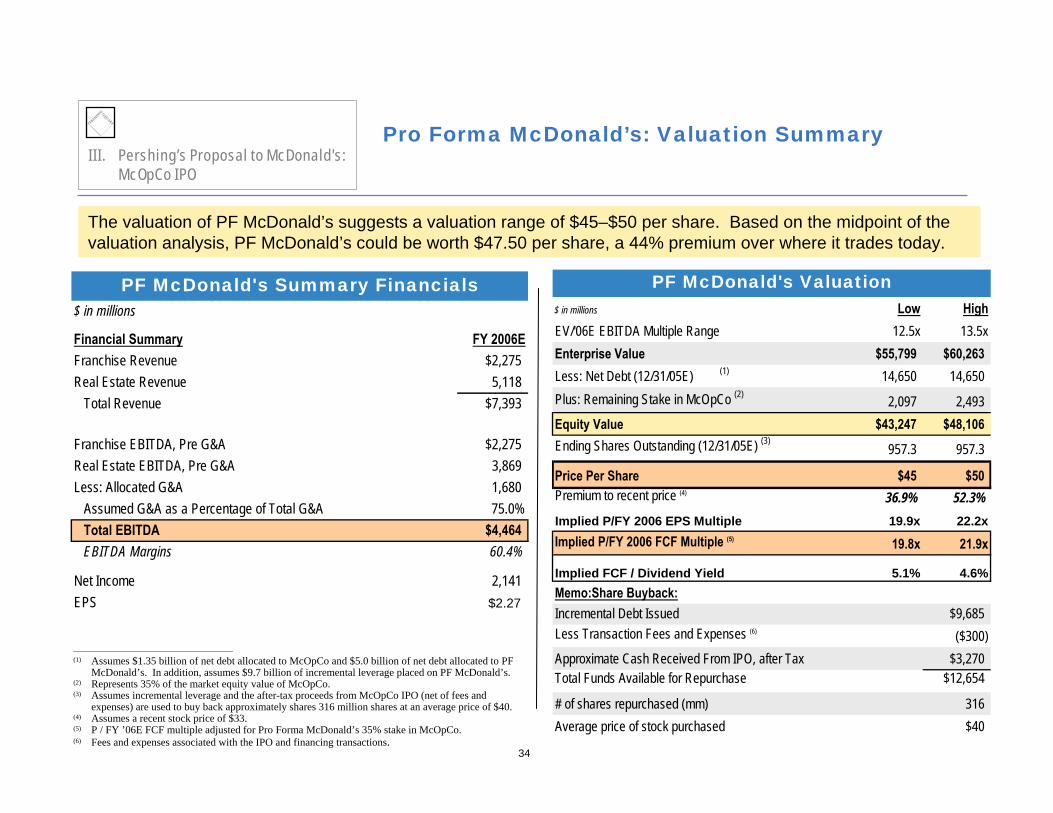
The valuation of PF McDonald’s suggests a valuation range of $45–$50 per share. Based on the midpoint of the valuation analysis, PF McDonald’s could be worth $47.50 per share, a 44% premium over where it trades today.
________________________________________________(1) Assumes $1.35 billion of net debt allocated to McOpCo and $5.0 billion of net debt allocated to PF
McDonald’s. In addition, assumes $9.7 billion of incremental leverage placed on PF McDonald’s.(2) Represents 35% of the market equity value of McOpCo.(3) Assumes incremental leverage and the after-tax proceeds from McOpCo IPO (net of fees and
expenses) are used to buy back approximately shares 316 million shares at an average price of $40.(4) Assumes a recent stock price of $33.(5) P / FY ’06E FCF multiple adjusted for Pro Forma McDonald’s 35% stake in McOpCo.(6) Fees and expenses associated with the IPO and financing transactions.
III. Pershing’s Proposal to McDonald's: McOpCo IPO
PF McDonald's Summary Financials$ in millions
Financial Summary FY 2006EFranchise Revenue $2,275Real Estate Revenue 5,118
Total Revenue $7,393
Franchise EBITDA, Pre G&A $2,275Real Estate EBITDA, Pre G&A 3,869Less: Allocated G&A 1,680
Assumed G&A as a Percentage of Total G&A 75.0%Total EBITDA $4,464EBITDA Margins 60.4%
Net Income 2,141EPS $2.27
PF McDonald's Valuation$ in millions Low HighEV/'06E EBITDA Multiple Range 12.5x 13.5xEnterprise Value $55,799 $60,263Less: Net Debt (12/31/05E) (1) 14,650 14,650Plus: Remaining Stake in McOpCo (2) 2,097 2,493Equity Value $43,247 $48,106Ending Shares Outstanding (12/31/05E) (3)
957.3 957.3
Price Per Share $45 $50Premium to recent price (4) 36.9% 52.3%Implied P/FY 2006 EPS Multiple 19.9x 22.2xImplied P/FY 2006 FCF Multiple (5) 19.8x 21.9x
Implied FCF / Dividend Yield 5.1% 4.6%Memo:Share Buyback:Incremental Debt Issued $9,685Less Transaction Fees and Expenses (6) ($300)Approximate Cash Received From IPO, after Tax $3,270Total Funds Available for Repurchase $12,654
# of shares repurchased (mm) 316Average price of stock purchased $40

35
Capitalization and Credit Profile of Pro Forma McDonald’s
Set forth below are the sources and uses of proceeds associated with a $14.7 bn issuance of secured collateralized financing (net of cash on hand), or an incremental $9.7 of net debt, based on expected net debt as of FY 2005E. We have assumed a 5% fixed rate for this collateralized financing. After this transaction, Pro Forma McDonald’s would be leveraged approximately 3.5x Total Debt/EBITDA or at a 25% Debt to Enterprise Value ratio. Proceeds from this issuance would be used to repay existing debt, buyback shares and pay financing fees and expenses.
$ in millionsSources
New CMBS Financing (net of cash) $14,650Percentage Loan to Value 44%
Total $14,650
UsesRepay Existing Net Debt at PF McDonald's $4,965Buyback Shares 9,535Fees and Expenses 150
Total $14,650
PF McDonald's Capital StructureFY2005E
Total Net Debt at Stand-alone McDonalds $6,315Less: Net Debt Allocated to McOpCo (1,350)Net Debt at PF McDonalds $4,965Incremental Debt Issued through CMBS 9,685
Total Net Debt $14,650
Total Debt / EBITDA 3.5xNet Debt / EBITDA 3.4xAssumed Corporate Credit Investment GradeTotal Debt / Total Capitalization 24.5%
III. Pershing’s Proposal to McDonald's: McOpCo IPO

36
3.5x
11.3x
6.1x
10.2x8.1x
0.0x
3.0x
6.0x
9.0x
12.0x
Brookfield Properties British Land Land Securities Forest City Enterprises
25%
48% 56%35%
59%
0%
25%
50%
75%
100%
Brookfield Properties British Land Land Securities Forest City Enterprises
Comparing PF McDonald’s Credit Stats with Comparable Real Estate Holding C-Corporations
Total Debt / ’05E EBITDA (1)
Debt / Enterprise Value
EBITDA/Interest: 5.8x (2) 2.3x 1.5x 2.5x NA
Rating: BBB BBB NR BB+
Pro Forma
Pro Forma
________________________________________________(1) Based on Wall Street research estimates. Pro Forma McDonald’s EV assumes a valuation multiple of 13x EV/FY’06 EBITDA.(2) Assumes an average 5% fixed rate on PF McDonald’s debt.
III. Pershing’s Proposal to McDonald's: McOpCo IPO

37
Credit Ratings of Large Public REITs
A review of large REITs indicates that these businesses support investment grade ratings with a debt to enterprise value of 36% on average, as compared to Pro Forma McDonald’s which would have a debt to enterprise value of 25%.
________________________________________________
Notes:Stock prices as of 11/11/2005. PF McDonald’s EV assumes a valuation multiple of 13x EV/FY’06 EBITDA.Total Debt includes Preferred.
III. Pershing’s Proposal to McDonald's: McOpCo IPO
Total Debt/ Moody's Moody's S&P S&PCompany Name Enterprise Value Rating Outlook Rating Outlook
Simon Property Group Inc. 47.2% Baa2 Stable BBB+ StableEquity Office Properties Trust 50.9% Baa3 Stable BBB+ StableVornado Realty Trust 37.4% Baa3 Stable BBB+ StableEquity Residential 38.4% Baa1 Stable BBB+ StablePrologis 31.5% Baa1 Stable BBB+ StableArchstone-Smith Trust 33.5% Baa1 Stable BBB+ StableBoston Properties Inc. 36.0% NR NR BBB+ StableKimco Realty Corp. 25.2% Baa1 Stable A- StableAvalonBay Communities Inc. 27.3% Baa1 Stable BBB+ Stable
Median Total Debt/EV 36%Average Total Debt/EV 36%
PF McDonald's Total Debt/EV 25%

38
Pro Forma McDonald’s Has A Superior Credit Profile to a Typical REITIII. Pershing’s Proposal to McDonald's:
McOpCo IPO
Despite being a C-Corp and lacking the tax advantages of a REIT, PF McDonald’s has several superior credit characteristics
REITs are required to pay 90% of earnings through dividends, whereas Pro Forma McDonald’shas much more credit flexibility
PF McDonald’s has significant brand value to support its cash flows and overall credit

IV. Company Response to Pershing
40
Company Response to PershingIV. Company Response to Pershing
McDonald’s asked its Advisors to help review the Proposal
Goal was to review the proposal to assess 4 critical areas:
Advisors reported back with judgments on
(1) Valuation
(2) Credit Impact
McDonald’s Management reviewed the Proposal to assess
(3) Friction Costs
(4) Governance / Alignment Issues

41
Management Concerns: Friction Costs, Credit Impact and Governance Issues
Friction Costs Credit Impact Alignment Issues
Some friction costs associated with the CMBS financing structure, but not a gating issue
Potential property tax revaluationsLegal costsLarge transaction for CMBS marketMostly driven by CMBS financing
Incremental $9bn of leverage as proposed may put pressure on credit rating
Rating agency consolidation of McOpCoLease commitments viewed as leverage
Separation of McOpCo from PF McDonald’s may cause alignment issues in the system
McDonald’s management stated that, assuming adequate value creation, none of these issues would prevent a restructuring
IV. Company Response to Pershing

42
Valuation: Judgments Made by Advisors
Advisors were assigned to review the Proposal
In general, Advisors agreed with Pershing on:McOpCo valuation
Relative allocation of EBITDA between McOpCo and PF McDonald’s
However, their judgment was that PF McDonald’s would not enjoy significant multiple expansion
“PF McDonald’s would trade like a restaurant stock”
IV. Company Response to Pershing

V. Developing a Response to the Company

44
Pershing’s Response Regarding Friction Costs and Credit Impact
Friction Costs Credit Impact
Friction costs immaterial in the context of value creation
Friction costs and transaction delays were driven by CMBS financing
Similar transaction could be effected with corporate debt
Stability of PF McDonald’s cash flow stream and robust asset base should allow it to incur additional debt without a material adverse change in rating
YUM’s credit rating is BBB-
V. Developing a Response to the Company

45
Franchisee Alignment:“Skin in the Game”V. Developing a Response to the
Company
Franchisor/Franchisee ConflictTop Line (percent of sales) vs. Bottom Line
Some believe this conflict is mitigated by owning and operating units
However, many of the most successful franchisors operate few, if any, units
Historical McDonald’sSubwayDunkin’ DonutsTim Hortons
McDonald’s current “skin in the game” is overstated due to lack of transfer pricing
We believe McOpCo represents ~10% of McDonald’s total value
PF McDonald’s role as landlord, franchisor, 35% shareholder and board member, leaves them with ample skin in the game

46
Franchisee Alignment:Benefits to Franchisees of an independent McOpCo
V. Developing a Response to the Company
McOpCo IPO would shift some power to the franchise base—A good thing
Franchisees know what’s best operationallyFranchisees have been the source of most product innovations (i.e. Big Mac, Egg McMuffin, Filet-o-Fish, Apple Pie)Driving force behind current process innovations (call centers at drive-thru) IPO would sharpen focus on being best in class franchisor
Level the playing field: McOpCo should compete on the same basis as franchisees
Pay market rent and franchise feesBe focused on bottom-line profitabilityBe run by equity compensated management
Opportunity for Franchisees to expand unit countHeavy demand among operators to acquire/manage additional unitsMcOpCo should refranchise units better managed by franchisees
47
What It Boils Down To:Valuation of PF McDonald’sV. Developing a Response to the
Company
Although there are some differences in opinion regarding friction costs, leverage and potential
alignment issues, the key disparity between Pershing and the Company’s views was
regarding the Valuation of Pro Forma McDonald’s…

48
PF McDonald’s FY2005E EBITDA pre-G&A Contribution
Pro Forma McDonald’s is Not a Restaurant Company
V. Developing a Response to the Company
37%
63%
Real Estate
Brand Royalty

49
Pro Forma TypicalReal Estate
C-CorpChoice Hotels
Typical Mature QSR
2005E Operating Metrics:EBITDA Margins 60% ~70% - 80% 66% 23% 31% ~15% - 20%EBITDA – CapEx Margins 50% ~65% - 75% 61% 18% 27% ~7.5 % - 12.5%EPS Growth 9% NA 16% 11% 9% ~10% - 12%
Trading Multiples
Adjusted Enterprise Value (2) / CY 2006E EBITDA 13.0x ~13x - 16x 15.1x 12.3x 12.6x ~8.5x - 9.5xCY 2006E EBITDA – CapEx 15.5x ~17x - 20x 16.0x 15.5x 14.2x ~12x - 15x
Price /CY 2006E EPS 21.1x NA 24.3x 20.1x 18.8x ~15x - 19x
CY 2006E FCF (3) 20.9x ~20x - 25x 24.0x 20.8x 18.9x ~16x - 20x
Leverage MultiplesNet Debt / EBITDA 3.4x ~5x - 10x 1.7x 0.0x NM ~0.5x - 1.8xTotal Debt / Enterprise Value 24% ~35% - 60% 11% 4% 4% ~7.5% - 20%
Comparable Companies
PF McDonald’s operating metrics are much closer to a typical Real Estate C-Corporation or a high branded intellectual property business such as PepsiCo or Coca-Cola than they are a typical QSR.
High Branded Intangible Property
V. Developing a Response to the Company
Assumes PF McDonald’s
price of ~$47.50
________________________________________________
Stock prices as of 11/11/05. Projections based on Wall Street estimates.(1) Typical mature QSR based on YUM! Brands and Wendy’s.(2) Adjusted for unconsolidated assets.(3) FCF denotes Net Income plus D&A less CapEx.
50
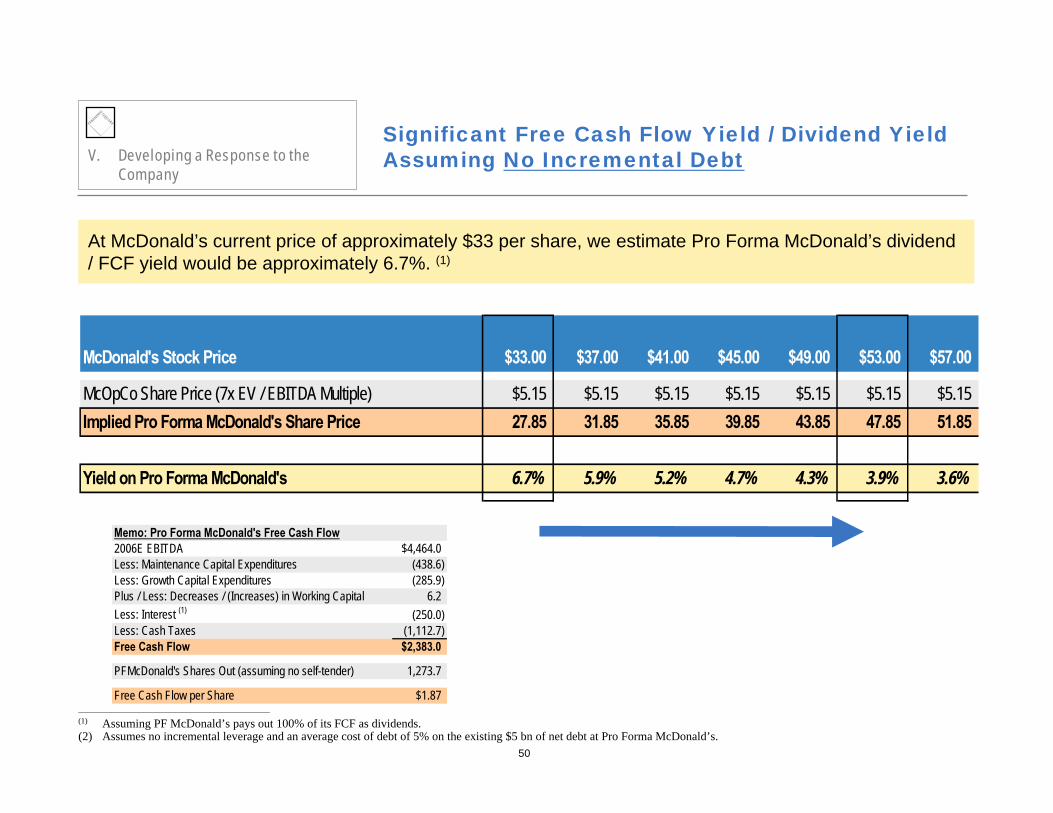
McDonald's Stock Price $33.00 $37.00 $41.00 $45.00 $49.00 $53.00 $57.00
McOpCo Share Price (7x EV / EBITDA Multiple) $5.15 $5.15 $5.15 $5.15 $5.15 $5.15 $5.15Implied Pro Forma McDonald's Share Price 27.85 31.85 35.85 39.85 43.85 47.85 51.85
Yield on Pro Forma McDonald's 6.7% 5.9% 5.2% 4.7% 4.3% 3.9% 3.6%
Significant Free Cash Flow Yield / Dividend YieldAssuming No Incremental Debt
At McDonald’s current price of approximately $33 per share, we estimate Pro Forma McDonald’s dividend / FCF yield would be approximately 6.7%. (1)
V. Developing a Response to the Company
Memo: Pro Forma McDonald's Free Cash Flow2006E EBITDA $4,464.0Less: Maintenance Capital Expenditures (438.6)Less: Growth Capital Expenditures (285.9)Plus / Less: Decreases / (Increases) in Working Capital 6.2Less: Interest (1) (250.0)Less: Cash Taxes (1,112.7)Free Cash Flow $2,383.0
PFMcDonald's Shares Out (assuming no self-tender) 1,273.7
Free Cash Flow per Share $1.87________________________________________________(1) Assuming PF McDonald’s pays out 100% of its FCF as dividends.(2) Assumes no incremental leverage and an average cost of debt of 5% on the existing $5 bn of net debt at Pro Forma McDonald’s.

51
Based on Reported FinancialsBased on Pershing Assumptions
$1.5 $1.6 $1.8 $1.9 $2.1$2.5 $2.6 $2.7 $2.9 $3.2 $3.1 $3.1 $3.2
$3.6$4.0
$0.0
$1.0
$2.0
$3.0
$4.0
1990 1991 1992 1993 1994 1995 1996 1997 1998 1999 2000 2001 2002 2003 2004
Pro Forma McDonald’s:Stable and Growing
Real Estate and Franchise EBITDA($ in billions)
Real Estate & Franchise EBITDA Growth: 4.9% 11.7% 8.5% 10.4% 15.3% 4.0% 4.3% 10.1% 7.4% (0.5%) 0.1% 0.9% 12.6% 13.4%________________________________________________
Notes:Assumes McOpCo G&A to be 25% of consolidated G&A and Real Estate and Franchise G&A to be 75% of consolidated G&A.Assumes McOpCo pays franchise fees of 4% of sales and rent of 9% of sales.
V. Developing a Response to the Company
Pershing believes the best way to think about Pro Forma McDonald’s is as a growing annuity.

52
Which Would You Rather Own: Pro Forma McDonald’s or a Large Retail REIT?V. Developing a Response to the
Company
________________________________________________
Note: Assumes a 7x EV / FY ’06E EBITDA multiple on McOpCo.(1) Retail / REIT dividend yield based on Simon Property Group. Illustrative LT Dividend growth based on Pershing’s estimates.(2) Assumes full payout of free cash flows for PF McDonald’s.(3) Assumes 15% tax rate on PF McDonald’s dividend and a 35% tax rate on the REIT dividend.(4) Scenario 2 Pre-Tax and After-Tax Yields are adjusted for a 35% stake in McOpCo.
McDonald's Stock Price $33.15 $35.15 $40.15 $45.15 $50.15 $55.15 $60.15 TypicalMcOpCo Stock Price 5.15 5.15 5.15 5.15 5.15 5.15 5.15 Large RetailPF McDonald's Stock Price $28.00 $30.00 $35.00 $40.00 $45.00 $50.00 $55.00 REIT (1)
Scenario 1: Pre-Tax Yield (2) 6.7% 5.9% 5.2% 4.7% 4.3% 3.9% 3.6% 4.0%No SharebuybackNo Incremental After-Tax Investor Yield (3) 5.7% 5.0% 4.4% 4.0% 3.6% 3.3% 3.1% 2.6% Leverage
Estimated LT Dividend Growth 3% - 4% 3%- 6%
Scenario 2 PF McDonald's Stock Price $28.00 $30.00 $35.00 $40.00 $45.00 $50.00 $55.00Proposed Pre-Tax Yield (4) 8.5% 7.9% 6.7% 5.8% 5.1% 4.6% 4.1%Sharebuyback
After-Tax Investor Yield (4) 7.2% 6.7% 5.7% 4.9% 4.3% 3.9% 3.5%
Estimated LT Dividend Growth 3% - 4%

53
McDonald's Stock Price $33.15 $35.15 $40.15 $45.15 $50.15 $55.15 $60.15McOpCo Stock Price 5.15 5.15 5.15 5.15 5.15 5.15 5.15 10 YearPF McDonald's Stock Price $28.00 $30.00 $35.00 $40.00 $45.00 $50.00 $55.00 Treasury
Scenario 1: Pre-Tax Yield (1) 6.7% 5.9% 5.2% 4.7% 4.3% 3.9% 3.6% 4.6%No SharebuybackNo Incremental After-Tax Investor Yield (2) 5.7% 5.0% 4.4% 4.0% 3.6% 3.3% 3.1% 3.0% Leverage
Estimated LT Dividend Growth 3% - 4% 3% - 4% 0%
Scenario 2 PF McDonald's Stock Price $28.00 $30.00 $35.00 $40.00 $45.00 $50.00 $55.00Proposed Pre-Tax Yield (3) 8.5% 7.9% 6.7% 5.8% 5.1% 4.6% 4.1%Sharebuyback
After-Tax Investor Yield (3) 7.2% 6.7% 5.7% 4.9% 4.3% 3.9% 3.5%
Estimated LT Dividend Growth 3% - 4% 3% - 4%
Which Would You Rather Own: Pro Forma McDonald’s or 10-Year U.S. Treasury?V. Developing a Response to the
Company
________________________________________________
Note: Assumes a 7x EV / FY ’06E EBITDA multiple on McOpCo.(1) Assumes full payout of free cash flows for PF McDonald’s.(2) Assumes 15% tax rate on PF McDonald’s dividend and a 35% tax rate on the 10-Year Treasury dividend.(3) Scenario 2 Pre-Tax and After-Tax Yields are adjusted for a 35% stake in McOpCo.

54
McDonald's Stock Price $33.15 $35.15 $40.15 $45.15 $50.15 $55.15 $60.15McOpCo Stock Price 5.15 5.15 5.15 5.15 5.15 5.15 5.15 10 YearPF McDonald's Stock Price $28.00 $30.00 $35.00 $40.00 $45.00 $50.00 $55.00 TIPS
Scenario 1: Pre-Tax Yield (1) 6.7% 5.9% 5.2% 4.7% 4.3% 3.9% 3.6% 2.1%No SharebuybackNo Incremental After-Tax Investor Yield (2) 5.7% 5.0% 4.4% 4.0% 3.6% 3.3% 3.1% 3.0% Leverage
Estimated LT Dividend Growth 3% - 4% 2.5%
Scenario 2 PF McDonald's Stock Price $28.00 $30.00 $35.00 $40.00 $45.00 $50.00 $55.00Proposed Pre-Tax Yield (3) 8.5% 7.9% 6.7% 5.8% 5.1% 4.6% 4.1%Sharebuyback
After-Tax Investor Yield (3) 7.2% 6.7% 5.7% 4.9% 4.3% 3.9% 3.5%
Estimated LT Dividend Growth 3% - 4%
Which Would You Rather Own: Pro Forma McDonald’s or a Treasury Inflation Protected Security (TIPS)?
V. Developing a Response to the Company
________________________________________________
Note: Assumes a 7x EV / FY ’06E EBITDA multiple on McOpCo.(1) Assumes full payout of free cash flows for PF McDonald’s.(2) Assumes 15% tax rate on PF McDonald’s dividend and a 35% tax rate on the TIPS dividend.(3) Scenario 2 Pre-Tax and After-Tax Yields are adjusted for a 35% stake in McOpCo.

55
Valuation of McDonald’s as a Growing Annuity
Based on a review of the cost of capital of Real Estate holding corporations and Intangible Property / Franchise businesses like Coca Cola and Choice Hotels, we believe that Pro Forma McDonald’s levered FCF could have a discount rate in the area 7.25% - 7.75%. As such, we believe PF McDonald’s would have a FCF Yield of 4.25% - 5.25%. This implies a midpoint equity valuation range of $48 per share.
V. Developing a Response to the Company
________________________________________________(1) Assumes no dividend paid in FCF calculation.(2) Includes the value of PF McDonald’s 35% equity stake in McOpCo (approx. $2 per share). Assumes a 7x EV / FY ’06E EBITDA McOpCo valuation multiple.
Midpoint of PF McDonald’s
Equity Value per Share(2): $48
Low HighEstimated Discount Rate 7.75% 7.25%Implied Perpetuity Growth Rate 2.50% 3.00%Implied FCF Yield 5.25% 4.25%Implied FCF Multiple 19.0x 23.5x
FY'06E Free Cash Flow per Share (1) $2.17 $2.17(Note: FCF Assumes Proposal Scenario)

56
ConclusionsV. Developing a Response to the
Company
McDonald’s is significantly undervalued todayOver 80% of its cash flows comes from real estate income and franchise income
Proposal creates value for several reasonsIncreases shareholder valueImproves management focusIncreases transparencyImproves capital allocationImproves franchise alignment
There are multiple ways to unlock valuePershing’s Initial ProposalVariations on Pershing’s Initial Proposal
57
Next StepsV. Developing a Response to the
Company
Engage constituents regarding proposal
Shareholders
Franchisees
Broad investment community
Incorporate your feedback
Consider revised proposal

58
V. Developing a Response to the Company
Q & A

Appendix

A. Pershing’s Proposal: Assumptions
61
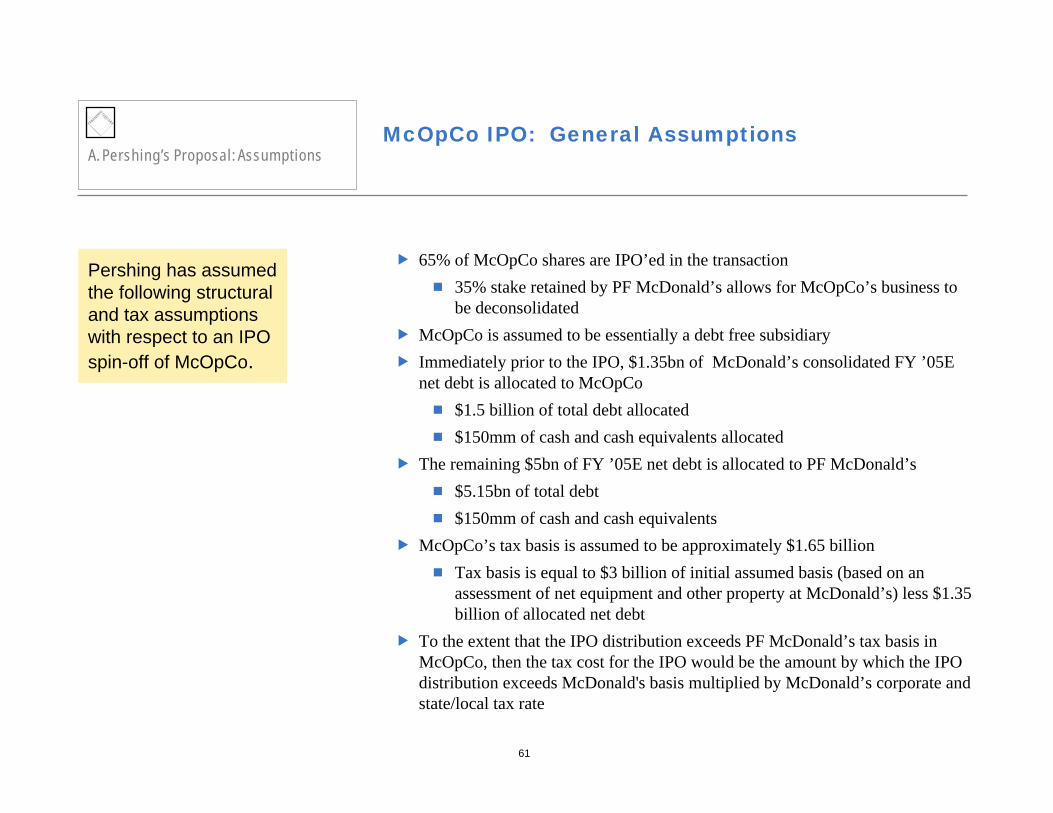
McOpCo IPO: General Assumptions
65% of McOpCo shares are IPO’ed in the transaction35% stake retained by PF McDonald’s allows for McOpCo’s business to be deconsolidated
McOpCo is assumed to be essentially a debt free subsidiaryImmediately prior to the IPO, $1.35bn of McDonald’s consolidated FY ’05E net debt is allocated to McOpCo
$1.5 billion of total debt allocated$150mm of cash and cash equivalents allocated
The remaining $5bn of FY ’05E net debt is allocated to PF McDonald’s$5.15bn of total debt$150mm of cash and cash equivalents
McOpCo’s tax basis is assumed to be approximately $1.65 billion Tax basis is equal to $3 billion of initial assumed basis (based on an assessment of net equipment and other property at McDonald’s) less $1.35 billion of allocated net debt
To the extent that the IPO distribution exceeds PF McDonald’s tax basis in McOpCo, then the tax cost for the IPO would be the amount by which the IPO distribution exceeds McDonald's basis multiplied by McDonald’s corporate and state/local tax rate
Pershing has assumed the following structural and tax assumptions with respect to an IPO spin-off of McOpCo.
A. Pershing’s Proposal: Assumptions

62
McOpCo IPO: Structural And Tax Observations
Step 1: McOpCo dividends a $4.2bn Note to McDonald’s (parent)
Step 2: IPO of McOpCo and Tax Costs
Step 3: Leveraged Self-Tender at Pro Forma McDonald’s
McOpCo
McOpCo
Equity Markets
FranCo
McOpCo declares and pays a dividend to McDonald’s (parent) in the form of a Note in an amount equal to the anticipated proceeds from an initial public offering of McOpCo
For illustrative purposes, we assume the Note is for $4.2bn, or 65% of the equity market value of McOpCo (assumed to be $6.5bn)
McOpCo undertakes the IPO and uses the proceeds to repay the dividend note.
The tax cost for the IPO would be the amount by which the IPO distribution exceeded McDonald's basis in the McOpCo stock multiplied by McDonald’s corporate and state/local tax rate
Assuming a $4.2bn of IPO distribution, the tax cost would be approximately $1bn
Tax cost equals $4.2 billion of distribution less $1.65 billion of basis multiplied by the tax rate of 38%
As such, after tax proceeds of the McOpCo IPO will be approximately $3.2 billion
PF McDonald’s is organized as a real estate business (“PropCo”) and a franchise business (“FranCo”)
PropCo issues secured financing with proceeds used for
Repaying existing debt at PF McDonald’sBuying back shares
PF McDonald’s performs a self tender using proceeds from:
New CMBS financingsAfter tax proceeds of IPO
IPO of McOpCoShares
$4.2bn Note
$4.2 bn cash received
McOpCo repays $4.2 bn Note to McDonald’s
McDonald’s retains
35% stake
PropCo
Pro Forma
Issues CMBS financing, or $9.7bn of incremental debt
PF McDonald’s performs a leveraged self-tender
No debt at FranCo
A. Pershing’s Proposal: Assumptions

63
McOpCo IPO Proceeds
McOpCo IPO After Tax ProceedsLow High Average
Taxes payableMcOpCo Equity Market Value $5,993 $7,122 $6,558
IPO Percentage 65% 65% 65%
Distribution to PF McDonald's $3,895 $4,630 $4,262
Book Basis of McOpCo 3,000 3,000 3,000
Net Debt Allocated to McOpCo (1,350) (1,350) (1,350)
Adjusted Basis in McOpCo 1,650 1,650 1,650
Taxable Gain $2,245 $2,980 $2,612
Tax Rate 38% 38% 38%
Taxes payable $853 $1,132 $993
After Tax Proceeds
Distribution $3,895 $4,630 $4,262
Taxes Payable (853) (1,132) (993)After Tax Distributions $3,042 $3,497 $3,270
Set forth herein is a schedule of the after-tax proceeds from the McOpCoIPO.
A. Pershing’s Proposal: Assumptions
64
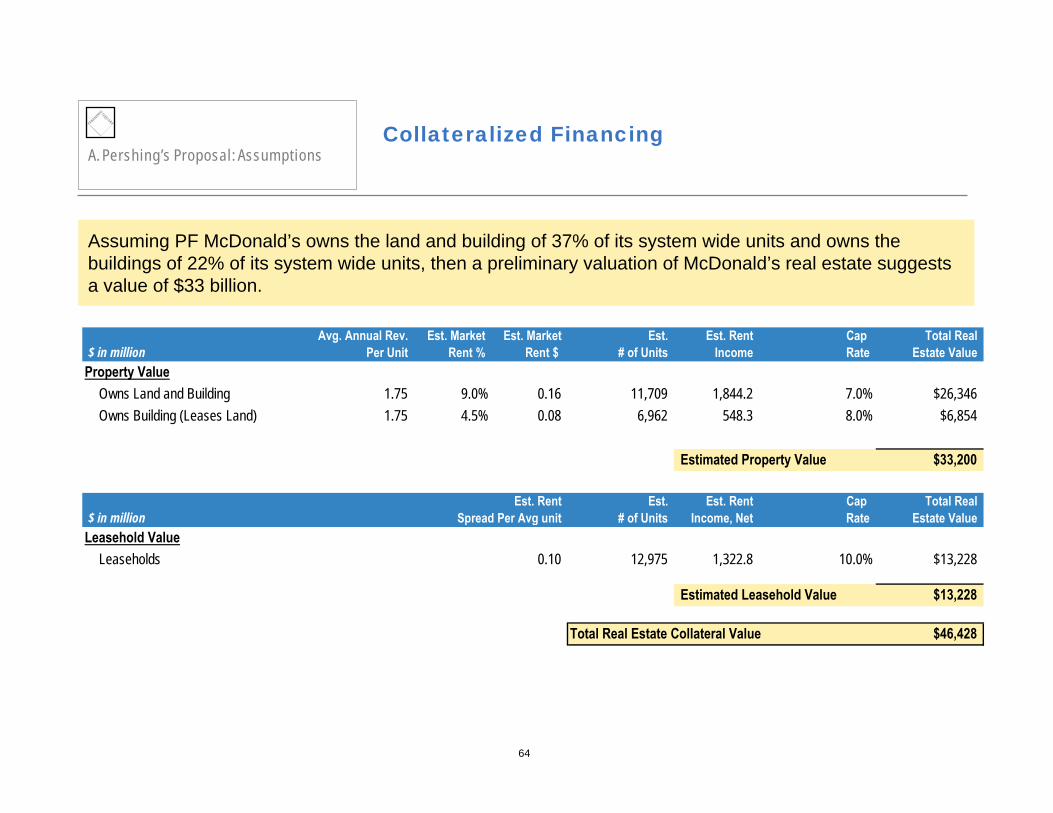
Collateralized Financing
Assuming PF McDonald’s owns the land and building of 37% of its system wide units and owns the buildings of 22% of its system wide units, then a preliminary valuation of McDonald’s real estate suggests a value of $33 billion.
A. Pershing’s Proposal: Assumptions
Avg. Annual Rev. Est. Market Est. Market Est. Est. Rent Cap Total Real$ in million Per Unit Rent % Rent $ # of Units Income Rate Estate Value
Property ValueOwns Land and Building 1.75 9.0% 0.16 11,709 1,844.2 7.0% $26,346Owns Building (Leases Land) 1.75 4.5% 0.08 6,962 548.3 8.0% $6,854
Estimated Property Value $33,200
Est. Rent Est. Est. Rent Cap Total Real$ in million Spread Per Avg unit # of Units Income, Net Rate Estate Value
Leasehold ValueLeaseholds 0.10 12,975 1,322.8 10.0% $13,228
Estimated Leasehold Value $13,228
Total Real Estate Collateral Value $46,428

65
PF McDonald’s: Cost of Capital
We estimated the asset betas of several Real Estate holding C-Corporations and several high branded intellectual property businesses.
A. Pershing’s Proposal: Assumptions
Note: Market information as of 11/10/05. Utilized treasury stock method.Sources: Barra, company reports, Factset, and Wall Street Equity research.
High Branded Intangible Property Business Betas(Dollar values in millions)
Adjusted Marginal Total Debt &Equity Cost of Equity Total Preferred Tax Unlevered Preferred /
Company Beta Equity Value Debt Stock Rate Beta TEVCoca Cola Co. 0.49 7.3% $101,776.1 $4,200.0 - 38.0% 0.48 4.2%Pepsico Inc. 0.46 7.2% 99,498.9 4,607.0 41.0 38.0% 0.45 4.7%Choice Hotels 0.86 9.3% 2,285.7 296.7 - 38.0% 0.79 11.7%
Mean 0.60 7.9% $67,853.6 $3,034.6 $13.7 38.0% 0.57 6.8%Median 0.49 7.3% 99,498.9 4,200.0 - 38.0% 0.48 4.7%
Real Estate Business Betas(Dollar values in millions)
Adjusted Marginal Total Debt &Equity Cost of Equity Total Preferred Tax Unlevered Preferred /
Company Beta Equity Value Debt Stock Rate Beta TEVBritish Land 0.62 8.0% $8,913.9 $11,391.1 - 38.0% 0.34 56.8%Brookfield Properties 0.80 9.0% 6,805.9 6,208.0 1,477.0 38.0% 0.45 60.5%Forest City Enterprises 0.66 8.2% 3,863.9 5,566.0 - 38.0% 0.35 59.3%Land Securities 0.55 7.7% 12,279.2 6,484.2 - 38.0% 0.42 34.6%
Mean 0.66 8.2% $7,965.7 $7,412.3 $369.3 38.0% 0.39 52.8%Median 0.64 8.1% 7,859.9 6,346.1 - 38.0% 0.38 58.0%

66
PF McDonald’s: Cost of Capital (Cont’d)
Based on a blended asset beta calculation we determined a range of values for the WACC of PF McDonald’s.
A. Pershing’s Proposal: Assumptions
Note: Market information as of 11/10/05. Utilized treasury stock method.Sources: Barra, company reports, Factset, and Wall Street Equity research.
Blended Asset Beta Calculation% Contribution from Blended Average
Asset % Contribution from Asset High Branded UnleveredBeta Real Estate Beta Intellectual Property Asset Beta
Average Real Estate Average High Branded Intellectual PropertyUnlevered Asset Beta 0.38 60.0% Unlevered Asset Beta 0.57 40.0% 0.45
Main Target AssumptionsPreTax Cost of Debt 6.0%Risk-Free Rate 4.6%Equity Risk Premium 5.0%Tax Rate 38.0%
WACC CalculationUnlevered Asset Beta 0.46Releverd Beta 0.56Levered Cost of Equity 7.4%Equity Weight 75.0%
AfterTax Cost of Debt 3.7%Target Debt & Pref. / TEV 25.0%Implied Debt / Equity 33.3%
WACC 6.5%
WACC Sensitivity Analysis
Levered Beta0.45 0.50 0.55 0.60 0.65
Equity Risk 4.0% 5.8% 5.9% 6.1% 6.2% 6.4% Premium 5.0% 6.1% 6.3% 6.5% 6.7% 6.8%
6.0% 6.4% 6.7% 6.9% 7.1% 7.3%7.0% 6.8% 7.0% 7.3% 7.6% 7.8%
Levered Beta0.45 0.50 0.55 0.60 0.65
Debt / TEV 15.0% 6.4% 6.6% 6.8% 7.0% 7.3%20.0% 6.2% 6.4% 6.6% 6.8% 7.0%25.0% 6.1% 6.3% 6.5% 6.7% 6.8%30.0% 5.9% 6.1% 6.3% 6.5% 6.6%35.0% 5.8% 5.9% 6.1% 6.3% 6.4%

B. PF McDonald's Financial Analysis

68
Net Unit GrowthApproximates 1.5% - 2.0% of total franchise system unit growth annually or 1.0% - 1.5% of systemwide unit growth
Revenue drivers:Average systemwide same-store sales CAGR of ~2.5% annuallyRental revenue from franchisees of 9.0% of franchise & affiliated system salesRental revenue from McOpCo of 9.0% of McOpCo salesFranchise revenue from franchisees of 4.0% of franchise & affiliated system salesFranchise revenue from McOpCo of 4.0% of McOpCo sales
Cost drivers:Franchise rental expense based on a historical % of rental revenue from franchiseesMcOpCo rental expense based on a historical % of rental revenue from McOpCoD&A calculated assuming a 20-year useful life for existing net depreciable PP&E of approximately $12.5 billion (excluding land), and a 20-year useful life for depreciable PP&E purchased in the future75% of SG&A allocated to Pro Forma McDonald’s
Net CapEx drivers:All CapEx is net of proceeds received from store closures$1.3 million of CapEx for each new unit where Pro Forma McDonald’s owns the land and the building in 2005 and 2006, growing at an inflationary rate of 2.0% thereafter$650K million of CapEx for each new unit where Pro Forma McDonald’s owns the building but not the land in 2005 and 2006, growing at an inflationary rate of 2.0% thereafterRun-rate maintenance CapEx of approximately $320 million, implying approximately $10K per system wide unit, growing at 2%Allocation of 75% of consolidated McDonald’s corporate CapExConsolidated corporate CapEx held constant at 0.7% of sales
OtherIncremental total debt of $9.7 billion, resulting in total debt of approximately $14.8 billion (net debt of $14.65bn)Free cash used to buy back shares and pay dividends$150 mm minimum cash balanceTax rate of 32%Minimal working capital requirements25% Debt to Cap ratio increasing to 30% in 2008Assumes an illustrative 30% dividend payout ratio to match current consolidated McDonald’s
Pro Forma McDonald’s: Model Key Drivers
Set forth herein are the assumptions for the Pro Forma McDonald’s business.
B. PF McDonald's Financial Analysis
69
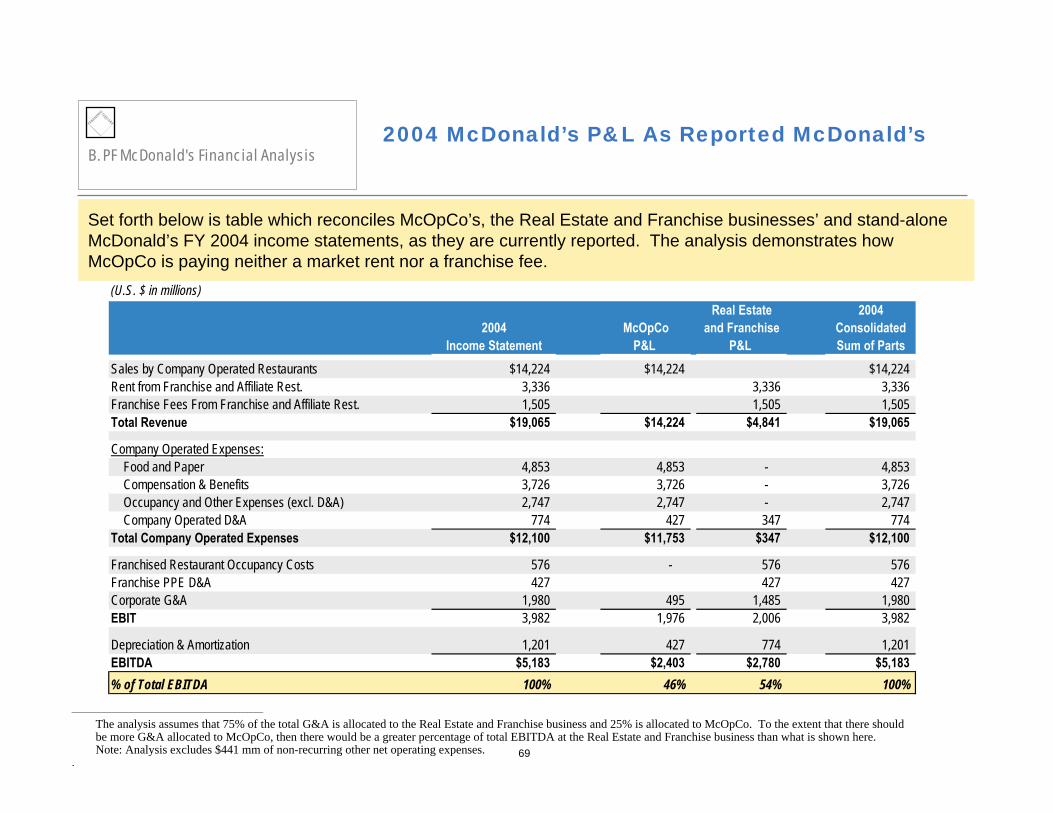
2004 McDonald’s P&L As Reported McDonald’sB. PF McDonald's Financial Analysis
Set forth below is table which reconciles McOpCo’s, the Real Estate and Franchise businesses’ and stand-alone McDonald’s FY 2004 income statements, as they are currently reported. The analysis demonstrates how McOpCo is paying neither a market rent nor a franchise fee.
________________________________________________
The analysis assumes that 75% of the total G&A is allocated to the Real Estate and Franchise business and 25% is allocated to McOpCo. To the extent that there should be more G&A allocated to McOpCo, then there would be a greater percentage of total EBITDA at the Real Estate and Franchise business than what is shown here.Note: Analysis excludes $441 mm of non-recurring other net operating expenses.
.
(U.S. $ in millions)Real Estate 2004
2004 McOpCo and Franchise ConsolidatedIncome Statement P&L P&L Sum of Parts
Sales by Company Operated Restaurants $14,224 $14,224 $14,224Rent from Franchise and Affiliate Rest. 3,336 3,336 3,336 Franchise Fees From Franchise and Affiliate Rest. 1,505 1,505 1,505 Total Revenue $19,065 $14,224 $4,841 $19,065
Company Operated Expenses: Food and Paper 4,853 4,853 - 4,853 Compensation & Benefits 3,726 3,726 - 3,726 Occupancy and Other Expenses (excl. D&A) 2,747 2,747 - 2,747 Company Operated D&A 774 427 347 774 Total Company Operated Expenses $12,100 $11,753 $347 $12,100
Franchised Restaurant Occupancy Costs 576 - 576 576 Franchise PPE D&A 427 427 427 Corporate G&A 1,980 495 1,485 1,980 EBIT 3,982 1,976 2,006 3,982
Depreciation & Amortization 1,201 427 774 1,201 EBITDA $5,183 $2,403 $2,780 $5,183% of Total EBITDA 100% 46% 54% 100%

70
2005E P&L ReconciliationB. PF McDonald's Financial Analysis
Set forth below is a table which reconciles McOpCo’s, Pro Forma McDonald’s and standalone McDonald’s FY 2005E income statements. The analysis demonstrates the flow of rent income, franchise income and rent expense upon separation of the businesses.
________________________________________________(1) Assumes total PF McDonald’s D&A of approximately $712 million, which is composed of $499 million (or 70%) of franchise PP&E and $214 million (or 30%) of D&A associated with
company-operated units.
(U.S. $ in millions)2005 Pro Forma 2005
Projected McOpCo McDonald's Inter-Company ConsolidatedIncome Statement P&L P&L Eliminations Sum of Parts
Sales by Company Operated Restaurants $15,042 $15,042 $15,042Rent from Franchise and Affiliate Rest. 3,578 3,578 3,578 Rent From Company Operated Rest. - 1,354 (1,354) - Franchise Fees From Franchise and Affiliate Rest. 1,590 1,590 1,590 Franchise Fees From Company Operated Rest. - 602 (602) - Total Revenue $20,211 $15,042 $7,124 ($1,956) $20,211
Company Operated Expenses: Food and Paper 5,132 5,132 - - 5,132 Compensation & Benefits 3,926 3,926 - - 3,926 Non-Rent Occupancy and Other Expenses (excl. D&A) 2,400 2,400 - - 2,400 Company Operated D&A 789 576 214 789 Company-Operated Rent Expense 616 616 616 (616) 616 Additional Rent Payable to PropCo - 737 - (737) - Franchise Fee Payable to FranCo - 602 - (602) - Total Company Operated Expenses $12,863 $13,989 $830 ($1,956) $12,863
Franchised Restaurant Occupancy Costs 600 - 600 - 600 Franchise PPE D&A 499 499 499 Corporate G&A 2,174 544 1,631 2,174 EBIT 4,075 510 3,564 - 4,075
Depreciation & Amortization 1,288 576 712 - 1,288 EBITDA $5,362 $1,086 $4,277 $0 $5,362% of Total EBITDA 100% 20% 80% 100%Maintenance Capex 1,250 501 749 1,250EBITDA - Maintenance Capex 4,113 585 3,528 4,113% of Total EBITDA - Maintenance Capex 100% 14% 86% 100%

71
2006E P&L ReconciliationB. PF McDonald's Financial Analysis
Set forth below is a table which reconciles McOpCo’s, Pro Forma McDonald’s and standalone McDonald’s FY 2006E income statements. The analysis demonstrates the flow of rent income, franchise income and rent expense upon separation of the businesses.
________________________________________________(1) Assumes total PF McDonald’s D&A of approximately $737 million, which is composed of $516 million (or 70%) of franchise PP&E and $221 million (or 30%) of D&A associated with
company-operated units.
(U.S. $ in millions)2006 Pro Forma 2006
Projected McOpCo McDonald's Inter-Company Consolidated(U.S. $ in millions) Income Statement P&L P&L Eliminations Sum of PartsSales by Company Operated Restaurants $15,429 $15,429 $15,429Rent from Franchise and Affiliate Rest. 3,730 - 3,730 - 3,730 Rent From Company Operated Rest. - - 1,389 (1,389) - Franchise Fees From Franchise and Affiliate Rest. 1,658 - 1,658 - 1,658 Franchise Fees From Company Operated Rest. - - 617 (617) - Total Revenue $20,816 $15,429 $7,393 ($2,006) $20,816
Company Operated Expenses: Food and Paper 5,264 5,264 - - 5,264 Compensation & Benefits 4,012 4,012 - - 4,012 Non-Rent Occupancy and Other Expenses (excl. D&A) 2,458 2,458 - - 2,458 Company Operated D&A 808 587 221 - 808 Company-Operated Rent Expense 632 632 632 (632) 632 Additional Rent Payable to PropCo - 756 - (756) - Franchise Fee Payable to FranCo - 617 - (617) - Total Company Operated Expenses $13,174 $14,327 $853 ($2,006) $13,174
Franchised Restaurant Occupancy Costs 617 - 617 - 617 Franchise PPE D&A 516 - 516 - 516 Corporate G&A 2,240 560 1,680 - 2,240 EBIT 4,269 542 3,727 - 4,269
Depreciation & Amortization 1,324 587 737 - 1,324 EBITDA from Operations $5,594 $1,130 $4,464 $0 $5,594% of Total EBITDA 100% 20% 80% 100%Maintenance Capex 943 504 439 943EBITDA - Maintenance Capex 4,651 626 4,025 4,651% of Total EBITDA - Maintenance Capex 100% 13% 87% 100%

72
2006E Net Capital Expenditures ReconciliationB. PF McDonald's Financial Analysis
Set forth herein is a table which demonstrates net capital expenditures by category for McOpCo, PF McDonald’s and the standalone (consolidated) McDonald’s.
Note: Our Free Cash Flows are derived using Net Capital Expenditures, net of proceeds received from closures. We note that the Company typically generates $300 - $400mm of proceeds annually from closings.
2006E Net Capital Expenditures
(U.S. $ in millions)Consolidated Pro FormaMcDonald's McOpCo McDonald's
New Restaurants, Net $316 $30 $286
Existing Restaurants 787 465 322
Corporate/Other 156 39 117
Net Capital Expenditures $1,259 $534 $724

73
PF McDonald’s: Summary Income StatementB. PF McDonald's Financial Analysis
Below are the summary projections for Pro Forma McDonald’s based on the assumptions detailed on page 68.
($ in millions, except per share data)2006 - 2011
2002A 2003A 2004A 2005E 2006E 2007E 2008E 2009E 2010E 2011E CAGRIncome Statement DataRevenue $5,401.0 $6,008.5 $6,690.0 $7,124.1 $7,393.1 $7,676.7 $7,969.9 $8,276.2 $8,596.2 $8,930.9 3.9%
% Growth 11.2% 11.3% 6.5% 3.8% 3.8% 3.8% 3.8% 3.9% 3.9%
EBITDA $3,168.7 $3,568.2 $4,046.0 $4,276.7 $4,464.0 $4,653.4 $4,849.3 $5,054.9 $5,270.8 $5,497.5 4.3%% Margin 58.7% 59.4% 60.5% 60.0% 60.4% 60.6% 60.8% 61.1% 61.3% 61.6%
EBITDA - CapEx 4,046.0 3,312.7 3,739.5 3,909.2 4,085.0 4,258.5 4,440.1 4,630.1 4.4%% Margin 60.5% 46.5% 50.6% 50.9% 51.3% 51.5% 51.7% 51.8%
D&A 774.0 712.3 736.9 768.5 794.5 821.5 849.6 878.8
EBIT $2,492.7 $2,827.4 $3,272.0 $3,564.4 $3,727.0 $3,884.9 $4,054.8 $4,233.4 $4,421.2 $4,618.6 4.4%% Margin 46.2% 47.1% 48.9% 50.0% 50.4% 50.6% 50.9% 51.2% 51.4% 51.7%
Net Interest Expense (736.6) (801.5) (889.7) (932.5) (971.8) (1,012.7)
Equity Income from OpCo 35.0% 107.9 121.9 137.5 151.7 162.4 171.9
Net Income $2,141.4 $2,218.6 $2,289.8 $2,396.3 $2,507.9 $2,623.9 4.1%
EPS $2.27 $2.47 $2.72 $2.97 $3.24 $3.54 9.3%Average Shares Outstanding 945.4 897.8 842.8 806.4 773.3 741.8

74
PF McDonald’s: Summary Cash Flow and Balance SheetB. PF McDonald's Financial Analysis
Below are the summary cash flow projections for Pro Forma McDonald’s based on the assumptions detailed on page 68.
($ in millions, except per share data)2006 - 2011
2002A 2003A 2004A 2005E 2006E 2007E 2008E 2009E 2010E 2011E CAGRCash Flow DataEBITDA $4,464.0 $4,653.4 $4,849.3 $5,054.9 $5,270.8 $5,497.5
less: Cash Taxes (956.9) (986.7) (1,012.8) (1,056.3) (1,103.8) (1,153.9)less: Cash Interest Expense (736.6) (801.5) (889.7) (932.5) (971.8) (1,012.7)less: Dividends (653.2) (676.8) (698.5) (731.0) (765.0) (800.4)less: Change in Working Capital 6.2 6.5 6.7 7.0 7.2 7.5less: Growth CapEx (285.9) (291.6) (297.4) (314.7) (333.5) (354.0)less: Maintenance CapEx (438.6) (452.6) (466.9) (481.7) (497.2) (513.4)plus: After-tax Dividends from McOpCo 0.0 0.0 0.0 0.0 0.0 0.0
Free Cash Flow (post dividends) $1,398.9 $1,450.8 $1,490.7 $1,545.7 $1,606.7 $1,670.6Free Cash Flow (pre dividends) 2,052.1 2,127.6 2,189.2 2,276.7 2,371.7 2,471.0FCF per Share (pre dividends) $2.17 $2.37 $2.60 $2.82 $3.07 $3.33 8.9%Illustrative Stock Price at 20x LTM FCF $43.41 $47.40 $51.95 $56.47 $61.34 $66.63
20Balance Sheet DataCash 150.0 150.0 150.0 150.0 150.0 150.0 150.0Revolver 0.0 0.0 0.0 0.0 0.0 0.0 0.0Long-Term Debt $14,800.0 14,800.0 17,393.4 18,331.6 19,104.0 19,904.5 20,740.4Total Debt / Capitalization 24.5% 26.8% 30.0% 30.0% 30.0% 30.0% 30.0%
Total Debt / EBITDA 3.5x 3.3x 3.7x 3.8x 3.8x 3.8x 3.8xNet Debt / EBITDA 3.4x 3.3x 3.7x 3.7x 3.7x 3.7x 3.7x
C. McOpCo Financial Analysis
76
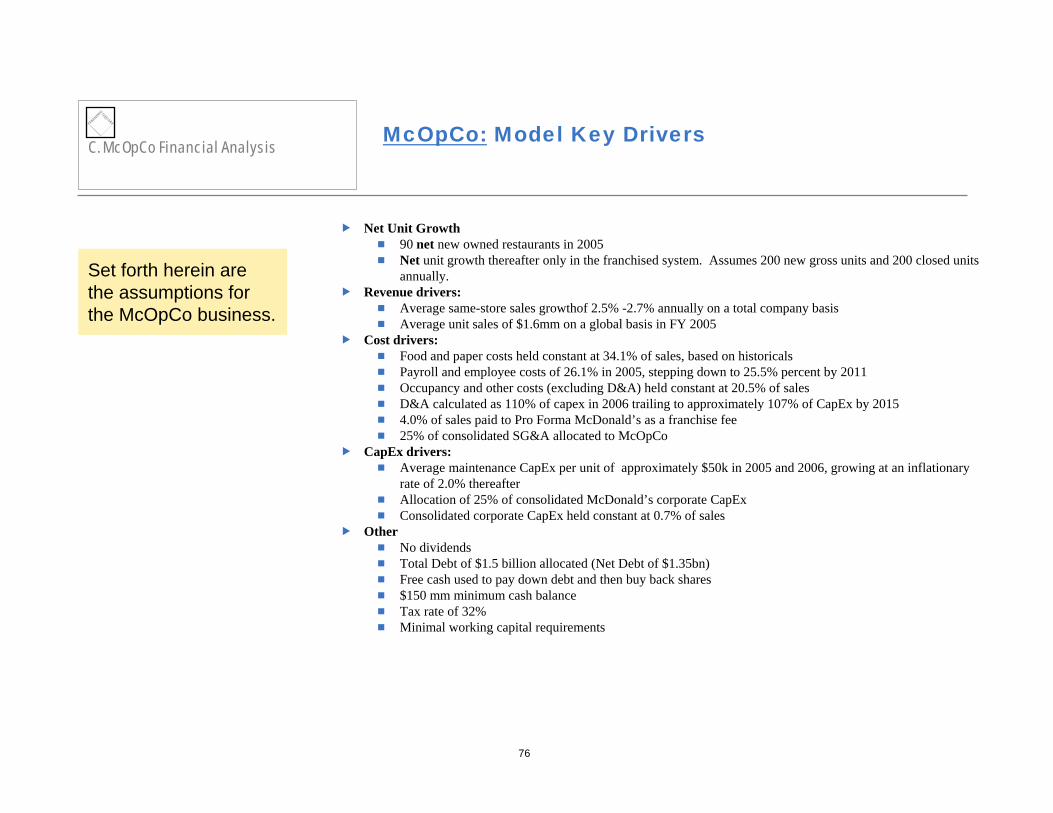
Net Unit Growth90 net new owned restaurants in 2005Net unit growth thereafter only in the franchised system. Assumes 200 new gross units and 200 closed units annually.
Revenue drivers:Average same-store sales growthof 2.5% -2.7% annually on a total company basisAverage unit sales of $1.6mm on a global basis in FY 2005
Cost drivers:Food and paper costs held constant at 34.1% of sales, based on historicalsPayroll and employee costs of 26.1% in 2005, stepping down to 25.5% percent by 2011Occupancy and other costs (excluding D&A) held constant at 20.5% of salesD&A calculated as 110% of capex in 2006 trailing to approximately 107% of CapEx by 20154.0% of sales paid to Pro Forma McDonald’s as a franchise fee25% of consolidated SG&A allocated to McOpCo
CapEx drivers:Average maintenance CapEx per unit of approximately $50k in 2005 and 2006, growing at an inflationary rate of 2.0% thereafterAllocation of 25% of consolidated McDonald’s corporate CapExConsolidated corporate CapEx held constant at 0.7% of sales
OtherNo dividendsTotal Debt of $1.5 billion allocated (Net Debt of $1.35bn)Free cash used to pay down debt and then buy back shares$150 mm minimum cash balanceTax rate of 32%Minimal working capital requirements
McOpCo: Model Key Drivers
Set forth herein are the assumptions for the McOpCo business.
C. McOpCo Financial Analysis

77
C. McOpCo Financial AnalysisMcOpCo Summary Income Statement
Set forth below are the summary projections for McOpCo based on the assumptions detailed on page 76.
(U.S. $ in millions)2006 - 2011
2004A 2005E 2006E 2007E 2008E 2009E 2010E 2011E CAGRIncome Statement DataRevenue $14,223.8 $15,042.4 $15,428.9 $15,838.3 $16,259.2 $16,692.0 $17,136.9 $17,594.4 2.7%
% Growth 11.2% 5.8% 2.6% 2.7% 2.7% 2.7% 2.7% 2.7%
EBITDA $1,136.7 $1,085.7 $1,129.6 $1,173.3 $1,218.5 $1,265.4 $1,313.9 $1,364.2 3.8%% Margin 8.0% 7.2% 7.3% 7.4% 7.5% 7.6% 7.7% 7.8%
EBITDA - CapEx 1,136.7 562.5 595.6 628.1 662.0 697.3 734.0 772.2 5.3%% Margin 8.0% 3.7% 3.9% 4.0% 4.1% 4.2% 4.3% 4.4%
D&A 427.0 575.5 587.4 599.6 609.3 622.0 635.0 645.2
EBIT $709.7 $510.2 $542.2 $573.6 $609.2 $643.3 $678.9 $718.9 5.8%% Margin 5.0% 3.4% 3.5% 3.6% 3.7% 3.9% 4.0% 4.1%
Net Interest Expense (90.9) (68.5) (43.9) (17.0) 0.2 3.4
Net Income $306.9 $343.5 $384.4 $425.9 $461.8 $491.2 9.9%
EPS $0.24 $0.27 $0.30 $0.33 $0.37 $0.41 11.3%Average Shares Outstanding 1,273.7 1,273.7 1,273.7 1,273.7 1,248.1 1,191.9

78
McOpCo Summary Cash Flow and Balance SheetC. McOpCo Financial Analysis
Set forth below are the summary cash flow projections for McOpCo based on the assumptions detailed on page 76.
2006 - 20112004A 2005E 2006E 2007E 2008E 2009E 2010E 2011E CAGR
Cash Flow DataEBITDA $1,129.6 $1,173.3 $1,218.5 $1,265.4 $1,313.9 $1,364.2
less: Cash Taxes (145.1) (163.9) (184.9) (203.9) (218.3) (231.1)less: Cash Interest Expense (88.7) (61.5) (31.4) (6.1) 3.4 3.4less: Dividends 0.0 0.0 0.0 0.0 0.0 0.0less: Change in Working Capital 6.2 6.5 6.7 7.0 7.2 7.5less: Growth CapEx (30.0) (30.6) (31.2) (31.8) (32.5) (33.1)less: Maintenance CapEx (504.0) (514.5) (525.3) (536.2) (547.4) (558.8)
Free Cash Flow (after dividends) $367.9 $409.3 $452.5 $494.3 $526.3 $552.0 8.5%Free Cash Flow per share (before dividends) $0.29 $0.32 $0.36 $0.39 $0.44 $0.49 11.1%
Balance Sheet DataCash 150.0 150.0 150.0 150.0 150.0 150.0 150.0Revolver 0.0 0.0 0.0 0.0 0.0 0.0 0.0Long-Term Debt 1,500.0 1,132.1 722.8 270.3 0.0 0.0 0.0
Total Debt / EBITDA 1.4x 1.0x 0.6x 0.2x 0.0x 0.0x 0.0xNet Debt / EBITDA 1.2x 0.9x 0.5x 0.1x -0.1x -0.1x -0.1x
Final Revised Proposal.ppt
Confidential
A Plan to Win / WinJanuary 18, 2006
Pershing SquareCapital Management
Final Revised Proposal.ppt
2
DISCLAIMER
Pershing Square Capital Management's ("Pershing") analysis and conclusions regarding McDonald's Corporation ("McDonald's” or the “Company”) are based on publicly available information. Pershing recognizes that there may be confidential information in the possession of the Company and its advisors that could lead them to disagree with Pershing’s conclusions or the approach Pershing is advocating.
The analyses provided include certain estimates and projections prepared with respect to, among other things, the historical and anticipated operating performance of the Company. Such statements, estimates, and projections reflect various assumptions by Pershing concerning anticipated results that are inherently subject to significant economic, competitive, and other uncertainties and contingencies and have been included solely for illustrative purposes. No representations, express or implied, are made as to the accuracy or completeness of such statements, estimates or projections or with respect to any other materials herein. Actual results may vary materially from the estimates and projected results contained herein.
Pershing manages funds that are in the business of trading - buying and selling - public securities. It is possible that there will be developments in the future that cause Pershing to change its position regarding the Company and possibly reduce, dispose of, or change the form of its investment in the Company. Pershing recognizes that the Company has a stock market capitalization in excess of $40bn, and that, accordingly, it could be more difficult to exert influence over its Board than has been the case with smaller companies.

Final Revised Proposal.ppt
3
AgendaA Revised Proposal for Creating Value at McDonald’s
Background of our involvement
What are our objectives?
Brief review of our Initial Proposal
Our Revised Proposal
Benefits of our Revised Proposal
Company
Franchisees
Shareholders
Q & A

Final Revised Proposal.ppt
4
Pershing’s Involvement with McDonald’s
September 22, 2005: Pershing Square Capital Management (“Pershing”) presented a proposal for increasing shareholder value (“Initial Proposal”) to McDonald’s management
October 31, 2005: McDonald’s management communicated its response to our Initial Proposal
Management believed that our Initial Proposal (1) would result in potential “frictional costs”; (2) could have an unfavorable credit impact; and (3) could create system issues
McDonald’s believed, based on its advisors’ valuation, that there was not enough value creation to outweigh frictional costs and other concerns
November 15, 2005: Pershing presented the Initial Proposal to the investment community
Since November 15, we have had numerous discussions with shareholders and franchisees from around the world
Today we would like to share our Revised Proposal for Creating Significant Value at McDonald’s which incorporates feedback from McDonald’s management, franchisees and other shareholders
A Revised Proposal for Creating Value at McDonald’s

Final Revised Proposal.ppt
5
What Are Our Objectives?A Revised Proposal for Creating Value at McDonald’s
In developing our Revised Proposal, our objectives are to:
Improve McOpCo’s operating performance
Strengthen the McDonald’s System
Unlock significant shareholder value
We believe our Revised Proposal will:
Achieve these objectives
Address all of the Company’s concerns regarding ourfirst proposal
Increase McDonald’s share price to $46-$50 per share (before considering any operational benefits)
Minimize execution risk and management distraction

Final Revised Proposal.ppt
Confidential
Objective 1:Improve McOpCo’s Operating Performance

Final Revised Proposal.ppt
7
Objective 1: Improve McOpCo’s Operating Performance
McOpCo, as a wholly owned subsidiary, is not achieving its full business and financial potential
McOpCo does not pay a market rent or a franchise fee, unlike a typical franchisee
Adjusting for a market rent and a franchise fee, McOpCo has lower average unit margins than those of an average U.S. franchisee
“Corporate subsidies” in the form of uncharged rent and uncharged franchisee fees have led to McOpCo being run inefficiently over time
Uneconomical capital allocation decisions
Suboptimal pricing policy
A Revised Proposal for Creating Value at McDonald’s

Final Revised Proposal.ppt
8
Objective 1: Improve McOpCo’s Operating Performance (cont’d)
Estimated 4-Wall EBITDA Margins
12.7%
8.8%
14.8%
0%
4%
8%
12%
16%
Avg. U.S. McOpCo Avg. Intl. McOpCo Avg. U.S. Franchise
Estim
ated
4-W
all E
BITD
A Ma
rgin
%
Adjusted for a Market Rent and Franchise Fee
(1)
(1)
(2)
McOpCo’s Estimated Average Unit EBITDA marginsversus
U.S. Franchisees’ Estimated Average Unit EBITDA margins(1)
________________________________________________
Note: See page 57 of the Appendix for Pershing’s detailed assumptions.1) Analysis is based on Pershing’s estimates using 2004 financial data. McDonald’s does not provide average unit data for McOpCo or McDonald’s franchisees in its
public financials. Assumes a market rent of 9% of sales and a franchise fee of 4% of sales. 2) Based on $260k of average EBITDA per franchised store and average revenues per franchised store of approximately $1,760k.
A Revised Proposal for Creating Value at McDonald’s

Final Revised Proposal.ppt
9
Objective 1: Improve McOpCo’s Operating Performance (cont’d)
McOpCo managers do not have appropriate compensation incentives
No direct equity compensation in McOpCo’s business
No market-based performance measurement system
“Farm Team” mentality whereby the best McOpCo managers are promoted to corporate McDonald’s
If they don’t join corporate McDonald’s, they sometimes leave to become a franchisee
Top restaurant operators need more incentive to stay at McOpCo
A Revised Proposal for Creating Value at McDonald’s

Final Revised Proposal.ppt
10
Objective 1: Improve McOpCo’s Operating Performance (cont’d)
“Earn the Right to Own”McOpCo’s restaurant portfolio needs to be optimized in order to improve margins and capital allocation
A Revised Proposal for Creating Value at McDonald’s
Refranchise select units in mature
markets
Redeploy capital and resources in
emerging markets
McOpCo increases focus
on emerging markets growth
Because of their developed franchise systems, mature markets do not need the same capital or resources as emerging marketse.g., U.S., Canada and U.K.
Capital and freed-up resources from refranchising should be redeployed in fast growing / high return emerging QSR markets
Regions where franchise laws are still in infancy and McDonald’s franchise base is not yet sufficient to drive growthe.g., China and Russia
McOpCo should increase its focus on profitable emerging markets growth
McOpCo

Final Revised Proposal.ppt
Confidential
Objective 2:Strengthen the McDonald’s System
Final Revised Proposal.ppt
12
Objective 2: Strengthen the McDonald’s System
(1) Inherent conflict between McDonald’s and the Franchisees: McDonald’s “Top-line” focus versus Franchisees’ “Bottom-line” focus
McDonald’s makes the bulk of its profits from the franchisees’ top line
However, top line same-store sales growth does not always translate into improving franchisees’bottom line
Stock market often rewards McDonald’s for higher same store sales growth even though the franchisees are sometimes pressured to sacrifice margin for discount pricing
(2) McOpCo, with its subsidized economics, magnifies this conflict
McOpCo does not compete on equal footing because it does not pay a market rent or franchisee fee
Suboptimal pricing or capital allocation decisions do not impact McOpCo’s financials as dramatically as those of franchisees
Perception among franchisees is that McOpCo is not held to the same degree of accountability
A Revised Proposal for Creating Value at McDonald’s
Pershing spoke with franchisees from around the world. Here’s what they told us:
Final Revised Proposal.ppt
13
(3) Capital allocation criteria / decision-making process varies between McOpCo and the franchisee community
Low ROIC investments are occasionally forced upon franchisees
McOpCo regional managers often make capital investment decisions they will not have to live with, given their status as salaried employees with limited tenure in any one position
“Made for You” program is an example of a historical capital investment decision that may have been amended or prevented by an arm's-length McOpCo
Hundreds of millions of dollars of capital invested in a kitchen system that is widely considered inefficient
For many franchisees, it has led to decreased profitability, increased wait times and increased staffing requirements
Testing at McOpCo did not reveal the true economic impact of the program
“Made for You” problems could have been prevented if the system had the appropriate “checks and balances”
Strengthening the McDonald’s System: What Franchisees Had to SayA Revised Proposal for Creating Value
at McDonald’s
Final Revised Proposal.ppt
14
(4) McOpCo undercuts on pricing
McOpCo’s subsidized economics reduce the impact of lower margin product pricing decisions
As such, approximately 27% (1) of the McDonald’s system currently does not price optimally
Reduces the profitability of the entire system
Underpricing at McOpCo pressures franchisees to sacrifice “penny profits” for traffic and sales volume
(5) McDonald’s should retain control of McOpCo
Franchisees generally agreed that control of McOpCo should remain with McDonald’sKeeps the franchisee vote democratic and dispersed
A Revised Proposal for Creating Value at McDonald’s
________________________________________________
(1): Based on approximately 8,119 McOpCo restaurants out of 30,516 systemwide McDonald’s restaurants, as of 2004.
Strengthening the McDonald’s System: What Franchisees Had to Say (cont’d)
Final Revised Proposal.ppt
15
Strengthening the McDonald’s System: What Franchisees Had to Say (cont’d)
(6) Strong interest in owning new units / McOpCo refranchising program
Franchisees have a strong interest in buying McOpCo restaurants
Given McDonald’s exclusivity requirements for franchisees, the only opportunity for franchisees to materially increase their wealth is to own more McDonald’s units
A refranchising program would create an attractive incentive system
Would allow the top quartile performing operators to be rewarded with an opportunity to increase units
McOpCo’s current portfolio of restaurants needs to be rationalized through refranchising,in order to
Increase McOpCo’s profitability
Improve systemwide same-store sales growth
Satisfy considerable franchisee demand
A Revised Proposal for Creating Value at McDonald’s

Final Revised Proposal.ppt
Confidential
Objective 3:Unlock Shareholder Value

Final Revised Proposal.ppt
17
Objective 3: Unlock Shareholder Value at McDonald’s
McDonald’s controls substantially all of its systemwide real estate
Earns 9% of systemwideunit sales as rent
For real estate it does not own, it pays a rent expense and generates income through subleases
Approximately 32,000 restaurants whereMcDonald’s receives 4% of unit sales
Franchise
Restaurant Operations
Real Estate
Brand McDonald’s McOpCo
Over 8,000 McDonald’s company operated restaurants
A Revised Proposal for Creating Value at McDonald’s
Collects a royalty of 13% of systemwide sales

Final Revised Proposal.ppt
18
Objective 3: Unlock Shareholder Value at McDonald’s (cont’d)
FranchiseReal Estate
Brand McDonald’s
A Revised Proposal for Creating Value at McDonald’s
Collects a royalty of 13% of systemwide sales
World-leading brand~ 60% EBITDA Margins (1)
Low maintenance capital requirements~ 55% EBITDA – maintenance capex margins (1)
Low operating leverage / high earnings stabilityHigh ROICLow cost of capital Valuable fixed asset base50 year track recordGlobal and diverse customer base
There are very few businesses in the world with all the
attractive business characteristics of Brand McDonald’s
________________________________________________
(1) Based on Pershing’s estimates. Assumes McOpCo pays a market rent and franchise fee.
.

Final Revised Proposal.ppt
19
Objective 3: Unlock Shareholder Value at McDonald’s (cont’d)
Financial statements are not transparent
McOpCo does not pay an “arm's-length” rent or franchise fee to Brand McDonald’s
As such, reported financials do not make apparent that approximately 80% of McDonald’s EBITDA is derived from the higher multiple Brand McDonald’s
Issuing transparent segment financials for McOpCo and Brand McDonald’s would demonstrate
True profitability of Brand McDonald’s
True operating margins and capital requirements at McOpCo
A Revised Proposal for Creating Value at McDonald’s
The first step to unlocking shareholder value is to introduce transparent segment financials.

Final Revised Proposal.ppt
20
Objective 3: Unlock Shareholder Value at McDonald’s (cont’d)
2004 Total EBITDA Adjusted for Market Rent and Franchise Fees
55%
2004 Total EBITDA As Reported
In 2004, McDonald’s company-operated restaurants appeared to contribute 46% of total EBITDA. However, once adjusted for a franchise fee and a market rent fee, McOpCo constituted only 22% of total EBITDA, with Brand McDonald’s contributing 78% of total EBITDA.
________________________________________________
Note: The analysis assumes that 75% of the total G&A is allocated to Brand McDonald’s business and 25% is allocated to McOpCo. McDonald’s management has indicated this is a conservative assumption regarding Brand McDonald’s. Analysis excludes $441 mm of non-recurring other net operating expenses.
.
A Revised Proposal for Creating Value at McDonald’s
46%
54%
McOpCo
Brand McDonald's
2004 EBITDA %McOpCo $2.4bn 46%Brand McDonald's 2.8bn 54%Total $5.2bn 100%
78%
22% McOpCo
Brand McDonald's
2004 EBITDA %McOpCo $1.1bn 22%Brand McDonald's 4.1bn 78%Total $5.2bn 100%

Final Revised Proposal.ppt
21
Objective 3: Unlock Shareholder Value at McDonald’s (cont’d)
McDonald’s is fundamentally Not a restaurant company
Why is it valued as such?_________________________________________(1) FY’05E EBITDA- Maintenance CapEx contribution is based on Pershing’s estimates. CapEx is net of proceeds from restaurant closings. We note that the Company does not provide
EBITDA and Maintenance CapEx allocation by segment.
McDonald’s FY 2005E EBITDA – Maintenance CapEx, Adjusted for a
Market Rent and Franchise Fee(1)
A Revised Proposal for Creating Value at McDonald’s
86%
14%McOpCo
Brand McDonald's
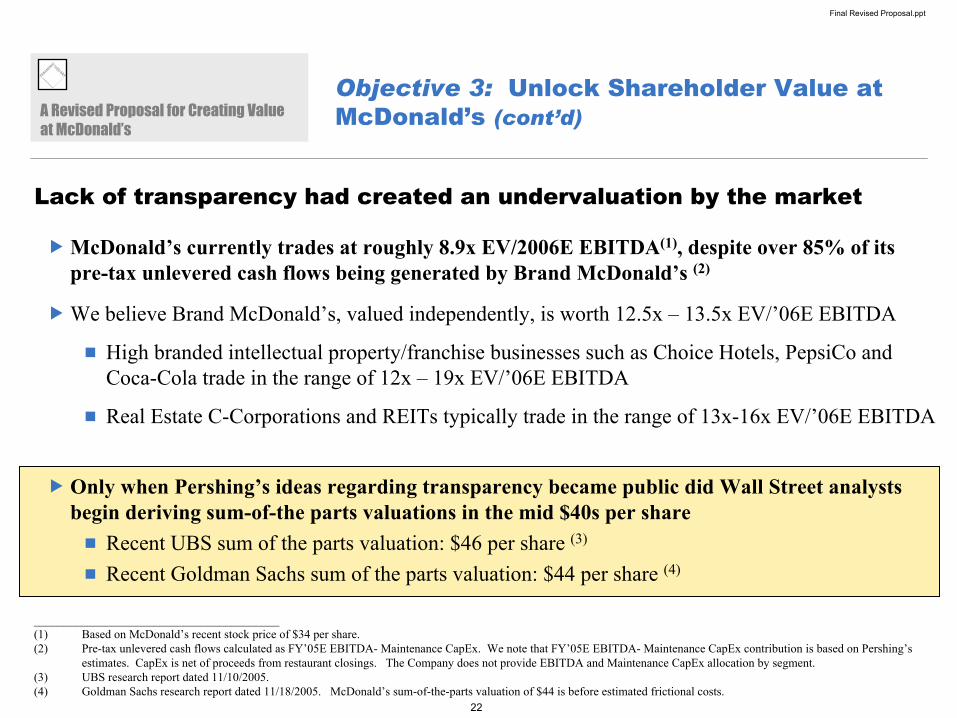
Final Revised Proposal.ppt
22
Objective 3: Unlock Shareholder Value at McDonald’s (cont’d)A Revised Proposal for Creating Value
at McDonald’s
_________________________________________(1) Based on McDonald’s recent stock price of $34 per share.(2) Pre-tax unlevered cash flows calculated as FY’05E EBITDA- Maintenance CapEx. We note that FY’05E EBITDA- Maintenance CapEx contribution is based on Pershing’s
estimates. CapEx is net of proceeds from restaurant closings. The Company does not provide EBITDA and Maintenance CapEx allocation by segment.(3) UBS research report dated 11/10/2005. (4) Goldman Sachs research report dated 11/18/2005. McDonald’s sum-of-the-parts valuation of $44 is before estimated frictional costs.
Lack of transparency had created an undervaluation by the market
McDonald’s currently trades at roughly 8.9x EV/2006E EBITDA(1), despite over 85% of itspre-tax unlevered cash flows being generated by Brand McDonald’s (2)
We believe Brand McDonald’s, valued independently, is worth 12.5x – 13.5x EV/’06E EBITDA
High branded intellectual property/franchise businesses such as Choice Hotels, PepsiCo and Coca-Cola trade in the range of 12x – 19x EV/’06E EBITDA
Real Estate C-Corporations and REITs typically trade in the range of 13x-16x EV/’06E EBITDA
Only when Pershing’s ideas regarding transparency became public did Wall Street analysts begin deriving sum-of-the parts valuations in the mid $40s per share
Recent UBS sum of the parts valuation: $46 per share (3)
Recent Goldman Sachs sum of the parts valuation: $44 per share (4)

Final Revised Proposal.ppt
Confidential
Review of our Initial Proposal

Final Revised Proposal.ppt
24
Review of Our Initial Proposal
McOpCo to be organized as an independent entitySigns “arm's-length” rent and franchise agreements with McDonald’s
IPO of 65% of McOpCoMcOpCo is deconsolidated and transparent financials are released to investors
Issue $14.7bn of financing secured against real estateImplies approximately $9.7bn of incremental debt
Use Debt financing and IPO proceeds toRefinance all of the existing net debt (approximately $5bn ) at Brand McDonald’s (1)
Repurchase shares and pay transaction fees and expenses
Our Initial Proposal is available on the internet at http://www.valueinvestingcongress.com/Final-Pres.pdf
A Revised Proposal for Creating Value at McDonald’s
________________________________________________(1) Assumes $6.35bn of net debt on
12/31/05 at consolidated McDonald’s of which $1.35 bn of net debt is allocated to McOpCo and $5.0 bn of net debt allocated to Brand McDonald’s.
Step 1:
Step 2:
Step 3:
Step 4:
Our Initial Proposal called for…

Final Revised Proposal.ppt
25
Mischaracterizations of Our Initial Proposal…
Our Initial Proposal did NOT:
Provide for the sale of any real estate by McDonald’s
Put franchisees in danger of having a new landlord
Involve the creation of a REIT
Require a real estate financing to create significant value
Hinge on a leveraged share buyback as its primary method of value creation
Our Initial Proposal did:
Assume significant value would be unlocked once McOpCo was IPO’ed and investors had access to transparent financials for Brand McDonald’s, demonstrating that it is fundamentally NOT a restaurant company
A Revised Proposal for Creating Value at McDonald’s
There have been several mischaracterizations of our Initial Proposal which we believe need to be cleared up.
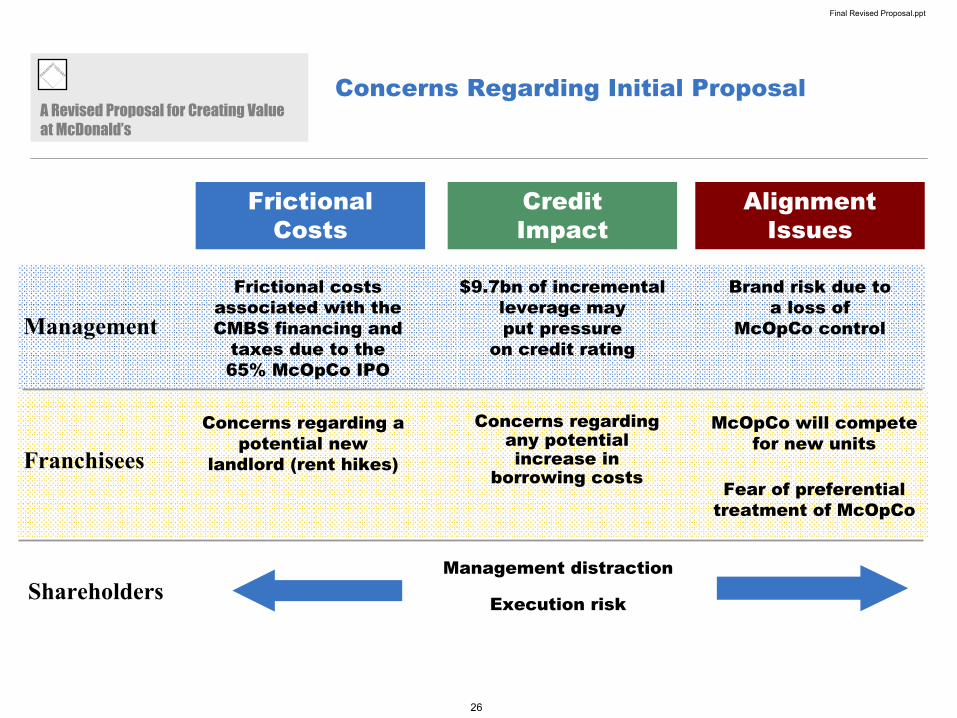
Final Revised Proposal.ppt
26
Concerns Regarding Initial Proposal
Frictional Costs
Management
Frictional costs associated with the CMBS financing and
taxes due to the 65% McOpCo IPO
$9.7bn of incremental leverage may put pressure
on credit rating
Brand risk due to a loss of
McOpCo control
Management distraction
Execution risk
Credit Impact
AlignmentIssues
Franchisees
Shareholders
Concerns regarding any potential increase in
borrowing costs
Concerns regarding a potential new
landlord (rent hikes)
McOpCo will compete for new units
Fear of preferential treatment of McOpCo
A Revised Proposal for Creating Value at McDonald’s

Final Revised Proposal.ppt
Confidential
Our Revised Proposal

Final Revised Proposal.ppt
28
Our Revised Proposal
Step 1: Issue Transparent Segment Financials
Step 2: IPO 20%of McOpCo
McOpCo creates a separate Board of Directors
At least one Board member appointedfrom the franchisee community
IPO 20% of McOpCo
20% IPO will generate no tax costs given existing tax basis
McDonald’s retains full control of McOpCo
Minimal execution risk
Frictional costs of roughly 5 cents per share (1)
(versus management estimates of $4-$5 per share for the Initial Proposal)
A Revised Proposal for Creating Value at McDonald’s
McOpCo signs arm’s-length lease and franchise agreements with McDonald’s Corporation
McDonald’s Corporation requires McOpCo to pay a market rent and franchise fee
McDonald’s Corporation issues transparent segment financials for arm's-length McOpCo and Brand McDonald’s
Continued________________________________________________(1) Assumes IPO transaction fees and expenses of 5% of IPO proceeds.

Final Revised Proposal.ppt
29
McDonald’s increases its dividend payout to 90% of after-tax free cash flow from roughly 35% of free cash flow currently (1)
Implies a dividend of $1.93 per share in FY 2006E versus 0.67 per share in 2005
At a recent price of $34 per share, implies a new dividend yield of 5.7%,versus current yield of ~ 2%
McDonald’s Corporation initiates incremental share buybacks using existing cash on hand and IPO proceeds
Revised Proposal requires no incremental debt to be issued over total debt position as of 9/30/05
Our Revised Proposal (cont’d)
Step 4: Dividend Increase and Share buybacks
A Revised Proposal for Creating Value at McDonald’s
Step 3: Commence McOpCo Refranchising Program
McOpCo commences refranchising 1,000 units in mature markets (U.S., Canada and U.K.) over the next two to three years
Proceeds from refranchising can be redeployed in fast growing, high return emerging markets (China and Russia)
________________________________________________(1) Assumes $843mm of dividends paid in FY2005E. FY2005E dividend payout
ratio based on 9/30/2005 Last Twelve Months after-tax free cash flows, calculated as operating cash flows less cash flows from investing activities.

Final Revised Proposal.ppt
30
Addressing Concerns Regarding the Initial Proposal
Frictional Costs
ManagementNo CMBS financing
Minimal transaction costs
No taxes
No incremental debt
Transparency improves credit profile
Maintain control of McOpCo
Retain flexibility
Minimal management distraction
Minimal execution risk
Credit Impact
AlignmentIssues
Shareholders
No transfer of property
No rent hikes
No increase in borrowing cost for operators
Preserves highly “democratic”franchisee system
McOpCo will be a net seller of units in mature markets
A Revised Proposal for Creating Value at McDonald’s
Franchisees

Final Revised Proposal.ppt
31
Improving McOpCo’s Operating Performance
Current Issue Benefits of the Revised Proposal McOpCo is not reaching its full business and financial potential
IPO of McOpCo would make margin improvement a key focus
No more corporate subsidies to buttress operating margins
McOpCo management can run its business based on the most appropriate operating strategy
Publicly traded arm’s-length McOpCo would force improved capital allocation decisions and optimal pricing policy
Refranchising and redeploying capital/resources would better position McDonald’s in the most attractive growth markets
Investors will respond well to margin and capital allocation improvement as well as the emerging markets growth story
Managerial focus and incentives
McOpCo’s management can be compensated based on the market performance of its business
McOpCo managerial focus will improve as a result of having greater accountability, increased responsibility, a better performance measuring yardstick via the public markets and more direct incentives
A Revised Proposal for Creating Value at McDonald’s
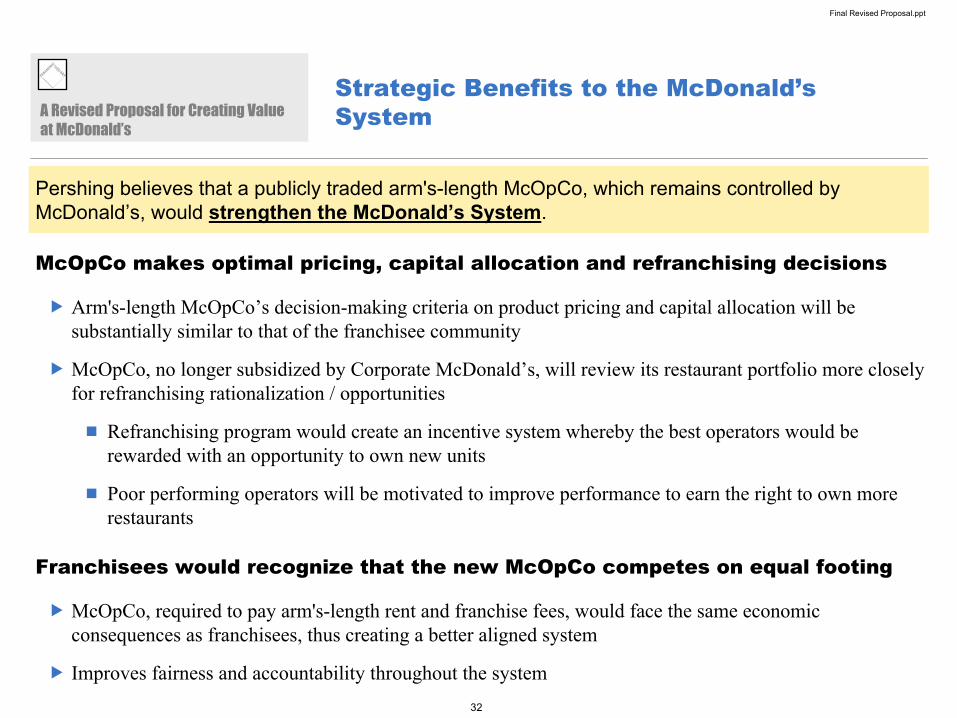
Final Revised Proposal.ppt
32
Strategic Benefits to the McDonald’s System
McOpCo makes optimal pricing, capital allocation and refranchising decisions
Arm's-length McOpCo’s decision-making criteria on product pricing and capital allocation will be substantially similar to that of the franchisee community
McOpCo, no longer subsidized by Corporate McDonald’s, will review its restaurant portfolio more closely for refranchising rationalization / opportunities
Refranchising program would create an incentive system whereby the best operators would be rewarded with an opportunity to own new units
Poor performing operators will be motivated to improve performance to earn the right to own more restaurants
Franchisees would recognize that the new McOpCo competes on equal footing
McOpCo, required to pay arm's-length rent and franchise fees, would face the same economic consequences as franchisees, thus creating a better aligned system
Improves fairness and accountability throughout the system
Pershing believes that a publicly traded arm's-length McOpCo, which remains controlled by McDonald’s, would strengthen the McDonald’s System.
A Revised Proposal for Creating Value at McDonald’s

Final Revised Proposal.ppt
33
Strategic Benefits to the McDonald’s System (cont’d)
Would increase McDonald’s credibility in the system and allow it to better understand the true impact of new product introductions
Testing products at arm's-length McOpCo would provide McDonald’s with
A better understanding of the true economic impact of its new products on the typical owner/operator’s bottom line
More credibility when communicating impact of new products to franchisees
Franchisee participation on the McOpCo Board will temper any perception that McOpCo receives “preferential treatment” from McDonald’s
80% ownership of McOpCo would preserve McDonald’s “skin in the game”
Bottom-lined focused McOpCo would be influential in endorsing new products
A Revised Proposal for Creating Value at McDonald’s
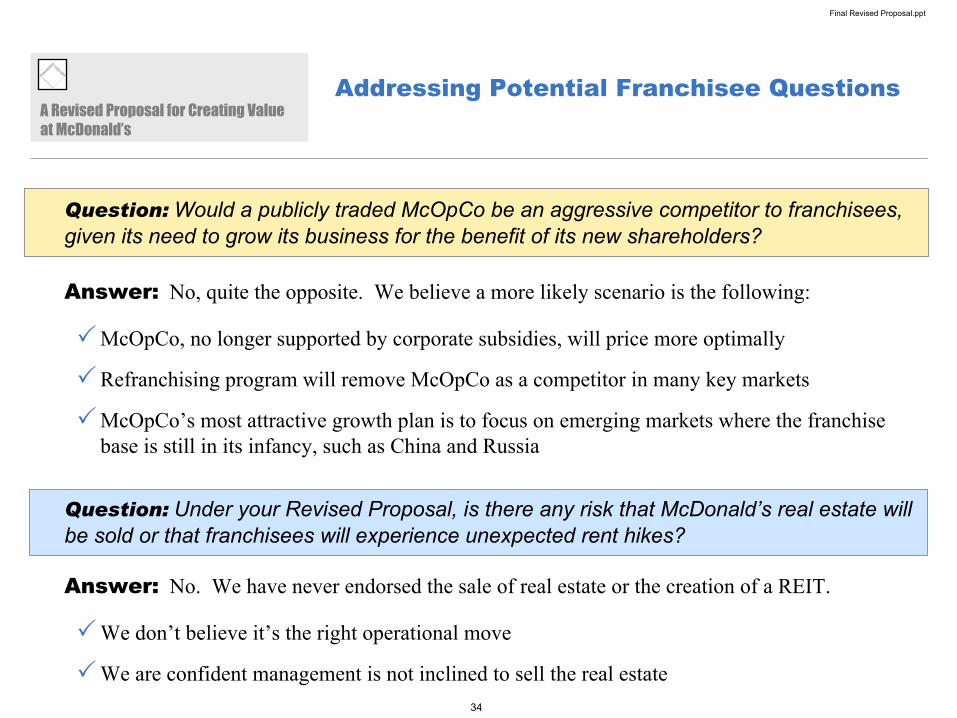
Final Revised Proposal.ppt
34
Addressing Potential Franchisee QuestionsA Revised Proposal for Creating Value at McDonald’s
Question: Would a publicly traded McOpCo be an aggressive competitor to franchisees, given its need to grow its business for the benefit of its new shareholders?
Answer: No, quite the opposite. We believe a more likely scenario is the following:
McOpCo, no longer supported by corporate subsidies, will price more optimally
Refranchising program will remove McOpCo as a competitor in many key markets
McOpCo’s most attractive growth plan is to focus on emerging markets where the franchise base is still in its infancy, such as China and Russia
Question: Under your Revised Proposal, is there any risk that McDonald’s real estate will be sold or that franchisees will experience unexpected rent hikes?
Answer: No. We have never endorsed the sale of real estate or the creation of a REIT.
We don’t believe it’s the right operational move
We are confident management is not inclined to sell the real estate

Final Revised Proposal.ppt
35
Addressing Potential Franchisee QuestionsA Revised Proposal for Creating Value at McDonald’s
Question: How will this change a franchisee’s day-to-day interaction with McDonald’s Corporation?
Answer: There will be no changes. A franchisee’s day-to-day interaction with McDonald’s will not be affected by the creation of a publicly traded McOpCo.
However, the franchisee community may find a strong ally in a publicly traded McOpCo
McOpCo’s management will be able to push back on lower margin / low return new products introduced by Corporate McDonald’s
McOpCo will improve the check and balance mechanisms in the system
Testing at McOpCo on new products will be a better benchmark for how a product will perform throughout the system
Many McOpCo stores in the U.S., Canada and U.K. will be up for refranchising
Franchisee representation on McOpCo’s Board will improve McOpCo’s credibility and communication with the system

Final Revised Proposal.ppt
36
Addressing Potential Company QuestionsA Revised Proposal for Creating Value at McDonald’s
Question: Would a publicly traded McOpCo hinder the current “Farm Team” system or inhibit McDonald’s ability to recruit top McOpCo managers to work at Corporate?
Answer: No. We believe the creation of a publicly traded McOpCo will actually improve the talent pool at both Brand McDonald’s and McOpCo.
Offering direct equity compensation in McOpCo will
Attract “best-in-class” operators
Improve retention
Arm’s-length, publicly traded McOpCo is better training ground than the current wholly owned McOpCo
Better “real world” business discipline for managers, once corporate subsidies are removed
Teaches restaurant operators how to run a public business
With 80% ownership, Brand McDonald’s will still be able to leverage its deep relationship with McOpCo for recruiting purposes

Final Revised Proposal.ppt
37
Unlocking Shareholder Value
Current Issue Benefits of the Revised Proposal Transparent financials
Separate arm’s-length McOpCo financials would be made available to investors
Transparent segment financials would be made available at McDonald’s, demonstrating the operating cash flows generated by Brand McDonald’s
Dividends and Equity Options
Ability to increase dividends
Reduce option dilution at McDonald’s through the use of McOpCo currency
Valuation
McOpCo IPO would allow Wall Street analysts and the broad investment community to value McDonald’s on a sum-of-the parts basis
Investors would focus more on the value of Brand McDonald’s
A publicly traded McOpCo would increase financial transparency and would allow investors to appropriately value McDonald’s on a sum-of-the-parts basis.
A Revised Proposal for Creating Value at McDonald’s
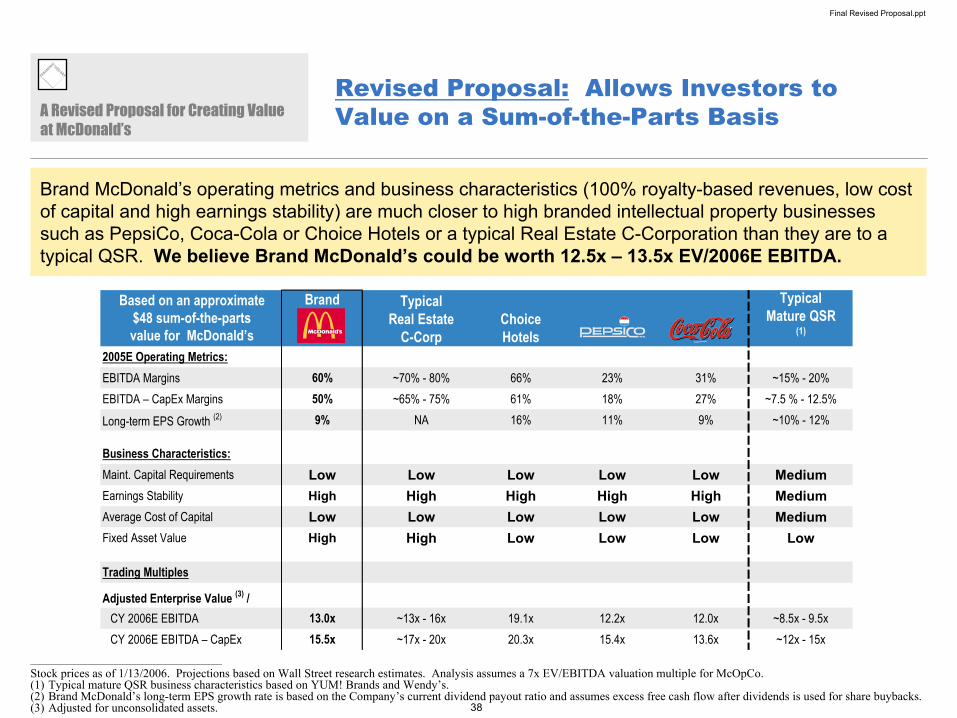
Final Revised Proposal.ppt
38
Brand TypicalReal Estate
C-CorpChoice Hotels
Typical Mature QSR
(1)
2005E Operating Metrics:EBITDA Margins 60% ~70% - 80% 66% 23% 31% ~15% - 20%EBITDA – CapEx Margins 50% ~65% - 75% 61% 18% 27% ~7.5 % - 12.5%
Long-term EPS Growth (2) 9% NA 16% 11% 9% ~10% - 12%
Business Characteristics:Maint. Capital Requirements Low Low Low Low Low MediumEarnings Stability High High High High High MediumAverage Cost of Capital Low Low Low Low Low MediumFixed Asset Value High High Low Low Low Low
Trading Multiples
Adjusted Enterprise Value (3) / CY 2006E EBITDA 13.0x ~13x - 16x 19.1x 12.2x 12.0x ~8.5x - 9.5xCY 2006E EBITDA – CapEx 15.5x ~17x - 20x 20.3x 15.4x 13.6x ~12x - 15x
Revised Proposal: Allows Investors to Value on a Sum-of-the-Parts BasisA Revised Proposal for Creating Value
at McDonald’s
________________________________________________
Stock prices as of 1/13/2006. Projections based on Wall Street research estimates. Analysis assumes a 7x EV/EBITDA valuation multiple for McOpCo.(1) Typical mature QSR business characteristics based on YUM! Brands and Wendy’s.(2) Brand McDonald’s long-term EPS growth rate is based on the Company’s current dividend payout ratio and assumes excess free cash flow after dividends is used for share buybacks.(3) Adjusted for unconsolidated assets.
Brand McDonald’s operating metrics and business characteristics (100% royalty-based revenues, low cost of capital and high earnings stability) are much closer to high branded intellectual property businesses such as PepsiCo, Coca-Cola or Choice Hotels or a typical Real Estate C-Corporation than they are to a typical QSR. We believe Brand McDonald’s could be worth 12.5x – 13.5x EV/2006E EBITDA.
Based on an approximate$48 sum-of-the-parts value for McDonald’s

Final Revised Proposal.ppt
39
($ in millions) Adjusting for a Market IPO of 20% of McOpCoAs Reported Rent and Franchise Fee and Transparency Drives Revaluation
EV/'06E EBITDA Enterprise2006E 2006E EV/'06E EBITDA Enterprise Multiple Value
Segment EBITDA EBITDA Multiple Value Low - High Low - High
McOpCo $2,503 $1,130 7.0x $7,908 7.0x 7.0x $7,908 $7,908
Brand McDonald's 3,090 4,464 9.3x 41,675 12.5x 13.5x 55,799 60,263
Total $5,594 5,594 8.9x $49,582 $63,707 $68,171
Recent Stock Price $34.00 Implied Share Price $46 $50Premium to Unaffected Price (1) 45% 57%
Revised Proposal: Allows Investors to Value on a Sum-of-the-Parts Basis
We believe a minority IPO of McOpCo would force a market revaluation of McDonald’s.
________________________________________________Note: Assumes $1.25bn of proceeds from IPO and $1.75bn of existing cash on hand used to repurchase shares. Capital structure assumptions are detailed on page 56 of the Appendix.
Analysis is pro forma for a McOpCo spin-off and McDonald’s share buyback on 12/31/05.(1) Based on 10/31 closing price of $31.60.
Implied multiple,based on a $34
stock price
A Revised Proposal for Creating Value at McDonald’s

Final Revised Proposal.ppt
40
Assuming Transparent Segment Financials
McDonald's Equity Value per ShareBrand McDonald's EV/2006E EBITDA
12.0x 12.5x 13.0x 13.5x 13.5x
McOpCo 6.0x $42.97 $44.86 $46.74 $48.62 $48.62
EV / '06E 6.5x 43.45 45.33 47.21 49.10 49.10
EBITDA 7.0x 43.93 45.81 47.69 49.57 49.57
Multiple 7.5x 44.40 46.28 48.17 50.05 50.05
McDonald’s Sum-of-the-Parts Analysis at Various Multiples
________________________________________________
Note: Assumes 75% of consolidated G&A is allocated to Brand McDonald’s, with the rest allocated to McOpCo. Assumes McDonald’s FY ’05E Net Debt of $8.1bn, Minority Interest in McOpCo of $1.3bn, and FY’05E Diluted Shares Outstanding of 1,186mm, all pro forma for Pershing’s Revised Proposal.
Assuming McOpCo pays a market rent and franchisee fee, we have modeled McOpCo FY ’06E EBITDA of $1.1 billion and Brand McDonald’s FY ’06E EBITDA of $4.5 billion.
Based on these assumptions, we believe McDonald’s stock price would trade in the range of approximately $46 -$50 per share, as a result of a 20% IPO of McOpCo.
A Revised Proposal for Creating Value at McDonald’s
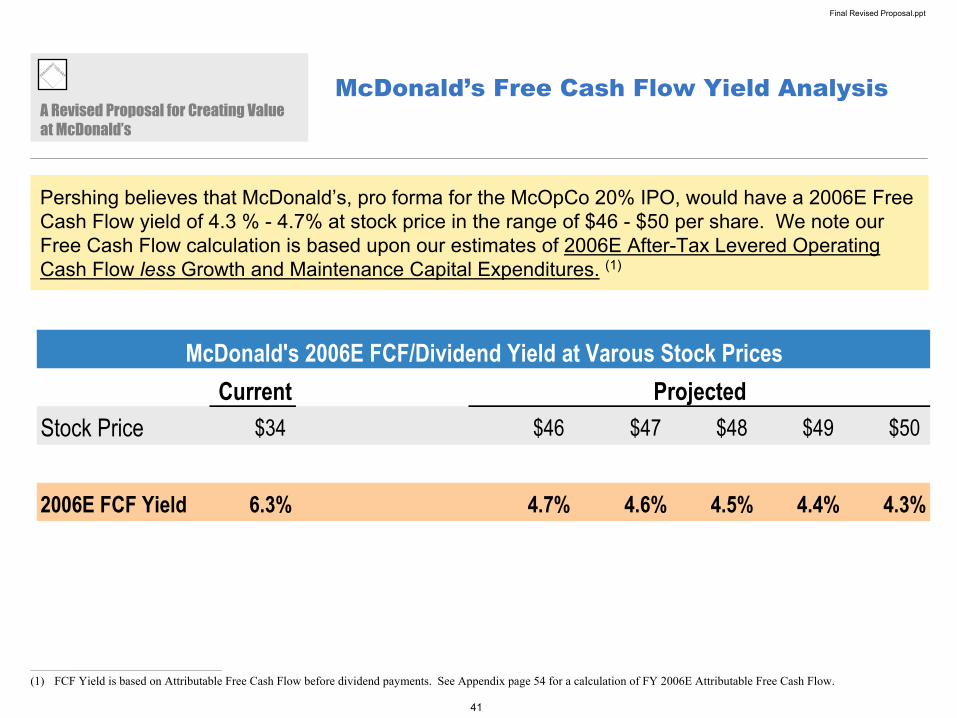
Final Revised Proposal.ppt
41
McDonald’s Free Cash Flow Yield Analysis
________________________________________________
(1) FCF Yield is based on Attributable Free Cash Flow before dividend payments. See Appendix page 54 for a calculation of FY 2006E Attributable Free Cash Flow.
Pershing believes that McDonald’s, pro forma for the McOpCo 20% IPO, would have a 2006E Free Cash Flow yield of 4.3 % - 4.7% at stock price in the range of $46 - $50 per share. We note our Free Cash Flow calculation is based upon our estimates of 2006E After-Tax Levered Operating Cash Flow less Growth and Maintenance Capital Expenditures. (1)
A Revised Proposal for Creating Value at McDonald’s
McDonald's 2006E FCF/Dividend Yield at Varous Stock PricesCurrent Projected
Stock Price $34 $46 $47 $48 $49 $50
2006E FCF Yield 6.3% 4.7% 4.6% 4.5% 4.4% 4.3%

Final Revised Proposal.ppt
42
Minimal Execution RiskA Revised Proposal for Creating Value at McDonald’s
A minority IPO of McOpCo would have minimal execution risk and negligible frictional costs
Simple transaction
Many successful value creating precedent transactions
Minimal management distraction
Frictional costs of roughly 5 cents per share
Preserves current structure’s control of McOpCo
McDonald’s would maintain the flexibility to repurchase minority McOpCo stake
…if desired improvements were not obtained
Minority buyouts are simple and common transactions with minimal transaction costs
McOpCo

Final Revised Proposal.ppt
43
Further Upside to Our Valuation
Pershing’s valuation is based on the business as it exists today, assuming no further operational improvements.
Pershing believes that creating a publicly traded arm's-length McOpCo will substantially improve both top-line and bottom-line performance of McDonald’s
We believe that McOpCo has EBITDA margins of roughly 7.3% (post corporate allocation) (1)
Based on comparable restaurant businesses, we believe McOpCo is capable of achieving at least 10% EBITDA margins
However, Pershing has assumed no incremental operational improvements as part of its valuation
We also see potential G&A improvement as an additional opportunity
Standalone McDonald’s LTM 9/30/05 G&A per systemwide unit of $68k versus YUM! Brands LTM 9/30/05 G&A per systemwide unit of approximately $35k
We have not included an IPO / potential spin-off of Chipotle as part of our analysis
IPO and potential spin-off of Chipotle will create additional value for investors
A Revised Proposal for Creating Value at McDonald’s
________________________________________________
(1) McOpCo EBITDA margins are after adjusting for a market rent and franchise fee and allocating 25% of McDonald’s consolidated G&A to McOpCo.

Final Revised Proposal.ppt
44
$52$56
$61
$50
$30
$40
$50
$60
Pershing Proposal:
McOpCo 20% IPO and Market Revaluation of
McDonald’s
McOpCo improves
EBITDA margins to 10%
(approx. 275bps improvement)
Improve G&A to YUM! levels of
$35k per systemwide unit
(~$1bn of G&A savings)(2)
Improve G&A to $50k per
systemwide unit (~$500mm of G&A
savings)(2)
Recent: $34
Further Upside to Our Valuation (cont’d)A Revised Proposal for Creating Value at McDonald’s
Pershing Proposal
Upside
We believe our Proposal can potentially increase McDonald’s share price to $50 per share. In addition, we believe McDonald’s strong management team, running a world-leading brand, can
create significant additional value based only on incremental operating improvements.(1)
_______________________________________________
(1) See Appendix page 55 for more detail regarding our assumptions on operating improvements. (2) Total savings denotes consolidated G&A, of which 75% is allocated to Brand McDonald’s and 25% is allocated to McOpCo.
McDonald’s Potential Stock Price

Final Revised Proposal.ppt
45
A Plan to Win / Win
Addresses concerns of all stakeholders
Creates financial transparency for investors
Will lead to substantial value creation for McDonald’s shareholders
Simple transaction
Minimal execution risk, management distraction and frictional costs
Positions McOpCo to make optimal capital allocation and business execution decisions
Improves the System’s “checks and balances”
Allows McDonald’s maximum control and flexibility regarding future strategic alternatives
Significant upside, given strong Management team
A Revised Proposal for Creating Valueat McDonald’s

Final Revised Proposal.ppt
Confidential
Q & A

Final Revised Proposal.ppt
Confidential
Appendix

Final Revised Proposal.ppt
48
2004 McDonald’s P&L As Reported
Set forth below is a table which reconciles McOpCo’s, Brand McDonald’s and stand-alone McDonald’s FY 2004 income statements, as they are currently reported. The analysis demonstrates how McOpCo is paying neither a market rent nor a franchise fee.
________________________________________________
The analysis assumes that 75% of the total G&A is allocated to the Brand McDonald’s and 25% is allocated to McOpCo. To the extent that there should be more G&A allocated to McOpCo, then there would be a greater percentage of total EBITDA at Brand McDonald’s than what is shown here.Note: Analysis excludes $441 mm of non-recurring other net operating expenses.
.
Appendix
Brand 20042004 McOpCo McDonald's Consolidated
Income Statement P&L P&L Sum of PartsSales by Company Operated Restaurants $14,224 $14,224 $14,224Rent from Franchise and Affiliate Rest. 3,336 3,336 3,336 Franchise Fees From Franchise and Affiliate Rest. 1,505 1,505 1,505 Total Revenue $19,065 $14,224 $4,841 $19,065
Company Operated Expenses: Food and Paper 4,853 4,853 - 4,853 Compensation & Benefits 3,726 3,726 - 3,726 Occupancy and Other Expenses (excl. D&A) 2,747 2,747 - 2,747 Company Operated D&A 774 427 347 774 Total Company Operated Expenses $12,100 $11,753 $347 $12,100
Franchised Restaurant Occupancy Costs 576 - 576 576 Franchise PPE D&A 427 427 427 Corporate G&A 1,980 495 1,485 1,980 EBIT 3,982 1,976 2,006 3,982
Depreciation & Amortization 1,201 427 774 1,201 EBITDA $5,183 $2,403 $2,780 $5,183% of Total EBITDA 100% 46% 54% 100%
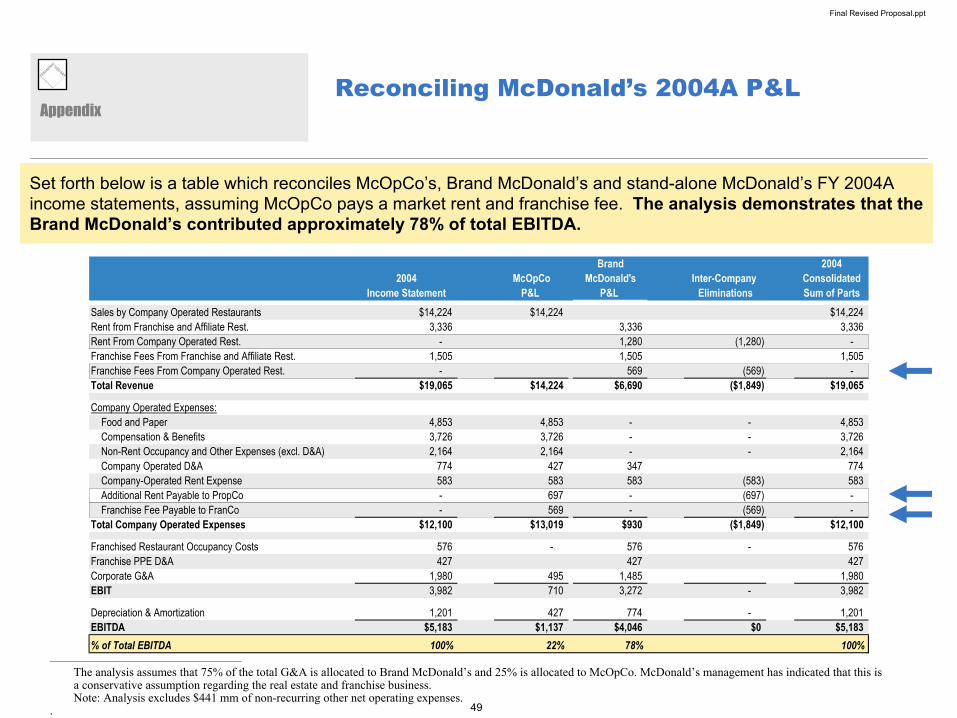
Final Revised Proposal.ppt
49
Reconciling McDonald’s 2004A P&L
Set forth below is a table which reconciles McOpCo’s, Brand McDonald’s and stand-alone McDonald’s FY 2004A income statements, assuming McOpCo pays a market rent and franchise fee. The analysis demonstrates that the Brand McDonald’s contributed approximately 78% of total EBITDA.
________________________________________________
The analysis assumes that 75% of the total G&A is allocated to Brand McDonald’s and 25% is allocated to McOpCo. McDonald’s management has indicated that this is a conservative assumption regarding the real estate and franchise business.Note: Analysis excludes $441 mm of non-recurring other net operating expenses.
.
Appendix
Brand 20042004 McOpCo McDonald's Inter-Company Consolidated
Income Statement P&L P&L Eliminations Sum of PartsSales by Company Operated Restaurants $14,224 $14,224 $14,224Rent from Franchise and Affiliate Rest. 3,336 3,336 3,336 Rent From Company Operated Rest. - 1,280 (1,280) - Franchise Fees From Franchise and Affiliate Rest. 1,505 1,505 1,505 Franchise Fees From Company Operated Rest. - 569 (569) - Total Revenue $19,065 $14,224 $6,690 ($1,849) $19,065
Company Operated Expenses: Food and Paper 4,853 4,853 - - 4,853 Compensation & Benefits 3,726 3,726 - - 3,726 Non-Rent Occupancy and Other Expenses (excl. D&A) 2,164 2,164 - - 2,164 Company Operated D&A 774 427 347 774 Company-Operated Rent Expense 583 583 583 (583) 583 Additional Rent Payable to PropCo - 697 - (697) - Franchise Fee Payable to FranCo - 569 - (569) - Total Company Operated Expenses $12,100 $13,019 $930 ($1,849) $12,100
Franchised Restaurant Occupancy Costs 576 - 576 - 576 Franchise PPE D&A 427 427 427 Corporate G&A 1,980 495 1,485 1,980 EBIT 3,982 710 3,272 - 3,982
Depreciation & Amortization 1,201 427 774 - 1,201 EBITDA $5,183 $1,137 $4,046 $0 $5,183% of Total EBITDA 100% 22% 78% 100%
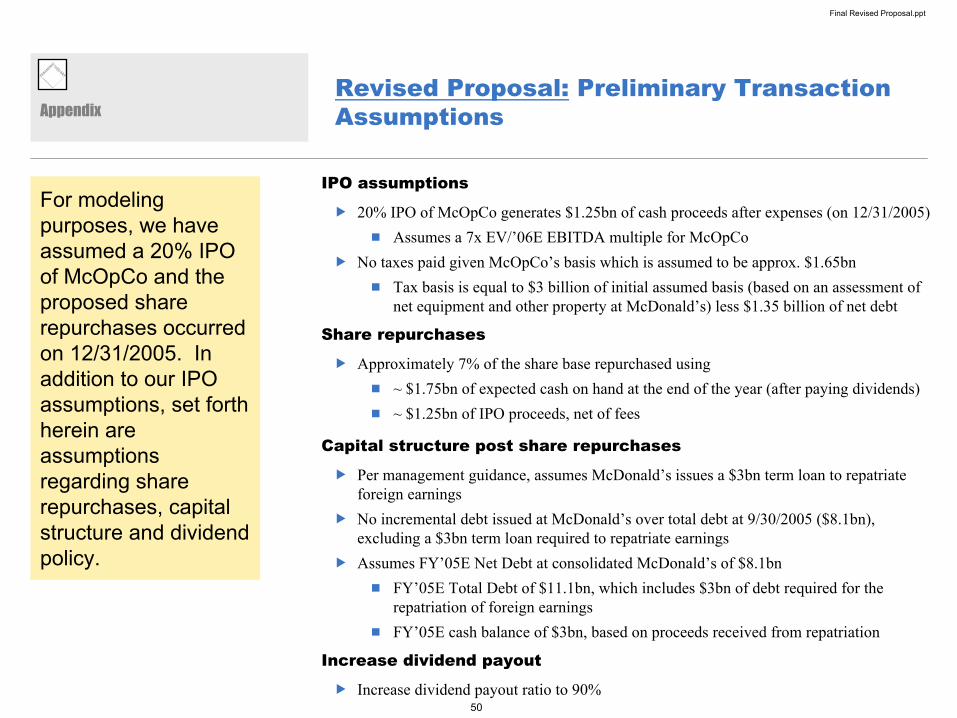
Final Revised Proposal.ppt
50
Revised Proposal: Preliminary Transaction AssumptionsAppendix
IPO assumptions
20% IPO of McOpCo generates $1.25bn of cash proceeds after expenses (on 12/31/2005)Assumes a 7x EV/’06E EBITDA multiple for McOpCo
No taxes paid given McOpCo’s basis which is assumed to be approx. $1.65bn Tax basis is equal to $3 billion of initial assumed basis (based on an assessment of net equipment and other property at McDonald’s) less $1.35 billion of net debt
Share repurchases
Approximately 7% of the share base repurchased using ~ $1.75bn of expected cash on hand at the end of the year (after paying dividends)~ $1.25bn of IPO proceeds, net of fees
Capital structure post share repurchases
Per management guidance, assumes McDonald’s issues a $3bn term loan to repatriate foreign earningsNo incremental debt issued at McDonald’s over total debt at 9/30/2005 ($8.1bn), excluding a $3bn term loan required to repatriate earningsAssumes FY’05E Net Debt at consolidated McDonald’s of $8.1bn
FY’05E Total Debt of $11.1bn, which includes $3bn of debt required for the repatriation of foreign earningsFY’05E cash balance of $3bn, based on proceeds received from repatriation
Increase dividend payout
Increase dividend payout ratio to 90%
For modeling purposes, we have assumed a 20% IPO of McOpCo and the proposed share repurchases occurred on 12/31/2005. In addition to our IPO assumptions, set forth herein are assumptions regarding share repurchases, capital structure and dividend policy.

Final Revised Proposal.ppt
51
McOpCo IPO: Mechanics
Step 1: McOpCo dividends a $1.3bn Note to McDonald’s (parent) Step 2: IPO of McOpCo Step 3: Share Repurchases using
Cash on Hand and IPO Proceeds
McOpCo
McOpCo
Equity Markets
McOpCo declares and pays a dividend to McDonald’s (parent) in the form of a Note in an amount equal to the anticipated proceeds from an initial public offering of McOpCo
For illustrative purposes, we assume the Note is for $1.3bn, or 20% of the equity market value of McOpCo (assumed to be $6.6bn)
McOpCo undertakes the IPO and uses the proceeds to repay the dividend note.
Any tax cost for the IPO would be the amount by which the IPO distribution exceeded McDonald's basis in the McOpCo stock multiplied by McDonald’s corporate and state/local tax rate
Assuming a $1.3bn of IPO distribution, there would be no tax cost associated with the IPO
Assume a $1.65 billion of tax basis
No incremental leverage issued
PF McDonald’s repurchases approximately 7% of the fully diluted share base using
Excess cash on handAfter tax proceeds of IPO
IPO of McOpCoShares
$1.3bn Note
$1.3 bn cash received
McOpCo repays $1.3 bn Note to McDonald’s
McDonald’s retains
80% stake
McDonald’s performs a self-tender post the IPO
Equity Markets
Pays$3.0 billion
Repurchases shares
Appendix

Final Revised Proposal.ppt
52
McOpCo IPO: Proceeds
Given the estimated tax basis in McOpCo, we believe that no taxes would need to paid in an IPO of McOpCo.
Appendix
McOpCo IPO After Tax ProceedsLow High Average
Taxes payableMcOpCo Equity Market Value $5,993 $7,122 $6,558
IPO Percentage 20% 20% 20%
Distribution to PF McDonald's $1,199 $1,424 $1,312
Estimated Book Basis of McOpCo 3,000 3,000 3,000
Net Debt Allocated to McOpCo (1,350) (1,350) (1,350)
Adjusted Basis in McOpCo 1,650 1,650 1,650
Taxable Gain $0 $0 $0
Tax Rate 38% 38% 38%
Taxes payable $0 $0 $0
After Tax Proceeds
Distribution $1,199 $1,424 $1,312Taxes Payable 0 0 0After Tax Distributions $1,199 $1,424 $1,312
Estimated IPO fees (60) (71) (66)
Net Proceeds $1,139 $1,353 $1,246
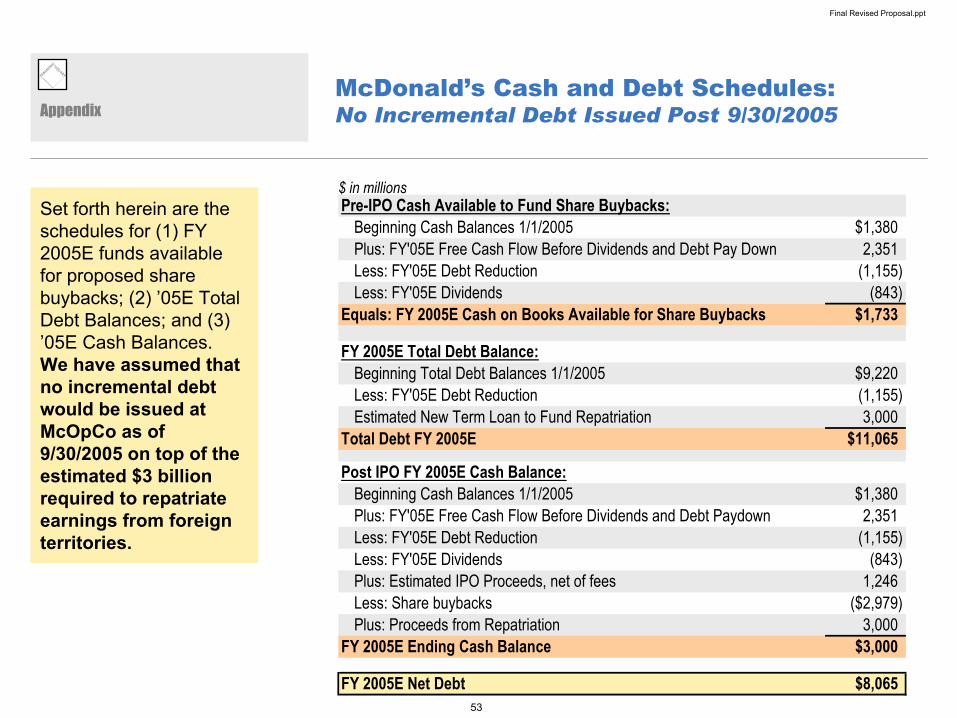
Final Revised Proposal.ppt
53
McDonald’s Cash and Debt Schedules:No Incremental Debt Issued Post 9/30/2005
Set forth herein are the schedules for (1) FY 2005E funds available for proposed share buybacks; (2) ’05E Total Debt Balances; and (3) ’05E Cash Balances. We have assumed that no incremental debt would be issued at McOpCo as of 9/30/2005 on top of the estimated $3 billion required to repatriate earnings from foreign territories.
$ in millions
Appendix
Pre-IPO Cash Available to Fund Share Buybacks:Beginning Cash Balances 1/1/2005 $1,380Plus: FY'05E Free Cash Flow Before Dividends and Debt Pay Down 2,351Less: FY'05E Debt Reduction (1,155)Less: FY'05E Dividends (843)
Equals: FY 2005E Cash on Books Available for Share Buybacks $1,733
FY 2005E Total Debt Balance:Beginning Total Debt Balances 1/1/2005 $9,220Less: FY'05E Debt Reduction (1,155)Estimated New Term Loan to Fund Repatriation 3,000
Total Debt FY 2005E $11,065
Post IPO FY 2005E Cash Balance:Beginning Cash Balances 1/1/2005 $1,380Plus: FY'05E Free Cash Flow Before Dividends and Debt Paydown 2,351Less: FY'05E Debt Reduction (1,155)Less: FY'05E Dividends (843)Plus: Estimated IPO Proceeds, net of fees 1,246Less: Share buybacks ($2,979)Plus: Proceeds from Repatriation 3,000
FY 2005E Ending Cash Balance $3,000
FY 2005E Net Debt $8,065

Final Revised Proposal.ppt
54
McDonald’s 2006E Free Cash FlowAssuming a 20% IPO of McOpCo
Set forth herein is a schedule for 2006E Free Cash Flow based on our estimates.
Attributable free cash flow per share deducts the minority interest free cash flow pertaining to the 20% stake of McOpCo’s no longer owned by McDonald’s. FY2006E shares outstanding is pro forma for the proposed share buyback.
Appendix
2006E Cash Flow Data ($ in mm except per share data)
EBITDA $5,594
less: Cash Taxes (1,186)
less: Cash Interest Expense (563)
less: Growth CapEx (Net of Proceeds from Closings) (316)
less: Maintenance CapEx (943)
less: Change in Working Capital 12
less: Minority Interest Free Cash Flow (74)
Attributable Free Cash Flow Before Financing Activities $2,525
FY 2006E Average Shares Outstanding (mm) 1,176
Attributable Free Cash Flow per Share $2.15
Dividends Paid at 90% of Attributable FCF 2,272
Dividend Paid per Share $1.93

Final Revised Proposal.ppt
55
Assumptions: Upside Operating ImprovementsAppendix
Set forth herein is a table which details our assumptions regarding potential operating improvements.
Pr Forma Estimated Pro Forma2006E EV/'06E EBITDA Enterprise
Transaction / Assumptions Segment EBITDA Multiple ValueMcOpCo EBITDA Improvement McOpCo $1,554 7.0x $10,878
Brand McDonald's 4,464 13.5x 60,263275bps Total 6,018 $71,141FY 2006E Financial Data:McOpCo Revenue $15,429 Less: FY'05E Net Debt 8,065McOpCo EBITDA $1,130 Less: Minority Interest (Market Value) 1,906 Current EBITDA Margin 7.3% Equals: Market Value of Equity $61,171New Margins 10.1% PF FY'05E Diluted Shares Outstanding (mm) 1,186New McOpCo EBITDA 1,554 Estimated Share Price $52
G & A Savings: Improving to $50k per unit McOpCo $1,679 7.0x $11,753Unit Level Assumption: Brand McDonald's 4,839 13.5x 65,326~50k per unit Total 6,518 $77,078G&A Allocation Assumptions:McOpCo 25.0% Less: FY'05E Net Debt 8,065Brand McDonald's 75.0% Less: Minority Interest (Market Value) 2,081 Savings ($ in mm) Equals: Market Value of Equity $66,933McOpCo $125 PF FY'05E Diluted Shares Outstanding (mm) 1,186Brand McDonald's $375 Estimated Share Price $56
G & A Savings: Improving to YUM! Levels McOpCo $1,804 7.0x $12,628Unit Level Assumption: Brand McDonald's 5,214 13.5x 70,388~35k per unit Total 7,018 $83,016G&A Allocation Assumptions:McOpCo 25.0% Less: FY'05E Net Debt 8,065Brand McDonald's 75.0% Less: Minority Interest (Market Value) 2,256 Savings ($ in mm) Equals: Market Value of Equity $72,696McOpCo $250 PF FY'05E Diluted Shares Outstanding (mm) 1,186Brand McDonald's $750 Estimated Share Price $61
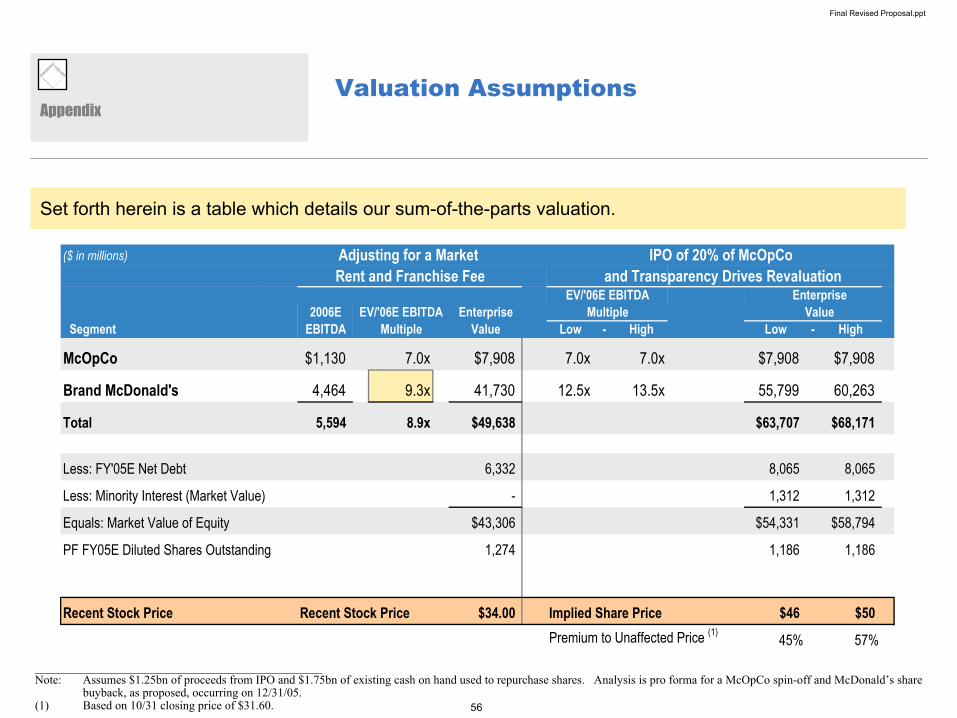
Final Revised Proposal.ppt
56
Valuation AssumptionsAppendix
Set forth herein is a table which details our sum-of-the-parts valuation.
________________________________________________Note: Assumes $1.25bn of proceeds from IPO and $1.75bn of existing cash on hand used to repurchase shares. Analysis is pro forma for a McOpCo spin-off and McDonald’s share
buyback, as proposed, occurring on 12/31/05.(1) Based on 10/31 closing price of $31.60.
($ in millions) Adjusting for a Market IPO of 20% of McOpCoRent and Franchise Fee and Transparency Drives Revaluation
EV/'06E EBITDA Enterprise2006E EV/'06E EBITDA Enterprise Multiple Value
Segment EBITDA Multiple Value Low - High Low - High
McOpCo $1,130 7.0x $7,908 7.0x 7.0x $7,908 $7,908
Brand McDonald's 4,464 9.3x 41,730 12.5x 13.5x 55,799 60,263
Total 5,594 8.9x $49,638 $63,707 $68,171
Less: FY'05E Net Debt 6,332 8,065 8,065
Less: Minority Interest (Market Value) - 1,312 1,312
Equals: Market Value of Equity $43,306 $54,331 $58,794
PF FY05E Diluted Shares Outstanding 1,274 1,186 1,186
Recent Stock Price Recent Stock Price $34.00 Implied Share Price $46 $50Premium to Unaffected Price (1) 45% 57%

Final Revised Proposal.ppt
57
($ in thousands)
Avg. Unit Sales $1,912 100.0% $1,494 100.0% $1,762 100.0%
Operating Income Before Rent Expense $433 22.7% $281 18.8% Less: Market Rent & Franchisee Fee 249 13.0% 194 13.0%Operating Income after Rent and Franchise Fee $185 9.7% $87 5.8%Plus: Estimated D&A 57 3.0% 45 3.0%
4-Wall EBITDA (w/ Mkt. Fees) $242 12.7% $132 8.8% $260 14.8%
Avg. Intl. McOpCo Unit Avg. US Franchisee UnitAvg. US McOpCo Unit
Average Unit Level EBITDA MarginsAppendix
Set forth herein is a table which details our assumptions regarding average unit level 4-Wall EBITDA margins for McOpCo and U.S. Franchisees.
________________________________________________
Note: McOpCo estimates based on FY 2004 financial data and assumes 2,002 U.S. McOpCo units and 6,117 International McOpCo units.(1) As presented by Ralph Alvarez, President of McDonald’s North America, at McDonald’s Analyst Meeting at Oak Brook, IL on 9/21/05..
(1)

Final Revised Proposal.ppt
58
III. Case Studies McDonalds 7 Year Stock Price Performance:January 1999 to present
$10
$15
$20
$25
$30
$35
$40
$45
$50
1/19/99 10/1/99 6/12/00 2/22/01 11/4/01 7/17/02 3/29/03 12/9/03 8/20/04 5/2/05 1/13/06
$4811/12/1999

Don’t Judge a Book By Its CoverNovember 9, 2006
Pershing SquareCapital Management, L.P.
1
Disclaimer
The analysis and conclusions of Pershing Square Capital Management, L.P. ("Pershing") regarding Borders Group, Inc. (“Borders” or the “Company”) are based on publicly available information. Pershing recognizes that there may be confidential information in the possession of the Company that could lead the Company to disagree with Pershing’s conclusions.
The analyses provided include certain estimates and projections prepared with respect to, among other things, the historical and anticipated operating performance of the Company. Such statements, estimates, and projections reflect various assumptions by Pershing concerning anticipated results that are inherently subject to significant economic, competitive, and other uncertainties and contingencies and have been included solely for illustrative purposes. No representations, express or implied, are made as to the accuracy or completeness of such statements, estimates or projections or with respect to any other materials herein. Actual results may vary materially from the estimates and projected results contained herein.
Pershing advises funds that are in the business of trading - buying and selling - public securities. It is possible that there will be developments in the future that cause such funds to change their positions regarding the Company and possibly increase, reduce, dispose of, or change the form of their investment in the Company.

2
Borders Group
2nd largest U.S. book retailer13% of U.S. retail book market (versus Barnes and Noble at 17% and Amazon at 10%)
2006E Rev of $4.1bn and EBITDA of $235mm
Year-end Enterprise Value of $1.6bn and Equity Value of $1.1bn (1)
EV / ’06 EBITDA: 6.9x
EV / ’06 EBITDA – Maint. Capex: 8.8x
P / ’06 EPS: 27.2xForward estimates based on Pershing estimates.(1) Based on management’s guidance for Net Debt and shares outstanding at year end 2006. Assumes a $21 current stock price for BGP throughout this presentation.
Ticker: BGP
Recent price: $21
Note: BGP fiscal year ends on January 31. Presentation based on a Calendar year.

3
What is Borders?
Superstores Mall Stores International■ Large format
(25,000 sq ft)■ Large selection■ 476 units■ Most profitable segment■ Positive sales trends
■ Waldenbooks■ Small format, mall-based■ Limited selection ■ 600 units■ Negative sales trends
and declining profitability
% LTM Rev. 68% 17% 15%
% LTM EBITDA 92% 5% 3%
■ U.K. and Australia■ 90 units / mix of large /
small format stores■ Declining profitability
% LTM ROA 10% -1% -2%
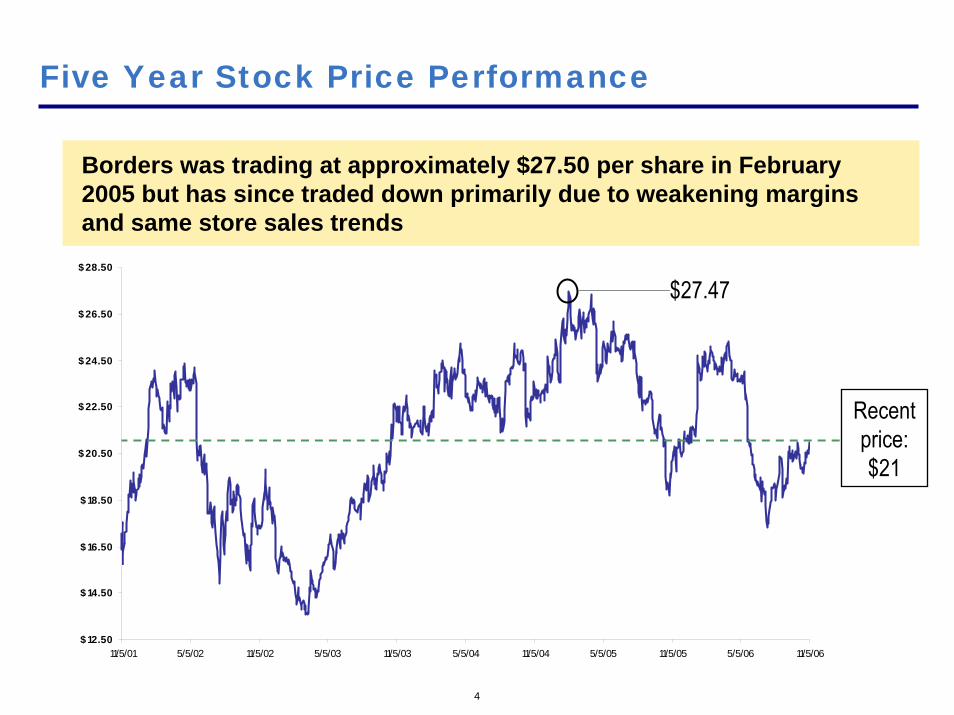
4
$ 12.50
$ 14.50
$ 16.50
$ 18.50
$ 20.50
$ 22.50
$ 24.50
$ 26.50
$ 28.50
11/5/01 5/5/02 11/5/02 5/5/03 11/5/03 5/5/04 11/5/04 5/5/05 11/5/05 5/5/06 11/5/06
Five Year Stock Price Performance
Borders was trading at approximately $27.50 per share in February 2005 but has since traded down primarily due to weakening margins and same store sales trends
$27.47
Recent price:$21

5
$294$308 $318
$333
$300
8.6% 8.8%8.4%
7.4%
8.5%
$0
$50
$100
$150
$200
$250
$300
$350
2001 2002 2003 2004 20053.0%
4.0%
5.0%
6.0%
7.0%
8.0%
9.0%
10.0%
Adjusted EBITDA and Margins ($ in millions)
Borders Historical Financial Performance
In 2005, Borders’ consolidated Adjusted EBITDA margins fell to 7.4% from the previous four-year average of approximately 8.6%
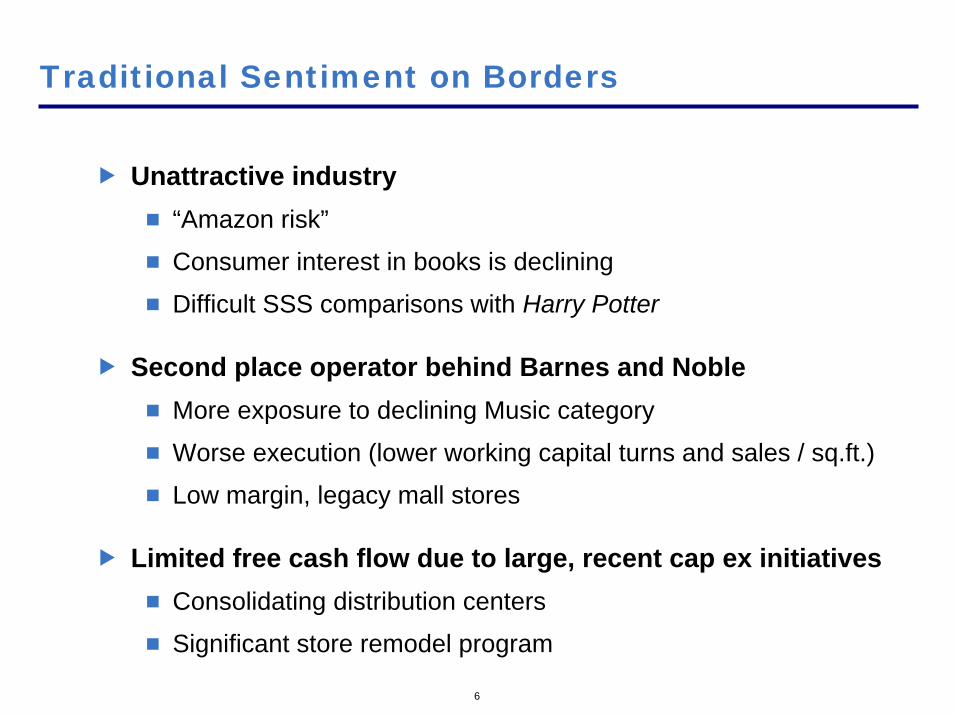
6
Traditional Sentiment on Borders
Unattractive industry“Amazon risk”
Consumer interest in books is declining
Difficult SSS comparisons with Harry Potter
Second place operator behind Barnes and NobleMore exposure to declining Music category
Worse execution (lower working capital turns and sales / sq.ft.)
Low margin, legacy mall stores
Limited free cash flow due to large, recent cap ex initiativesConsolidating distribution centers
Significant store remodel program

Why Do We Like Borders?
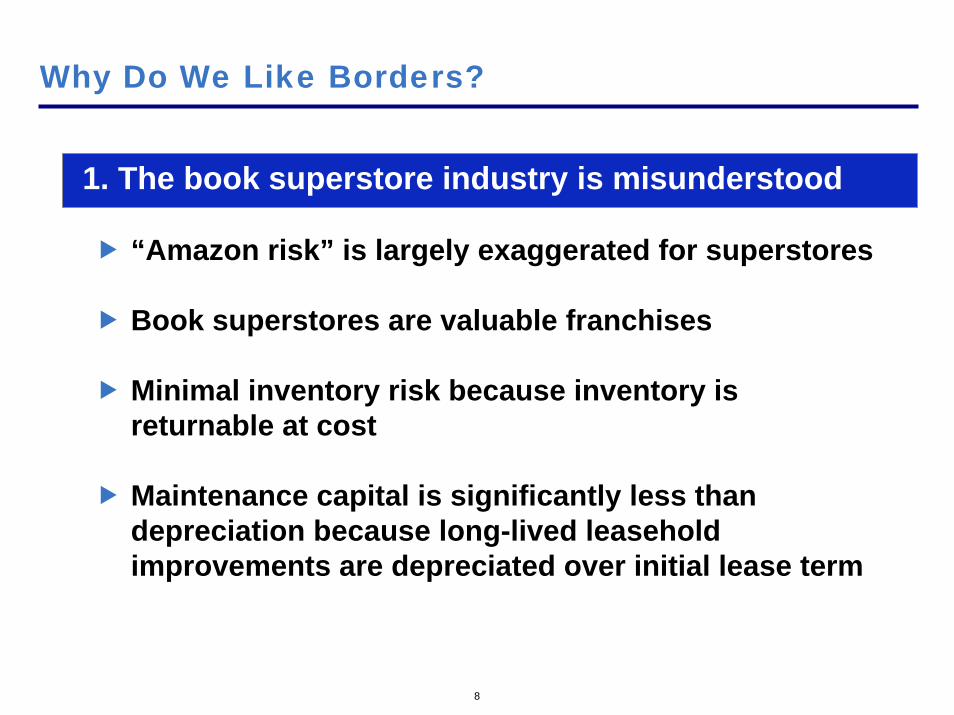
8
1. The book superstore industry is misunderstood
“Amazon risk” is largely exaggerated for superstores
Book superstores are valuable franchises
Minimal inventory risk because inventory is returnable at cost
Maintenance capital is significantly less than depreciation because long-lived leasehold improvements are depreciated over initial lease term
Why Do We Like Borders?

9
2. Borders is a mix of high-quality businesses and several low-ROI, money-losing businesses which are in the process of being rationalized
Value of core Superstores business is obscured by declining profitability in the Mall Stores and International Stores
In addition, within the Superstores segment, value is being masked by a declining category as well as several recent management initiatives
Rapid decline of Music sales (music was 22% of sales in 2001, now roughly 11%)
Recent initiatives, including (1) Remodel program, (2) Rewards program, and (3) Distribution center consolidation, have reducedreported Superstores profitability
Why Do We Like Borders?

10
Why Do We Like Borders? (cont’d)
Superstores are healthy, growing and improvingStable EBITDA margins (9.5% - 10+%) with high ROIC
Expected annual square footage growth of ~6%
Remodeling program will reduce Music category exposure
Opportunity to increase working capital turns
Mall and International segments are low ROIC businesses that can be monetized with minimal disruption
Estimated ~$200mm of Net Working Capital on an estimated ~$15mm of EBITDA contribution
Potentially “worth more dead than alive”
New Management is focused on rationalizing business

11
3. Extensive share repurchase program and newly hired CEO should help drive value creation
~$500mm of share repurchases in the past 2.5 years
Common shares outstanding reduced by ~ 20%
Company is repurchasing ~14% of market cap in the second half of 2006
New CEO George Jones joined in July
Why Do We Like Borders?
1. “Misunderstood Industry”
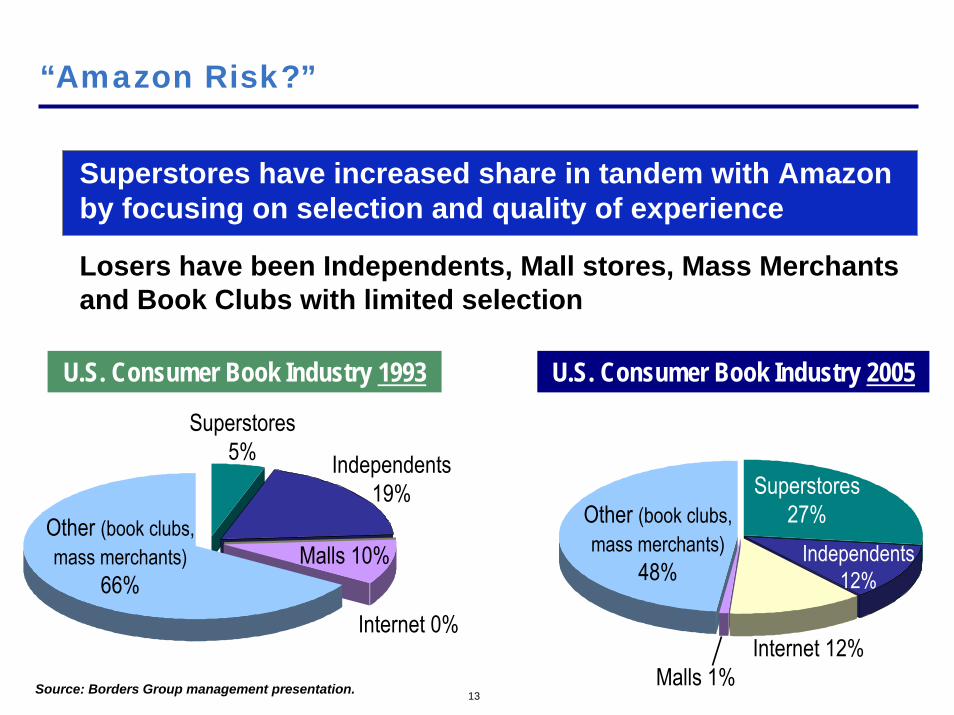
13
“Amazon Risk?”
Superstores have increased share in tandem with Amazon by focusing on selection and quality of experience
Losers have been Independents, Mall stores, Mass Merchants and Book Clubs with limited selection
Other (book clubs, mass merchants)
66%
Superstores 5% Independents
19%
Malls 10%
Superstores 27%
Independents 12%
Malls 1%Internet 12%
U.S. Consumer Book Industry 1993 U.S. Consumer Book Industry 2005
Other (book clubs, mass merchants)
48%
Internet 0%
Source: Borders Group management presentation.

14
Book Superstores are attractive “anchor” tenants
Favorable customer demographic – book buyers are well-educated, high-income customers
Superstores are “Mini Malls” with books as the anchor
High-quality customer experience
Borders ranked #2 in Overall Quality for Retailers in 2006 Harris Poll
Not just a book store: café, community events, meeting place
Customer spends an average of one hour in the store
Opportunity to sell more than books
Barnes and Noble is the second-largest retailer of coffee in U.S.
Borders achieving success with Seattle’s Best and Paperchase
Books Superstores Are Valuable Franchises

15
Gross Margin Stability at Superstores
Best sellers are ubiquitous and extremely price competitive, yet they represent less than 5% of typical superstore sales
Nearly all (~97%) book inventory is returnable to the publishers at cost
Increases gross profit margin stability
Book inventory is non-perishable and generally has limited “fad” risk
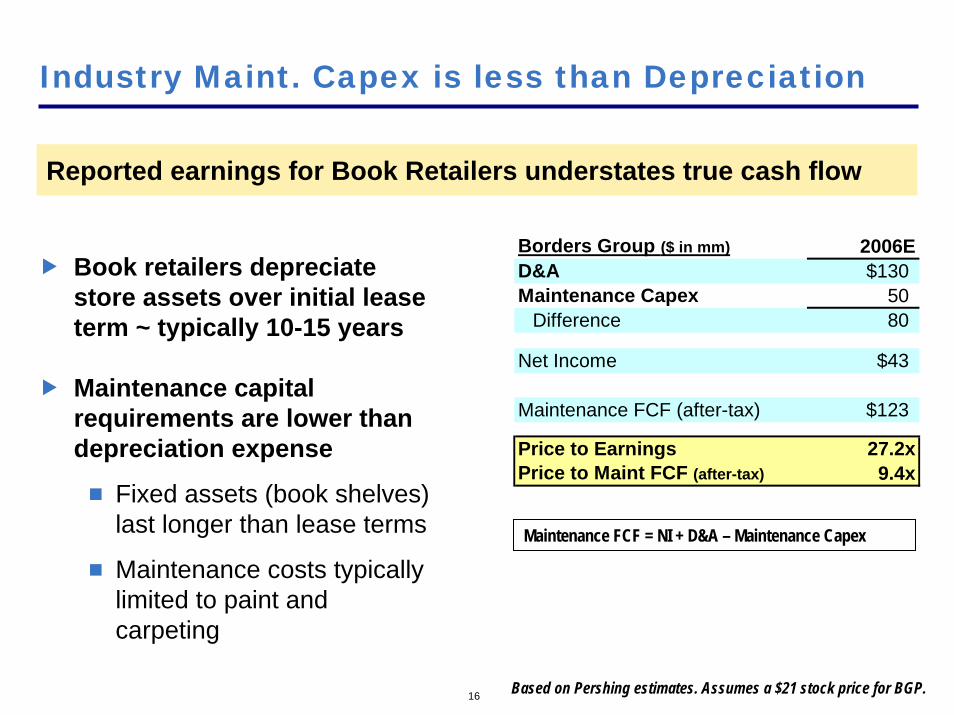
16
Industry Maint. Capex is less than Depreciation
Book retailers depreciate store assets over initial lease term ~ typically 10-15 years
Maintenance capital requirements are lower than depreciation expense
Fixed assets (book shelves) last longer than lease terms
Maintenance costs typically limited to paint and carpeting
Reported earnings for Book Retailers understates true cash flow
Maintenance FCF = NI + D&A – Maintenance Capex
Based on Pershing estimates. Assumes a $21 stock price for BGP.
Borders Group ($ in mm) 2006ED&A $130Maintenance Capex 50
Difference 80
Net Income $43
Maintenance FCF (after-tax) $123
Price to Earnings 27.2xPrice to Maint FCF (after-tax) 9.4x

2. High-Quality Businesses Obscured by Money-Losing Businesses
Superstores
Mall Stores
International

18
0.0%
2.0%
4.0%
6.0%
8.0%
10.0%
12.0%
2001 2002 2003 2004 2005
Healthy Superstores Obscured by Bad Businesses
Superstores
International
Mall Stores
Adjusted EBITDA Margins
Superstores profitability and stability have been obscured by the Mall and International businesses, which are currently being rationalized
Note: EBITDA Adjusted for non-cash asset impairment associated with store closures.

19
Within Superstores, there is Opportunity…
Superstores performance has also been masked by declining music sales and certain one-time costs in 2006
Company has initiated a Store Remodel Program
Reduce exposure to declining Music sales
Increase high-margin Paperchase and Coffee sales
Newly launched Rewards program and several one-time expenses have created noise in reported 2006 financials, obscuring results
Expenses for consolidating distribution centers, launching rewards program and remodeling store base
Superstores EBITDA could increase by 40+% by 2008 as result of improved product mix, unit growth and elimination of these one-time expenses

Borders Superstores

21
Superstores: “Mini Mall” with several “Tenants”
Books
Café
Paperchase
DVD
Music
“Anchor tenant.” Stable business
Seattle’s Best. “Mini-Starbucks.” High margin + growing
Specialty paper like Kate’s Paperie. High margin + growing
Growth slowing
Deteriorating rapidly

22
Typical store has 25,000 sq. ftUp to 200,000 titles of books, music, movies plus a Cafe
Attractive unit growth476 superstores
Current plan is to grow 30 units / year (~6% annually)
Unit economics:$2.4mm of invested capital ($1.2mm of fixed assets, $1.2mm of NWC)
Average unit sales of $5.7mm
Avg. 4-Wall EBITDA – Maint. Capex contribution of ~$700k
~29% “stabilized” unlevered ROIBased on Pershing estimates.
Superstores: Operating Data
$700$2,400
= 29%

23
Superstores Historical Financials
Over the last five years, the Superstores segment has generated steady Adj. EBITDA margins between 9.6% - 10.3%
($ in millions)
EBITDA adjusted for non-cash asset impairment associated with store closures.
2001 2002 2003 2004 2005Operating Data:Units 363 404 445 462 473
Growth 11.3% 10.1% 3.8% 2.4%
Reported SSS 2.0% -1.2% 1.2% 0.6% 1.1%
Financial DataSales 2,234 2,319 2,470 2,589 2,710
Growth 3.8% 6.5% 4.8% 4.7%
Adj. EBITDA 220 239 242 262 261Margin 9.8% 10.3% 9.8% 10.1% 9.6%Growth 8.5% 1.2% 8.6% -0.6%

24
Music Category Exposure Has Hurt
Excluding Music sales, Superstores same store sales (“SSS”) trends have averaged 1.5% more than average reported comparable sales, based on our estimates
2001 2002 2003 2004 2005Avg.
Reported Superstore SSS 2.0% (1.2%) 1.2% 0.6% 1.1% 0.7%
Estimated Music SSS (4.0%) (8.0%) (11.4%) (12.0%) (12.0%)Music % of Sales 22.0% 17.0% 16.0% 15.0% 11.0%Music Impact on Reported SSS (0.9%) (1.4%) (1.8%) (1.8%) (1.3%)
Avg.Est. Superstore SSS (ex-music) 2.9% 0.2% 3.0% 2.4% 2.4% 2.2%
Difference 0.9% 1.4% 1.8% 1.8% 1.3%

25
Remodeling program will reduce Music category exposure by ~50% and improve Coffee and Paperchase sales
Reducing Music category exposure and replacing with high-margin Paperchase category
Music margins are ~20% versus Paperchase margins of ~50%
Paperchase has higher sales per square foot than Music
Upgrading Café offering to Seattle’s Best Coffee (Starbuck’s subsidiary)
Significant financial benefits in Year 1Estimated storewide 2.6% sales lift
40bps of margin improvement due to mix shift to higher-margin products with minimal maintenance capital requirements
Remodels one year after conversion continue to outperform
Remodeling: Improving the Superstore

26
Remodeling: Attractive Use of Cash Flow
Based on the first year of remodel activity, the New Format Superstores should have over 22% return on remodel cap ex
Old New$ in thousands Format Format CommentaryRevenue $5,700 $5,848Sales Lift (Year 1) 2.6%
Incremental Sales $148Contribution Margin 35.0% Note: 40% current contribution marginProfit on Incremental Sales $52
Margin Benefit from Mix (Year 1) 40 bps Seattle's Best Coffee / Specialty Paper Margin Increase from Mix $23
Combined Margin Benefit $75Remodel Cost (net of W/C reduction of $15k) $335
ROIC (Year 1) 22.5%
Based on Pershing estimates and management guidance.

27
Newly launched Rewards Program has created noise in Superstores financials
What is the Rewards Program?5% of all purchases (triggered at $200 per Rewards customer) arecredited towards a Holiday Spending Account
“Use it or lose it”
What is the impact?Accrual assuming 100% redemption
Launch and accrual expenses have reduced YTD Superstores segment EBITDA compared to prior years
Rewards accruals of $8.4mmAdvertising and payroll for launch of $4.2mmReduced YTD EBITDA by 18%
Rewards Program Creating “Noise” in Financials

28
What will be the impact of Rewards going forward?
Q3 reported earnings will feel the most impactAccrual amount likely to accelerate as larger member base exceeds $200 spending level
Q3 is historically the weakest quarter, usually breakeven to slightly negative earnings
We expect that Q4 will see a positive impact from RewardsWe believe Q4 guidance conservatively assumes high redemption rate and no incremental sales
Prior year test markets showed positive impactComparable sales in test markets were higher – implying incremental sales
Avg. ticket w/ rewards credit was 2x avg. ticket w/o rewards credit
Rewards Program Creating “Noise” in Financials

29
One-Time Costs Expected in 2006E
One time P&L impact of Remodels: YTD $2.5mm
Redundant distribution center costs: YTD $7.8mm
Launch of Rewards:YTD: $4.2mm
Superstores Segment Financials($ in millions)
Based on Pershing estimates.
2005A 2006ESame store sales 1.1% 0.0%
Revenue $2,710 $2,795EBITDA 261 228
Margins 9.6% 8.2%
One time costs:Redundant Distribution Center Costs $10Advertising / G&A for Launch of Rewards 5Impact of Remodels 5Total $20
Pro Forma EBITDA $249Pro Forma Margins 8.9%

30
What Could Superstores EBITDA be in 2008?
$180
$200
$220
$240
$260
$280
$300
$320
$340
Superstores 2006E
EBITDA
One-time expenses in
2006 of ~$20mm
Remodeling & SSS leverage: 100bps margin
increase
2% comps and 30 new
units annually
EBIT
DA $ i
n m
illion
s
$228 8.2%
EBITDA Margin
$249 8.9%
$2898.9%
$322 9.9%
Margin41%
increase
Assuming 2% comps and the Company’s unit growth plan, if EBITDA margins were to improve 100bps by 2008 (returning to 5-year average levels), EBITDA could increase by 41% from “reported” levels
Avg. 5 year margins: 9.9%

31
Working Capital Opportunity
Potential for $130mm of cash flow generation (or ~12% of the current equity market value) through working capital improvements at Superstores over the next 2 years
Net Working Capital at Superstores currently at ~$550M
Company can reduce working capital by 10-15% near term and 30-40% in the long term
Consolidating distribution centers and new merchandising system
Increasing “face outs” / decreasing stock
Current Superstores inventory turns of ~1.7x
We have assumed Superstores segment achieves inventory turns equal to 2.2x, a discount to Barnes and Nobles at ~2.4x
Equals approximately ~$130mm of free cash flow generation
Mall Stores

33
Obsolete Format: Mall stores have difficulty competing with Mass Merchants on price and with book superstores on selection / “experience”
~600 Waldenbooks stores
Typical store has 3,000 sq. ft and 30,000 titles
Best sellers are a higher % of sales
Weak margins / deteriorating business
2006E Revenues of $615mm and EBITDA of $5m
Seasonal Calendar Kiosk business is the main EBITDA contributor
Barnes and Noble has exited nearly all mall locations…
Mall Stores: Obsolete Format

34
Mall Stores: Deteriorating Business
$23
$44
$61$61$67
7.2%
3.0%
7.4% 7.5%
5.6%
$0
$10
$20
$30
$40
$50
$60
$70
$80
2001 2002 2003 2004 20050.0%
1.0%
2.0%
3.0%
4.0%
5.0%
6.0%
7.0%
8.0%
Mall segment Adjusted EBITDA margins in 2005 were 3%, having fallen ~60% since 2003
Adjusted EBITDAMargins
AdjustedEBITDA($ in millions)
Note: EBITDA Adjusted for non-cash asset impairment associated with store closures.

35
Mall Stores: Rationalization Plan
410 Mall Stores (~70% of total) have leases expiring in 2006
Management says that 200 are profitable, 200 are marginal, and 200 are losing money
Plan to close unprofitable stores as leases expire
Remaining stores negotiate rent reductions with 1-year renewals

36
Mall Stores: “Worth More Dead than Alive”
Assuming $150,000 of Net Working Capital on average per Waldenbooks store, we believe there is $90mm of total Net Working Capital trapped in the Mall segment
Waldenbooks Total Units 600 Net Working Capital per store ($000) $150kTotal Net Working Capital ($ in mm) $90mm
2006E EBITDA ~$5mm

InternationalU.K. Australia

38
U.K. stores
37 Borders Superstores
31 Books, Etc. (small format)
90 Paperchase
Australia / New Zealand: 18 Superstores
2005 EBITDA margins of 4.3%
Significantly lower than 2005 Superstore margins of 9.6%
We estimate International 2006E EBITDA margins of 1.5% (assuming revenue of $650mm and EBITDA $10mm)
International Stores
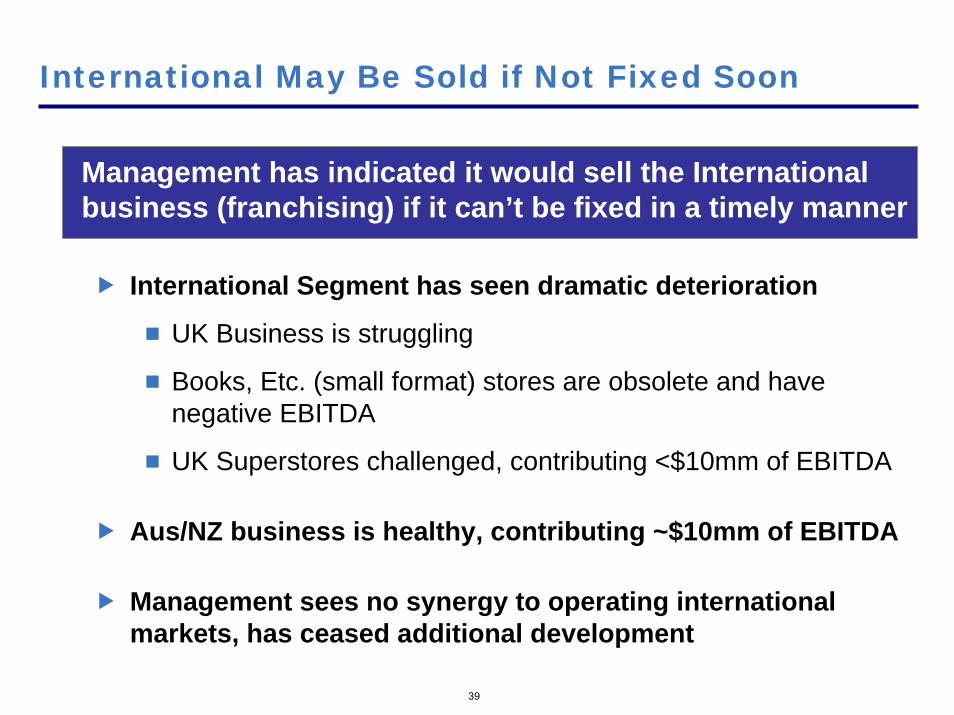
39
International May Be Sold if Not Fixed Soon
Management has indicated it would sell the International business (franchising) if it can’t be fixed in a timely manner
International Segment has seen dramatic deterioration
UK Business is struggling
Books, Etc. (small format) stores are obsolete and have negative EBITDA
UK Superstores challenged, contributing <$10mm of EBITDA
Aus/NZ business is healthy, contributing ~$10mm of EBITDA
Management sees no synergy to operating international markets, has ceased additional development

40
International: Worth More Dead than Alive?
Based on our assumptions, we believe there is approximately $110mm of Net Working Capital in the International Stores
NWC / # of Net WorkingStore Units Capital (mm)
UK Superstores $2.2mm 37 $80
Books, Etc. (small format) $285k 31 9
Australia / NZ Superstores $900k 18 16
Other (Puerto Rico, Singapore, etc…) $1.2mm 4 5Total (in mm) $110
2006E International Stores EBITDA (mm) ~$10
3. Other Factors:Share Repurchase Activity and New CEO
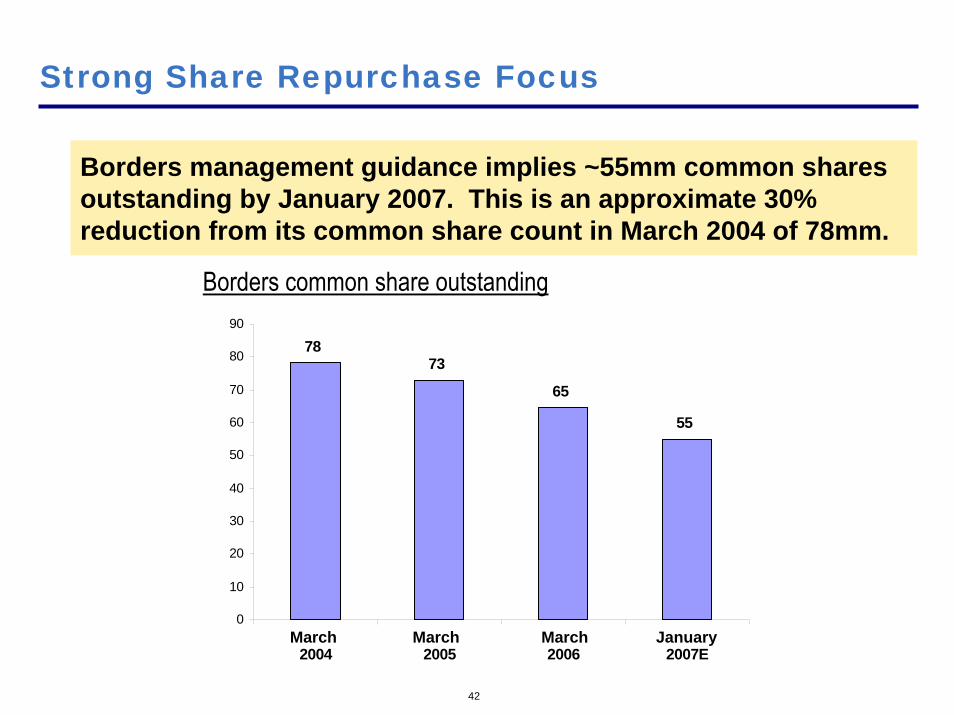
42
7873
65
55
0
10
20
30
40
50
60
70
80
90
2004 2005 2006 2007E
Borders common share outstanding
Strong Share Repurchase Focus
Borders management guidance implies ~55mm common shares outstanding by January 2007. This is an approximate 30% reduction from its common share count in March 2004 of 78mm.
March March March January

43
New CEO: Focused on Returns
New CEO, George Jones
Joined in July
Purchased ~$1mm of stock
Retail merchandising and operations expertise (Target, Warner Bros., Saks)
Renewed sense of urgency
Fixing / rationalizing the business
Emphasis on returns

Valuation
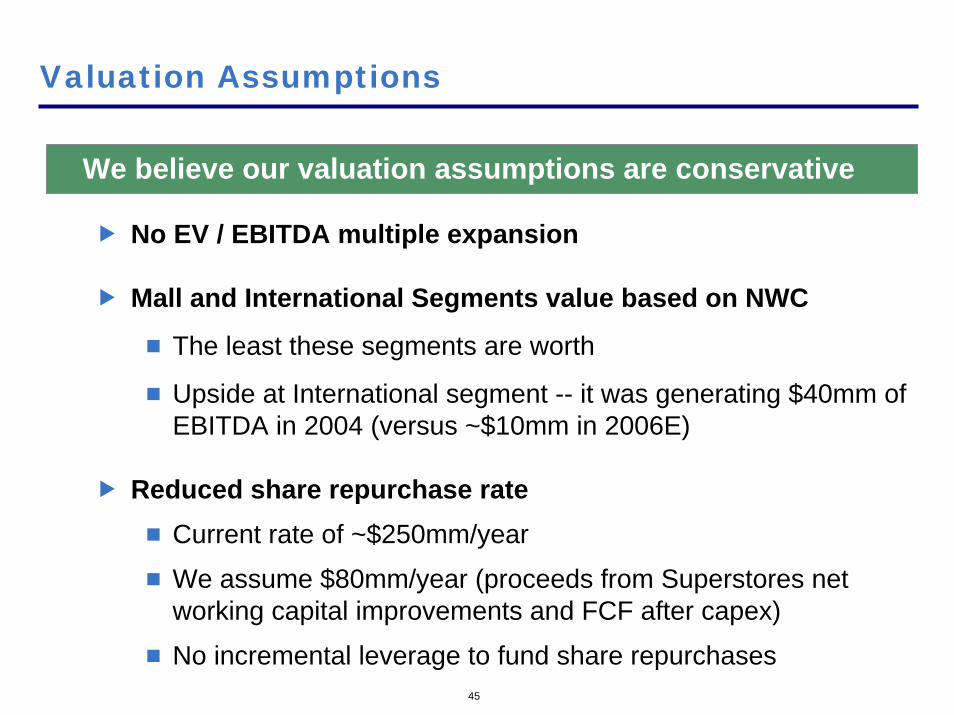
45
Valuation Assumptions
We believe our valuation assumptions are conservative
No EV / EBITDA multiple expansion
Mall and International Segments value based on NWC
The least these segments are worth
Upside at International segment -- it was generating $40mm of EBITDA in 2004 (versus ~$10mm in 2006E)
Reduced share repurchase rateCurrent rate of ~$250mm/year
We assume $80mm/year (proceeds from Superstores net working capital improvements and FCF after capex)
No incremental leverage to fund share repurchases
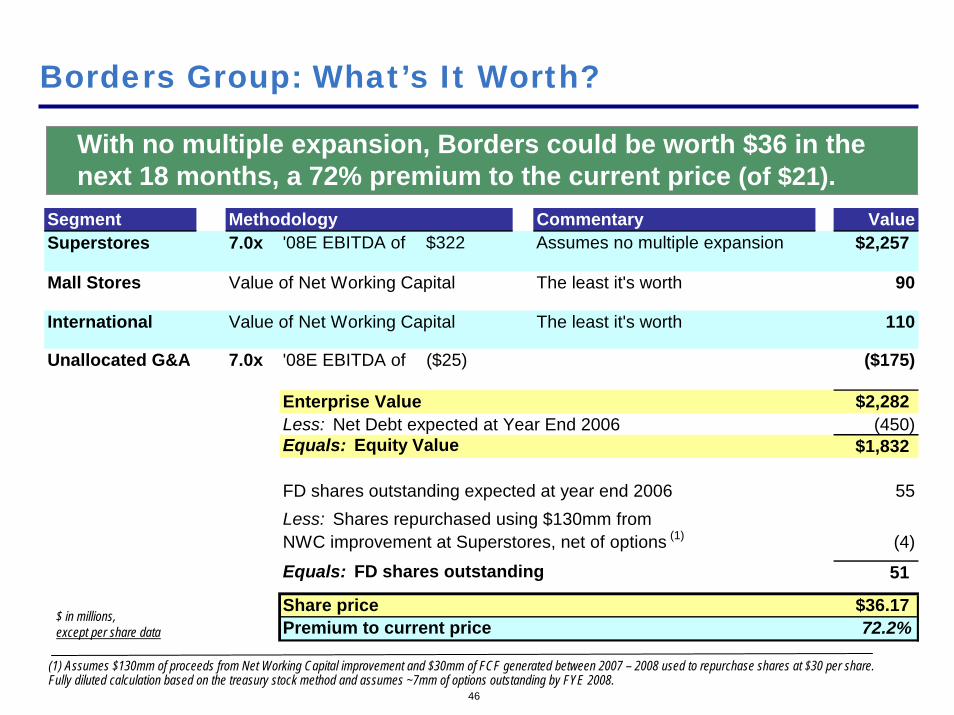
46
Borders Group: What’s It Worth?
With no multiple expansion, Borders could be worth $36 in the next 18 months, a 72% premium to the current price (of $21).
Segment Methodology Commentary ValueSuperstores 7.0x '08E EBITDA of $322 Assumes no multiple expansion $2,257
Mall Stores Value of Net Working Capital The least it's worth 90
International Value of Net Working Capital The least it's worth 110
Unallocated G&A 7.0x '08E EBITDA of ($25) ($175)
Enterprise Value $2,282Less: Net Debt expected at Year End 2006 (450)Equals: Equity Value $1,832
FD shares outstanding expected at year end 2006 55Less: Shares repurchased using $130mm from NWC improvement at Superstores, net of options (1) (4)
Equals: FD shares outstanding 51
Share price $36.17Premium to current price 72.2%
(1) Assumes $130mm of proceeds from Net Working Capital improvement and $30mm of FCF generated between 2007 – 2008 used to repurchase shares at $30 per share. Fully diluted calculation based on the treasury stock method and assumes ~7mm of options outstanding by FYE 2008.
$ in millions, except per share data
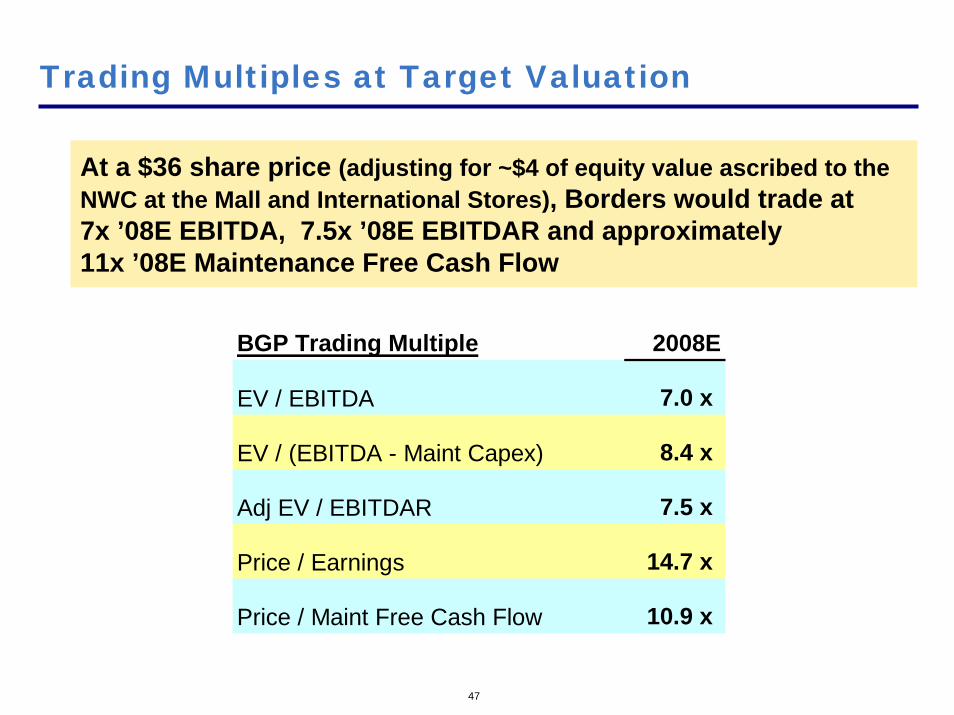
47
Trading Multiples at Target Valuation
At a $36 share price (adjusting for ~$4 of equity value ascribed to the NWC at the Mall and International Stores), Borders would trade at 7x ’08E EBITDA, 7.5x ’08E EBITDAR and approximately 11x ’08E Maintenance Free Cash Flow
BGP Trading Multiple 2008E
EV / EBITDA 7.0 x
EV / (EBITDA - Maint Capex) 8.4 x
Adj EV / EBITDAR 7.5 x
Price / Earnings 14.7 x
Price / Maint Free Cash Flow 10.9 x

48
Recent LBO Leverage Levels
At a $36 price, Borders would trade at 7.5x ’08E EBITDAR, only a slight premium to 6.8x, the average of total leverage levels used in several recent retail LBO transactions
Purchase Total LeveragePrice Adj. Debt/
Transaction: EV / EBITDA EBITDARLinens 'n Things 7.7 x 6.2 x Burlington Coat Factory 7.4 x 6.5 x The Sports Authority 7.7 x 6.8 x Michael's Stores 11.0 x 7.8 x
Average 8.5 x 6.8 x

Concluding Thoughts

50
Borders is similar to other investments where we have had success
Value of high-quality segment obscured by performance of low-return segments
Traditional sentiment on the Company is “negative”or neutral at best
Market is more focused on consolidated same store sales rather than the underlying business quality
New CEO is focused on making changes to fix the business
Concluding Thoughts

51
Concluding Thoughts…
Investment requires a long-term view…
Near-term performance impacted by current business structure and initiatives (Rewards, Remodeling, etc…)
Near-term risk is somewhat mitigated by an upcoming slate of strong book releases
We believe it will take time for management to realize full opportunity


A TIP for Target Shareholders
Pershing Square Capital Management, L.P.
October 29, 2008

DisclaimerThe information contained in this presentation (the “Information”) is based on publicly available information about Target Corporation (“Target”). None of Pershing Square Capital Management, L.P., its affiliates and any of their respective officers, directors and employees (collectively, “Pershing”), nor any representative of Pershing, has independently verified any of the Information. Pershing recognizes that there may be confidential or otherwise non-public information in Target’s possession that could lead others to disagree with Pershing’s conclusions. The sole purpose of presenting the Information is to inform analysts and shareholders about the transaction described in this presentation (the “Transaction”). This presentation does not constitute an offer or a solicitation of any kind.
Neither Pershing nor any of its representatives makes any representation or warranty, express or implied, as to the accuracy or completeness of the Information or any other written or oral communication made in connection with this presentation or the Transaction. The Information includes certain forward-looking statements, estimates and projections with respect to the anticipated future financial, operating and stock market performance of Target in the absence of the Transaction and the two public companies that may result if the Transaction is completed. Such statements, estimates and projections may prove to be substantially inaccurate, reflect significant assumptions and judgments that may prove to be substantially inaccurate, and are subject to significant uncertainties and contingencies beyond Pershing’s control, including those described under the caption “Risk Factors” in Target’s filings with the Securities and Exchange Commission as well as general economic, credit, capital and stock market conditions, competitive pressures, geopolitical conditions, inflation, interest rate fluctuations, regulatory and tax matters and other factors.
Pershing and its representatives expressly disclaim any and all liability relating to or resulting from the use of the Information or any errors therein or omissions therefrom, including under applicable securities laws. The Information does not purport to include all information that may be material with respect to the Transaction or Target. Thus, shareholders and others should conduct their own independent investigation and analysis of Target, the Transaction and the Information.
The Information is not intended to provide the basis for fully evaluating, and should not be considered a recommendation with respect to, the Transaction, Target, the securities of Target or any other matter. Except where otherwise indicated, the Information speaks as of the date hereof. Neither Pershing nor any of its representatives undertakes any obligation to correct, update or revise the Information or to otherwise provide any additional materials.
The preparation and distribution of this presentation should not be taken as any form of commitment on the part of Pershing to take any action in connection with the Transaction.
Pershing is in the business of buying and selling securities. It has, and may in the future, buy, sell or change the form of its position in Target for any or no reason.
IRS Circular 230 Disclosure: To ensure compliance with requirements imposed by the IRS, we inform you that (i) any discussion of U.S. tax matters contained in this communication (including any attachments) is not intended or written to be used, and cannot be used, for the purpose of avoiding penalties under the Internal Revenue Code; (ii) any such discussion of tax matters is written in connection with the promotion or marketing of the matters addressed; and (iii) you should seek advice from an independent advisor.
1
Pershing’s Investment in Target
2
Pershing initiated its investment in Target (“Company”) in April 2007
We currently have beneficial ownership of slightly less than 10% of the Company
Since May 2008, we have been discussing a potential Transaction with Target management
Pershing has improved its initial Transaction to address issues raised by the Company. Today, we are presenting this revised Transaction to the Company, its shareholders, and members of the investment community
3
Pershing’s Relationship with Target
Since our first meeting with management in the summer of 2007, Pershing has enjoyed a very constructive relationship with Target
We view Target’s management as the best in the Retail Industry
We appreciate management’s willingness to listen to and evaluate ideas proposed by shareholders
Our goal is to work with management and other shareholders to find the best strategic and value-maximizing outcome for the Company, its employees, and its shareholders

Why Are We Going Public?
4
Given the materiality of the Transaction, Pershing thought it would be beneficial to share the idea publicly with Target stakeholders and the investment community
The Transaction is important enough to warrant “testing” with shareholders
We think the insights gained by sharing the Transaction publiclywill be of tremendous benefit to Target as well as other stakeholders
Target is currently evaluating the Transaction
By going public with our presentation in advance of Target’s decision regarding the Transaction, shareholders and the investment community can provide their input on the Transaction’s merits
5
Significant Preparation and Analysis
To assist in preparing this presentation, Pershing retained UBS Investment Bank (“UBS”) and Sullivan & Cromwell LLP (“S&C”) as financial and legal advisors
Pershing and its advisors’ analyses are based on publicly available information
UBS has provided financial advisory services
S&C has provided legal, structural, and tax advisory services
Note: All financials in this presentation are based on Calendar Year

6
Agenda
Objectives
The Transaction
Transaction Rationale
Valuation
Appendix
■ Detailed Valuation Analysis
■ Credit Rating Analysis
■ Structural and Legal Considerations

Objectives

8
Target: Retail and Real Estate Operations
Real Estate OperationsRetail Operations■ Iconic U.S. retail brand
■ Best-in-class operator with distinctive merchandising strategy
■ 1,685 stores in 48 states
■ Best management team in the retail industry
■ Attractive growth profile, driven by mid-to-high single-digit square footage growth and market share gains
■ Recently sold an undivided interest in credit card receivables
■ High-quality owned real estate in attractive suburban and urban locations
■ Significant value embedded in real estate, not accounted for in public market valuation
■ Owns ~95% of its retail buildings and ~85% of the land under its retail locations
■ Owns ~84% of its distribution centers (“DCs”) and ~81% of the land under its DCs
■ Facilities Management Services comprising hundreds of employees responsible for property maintenance

34% 34%
58% 63%
68%
87% 87% 92% 95%
0
10
20
30
40
50
60
70
80
90
100
% U
nits
Ow
ned
(Bui
ldin
gs)1
Significant Real Estate Ownership
Target owns the highest percentage of its real estate compared to other big box retailers
% DCs owned(3): 84% ND 2% 84% 76% 55% 89% 54% ND85% 79% ND ND 55% ND 35% ND 27%% owned units/land(2):
“ND” represents Not Disclosed(1) Represents % owned stores (includes owned stores on leased land)(2) Represents % owned stores on owned land only(3) Represents % owned DCs (includes owned DCs on leased land) 9

$ in billions 2008EExisting Retail EBITDA $6.3Less: Additional Rent (2.5)Equals: PF Retail EBITDA $3.8
Implied EV of '08E EBITDAPro Forma Target Corp 7.0x $26.9
What if Target Were to Rent its Real Estate?
Target Real Estate Co Pro Forma Target Corp
Target’s resulting EBITDA after rent expense would be $3.8bn
10
(1) Implied cap rate of 8.5% on 35mm square feet of distribution facilities, valued at $50 per square foot (2) Assumes for illustrative purposes that the remaining 53% interest in credit card receivables is sold to an Investment Partner for $4.4bn and that Target retains $150mm of credit card income
Assuming that Target were to rent all of its owned store locations at an estimated market rent of 4.25% of store sales (or approximately $13/sq. ft.) and its owned distribution facilities at $4.25/sq. ft., Target would pay an additional rent of $2.5bn in 2008
(1)
(2)
$ in billions 2008ETarget Retail Sales $64.9Implied Retail Rent as % of Sales 4.25%Percentage of Owned Real Estate 85%
Retail Rental Income $2.4Dist. Facilities Rental Income 0.2Real Estate 4-Wall EBITDA $2.5

$39 Billion of Real Estate Replacement Value
11
Assuming that on average, a new store costs $26mm to zone, develop and build or approximately $197/sq. ft. (1) and that each Distribution Facility costs $70mm or approximately $50/sq. ft. (1), the replacement cost of Target’s owned real estate (excluding the value of its buildings on ground leased land and its existing leases) is approximately $39bn
(1) Based on average store size of 132k square feet, and DCs & WHs size of 1.4mm square feet(2) Analysis excludes the value of owned buildings on third-party ground leased land; assumes cost of a Target store of $26mm ($13mm building and $13mm land) and cost of distribution facility and warehouse of $70mm ($50mm building and $20mm land)(3) Assumes 1,438 stores, and 25 distribution facilities and warehouses on owned land in 2008E
Replacement Value of Owned Land and Buildings (2), (3)
2008E Retail Real Estate:2008E Estimated Owned Value / Total Value
Total Sq. Ft. (mm) % Owned Sq. Ft. (mm) Sq. Ft. ($bn)222 85% 189 $197 $37.4
2008E DCs and WHs:2008E Estimated Owned Value / Total Value
Total Sq. Ft. (mm) % Owned Sq. Ft. (mm) Sq. Ft. ($bn)44 81% 35 $50 $1.8
Total Real Estate Replacement Value ($bn) $39.1Implied Cap Rate @ $2.5bn of Estimated Market Rent 6.4%

Market Assigns Little Value to Target’s Real Estate
12
(1) Based on 2008 Q2 company filings and a 20-day trading average stock price as of 10/24/08(2) Assumes for illustrative purposes that the remaining 53% interest in credit card receivables is sold to an Investment Partner for $4.4bn and that Target retains $150mm of credit card income
Assuming Target were to rent its owned real estate and using a 7.0x ’08E EBITDA multiple on the pro forma retail business, the 20-day trading average stock price of $40 implies only $13bn of value for Target’s owned real estate, a significant discount to book and replacement value
$ in billionsCurrent TGT Enterprise Value @ $40/Share $48.3 (1)
Less : PF Target Corp (26.9) (2)
Less : Credit Card Receivables (8.0) Equals : Implied Real Estate Value $13.4
Gross Book Value of Land and Buildings $25.2 (1)
Discount to Gross Book Value 47%
Replacement Value of Owned Real Estate $39.1Discount to Replacement Value 66%

13
Objectives
Retain complete control of its buildings and its brand
Retain 100% flexibility with respect to its construction, remodeling, and relocation plans
Improve the Company’s free cash flow and access to capital
Increase the Company’s ROIC and lower its cost of capital
Maintain an investment grade credit rating
Increase the Company’s EPS growth rate
Minimize tax leakage and friction costs
In considering alternatives for the Company, Pershing Square’s objective was to eliminate the stock market’s ascribed discount to the intrinsic value of Target’s real estate and allow the Company to:

Value destruction due to tax leakage, both at the corporate and shareholder levels
In the course of our work, we reviewed several structures:
14
Several Alternatives Were Reviewed
Transaction Alternatives
2. Taxable Spin-off of all owned land and buildings
3. Large sale-leaseback transaction
1. Tax-Free Spin-off of all owned land and buildings
Value destruction due to tax leakage at the corporate level
Transaction execution may be difficult
Difficult to maintain sufficient control over buildings and achieve tax-free status
Lease life (including fixed rate renewals) limited to 75% of the useful life of the buildings
Gating Items
Pershing concluded that the above alternatives were not optimal,given the Company’s strategy and objectives

Pershing has identified a Transaction which will achieve all of the stated objectives
The Transaction is consistent with the way Target owns some of its real estate today
The Transaction will create tremendous shareholder value
15

The Transaction
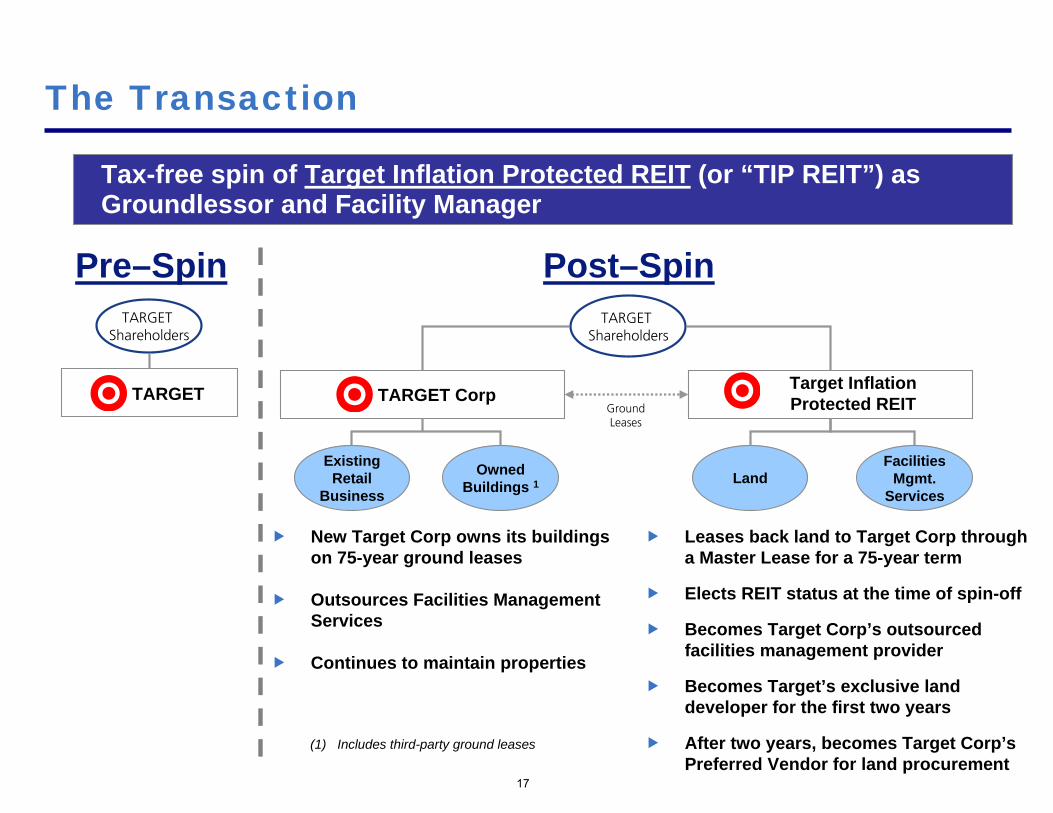
The Transaction
Tax-free spin of Target Inflation Protected REIT (or “TIP REIT”) as Groundlessor and Facility Manager
Pre–SpinTARGET
Shareholders
TARGET
New Target Corp owns its buildings on 75-year ground leases
Outsources Facilities Management Services
Continues to maintain properties
Leases back land to Target Corp through a Master Lease for a 75-year term
Elects REIT status at the time of spin-off
Becomes Target Corp’s outsourced facilities management provider
Becomes Target’s exclusive land developer for the first two years
After two years, becomes Target Corp’s Preferred Vendor for land procurement
Post–SpinTARGET
Shareholders
Ground Leases
LandFacilities
Mgmt.Services
Target Inflation Protected REIT
ExistingRetail
Business
OwnedBuildings 1
TARGET Corp
(1) Includes third-party ground leases
17

Solving a Retailer’s Real Estate Dilemma
TIP REIT
Question: How can a Retailer unlock the value of its real estate without losing control of its buildings?
Answer: Tax-free spin-off of an active business that ground leases the land back to the Retailer
Retailer retains ownership of its buildings and 100% control with respect to its construction, remodeling, and relocation plans
Retailer becomes a 75-year ground lessee for its owned properties on attractive terms with no financial covenants
Retailer gets an unlevered business partner (a land-only REIT) that can more efficiently finance future land development
18
Land under Stores and DCs
Facilities Mgmt.Services

Unlocking Immense Real Estate Value
$40/Share (1) Inflation Protected Treasury Securities (TIPS) (3)
Large Cap REITs (1)
Target’s Market Valuation (1)
2009E EV / EBITDA
Inflation Protected Securities / REIT Market Valuations
2009E EV / EBITDA
6.0x 33.3x15.7xRecent “Big Box” Ground
Lease (2)
17.0x
REITs, private market ground leases, and inflation-protected securities all trade at much higher valuation multiples than Target’s multiple, at only 6.0x ‘09E EV/EBITDA, based on a 20-day trading average stock price of $40
The Transaction creates immense and instant value because 22% of Target’s current EBITDA will be valued at a significantly higher multiple than where Target trades today
19
(1) Based on a 20-day trading average as of 10/24/08(2) Based on mid-point precedent cap rate of 5.9%(3) Based on current 20-year TIP yield of 3.0%

Execution is Not Impacted by the Current Markets
Given the global credit markets today, the only strategic transactions that can take place are those that do not require access to capital:
Spin-offs
Stock-for-stock mergers / acquisitions
Acquisitions by cash-rich acquirors
The Transaction is structured as a spin-off where each current shareholder will receive pro rata shares in TIP REIT
No equity or debt capital is required to spin off TIP REIT
Target does not need access to the capital markets to consummate this Transaction
20

Transaction Plan: How Would it Happen?
Step 1: The existing company (“Target Corp”) forms a new subsidiary (“TIP REIT”) and transfers to it the Facilities Management Services business, the owned land under the stores, and the owned land under the distribution facilities
Transaction DescriptionAsset Contribution
75-year
Master LeaseTarget Corp
LandFacilities
ManagementServices
TIP REIT
Target Corp
TIP REITLandFacilities
ManagementServices
Land LeaseStep 2: TIP REIT leases the land back to Target Corp through a Master Lease for a 75-year term
1
2
21

Transaction Plan (cont’d)Transaction DescriptionSpin-off and REIT Election
E&P Purge
Step 3: Target Corp spins off TIP REIT to its shareholders pro rata and tax-free
Step 4: TIP REIT elects REIT status effective immediately
Simultaneously, TIP REIT drops the Facilities Management Services business into a new corporation, a taxable REIT subsidiary (TRS)
Step 5: TIP REIT pays a taxable dividend (at the 15% dividend tax rate to non-corporate taxpayers) to shareholders equal to its allocated portion of Target’s $16bn of retained Earnings and Profits (“E&P”), estimated to be $8bn based on the implied mid-point valuation of TIP REIT/Target Corp
20% of the dividend ($1.6bn) may be paid in cash with the remaining paid in TIP REIT common stock
This cash dividend can be deferred until the end of the calendar year in which the REIT election occurs
3
4
TargetCorp
Land
TIP REIT
Shareholders
Tax-FreeSpin-off
Facilities Mgmt Services
(TRS)
5
Shareholders
Land
TargetCorpTIP REIT
75-year Lease
$8bn Taxable Dividend
(E&P Purge)
Facilities Mgmt Services
(TRS)
22

Illustrative Master Lease Term Sheet
Lessee
Lessor
Leased Property
Term
Rate
Financial Covenants
Maintenance of Buildings
Lease Structure
The lease is intended to be treated as a lease for tax purposes; lessor will be treated as the ownerNote: The lease is assumed to be treated as an operating lease for accounting purposes
Target Corp
TIP REIT
Land in fee under stores and distribution centers
75-year term
None
Flat dollar amounts per year with annual increasesFor this Transaction we have assumed annual increases based on CPI increases
Target Corp will have the right to re-model or tear down and rebuild stores as it sees fit
Preferred Vendor
Agreement
For the first 2 years post-Transaction, TIP REIT will be Target Corp’s exclusive land developerThereafter, TIP REIT will become Target Corp’s preferred vendor for future land procurement / development needs
23
Sublease Target Corp may sublease one or more sites but no sublease would release Target Corp from its obligations under the lease

Ongoing Relationships
TIP REIT will provide Facilities Management Services to Target Corp under a long-term agreement
Arm’s-length termsTIP REIT expected to continue to perform Facilities Management Services for third parties after the spin-off
Target Corp agrees to use TIP REIT as its land procurement developer for the first two years after the spin-off on agreed-upon terms
Creates a contractual 2-year development pipeline for TIP REIT and a funding sourcefor Target Corp
Afterwards, Target Corp will grant TIP REIT preferred vendor status for Target Corp’s land procurement needs on market terms for future Target stores
Under this Preferred Vendor Agreement, it is anticipated that TIP REIT will be Target Corp’s land procurement developer in the future
After the spin-off, TIP REIT and Target Corp may also share overlapping board members The number of overlapping board members would comprise a minority of each boardThere may be restrictions on the duration of the overlap
Post separation, Target Corp and TIP REIT will continue to be closely aligned, but on an arm’s-length basis
24

25
Transaction Assumptions
Lease Terms’09E rent/square foot on land for stores — $7/sq. ft.; equals to 7% of $100/sq. ft.’09E rent/square foot on land for distribution centers and warehouses — $1.25/sq. ft.Rental rate grows based on CPI (assumes CPI = 2.5%)
Credit Card Business
(Both Transaction and Standalone)
Target sells 53% remaining interest of credit card portfolio$4.4bn of proceeds used to pay down debt (including all securitized debt)Elimination of $3.6bn JPMorgan financing
Target retains $150mm of pre-tax earnings stream from its credit card business in partnershiptransaction
Capital Structure
After reducing $4.4bn of debt from the sale of the remaining 53% interest of CC business (and accordingly eliminating the JPMorgan credit card liability), we have assumed all existing debt stays at Target CorpFlexibility to re-allocate debt between Target Corp and TIP REIT
Capital Expenditures
Target Corp funds all maintenance capex as well as all building developmentTIP REIT funds all new Target store land procurement, development and improvement costs ($100/sq. ft.)
Facilities Management
Services
Assumes $125mm of ’09E internal Facilities Management Services expense at Target CorpAssumes TIP REIT receives $144mm in revenues from Target Corp and third parties, expenses $125mm of costs and earns $19mm in EBIT, implying a 13% EBIT margin in 2009E
Dividends 100% of AFFO distributed at TIP REITResults in total dividends to shareholders of $1.86/share in PF2009E vs. current $0.60/share
The following transaction assumptions were used for an illustrative 01/01/09 transaction:
TIP REIT G&A Assumes $20mm of G&A allocated to TIP REIT and incremental $15mm of standalone costs in ’08E
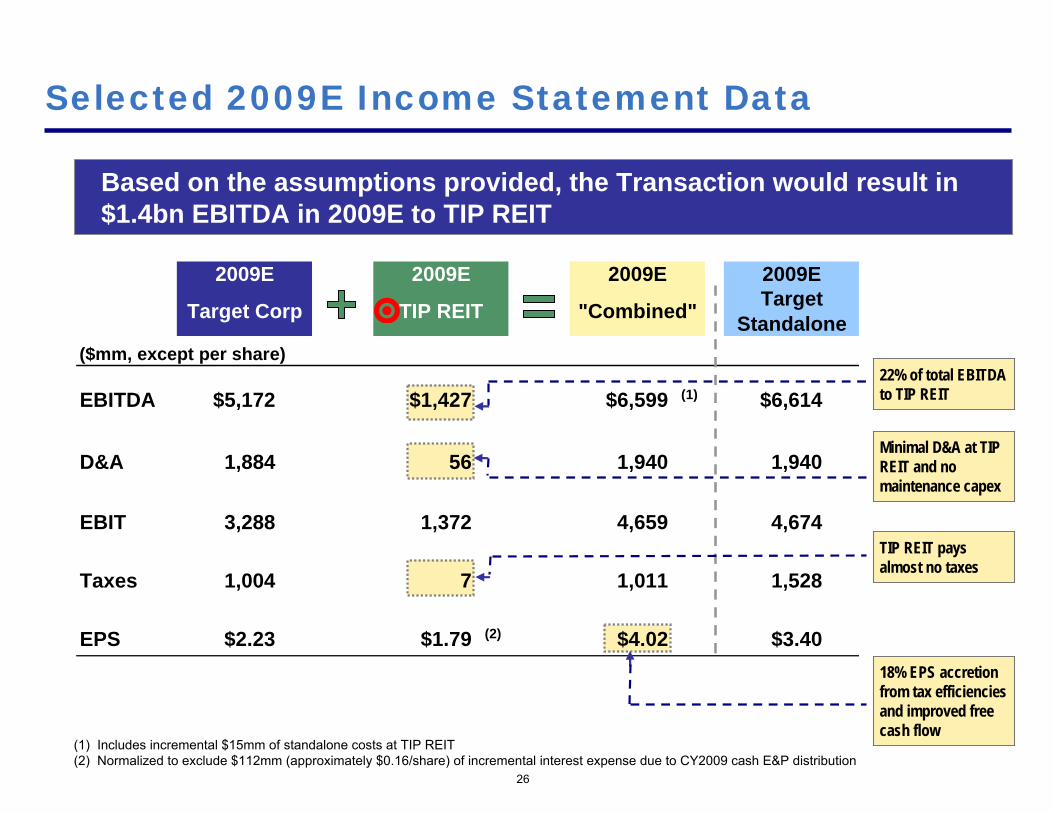
2009E 2009E 2009E 2009E
Target Corp TIP REIT "Combined" Target Standalone
($mm, except per share)
EBITDA $5,172 $1,427 $6,599 (1) $6,614
D&A 1,884 56 1,940 1,940
EBIT 3,288 1,372 4,659 4,674
Taxes 1,004 7 1,011 1,528
EPS $2.23 $1.79 (2) $4.02 $3.40
Selected 2009E Income Statement Data
26
22% of total EBITDA to TIP REIT
Minimal D&A at TIP REIT and no maintenance capex
TIP REIT pays almost no taxes
18% EPS accretion from tax efficiencies and improved free cash flow
Based on the assumptions provided, the Transaction would result in $1.4bn EBITDA in 2009E to TIP REIT
(1) Includes incremental $15mm of standalone costs at TIP REIT(2) Normalized to exclude $112mm (approximately $0.16/share) of incremental interest expense due to CY2009 cash E&P distribution

27
2009E Detailed Income Statement Data
The table below sets forth the Income Statements for the two entities2009E 2009E Intercompany 2009E
($mm) Target Corp TIP REIT Adjustments "Combined"
P&L Data:Retail Revenue $68,249 – – $68,249Rental Revenue – 1,444 (1,444) – Facilities Management Revenue 1 – 144 (144) – Total Revenue $68,249 $1,587 ($1,587) $68,249
COGS (47,777) – – (47,777)Gross Margin 20,472 1,587 (1,587) 20,472 Gross Margin (%) 30.0% 100.0% 30.0%
Less: Existing Rent Expense (173) – – (173)Less: Incremental Ground Lease Expense payable to TIP REIT 2 (1,444) – 1,444 – Less: SG&A (excluding rent expense) (13,814) (20) – (13,834)Less: Incremental Standalone Cost 3 – (15) – (15)Less: Facilities Management Expense 1 (19) (125) 144 – Plus: Credit Card EBITDA 4 150 – – 150Equals: EBITDA $5,172 $1,427 – $6,599 % of Total 78.4% 21.6% 100.0%
Less: Depreciation and Amortization (1,884) (56) – (1,940)Equals: EBIT $3,288 $1,372 – $4,659 % of Total 70.6% 29.4% 100.0%
(1) Reflects payment to TIP REIT of $144mm less assumed expense of $125mm(2) Assumes rent of $7.00/sq. ft. on store land and $1.25/sq. ft. on DCs and WHs land for CY 2009E(3) Incremental standalone cost of TIP REIT(4) Assumes the sale of the remaining 53% interest on credit card receivables on 01/01/09, with Target retaining $150mm of credit card EBITDA

$3.92
$2.68
$1.86
$0
$1
$2
$3
$4
$5
$6
Target Target "Combined"
Mai
nten
ance
FC
F/Sh
are
TIP REIT
Target Corp
$4.54
Target Standalone
16%
2009E Maintenance Free Cash Flows
28
The Transaction achieves significant cash flow savings given the tax-efficient structure for owning land
2009E Maintenance Free Cash Flow per Share (1)
(1) Includes cost of store remodeling; normalized to exclude $112mm (approximately $0.16/share) of incremental interest expense due to CY2009 cash E&P distribution

2009E 2009E 2009E 2009E($mm, except per share data) Target Corp 1 TIP REIT "Combined" Standalone 1
Cash Flow Data:EBITDA $5,172 $1,427 $6,599 $6,614Less: Maintenance Capex (1,714) – (1,714) (1,714)Less: Interest Expense 2 (673) (76) (748) (694)Less: Taxes 3 (1,004) (7) (1,011) (1,528)Plus: Change in Net Working Capital 79 – 79 79Plus: Other 73 – 73 73Equals: Maintenance Free Cash Flow $1,933 $1,344 $3,278 $2,830Weighted Average Shares Outstanding 722 722 721Maintenance FCF/Share $2.68 $1.86 $4.54 $3.92
Maintenance FCF/share accretion ($)
Maintenance FCF/share accretion (%)
(1) Assumes sale of remaining 53% interest on credit card receivables for $4.4bn on 01/01/09 with Target retaining $150mm of credit card EBITDA(2) Assumes interest rate on debt of 6.2% at Target Corp and 7.0% at TIP REIT; normalized to exclude $112mm of incremental interest expense due to CY2009 cash E&P distribution(3) Assumes tax rate of 38% for Target Corp and TIP REIT Facilities Management Services business
29
Detailed 2009E Maintenance Free Cash Flows
The Transaction achieves significant cash flow savings given the tax-efficient structure for owning land
$0.62
16%

$0
$20
$40
$60
$80
Target (20-Day Avg. Price) ¹ Target REIT Spin-Off ² 12-Month Price Target ²
$/Sh
are
TIP REIT
Target CorpTarget
Standalone
74%
$40
$70
$38
$32 $42
$42
$83
TIP REIT
Target Corp
Valuation Summary
30
Based on the assumptions provided and using the mid-point of the valuation analysis, this Transaction would result in total combined value of $70 per share for Target shareholders (74% premium to the 20-day average trading price) and $83 per share twelve months later
For illustrative purposes, assumes Transaction occurs on 01/01/09(1) Based on a 20-day trading average as of 10/24/08; assumes sale of remaining 53% interest on credit card business with proceeds used to pay down debt (2) Based on mid-point of valuation analysis

Even ignoring valuation benefits, there are important strategic reasons to consummate the Transaction…
31
Transaction Rationale
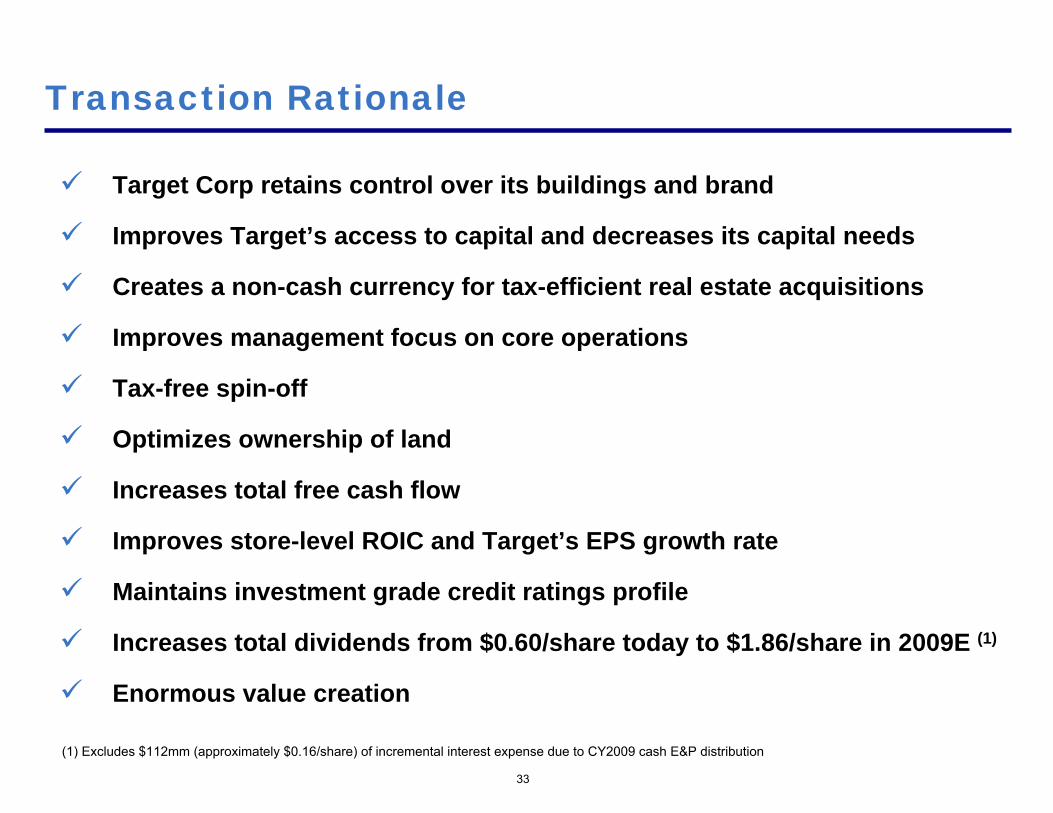
33
Transaction Rationale
Target Corp retains control over its buildings and brand
Improves Target’s access to capital and decreases its capital needs
Creates a non-cash currency for tax-efficient real estate acquisitions
Improves management focus on core operations
Tax-free spin-off
Optimizes ownership of land
Increases total free cash flow
Improves store-level ROIC and Target’s EPS growth rate
Maintains investment grade credit ratings profile
Increases total dividends from $0.60/share today to $1.86/share in 2009E (1)
Enormous value creation
(1) Excludes $112mm (approximately $0.16/share) of incremental interest expense due to CY2009 cash E&P distribution

34
Retains Control Over its Buildings and Brand
Target Corp maintains control over its real estate construction, remodeling, and relocation efforts
All economic benefits of construction / remodeling of stores stay with Target Corp
Ground lease provides Target Corp with a high degree of control and flexibility
75-year lease term with the ability to relocate and subleaseLease term flexibility on a store-by-store basis
Contingent rent eliminates GAAP straight-line rent leveling requirements
Unique landlord / tenant relationship benefits both TIP REIT and Target CorpTIP REIT and Target Corp have a mutual vested interest in maintaining the strong viability of the Target brand and retail business
Flexible lease structure will allow Target Corp to retain control of its brand and stores

Improves Overall Access to Capital
Simple, predictable businessHigh margins and strong cash flowsUnlevered balance sheet75-year leaseNo transaction incomeInflation-protected income streamTremendous securityNo maintenance capital requirementsNo currency or commodity riskHigh-quality, in-demand tenantDiversified real estate geography
35
Today, only the most stable and unlevered businesses can freely access the debt and equity capital markets. TIP REIT will be one of the most stable companies in the world today
TIP REIT
TIP REIT will have better and cheaper access to the capital markets than any retailer. As such, Target will have a stable strategic and financial partner to fund future growth

Decreases Target Corp’s Capital Needs
Today, on average, it costs Target approximately $100/sq. ft. toprocure and develop land for its stores. In 2009, this is expected to amount to roughly 50% of growth capital or $1.1bn
Outsourcing these capital requirements to TIP REIT would increase Target Corp’s cash flows and decrease its need for growth capital
36(1) Depreciable asset
LandCost of raw landPermits / ZoningProfessional fees (title search,legal, engineering, appraisal, etc…)Surveying and environmental assessmentsReal estate taxes
Land ImprovementsLand excavation (fill, grading)DrainageDemolition costs of existing propertiesSewage systems (1)
Parking lots (1)
Lights (1)
Fencing (1)
Sidewalks (1)
Landscaping (1)

2009E 2009E 2009E 2009E($mm, except per share data) Target Corp (1) TIP REIT "Combined" Standalone (1)
Maintenance Free Cash Flow $1,933 $1,344 $3,278 $2,830
Less: New Building Development/Other Capex (1,112) – (1,112) (1,112)
Less: New Land Development Capex – (1,079) (1,079) (1,079)
Equals: Free Cash Flow after Total Capex $821 $266 $1,087 $639
(1) Assumes sale of remaining 53% interest on credit card receivables for $4.4bn on 01/01/09 with Target retaining $150mm of credit card EBITDA in '09E
37
Decreases Target Corp’s Capital Needs (cont’d)
The Transaction enables Target Corp to generate more free cash flow after growth capex than Target today. As such, Target Corp will not need to access the capital markets because TIP REIT will providefuture growth capital and taxes will be reduced
Target Corp would have approximately $200mm of
incremental FCF after growth capex versus Target Standalone
as a result of not funding new land development and reduced taxes

Creates Currency for Tax Efficient Acquisitions
An UPREIT owns some or all of its assets through an Operating Partnership (“OP”) and can make acquisitions by exchanging OP units for real property
OP units are convertible, on a one-for-one basis, into TIP REIT shares
Utilization of an UPREIT structure would provide TIP REIT with an attractive acquisition currency that allows selling landowners to access liquidity, diversification, and yield without triggering tax
38

Creates Currency for Tax Efficient Acquisitions
To TIP REIT:OP units are an attractive acquisition currency in transactions with landowners who typically have a very low basis in their properties
OP units do not require any capital market access
TIP REIT may be able to acquire land from current Target landowners who historically would not sell for tax reasons
To Land Owners:Defers tax on sale of land to OP
Conversion right gives seller liquidity
OP unit represents a diversified real estate investment
Structure allows a diverse group of property owners to manage individual tax, liquidity, and other needs
39
There are several benefits to an UPREIT structure

40
Improves Management Focus
Target’s core competency is retailing (i.e. merchandising, branding, marketing, and designing a unique shopping experience)
Management will increase focus on Target’s core competencies and outsource certain other functions:
Facilities management (lawn care, parking lot maintenance, etc.)
Land development, planning, and zoning
Environmental planning
Target Corp can better focus on retailing while TIP REIT can focus on facilities management and land acquisitions
Management will be able to focus on retail operations

41
Tax-free Spin-off
ApplicationRequirements
Parent must have control of SpinCo immediately prior to the distribution
Control means 80% of total voting power and 80% of the number of shares of each class of non-voting stock
Business Purpose
Active Trade or Business
Both Parent and SpinCo must each be engaged in an active trade or business immediately after the spin-off
The business must also have been conducted throughout the 5-year period ending on the date of the spin-off
Device
The spin-off cannot be principally used as a device for the distribution of earnings and profits
Distribution of Control
The spin-off must be motivated by a non-tax corporate business purpose
Non-tax business purpose for separation, widely-held ownership of Target Corp and TIP REIT, and absence of plan by shareholders to sell stake in either company evidence that transaction is not a deviceLeases are structured to ensure TIP REIT is treated as tax owner of land
Target Corp will have control of 100% of TIP REIT prior to spin-off
Improved access to capital and capital allocationImproved currency for future real estate acquisitionsImproved management focus on retail operationsEnhanced equity-based management compensationLeases are structured to ensure TIP REIT is treated as tax owner of land
Facilities Management Services business is an active trade or business that has been conducted by Target Corp, in addition to its retail business, for the past five years
TIP REIT expected to continue to offer Facilities Management Services to customers other than Target Corp
The Transaction satisfies all of the requirements for a tax-free spin-off

Optimizes Land Ownership: Depreciation Considerations
Raw land (and the majority of the capitalized costs associated with land procurement / development) cannot be depreciated
Unlike buildings, which are depreciable and remain at Target Corp, land development has minimal offsetting tax deductibility
However, ground rent is tax deductible
As such, long-term ground leases are a more tax-efficient way for a tax-paying entity to control real estate than outright land ownership
Unless it is in the business of land speculation, there is no distinct strategic advantage for a retailer to own land versus a very long-term, covenant-free ground lease
On the other hand, a REIT should own land since (1) it is not a tax-paying entity and does not get any benefits from depreciation and (2) it is in the business of owning real estate
42

Optimizes Land Ownership: REIT Conversion
ApplicationREIT Requirements
Ownership
Asset Test
At least 75% of assets must be comprised of real estate, cash or cash items and Government securitiesREIT can conduct non-real estate related activities through a taxable REIT subsidiary (TRS). TRS shares could be up to 25% of the gross asset value of all the REIT’s assets
Income Test
At least 75% of REIT’s gross income must consist of rents, gain from disposition of real property and income from other REITsRents from related parties are disqualified under the income test (parties are related if there is a 10% or greater ownership by vote or value of the tenant by the REIT)At least 95% of gross income must consist of (i) income that satisfies the 75% income test and (ii) dividends and interest from any source
Distribution Requirements
In the year of election, REIT must distribute C-Corp earnings and profits by end of taxable yearAt least 90% of REIT taxable income must be distributed annually (undistributed income would remain subject to corporate-level tax)
REIT must have 100 or more shareholders Five or fewer individual shareholders may hold no more than 50%
Land satisfies the asset testThe Facilities Management Services business will be placed in a TRS and its income will be taxed at the corporate levelThe value of TIP REIT’s TRS shares will be less than 25% of the total value of TIP REIT
Rental income from leases will satisfy the 75% income test; rental income and dividends will satisfy the 95% income testNew 9.9% TIP REIT ownership restriction will ensure that rents from Target Corp are not related-party rents
TIP REIT will make a taxable distribution of stock and cash by December 31 of year of spin-off to purge retained Earnings and ProfitsTIP REIT will distribute ≥ 100% of its REIT taxable income
TIP REIT will be widely held by the publicRestrictions will be placed on the ownership of TIP REIT shares to ensure no single shareholder may own > 9.9% of its shares
The Transaction satisfies all the requirements of a REIT conversion, thus optimizing the ownership of land for Target shareholders
43

Differential2009E Maintenance FCF/Share 1 $2.68 $1.86 $4.54 $3.92 $0.62
2009E EPS 1 $2.23 $1.79 $4.02 $3.40 $0.62
44
Increases Total FCF via REIT Conversion
Most D&A remains at tax-paying entity (Target Corp)
Ground lease expense at Target Corp is tax deductible
REIT does not pay taxes
TARGET Standalone
TARGETCorp
TIPREIT 2
Using Target’s ’09 P/E multiple of 11.8x (based on $40/share), the incremental earnings accretion from this Transaction creates $7 per share of value ignoring other valuation benefits
(1) Assumes sale of remaining 53% interest on credit card business is sold in both Standalone and Transaction scenarios(2) Normalized to exclude $112mm (approximately $0.16/share) of incremental interest expense due to CY2009 cash E&P distribution
The Transaction allows for greater free cash flow generation forTarget’s shareholders than the Standalone company provides
TARGET“Combined”

45
Improves Store-level ROIC at Target Corp
Assuming the average store real estate costs $26mm, of which $13mm is allocated to the land and $13mm to the building, store-level return on investment increases from 23.0% to 39.8%
(1) Assumes $0.9mm of ground lease rent expense, based on $7/sq. ft. lease cost and 131k of store square footage, on average
Owned Store Level Operating Data and Assumptions ($mm)
Standalone 2007A
Pro Forma 2007A
Retail Sales per Avg. Store $40 $40
Estimated Four-Wall Operating Costs 34 35 Ground Lease Expense per Avg. Store -- 1(1)
Estimated Four-Wall EBIT per Avg. Store $6 $5 Margin (%) 15.0% 13.0%
New Land Capex $13 -- New Building Capex 13 13 Total Investment $26 $13 Estimated Returns on Investment (%) 23.0% 39.8%

Earnings per Share ($)'09-'13CAGR
2008 2009 2010 2011 2012 2013 (%)
PF Target Corp 1 $2.23 $2.67 $3.20 $3.70 $4.27
EPS Growth (%) 19.5% 20.2% 15.5% 15.3%
Target Standalone 1, 2 $3.29 $3.40 $3.90 $4.57 $5.18 $5.89
EPS Growth (%) 3.5% 14.8% 17.0% 13.4% 13.8%
Memo: Operating Assumptions:Same-store sales 0.5% 3.3% 3.5% 3.5% 3.5%Sq. ft. growth 4.7% 4.1% 6.0% 6.5% 7.0%
Gross Margin 30.0% 30.1% 30.2% 30.2% 30.2%SG&A as % of sales 20.2% 20.1% 20.0% 20.0% 20.0%
(1) Assumes remaining 53% interest of credit card business sold for $4.4bn on 01/01/09 and all proceeds used to pay down debt(2) Assumes Target Standalone maintains existing dividend policy
17.6%
14.7%
46
Increases Target Corp’s EPS Growth Rate
Because of its higher ROIC, improved free cash flow profile, and more efficient capital structure, Target Corp’s EPS growth will exceed that of Target Standalone
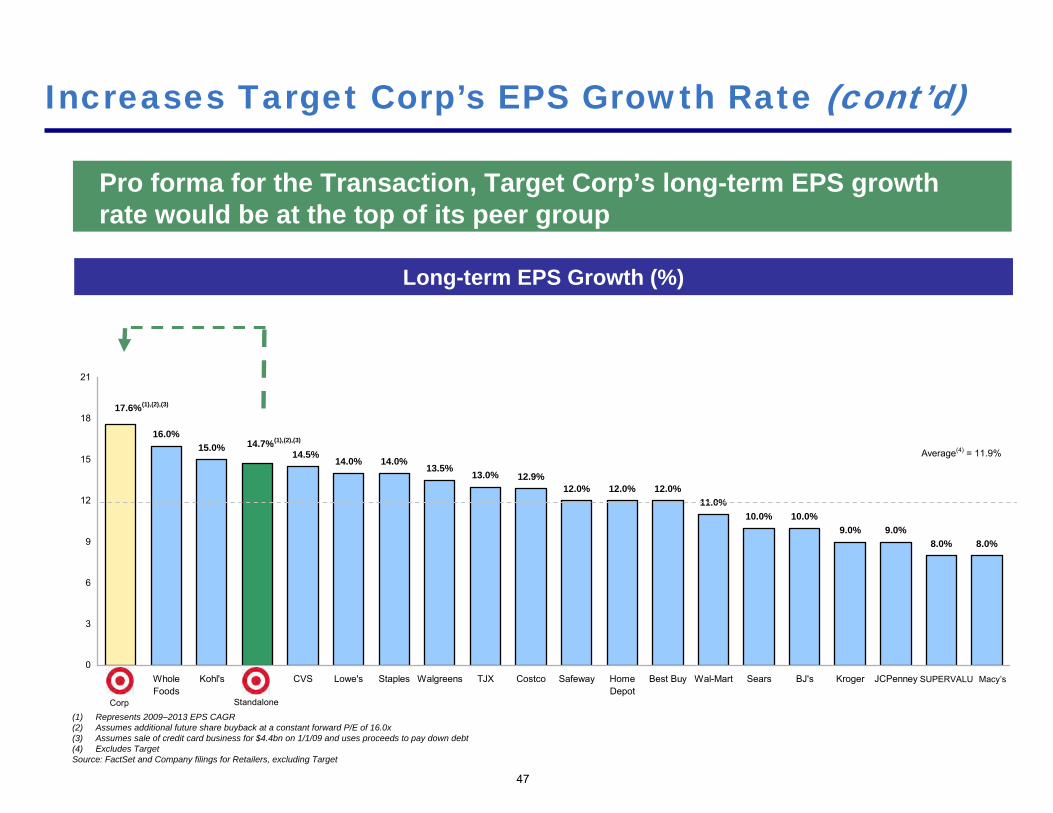
8.0%8.0%9.0%9.0%
10.0%10.0%11.0%
12.0%12.0%12.0%12.9%13.0%
13.5%14.0%14.0%
14.5%14.7%(1),(2),(3)
15.0%16.0%
17.6%(1),(2),(3)
0
3
6
9
12
15
18
21
WholeFoods
Kohl's CVS Lowe's Staples Walgreens TJX Costco Safeway HomeDepot
Best Buy Wal-Mart Sears BJ's Kroger JCPenney
Average(4) = 11.9%
47
Long-term EPS Growth (%)
Pro forma for the Transaction, Target Corp’s long-term EPS growth rate would be at the top of its peer group
Corp Standalone
Increases Target Corp’s EPS Growth Rate (cont’d)
SUPERVALU Macy’s
(1) Represents 2009–2013 EPS CAGR(2) Assumes additional future share buyback at a constant forward P/E of 16.0x(3) Assumes sale of credit card business for $4.4bn on 1/1/09 and uses proceeds to pay down debt(4) Excludes TargetSource: FactSet and Company filings for Retailers, excluding Target

Target Corp Target Combined"De-consolidated View" "Consolidated View"
PF 2008E Credit Metrics:Lease Adj. Debt/EBITDAR 3.6x 2.4xDebt/EBITDA 2.3x 2.3xEBITDAR/(Interest + Rent) 3.2x 7.3xEBITDA/(Interest) 9.7x 8.8x
Expected Rating Mid - High BBB/Baa A- / A3
48
Maintains Investment Grade Credit Ratings
To be conservative, we have assumed that the agencies will take a “De-consolidated View” and Target will maintain solid investment grade ratings in the Mid - High BBB/Baa category (versus A+/A2 rating today)
Post-transaction, we believe Target Corp will be rated investment grade, either in the Mid - High BBB or Low A categories, depending on whether the rating agencies take a “De-consolidated” or “Consolidated” view. A “Consolidated”view would assess the credit profile of the Target system, effectively cancelling TIP REIT’s rent payments, leading to a higher rating. This is similar to how the agencies rate Coca Cola and its bottlers

"Combined"Consol. Rating
Target TIP Intercompany Angencies($mm) Corp REIT Adjustments ViewBalance Sheet Data:8/2/08 Debt $19,655 – – $19,655Less: Debt Paydown with H2 '08 Cash Flow 1 (200) – – (200)Less: Debt Paydown from Excess Cash – – – 0CY2008E Debt 19,455 – – $19,455Less: Debt Paydown from Credit Card Proceeds (4,400) – – (4,400)Less: Elimination of JPMorgan Financing (3,600) – – (3,600)Plus: Debt Issued for E&P Distribution at TIP REIT 2 – 1,600 – 1,600Plus: Debt Issued to Fund Land Development at TIP REIT 3 – 1,322 – 1,322Less: Debt Paydown – – – PF2008E Ending Debt $11,455 $2,922 – $14,377Plus: Lease Adjusted Debt (8x 2008E Total Lease Expense) 12,309 – (10,956) 1,353PF2008E Lease Adj. Total Debt $23,764 $2,922 ($10,956) $15,730
PF 2008E Credit Metrics:Debt / EBITDA 2.3x 2.2x – 2.3xLease Adj. Total Debt / EBITDAR 3.6x 2.2x – 2.4xEBITDAR / (Interest+Rent) 3.2x 6.6x – 7.3x
(1) Assumes remaining 53% interest of credit card business sold for $4.4bn on 01/01/09 and all proceeds used to pay down debt(2) $1.6bn of debt issued to fund E&P dividend, which must be paid by December 31 of the year REIT status is elected(3) Assumes that 1st year land acquisitions financed solely with debt
Pro Forma 2008E Balance Sheets
The table below sets forth the Balance Sheets for the two entities
49

Target Corp: Deleveraging to an “A” Ratings Profile after 2 Years
TIP REIT will be required to fund land capex for the first two years after the spin-off. Thereafter, TIP REIT will be Target Corp’s land developer through its Preferred Vendor Agreement. As such, Target Corp will generate significant free cash flow and will likely deleverage to an A-/A3 ratings profile after two years
Despite temporarily having a lower credit rating than today, (1) Target Corp will not need access to capital because it will be significantly free cash flow positive after growth capex and (2) it will be able to deleverage back to an “A”category credit rating in a short time frame
50
PF 2008E 2009E 2010E 2011E
($bn, except where noted)End of Year Debt Balance 11.5 10.8 9.6 8.3
Lease Adj. Debt 12.3 12.9 13.8 15.0
End of Year Adj. Debt Balance 23.8 23.8 23.4 23.3
EBITDAR 6.5 6.8 7.5 8.4
Target Corp Adj. Debt/EBITDAR 3.6x 3.5x 3.1x 2.8x
Expected Ratings Profile Mid - High BBB/Baa Mid - High BBB/Baa High BBB/Baa A- / A3
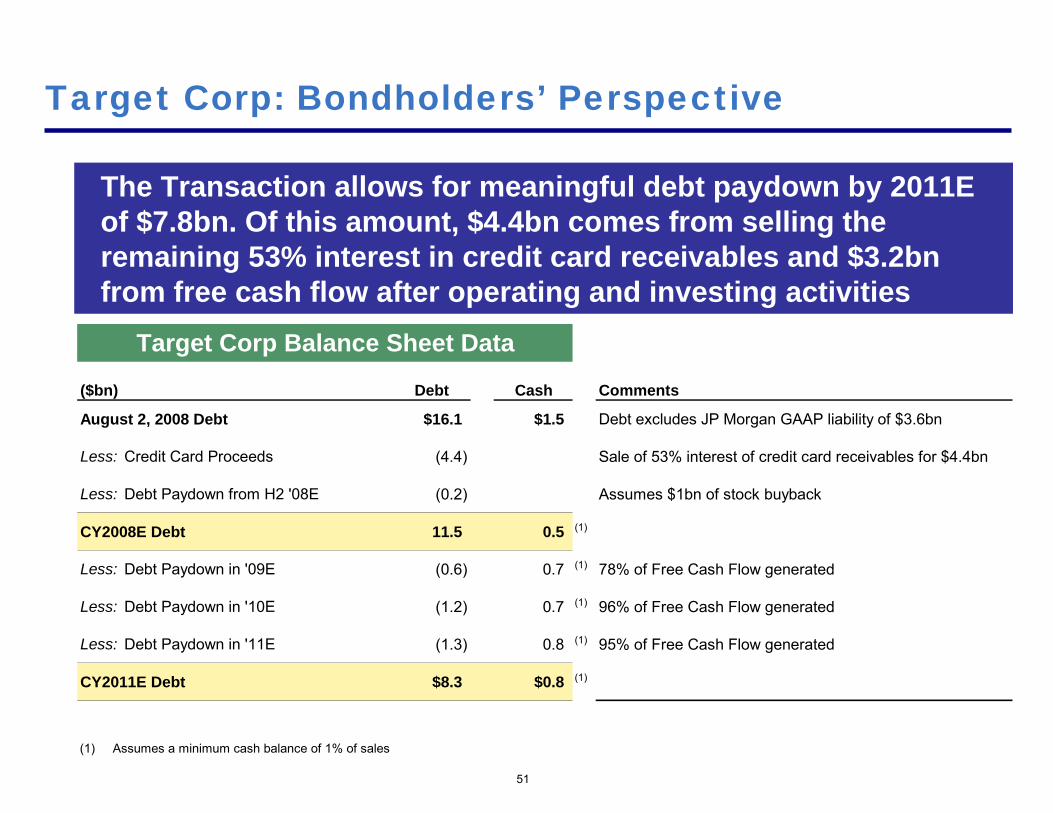
Target Corp: Bondholders’ Perspective
51
The Transaction allows for meaningful debt paydown by 2011E of $7.8bn. Of this amount, $4.4bn comes from selling the remaining 53% interest in credit card receivables and $3.2bn from free cash flow after operating and investing activities
Target Corp Balance Sheet Data
($bn) Debt Cash Comments
August 2, 2008 Debt $16.1 $1.5 Debt excludes JP Morgan GAAP liability of $3.6bn
Less: Credit Card Proceeds (4.4) Sale of 53% interest of credit card receivables for $4.4bn
Less: Debt Paydown from H2 '08E (0.2) Assumes $1bn of stock buyback
CY2008E Debt 11.5 0.5 (1)
Less: Debt Paydown in '09E (0.6) 0.7 (1) 78% of Free Cash Flow generated
Less: Debt Paydown in '10E (1.2) 0.7 (1) 96% of Free Cash Flow generated
Less: Debt Paydown in '11E (1.3) 0.8 (1) 95% of Free Cash Flow generated
CY2011E Debt $8.3 $0.8 (1)
(1) Assumes a minimum cash balance of 1% of sales

What’s Better: Debt or a TIP REIT Master Lease?
52
Debt TIP REIT Master Lease
Liquidity Risk Yes None
Financial Covenants Many covenants None
Holders Unrelated investors Strategic partner /“Friendly landlord”
Market access? Currently difficult to access Spin-off will obviaterequiring access
Duration 30 year maximum 75 years
Target’s cost 7.3% for 10-year bond 7%(20-day average cost) (Rent / cost sq. ft.)
TIP REIT’s Master Lease is much more attractive than long-term debt

Strong Similarities with a Credit Card Partnership
Credit Card Partnership
TIP REITSpin-off
Control
Taxable Gains
Use of Proceeds
Improved AccessTo Capital
Capital Allocation
Target can control its credit card business without the need to own receivables
Target can control its buildings and retailing strategy without the need to own land
Receivables ownership is transferred to a party with a lower cost of capital
Land (and land improvements) ownership is transferred to a party with a lower cost of capital
Primarily to return capital to shareholders (via buyback)
Return capital to shareholders (via spin-off of TIP REIT)
Minimal NoneCredit Card Partner funds future receivables growth
TIP REIT funds future land procurement and development
ROIC CC ROIC improves significantly Store-level ROIC nearly doubles
53

$0
$20
$40
$60
$80
Target (20-Day Avg. Price) ¹ Target REIT Spin-Off ² 12-Month Price Target ²
$/Sh
are
TIP REIT
Target CorpTarget
Standalone
74%
$40
$70
$38
$32 $42
$42
$83
TIP REIT
Target Corp
Valuation Summary
54
For illustrative purposes, assumes Transaction occurs on 01/01/09(1) Based on 20-day trading average as of 10/24/08; assumes sale of remaining 53% interest on credit card business with proceeds used to pay down debt (2) Based on mid-point of valuation analysis
Equity Value ($bn) $29 $23 Equity Value ($bn) $30Enterprise Value ($bn) $40 $34 Enterprise Value ($bn) $40 '09E EV/EBITDA 6.0x 6.5x '10E EV/EBITDA 7.0x '09E P/E 11.8x 14.2x '10E P/E 15.6x Equity Value ($bn) $27.5 Equity Value ($bn) $30 Enterprise Value ($bn) $27.5 Enterprise Value ($bn) $31 ‘09E Dividend Yield 4.9% ‘10E Dividend Yield 4.7% Cap Rate 5.3% Cap Rate 5.0% '09E P/AFFO 20.5x '10E P/AFFO 21.4x '09E EV/EBITDA 19.3x '10E EV/EBITDA 20.3x
Targ
etC
orp
TIP
REI
T
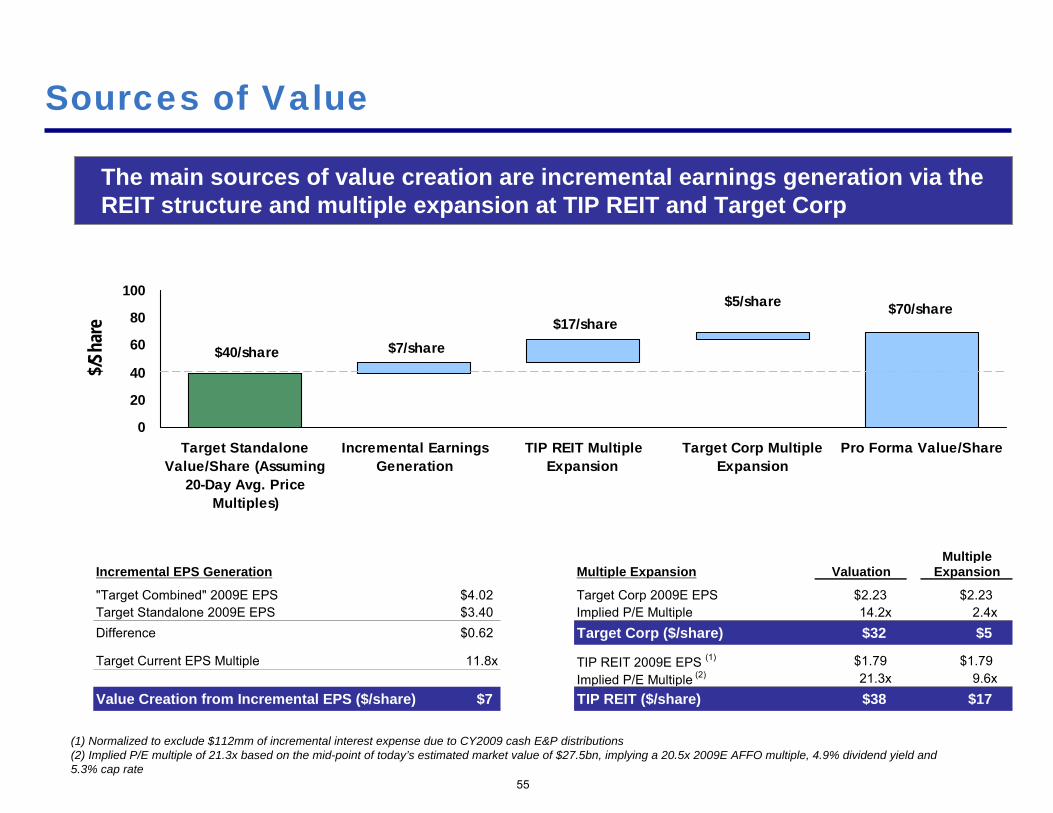
$40/share $7/share$17/share
$70/share
0
20
40
60
80
100
Target StandaloneValue/Share (Assuming
20-Day Avg. PriceMultiples)
Incremental EarningsGeneration
TIP REIT MultipleExpansion
Target Corp MultipleExpansion
Pro Forma Value/Share
$5/share
(1) Normalized to exclude $112mm of incremental interest expense due to CY2009 cash E&P distributions(2) Implied P/E multiple of 21.3x based on the mid-point of today’s estimated market value of $27.5bn, implying a 20.5x 2009E AFFO multiple, 4.9% dividend yield and 5.3% cap rate
Sources of Value
The main sources of value creation are incremental earnings generation via the REIT structure and multiple expansion at TIP REIT and Target Corp
55
$/Sha
re
MultipleIncremental EPS Generation Multiple Expansion Valuation Expansion
"Target Combined" 2009E EPS $4.02 Target Corp 2009E EPS $2.23 $2.23Target Standalone 2009E EPS $3.40 Implied P/E Multiple 14.2x 2.4xDifference $0.62 Target Corp ($/share) $32 $5
Target Current EPS Multiple 11.8x TIP REIT 2009E EPS (1) $1.79 $1.79Implied P/E Multiple (2) 21.3x 9.6x
Value Creation from Incremental EPS ($/share) $7 TIP REIT ($/share) $38 $17

$109
$97
$83
$70
$50
$60
$70
$80
$90
$100
$110
Today 1 Year 2 Year 3 Year
$/S
hare
Hypothetical Value Creation over Time (1)
The implied hypothetical future value per share post-transaction for Target shareholders is $109 in three years
56
Post-TransactionHypothetical Valuation
(1) Future values post 1-year are based on constant multiples(2) Excludes one-time dividend from E&P distribution
TRANSACTIONTarget Corp - Hypothetical Value/Share $32 $42 $50 $58TIP REIT - Hypothetical Value/Share $38 $40 $43 $45TIP REIT - Cumulative Dividend (2) $0 $2 $4 $6Total Hypothetical Value/Share ($) $70 $83 $97 $109
Valuation: Potential Questions and Answers

Potential Questions
What’s so special about TIP REIT?
Why are TIPS the best comparable security to TIP REIT?
Why is TIP REIT more valuable than a private ground lease?
Why is TIP REIT unlike any existing REIT today?
Why would this Transaction improve Target Corp’s valuation?
Why is this Transaction ideally suited for Target?
What are the risks?
Other potential questions
58
What’s So Special About TIP REIT?

60
TIP REIT Investment Highlights
“Land-only” structure is extremely secure■ $39bn of “Lease Security”, including $20bn of unencumbered buildings
Long-term lease provides bond-like stability and inflation-protection■ 75-year, inflation-protected “Master Lease” with Target Corp
Significant growth opportunity■ Formal arrangement with Target Corp provides long-term growth pipeline
High quality locations and superb tenant profile
De minimis maintenance capex allows for strong FCF generation
Tremendous size and scale – a “must-own” REIT

Ground leases are the most secure form of real estate investmentIn the event of a default on a ground lease, the building and improvements revert to the landowner
As such, in the event of tenant default, a landowner can re-lease the land and the building at significantly lower rent than market and still maintain its current lease payments
61
“Land-only” Structure is Tremendously Secure
TIP REIT’s land-only leases are the most secure form of real estate investment
Because it will lose its building in the event of default, a tenant is highly motivated to make its ground lease payments. The unencumbered building acts as collateral, making the ground lease extremely secure
Ground lessor leases land at
$7 / sq. ft.
Ground lessor re-leases land AND buildingat $13/sq. ft.
$7 sq. ft.Rent
$13 sq. ft.Rent
Event of default
Today
Illustrative Example: Significant cushion for rents to fall in the event of default

62
$39 Billion of “Lease Security”
Although the buildings are not pledged as security, they will revert to the landowner upon a ground lease default. As such, illustratively, we define TIP REIT’s “Lease Security” as the value of the land and unencumbered buildings. Based on replacement cost, this “Lease Security” is valued at $39bn
Total “Lease Security”: $39bn Unencumbered “Collateral”: $20bn (3)
(1) Analysis excludes the value of owned buildings on third-party ground leased land; assumes cost of a Target store of $26mm ($13mm building and $13mm land) and cost of DC and WH of $70mm ($50mm building and $20mm land)(2) Assumes 1,438 stores, and 25 DCs and WHs on owned land in 2008E(3) Although the buildings are not pledged as security, the effective result is that they act like “collateral” in the event of tenant default
Replacement Value of Owned Land and Buildings (1), (2) Value of Buildings Only (on the Owned Land) (1)
2008E Retail Real Estate: Retail Buildings - 1,438 Stores in '08E:
2008E Estimated Owned Value / Total Value Estimated Replacement Cost per Square Foot $99Total Sq. Ft. (mm) % Owned Sq. Ft. (mm) Sq. Ft. ($bn) 2008E Owned Square Feet (mm) 189
222 85% 189 $197 37.4 Value of Owned Store Buildings ($bn) $18.7
2008E DCs and WHs: DC and WH Buildings - 25 DCs and WHs in '08E:
2008E Estimated Owned Value / Total Value Estimated Replacement Cost per Square Foot $36Total Sq. Ft. (mm) % Owned Sq. Ft. (mm) Sq. Ft. ($bn) 2008E Owned Square Feet (mm) 35
44 81% 35 $50 1.8 Value of Owned DC and WH Buildings ($bn) $1.3
Total Real Estate Replacement Value ($bn) $39.1 Total Value of Buildings on Owned Land ($bn) $19.9
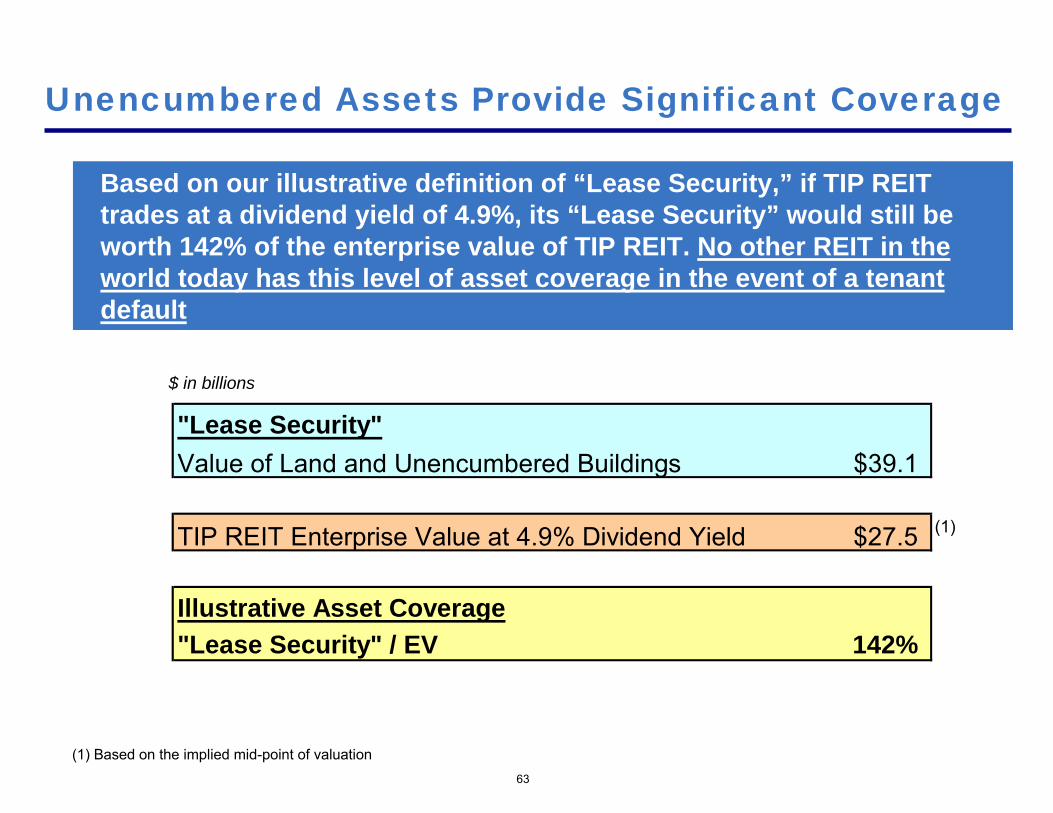
63
Unencumbered Assets Provide Significant Coverage
Based on our illustrative definition of “Lease Security,” if TIP REIT trades at a dividend yield of 4.9%, its “Lease Security” would still be worth 142% of the enterprise value of TIP REIT. No other REIT in the world today has this level of asset coverage in the event of a tenant default
(1) Based on the implied mid-point of valuation
$ in billions
"Lease Security"Value of Land and Unencumbered Buildings $39.1
TIP REIT Enterprise Value at 4.9% Dividend Yield $27.5 (1)
Illustrative Asset Coverage"Lease Security" / EV 142%

64
Benefits of a Master Lease
Under a master lease, all of the sites will be subject to a single lease agreement
The master lease provides for an aggregate amount due for all of the sites
Under the master lease, a failure to pay full rent due on a single site will cause all of the leases covered by the master lease to be in default
TIP REIT’s rights under the master lease require Target Corp to satisfy its lease obligations under all events
As the tenant, Target Corp must continue making lease payments to maintain ownership of all buildings and other improvements
A Master Lease has a number of structural advantages that will enhance the stability and security of TIP REIT

65
Long-term Lease Provides Bond-like Stability
Given its long-term lease arrangement and its land-only structure, TIP REIT’s risk profile will be similar to that of a long-term, senior secured, highly-rated, and inflation-protected bond
75-year Master Lease
Long-term lease
100% occupancy
Highly rated, high-quality tenant in Target
Inflation protection
Extremely low probability of lease default
Land-only REIT structure
$39bn of “lease security” or 142% asset coverage at a 4.9% dividend yieldEffectively “over collateralized” by $20bn of buildings
Highly-rated
Senior Secured
Inflation-protected
Bond
TIP REITRisk profile:
Long-term

TIP REIT’s Preferred Vendor Agreement with Target Corp will provide it with a strong pipeline of land development opportunities
Target Corp believes that in the U.S. alone it can double its store count to more than 3,000 stores
Significant square footage growth at TIP REIT will translate into strong NOI growth
2009E – 2013E retail square footage CAGR of 6.8%
2009E – 2013E top-line CAGR of 9.3%
2009E – 2013E NOI CAGR of 9.3%
66
Significant Growth Opportunity
In addition to its incredibly stable and secure cash flows, TIP REIT has strong growth prospects, given its initial 2-year exclusive right as Target Corp’s land developer and its formal Preferred Vendor Agreement with Target Corp thereafter

67
High Quality Locations and Superb Tenant
TIP REIT’s high quality locations and strong tenant profile will support its premium valuation
Attractive urban / suburban locations with strong demographicsGeographically diversified portfolio of approximately 1,438 stores (1) in 48 statesMultiple opportunities for alternative use of land sitesAbility to attract shadow development, enhancing value of ground leases as sites evolve into in-fill locations
Strong tenant in Target CorpLeading brand, market share winner and “in demand” tenantInvestment grade tenant with strong financial outlookStrong focus on maintaining and improving buildings100% occupancy for 75 yearsLow store churn rate
(1) Represents 2008E Target Corp stores on TIP REIT land

(1) Represents non-financial companies in the S&P 500 with market caps greater than $20bn(2) Based on 2009E dividends
Rank Company Market Cap.
($mm) 55 Home Depot 31,439
56 Devon Energy 30,851
57 Lockheed Martin 30,382
58 Union Pacific 29,674
59 Colgate-Palmolive 28,291
60 American Express 27,898
61 UnitedHealth Group 27,896
62 TIP REIT 27,500
63 Burlington Northern Santa Fe 27,386
64 Southern Co. 26,656
65 E.I. DuPont de Nemours & Co. 26,466
Rank Company Dividend Yield (%) 1 Pfizer 7.72 Verizon Communications 7.3 3 Dow Chemical 7.0 4 Bristol-Myers Squibb 7.0 5 General Electric 7.0 6 Altria Group 6.7 7 AT&T 6.5 8 Carnival 6.0 9 Eli Lilly 5.9 10 E.I. DuPont de Nemours 5.6 11 Merck 5.6 12 Philip Morris International 5.3 13 Caterpillar 5.0 14 TIP REIT (2) 4.9 15 Home Depot 4.9 16 Southern Co. 4.9
68
Large Market Cap — Must Own Yield Stock
TIP REIT will be the 62nd largest company in the S&P 500
Given its market cap, TIP REIT will be owned by S&P 500 index funds, large cap funds, real estate index funds, yield-oriented investors, and investors seeking inflation-protected assets
S&P 100 Non-Financials Ranked by Dividend Yield (1)S&P 500 Ranked by Market Cap
Why are Treasury Inflation Protected Securities (“TIPS”) the Best Comparable Security to TIP REIT?

70
How is TIP REIT Similar to TIPS?
TIP REIT has many of the same features of Treasury Inflation Protected Securities (TIPS). However, TIP REIT has the added benefit of a growth platform and no “Phantom tax”
20-Year TIPSTIP REITExtremely low probability of default
Backed by highly-rated Target Corp$39bn of “Lease Security” or ~140% TIP REIT’s EV at 4.9% dividend yield
Backed by federal government
Inflation protection Payment based on CPI adjusted principal
Rent income adjusted for CPI
Long-term duration with required payments
75-year lease termREIT dividend payment required by law
20 yearsInterest payment required by law
Liquidity $28bn market cap Over $450bn market (1)
Growth platform
“Phantom tax”Yes No
No Yes (tax on inflation adj. principal)
(1) Size of total TIPS market

71
TIP REIT Can Be Valued As Two Entities
TIP REIT stock can be valued as two entities: (1) an Inflation-Protected Secured Bond that is nearly identical to TIPS and (2) a Land Developer with a stable growth platform
TIP REITTIP-like Security Land Developer
Cash flows generated as the Preferred Land Developer of new Target stores
Exclusive right to be Target’s land developer for the first two years post Transaction
Preferred Land Developer after two years
Attractive 6% – 8% square footage growth for the foreseeable future
Provide Facilities Management services as part of land developer platform
Cash flows from the rental income generated by the existing, “static” ground lease portfolio
Nearly identical to TIPS, given stability, security and the long-term, inflation-adjusted nature of the Master Lease
Inflation-linked rents based on the same CPI measure as used for TIPS
Semi-annual dividend payments on the same date as TIPS interest payments
Highly liquid

72
TIP REIT: (1) Valuing the TIP-like Security
TIP REIT: TIP-like Security
The TIP-like Security should trade at a small spread to TIPS of 165 – 215 bps
Rate / Yield Spread to TIPS
165 bps — 215 bps
3.0%
165 bps — 215 bps
4.65% — 5.15%
20-year TIP Yield Today
Current TGT Unsecured CDS @ 190bps ± 25 bps 1.65% — 2.15%
—
The current TIPS yield of 3.0% implies an expected 20-year inflation rate of only 1.4%. If the expected 20-year inflation rate increased to 2.0% and the 20-year Treasury rate remained constant, then the 20-year TIPS would yield 2.4% and TIP REIT would yield 4.05% – 4.55%. The higher the inflation rate, the more valuable TIP REIT will be

TIP REIT: (1) Valuing the TIP-like Security (cont’d)
Importantly, we believe our TIPS-based valuation analysis conservatively measures TIP REIT’s credit risk
73
In the preceding analysis, we use Target’s unsecured CDS spreads as the measure of credit risk under the TIP REIT Master Lease.
We believe this is conservative because while TIP REIT has Target’s (unsecured) credit, it also has $20bn of unencumbered buildings that would revert to TIP REIT in the event of tenant default.
We estimate that Target’s ground lease credit risk should be materially lower than Target’s unsecured CDS spread

74
TIP REIT: (2) Valuing the Land Developer
TIP REIT’s land development opportunity can be valued based on its growth platform value
Growth Platform Valuation
Based on 20-year DCF analysis
Implied valuation at 4.65% – 5.15% cap rate and 10.5% – 12.5% discount rate2029E terminal NOI: $2,560mmValuation range of $0.0bn – $2.3bn
(1) Based on 2029E NOI of $2,560mm and 4.65% cap rate
TerminalValue (1)
2009 2010 2011 2012 2013 ... 2029Incremental Rental Revenues $74 $145 $257 $391 $551After-tax Facilities Management Income 12 12 14 15 17G&A Expense (20) (21) (21) (22) (22)Total Capex (1,079) (1,008) (1,582) (1,863) (2,190)Free Cash Flow from Platform ($1,013) ($872) ($1,332) ($1,478) ($1,644)Terminal Value $55,047Discount Rate 12.5% 10.5%Terminal Cap Rate 5.15% 4.65%Present Value of Platform – $2,293
Platform Value

75
Valuation: TIP REIT in Total
TIP-like Security
Land Developer
Equity Value (1) Implied Cap Rate (2)
Total TIP REIT
$38/share 4.9%
(1) At mid-point valuation(2) Implied yield calculated based on NOI / Implied value
$2/share
$40/share 5.1%
Based on “TIPS”-based valuation of TIP REIT, the implied TIP REIT valuation is $29bn, or $40/share today
Valuation
2008E Existing dividends: $1,354mm
Dividend yield: 4.65% – 5.15%
Valuation: $26bn – $29bn
2029E NOI: $2,560mm
Terminal cap rate: 4.65% – 5.15%
Discount rate on 20-yr DCF: 10.5% – 12.5%
Valuation: $0.0bn – $2.3bn
2009E NOI of $1,462mm
Valuation: $26bn – $31bn or $36/share – $44/share

TIP REIT
Target Corp
$70
$38
$32
Conservative Approach to Valuation
Our mid-point valuation price for TIP REIT of $38 (1) implies a 4.9% dividend yield for the TIPS-like security and (2) excludes the value of the Land Developer
TIP REIT Spin-offEquity Value / Share
76
Using a “TIPS”-based valuation analysis, our mid-point valuation price of $38/share excludes the value of TIP REIT’s development platform
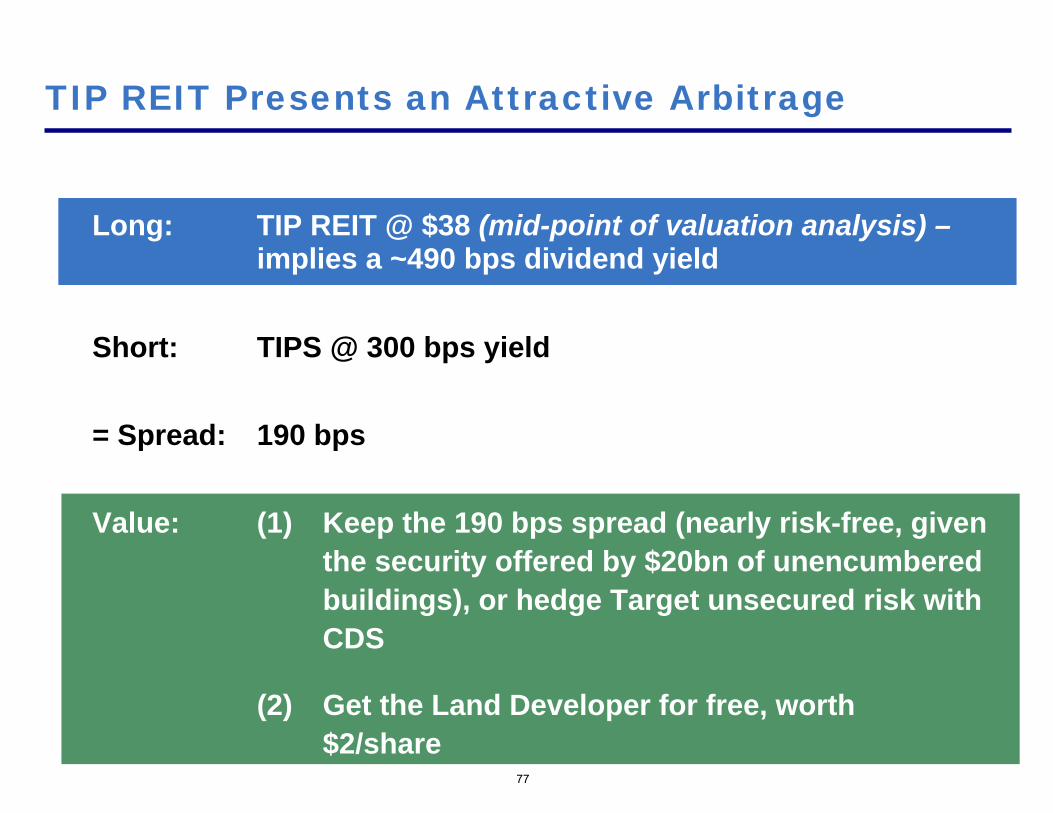
TIP REIT Presents an Attractive Arbitrage
Long: TIP REIT @ $38 (mid-point of valuation analysis) –implies a ~490 bps dividend yield
Short: TIPS @ 300 bps yield
= Spread: 190 bps
Value: (1) Keep the 190 bps spread (nearly risk-free, given the security offered by $20bn of unencumbered buildings), or hedge Target unsecured risk with CDS
(2) Get the Land Developer for free, worth $2/share
77

How is this Trade Possible?
78
This arbitrage trade is feasible for several reasons:
The TIPS market is highly liquid
TIP REIT would be a highly liquid security with an initial market capitalization of approximately $28 billion
TIPS trade, even in the current low liquidity environment, approximately $1 – $2 billion per day
Normal volume is typically $3 – $5 billion or more per day
TIPS are readily borrowable and easily shortable
TIP REIT would pay semi-annual dividends on the exact same day that TIPS pay interest payments (Jan 15th and July 15th )
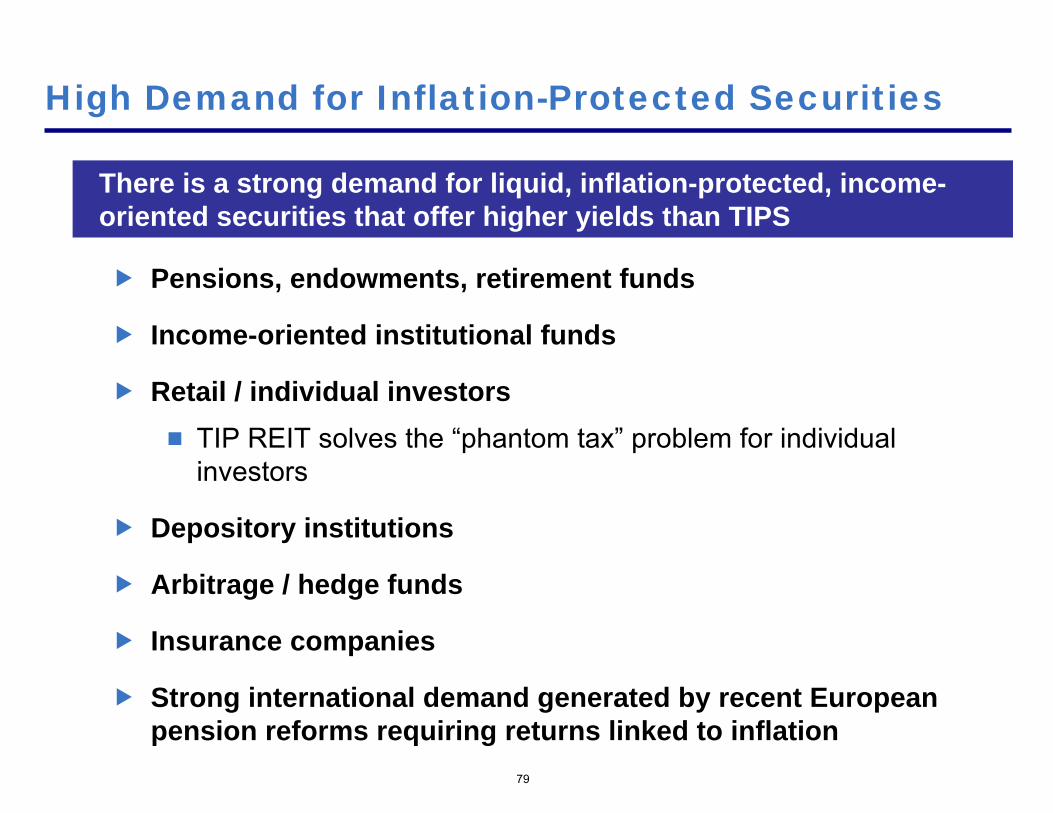
High Demand for Inflation-Protected Securities
79
Pensions, endowments, retirement funds
Income-oriented institutional funds
Retail / individual investorsTIP REIT solves the “phantom tax” problem for individual investors
Depository institutions
Arbitrage / hedge funds
Insurance companies
Strong international demand generated by recent European pension reforms requiring returns linked to inflation
There is a strong demand for liquid, inflation-protected, income-oriented securities that offer higher yields than TIPS

Why is TIP REIT More Valuable than a Private Ground Lease?

Building Lot Total LeaseSize Size Lease Term with
Transaction Tenant Location (Sq. Ft.) (Acres) Cap Rate Term Options OptionsFor Sale Lowe's Princeton, WV 116,000 14.16 6.61% 20 Years 6, Five-Year 50 YearsFor Sale Kohl's Selinsgrove, PA 68,416 4.47 6.25% 20 Years 8, Five-Year 60 YearsFor Sale Lowe's Derby, CT 152,890 13.10 5.50% 20 Years 8, Five-Year 60 YearsFor Sale Lowe's Eugene, OR 137,933 12.30 6.25% 20 Years na naFor Sale Wal-Mart Albuquerque, NM 40,000 5.15 5.50% 20 Years 15, Five-Year 95 YearsFor Sale Kohl's Fort Gratiot, MI 89,008 14.75 5.75% 20 Years 4, Five-Year 40 YearsSold Target Fairlawn, OH 99,402 5.28 6.00% 20 Years 6, Five-Year 50 YearsSold - March 27, 2008 Lowe's Whitehall, PA 166,609 14.24 6.05% 20 Years na naSold - March 23, 2008 Home Depot Austell, GA 130,948 14.46 5.75% 20 Years na naSold - October 2007 Kohl's Reno, NV 94,213 9.09 6.10% na na naSold - September 2007 Lowe's Escondido, CA 178,712 11.27 6.00% 20 Years 6, Five-Year 50 YearsSold - July 2007 Lowe's Sayre, PA 111,371 12.50 6.25% 20 Years 8, Five-Year 60 Years
Mean 6.00%Median 6.03%High 6.61%Low 5.50%
81
Ground Leases Typically Trade from 5.50% to 6.25%
Precedent private ground lease transactions support cap rates ofapproximately 5.50% – 6.25% for a typical ground lease with no development pipeline
Source: LoopNet and other public filings

Why is TIP REIT Better than a Private Ground Lease?
82
TIP REIT offers better value to investors than a typical privateground lease
TIP REIT has several qualities which make it more attractive than a private ground lease
Large cap, liquid public ownership
75-year Master Lease term (longer than most private ground leases)
1,438 retail properties (1) in 48 states
Inflation-protected rental stream with annual adjustments
Best-in-class retail tenant
Geographic diversity
Unlike a static ground lease, TIP REIT also has growth, given its dependable new store growth pipeline
Given the above factors, TIP REIT will trade at a lower cap rate than an individual private ground lease
(1) Represents 2008E Target Corp stores on TIP REIT land

Why is TIP REIT Unlike Any Existing REIT Today?

84
Leverage None High: 63% Debt-to-TMCAverage: 47% Debt-to-TMC
TIP REIT Large Cap REITs
NoneHigh – REITs have borrowed at low rates and are facing much higher rates and refinancing risk for debt maturities
None / 100% rental income Sometimes
None / 75-year lease Yes, typically 10% or more of leases up for renewal annually
Re-leasing Risk
None Yes, typically 8% of EBITDAMaintenanceCapital
Preferred vendor arrangement No preferred arrangementGrowth
$20bn of unencumbered buildings, given “land-only” structure None. Owns both land buildings“Lease Security”
TransactionIncome
RefinancingRisk / EarningsPressure
TIP REIT: Unlike Any Existing REIT Today

(1) By equity market value(2) Source: Wall Street research; 2008E maintenance Capex / EBITDA
85
TIP REIT: No Maintenance Capital Requirements
TIP REIT’s “land-only” structure maximizes cash flow. Unlike large cap real estate companies that spend on average 8% of EBITDA to maintain depreciable properties, TIP REIT requires virtually no maintenance capital
Given TIP REIT’s de minimis maintenance capital requirements, TIP REIT’s free cash flow should be compared to a real estate investment trust’s AFFO, not the “FFO” metric
10 Largest REITs (1) Maint. Capex / EBITDA (2)
1 TIP REIT 0.0%2 Simon Property Group 8.7%3 Public Storage 5.5%4 Vornado Realty Trust 13.4%6 Boston Properties 11.8%5 Equity Residential 6.9%7 HCP, Inc. 6.9%8 Kimco Realty Corporation 6.7%9 ProLogis 8.5%
10 AvalonBay Communities 5.7%Average (Excluding TIP REIT) 8.2%

86
TIP REIT: Tremendous Size and Scale
TIP REIT owns land under 225mm square feet of buildings (1), including 35mm sq. ft. of distribution facilities. TIP REIT would have a larger equity market capitalization than any real estate company in the U.S. today
Given its size and scale, TIP REIT will be a “must own” stock for any real estate equity investor
(1) Represents 2008E Target Corp stores, distribution facilities and warehouses on TIP REIT land (2) By equity market value; based on a 20-day trading average as of 10/24/08(3) Based on company filings as of Q2 2008A
Equity Total OwnedMarket GLA (3)
10 Largest REITs (2) Value ($mm) (mm)1 TIP REIT (1) 27,500 2252 Simon Property Group 20,836 1603 Public Storage 13,891 1254 Vornado Realty Trust 13,023 816 Boston Properties 10,679 415 Equity Residential 10,479 na 7 HCP, Inc. 8,450 na 8 Kimco Realty Corporation 7,451 749 ProLogis 7,170 487
10 AvalonBay Communities 6,106 na

87
TIP REIT versus Triple Net Lease REITs
TIP REIT is a much more stable, faster growing and higher quality business than any Triple Net Lease REIT
Lease Typeand Terms
Land-only Master LeaseHighly secure given unencumbered buildings worth $20bn75-year lease term
Fee simple individual leasesNo “over-collateralization” and often unmarketable specialty use properties~13-year avg. remaining lease term (1)
Individual leases have re-leasing risk
TIP REIT Triple Net Lease REIT
Asset Quality High quality / Multiple alternative uses Mixed quality / Limited alternative use
Tenant Quality Generally below investment grade credit and deteriorating
Unproven, often specialty retail
Size and Scale Largest market equity cap Small equity market cap
Investment grade credit and improvingLeading GM Retailer
Growth Preferred Vendor Agreement with a fast-growing, leading retailer
Limited growth / no formal arrangement
(1) Extension option detail not disclosed in company filings

Leases:
Leased Property Land-only Land and Building Land and Building Land and Building
Lease Type Master Lease Individual Leases Individual Leases Individual Leases
Unencumbered Assets of the Tenants
1,438 Stores and 25 Distribution Facilities (1) None None None
Effective “Over-collateralization” $20 billion of Buildings None None None
Avg. Remaining Lease Terms (Yrs) 75.0 13.0 (3) 13.0 (3) 13.0 (3), (4)
Estimated Lease Turnover (‘08–’17) 0.0% 34.8% (4) 45.6% (4) 35.4% (4)
Size:
Equity Market Value ($mm) (2) $27,500.0 $2,405.5 $1,523.3 $1,428.9
Enterprise Value ($mm) (2) $27,500.0 $4,183.6 $2,714.5 $2,934.4
Gross Leasable Area (mm sq. ft.) 225 (1) 19 11 9 (4)
Leverage:
(Net Debt + Preferred) / EV 8.6% (5) 42.5% 43.8% 50.7%
Growth Opportunity:
Preferred Vendor Agreement Yes No No No Source: Company filings (1) Represents 2008E Target Corp stores, distribution facilities and warehouses on TIP REIT land (2) Triple net lease REITs are based on a 20-day trading average stock price as of 10/24/08 (3) Extension option detail not disclosed in company filings (4) Based on 2007A (5) Based on 2009E
Side-by-Side Comparison with Triple Net Lease REITs
88
TIP REIT@ $38/share
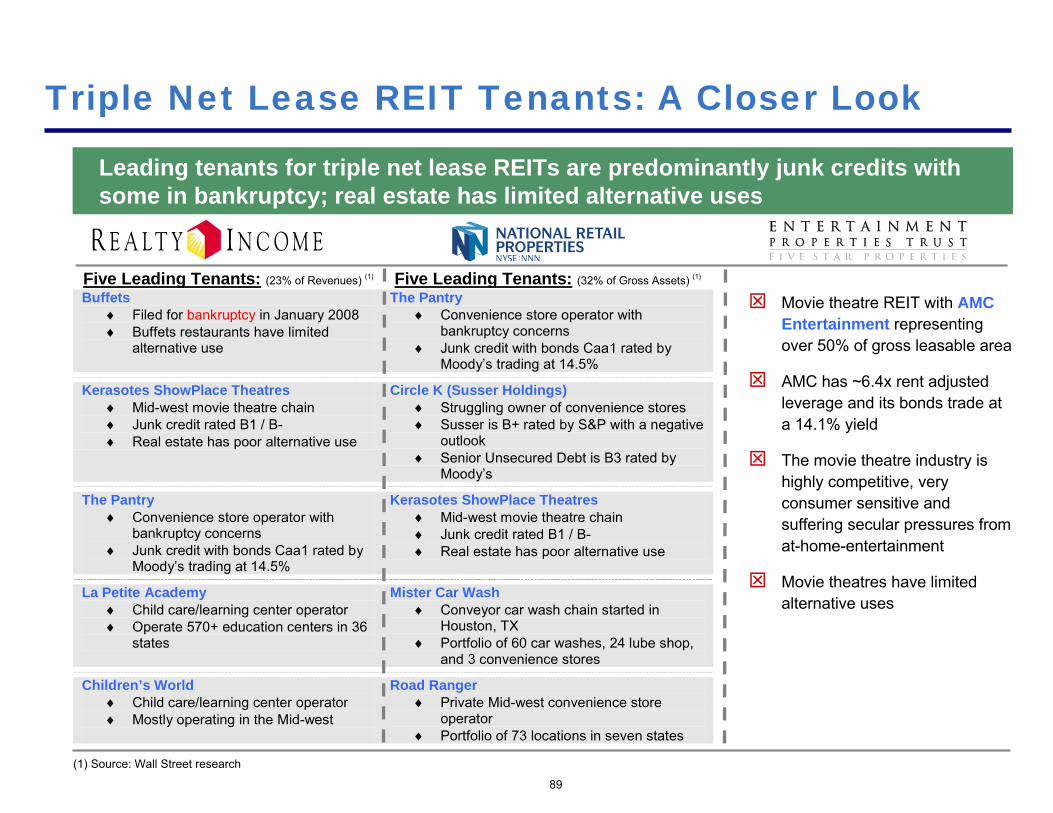
Five Leading Tenants: (23% of Revenues) (1) Five Leading Tenants: (32% of Gross Assets) (1) Buffets
♦ Filed for bankruptcy in January 2008 ♦ Buffets restaurants have limited
alternative use
The Pantry ♦ Convenience store operator with
bankruptcy concerns ♦ Junk credit with bonds Caa1 rated by
Moody’s trading at 14.5% Kerasotes ShowPlace Theatres
♦ Mid-west movie theatre chain ♦ Junk credit rated B1 / B- ♦ Real estate has poor alternative use
Circle K (Susser Holdings) ♦ Struggling owner of convenience stores ♦ Susser is B+ rated by S&P with a negative
outlook ♦ Senior Unsecured Debt is B3 rated by
Moody’s
The Pantry ♦ Convenience store operator with
bankruptcy concerns ♦ Junk credit with bonds Caa1 rated by
Moody’s trading at 14.5%
Kerasotes ShowPlace Theatres ♦ Mid-west movie theatre chain ♦ Junk credit rated B1 / B- ♦ Real estate has poor alternative use
La Petite Academy ♦ Child care/learning center operator ♦ Operate 570+ education centers in 36
states
Mister Car Wash ♦ Conveyor car wash chain started in
Houston, TX ♦ Portfolio of 60 car washes, 24 lube shop,
and 3 convenience stores Children’s World
♦ Child care/learning center operator ♦ Mostly operating in the Mid-west
Road Ranger ♦ Private Mid-west convenience store
operator ♦ Portfolio of 73 locations in seven states
Triple Net Lease REIT Tenants: A Closer Look
89
Leading tenants for triple net lease REITs are predominantly junk credits with some in bankruptcy; real estate has limited alternative uses
Movie theatre REIT with AMC Entertainment representing over 50% of gross leasable area
AMC has ~6.4x rent adjusted leverage and its bonds trade at a 14.1% yield
The movie theatre industry is highly competitive, very consumer sensitive and suffering secular pressures from at-home-entertainment
Movie theatres have limited alternative uses
(1) Source: Wall Street research

'09E Dividend Yield 4.9%Cap Rate 5.3%
19.3x15.7x
12.7x
6.0x
TIP REIT Large Cap REITAverage
Triple Net LeaseREIT Average
TargetStandalone
2009
E E
BIT
DA
(x)
REIT Multiples
90
TIP REIT will trade at a significant premium to any REIT because of its stability, security, and certain growth
2009E EV/EBITDA
Note: Target Standalone, Large Cap REITs, and Triple Net Lease REITs stock prices based on 20-day trading average as of 10/24/08

TIP REIT’s only commonality with other REITs is its Tax-Exempt structure
91

Why Would this Transaction Improve Target Corp’s Valuation?

93
Improves Store-level ROIC at Target Corp
Assuming the average store real estate costs $26mm, of which $13mm is allocated to the land and $13mm to the building, we believe store level return on investment would increase from 23.0% to 39.8%
(1) Assumes $0.9mm of ground lease rent expense, based on $7/sq. ft. lease cost and 131k of store square footage, on average
Owned Store Level Operating Data and Assumptions ($mm)
Standalone 2007A
Pro Forma 2007A
Retail Sales per Avg. Store $40 $40
Estimated Four-Wall Operating Costs 34 35 Ground Lease Expense per Avg. Store -- 1(1)
Estimated Four-Wall EBIT per Avg. Store $6 $5 Margin (%) 15.0% 13.0%
New Land Capex $13 -- New Building Capex 13 13 Total Investment $26 $13 Estimated Returns on Investment (%) 23.0% 39.8%

Earnings per Share ($)'09-'13CAGR
2008 2009 2010 2011 2012 2013 (%)
PF Target Corp 1 $2.23 $2.67 $3.20 $3.70 $4.27
EPS Growth (%) 19.5% 20.2% 15.5% 15.3%
Target Standalone 1, 2 $3.29 $3.40 $3.90 $4.57 $5.18 $5.89
EPS Growth (%) 3.5% 14.8% 17.0% 13.4% 13.8%
Memo: Operating Assumptions:Same-store sales 0.5% 3.3% 3.5% 3.5% 3.5%Sq. ft. growth 4.7% 4.1% 6.0% 6.5% 7.0%
Gross Margin 30.0% 30.1% 30.2% 30.2% 30.2%SG&A as % of sales 20.2% 20.1% 20.0% 20.0% 20.0%
(1) Assumes remaining 53% interest of credit card business sold for $4.4bn on 01/01/09 and all proceeds used to pay down debt(2) Assumes Target Standalone maintains existing dividend policy
17.6%
14.7%
94
Increases Target Corp’s EPS Growth Rate
Because of its higher ROIC, improved free cash flow profile, and more efficient capital structure, Target Corp’s EPS growth will exceed that of Target Standalone

8.0%8.0%9.0%9.0%
10.0%10.0%11.0%
12.0%12.0%12.0%12.9%13.0%
13.5%14.0%14.0%
14.5%14.7%(1),(2),(3)
15.0%16.0%
17.6%(1),(2),(3)
0
3
6
9
12
15
18
21
WholeFoods
Kohl's CVS Lowe's Staples Walgreens TJX Costco Safeway HomeDepot
Best Buy Wal-Mart Sears BJ's Kroger JCPenney
Average(4) = 11.9%
95
Long-term EPS Growth (%)
Pro forma for the Transaction, Target Corp’s long-term EPS growth rate would be at the top of its peer group
Corp Standalone
Increases Target Corp’s EPS Growth Rate (cont’d)
SUPERVALU Macy’s
(1) Represents 2009–2013 EPS CAGR(2) Assumes additional future share buyback at a constant forward P/E of 16.0x(3) Assumes sale of credit card business for $4.4bn on 1/1/09 and uses proceeds to pay down debt(4) Excludes TargetSource: FactSet and Company filings for Retailers, excluding Target

Multiple Expansion at Target Corp
Target Corp will trade at a higher multiple than current Target Standalone due to a powerful combination of improved ROIC and EPS growth
ROIC and EPS Growth – key value drivers with a direct impact on multiples
Improving both metrics concurrently is a powerful value creatingcombination which should lead to multiple expansion
More efficient cash generation results in higher ROIC at virtually same level of risk, resulting in substantial economic value added
Increased returns and more efficient cash flow generation allow for additional share buybacks that foster EPS growth
“Growth does indeed drive multiples, but only when combined with a healthy return on invested capital.” (Tim Koller et. al, McKinsey & Co.)
96

Why is this Transaction Ideally Suited for Target?

“Land-only” REIT Spin-off is Value Maximizing for Retailers Meeting Certain Criteria
Retailer Criteria:
High Land Ownership
Strong Square FootageGrowth Opportunity in the U.S.
Retailers that own most of their land and buildings are ideally suited for a “Land-only” REIT spin-off
To create the most value from a “Land-only” REIT spin-off, a retailer must meet certain criteria including very high land ownership, predominantly U.S.-based real estate and retail sales, strong square footage growth in the U.S., and low valuation multiples. Target meets ALL of these criteria
98
Predominantly U.S. Real Estate and U.S. Retail Sales
Low EV / EBITDA Multiple Relative to REITs
Commentary: Application to Target:Target owns more of its store land and buildings than any other big box retailer in the U.S.
Retailers with strong growth opportunities in the U.S. can provide a dependable development pipeline for the “Land-only”REIT, enhancing the REIT’s value
Target is one of the fastest growing U.S. big box retailers in the country with mid-to-high single digit expected sq. ft. long-term growth for the foreseeable future
International real estate is not well suited for a tax-free REIT spin-off, given regulatory issues and tax complications
Target’s real estate is exclusively based in the U.S. Target’s EBITDA is generated exclusively from U.S.-based sales
Retailers trading at low EV / EBITDA multiples can release the greatest value from the “Land-only” REIT spin-off
Target trades at 6.0x ’09E EBITDA versus large cap REITs at 15.7x EBITDA and TIP REIT at 19.3x EBITDA
Strong, Stable Retail Operations with Attractive Credit Profile
Retailers with strong and stable operations will be a high-quality tenant
Target is a market share winner with leading retail operations, stable FCF and strong management
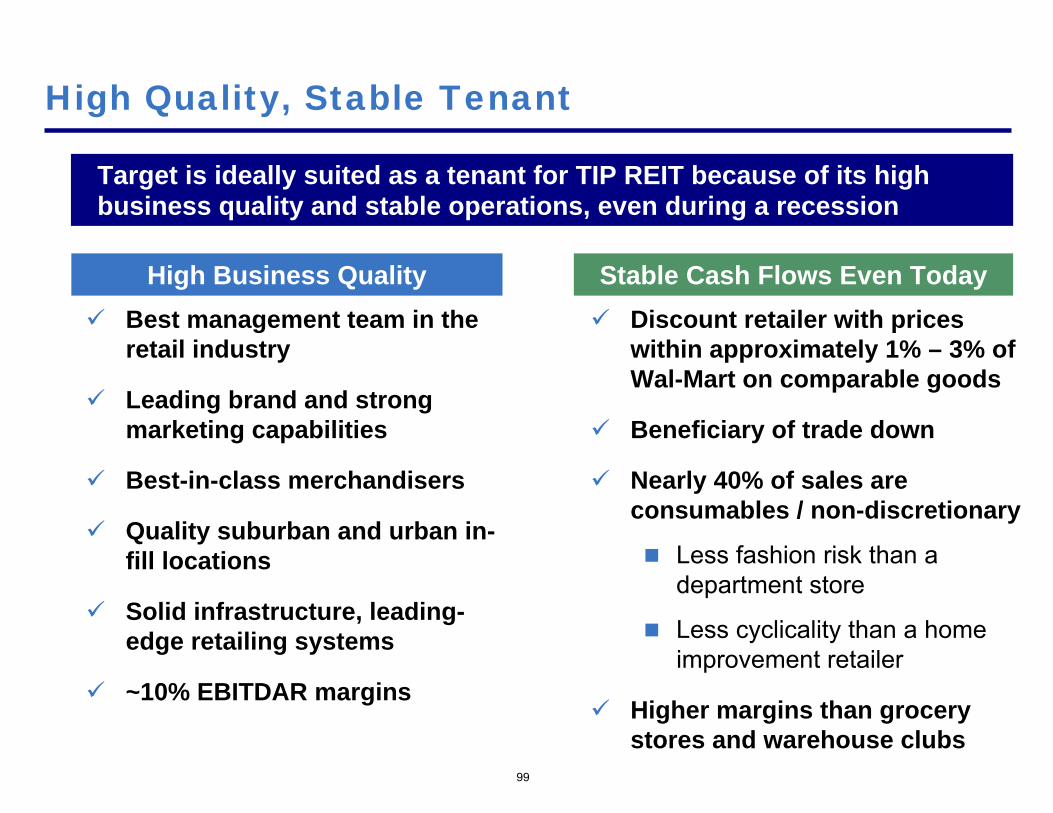
High Quality, Stable Tenant
Target is ideally suited as a tenant for TIP REIT because of its high business quality and stable operations, even during a recession
High Business QualityBest management team in the retail industry
Leading brand and strong marketing capabilities
Best-in-class merchandisers
Quality suburban and urban in-fill locations
Solid infrastructure, leading-edge retailing systems
~10% EBITDAR margins
Stable Cash Flows Even TodayDiscount retailer with prices within approximately 1% – 3% of Wal-Mart on comparable goods
Beneficiary of trade down
Nearly 40% of sales are consumables / non-discretionary
Less fashion risk than a department store
Less cyclicality than a home improvement retailer
Higher margins than grocery stores and warehouse clubs
99

Target: Beneficiary of Trade Down
Consider the $1,235 patent-leather satchel with golden hardware designed by Anya Hindmarch. Mary Hall, a marketing manager at I.B.M. in Redondo Beach, Calif., heard its siren call. Then she went to Target to purchase a similarly shiny purse, made out of polyvinyl chloride, by the same designer. Price: $49.99. “In the current economy, I thought I would reform,” Ms. Hall said. Welcome to “recession chic” and its personification, the “recessionista,” the new name for the style maven on a budget.
New York Times, 10/24/2008
Indeed, many diehard Nordstrom fans came prepared to open up their purses for $545 Moschino shoes and $1,495 Valentino handbags. Kim Calloway, a 38-year-old senior accountant, arrived at 7:50 a.m. and walked out with $1,200 worth of jeans, cosmetics and skin care products, noting that she hasn't cut back on her spending. "I probably should, but I probably won't," she said. Others, warier about the economy, came more for the spectacle. Charlene Stone, 49, of Wexford, an affluent suburb, didn't buy anything but enjoyed looking. Lately, she has been shopping more at discounter Target for her daughter's clothes. "I'm about the bargains," she said.
Wall Street Journal, 10/25/2008
100

101
What if TGT’s Valuation Normalizes to Historical Levels?
Last 5 year average
@ $40 (1) TIP REIT@ 38/share
Large Cap REITs (1)
Target’s EV / Forward EBITDA Multiple REIT Forward EV / EBITDA Multiple
8.2x 6.0x 19.3x 15.7x
When reviewing Target’s historical EV / EBITDA multiples, on average, Target has not been afforded the valuation levels of a typical Large Cap REIT or the expected valuation multiple of TIP REIT
Even if Target’s valuation multiples normalized over the next 12 – 18 months to historical levels, Target’s Standalone valuation multiples would never reach the expected EV/EBITDA multiples of TIP REIT
TIP REIT does not pay taxes and has no maintenance capital requirements
Importantly, with 22% of Target’s existing EBITDA representing the ground lease rents available to TIP REIT, the separation of TIP REIT would allow for significant shareholder value creation for Target shareholders
(1) Based on a 20-day trading average as of 10/24/08

What are the Risks?
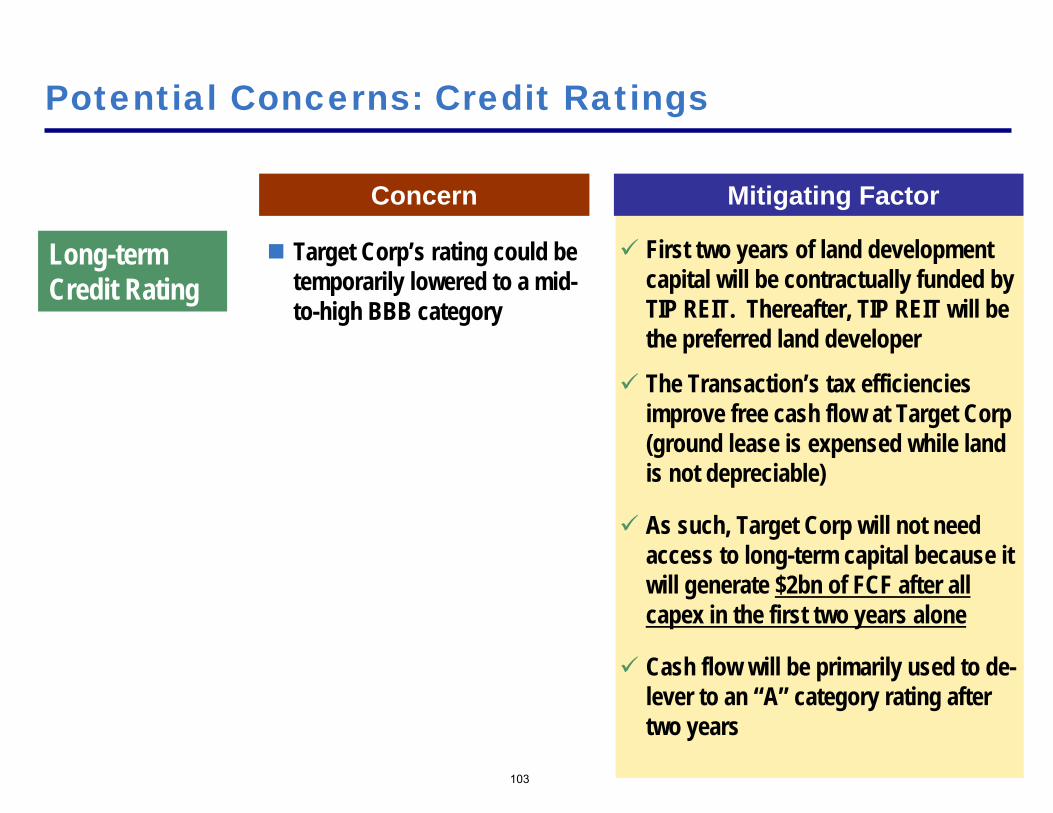
Potential Concerns: Credit Ratings
Concern Mitigating Factor
Long-termCredit Rating
Target Corp’s rating could be temporarily lowered to a mid-to-high BBB category
First two years of land development capital will be contractually funded by TIP REIT. Thereafter, TIP REIT will be the preferred land developer
The Transaction’s tax efficiencies improve free cash flow at Target Corp (ground lease is expensed while land is not depreciable)
As such, Target Corp will not need access to long-term capital because it will generate $2bn of FCF after all capex in the first two years alone
Cash flow will be primarily used to de-lever to an “A” category rating after two years
103
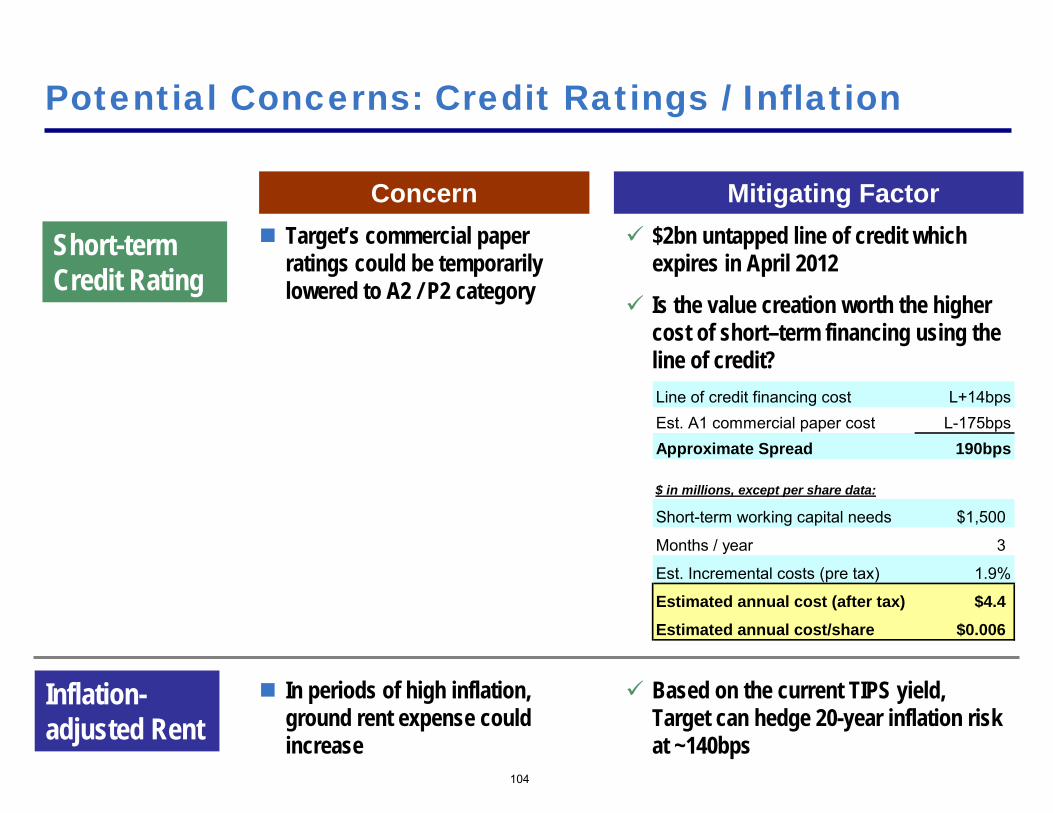
Potential Concerns: Credit Ratings / Inflation
Concern Mitigating Factor
Short-term Credit Rating
Target’s commercial paper ratings could be temporarily lowered to A2 / P2 category
Based on the current TIPS yield, Target can hedge 20-year inflation risk at ~140bps
104
Inflation-adjusted Rent
In periods of high inflation, ground rent expense could increase
$2bn untapped line of credit which expires in April 2012
Is the value creation worth the higher cost of short–term financing using the line of credit?Line of credit financing cost L+14bpsEst. A1 commercial paper cost L-175bpsApproximate Spread 190bps
$ in millions, except per share data:
Short-term working capital needs $1,500
Months / year 3
Est. Incremental costs (pre tax) 1.9%
Estimated annual cost (after tax) $4.4
Estimated annual cost/share $0.006
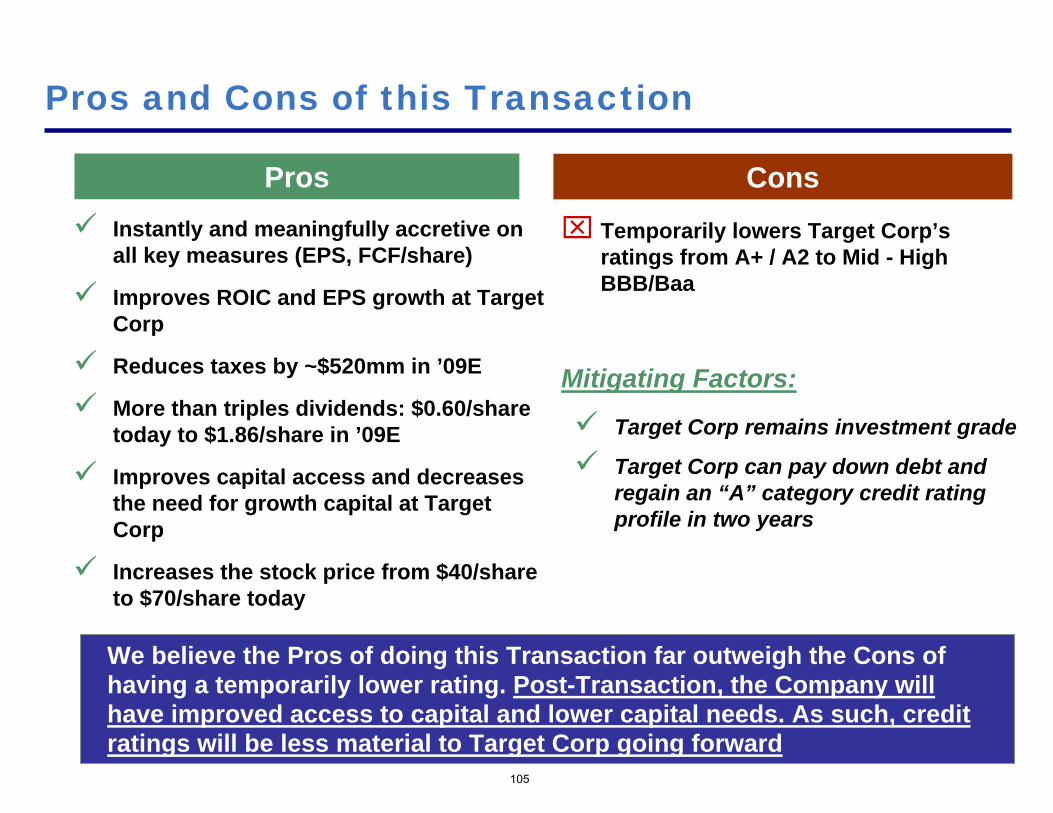
105
Pros and Cons of this Transaction
Instantly and meaningfully accretive on all key measures (EPS, FCF/share)
Improves ROIC and EPS growth at Target Corp
Reduces taxes by ~$520mm in ’09E
More than triples dividends: $0.60/share today to $1.86/share in ’09E
Improves capital access and decreases the need for growth capital at Target Corp
Increases the stock price from $40/share to $70/share today
⌧ Temporarily lowers Target Corp’s ratings from A+ / A2 to Mid - HighBBB/Baa
Mitigating Factors:
Target Corp remains investment grade
Target Corp can pay down debt and regain an “A” category credit rating profile in two years
Pros Cons
We believe the Pros of doing this Transaction far outweigh the Cons of having a temporarily lower rating. Post-Transaction, the Company will have improved access to capital and lower capital needs. As such, credit ratings will be less material to Target Corp going forward
Another way to pose the question:
Would you pursue this Transaction if it were a Strategic Acquisition?
106

107
What If this Were an Acquisition?
⌧ Temporarily lowers Target Corp’s ratings from A+ / A2 to Mid - HighBBB/Baa
Mitigating Factors:
Target Corp remains investment grade
Target Corp can pay down debt and achieve a higher credit rating in two years
Acquisition Rationale Acquisition Risks
It is common for a company to pursue an acquisition that greatlyincreases shareholder value and temporarily lowers ratings to anacceptable investment grade level
Instantly and meaningfully accretive on all key measures (EPS, FCF/share)
Improves ROIC and EPS growth at Target Corp
Reduces taxes by ~$520mm in ’09E
More than triples dividends: $0.60/share today to $1.86/share in ‘09
Improves capital access and decreases the need for growth capital at Target Corp
Increases the stock price from $40/share to $70/share today
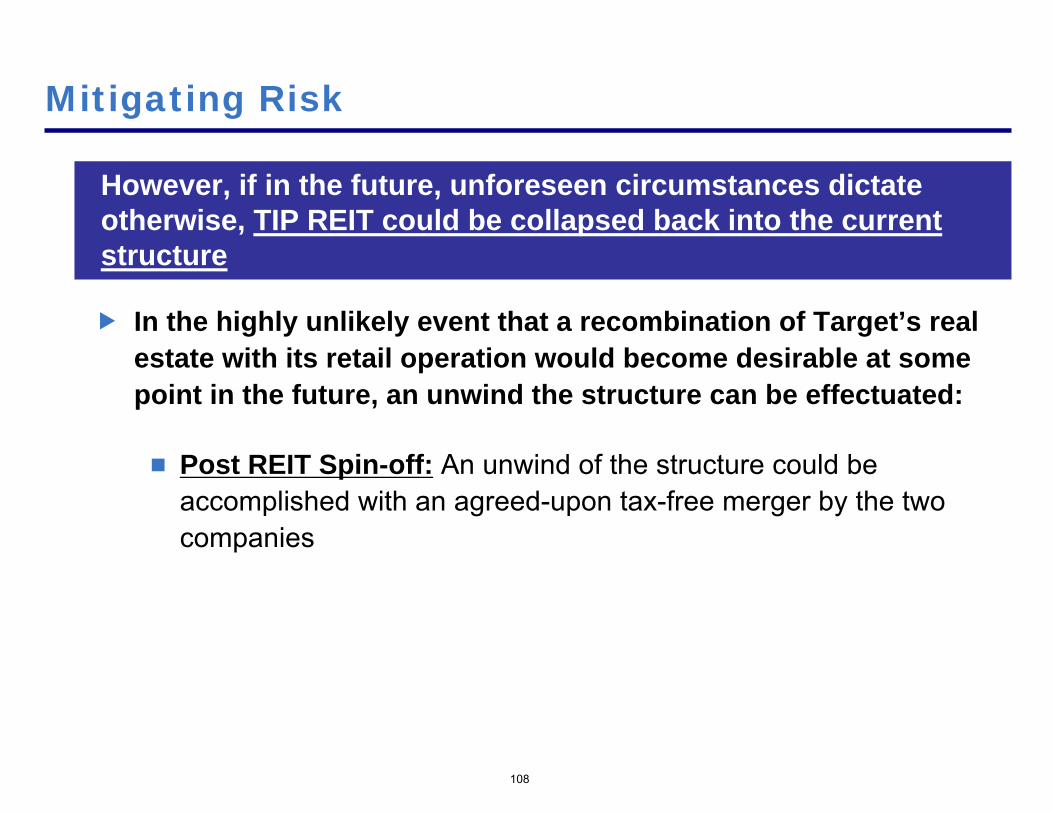
108
Mitigating Risk
In the highly unlikely event that a recombination of Target’s real estate with its retail operation would become desirable at some point in the future, an unwind the structure can be effectuated:
Post REIT Spin-off: An unwind of the structure could be accomplished with an agreed-upon tax-free merger by the two companies
However, if in the future, unforeseen circumstances dictate otherwise, TIP REIT could be collapsed back into the current structure

Other Potential Questions

What is the Governance Structure of TIP REIT?
110
TIP REIT would be incorporated where most REITs are incorporated: Maryland
Jurisdiction: We believe Maryland is the most favorable jurisdiction for TIP REIT
Ownership Restrictions: The certificate of incorporation of TIP REIT would include a customary 9.9% actual and constructive ownershiplimit and other provisions customary for REITs to assure compliance with REIT ownership and related-party rent rules
Other Governance Provisions: Similar to Target Corp’s existing governance rules except as the Board may otherwise determine in connection with the Transaction

Will Consents Be Needed?
Minnesota Corporate Statute Requiring Shareholder Vote for Transfer of All or Substantially All Assets
The Transaction meets Minnesota’s safe harbor for not being a transfer of “all or substantially all assets” and therefore does not trigger shareholder vote
Bond Indenture Covenants
Covenant restricting transfer of assets substantially as an entirety:The Transaction – which only involves Target’s land – is not a transfer of assets “substantially as an entirety” and therefore does not breach this covenant
Covenant restricting sale (or transfer) and leaseback of an “Operating Property” with an entity other than a restricted subsidiary:
The transfer/leaseback is with an entity that at the time of the transfer/leaseback is a restricted subsidiary and it is therefore exempt from this covenant (the subsequent spin off is permitted since the indenture does not include any dividend stopper)In addition, none of the land parcels being transferred is an Operating Property subject to this covenant since none has a net book value greater than 0.35% of Consolidated Net Tangible AssetsAlso, if the Board designates subsidiaries currently holding land to be unrestricted subsidiaries as permitted by the indenture, the covenant will not apply to a transfer / leaseback by those subsidiaries
No other indenture issues identified111
No Shareholder or Bondholder consents are needed

Q & A

Appendix
Detailed Valuation Analysis

$0
$20
$40
$60
$80
Target (20-Day Avg. Price) ¹ Target REIT Spin-Off ² 12-Month Price Target ²
$/Sh
are
TIP REIT
Target CorpTarget
Standalone
74%
$40
$70
$38
$32 $42
$42
$83
TIP REIT
Target Corp
Valuation Summary
115
For illustrative purposes, assumes Transaction occurs on 01/01/09(1) Based on 20-day trading average as of 10/24/08; assumes sale of remaining 53% interest on credit card business with proceeds used to pay down debt (2) Based on mid-point of valuation analysis
Equity Value ($bn) $29 $23 Equity Value ($bn) $30Enterprise Value ($bn) $40 $34 Enterprise Value ($bn) $40 '09E EV/EBITDA 6.0x 6.5x '10E EV/EBITDA 7.0x '09E P/E 11.8x 14.2x '10E P/E 15.6x Equity Value ($bn) $27.5 Equity Value ($bn) $30 Enterprise Value ($bn) $27.5 Enterprise Value ($bn) $31 ‘09E Dividend Yield 4.9% ‘10E Dividend Yield 4.7% Cap Rate 5.3% Cap Rate 5.0% '09E P/AFFO 20.5x '10E P/AFFO 21.4x '09E EV/EBITDA 19.3x '10E EV/EBITDA 20.3x
Targ
etC
orp
TIP
REI
T

Valuation Analysis – TIP REIT

TIP REIT Summary of Valuation Analysis: Today
117
Various methodologies imply a TIP REIT reference range of $25 – $30bn, or $35 – $42/share today
Valuation Range($25bn – $30bn)
Net Asset – 4.65% – 5.15% Dividend Yield on Existing Ground LeaseValue – Dividend Yield Based on Sum of CDS Spread and TIPS Yield(TIPS) – CY2008 Existing Dividends: $1,354mm
– 20-year DCF Analysis of Platform– 10.50% – 12.50% Discount Rate on Platform
Net Asset – 5.50% – 6.25% Cap Rate on Existing Ground LeaseValue – Cap Rate Range Based on Precedent Transactions
(Precedents) – CY2009 Existing NOI: $1,354mm– 20-year DCF Analysis of Platform– 10.50% – 12.50% Discount Rate on Platform
Discounted – 8.0% – 10.0% WACCCash Flow – 4.65% – 5.15% Terminal Cap Rate
Equity Value ($bn)Implied Multiples: ($mm) $25.0 $27.5 $30.0 CY2009 AFFO 1,344 18.6x 20.5x 22.3x CY2009 EBITDA 1,427 17.5x 19.3x 21.0x CY2009 Div. Yield 1,344 5.4% 4.9% 4.5% Cap Rate 1,462 5.8% 5.3% 4.9%
21.7
27.8
31.4
25.8
33.6
26.3
15.0 20.0 25.0 30.0 35.0 40.0
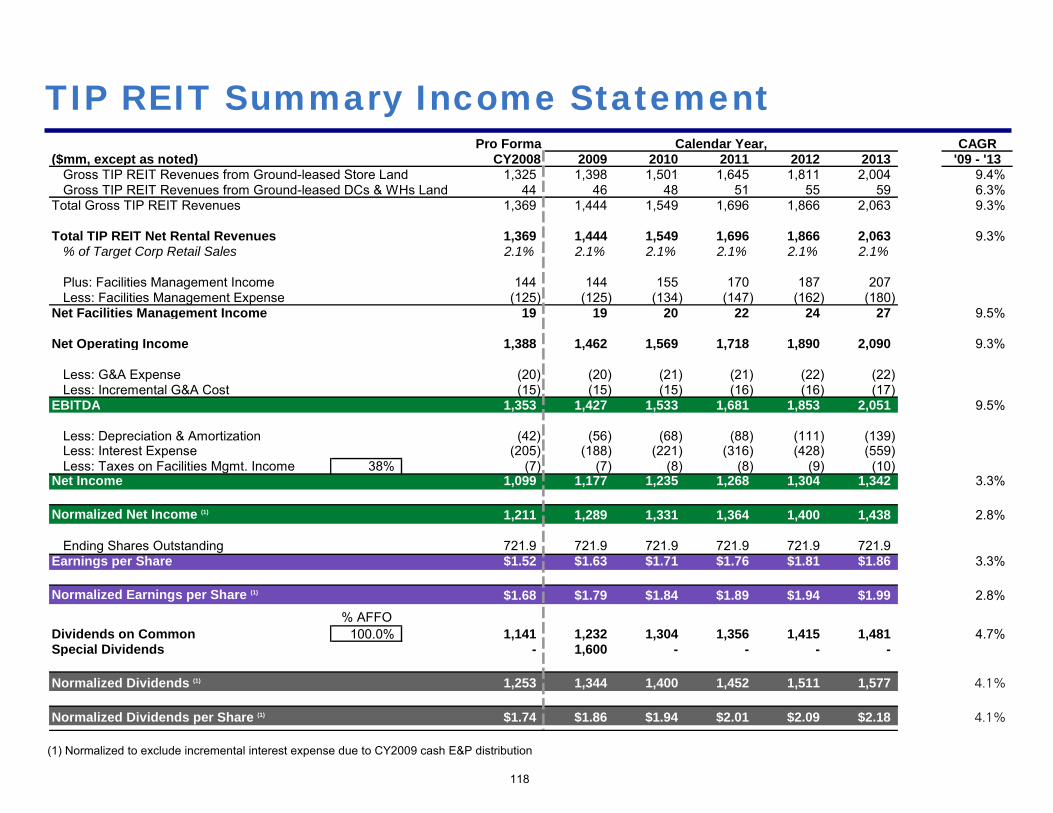
118
TIP REIT Summary Income Statement
(1) Normalized to exclude incremental interest expense due to CY2009 cash E&P distribution
Pro Forma Calendar Year, CAGR($mm, except as noted) CY2008 2009 2010 2011 2012 2013 '09 - '13
Gross TIP REIT Revenues from Ground-leased Store Land 1,325 1,398 1,501 1,645 1,811 2,004 9.4%Gross TIP REIT Revenues from Ground-leased DCs & WHs Land 44 46 48 51 55 59 6.3%
Total Gross TIP REIT Revenues 1,369 1,444 1,549 1,696 1,866 2,063 9.3%
Total TIP REIT Net Rental Revenues 1,369 1,444 1,549 1,696 1,866 2,063 9.3%% of Target Corp Retail Sales 2.1% 2.1% 2.1% 2.1% 2.1% 2.1%
Plus: Facilities Management Income 144 144 155 170 187 207 Less: Facilities Management Expense (125) (125) (134) (147) (162) (180)
Net Facilities Management Income 19 19 20 22 24 27 9.5%
Net Operating Income 1,388 1,462 1,569 1,718 1,890 2,090 9.3%
Less: G&A Expense (20) (20) (21) (21) (22) (22) Less: Incremental G&A Cost (15) (15) (15) (16) (16) (17)
EBITDA 1,353 1,427 1,533 1,681 1,853 2,051 9.5%
Less: Depreciation & Amortization (42) (56) (68) (88) (111) (139) Less: Interest Expense (205) (188) (221) (316) (428) (559) Less: Taxes on Facilities Mgmt. Income 38% (7) (7) (8) (8) (9) (10)
Net Income 1,099 1,177 1,235 1,268 1,304 1,342 3.3%
Normalized Net Income (1) 1,211 1,289 1,331 1,364 1,400 1,438 2.8%
Ending Shares Outstanding 721.9 721.9 721.9 721.9 721.9 721.9 Earnings per Share $1.52 $1.63 $1.71 $1.76 $1.81 $1.86 3.3%
Normalized Earnings per Share (1) $1.68 $1.79 $1.84 $1.89 $1.94 $1.99 2.8%% AFFO
Dividends on Common 100.0% 1,141 1,232 1,304 1,356 1,415 1,481 4.7%Special Dividends - 1,600 - - - -
Normalized Dividends (1) 1,253 1,344 1,400 1,452 1,511 1,577 4.1%
Normalized Dividends per Share (1) $1.74 $1.86 $1.94 $2.01 $2.09 $2.18 4.1%

119
TIP REIT Summary Balance Sheet/CF Statement
Calendar Year,($mm, except as noted) 2009 2010 2011 2012 2013EBITDA 1,427 1,533 1,681 1,853 2,051 Less: Interest Expense (188) (221) (316) (428) (559) Less: Taxes on Facilities Mgmt. Income (7) (8) (8) (9) (10) Less: Development Capex (1,079) (1,008) (1,582) (1,863) (2,190) Total Free Cash Flow 154 295 (226) (447) (709)
Total Cash 3 3 3 3 3 Total Debt 2,682 3,690 5,272 7,135 9,325
Total Debt / EBITDA 1.9x 2.4x 3.1x 3.9x 4.5x
EBITDA / Interest Expense 7.6x 6.9x 5.3x 4.3x 3.7x
Total Debt / Total Real Estate Value 11.1% 14.2% 18.6% 22.9% 27.0%
Ending Shares Outstanding 722 722 722 722 722

120
TIP REIT Valuation Matrix
Set forth below is a valuation matrix that demonstrates TIP REIT’s trading multiples at various values within the reference range
Value per Share($mm) $34.50 $36.50 $38.09 $40.50 $42.50
Shares O/S
EQUITY VALUE 721.9 24,907 26,351 27,500 29,238 30,682
Multiples of: Metrics
CY 2009 FFO (1) 1,344 18.5x 19.6x 20.5x 21.7x 22.8x
CY 2010 FFO (1) 1,400 17.8x 18.8x 19.6x 20.9x 21.9x
CY 2011 FFO (1) 1,452 17.1x 18.1x 18.9x 20.1x 21.1x
CY 2009 AFFO (1) 1,344 18.5x 19.6x 20.5x 21.7x 22.8x
CY 2010 AFFO (1) 1,400 17.8x 18.8x 19.6x 20.9x 21.9x
CY 2011 AFFO (1) 1,452 17.1x 18.1x 18.9x 20.1x 21.1x
Dividend Yield Assuming Payout Ratio of:
80% of CY 2009 AFFO 1,076 4.3% 4.1% 3.9% 3.7% 3.5%
90% of CY 2009 AFFO 1,210 4.9% 4.6% 4.4% 4.1% 3.9%
100% of CY 2009 AFFO 1,344 5.4% 5.1% 4.9% 4.6% 4.4%
Implied Value: Implied Value of Land / Blended Sq. Ft. 225 $111 $117 $122 $130 $137
(1) Normalized to exclude incremental interest expense due to CY2009 cash E&P distributions

121
TIP REIT NAV (TIPS) Analysis
Existing Lease Valuation
Inflation-indexed rent growth allows for a “TIPS-like” risk/return
Dividend yield range based on theoretical analysis:TIPS yield of 3.00% + Target unsecured CDS of 1.65% – 2.15% = Total yield of 4.65% – 5.15%
Implied valuation at 4.65% – 5.15% dividend yield range2008E dividend: $1,354mmValuation range of $26bn – $29bn
Platform Valuation
Based on 20-year DCF analysis
Implied valuation at 4.65% – 5.15% cap rate and 10.5% – 12.5% discount rate2029E terminal NOI: $2,560mmValuation range of $0.0bn – $2.3bn
The implied TIP REIT valuation range on TIPS-based NAV analysis is $26 –$31bn, or $36 – $44/share today

122
TIP REIT NAV (TIPS) Analysis (cont’d)
The implied TIP REIT valuation range on TIPS-based NAV analysis is $26 –$31bn, or $36 – $44/share today
($mm, except per share data) 2008
Rental Revenues - Store Land $1,325Rental Revenues - DCs & WHs Land 44Incremental Standalone Costs (15)Rental Revenues from Existing Ground Lease $1,354Dividend Yield 5.15% 4.65%
+ Present Value of Existing Ground Lease $26,300 $29,128TerminalValue (1)
2009 2010 2011 2012 2013 ... 2029Incremental Rental Revenues $74 $145 $257 $391 $551After-tax Facilities Management Income 12 12 14 15 17G&A Expense (20) (21) (21) (22) (22)Total Capex (1,079) (1,008) (1,582) (1,863) (2,190)Free Cash Flow from Platform ($1,013) ($872) ($1,332) ($1,478) ($1,644)Terminal Value $55,047Discount Rate 12.5% 10.5%Terminal Cap Rate 5.15% 4.65%Present Value of Platform – $2,293
––Existing Ground Lease $26,300 $29,128Platform Value – 2,293Implied Enterprise Value $26,300 $31,421Net Debt – – Implied Equity Value $26,300 $31,421Value per Share $36 $44
(1) Based on 2029E NOI of $2,560mm and 4.65% cap rate
Existing Ground Lease
Platform Value
Total TIP REIT Value

123
TIP REIT NAV (Ground Lease Precedents) Analysis
Existing Lease Valuation
Cap rate range based on ground lease precedents: 5.50% – 6.25%
Implied valuation at 5.50% – 6.25% cap rate range2009E NOI: $1,354mmValuation range of $22bn – $25bn
Platform Valuation
Based on 20-year DCF analysis
Implied valuation at 5.50% – 6.25% cap rate and 10.5% – 12.5% discount rate2029E terminal NOI: $2,560mmValuation range of $0.0bn – $1.1bn
The implied TIP REIT valuation range on Ground Lease Precedents-based NAV analysis is $22 – $26bn, or $30 – $36/share today

124
TIP REIT NAV (Ground Lease Precedents) Analysis (cont’d)
($mm, except per share data) 2009
Rental Revenues - Store Land $1,325Rental Revenues - DCs & WHs Land 44Incremental Standalone Costs (15)Rental Revenues from Existing Ground Lease $1,354Cap Rate 6.25% 5.50%
+ Present Value of Existing Ground Lease $21,671 $24,626TerminalValue (1)
2009 2010 2011 2012 2013 ... 2029Incremental Rental Revenues $74 $145 $257 $391 $551After-tax Facilities Management Income 12 12 14 15 17G&A Expense (20) (21) (21) (22) (22)Total Capex (1,079) (1,008) (1,582) (1,863) (2,190)Free Cash Flow from Platform ($1,013) ($872) ($1,332) ($1,478) ($1,644)Terminal Value $46,540Discount Rate 12.5% 10.5%Terminal Cap Rate 6.25% 5.50%Present Value of Platform – $1,138
––Existing Ground Lease $21,671 $24,626Platform Value – 1,138Implied Enterprise Value $21,671 $25,764Net Debt – – Implied Equity Value $21,671 $25,764Value per Share $30 $36
(1) Based on 2029E NOI of $2,560mm and 5.50% cap rate
Existing Ground Lease
Platform Value
Total TIP REIT Value
The implied TIP REIT valuation range on Ground Lease Precedents-based NAV analysis is $22 – $26bn, or $30 – $36/share today
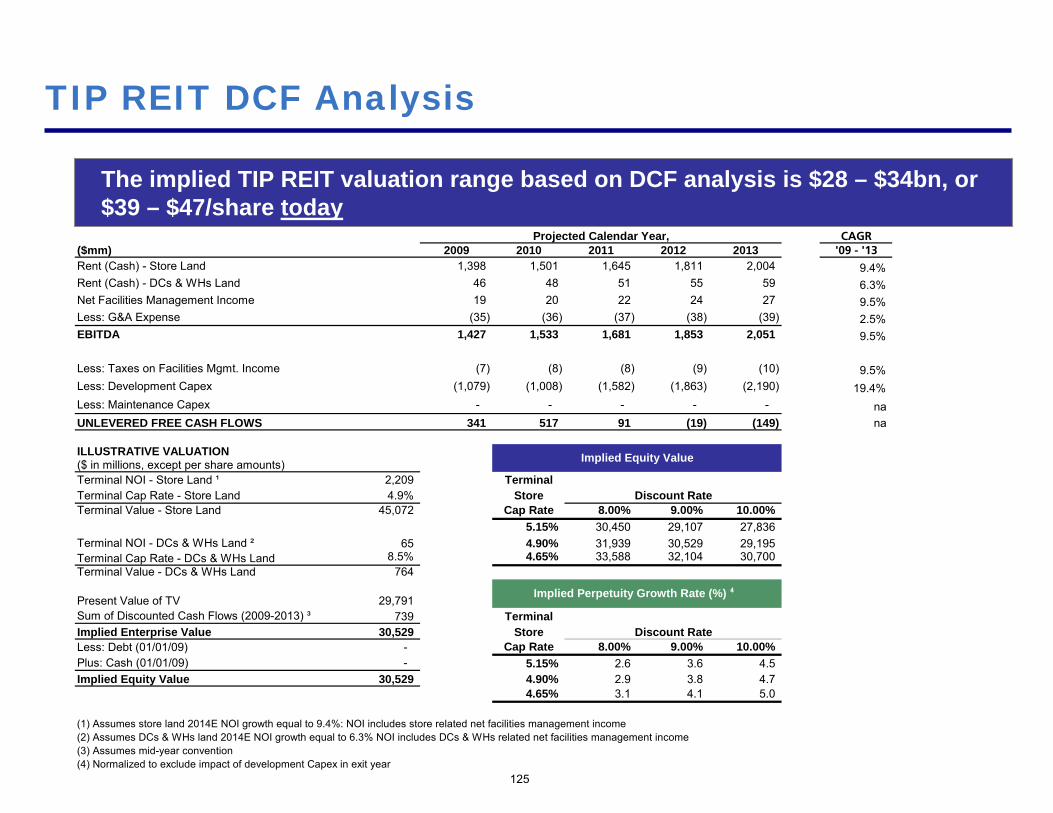
125
TIP REIT DCF Analysis
The implied TIP REIT valuation range based on DCF analysis is $28 – $34bn, or $39 – $47/share today
Projected Calendar Year, CAGR($mm) 2009 2010 2011 2012 2013 '09 - '13Rent (Cash) - Store Land 1,398 1,501 1,645 1,811 2,004 9.4%Rent (Cash) - DCs & WHs Land 46 48 51 55 59 6.3%Net Facilities Management Income 19 20 22 24 27 9.5%Less: G&A Expense (35) (36) (37) (38) (39) 2.5%EBITDA 1,427 1,533 1,681 1,853 2,051 9.5%
Less: Taxes on Facilities Mgmt. Income (7) (8) (8) (9) (10) 9.5%Less: Development Capex (1,079) (1,008) (1,582) (1,863) (2,190) 19.4%Less: Maintenance Capex - - - - - na UNLEVERED FREE CASH FLOWS 341 517 91 (19) (149) na
ILLUSTRATIVE VALUATION($ in millions, except per share amounts)Terminal NOI - Store Land ¹ 2,209 TerminalTerminal Cap Rate - Store Land 4.9% Store Discount RateTerminal Value - Store Land 45,072 Cap Rate 8.00% 9.00% 10.00%
5.15% 30,450 29,107 27,836 Terminal NOI - DCs & WHs Land ² 65 4.90% 31,939 30,529 29,195 Terminal Cap Rate - DCs & WHs Land 8.5% 4.65% 33,588 32,104 30,700 Terminal Value - DCs & WHs Land 764
Present Value of TV 29,791 Sum of Discounted Cash Flows (2009-2013) ³ 739 TerminalImplied Enterprise Value 30,529 Store Discount RateLess: Debt (01/01/09) - Cap Rate 8.00% 9.00% 10.00%Plus: Cash (01/01/09) - 5.15% 2.6 3.6 4.5 Implied Equity Value 30,529 4.90% 2.9 3.8 4.7
4.65% 3.1 4.1 5.0
(1) Assumes store land 2014E NOI growth equal to 9.4%: NOI includes store related net facilities management income(2) Assumes DCs & WHs land 2014E NOI growth equal to 6.3% NOI includes DCs & WHs related net facilities management income(3) Assumes mid-year convention(4) Normalized to exclude impact of development Capex in exit year
Implied Equity Value
Implied Perpetuity Growth Rate (%) ⁴

TIP REIT Valuation—12-Month Price Target
126
Various methodologies imply a TIP REIT reference range of $27.5 – $32.5bn, or $38 – $45/share 12 months from today
Valuation Range($27.5bn – $32.5bn)
Net Asset – 4.65% – 5.15% Dividend Yield on Existing Ground LeaseValue – Dividend Yield Based on Sum of CDS Spread and TIPS Yield(TIPS) – CY2009 Existing Dividends: $1,429mm
– 20-year DCF Analysis of Platform– 10.50% – 12.50% Discount Rate on Platform– Includes normalized dividends of $1,344mm in CY2009
Net Asset – 5.50% – 6.25% Cap Rate on Existing Ground LeaseValue – Cap Rate Range Based on Precedent Transactions
(Precedents) – CY2010 Existing NOI: $1,464mm– 20-year DCF Analysis of Platform– 10.50% – 12.50% Discount Rate on Platform– Includes normalized dividends of $1,344mm in CY2009
Discounted – 8.0% – 10.0% WACCCash Flow – 4.65% – 5.15% Terminal Cap Rate
– Includes normalized dividends of $1,344mm in CY2009
Equity Value ($bn)Implied Multiples: ($mm) $27.5 $30.0 $32.5 CY2010 AFFO 1,400 19.6x 21.4x 23.2x CY2010 EBITDA 1,533 18.6x 20.3x 21.9x CY2010 Div. Yield 1,400 5.1% 4.7% 4.3% Cap Rate 1,569 5.5% 5.0% 4.7%
23.7
31.2
33.3
28.0
37.4
28.0
17.5 22.5 27.5 32.5 37.5 42.5

Valuation Analysis – Target Corp

Trading Data – – 5.5–7.5x EBITDARetailers 1 – CY2009 EBITDA: $5,172mm
(EV/EBITDA) – Current Multiple is 6.0x
Trading Data – – 11.0–14.5x EPSRetailers 1 – CY2009 EPS: $2.23
(P/E) – Current Multiple is 11.8x
Trading Data – – 5 Year P/E of 15.9x and 5 Year EV/EBITDA of 8.2xTarget 5 Year Historical – CY2009 EPS: $2.23 and CY2009 EBITDA: $5,172mm
(P/E and EV/EBITDA) – Current P/E is 11.8x and current EV/EBITDA is 6.0x
Discounted – 9.0–11.0% WACCCash Flow – 6.0–7.0x Terminal EBITDA Multiple
($bn)
Equity Value 20.3 22.8 25.3Enterprise Value 31.3 33.8 36.3Share Price ($/Share) $28 $32 $35
'09 P/E 12.6x 14.2x 15.7x'10 P/E 10.6x 11.8x 13.1x
'09 PEG 0.7x 0.8x 0.9x'10 PEG 0.6x 0.7x 0.7x
'09 EV/EBITDA 6.0x 6.5x 7.0x(1) Based on 20-day average as of October 24, 2008 '10 EV/EBITDA 5.4x 5.9x 6.3x
17.7
25.6
26.4
27.8
23.4
31.5
35.4
17.5
15.0 25.0 35.0
Target Corp Summary Valuation Analysis: Today
Valuation Range($20.3bn–$25.3bn)
Equity Value ($bn)
128
The implied valuation range for Target Corp based on several methodologies outlined below is $20.3 – $25.3bn, or $28 – $35/share today
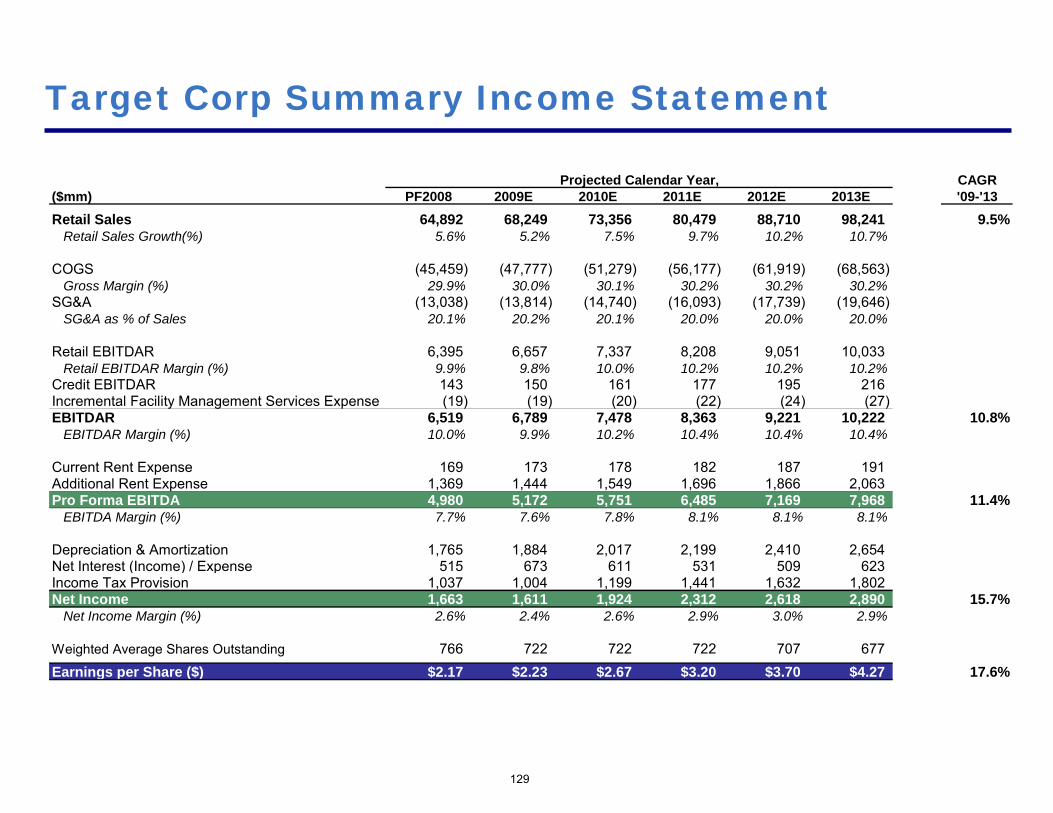
129
Target Corp Summary Income Statement
Projected Calendar Year, CAGR($mm) PF2008 2009E 2010E 2011E 2012E 2013E '09-'13Retail Sales 64,892 68,249 73,356 80,479 88,710 98,241 9.5%
Retail Sales Growth(%) 5.6% 5.2% 7.5% 9.7% 10.2% 10.7%
COGS (45,459) (47,777) (51,279) (56,177) (61,919) (68,563)Gross Margin (%) 29.9% 30.0% 30.1% 30.2% 30.2% 30.2%
SG&A (13,038) (13,814) (14,740) (16,093) (17,739) (19,646)SG&A as % of Sales 20.1% 20.2% 20.1% 20.0% 20.0% 20.0%
Retail EBITDAR 6,395 6,657 7,337 8,208 9,051 10,033Retail EBITDAR Margin (%) 9.9% 9.8% 10.0% 10.2% 10.2% 10.2%
Credit EBITDAR 143 150 161 177 195 216Incremental Facility Management Services Expense (19) (19) (20) (22) (24) (27) EBITDAR 6,519 6,789 7,478 8,363 9,221 10,222 10.8%
EBITDAR Margin (%) 10.0% 9.9% 10.2% 10.4% 10.4% 10.4%
Current Rent Expense 169 173 178 182 187 191Additional Rent Expense 1,369 1,444 1,549 1,696 1,866 2,063Pro Forma EBITDA 4,980 5,172 5,751 6,485 7,169 7,968 11.4%
EBITDA Margin (%) 7.7% 7.6% 7.8% 8.1% 8.1% 8.1%
Depreciation & Amortization 1,765 1,884 2,017 2,199 2,410 2,654Net Interest (Income) / Expense 515 673 611 531 509 623Income Tax Provision 1,037 1,004 1,199 1,441 1,632 1,802Net Income 1,663 1,611 1,924 2,312 2,618 2,890 15.7%
Net Income Margin (%) 2.6% 2.4% 2.6% 2.9% 3.0% 2.9%
Weighted Average Shares Outstanding 766 722 722 722 707 677Earnings per Share ($) $2.17 $2.23 $2.67 $3.20 $3.70 $4.27 17.6%

130
Target Corp Summary Balance Sheet/CF Statement
Significant Free Cash Flow generation allows Target Corp to de-leverage to 2.8x Lease Adj. Debt/EBITDAR
Projected Calendar Year,($mm) PF2008 2009E 2010E 2011E 2012E 2013EEBITDA 4,980 5,172 5,751 6,485 7,169 7,968Less: Interest Expense (515) (673) (611) (531) (509) (623)Less: Taxes (1,037) (1,004) (1,199) (1,441) (1,632) (1,802)Plus: Decrease in Net Working Capital 79 79 120 167 193 224Plus: Other 73 73 73 73 73 73Less: Maintenance Capex (1,714) (1,714) (1,827) (1,785) (1,968) (2,179)Maintenance Free Cash Flow 1,866 1,933 2,307 2,967 3,327 3,662Less: Growth Capex (1,112) (1,112) (1,023) (1,615) (1,902) (2,237)Total Free Cash Flow 754 821 1,284 1,352 1,424 1,425
Total Cash 500 682 734 805 887 982Total Debt 11,455 10,817 9,584 8,303 8,938 10,078
Lease Adj. Debt/EBITDAR 3.6x 3.5x 3.1x 2.8x 2.8x 2.8xDebt/EBITDA 2.3x 2.1x 1.7x 1.3x 1.2x 1.3xEBITDAR/(Interest+Rent) 3.2x 3.0x 3.2x 3.5x 3.6x 3.6xEBITDA/Interest 9.7x 7.7x 9.4x 12.2x 14.1x 12.8x
Ending Shares Outstanding 722 722 722 722 693 662Weighted Average Shares Outstanding 766 722 722 722 707 677

Value per ShareValuation Range ($mm) $28.00 $30.00 $31.58 $33.00 $35.00
Shares O/S
EQUITY VALUE 721.9 20,214 21,658 22,800 23,824 25,268
Net Debt (1/1/09) 10,955 10,955 10,955 10,955 10,955
ENTERPRISE VALUE 31,169 32,613 33,755 34,779 36,223
Multiples of: Metrics
CY 2008 EBITDA 4,980 6.3x 6.5x 6.8x 7.0x 7.3x
CY 2009 EBITDA 5,172 6.0x 6.3x 6.5x 6.7x 7.0x
CY 2010 EBITDA 5,751 5.4x 5.7x 5.9x 6.0x 6.3x
CY 2008 Earnings $2.17 12.9x 13.8x 14.5x 15.2x 16.1x
CY 2009 Earnings $2.23 12.5x 13.4x 14.2x 14.8x 15.7x
CY 2010 Earnings $2.67 10.5x 11.3x 11.8x 12.4x 13.1x
CY 2009 PEG 17.6% 0.7x 0.8x 0.8x 0.8x 0.9x
CY 2010 PEG 17.6% 0.6x 0.6x 0.7x 0.7x 0.7x
131
Target Corp Valuation Matrix
Set forth below is a valuation matrix that demonstrates Target Corp’s trading multiples at various stock prices

Trading Data For Other Retailers (1)
132
(1) As of October 24, 2008(2) Assumes 20-day average stock price, except for Target Corp (3) Assumes sale of credit card business for $4.4bn on 1/1/09 and uses proceeds to pay down debt(4) Implied multiples from midpoint of Target Corp valuation ($20.3bn–$25.3bn)(5) Represents 2009–2013 EPS CAGR(6) Excludes Target
EV/CY08E EV/CY09E EV/CY10E P/E Ratio PEG Ratio
Company name
Stock Price(2)
($)
% of 52wk High
Equity Value ($mm)
EV ($mm)
Sales(x)
EBITDA (x)
Sales (x)
EBITDA (x)
Sales(x)
EBITDA (x)
CY09E (x)
CY10E (x)
CY09E (x)
CY10E (x)
IBES LTG (%)
Total Debt/CY08E
EBITDA (x)
Adj. Debt/CY08E EBITDAR (x)
Target Standalone(3) 39.98 – 28,863 39,818 0.61 6.3 0.58 6.0 0.54 5.5 11.8 10.2 0.8 0.7 14.7(5) 1.8 2.0 Target Corp(4) 31.58 – 22,800 33,755 0.52 6.8 0.49 6.5 0.46 5.9 14.2 11.8 0.8 0.7 17.6(5) 2.3 3.6
Discounters Wal-Mart 54.91 86.0 216,168 255,900 0.63 8.4 0.58 7.8 0.55 7.4 14.4 13.0 1.3 1.2 11.0 1.5 1.8 Mean/Median 0.63 8.4 0.58 7.8 0.55 7.4 14.4 13.0 1.3 1.2 11.0 1.5 1.8 Supermarkets Kroger 26.08 84.2 17,196 24,618 0.32 6.2 0.30 5.8 0.28 5.6 12.3 11.2 1.4 1.2 9.0 1.9 2.8 Safeway 22.39 62.2 9,617 15,105 0.34 4.9 0.33 4.8 0.32 4.7 9.3 8.8 0.8 0.7 12.0 1.9 2.7 SUPERVALU 18.32 42.3 3,879 12,755 0.28 4.8 0.28 4.8 0.28 4.7 6.5 6.1 0.8 0.8 8.0 3.4 4.0 Whole Foods 15.67 30.7 2,198 3,013 0.37 5.8 0.34 5.2 0.31 4.9 14.1 11.2 0.9 0.7 16.0 1.6 3.4 Mean 0.33 5.4 0.31 5.2 0.30 5.0 10.6 9.3 1.0 0.9 11.3 2.2 3.2 Median 0.33 5.4 0.32 5.0 0.30 4.8 10.8 10.0 0.8 0.7 10.5 1.9 3.1 Department Stores Macy's 12.31 36.5 5,176 14,260 0.57 5.0 0.58 5.3 0.58 5.3 9.8 9.1 1.2 1.1 8.0 3.7 4.0 Kohl's 35.31 60.8 10,769 12,545 0.75 5.8 0.72 5.7 0.69 5.4 11.3 10.3 0.8 0.7 15.0 1.0 2.1 Sears 70.38 50.5 8,897 11,581 0.24 6.4 0.25 7.2 0.25 7.3 32.4 43.9 3.2 4.4 10.0 2.1 4.0 JCPenney 25.45 44.3 5,652 7,249 0.38 3.9 0.39 4.1 0.37 3.9 8.8 7.4 1.0 0.8 9.0 2.0 2.8 Mean 0.48 5.3 0.49 5.6 0.47 5.5 15.6 17.7 1.5 1.8 10.5 2.2 3.2 Median 0.47 5.4 0.48 5.5 0.48 5.4 10.5 9.7 1.1 1.0 9.5 2.1 3.4 Other Large Cap Retailers CVS 30.13 68.0 43,682 52,640 0.61 7.2 0.57 6.4 0.52 5.7 10.6 9.4 0.7 0.7 14.5 1.3 2.5 Home Depot 21.59 67.8 36,678 47,282 0.65 6.5 0.66 6.7 0.64 6.0 13.2 11.1 1.1 0.9 12.0 1.6 2.3 Lowe's 19.85 69.7 29,089 33,699 0.69 6.1 0.68 6.1 0.64 5.5 13.6 11.5 1.0 0.9 14.0 1.0 1.4 Walgreens 25.63 63.4 25,369 26,346 0.43 6.0 0.40 5.5 0.37 5.0 10.6 9.5 0.8 0.7 13.5 0.3 2.4 Costco 57.95 77.0 25,310 24,463 0.33 9.2 0.30 8.4 0.28 8.0 17.8 15.9 1.4 1.2 12.9 0.9 1.3 Staples 18.08 68.0 12,936 17,200 0.72 8.2 0.61 7.1 0.58 6.5 11.5 9.7 0.8 0.7 14.0 2.1 3.5 Best Buy 28.42 52.7 11,718 14,589 0.32 5.1 0.29 4.8 0.26 4.5 9.0 8.0 0.8 0.7 12.0 0.9 2.4 TJX 27.43 73.1 11,686 12,023 0.61 6.1 0.59 5.9 0.55 5.5 11.5 10.2 0.9 0.8 13.0 0.4 2.8 BJ's 35.16 79.4 2,108 1,994 0.20 6.2 0.18 6.0 0.17 5.7 15.4 13.9 1.5 1.4 10.0 0.0 2.5 Mean 0.51 6.7 0.47 6.3 0.45 5.8 12.6 11.0 1.0 0.9 12.9 1.0 2.3 Median 0.61 6.2 0.57 6.1 0.52 5.7 11.5 10.2 0.9 0.8 13.0 0.9 2.4
Mean(6) 0.47 6.2 0.45 6.0 0.42 5.6 12.9 12.2 1.1 1.1 11.9 1.5 2.7 Median(6) 0.41 6.1 0.39 5.9 0.37 5.5 11.5 10.2 0.9 0.8 12.0 1.5 2.6 High(6) 0.75 9.2 0.72 8.4 0.69 8.0 32.4 43.9 3.2 4.4 16.0 3.7 4.0 Low(6) 0.20 3.9 0.18 4.1 0.17 3.9 6.5 6.1 0.7 0.7 8.0 0.0 1.3

133
Implied Valuation Based on Other Retailers
The implied Target Corp valuation range based on other publicly traded retailers is $18 – $28bn, or $24 – $39/share today
2009E 2009EMultiple Metric ($mm) Multiple Range Implied Value ($bn)
EV/EBITDA 5,172 5.5x – 7.5x 17.5 – 27.8
P/E $2.23 11.0x – 14.5x 17.7 – 23.4
Implied Reference Range

32.4
17.815.4 14.4 13.2 12.3 11.5 10.6 9.8 9.3 9.0 8.8
6.5
11.8(3) 11.5 11.314.2(2)
13.610.6
14.1
0
5
10
15
20
25
30
35
Sears Costco BJ's Wal-Mart WholeFoods
Lowe's HomeDepot
Kroger Staples TJX Kohl's CVS Walgreens Macy's Safeway Best Buy JCPenney
Average(4) = 12.9
8.4 7.87.2 7.1 6.7 6.4 6.1 6.0 5.9 5.5 5.3 5.2 4.8 4.8 4.8
4.1
6.0(3) 5.8 5.76.5(2)
0
4
8
12
Costco Wal-Mart Sears Staples HomeDepot
CVS Lowe's BJ's TJX Kroger Kohl's Walgreens Macy's WholeFoods
Best Buy Safeway
Average(4) = 6.0
134
Target Corp Comparable Companies-Trading Multiples(1)
2009E EV/EBITDA Multiples (x)
2009E P/E Multiples (x)
(1) As of October 24, 2008(2) Implied multiple from midpoint of Target Corp valuation ($20.3bn–$25.3bn)(3) Represents fiscal year ending January(4) Excludes Target
Standalone
Target is currently trading near the midpoint of its peer group
Corp
StandaloneCorp
SUPERVALU
SUPERVALU
JCPenney

Projected Calendar Year,($mm) 2009E 2010E 2011E 2012E 2013EEBITDA 1 5,172 5,751 6,485 7,169 7,968 Less: Depreciation and Amortization (1,884) (2,017) (2,199) (2,410) (2,654) EBIT 3,288 3,735 4,285 4,759 5,314 Less: Taxes @ 38% (1,262) (1,434) (1,645) (1,827) (2,041) After-Tax EBIT 2,025 2,301 2,640 2,931 3,274 Plus: Depreciation and Amortization 1,884 2,017 2,199 2,410 2,654 Less: Net Capital Expenditures (2,826) (2,850) (3,400) (3,870) (4,416) Plus: Decrease in Working Capital 79 120 167 193 224 UNLEVERED FREE CASH FLOWS 1,162 1,588 1,606 1,665 1,736
ILLUSTRATIVE VALUATION($ in millions, except per share amounts)Terminal EBITDA 2 8,824 Terminal Discount RateTerminal EV/EBITDA Multiple 6.5x Multiple 9.00% 10.00% 11.00% Terminal Value 57,357 6.0x 29,668 27,993 26,404 Present Value of TV 3 35,614 6.5x 32,536 30,732 29,022 Sum of Discounted Cash Flows (2009-2013) 3 6,073 7.0x 35,403 33,472 31,641 Implied Enterprise Value 41,687 Less: Debt (1/1/09) 4 (11,455) Plus: Cash (1/1/09) 4 500 Implied Equity Value 30,732 Terminal Discount Rate
Multiple 9.00% 10.00% 11.00%6.0x 2.4 3.3 4.2 6.5x 2.9 3.8 4.7
Notes: 7.0x 3.3 4.2 5.1 1 Assumes sale of remaining 53% interest on credit card receivables for $4.4bn; ongoing royalty stream of $150mm2 Assumes 2014E EBITDA growth equal to 2013E growth3 Assumes mid-year convention4 Assumes $4.4bn of proceeds from sale of remaining 53% interest on credit card receivables used to pay down debt 5 Assumes capital expenditures equal to depreciation and amortization in perpetuity
Implied Equity Value
Implied Perpetuity Growth Rate (%) 5
135
Target Corp Discounted Cash Flow Analysis
The implied Target Corp valuation range based on DCF analysis is $26 – $35bn, or $37 – $49/share today

Trading Data – – 6.0–8.0x EBITDARetailers – CY2010 EBITDA: $5,751mm
(EV/EBITDA) – Current Multiple is 6.0x
Trading Data – – 13.0–16.0x EPSRetailers – CY2010 EPS: $2.67
(P/E) – Current Multiple is 11.8x
Trading Data – – 5 Year P/E of 15.9x and 5 Year EV/EBITDA of 8.2xTarget 5 Year Historical – CY2010 EPS: $2.67 and CY2010 EBITDA: $5,751mm
(P/E and EV/EBITDA) – Current P/E is 11.8x and current EV/EBITDA is 6.0x
Discounted – 9.0–11.0% WACCCash Flow – 6.5–7.5x Terminal EBITDA Multiple
($bn)
Equity Value 27.5 30.0 32.5Enterprise Value 37.6 40.1 42.6Share Price ($/Share) $38 $42 $45
'10 P/E 14.3x 15.6x 16.9x
'10 PEG 0.8x 0.9x 1.0x
'10 EV/EBITDA 6.5x 7.0x 7.4x
25.0
30.6
33.0
35.9
30.8
37.0
42.3
24.4
22.0 27.0 32.0 37.0 42.0
Target Corp—12-Month Price Target
Valuation Range($27.5bn–$32.5bn)
Equity Value ($bn)
136
The implied valuation range for Target Corp based on several methodologies outlined below is $27.5 – $32.5bn, or $38 – $45/share 12 months from today

Credit Rating Analysis

138
Maintains Investment Grade Credit Rating
Target Corp and TIP REIT will have integrated, mutually dependent business modelsVast majority of TIP REIT revenues will be based on Target Corp land leases for many yearsLease arrangements and large size of land portfolio lead to high correlation of credit quality between TIP REIT and Target Corp TIP REIT will also provide facility management services to Target Corp
Target Corp and TIP REIT will be separate legal entities with common public ownership at the onset; shareholder base expected to diverge over time due to differing business profiles of the two entities
Based on this structure, we believe that the Rating Agencies will adopt one of either two possible analytical approaches for their analysis of Target Corp and TIP REIT:
a ‘Consolidated’ analysis of the combined group/system, or
a ‘De-consolidated’ analysis of the two separate entities on a standalone basis, but with some linkageA ‘Consolidated’ approach is supported by the integrated, economically inter-twined business relationship between Target Corp as lessor and TIP REIT as landownerA ‘De-consolidated’ approach is supported by the fact that the companies will be separate legal entities with no common ownership, except for shareholders initiallyAgencies may not unanimously take the same analytical approach when assessing Target Corp and TIP REIT profile
Leading to potential for one or more agency taking a ‘consolidated’ approach and another taking a ‘de-consolidated’ approach
We believe the Rating Agencies will adopt one of two possible analytical approaches when assessing the credit profiles of the ‘new’ Target Corp and TIP REIT – ‘Consolidated’ vs. ‘De-consolidated’

139
Maintains Investment Grade Credit Rating (cont’d)
Regardless of the analytical approach adopted by the Agencies, we believe that Target Corp will maintain Investment Grade credit ratings
Under a ‘Consolidated’ methodology, Agencies are expected:
To review metrics of the consolidated group where lease payments between Target Corp and TIP REIT are expected to ‘cancel out’
To assign the consolidated group’s rating to both Target Corp and TIP REIT
Under a ‘De-consolidated’ methodology, Agencies are expected:
To review Target Corp and TIP REIT independently
To assign independent ratings to both Target Corp and TIP REIT, although we anticipate that there will be some ratings linkage between the two
Regardless of the analytical approach, we believe:Target Corp will maintain solid Investment Grade credit ratings
Between Mid-High BBB/Baa to A-/A3TIP REIT will achieve Investment Grade credit ratings
Under any scenario, we anticipate that Target Corp will generate significant free cash flows with ability to deleverage to credit metrics supportive of stronger Investment Grade ratings over the near to intermediate term

Structural and Legal Considerations
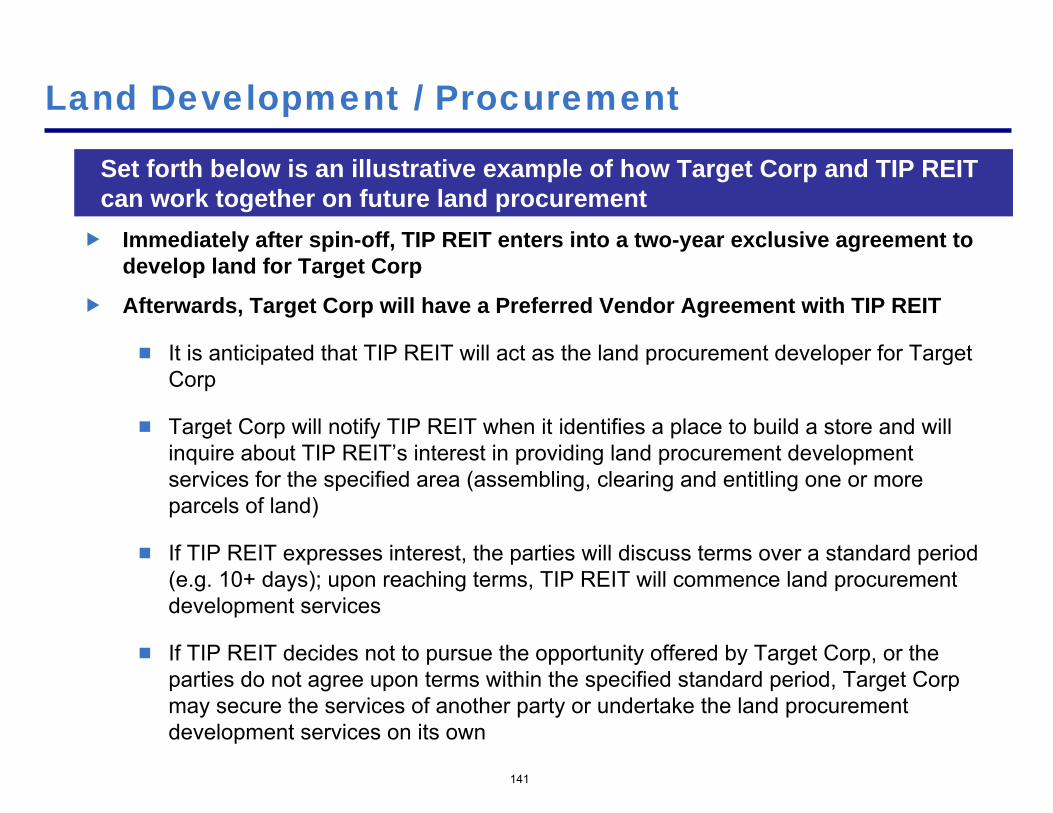
Land Development / Procurement
Immediately after spin-off, TIP REIT enters into a two-year exclusive agreement to develop land for Target Corp
Afterwards, Target Corp will have a Preferred Vendor Agreement with TIP REIT
It is anticipated that TIP REIT will act as the land procurement developer for Target Corp
Target Corp will notify TIP REIT when it identifies a place to build a store and will inquire about TIP REIT’s interest in providing land procurement development services for the specified area (assembling, clearing and entitling one or more parcels of land)
If TIP REIT expresses interest, the parties will discuss terms over a standard period (e.g. 10+ days); upon reaching terms, TIP REIT will commence land procurement development services
If TIP REIT decides not to pursue the opportunity offered by Target Corp, or the parties do not agree upon terms within the specified standard period, Target Corp may secure the services of another party or undertake the land procurement development services on its own
Set forth below is an illustrative example of how Target Corp and TIP REIT can work together on future land procurement
141
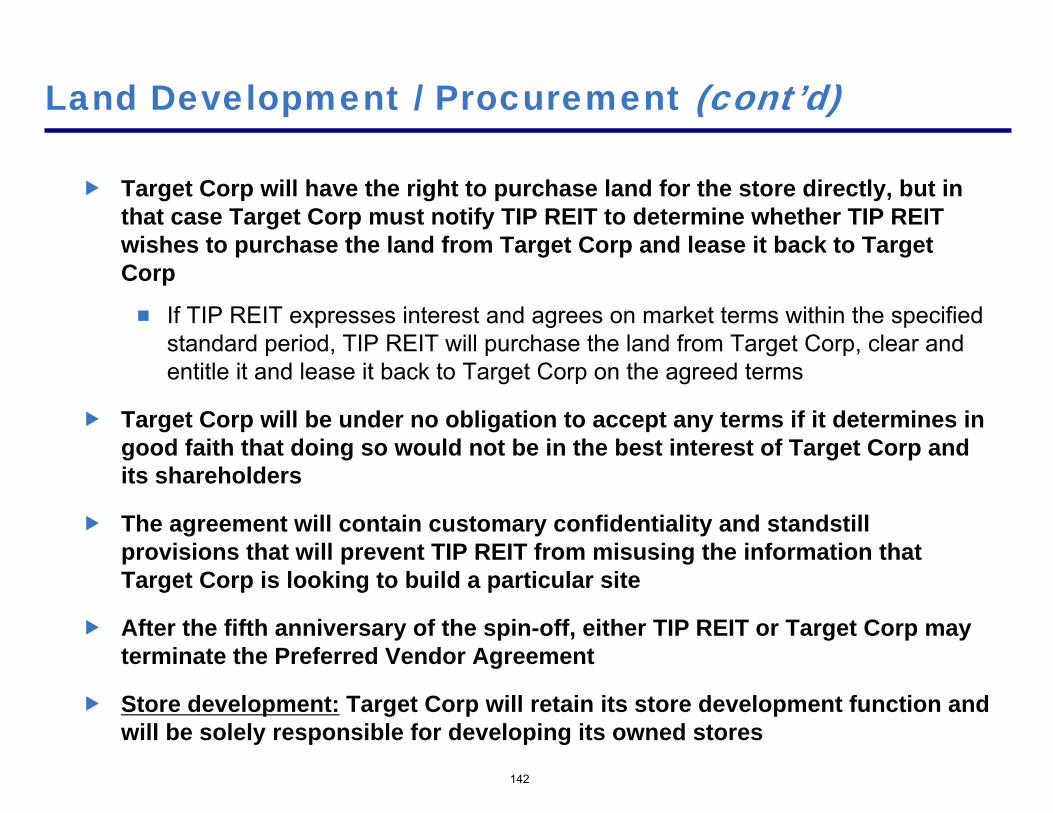
Land Development / Procurement (cont’d)
Target Corp will have the right to purchase land for the store directly, but in that case Target Corp must notify TIP REIT to determine whether TIP REIT wishes to purchase the land from Target Corp and lease it back to Target Corp
If TIP REIT expresses interest and agrees on market terms within the specified standard period, TIP REIT will purchase the land from Target Corp, clear and entitle it and lease it back to Target Corp on the agreed terms
Target Corp will be under no obligation to accept any terms if it determines in good faith that doing so would not be in the best interest of Target Corp and its shareholders
The agreement will contain customary confidentiality and standstill provisions that will prevent TIP REIT from misusing the information that Target Corp is looking to build a particular site
After the fifth anniversary of the spin-off, either TIP REIT or Target Corp may terminate the Preferred Vendor Agreement
Store development: Target Corp will retain its store development function and will be solely responsible for developing its owned stores
142
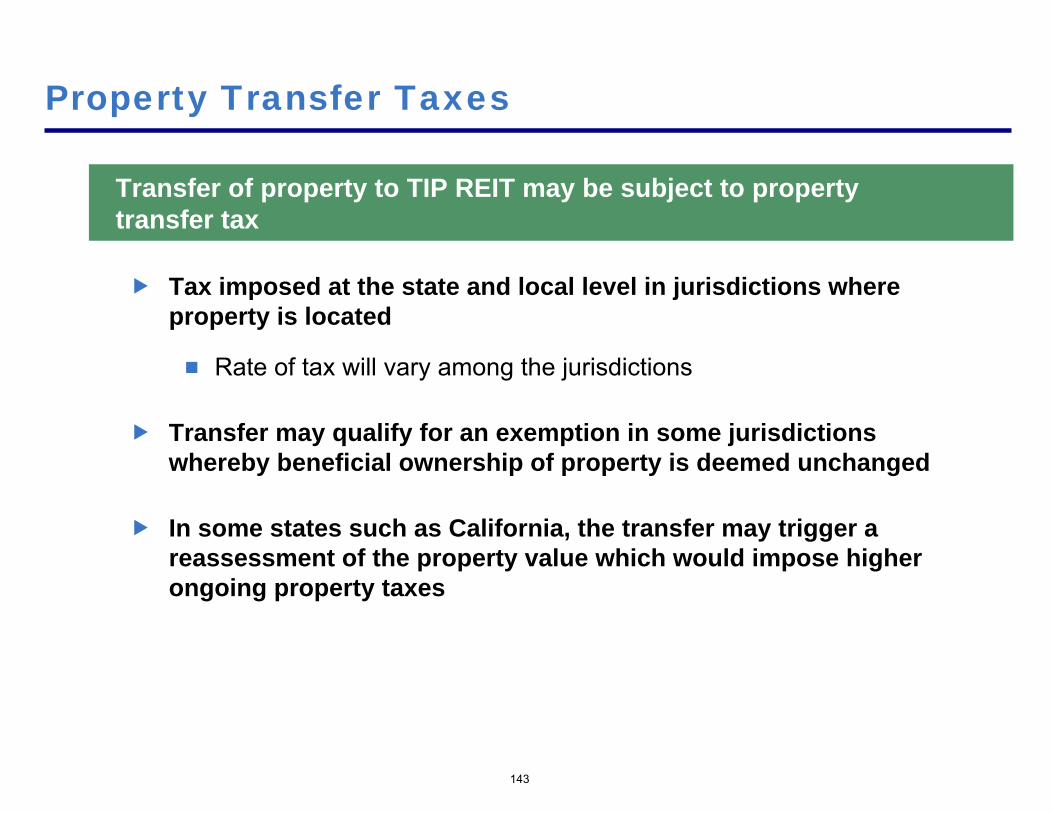
143
Property Transfer Taxes
Transfer of property to TIP REIT may be subject to property transfer tax
Tax imposed at the state and local level in jurisdictions where property is located
Rate of tax will vary among the jurisdictions
Transfer may qualify for an exemption in some jurisdictions whereby beneficial ownership of property is deemed unchanged
In some states such as California, the transfer may trigger a reassessment of the property value which would impose higher ongoing property taxes

Supporting Data

145
Store–level ROICP&L Data: ($mm)
Standalone 2007A
Pro Forma 2007A
Retail Sales $61,471 $61,471 Retail Gross Margin 19,576 19,576 Retail EBIT $4,213 $4,213 Plus: Advertising (50% of Consolidated) 598 598 Plus: Buying Group Expense and Occupancy Expense 1,321 1,321 Less: Incremental Ground Lease Rent (Stores) -- (1,235) (1) Less: Incremental Ground Lease Rent (DCs & WHs) -- (46) (2) Plus: Estimated Corporate G&A 615 615 % of Revenues 1.0% 1.0% Plus: Estimated Distribution Center Costs 2,459 2,505 % of Revenues 4.0% 4.1% Estimated Four-Wall Retail EBIT $9,040 $7,970
Store Level Operating Data and Assumptions: ($mm)
Standalone 2007A
Pro Forma 2007A
Retail Sales per Avg. Store $39.9 $39.9 Memo: Avg. # of Stores 1,540 1,540 Estimated Four-Wall Operating Costs per Avg. Store $33.9 $34.7 Ground Lease Expense per Avg. Store -- 1 Estimated Four-Wall EBIT per Avg. Store $6.0 $5.2 Margin 15.0% 13.0% New Land Capex $13 -- New Building Capex 13 13 Total Investment $26 $13 Est. Pre-Tax Unlevered Returns on Investment 23.0% 39.8%
(1) Assumes $1.2bn of ground lease rent expense from stores, based on $7/sq. ft. lease cost, 131k of square footage per store and 1,350 stores, on average; implying a cap rate of 7.0%(2) Assumes $46mm of ground lease rent expense from DCs & WHs, based on $1.25/sq. ft. lease cost, 1.4mm of square footage per DC & WH and 26 DCs & WHs, on average

Triple Net Lease REIT Tenants: Detailed Review
146
% of Adj. Debt/ LTM EBITDA/ LTM EBIT/ Yield ³ Tenant Revenue Industry Moody's / S&P ¹ LTM EBITDAR ² (x) Interest (x) ² Interest (x) ² (%) Commentary
Buffets 6 Restaurant WR / NR 9.8 0.8 0.3 In default ♦ March 31, 2008: Buffets auditor raises "going concern" doubt
♦ January 22, 2008: Buffets files for bankruptcy
Kerasotes ShowPlace Theatres 5 Movie Theater B1/ B- na na na na ♦ Moody’s does not expect Kerasotes to become free cash flow positive until after 2009
The Pantry (NASDAQ: PTRY)
4 Convenience Store WR / B+ 6.5 4 2.4 1.2 14.5 ♦ July 17, 2008: Moody's downgrades Pantry's Corporate Family Rating to B2 and assigned a negative rating outlook.
♦ April 9, 2008: Merrill Lynch reduces its investment rating on The Pantry to “Sell”
La Petite Academy 4 Education Services WR/NR na na na na ♦ June 26, 2008: Morgan Stanley Private Equity acquires a 60% stake in Learning Care Group Inc., the parent company of La Petite Academy
Children's World 4 Education Services na / na na na na na ♦ na
% of Adj. Debt/ LTM EBITDA/ LTM EBIT/ Yield ³ Tenant Gross Assets Industry Moody's / S&P ¹ LTM EBITDAR (x) Interest (x) Interest (x) (%) Commentary
The Pantry (NASDAQ: PTRY) 11 Convenience Store WR / B+ 6.5 4 2.4 1.2 14.5 ♦ See above
Circle K – Susser Holdings (NASDAQ: SUSS) 9 Convenience Store B3 / B+ 6.1 2.7 1.4 14.3 ♦ August 6, 2008: Susser reports earnings; Free Cash Flow for Susser Holdings deteriorates 19.1%
Kerasotes ShowPlace Theatres 5 Movie Theater B1/ B- na na na na ♦ See above
Mister Car Wash 4 Conveyor Car Wash na / na na na na na
Road Ranger 4 Convenience Store na / na na na na na
% of Total Adj. Debt/ LTM EBITDA/ LTM EBIT/ Yield ³ Tenant GLA Industry Moody's / S&P ¹ LTM EBITDAR (x) Interest (x) Interest (x) (%) Commentary
AMC Entertainment 51 Movie Theater WR / NR 6.4 2.6 0.9 14.1
Regal (NYSE: RGC) 7 Movie Theater B2 / BB- 5.7 4.3 2.7 10.7
Rave Motion Pictures 6 Movie Theater na / na na na na na
Consolidated Theaters 5 5 Movie Theater na / na na na na na
Muvico 3 5 Movie Theater na / na na na na na
♦ Real industry revenue is expected to decline at an average annual rate of 1.8% over the next 5 years
♦ The industry is in a mature phase of its development, as witnessed by the recent significant operator site and screen consolidation process associated with the filing for Chapter 11 Bankruptcy protection by most major operators in the early 2000s.
Source: Company filings and Wall Street research (1) Bloomberg as of October 24, 2008 (2) Company filings (3) Yield to Maturity of the most liquid security with the largest outstanding amount based on Interactive Data (4) Rent Expense as of last fiscal year reported (5) Wall Street research as of May 5, 2008
146
Model – Standalone

148
Standalone Model – Income StatementStatus Status
Quo Quo Credit Card Pro Forma Calendar Year, CAGR($mm) CY2007 CY2008 Adj. CY2008 2009 2010 2011 2012 2013 '09 - '13Retail Sales 61,471 64,892 64,892 68,249 73,356 80,479 88,710 98,241 9.5%
Base Sales Growth (%) 5.2% 7.5% 9.7% 10.2% 10.7%Credit Revenue 1,896 2,078 (1,936) 143 150 161 177 195 216 9.5%
Credit Sales Growth 5.2% 7.5% 9.7% 10.2% 10.7%Total Revenue 63,367 66,970 65,034 68,399 73,517 80,655 88,905 98,457 9.5%
Total Revenue Growth 5.2% 7.5% 9.7% 10.2% 10.7%
COGS 42,929 45,459 45,459 47,777 51,279 56,177 61,919 68,563% of Retail Sales 69.8% 70.1% 70.1% 70.0% 69.9% 69.8% 69.8% 69.8%
SG&A (excluding D&A and Rent Expense) 12,392 13,058 13,058 13,834 14,761 16,115 17,761 19,668% of Retail Sales 20.2% 20.1% 20.1% 20.3% 20.1% 20.0% 20.0% 20.0%
Credit Expenses 950 1,460 (1,460) - - - - - - % of Credit Revenue 50.1% 70.2% 0.0% 0.0% 0.0% 0.0% 0.0% 0.0%
Retail EBITDAR 6,150 6,375 6,375 6,637 7,316 8,187 9,029 10,011 10.8%Retail EBITDAR Margin (%) 10.0% 9.8% 9.8% 9.7% 10.0% 10.2% 10.2% 10.2%
Credit EBITDAR 946 619 (476) 143 150 161 177 195 216 9.5%Credit EBITDAR Margin (%) 49.9% 29.8% 100.0% 100.0% 100.0% 100.0% 100.0% 100.0%
EBITDAR 7,096 6,993 6,517 6,787 7,478 8,364 9,224 10,227 10.8%EBITDAR Margin (%) 11.2% 10.4% 10.0% 9.9% 10.2% 10.4% 10.4% 10.4%
Rent Expense 165 169 169 173 178 182 187 191EBITDA 6,931 6,824 6,348 6,614 7,300 8,182 9,038 10,036 11.0%
EBITDA Margin (%) 10.9% 10.2% 9.8% 9.7% 9.9% 10.1% 10.2% 10.2%
Depreciation & Amortization 1,659 1,807 1,807 1,940 2,085 2,288 2,522 2,793% of Retail Sales 2.7% 2.8% 2.8% 2.8% 2.8% 2.8% 2.8% 2.8%
Operating Income 5,272 5,017 4,541 4,674 5,215 5,894 6,516 7,243 11.6%
Net Interest (Income) / Expense 647 995 555 694 722 798 897 1,003Income Tax Provision 1,776 1,483 1,469 1,528 1,725 1,957 2,158 2,396
Tax Rate (%) 38% 37% 37% 38% 38% 38% 38% 38%Net Income 2,849 2,539 2,517 2,452 2,767 3,139 3,461 3,844 11.9%
Net Income Margin (%) 4.5% 3.8% 3.9% 3.6% 3.8% 3.9% 3.9% 3.9%
Current Diluted Shares Outstanding 882.6 819.0 819.0 721.9 720.4 697.3 677.3 659.1Shares Repurchase (63.7) (97) (97.0) (1.6) (23.1) (20.0) (18.2) (14.0)Share Repurchase from Options 0.0 0.0 0.0 0.0 0.0 0.0 0.0 0.0
Total Shares Outstanding 819.0 721.9 721.9 720.4 697.3 677.3 659.1 645.2Weighted Average Shares Outstanding 850.8 765.9 765.9 721.1 708.8 687.3 668.2 652.2
Earnings per Share ($) $3.33 $3.32 $3.29 $3.40 $3.90 $4.57 $5.18 $5.89 6.71 14.7%

149
Standalone Model – Balance Sheet
Status Status
Quo Quo Pro Forma Calendar Year,
($mm) CY2007 CY2008 Adj. CY2008 2009 2010 2011 2012 2013
Cash & Equivalents 2,450 500 0 500 607 653 716 790 874
Trade Receivables 8,054 8,383 (8,383) - - - - - -
Other Current Assets 8,402 9,232 9,232 9,710 10,436 11,450 12,621 13,977
Property, Plant & Equipment, gross 31,982 35,734 35,734 39,639 43,497 48,479 54,212 60,817
Accumulated Depreciation (7,887) (9,350) (9,350) (11,290) (13,375) (15,663) (18,185) (20,977)
Property, Plant & Equipment, net 24,095 26,384 26,384 28,348 30,122 32,816 36,027 39,840
Other Non-Current Assets 1,559 1,368 1,368 1,368 1,368 1,368 1,368 1,368
Total Assets 44,560 45,867 37,484 40,033 42,579 46,350 50,805 56,059
Debt 17,090 19,455 (8,000) 11,455 11,455 12,455 13,955 15,705 17,455
Other Current Liabilities 9,818 10,757 10,757 11,313 12,160 13,340 14,705 16,285
Other Non-Current Liabilities 2,345 2,392 2,392 2,392 2,392 2,392 2,392 2,392
Total Liabilities 29,253 32,604 24,604 25,160 27,007 29,687 32,802 36,132
Total Equity 15,307 13,264 (383) 12,880 14,873 15,572 16,663 18,004 19,927
Total Equity & Liabilities 44,560 45,867 37,484 40,033 42,579 46,350 50,805 56,059
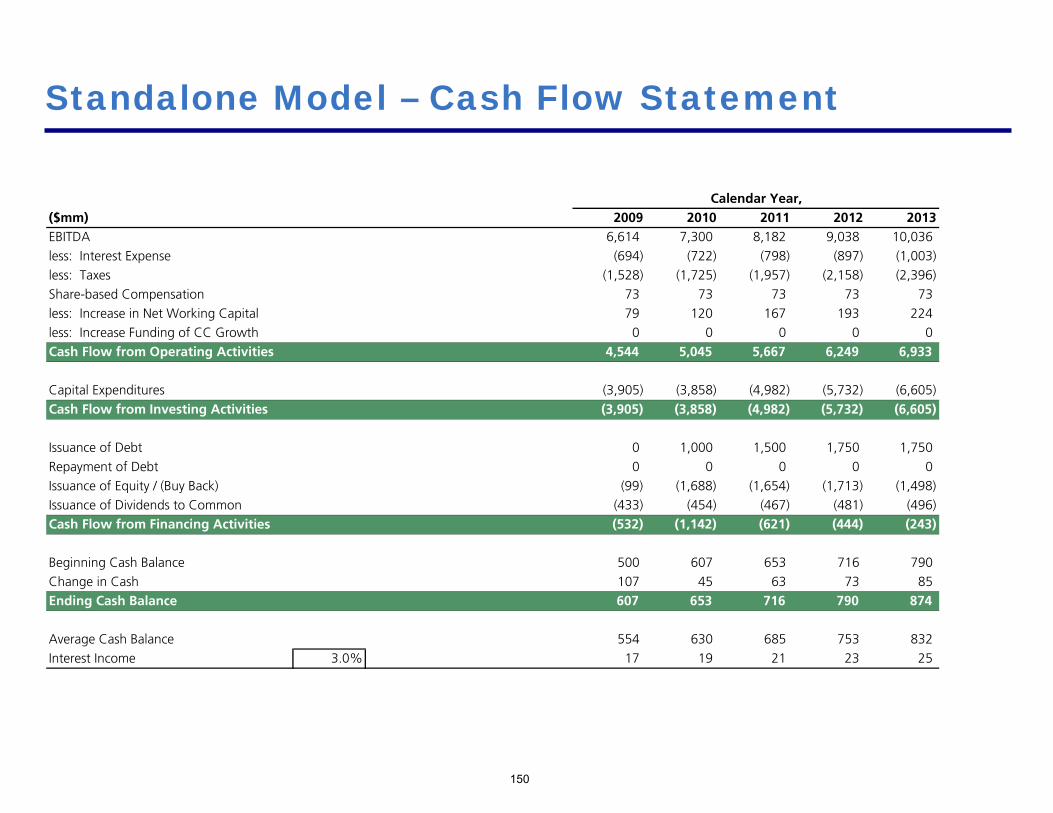
150
Standalone Model – Cash Flow Statement
Calendar Year,($mm) 2009 2010 2011 2012 2013EBITDA 6,614 7,300 8,182 9,038 10,036
less: Interest Expense (694) (722) (798) (897) (1,003)
less: Taxes (1,528) (1,725) (1,957) (2,158) (2,396)
Share-based Compensation 73 73 73 73 73
less: Increase in Net Working Capital 79 120 167 193 224
less: Increase Funding of CC Growth 0 0 0 0 0
Cash Flow from Operating Activities 4,544 5,045 5,667 6,249 6,933
Capital Expenditures (3,905) (3,858) (4,982) (5,732) (6,605)
Cash Flow from Investing Activities (3,905) (3,858) (4,982) (5,732) (6,605)
Issuance of Debt 0 1,000 1,500 1,750 1,750
Repayment of Debt 0 0 0 0 0
Issuance of Equity / (Buy Back) (99) (1,688) (1,654) (1,713) (1,498)
Issuance of Dividends to Common (433) (454) (467) (481) (496)
Cash Flow from Financing Activities (532) (1,142) (621) (444) (243)
Beginning Cash Balance 500 607 653 716 790
Change in Cash 107 45 63 73 85
Ending Cash Balance 607 653 716 790 874
Average Cash Balance 554 630 685 753 832
Interest Income 3.0% 17 19 21 23 25
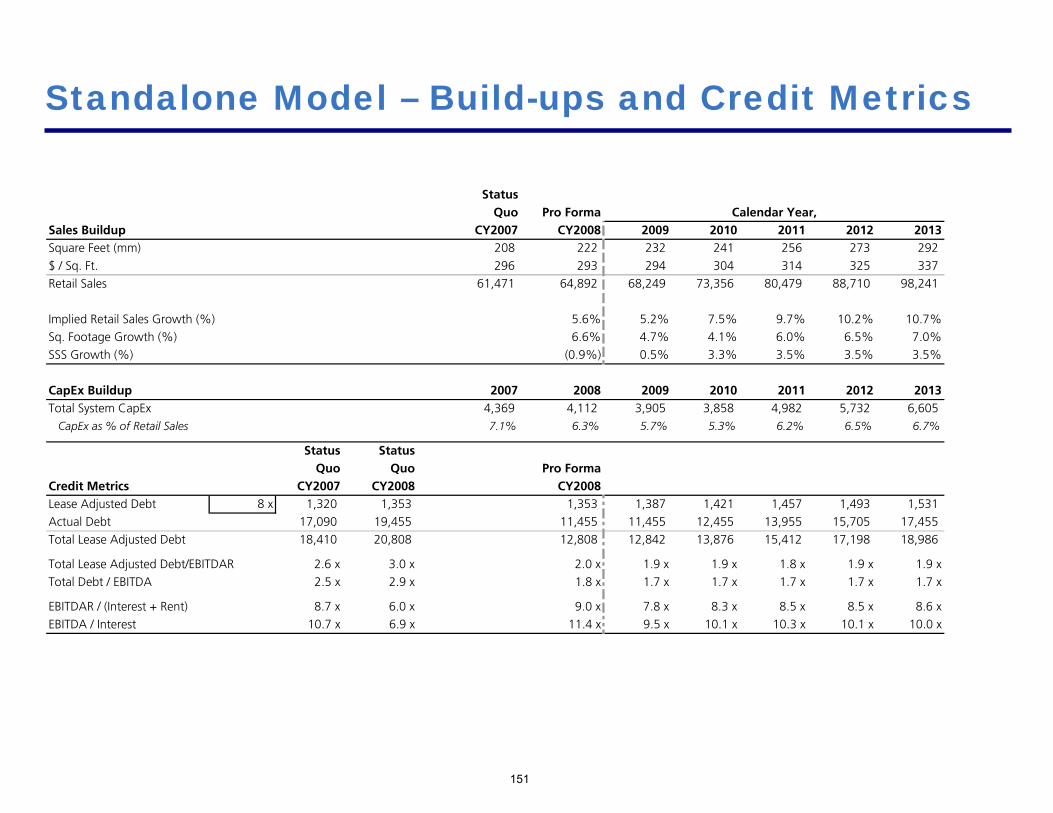
151
Standalone Model – Build-ups and Credit Metrics
StatusQuo Pro Forma Calendar Year,
Sales Buildup CY2007 CY2008 2009 2010 2011 2012 2013Square Feet (mm) 208 222 232 241 256 273 292
$ / Sq. Ft. 296 293 294 304 314 325 337
Retail Sales 61,471 64,892 68,249 73,356 80,479 88,710 98,241
Implied Retail Sales Growth (%) 5.6% 5.2% 7.5% 9.7% 10.2% 10.7%
Sq. Footage Growth (%) 6.6% 4.7% 4.1% 6.0% 6.5% 7.0%
SSS Growth (%) (0.9%) 0.5% 3.3% 3.5% 3.5% 3.5%
CapEx Buildup 2007 2008 2009 2010 2011 2012 2013Total System CapEx 4,369 4,112 3,905 3,858 4,982 5,732 6,605
CapEx as % of Retail Sales 7.1% 6.3% 5.7% 5.3% 6.2% 6.5% 6.7%
Status StatusQuo Quo Pro Forma
Credit Metrics CY2007 CY2008 CY2008Lease Adjusted Debt 8 x 1,320 1,353 1,353 1,387 1,421 1,457 1,493 1,531
Actual Debt 17,090 19,455 11,455 11,455 12,455 13,955 15,705 17,455
Total Lease Adjusted Debt 18,410 20,808 12,808 12,842 13,876 15,412 17,198 18,986
Total Lease Adjusted Debt/EBITDAR 2.6 x 3.0 x 2.0 x 1.9 x 1.9 x 1.8 x 1.9 x 1.9 x
Total Debt / EBITDA 2.5 x 2.9 x 1.8 x 1.7 x 1.7 x 1.7 x 1.7 x 1.7 x
EBITDAR / (Interest + Rent) 8.7 x 6.0 x 9.0 x 7.8 x 8.3 x 8.5 x 8.5 x 8.6 x
EBITDA / Interest 10.7 x 6.9 x 11.4 x 9.5 x 10.1 x 10.3 x 10.1 x 10.0 x

Model – TIP REIT

153
TIP REIT Model – Income StatementPro Forma Calendar Year, CAGR
($mm, except as noted) CY2008 2009 2010 2011 2012 2013 '09 - '13Gross TIP REIT Revenues from Ground-leased Store Land 1,325 1,398 1,501 1,645 1,811 2,004 9.4%Gross TIP REIT Revenues from Ground-leased DCs & WHs Land 44 46 48 51 55 59 6.3%
Total Gross TIP REIT Revenues 1,369 1,444 1,549 1,696 1,866 2,063 9.3%
Total TIP REIT Net Rental Revenues 1,369 1,444 1,549 1,696 1,866 2,063 9.3%% of Target Corp Retail Sales 2.1% 2.1% 2.1% 2.1% 2.1% 2.1%
Plus: Facilities Management Income 144 144 155 170 187 207 Less: Facilities Management Expense (125) (125) (134) (147) (162) (180)
Net Facilities Management Income 19 19 20 22 24 27 9.5%
Net Operating Income 1,388 1,462 1,569 1,718 1,890 2,090 9.3%
Less: G&A Expense (20) (20) (21) (21) (22) (22) Less: Incremental G&A Cost (15) (15) (15) (16) (16) (17)
EBITDA 1,353 1,427 1,533 1,681 1,853 2,051 9.5%
Less: Depreciation & Amortization (42) (56) (68) (88) (111) (139) Less: Interest Expense (205) (188) (221) (316) (428) (559) Less: Taxes on Facilities Mgmt. Income 38% (7) (7) (8) (8) (9) (10)
Net Income 1,099 1,177 1,235 1,268 1,304 1,342 3.3%
Normalized Net Income (1) 1,211 1,289 1,331 1,364 1,400 1,438 2.8%
Ending Shares Outstanding 721.9 721.9 721.9 721.9 721.9 721.9 Earnings per Share $1.52 $1.63 $1.71 $1.76 $1.81 $1.86 3.3%
Normalized Earnings per Share (1) $1.68 $1.79 $1.84 $1.89 $1.94 $1.99 2.8%% AFFO
Dividends on Common 100.0% 1,141 1,232 1,304 1,356 1,415 1,481 4.7%Special Dividends - 1,600 - - - -
Normalized Dividends (1) 1,253 1,344 1,400 1,452 1,511 1,577 4.1%
Normalized Dividends per Share (1) $1.74 $1.86 $1.94 $2.01 $2.09 $2.18 4.1%
(1) Normalized to exclude incremental interest expense due to CY2009 cash E&P distribution

154
TIP REIT Model – Balance Sheet
Pro Forma Calendar Year, CAGR($mm, except as noted) CY2008 2009 2010 2011 2012 2013 '09 - '13Real Estate:
Gross Existing Properties - Land & Improvements 12,228 12,228 12,228 12,228 12,228 12,228 Maintenance Capex - - - - - Development Properties - Land & Improvements 1,079 2,087 3,669 5,532 7,722 Accumulated Depreciation (846) (901) (970) (1,058) (1,169) (1,308)
Net Real Estate Asset 11,382 12,405 13,345 14,839 16,590 18,641
Cash - 3 3 3 3 3
Total Assets 11,382 12,408 13,348 14,842 16,593 18,644 10.7%
Debt:Revolver - 3 3 3 3 3 New Debt - 2,679 3,687 5,269 7,132 9,322
Total Debt - 2,682 3,690 5,272 7,135 9,325
Common Equity 11,382 11,382 11,382 11,382 11,382 11,382 Retained Earnings (Deficit) (1,656) (1,724) (1,812) (1,924) (2,063) Total Equity 11,382 9,727 9,658 9,570 9,459 9,320
Total Liabilities & Equity 11,382 12,408 13,348 14,842 16,593 18,644 10.7%

155
TIP REIT Model – Cash Flow Statement
Calendar Year, CAGR($mm, except as noted) 2009 2010 2011 2012 2013 '09 - '13Cash Flow from Operating Activities:
EBITDA 1,353 1,427 1,533 1,681 1,853 2,051 Less: Interest Expense (205) (188) (221) (316) (428) (559) Less: Taxes on Facilities Mgmt. Income (7) (7) (8) (8) (9) (10)
Net Cash Flow from Operating Activities 1,141 1,232 1,304 1,356 1,415 1,481 4.7%
Cash Flow from Investing Activities:Development Capex (1,079) (1,008) (1,582) (1,863) (2,190) Maintenance Capex - - - - -
Net Cash Flow from Investing Activities (1,079) (1,008) (1,582) (1,863) (2,190) 19.4%
Cash Flow from Financing Activities:Debt Financing:Increase (Decrease) in Revolver 3 - - - - Increase (Decrease) in New Debt 2,679 1,008 1,582 1,863 2,190 Equity Financing:Increase (Decrease) in Common Equity - - - - - Dividends on Common (1,141) (1,232) (1,304) (1,356) (1,415) (1,481) Special Dividends (1,600) - - - -
Net Cash Flow from Financing Activities (151) (295) 226 447 709
Beginning Cash Balance - 3 3 3 3 Net Change in Cash 3 - - - - Ending Cash Balance - 3 3 3 3 3
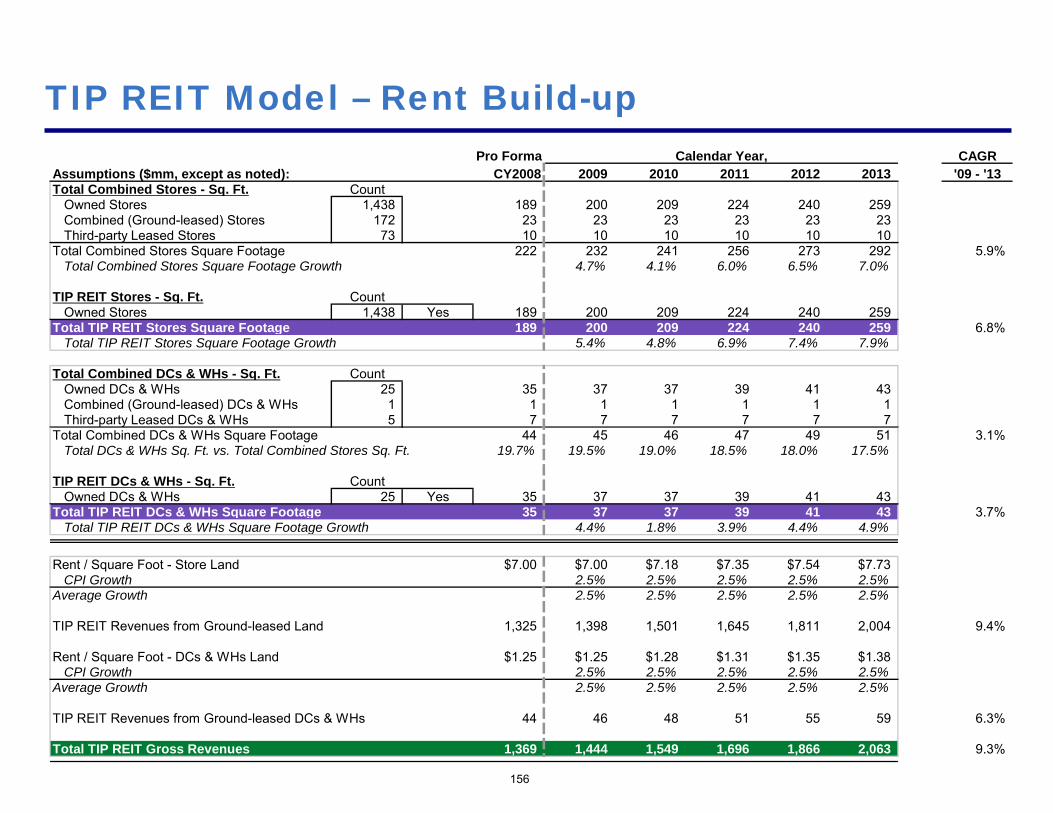
156
TIP REIT Model – Rent Build-upPro Forma Calendar Year, CAGR
Assumptions ($mm, except as noted): CY2008 2009 2010 2011 2012 2013 '09 - '13Total Combined Stores - Sq. Ft. Count
Owned Stores 1,438 189 200 209 224 240 259 Combined (Ground-leased) Stores 172 23 23 23 23 23 23 Third-party Leased Stores 73 10 10 10 10 10 10
Total Combined Stores Square Footage 222 232 241 256 273 292 5.9%Total Combined Stores Square Footage Growth 4.7% 4.1% 6.0% 6.5% 7.0%
TIP REIT Stores - Sq. Ft. CountOwned Stores 1,438 Yes 189 200 209 224 240 259
Total TIP REIT Stores Square Footage 189 200 209 224 240 259 6.8%Total TIP REIT Stores Square Footage Growth 5.4% 4.8% 6.9% 7.4% 7.9%
Total Combined DCs & WHs - Sq. Ft. CountOwned DCs & WHs 25 35 37 37 39 41 43 Combined (Ground-leased) DCs & WHs 1 1 1 1 1 1 1 Third-party Leased DCs & WHs 5 7 7 7 7 7 7
Total Combined DCs & WHs Square Footage 44 45 46 47 49 51 3.1%Total DCs & WHs Sq. Ft. vs. Total Combined Stores Sq. Ft. 19.7% 19.5% 19.0% 18.5% 18.0% 17.5%
TIP REIT DCs & WHs - Sq. Ft. CountOwned DCs & WHs 25 Yes 35 37 37 39 41 43
Total TIP REIT DCs & WHs Square Footage 35 37 37 39 41 43 3.7%Total TIP REIT DCs & WHs Square Footage Growth 4.4% 1.8% 3.9% 4.4% 4.9%
Rent / Square Foot - Store Land $7.00 $7.00 $7.18 $7.35 $7.54 $7.73CPI Growth 2.5% 2.5% 2.5% 2.5% 2.5%
Average Growth 2.5% 2.5% 2.5% 2.5% 2.5%
TIP REIT Revenues from Ground-leased Land 1,325 1,398 1,501 1,645 1,811 2,004 9.4%
Rent / Square Foot - DCs & WHs Land $1.25 $1.25 $1.28 $1.31 $1.35 $1.38CPI Growth 2.5% 2.5% 2.5% 2.5% 2.5%
Average Growth 2.5% 2.5% 2.5% 2.5% 2.5%
TIP REIT Revenues from Ground-leased DCs & WHs 44 46 48 51 55 59 6.3%
Total TIP REIT Gross Revenues 1,369 1,444 1,549 1,696 1,866 2,063 9.3%

157
TIP REIT Model – FFO & AFFO Reconciliations, Credit Statistics and Implied Metrics
(1) Normalized to exclude incremental interest expense due to CY2009 cash E&P distribution
Pro Forma Calendar Year, CAGRFFO & AFFO Reconciliations: CY2008 2009 2010 2011 2012 2013 '09 - '13Net Income 1,099 1,177 1,235 1,268 1,304 1,342
Plus: Depreciation & Amortization 42 56 68 88 111 139 Funds from Operations 1,141 1,232 1,304 1,356 1,415 1,481 4.7%
Ending Shares Outstanding 721.9 721.9 721.9 721.9 721.9 721.9 FFO / Share $1.58 $1.71 $1.81 $1.88 $1.96 $2.05 4.7%
Less: Maintenance Capex - - - - - - Adjusted Funds from Operations 1,141 1,232 1,304 1,356 1,415 1,481 4.7%
Normalized AFFO (1) 1,253 1,344 1,400 1,452 1,511 1,577 4.1%
Credit Statistics:Coverage:
EBITDA / Interest Expense 7.6x 6.9x 5.3x 4.3x 3.7x(EBITDA - Maintenance Capex) / Interest Expense 7.6x 6.9x 5.3x 4.3x 3.7x
Leverage:Total Debt / EBITDA 1.9x 2.4x 3.1x 3.9x 4.5x
Capitalization:Total Debt / Total Real Estate Value 11.1% 14.2% 18.6% 22.9% 27.0%(NOI capped at 6.0% and 8.5% for store land and DCs & WHs land, respectively)
Implied Metrics:Incremental Stores Square Footage 10 10 14 17 19
SuperTarget Stores 50.0% 5 5 7 8 10 Implied New Combined SuperTarget Stores 0.177 Sq. Ft. / SuperTarget 29 27 41 47 54
% of Total New Stores Built 41.4% 41.5% 41.4% 41.2% 41.2%Combined Total Number of SuperTarget Stores 239 268 295 336 383 437
General Merchandise Stores 50.0% 5 5 7 8 10 Implied New Combined GM Stores 0.124 Sq. Ft. / GM 41 38 58 67 77
% of Total New Stores Built 58.6% 58.5% 58.6% 58.8% 58.8%Combined Total Number of General Merchandise Stores 1,444 1,485 1,523 1,581 1,648 1,725 Total Implied New Stores 70 65 99 114 131 Cumulative Combined Total Implied Stores 1,683 1,753 1,818 1,917 2,031 2,162
Incremental DCs & WHs Square Footage 2 1 1 2 2 Implied Combined New DCs & WHs 1.408 1 0 1 1 1
Total Implied New DCs & WHs 1 0 1 1 1Cumulative Combined Total Implied DCs & WHs 31 32 33 34 35 36

158
TIP REIT Model – Capex Schedule
Calendar Year, CAGR($mm, except as noted) 2009 2010 2011 2012 2013 '09 - '13Total Combined Expenditures 3,905 3,858 4,982 5,732 6,605
Maintenance / Retail Capital Expenditures 1,714 1,827 1,785 1,968 2,179 6.2%Target Corp - Store Buildings 1,714 1,827 1,785 1,968 2,179 TIP REIT - - - - -
Development Capital Expenditures 2,191 2,031 3,198 3,765 4,426 19.2%Target Corp Building - Store and DCs & WHs 71.4% 1,112 1,023 1,615 1,902 2,237 TIP REIT Land - Store and DCs & WHs 28.6% 1,079 1,008 1,582 1,863 2,190 Target Corp - Other 0.0% - - - - -
TIP REIT Land - Store 1,056 999 1,560 1,836 2,158 Store Land Cost per Square Foot $102.50 $105.06 $107.69 $110.38 $113.14
TIP REIT Land - DCs & WHs 22 10 22 26 31 DCs & WHs Land Cost per Square Foot $14.00 $14.35 $14.71 $15.08 $15.45 $15.84
TIP REIT Land - Store Yes 1,056 999 1,560 1,836 2,158 TIP REIT Land - DCs & WHs Yes 22 10 22 26 31
Total Development Capex 1,079 1,008 1,582 1,863 2,190 19.4%
Development Financing Sources:Debt Financing 100% 1,079 1,008 1,582 1,863 2,190 Equity Financing 0% - - - - -

Model – Target Corp

160
Target Corp Model – Income StatementStatus
Quo REIT Credit Card Pro Forma Calendar Year, CAGR($mm) CY2008 Adj. Adj. CY2008 2009 2010 2011 2012 2013 '09 - '13Retail Sales 64,892 64,892 68,249 73,356 80,479 88,710 98,241 9.5%
Base Sales Growth (%) 5.2% 7.5% 9.7% 10.2% 10.7%Credit Revenue 2,078 (1,936) 143 150 161 177 195 216 9.5%
Credit Sales Growth na 5.2% 7.5% 9.7% 10.2% 10.7%Total Revenue 66,970 65,034 68,399 73,517 80,655 88,905 98,457 9.5%
Total Revenue Growth 5.2% 7.5% 9.7% 10.2% 10.7%
COGS 45,459 45,459 47,777 51,279 56,177 61,919 68,563% of Retail Sales 70.1% 70.1% 70.0% 69.9% 69.8% 69.8% 69.8%
SG&A (excluding D&A and Rent Expense) 13,058 (20) 13,038 13,814 14,740 16,093 17,739 19,646% of Retail Sales 20.1% 20.1% 20.2% 20.1% 20.0% 20.0% 20.0%
Credit Expenses 1,460 (1,460) - - - - - - % of Credit Revenue 70.2% 0.0% 0.0% 0.0% 0.0% 0.0% 0.0%
Retail EBITDAR 6,375 6,395 6,657 7,337 8,208 9,051 10,033 10.8%Retail EBITDAR Margin (%) 9.8% 9.9% 9.8% 10.0% 10.2% 10.2% 10.2%
Credit EBITDAR 619 (476) 143 150 161 177 195 216 9.5%Credit EBITDAR Margin (%) 29.8% na na na na na na
EBITDAR (Pre-spin) 6,993 6,537 6,807 7,498 8,385 9,246 10,249 10.8%EBITDAR Margin (%) 10.4% 10.1% 10.0% 10.2% 10.4% 10.4% 10.4%
Current Embedded Facility Management Costs (125) (125) (125) (134) (147) (162) (180)External Facility Mgmt. Payments to TIP REIT 144 144 144 155 170 187 207
Current Rent Expense 169 169 173 178 182 187 191Additional Rent Expense 1,369 1,444 1,549 1,696 1,866 2,063Pro Forma EBITDA (Post-spin) 6,824 4,980 5,172 5,751 6,485 7,169 7,968 11.4%
EBITDA Margin (%) 10.2% 7.7% 7.6% 7.8% 8.0% 8.1% 8.1%
Depreciation & Amortization 1,807 (42) 1,765 1,884 2,017 2,199 2,410 2,654% of Retail Sales 2.7% 2.7% 2.7% 2.7% 2.7% 2.7%
Operating Income 5,017 3,215 3,288 3,735 4,285 4,759 5,314 12.8%
Net Interest (Income) / Expense 995 515 673 611 531 509 623Income Tax Provision 1,483 1,037 1,004 1,199 1,441 1,632 1,802
Tax Rate (%) 37% 38% 38% 38% 38% 38% 38%Net Income 2,539 1,663 1,611 1,924 2,312 2,618 2,890 15.7%
Net Income Margin (%) 3.8% 2.6% 2.4% 2.6% 2.9% 2.9% 2.9%
Current Diluted Shares Outstanding 819.0 721.9 721.9 721.9 721.9 693.0Shares Repurchase (97.0) 0.0 0.0 0.0 (29.0) (31.4)
Total Shares Outstanding 721.9 721.9 721.9 721.9 693.0 661.6Weighted Average Shares Outstanding 765.9 721.9 721.9 721.9 707.5 677.3
Earnings per Share ($) $2.17 $2.23 $2.67 $3.20 $3.70 $4.27 4.92 17.6%
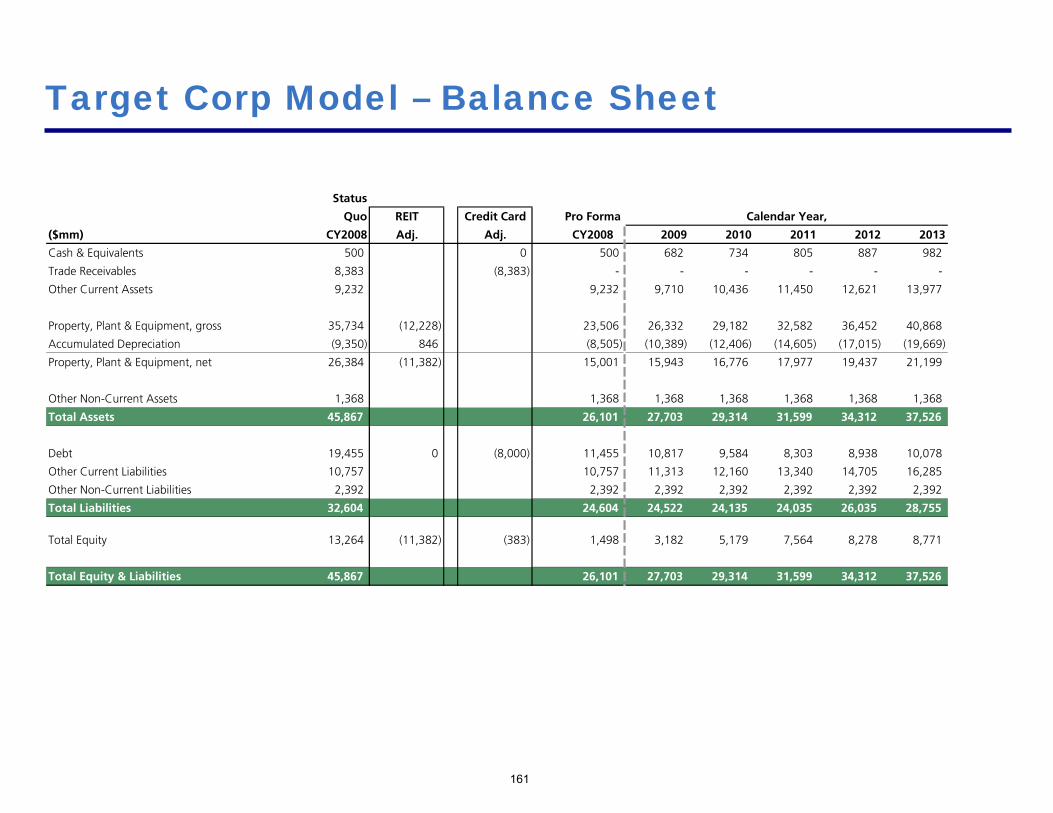
161
Target Corp Model – Balance Sheet
Status
Quo REIT Credit Card Pro Forma Calendar Year,
($mm) CY2008 Adj. Adj. CY2008 2009 2010 2011 2012 2013
Cash & Equivalents 500 0 500 682 734 805 887 982
Trade Receivables 8,383 (8,383) - - - - - -
Other Current Assets 9,232 9,232 9,710 10,436 11,450 12,621 13,977
Property, Plant & Equipment, gross 35,734 (12,228) 23,506 26,332 29,182 32,582 36,452 40,868
Accumulated Depreciation (9,350) 846 (8,505) (10,389) (12,406) (14,605) (17,015) (19,669)
Property, Plant & Equipment, net 26,384 (11,382) 15,001 15,943 16,776 17,977 19,437 21,199
Other Non-Current Assets 1,368 1,368 1,368 1,368 1,368 1,368 1,368
Total Assets 45,867 26,101 27,703 29,314 31,599 34,312 37,526
Debt 19,455 0 (8,000) 11,455 10,817 9,584 8,303 8,938 10,078
Other Current Liabilities 10,757 10,757 11,313 12,160 13,340 14,705 16,285
Other Non-Current Liabilities 2,392 2,392 2,392 2,392 2,392 2,392 2,392
Total Liabilities 32,604 24,604 24,522 24,135 24,035 26,035 28,755
Total Equity 13,264 (11,382) (383) 1,498 3,182 5,179 7,564 8,278 8,771
Total Equity & Liabilities 45,867 26,101 27,703 29,314 31,599 34,312 37,526
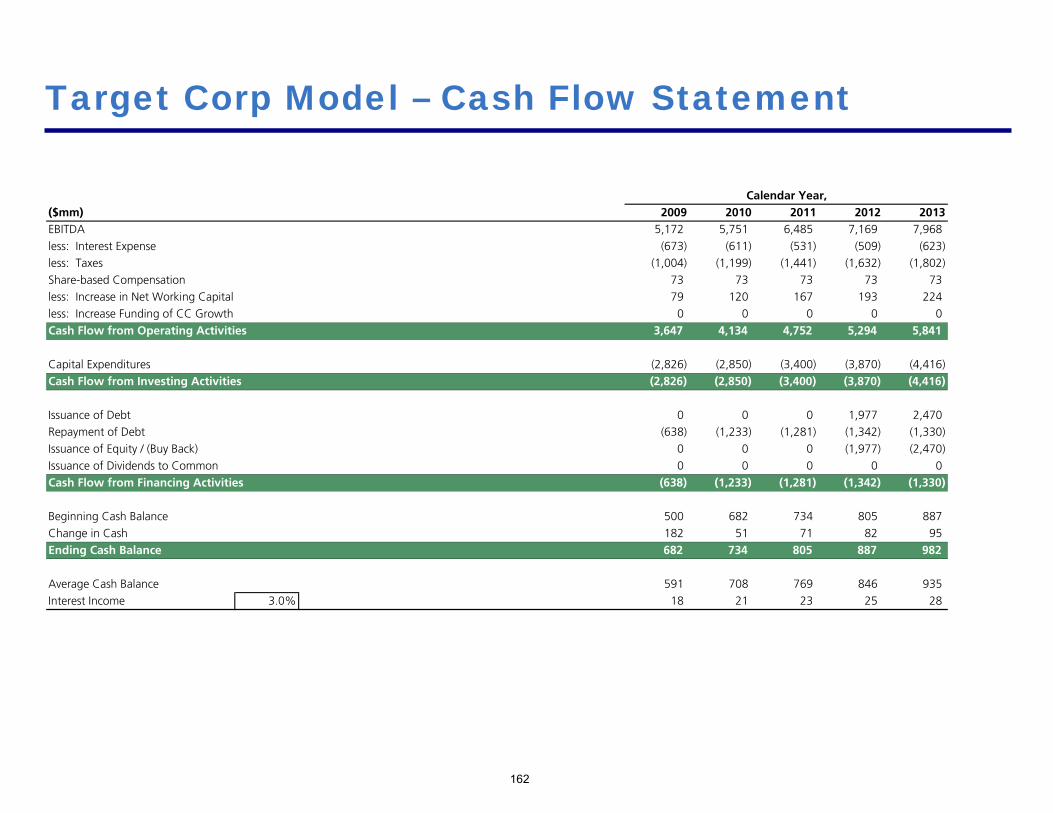
162
Target Corp Model – Cash Flow Statement
Calendar Year,($mm) 2009 2010 2011 2012 2013EBITDA 4,980 5,172 5,751 6,485 7,169 7,968
less: Interest Expense (515) (673) (611) (531) (509) (623)
less: Taxes (1,037) (1,004) (1,199) (1,441) (1,632) (1,802)
Share-based Compensation 73 73 73 73 73 73
less: Increase in Net Working Capital 79 120 167 193 224
less: Increase Funding of CC Growth 0 0 0 0 0 0
Cash Flow from Operating Activities 3,501 3,647 4,134 4,752 5,294 5,841
Capital Expenditures (2,826) (2,850) (3,400) (3,870) (4,416)
Cash Flow from Investing Activities (2,826) (2,850) (3,400) (3,870) (4,416)
Issuance of Debt 0 0 0 1,977 2,470
Repayment of Debt (638) (1,233) (1,281) (1,342) (1,330)
Issuance of Equity / (Buy Back) 0 0 0 (1,977) (2,470)
Issuance of Dividends to Common 0 0 0 0 0 0
Cash Flow from Financing Activities (638) (1,233) (1,281) (1,342) (1,330)
Beginning Cash Balance 500 682 734 805 887
Change in Cash 182 51 71 82 95
Ending Cash Balance 682 734 805 887 982
Average Cash Balance 591 708 769 846 935
Interest Income 3.0% 18 21 23 25 28

163
Target Corp Model – Build-ups and Credit MetricsPro Forma Calendar Year,
Sales Buildup CY2008 2009 2010 2011 2012 2013Square Feet (mm) 222 232 241 256 273 292$ / Sq. Ft. 293 294 304 314 325 337Retail Sales 64,892 68,249 73,356 80,479 88,710 98,241
Implied Retail Sales Growth (%) 5.2% 7.5% 9.7% 10.2% 10.7%Sq. Footage Growth (%) 4.7% 4.1% 6.0% 6.5% 7.0%SSS Growth (%) 0.5% 3.3% 3.5% 3.5% 3.5%
CapEx Buildup 2008 2009 2010 2011 2012 2013Total System CapEx 4,112 3,905 3,858 4,982 5,732 6,605
CapEx as % of Retail Sales 6.3% 5.7% 5.3% 6.2% 6.5% 6.7%
Maintenance/Retail CapEx 1,514 1,627 1,785 1,968 2,179Additional Cap Ex 200 200TOTAL Maintenance/Retail CapEx % of total 35.0% 1,439 1,714 1,827 1,785 1,968 2,179 – Target Corp 1,714 1,827 1,785 1,968 2,179 – TIP REIT (Existing DC & WH) 0 0 0 0 0
Development CapEx % of total 65.0% 2,191 2,031 3,198 3,765 4,426
Buildings (Tgt Corp) % of Development 50% 1,112 1,023 1,615 1,902 2,237 Land % of Development 50% 1,079 1,008 1,582 1,863 2,190 – Target Corp 0 0 0 0 0 – TIP REIT 1,079 1,008 1,582 1,863 2,190 Other (Target Corp) % of Development 0% 0 0 0 0 0
Facilities Management Business ($mm)Total Current Costs 125 125 134 147 162 180Growth % 0.0% 7.5% 9.7% 10.2% 10.7%
Markup to TIP REIT 15% 15% 15% 15% 15% 15%Facilities Management Revenue to TIP REIT 144 144 155 170 187 207
Credit MetricsLease Adjusted Debt 8 x 1,353 12,309 12,935 13,811 15,024 16,421 18,033Actual Debt 19,455 11,455 10,817 9,584 8,303 8,938 10,078Total Lease Adjusted Debt 20,808 23,764 23,752 23,394 23,327 25,359 28,111
Total Lease Adjusted Debt/EBITDAR 3.0 x 3.6 x 3.5 x 3.1 x 2.8 x 2.8 x 2.8 xTotal Debt / EBITDA 2.9 x 2.3 x 2.1 x 1.7 x 1.3 x 1.2 x 1.3 x
EBITDAR / (Interest + Rent) 6.0 x 3.2 x 3.0 x 3.2 x 3.5 x 3.6 x 3.6 xEBITDA / Interest 6.9 x 9.7 x 7.7 x 9.4 x 12.2 x 14.1 x 12.8 x

Target:A Revised Transaction
Pershing Square Capital Management, L.P.
November 19, 2008
DisclaimerThe information contained in this presentation (the “Information”) is based on publicly available information about Target Corporation (“Target”). None of Pershing Square Capital Management, L.P., its affiliates and any of their respective officers, directors and employees (collectively, “Pershing”), nor any representative of Pershing, has independently verified any of the Information. Pershing recognizes that there may be confidential or otherwise non-public information in Target’s possession that could lead others to disagree with Pershing’s conclusions. The sole purpose of presenting the Information is to inform interested parties about the transaction described in this presentation (the “Transaction”). This presentation does not constitute an offer or a solicitation of any kind.
Neither Pershing nor any of its representatives makes any representation or warranty, express or implied, as to the accuracy or completeness of the Information or any other written or oral communication made in connection with this presentation or the Transaction. The Information includes certain forward-looking statements, estimates and projections with respect to the anticipated future financial, operating and stock market performance of Target in the absence of the Transaction and the two public companies that may result if the Transaction is completed. Such statements, estimates and projections may prove to be substantially inaccurate, reflect significant assumptions and judgments that may prove to be substantially inaccurate, and are subject to significant uncertainties and contingencies beyond Pershing’s control, including those described under the caption “Risk Factors” in Target’s filings with the Securities and Exchange Commission as well as general economic, credit, capital and stock market conditions, competitive pressures, geopolitical conditions, inflation, interest rate fluctuations, regulatory and tax matters and other factors.
Pershing and its representatives expressly disclaim any and all liability relating to or resulting from the use of the Information or any errors therein or omissions therefrom, including under applicable securities laws. The Information does not purport to include all information that may be material with respect to the Transaction or Target. Thus, shareholders and others should conduct their own independent investigation and analysis of Target, the Transaction and the Information.
The Information is not intended to provide the basis for fully evaluating, and should not be considered a recommendation with respect to, the Transaction, Target, the securities of Target or any other matter. Except where otherwise indicated, the Information speaks as of the date hereof. Neither Pershing nor any of its representatives undertakes any obligation to correct, update or revise the Information or to otherwise provide any additional materials.
The preparation and distribution of this presentation should not be taken as any form of commitment on the part of Pershing to take any action in connection with the Transaction.
Pershing is in the business of buying and selling securities. It has, and may in the future, buy, sell or change the form of its position in Target for any or no reason.
IRS Circular 230 Disclosure: To ensure compliance with requirements imposed by the IRS, we inform you that (i) any discussion of U.S. tax matters contained in this communication (including any attachments) is not intended or written to be used, and cannot be used, for the purpose of avoiding penalties under the Internal Revenue Code; (ii) any such discussion of tax matters is written in connection with the promotion or marketing of the matters addressed; and (iii) you should seek advice from an independent advisor.
1
2
Recent Events
On October 29, 2008, Pershing presented “A TIP for Target Shareholders,” which detailed a potential Transaction (“October 29th Transaction”) that would create long-term value for Target Corporation and its shareholders
After the presentation, Target expressed concerns regarding the October 29th Transaction
Since then, Pershing has met with Target, members of its Board, as well as Retail and Real Estate investors
We have received valuable feedback from these meetings
Today, we will present a Revised Transaction that addresses Target’s concerns, incorporates feedback from the investment community, and creates great value for Target shareholders
3
Agenda
Review of the October 29th Transaction
Target’s Concerns
A Revised Transaction
Benefits of the Revised Transaction
Appendix

Review of the October 29th
Transaction
Updating Our Model
Reduced Q4 ’08E same-store-sales expectations to negative 5%
Lowered capital expenditures in 2009 by approximately $1bn
Slowed square footage growth in 2010E
Halted share buybacks in Q4 2008 and for the full year 2009
Used a 20-day average stock price of $37 per share for Target
We have updated our model to reflect Q3 2008 results as well as revised guidance provided by Target management on its earnings call on Monday, November 17, 2008
The analyses provided in this presentation reflect the updated model
5

6
Objectives
Retain complete control of its buildings and its brand
Retain 100% flexibility with respect to its construction, remodeling, and relocation plans
Improve the Company’s free cash flow and access to capital
Increase the Company’s ROIC and lower its cost of capital
Maintain an investment grade credit rating
Increase the Company’s EPS growth rate
Minimize tax leakage and friction costs
In reviewing alternatives for Target, Pershing Square’s objective was to eliminate the stock market’s ascribed discount to the intrinsic value of Target’s real estate and allow the Company to:

October 29th Transaction
Tax-free spin of Target Inflation Protected REIT (or “TIP REIT”) as Groundlessor and Facility Manager
Pre–SpinTARGET
Shareholders
TARGET
New Target Corp owns its buildings on 75-year ground leases
Outsources Facilities Management Services
Continues to maintain properties
Leases back land to Target Corp through a Master Lease for a 75-year term
Elects REIT status at the time of spin-off
Becomes Target Corp’s outsourced facilities management provider
Becomes Target’s exclusive land developer for the first two years
After two years, becomes Target Corp’s Preferred Vendor for land procurement
Post–SpinTARGET
Shareholders
Ground Leases
LandFacilities
Mgmt.Services
Target Inflation Protected REIT
ExistingRetail
Business
OwnedBuildings 1
TARGET Corp
(1) Includes third-party ground leases
7

Unlocking Immense Real Estate Value
$37/Share (1) Inflation Protected Treasury Securities (TIPS) (3)
Large Cap REITs (1)
Target’s Market Valuation (1)
2009E EV / EBITDA
Inflation Protected Securities / REIT Market Valuations
2009E EV / EBITDA
5.8x 35.7x14.5xRecent “Big Box” Ground
Lease (2)
17.0x
REITs, private market ground leases, and inflation-protected securities all trade at much higher valuation multiples than Target’s multiple, at only 5.8x ‘09E EV/EBITDA, based on a 20-day trading average stock price of $37
The Transaction creates immense and instant value because 22% of Target’s current EBITDA will be valued at a significantly higher multiple than where Target trades today
8
Note: Target valuation assumes sale of remaining 53% interest on credit card receivables for $4.4bn, with Target retaining $150mm of credit card EBITDA (1) Based on a 20-day trading average as of 11/14/08(2) Based on mid-point precedent cap rate of 5.9%(3) Based on current 20-year TIP yield of 2.8% as of 11/14/08

$0
$20
$40
$60
$80
Target (20-Day Avg. Price) ¹ TIP REIT Spin-Off ² 12-Month Price Target ²
$/Sh
are
TIP REIT
Target CorpTarget
Standalone
81%
$37
$67
$36
$31 $41
$39
$80
TIP REIT
Target Corp
Valuation Summary
9
Note: Target valuation assumes sale of remaining 53% interest on credit card receivables for $4.4bnFor illustrative purposes, assumes Spin-off Transaction occurs on 01/01/09(1) Based on 20-day trading average as of 11/14/08; assumes sale of remaining 53% interest on credit card business with proceeds used to pay down debt (2) Based on mid-point of valuation analysis
Equity Value ($bn) $28 $24 Equity Value ($bn) $31Enterprise Value ($bn) $37 $33 Enterprise Value ($bn) $39 '09E EV/EBITDA 5.8x 6.5x '10E EV/EBITDA 7.0x '09E P/E 11.4x 14.7x '10E P/E 16.1x Equity Value ($bn) $27 Equity Value ($bn) $29 Enterprise Value ($bn) $27 Enterprise Value ($bn) $30 ‘09E Dividend Yield 5.0% ‘10E Dividend Yield 4.8% Cap Rate 5.4% Cap Rate 5.1% '09E P/AFFO 20.0x '10E P/AFFO 21.0x '09E EV/EBITDA 19.1x '10E EV/EBITDA 20.1x
Targ
etC
orp
TIP
REI
T

Even ignoring valuation benefits, there are important strategic reasons to consummate the Transaction…
10

11
Benefits of the October 29th Transaction
1. Allows Target Corp to retain control over its buildings and brand
2. Improves Target’s overall access to capital
There is risk to Target’s status quo. Retailers’ access to capital has been called into question
TIP REIT is one of the most stable companies in the world
TIP REIT is better able to access capital for future land acquisitions thanTarget today, given TIP REIT’s immense security, stability, and unleveraged balance sheet
TIP REIT can use non-cash currency (OP units) for tax-efficient real estate acquisitions

2009E 2009E Net Incremental($mm, except per share data) Standalone (1) Target Corp (1) Cash Flow
Memo: Incremental Rent Expense – 1,433
Cash Flow Impact on Key Affected MetricsIncremental After-Tax Rent Expense – 888 (888)Dividends Paid 483 – 483Land Development Capex 890 – 890Net Impact to Cash Flow $1,373 $888 $484
12
Benefits of the October 29th Transaction (cont’d)
3. Increases free cash flow at Target Corp by nearly $500mm, thereby decreasing Target’s capital needs
After-tax rent expense of ~$890mm is offset by land development capex of ~$890mm, which is funded by TIP REIT
TIP REIT pays all of Target’s 2009E dividends of 64 cents/share as well as an incremental $1.15/share to Target shareholders
(1) Assumes sale of remaining 53% interest on credit card receivables for $4.4bn on 01/01/09, with Target retaining $150mm of credit card EBITDA in ’09E

13
Benefits of the October 29th Transaction (cont’d)
4. Maintains an investment grade credit ratings profile
5. Provides a clear path back to an “A” category credit rating
6. Creates over $510mm of tax savings in the first year post transaction
Optimizes ownership of land, a non-depreciable asset, through a REIT structure
PF 2008E (1) 2009E 2010E 2011E
($bn, except where noted)
Target Corp Adj. Debt/EBITDAR 3.4x 3.2x 2.8x 2.8x
Expected Ratings Profile Mid - High BBB/Baa Mid - High BBB/Baa A- / A3 A- / A3
(1) Assumes sale of remaining 53% interest on credit card receivables for $4.4bn on 01/01/09, with proceeds used to pay down debt

14
Benefits of the October 29th Transaction (cont’d)
7. Increases total dividends for Target’s current shareholders from $0.64/share to $1.79/share in 2009E (1)
8. Improves store-level ROIC and increases Target’s EPS growth rate
9. Achieves a tax-free spin-off
10. Creates enormous shareholder value, potentially increasing Target’s stock price from $37 to $67 per share
(1) Excludes $112mm (approximately $0.15/share) of incremental interest expense due to CY2009 cash E&P distribution

15
TIP REIT Investment Highlights
“Land-only” structure is extremely secure■ $39bn of “Lease Security”, including $20bn of unencumbered buildings
Long-term lease provides bond-like stability and inflation-protection■ 75-year, inflation-protected “Master Lease” with Target Corp
Significant growth opportunity■ Formal arrangement with Target Corp provides long-term growth pipeline
High quality locations and superb tenant profile
De minimis maintenance capex allows for strong FCF generation
Tremendous size and scale – a “must-own” yield stock

(1) As of November 14, 2008(2) Represents non-financial companies in the S&P 500 with market caps greater than $20bn(3) Based on 2009E dividends
Rank Company Dividend Yield (%) 1 Altria Group 7.92 Pfizer 7.9 3 General Electric 7.7 4 Bristol-Myers Squibb 6.3 5 Verizon Communications 6.1 6 E.I. DuPont de Nemours 6.0 7 Eli Lilly 5.9 8 AT&T 5.8 9 Philip Morris International 5.6
10 Merck 5.6 11 TIP REIT (3) 5.0 12 Southern Co. 4.8 13 Caterpillar 4.5 14 Home Depot 4.4 15 Dominion Resources 4.3
16
Large, Liquid, “Must-Own” Yield Stock
TIP REIT will be the 58th largest company in the S&P 500
Given its market cap, TIP REIT will be owned by S&P 500 index funds, large cap funds, real estate index funds, yield-oriented investors, and investors seeking inflation-protected assets
S&P 100 Non-Financials Ranked by Dividend Yield (2)S&P 500 Ranked by Market Cap (1)
Rank Company Market Cap (1)
($mm) 50 Time Warner 32,821
51 Colgate-Palmolive 31,323
52 Devon Energy 30,960
53 Boeing 30,129
54 Union Pacific 29,160
55 Lockheed Martin 28,948
56 Southern 27,273
57 Burlington Northern Santa Fe 27,257
58 TIP REIT 27,000
59 Celgene 26,965
60 Lowe’s 26,689

17
Leverage None High: 54% Debt-to-TMCAverage: 44% Debt-to-TMC
TIP REIT Large Cap REITs
NoneHigh – REITs have borrowed at low rates and are facing much higher rates and refinancing risk for debt maturities
None / 100% rental income Sometimes
None / 75-year lease Yes, typically 10% or more of leases up for renewal annually
Re-leasing Risk
None Yes, typically 8% of EBITDAMaintenanceCapital
Preferred vendor arrangement No preferred arrangementGrowth
$20bn of unencumbered buildings, given “land-only” structure None. Owns both land buildings“Lease Security”
TransactionIncome
RefinancingRisk / EarningsPressure
TIP REIT: Unlike Any Existing REIT Today
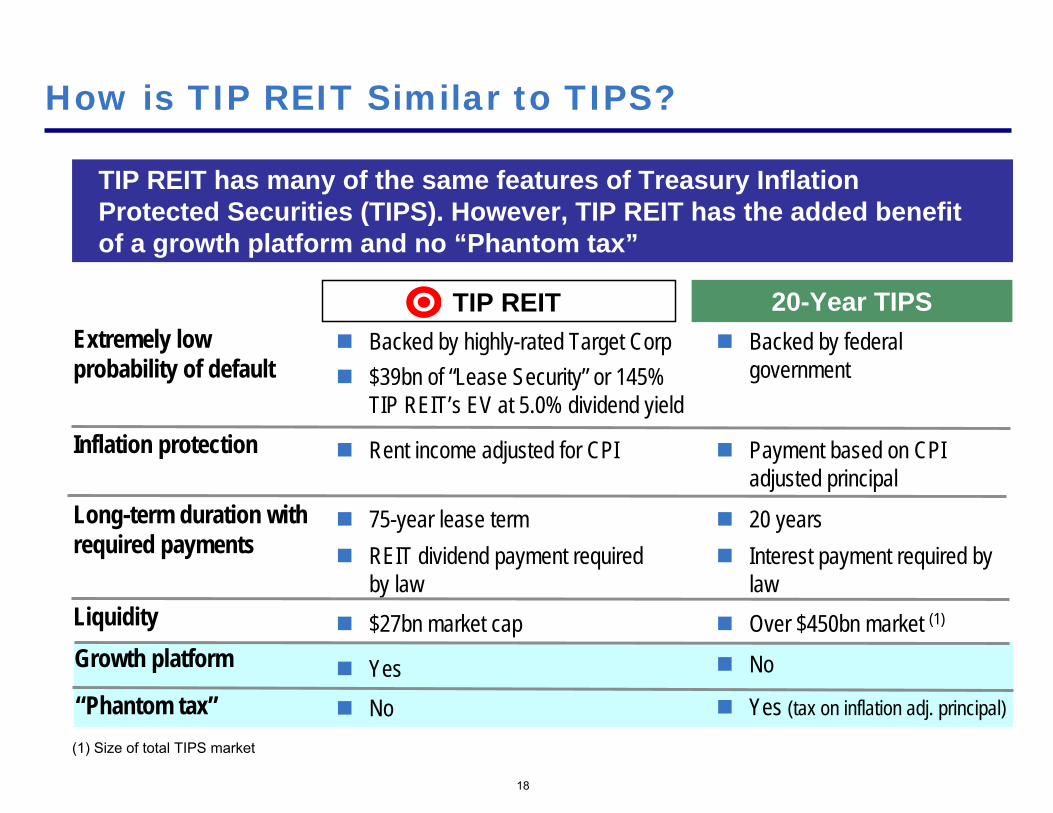
18
How is TIP REIT Similar to TIPS?
TIP REIT has many of the same features of Treasury Inflation Protected Securities (TIPS). However, TIP REIT has the added benefit of a growth platform and no “Phantom tax”
20-Year TIPSTIP REITExtremely low probability of default
Backed by highly-rated Target Corp$39bn of “Lease Security” or 145% TIP REIT’s EV at 5.0% dividend yield
Backed by federal government
Inflation protection Payment based on CPI adjusted principal
Rent income adjusted for CPI
Long-term duration with required payments
75-year lease termREIT dividend payment required by law
20 yearsInterest payment required by law
Liquidity $27bn market cap Over $450bn market (1)
Growth platform
“Phantom tax”Yes No
No Yes (tax on inflation adj. principal)
(1) Size of total TIPS market

Feedback from REIT Investors
Since the October 29th presentation, Pershing Square has met or held calls with several of the largest REIT investors and received valuable feedback regarding TIP REIT
Appreciation of the security and stability offered by land-only structure
Agreement on a valuation premium for land-only REIT (versus a land and building REIT)
Strong interest in an unlevered REIT
Desire for more large cap, liquid REITs
Interest in an independent TIP REIT Board and management
Valuation benefits of an “A” category credit rating at Target
Feedback from REIT investors
19

Interest from a Broad Group of Investors
In addition, Pershing Square has received strong interest in TIPREIT from a broad category of large investor groups beyond traditional REIT investors
Pensions
Endowments
Income-oriented funds
20
These investors are seeking security, stability, long-term inflation-protection, and a higher yield than that offered by TIPS

Target’s Concerns Regarding the October 29th Transaction

22
Target’s Concerns
Target expressed the following concerns regarding the October 29th Transaction:
Concern Management’s Commentary 1. Valuation
“The validity of assumptions supporting Pershing Square's market valuation of Target and the separate REIT entity”
2. Reduction in Target’s financial flexibility and inflation risk
“The reduction in Target's financial flexibility due to the conveyance of valuable assets to the REIT and the large expense obligation created by the proposed lease payments which are subject to annual increase”
3. Credit ratings, borrowing costs, and liquidity
“The adverse impact that the company believes the proposed structure would have on Target's debt ratings, borrowing costs and liquidity, exacerbated by current market conditions”
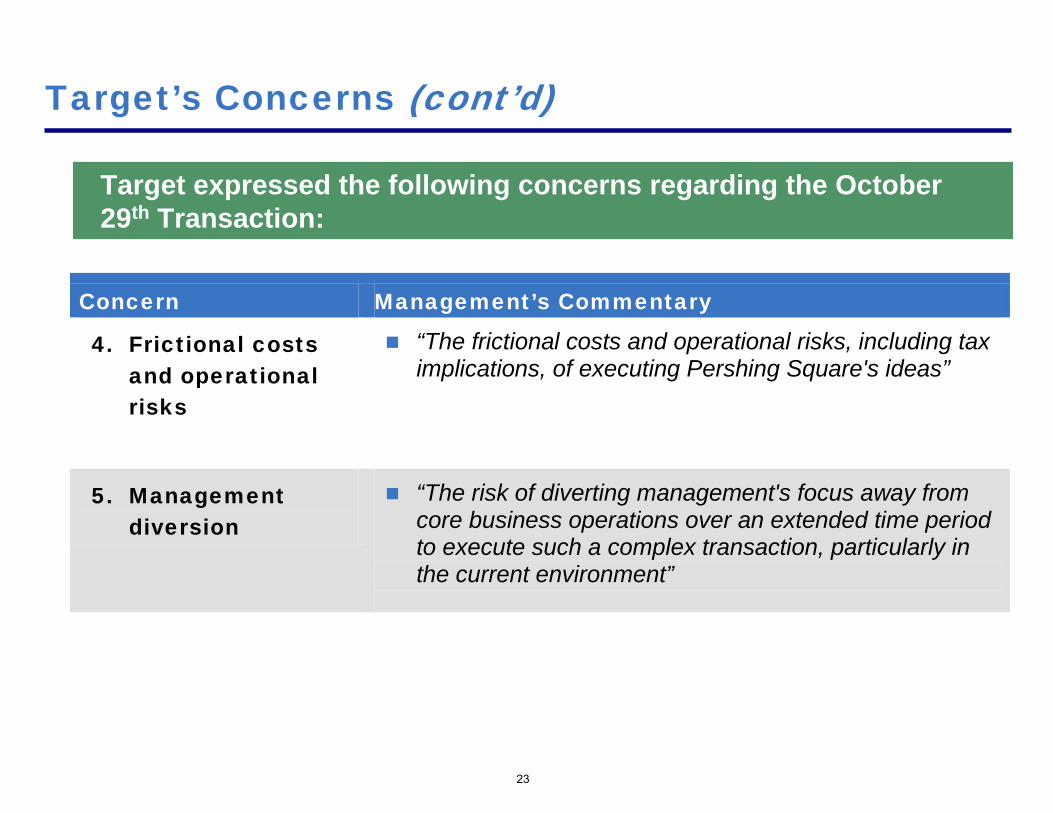
23
Target’s Concerns (cont’d)
Target expressed the following concerns regarding the October 29th Transaction:
Concern Management’s Commentary
4. Frictional costs and operational risks
“The frictional costs and operational risks, including tax implications, of executing Pershing Square's ideas”
5. Management diversion
“The risk of diverting management's focus away from core business operations over an extended time period to execute such a complex transaction, particularly in the current environment”

A Revised Transaction
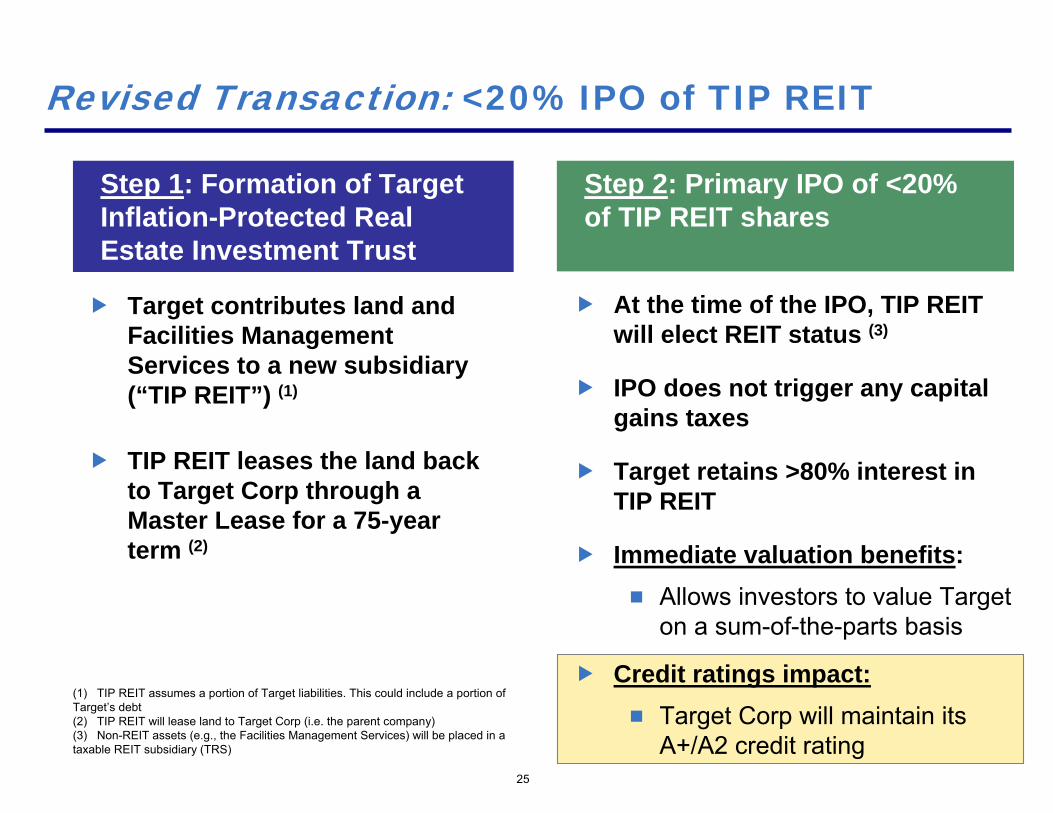
25
Revised Transaction: <20% IPO of TIP REIT
Step 1: Formation of Target Inflation-Protected Real Estate Investment Trust
Step 2: Primary IPO of <20% of TIP REIT shares
Target contributes land and Facilities Management Services to a new subsidiary (“TIP REIT”) (1)
TIP REIT leases the land back to Target Corp through a Master Lease for a 75-year term (2)
At the time of the IPO, TIP REIT will elect REIT status (3)
IPO does not trigger any capital gains taxes
Target retains >80% interest in TIP REIT
Immediate valuation benefits: Allows investors to value Target on a sum-of-the-parts basis
Credit ratings impact:Target Corp will maintain its A+/A2 credit rating
(1) TIP REIT assumes a portion of Target liabilities. This could include a portion of Target’s debt(2) TIP REIT will lease land to Target Corp (i.e. the parent company)(3) Non-REIT assets (e.g., the Facilities Management Services) will be placed in a taxable REIT subsidiary (TRS)

26
Post IPO: Pay Down ~$9bn of Debt
Step 3: Sale of the remaining 53% interest in Target’s Credit Card Receivables
Step 4: Pay down ~$9bn of Target debt using all of the credit card proceeds, a portion of the IPO proceeds, and free cash flow
At an opportune time (either pre- or post-IPO), Target sells remaining 53% interest in its credit card receivables
For this analysis, we have assumed $4.4bn of proceeds from the sale
$1.6bn of cash proceeds from the IPO is left on TIP REIT’s balance sheet
(1) Assumes TIP REIT funds land development capital expenditures of approximately $0.9bn post-IPO using debt
$ in billionsGross Receivables CY 2008E $9.0Allowance (0.8)Net Receivables CY 2008E $8.2
53% Interest at Net Book Value $4.4
($bn)
Paydown using Proceeds from Credit Card SaleSecuritized Debt $1.9Unsecured Debt 2.5Total $4.4
Paydown using IPO Proceeds 3.0Paydown using Free Cash Flow (1) 1.8
Total Debt Paydown $9.2
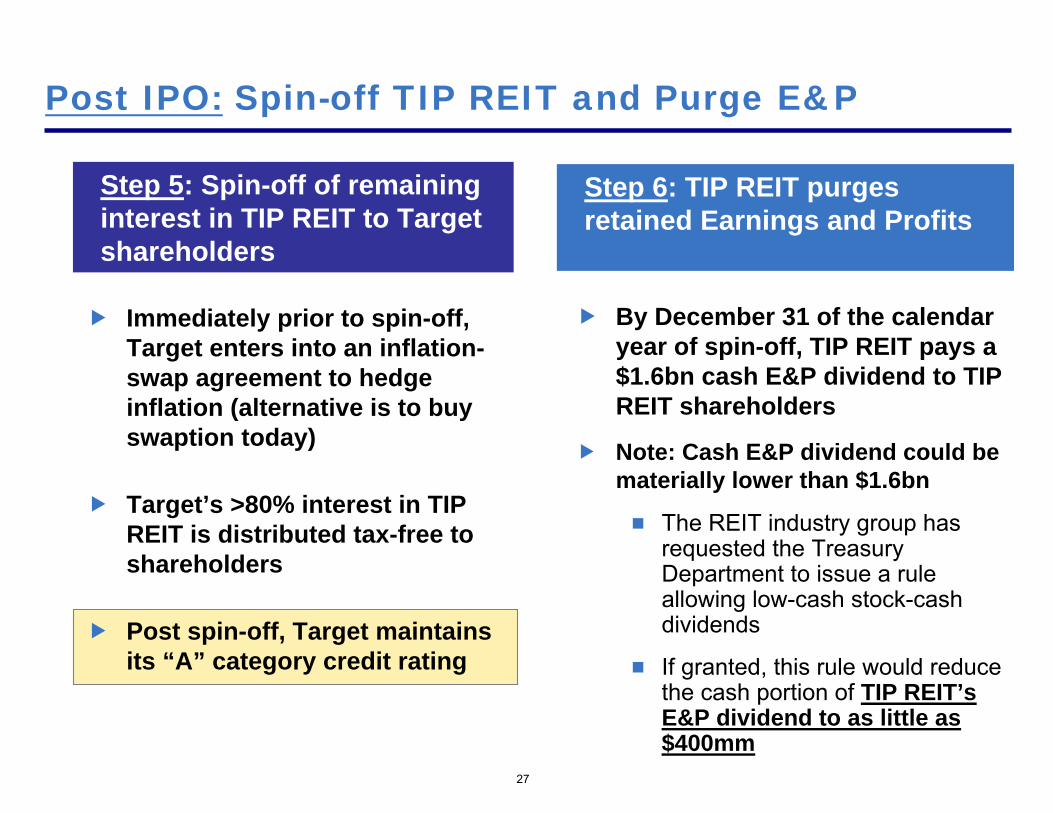
Post IPO: Spin-off TIP REIT and Purge E&P
Step 5: Spin-off of remaining interest in TIP REIT to Target shareholders
Step 6: TIP REIT purges retained Earnings and Profits
Immediately prior to spin-off, Target enters into an inflation-swap agreement to hedge inflation (alternative is to buy swaption today)
Target’s >80% interest in TIP REIT is distributed tax-free to shareholders
Post spin-off, Target maintains its “A” category credit rating
By December 31 of the calendar year of spin-off, TIP REIT pays a $1.6bn cash E&P dividend to TIP REIT shareholders
Note: Cash E&P dividend could be materially lower than $1.6bn
The REIT industry group has requested the Treasury Department to issue a rule allowing low-cash stock-cash dividends
If granted, this rule would reduce the cash portion of TIP REIT’sE&P dividend to as little as $400mm
27

TIP REIT IPO Proceeds
Assuming a 19.9% IPO of TIP REIT at a 15% IPO discount, the IPO would generate roughly $5.1bn in gross proceeds. After frictional costs and expenses, IPO proceeds of $3.0bn will be paid to retire Target debt and $1.6bn will remain at TIP REIT
28
(1) Calculation based on allocating and subsequently paying down $3.0bn of debt(2) Calculation based on adding net proceeds of $4.6bn to captive TIP REIT equity value of $24.0bn; assumes cash balance of $1.6bn at TIP REIT upon IPO(3) Assumes a 19.9% IPO of TIP REIT at a 15% IPO discount; net of paying $500mm after-tax frictional costs and fees, IPO proceeds are $4.6bn(4) Assumes approximately $350mm of after-tax frictional costs and $150mm of IPO fees
$ in billionsTIP REIT Equity Value $27.0
Implied 2009E Dividend Yield 5.0%
Captive TIP REIT Equity Value $24.0 (1)
Discount 15% 20.4New Issuance 19.9% 25.5
TIP REIT Post-IPO Equity Value $28.6 (2)
TIP REIT Gross IPO Proceeds $5.1 (3)
Use of IPO Proceeds:Retire Target Debt $3.0Cash Remaining at TIP REIT 1.6 Pay Frictional Costs and Fees 0.5 (4)
Total IPO Proceeds $5.1

Sources and Uses of Cash at Target Corp
29
Proceeds from the IPO and the sale of the remaining interest in the credit card receivables can be used to pay down debt
(1) Reflects cash flow generated after working capital, capex, and dividends; assumes maintenance of $500mm minimum cash balance; assumes TIP REIT funds land development capital expenditures of approximately $0.9bn by issuing debt during the first year post-IPO
Cash Sources ($bn) Cash Uses ($bn)
IPO Proceeds to Retire Target Debt $3.0 Paydown of Securitized Debt $1.9
Credit Card Sale Proceeds 4.4 Paydown of Unsecured Debt 7.3
1-Yr Cash Flow Generated at Target Corp (1) 1.8
Total Cash Sources $9.2 Total Cash Uses (Debt Paydown) $9.2

Target Pro FormaStandalone Target Corp
($bn) 2008E Adjustments Post Spin-off
JPMorgan GAAP Liability $3.6 ($3.6) -Credit Card Securitized Debt 1.9 (1.9) -Unsecured Debt 12.3 (7.3) 5.0Ending Debt $17.8 ($12.8) $5.0Plus: Lease Adjusted Debt (8x Total Lease Expense) 1.4 13.6Ending Lease Adj. Debt $19.2 $18.7
Lease Adj. Total Debt / EBITDAR 2.8x 2.6x
Expected Ratings Profile "A" Category "A" Category
Memo: Rent Expense 0.2 1.7
Post Spin-off: Target Corp Credit Ratings
30
Post Spin-off, Target Corp will maintain an “A” category credit ratings profile
$9.2bn of Total Debt Paydown
(1) Based on $14.8bn of unsecured debt as of Q3 ’08A, reduced in 4Q ’08E by $2.5bn through debt pay down with free cash flow and cash on balance sheet (while maintaining $500mm minimum cash balance)(2) Based on 2008E EBITDAR for Target Standalone of $6.9bn and 2008E Rent Expense of $0.2bn(3) Based on 2010E EBITDAR for Target Corp post spin-off of $7.3bn and 2010E Rent Expense of $1.7bn
(2) (3)
(2) (3)
(1)
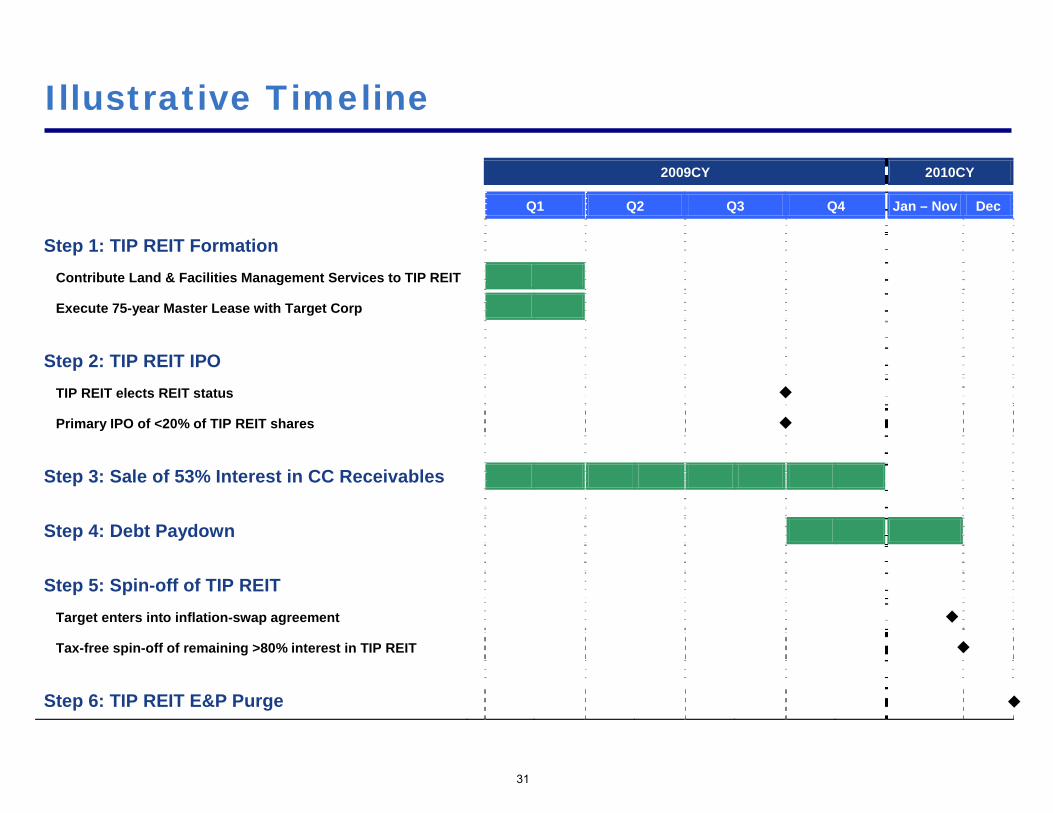
Illustrative Timeline
2009CY 2010CY
Q1 Q2 Q3 Q4 Jan – Nov Dec
Step 1: TIP REIT Formation
Contribute Land & Facilities Management Services to TIP REIT
Execute 75-year Master Lease with Target Corp
Step 2: TIP REIT IPO
TIP REIT elects REIT status
Primary IPO of <20% of TIP REIT shares
Step 3: Sale of 53% Interest in CC Receivables
Step 4: Debt Paydown
Step 5: Spin-off of TIP REIT
Target enters into inflation-swap agreement
Tax-free spin-off of remaining >80% interest in TIP REIT
Step 6: TIP REIT E&P Purge
31

$0
$20
$40
$60
$80
Target (20-Day Avg. Price) ¹ TIP REIT IPO ² 12-Month Future Price /TIP REIT Spin-Off ²
$/Sh
are
TIP REIT(Captive)
Target CorpTarget Standalone
77%
$37
$65
$30
$35 $46
$33
$79
TIP REIT
Target Corp
Valuation Analysis
32
Note: Target valuation assumes sale of remaining 53% interest on credit card receivables for $4.4bn, with Target retaining $150mm of credit card EBITDAFor illustrative purposes, assumes 19.9% REIT IPO occurs on 01/01/09 and full REIT Spin-off occurs on 01/01/10(1) Based on 20-day trading average as of 11/14/08; assumes sale of remaining 53% interest on credit card business with proceeds used to pay down debt (2) Based on mid-point of valuation analysis (3) Based on Adjusted Equity Value excluding cash balance of $1.6bn reserved for E&P distribution in 2010E
Equity Value ($bn) $28 $26 Equity Value ($bn) $35Enterprise Value ($bn) $37 $33 Enterprise Value ($bn) $39 '09E EV/EBITDA 5.8x 6.5x '10E EV/EBITDA 7.0x '09E P/E 11.4x 15.1x '10E P/E 16.8x Equity Value ($bn) $29 Equity Value ($bn) $31 Enterprise Value ($bn) $27 Enterprise Value ($bn) $30 ‘09E Dividend Yield (3) 5.0% ‘10E Dividend Yield (3) 4.8% Cap Rate 5.4% Cap Rate 5.1% '09E P/AFFO (3) 20.0x '10E P/AFFO (3) 21.0x '09E EV/EBITDA 19.1x '10E EV/EBITDA 20.1x
Targ
etC
orp
TIP
REI
T

Tremendous Upside at Various Assumptions
At any plausible valuation of TIP REIT and Target Corp, the Transaction results in a significant premium to the stock price of $37 / per share
33
TIP REIT ‘09E Dividend Yield
Targ
et C
orp
EV/ ’0
9E E
BITD
A
Value/Share ($)
Premium to $37 stock price (%)
TIP REIT ‘09E Dividend Yield
Targ
et C
orp
EV/ ’0
9E E
BITD
A
7.5% 7.0% 6.5% 6.0% 5.5% 5.0% 4.5%6.0x $52 $54 $55 $57 $59 $62 $656.5x 56 57 59 61 63 65 697.0x 59 60 62 64 66 68 727.5x 62 64 65 67 69 72 758.0x 66 67 69 70 73 75 78
7.5% 7.0% 6.5% 6.0% 5.5% 5.0% 4.5%6.0x 41% 45% 49% 54% 60% 67% 76%6.5x 51% 55% 59% 64% 70% 77% 85%7.0x 59% 63% 67% 72% 78% 85% 94%7.5x 68% 72% 76% 81% 87% 94% 103%8.0x 77% 81% 85% 90% 96% 103% 112%

Benefits of the Revised Transaction

Advantages of a Minority IPO of TIP REIT
35
Immediate value creation for Target shareholders
Force a market revaluation of TargetEnable investors to value Target based on a sum-of-the-parts basis, using the public valuation of TIP REIT
Immediately improves Target’s access to capital through TIP REIT
Increases Target’s liquidity, given ~$5bn of IPO proceeds
<20% IPO is a tax-free transaction
Maintains Target’s current “A” category credit rating
Provides funds for debt paydown
Preserves an “unwind” mechanism in the form of a buyback of the public minority stake of TIP REIT
A <20% IPO of TIP REIT would have several important advantages

Advantages of a Minority IPO of TIP REIT (cont’d)
36
Offers flexibility as to when Target:
Sells remaining interest in credit card receivables
Completes TIP REIT spin-off
Pays an E&P dividend ($1.6bn of cash in the calendar year of TIPREIT spin-off)
While maintaining control of TIP REIT, Target has the opportunity to:
“Test” the valuation of TIP REIT
Fine tune the relationship between Target / TIP REIT on land development issues
A Minority IPO would offer Target significant control and flexibility in executing the Revised Transaction
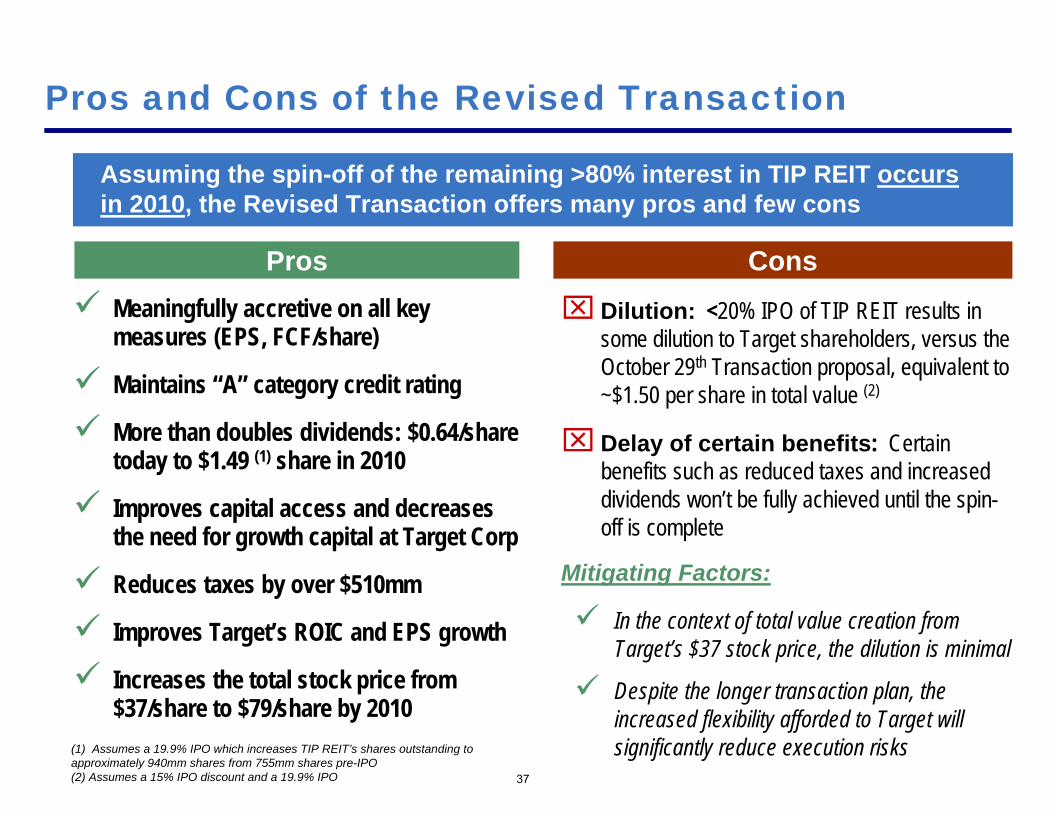
Pros and Cons of the Revised Transaction
Meaningfully accretive on all key measures (EPS, FCF/share)
Maintains “A” category credit rating
More than doubles dividends: $0.64/share today to $1.49 (1) share in 2010
Improves capital access and decreases the need for growth capital at Target Corp
Reduces taxes by over $510mm
Improves Target’s ROIC and EPS growth
Increases the total stock price from $37/share to $79/share by 2010
⌧ Dilution: <20% IPO of TIP REIT results in some dilution to Target shareholders, versus the October 29th Transaction proposal, equivalent to ~$1.50 per share in total value (2)
⌧ Delay of certain benefits: Certain benefits such as reduced taxes and increased dividends won’t be fully achieved until the spin-off is complete
Mitigating Factors:
In the context of total value creation from Target’s $37 stock price, the dilution is minimal
Despite the longer transaction plan, the increased flexibility afforded to Target will significantly reduce execution risks
Pros Cons
Assuming the spin-off of the remaining >80% interest in TIP REIT occurs in 2010, the Revised Transaction offers many pros and few cons
37
(1) Assumes a 19.9% IPO which increases TIP REIT’s shares outstanding to approximately 940mm shares from 755mm shares pre-IPO(2) Assumes a 15% IPO discount and a 19.9% IPO

Addressing Management’s Concerns
Concern Benefits of the Revised Transaction
1) Valuation Under any plausible valuation of TIP REIT, the Revised Transaction offers tremendous upside to Target’s stock price of $37
At Target’s current stock price of $37 and EV / ’09E EBITDA multiple of 5.8x, the implied dividend yield of TIP REIT is an improbable 16%
IPO provides a seasoning period for TIP REIT
An IPO would give the investment community several quarters to value TIP REIT before it is spun off, effectively seasoning the market and attracting long-term investors
Potential “unwind” mechanism
Should the Company not be satisfied with TIP REIT’s Transaction, Target can repurchase TIP REIT’s public minority stake, effectively “unwinding”the structure
38
Targ
et C
orp
EV/’0
9E E
BITD
A
TIP REIT ’09E Dividend Yield
Total Stock Price at Various ’09E Dividend Yields and ’09E Multiples
7.5% 7.0% 6.5% 6.0% 5.5% 5.0% 4.5%
6.0x $52 $54 $55 $57 $59 $62 $65
6.5x 56 57 59 61 63 65 69
7.0x 59 60 62 64 66 68 72
7.5x 62 64 65 67 69 72 75
8.0x 66 67 69 70 73 75 78

Addressing Management’s Concerns (cont’d)
Concern Benefits of the Revised Transaction
2) Reduction inTarget’s financialflexibility andinflation risk
Target pays down ~$9bn of debt, eliminating significant interest expense obligations
<20% IPO of TIP REIT provides the Company with the proceeds and flexibility to deleverage before the spin-off of the remaining interest in TIP REIT
Ground lease is more attractive than debtTIP REIT ground lease is, in many ways, more attractive than Target’s debt given the 75-year term, the lack of financial covenants, and the lack of refinancing risk
Inflation risk can be hedged out cheaplyTarget can lock in 20-year inflation protection today at ~250 bps per year, which implies an annual after-tax cost of approximately $0.03/share
39

Addressing Management’s Concerns (cont’d)
Concern Benefits of the Revised Transaction
3) Credit ratings,borrowing costs,and liquidity
Target will maintain its “A” category credit ratings at all times
Post spin-off of TIP REIT, Target Corp will maintain its “A” category credit rating as a result of deleveraging
Borrowing costs will not be impacted by the Revised Transaction
The Revised Transaction offers several key credit benefits:
Target’s liquidity is significantly increased given IPO proceeds
Target’s access to and cost of capital is improved by the formation of TIP REIT
40
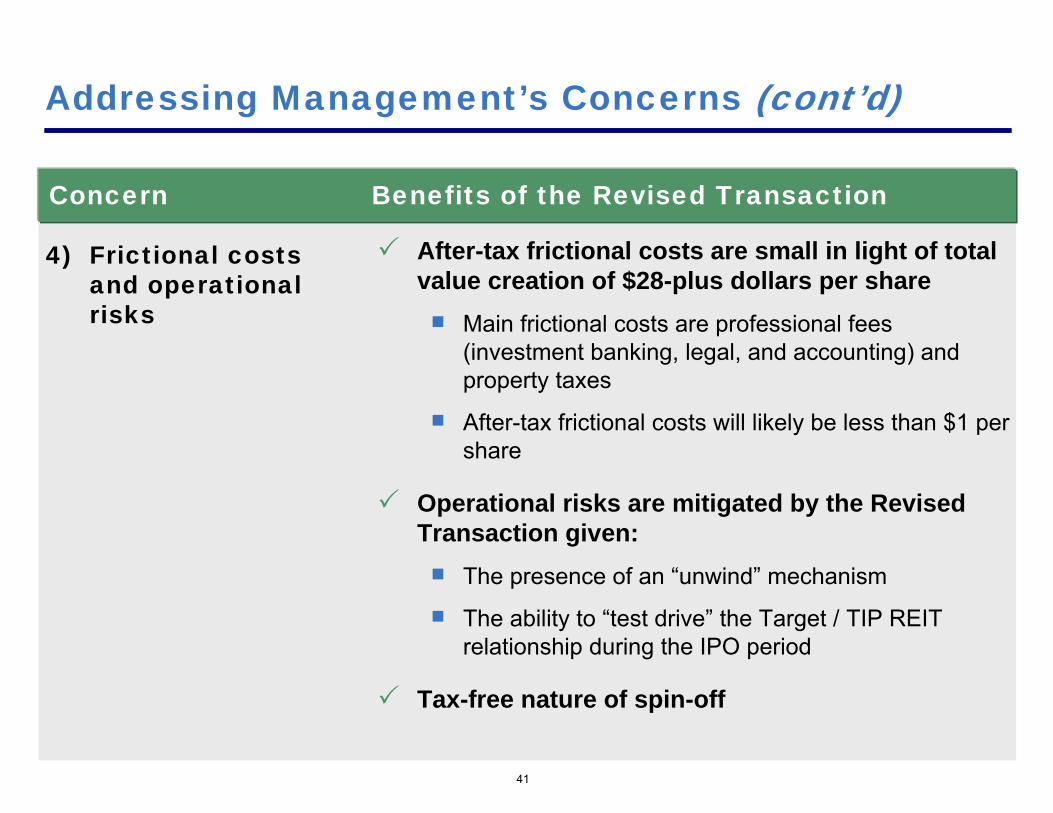
Addressing Management’s Concerns (cont’d)
Concern Benefits of the Revised Transaction
41
4) Frictional costsand operationalrisks
After-tax frictional costs are small in light of total value creation of $28-plus dollars per share
Main frictional costs are professional fees (investment banking, legal, and accounting) and property taxes
After-tax frictional costs will likely be less than $1 per share
Operational risks are mitigated by the Revised Transaction given:
The presence of an “unwind” mechanism
The ability to “test drive” the Target / TIP REIT relationship during the IPO period
Tax-free nature of spin-off

Addressing Management’s Concerns (cont’d)
Concern Benefits of the Revised Transaction
42
5) Managementdiversion
The formation of TIP REIT will require a modest amount of retail operating management’s time
Predominantly third-party legal and accounting work
CFO, EVP of Property Dev., and GC oversight required
Other members of senior operating management largely uninvolved
The Transaction is akin to placing a master ground lease on Target’s stores. It will be completely transparent and seamless to Target’s core business
IPO and eventual spin-off of TIP REIT will not distract Target’s core business teams:
Merchandising / purchasingMarketingRegional and store-levelIT / systems / administration
Vast majority of Target’s team
members will be uninvolved

Risk of the Status Quo
In today’s world, even the best retailers may lose access to capital
The TIP REIT IPO transaction would immediately increase Target’s access to capital
TIP REIT will have strong access to the debt and equity capital markets, far better than any retailer
TIP REIT will be able to issue OP units for tax-efficient land acquisitions
This Transaction will best position Target to benefit from a weak competitive environment
Given potential retailer bankruptcies, Target can use the liquidity provided by TIP REIT to acquire real estate that might be for sale at substantial discounts in the next 12-18 months
The risk of the status quo is that Target may lose access to capital and not be able take advantage of the current environment
43
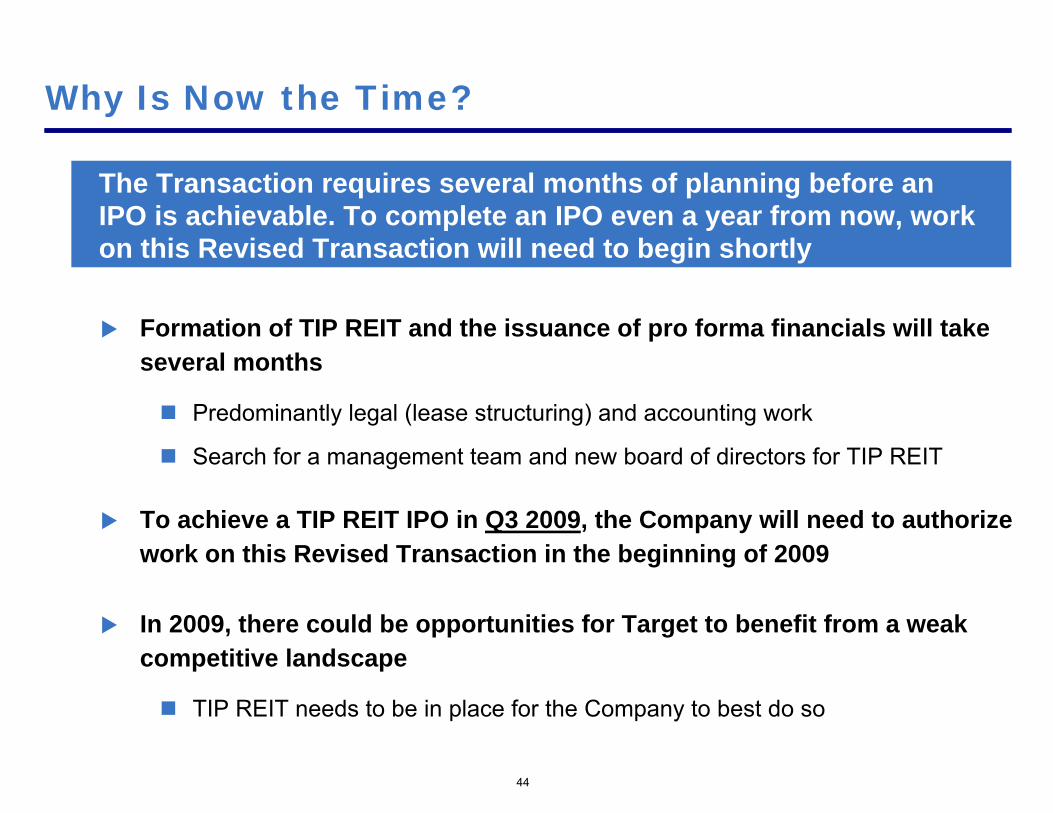
Why Is Now the Time?
44
Formation of TIP REIT and the issuance of pro forma financials will take several months
Predominantly legal (lease structuring) and accounting work
Search for a management team and new board of directors for TIP REIT
To achieve a TIP REIT IPO in Q3 2009, the Company will need to authorize work on this Revised Transaction in the beginning of 2009
In 2009, there could be opportunities for Target to benefit from a weak competitive landscape
TIP REIT needs to be in place for the Company to best do so
The Transaction requires several months of planning before an IPO is achievable. To complete an IPO even a year from now, workon this Revised Transaction will need to begin shortly

Fast Forward: 2010E and Beyond
For investors with a longer-term view, the Revised Transaction offers explosive potential upside in 2010E and beyond
A turn in the economy would lead to
Improved retail sales
Heightened inflation expectations
Potentially explosive earnings growth at Target Corp, particularly given recent expense reductions
Increased demand for TIP REIT, given inflation-protected income stream
45

46
Pershing’s Relationship with Target
Pershing has been in discussions with Target since May 2008 about a potential real estate transaction
We appreciate Target’s candid feedback and respect the Company’s concerns
Throughout this process, we have continually improved upon the transaction in an effort to create an outcome that satisfies Target’s strategic goals and concerns
We believe our Revised Transaction addresses all of Target’s concerns and achieves enormous value creation

Questions and Answers
Appendix

The Revised Transaction
Tax-free IPO and spin of Target Inflation Protected REIT (or “TIP REIT”) as Groundlessor and Facility Manager
Pre–Transaction
TARGET Shareholders
TARGET
New Target Corp owns its buildings on 75-year ground leases
Outsources Facilities Management Services
Continues to maintain properties
Leases back land to Target Corp through a Master Lease for a 75-year term
Elects REIT status at the time of IPO
Becomes Target Corp’s outsourced facilities management provider
Becomes Target Corp’s Preferred Vendor for land procurement
Post–Transaction
TARGET Shareholders
Ground Leases
LandFacilities
Mgmt.Services
Target Inflation Protected REIT
ExistingRetail
Business
OwnedBuildings 1
TARGET Corp
(1) Includes third-party ground leases
49
>80%
PublicShareholders
<20%

Revised Transaction: Steps 1 - 2
50
Step 1a: The existing company (“Target Corp”) forms a new subsidiary (“TIP REIT”) and transfers to it the Facilities Management Services business, the owned land under the stores, and the owned land under the distribution facilities
TIP REIT will assume a portion of Target’s liabilities
Transaction Description
Step 2: IPO / REIT Election
Step 1b: TIP REIT leases the land back to Target Corp (i.e. the parent company) through a Master Lease for a 75-year term
Step1: Formation of TIP REIT
Target Corp
TIP REITLandFacilities
ManagementServices
1a
75-year
Master Lease
Target Corp
LandFacilities
ManagementServices
TIP REIT
1b
Step 2a: After some period of time, TIP REIT offers up to 19.9% of its shares in a primary IPO for cash
Cash proceeds could be retained for corporate business purposes or used to reduce TIP REIT debt
Step 2b: TIP REIT elects REIT status effective immediately
Simultaneously, TIP REIT drops the Facilities Management Services business into a new corporation, a taxable REIT subsidiary (TRS)
Target Corp
Land
TIP REIT
Public
FacilitiesMgmt Services
(TRS)
<20% of TIP REITShares
Cash2a
2b
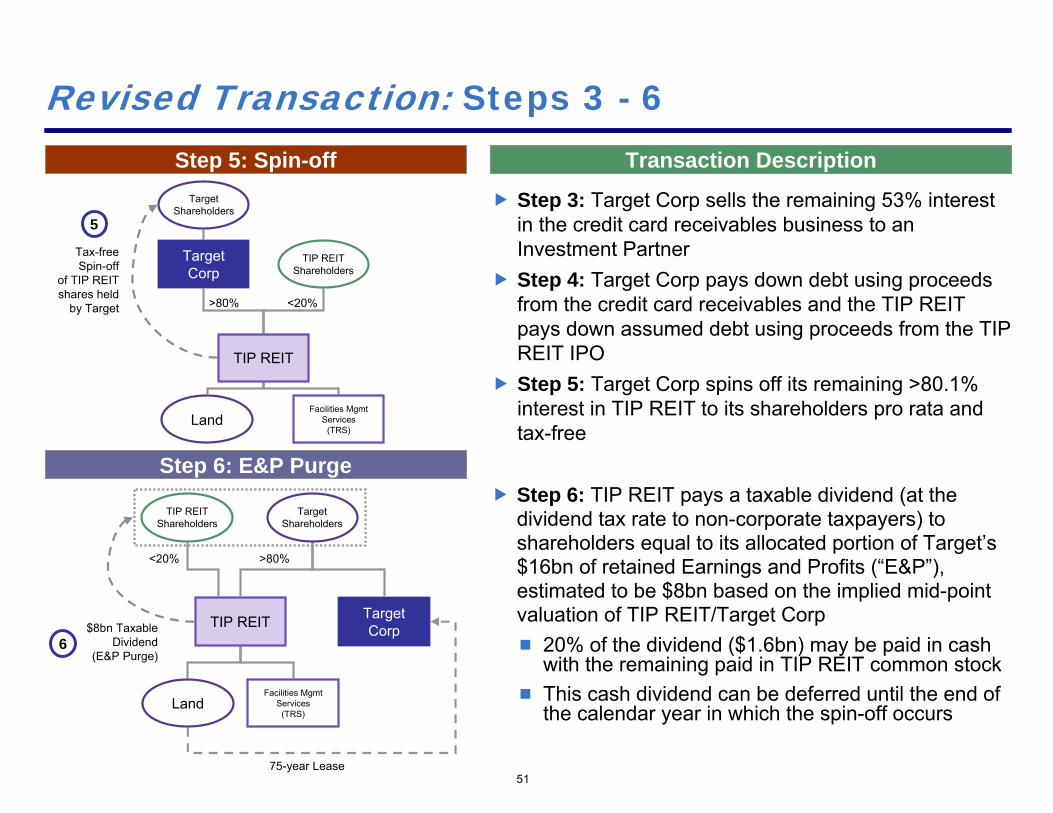
Revised Transaction: Steps 3 - 6
51
6
Transaction DescriptionStep 5: Spin-off
Step 6: E&P Purge
Step 3: Target Corp sells the remaining 53% interest in the credit card receivables business to an Investment PartnerStep 4: Target Corp pays down debt using proceeds from the credit card receivables and the TIP REIT pays down assumed debt using proceeds from the TIP REIT IPOStep 5: Target Corp spins off its remaining >80.1% interest in TIP REIT to its shareholders pro rata and tax-free
Step 6: TIP REIT pays a taxable dividend (at the dividend tax rate to non-corporate taxpayers) to shareholders equal to its allocated portion of Target’s $16bn of retained Earnings and Profits (“E&P”), estimated to be $8bn based on the implied mid-point valuation of TIP REIT/Target Corp
20% of the dividend ($1.6bn) may be paid in cash with the remaining paid in TIP REIT common stockThis cash dividend can be deferred until the end of the calendar year in which the spin-off occurs
5
Land
TIP REIT
TargetShareholders
Tax-freeSpin-off
of TIP REIT shares held
by Target
Facilities Mgmt Services
(TRS)
TargetCorp
TIP REITShareholders
TargetCorpTIP REIT
75-year Lease
$8bn Taxable Dividend
(E&P Purge)
LandFacilities Mgmt
Services(TRS)
<20% >80%
TargetShareholders
TIP REITShareholders
<20%>80%

Why are Treasury Inflation Protected Securities (“TIPS”) the Best Comparable Security to TIP REIT?

53
TIP REIT: (1) Valuing the TIP-like Security
TIP REIT: TIP-like Security
The TIP-like Security should trade at a small spread to TIPS of 195 – 245 bps
Rate / Yield Spread to TIPS
195 bps — 245 bps
2.8%
195 bps — 245 bps
4.75% — 5.25%
20-year TIP Yield Today
Current TGT Unsecured CDS @ ~220bps ± 25 bps 1.95% — 2.45%
—
The current TIPS yield of 2.8% implies an expected 20-year inflation rate of only 1.6%. If the expected 20-year inflation rate increased to 2.0% and the 20-year Treasury rate remained constant, then the 20-year TIPS would yield 2.4% and TIP REIT would yield 4.35% – 4.85%. The higher the inflation rate, the more valuable TIP REIT will be

54
TIP REIT: (2) Valuing the Land Developer
TIP REIT’s land development opportunity can be valued based on its growth platform value
Growth Platform Valuation
Based on 20-year DCF analysis
Implied valuation at 4.75% – 5.25% cap rate and 10.5% – 12.5% discount rate2029E terminal NOI: $2,503mmValuation range of $0.0bn – $2.4bn
(1) Based on 2029E NOI of $2,503mm and 4.75% cap rate
TerminalValue (1)
2009 2010 2011 2012 2013 ... 2029Incremental Rental Revenues $62 $122 $233 $366 $524After-tax Facilities Management Income 12 12 14 15 17G&A Expense (20) (21) (21) (22) (22)Total Capex (890) (830) (1,539) (1,801) (2,117)Free Cash Flow from Platform ($836) ($716) ($1,313) ($1,442) ($1,599)Terminal Value $52,694Discount Rate 12.5% 10.5%Terminal Cap Rate 5.25% 4.75%Present Value of Platform – $2,387
Platform Value
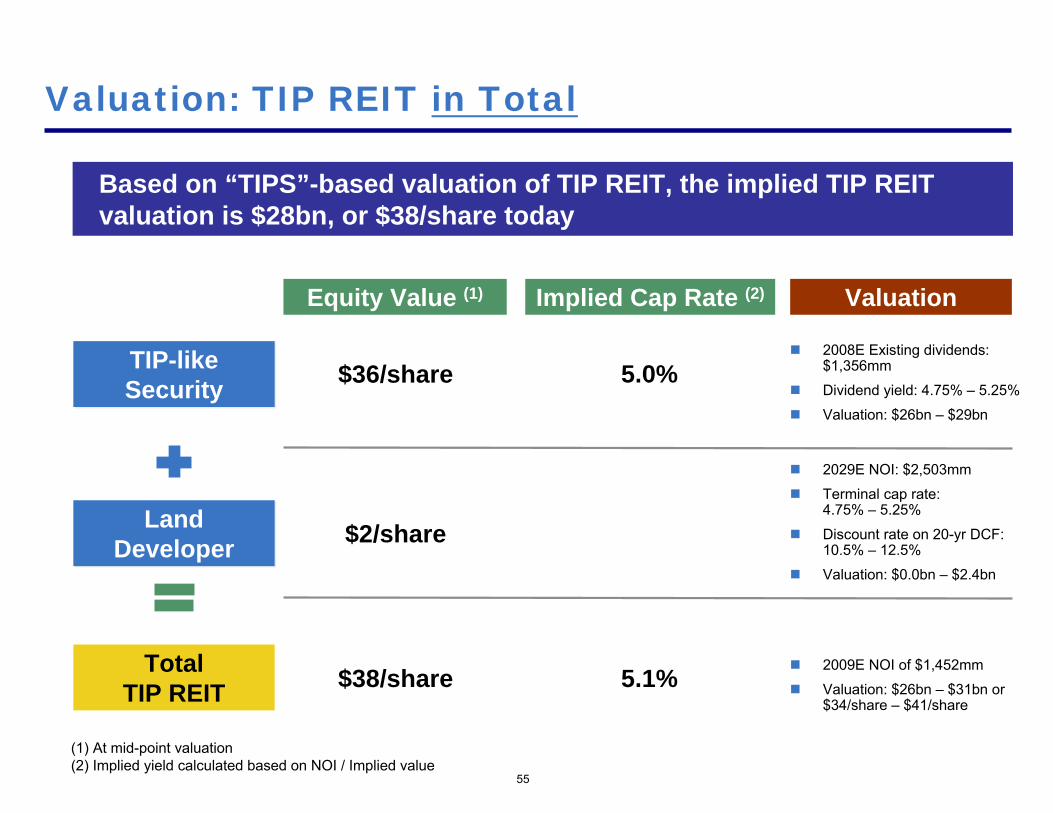
55
Valuation: TIP REIT in Total
TIP-like Security
Land Developer
Equity Value (1) Implied Cap Rate (2)
Total TIP REIT
$36/share 5.0%
(1) At mid-point valuation(2) Implied yield calculated based on NOI / Implied value
$2/share
$38/share 5.1%
Based on “TIPS”-based valuation of TIP REIT, the implied TIP REIT valuation is $28bn, or $38/share today
Valuation
2008E Existing dividends: $1,356mm
Dividend yield: 4.75% – 5.25%
Valuation: $26bn – $29bn
2029E NOI: $2,503mm
Terminal cap rate:4.75% – 5.25%
Discount rate on 20-yr DCF: 10.5% – 12.5%
Valuation: $0.0bn – $2.4bn
2009E NOI of $1,452mm
Valuation: $26bn – $31bn or $34/share – $41/share

TIP REIT
Target Corp
$67
$36
$31
Conservative Approach to Valuation
Our mid-point valuation price (pre-IPO) for TIP REIT of $36 (1) implies a 5.0% dividend yield for the TIPS-like security and (2) excludes the value of the Land Developer
TIP REIT Spin-offEquity Value / Share
56
Using a “TIPS”-based valuation analysis, our mid-point valuation price of $36/share excludes the value of TIP REIT’s development platform

Why is TIP REIT More Valuable than a Private Ground Lease?
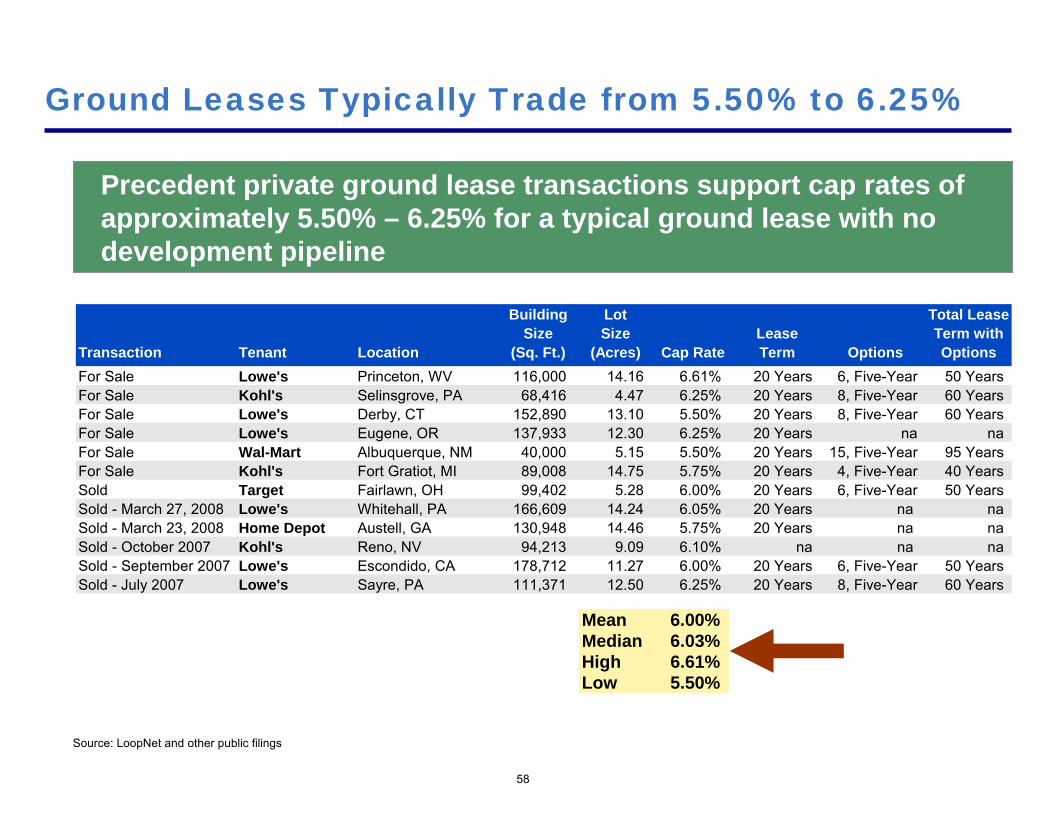
Building Lot Total LeaseSize Size Lease Term with
Transaction Tenant Location (Sq. Ft.) (Acres) Cap Rate Term Options OptionsFor Sale Lowe's Princeton, WV 116,000 14.16 6.61% 20 Years 6, Five-Year 50 YearsFor Sale Kohl's Selinsgrove, PA 68,416 4.47 6.25% 20 Years 8, Five-Year 60 YearsFor Sale Lowe's Derby, CT 152,890 13.10 5.50% 20 Years 8, Five-Year 60 YearsFor Sale Lowe's Eugene, OR 137,933 12.30 6.25% 20 Years na naFor Sale Wal-Mart Albuquerque, NM 40,000 5.15 5.50% 20 Years 15, Five-Year 95 YearsFor Sale Kohl's Fort Gratiot, MI 89,008 14.75 5.75% 20 Years 4, Five-Year 40 YearsSold Target Fairlawn, OH 99,402 5.28 6.00% 20 Years 6, Five-Year 50 YearsSold - March 27, 2008 Lowe's Whitehall, PA 166,609 14.24 6.05% 20 Years na naSold - March 23, 2008 Home Depot Austell, GA 130,948 14.46 5.75% 20 Years na naSold - October 2007 Kohl's Reno, NV 94,213 9.09 6.10% na na naSold - September 2007 Lowe's Escondido, CA 178,712 11.27 6.00% 20 Years 6, Five-Year 50 YearsSold - July 2007 Lowe's Sayre, PA 111,371 12.50 6.25% 20 Years 8, Five-Year 60 Years
Mean 6.00%Median 6.03%High 6.61%Low 5.50%
58
Ground Leases Typically Trade from 5.50% to 6.25%
Precedent private ground lease transactions support cap rates ofapproximately 5.50% – 6.25% for a typical ground lease with no development pipeline
Source: LoopNet and other public filings

Why is TIP REIT Better than a Private Ground Lease?
59
TIP REIT offers better value to investors than a typical privateground lease
TIP REIT has several qualities which make it more attractive than a private ground lease
Large cap, liquid public ownership
75-year Master Lease term (longer than most private ground leases)
1,435 retail properties (1) in 48 states
Inflation-protected rental stream with annual adjustments
Best-in-class retail tenant
Geographic diversity
Unlike a static ground lease, TIP REIT also has growth, given its dependable new store growth pipeline
Given the above factors, TIP REIT will trade at a lower cap rate than an individual private ground lease
(1) Represents 2008E Target Corp stores on TIP REIT land

Revised Transaction:Financial Models

Key Revised Assumptions in Models
61
We have updated our model to reflect Q3 2008 results as well as new guidance provided by Target management on its earnings call on Monday, November 17, 2008
Consolidated Model
Assume TIP REIT is captive and fully consolidated with the retailer for accounting purposesFor illustrative purposes, financials show full consolidation of the captive REIT throughout the entire projection period (such consolidation would cease upon full spin-off on 1/1/10)
TIP REIT Model
$1.6bn of cash E&P distribution now funded with proceeds from the 19.9% IPO of TIP REIT instead of additional debt
Target Corp Model
Adjustments to opening balance sheet reflect de-consolidation of TIP REIT from Consolidated Model
For illustrative purposes, we have assumed the sale of remaining 53% interest in the credit card business and the 19.9% IPO of TIP REIT occurring 1/1/09, to be followed by a full spin-off of TIP REIT on 1/1/10

Model – Consolidated
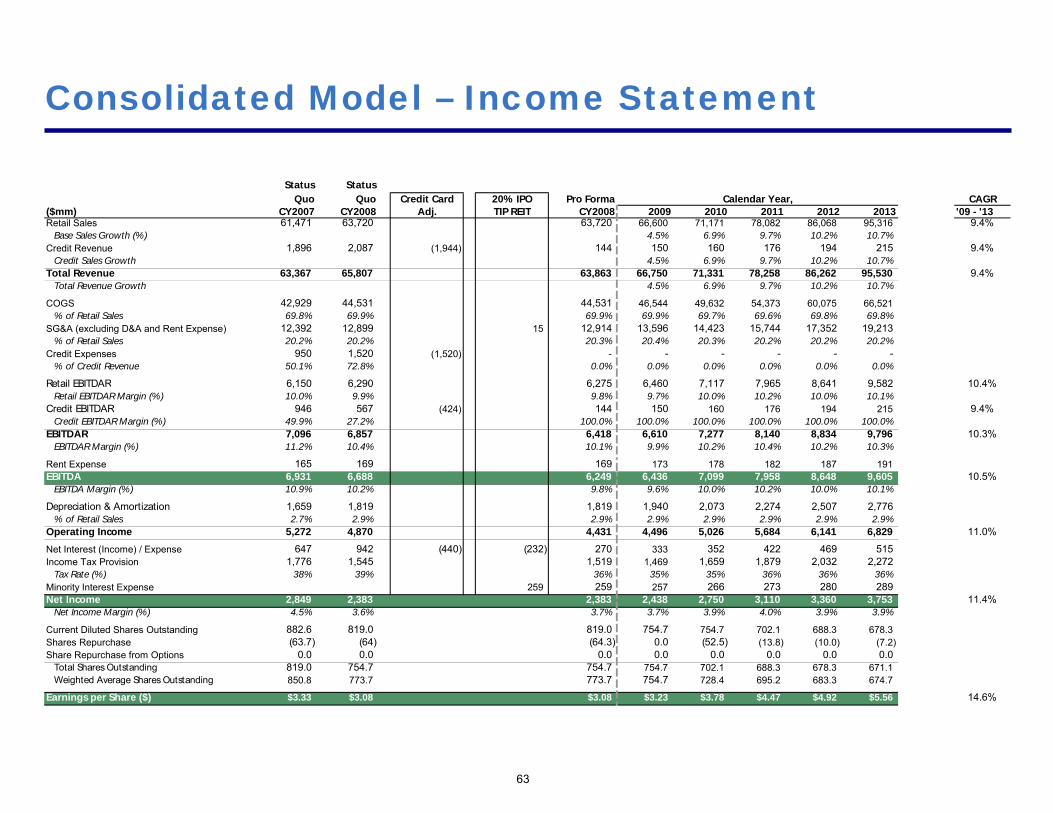
63
Consolidated Model – Income Statement
Status StatusQuo Quo Credit Card 20% IPO Pro Forma Calendar Year, CAGR
($mm) CY2007 CY2008 Adj. TIP REIT CY2008 2009 2010 2011 2012 2013 '09 - '13Retail Sales 61,471 63,720 63,720 66,600 71,171 78,082 86,068 95,316 9.4%
Base Sales Growth (%) 4.5% 6.9% 9.7% 10.2% 10.7%Credit Revenue 1,896 2,087 (1,944) 144 150 160 176 194 215 9.4%
Credit Sales Growth 4.5% 6.9% 9.7% 10.2% 10.7%Total Revenue 63,367 65,807 63,863 66,750 71,331 78,258 86,262 95,530 9.4%
Total Revenue Growth 4.5% 6.9% 9.7% 10.2% 10.7%
COGS 42,929 44,531 44,531 46,544 49,632 54,373 60,075 66,521% of Retail Sales 69.8% 69.9% 69.9% 69.9% 69.7% 69.6% 69.8% 69.8%
SG&A (excluding D&A and Rent Expense) 12,392 12,899 15 12,914 13,596 14,423 15,744 17,352 19,213% of Retail Sales 20.2% 20.2% 20.3% 20.4% 20.3% 20.2% 20.2% 20.2%
Credit Expenses 950 1,520 (1,520) - - - - - - % of Credit Revenue 50.1% 72.8% 0.0% 0.0% 0.0% 0.0% 0.0% 0.0%
Retail EBITDAR 6,150 6,290 6,275 6,460 7,117 7,965 8,641 9,582 10.4%Retail EBITDAR Margin (%) 10.0% 9.9% 9.8% 9.7% 10.0% 10.2% 10.0% 10.1%
Credit EBITDAR 946 567 (424) 144 150 160 176 194 215 9.4%Credit EBITDAR Margin (%) 49.9% 27.2% 100.0% 100.0% 100.0% 100.0% 100.0% 100.0%
EBITDAR 7,096 6,857 6,418 6,610 7,277 8,140 8,834 9,796 10.3%EBITDAR Margin (%) 11.2% 10.4% 10.1% 9.9% 10.2% 10.4% 10.2% 10.3%
Rent Expense 165 169 169 173 178 182 187 191EBITDA 6,931 6,688 6,249 6,436 7,099 7,958 8,648 9,605 10.5%
EBITDA Margin (%) 10.9% 10.2% 9.8% 9.6% 10.0% 10.2% 10.0% 10.1%
Depreciation & Amortization 1,659 1,819 1,819 1,940 2,073 2,274 2,507 2,776% of Retail Sales 2.7% 2.9% 2.9% 2.9% 2.9% 2.9% 2.9% 2.9%
Operating Income 5,272 4,870 4,431 4,496 5,026 5,684 6,141 6,829 11.0%
Net Interest (Income) / Expense 647 942 (440) (232) 270 333 352 422 469 515Income Tax Provision 1,776 1,545 1,519 1,469 1,659 1,879 2,032 2,272
Tax Rate (%) 38% 39% 36% 35% 35% 36% 36% 36%Minority Interest Expense 259 259 257 266 273 280 289Net Income 2,849 2,383 2,383 2,438 2,750 3,110 3,360 3,753 11.4%
Net Income Margin (%) 4.5% 3.6% 3.7% 3.7% 3.9% 4.0% 3.9% 3.9%
Current Diluted Shares Outstanding 882.6 819.0 819.0 754.7 754.7 702.1 688.3 678.3Shares Repurchase (63.7) (64) (64.3) 0.0 (52.5) (13.8) (10.0) (7.2)Share Repurchase from Options 0.0 0.0 0.0 0.0 0.0 0.0 0.0 0.0
Total Shares Outstanding 819.0 754.7 754.7 754.7 702.1 688.3 678.3 671.1Weighted Average Shares Outstanding 850.8 773.7 773.7 754.7 728.4 695.2 683.3 674.7
Earnings per Share ($) $3.33 $3.08 $3.08 $3.23 $3.78 $4.47 $4.92 $5.56 6.29 14.6%
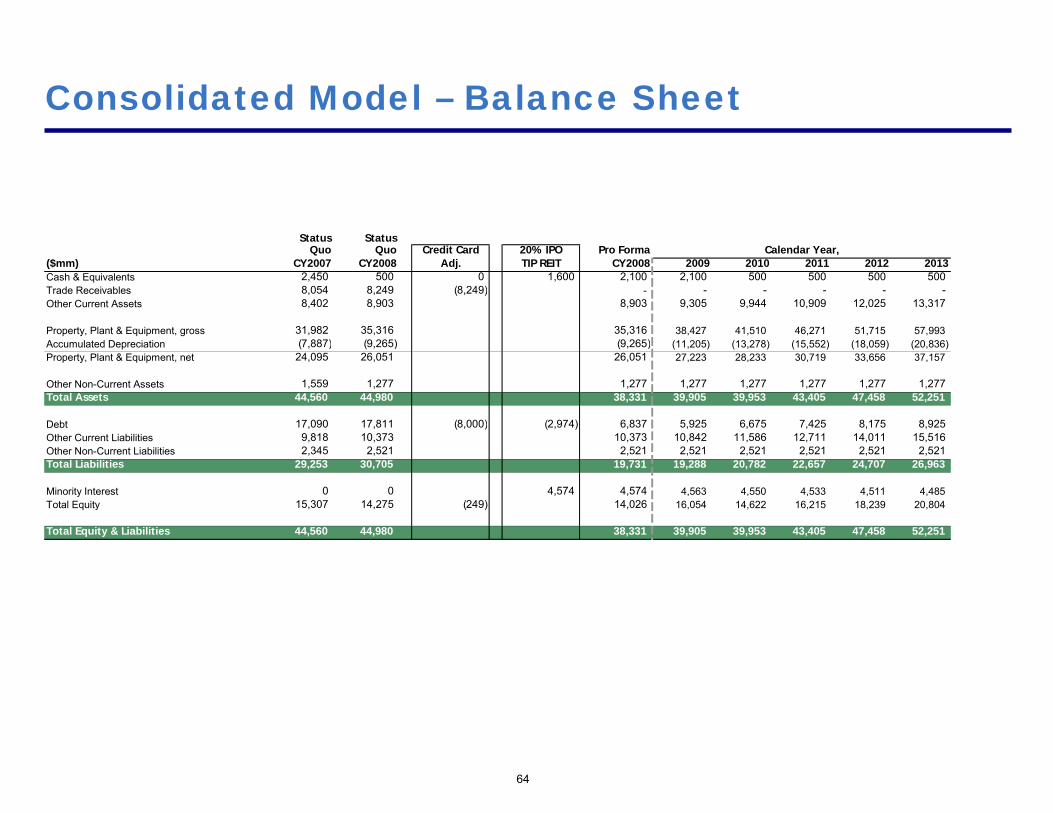
64
Consolidated Model – Balance Sheet
Status StatusQuo Quo Credit Card 20% IPO Pro Forma Calendar Year,
($mm) CY2007 CY2008 Adj. TIP REIT CY2008 2009 2010 2011 2012 2013Cash & Equivalents 2,450 500 0 1,600 2,100 2,100 500 500 500 500Trade Receivables 8,054 8,249 (8,249) - - - - - - Other Current Assets 8,402 8,903 8,903 9,305 9,944 10,909 12,025 13,317
Property, Plant & Equipment, gross 31,982 35,316 35,316 38,427 41,510 46,271 51,715 57,993Accumulated Depreciation (7,887) (9,265) (9,265) (11,205) (13,278) (15,552) (18,059) (20,836)Property, Plant & Equipment, net 24,095 26,051 26,051 27,223 28,233 30,719 33,656 37,157
Other Non-Current Assets 1,559 1,277 1,277 1,277 1,277 1,277 1,277 1,277Total Assets 44,560 44,980 38,331 39,905 39,953 43,405 47,458 52,251
Debt 17,090 17,811 (8,000) (2,974) 6,837 5,925 6,675 7,425 8,175 8,925 Other Current Liabilities 9,818 10,373 10,373 10,842 11,586 12,711 14,011 15,516Other Non-Current Liabilities 2,345 2,521 2,521 2,521 2,521 2,521 2,521 2,521Total Liabilities 29,253 30,705 19,731 19,288 20,782 22,657 24,707 26,963
Minority Interest 0 0 4,574 4,574 4,563 4,550 4,533 4,511 4,485Total Equity 15,307 14,275 (249) 14,026 16,054 14,622 16,215 18,239 20,804
Total Equity & Liabilities 44,560 44,980 38,331 39,905 39,953 43,405 47,458 52,251

65
Consolidated Model – Cash Flow Statement
Pro Forma Calendar Year,($mm) CY2008 2009 2010 2011 2012 2013EBITDA 6,688 6,436 7,099 7,958 8,648 9,605less: Interest Expense (270) (333) (352) (422) (469) (515)less: Taxes (1,545) (1,469) (1,659) (1,879) (2,032) (2,272)less: Dividends Paid to Minorities (268) (268) (279) (289) (302) (315)Share-based Compensation 73 73 73 73 73 73less: Increase in Net Working Capital 54 66 105 159 184 213less: Increase Funding of CC Growth 0 0 0 0 0 0Cash Flow from Operating Activities 4,733 4,506 4,988 5,600 6,103 6,789
Capital Expenditures (3,820) (3,111) (3,083) (4,761) (5,444) (6,277)Cash Flow from Investing Activities (3,820) (3,111) (3,083) (4,761) (5,444) (6,277)
Issuance of Debt 0 750 750 750 750Repayment of Debt (912) (0) 0 0 0Issuance of Equity / (Buy Back) 0 (3,760) (1,089) (890) (722)Issuance of Dividends to Common (483) (495) (501) (519) (540)Cash Flow from Financing Activities (1,395) (3,505) (839) (659) (512)
Beginning Cash Balance 2,100 2,100 500 500 500Change in Cash 0 (1,600) 0 0 0Ending Cash Balance 2,100 500 500 500 500
Average Cash Balance 2,100 1,300 500 500 500Interest Income 3.0% 63 39 15 15 15

66
Consolidated Model – Build-ups and Credit Metrics
StatusQuo Pro Forma Calendar Year,
Sales Buildup CY2007 CY2008 2009 2010 2011 2012 2013Square Feet (mm) 208 222 231 239 254 270 289$ / Sq. Ft. 296 286 288 297 308 318 330Retail Sales 61,471 63,720 66,600 71,171 78,082 86,068 95,316
Implied Retail Sales Growth (%) 3.7% 4.5% 6.9% 9.7% 10.2% 10.7%Sq. Footage Growth (%) 7.0% 4.0% 3.5% 6.0% 6.5% 7.0%SSS Growth (%) (3.1%) 0.5% 3.3% 3.5% 3.5% 3.5%
CapEx Buildup 2007 2008 2009 2010 2011 2012 2013Total System CapEx 4,369 3,820 3,111 3,083 4,761 5,444 6,277
CapEx as % of Retail Sales 7.1% 6.0% 4.7% 4.3% 6.1% 6.3% 6.6%
Status StatusQuo Quo Pro Forma
Credit Metrics CY2007 CY2008 CY2008Lease Adjusted Debt 8 x 1,320 1,353 1,353 1,387 1,421 1,457 1,493 1,531Actual Debt 17,090 17,811 6,837 5,925 6,675 7,425 8,175 8,925Total Lease Adjusted Debt 18,410 19,164 8,190 7,312 8,097 8,882 9,669 10,456
Total Lease Adjusted Debt/EBITDAR 2.6 x 2.8 x 1.3 x 1.1 x 1.1 x 1.1 x 1.1 x 1.1 xTotal Debt / EBITDA 2.5 x 2.7 x 1.1 x 0.9 x 0.9 x 0.9 x 0.9 x 0.9 x
EBITDAR / (Interest + Rent) 8.7 x 6.2 x 14.6 x 13.1 x 13.7 x 13.5 x 13.5 x 13.9 xEBITDA / Interest 10.7 x 7.1 x 23.2 x 19.3 x 20.2 x 18.9 x 18.5 x 18.6 x

67
Consolidated Model – Tax Adjustments
Pro Forma Calendar Year,($mm) CY2008 2009 2010 2011 2012 2013Profit Before Taxes 4,161 4,164 4,674 5,262 5,672 6,313Tax Rate (%) 39% 38% 38% 38% 38% 38%Taxes 1,636 1,582 1,776 1,999 2,155 2,399
Less: State Tax Savings (16) (16) (16) (16) (17) (17) Less: Tax Adj. for Public REIT Shareholders (102) (98) (101) (104) (106) (110) Less: Facilities Mgmt Tax Adj. (0) (0) (0) (0) (0) (0) Net Consolidated Taxes 1,519 1,469 1,659 1,879 2,032 2,272
Adjustment Calculations:
State Tax Savings:Total REIT Net Income 1,303 1,292 1,334 1,370 1,408 1,450 Net Income to Other Shareholders 259 257 266 273 280 289 Net Income to Target 1,044 1,035 1,069 1,097 1,128 1,161 Assumed Tax Rate (150bps less than current rate) 38% 37% 37% 37% 37% 37%Total State Tax Savings (16) (16) (16) (16) (17) (17)
Facilities Management Adjustments:Facilities Mgmt Income 19 19 20 22 24 27 Facilities Mgmt Taxes 7 7 8 8 9 10 Minority Interest on Taxes (1) (1) (2) (2) (2) (2) Target Share of Facilities Mgmt Income 10 10 11 12 13 15 Adjustment for Dividend Received Deduction 12% 11% 11% 11% 11% 11%Incremental Facilities Mgmt Adj. 1 1 1 1 2 2 Total Facilities Management Tax Adj. (0) (0) (0) (0) (0) (0)

Model – TIP REIT
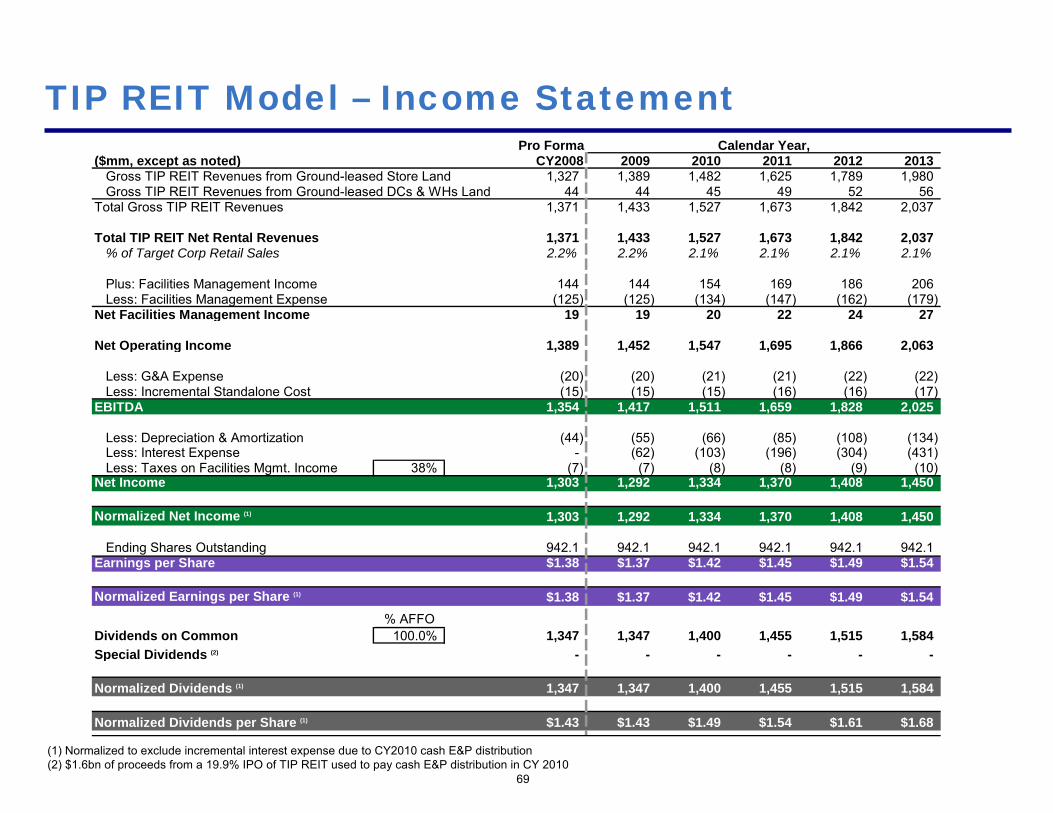
69
TIP REIT Model – Income Statement
(1) Normalized to exclude incremental interest expense due to CY2010 cash E&P distribution(2) $1.6bn of proceeds from a 19.9% IPO of TIP REIT used to pay cash E&P distribution in CY 2010
Pro Forma Calendar Year,($mm, except as noted) CY2008 2009 2010 2011 2012 2013
Gross TIP REIT Revenues from Ground-leased Store Land 1,327 1,389 1,482 1,625 1,789 1,980 Gross TIP REIT Revenues from Ground-leased DCs & WHs Land 44 44 45 49 52 56
Total Gross TIP REIT Revenues 1,371 1,433 1,527 1,673 1,842 2,037
Total TIP REIT Net Rental Revenues 1,371 1,433 1,527 1,673 1,842 2,037 % of Target Corp Retail Sales 2.2% 2.2% 2.1% 2.1% 2.1% 2.1%
Plus: Facilities Management Income 144 144 154 169 186 206 Less: Facilities Management Expense (125) (125) (134) (147) (162) (179)
Net Facilities Management Income 19 19 20 22 24 27
Net Operating Income 1,389 1,452 1,547 1,695 1,866 2,063
Less: G&A Expense (20) (20) (21) (21) (22) (22) Less: Incremental Standalone Cost (15) (15) (15) (16) (16) (17)
EBITDA 1,354 1,417 1,511 1,659 1,828 2,025
Less: Depreciation & Amortization (44) (55) (66) (85) (108) (134) Less: Interest Expense - (62) (103) (196) (304) (431) Less: Taxes on Facilities Mgmt. Income 38% (7) (7) (8) (8) (9) (10)
Net Income 1,303 1,292 1,334 1,370 1,408 1,450
Normalized Net Income (1) 1,303 1,292 1,334 1,370 1,408 1,450
Ending Shares Outstanding 942.1 942.1 942.1 942.1 942.1 942.1 Earnings per Share $1.38 $1.37 $1.42 $1.45 $1.49 $1.54
Normalized Earnings per Share (1) $1.38 $1.37 $1.42 $1.45 $1.49 $1.54% AFFO
Dividends on Common 100.0% 1,347 1,347 1,400 1,455 1,515 1,584 Special Dividends (2) - - - - - -
Normalized Dividends (1) 1,347 1,347 1,400 1,455 1,515 1,584
Normalized Dividends per Share (1) $1.43 $1.43 $1.49 $1.54 $1.61 $1.68

70
TIP REIT Model – Balance Sheet
Pro Forma Calendar Year,($mm, except as noted) CY2008 2009 2010 2011 2012 2013Real Estate:
Gross Existing Properties - Land & Improvements 11,833 11,833 11,833 11,833 11,833 11,833 Maintenance Capex - - - - - Development Properties - Land & Improvements 890 1,720 3,258 5,059 7,176 Accumulated Depreciation (885) (941) (1,007) (1,092) (1,199) (1,333)
Net Real Estate Asset 10,948 11,782 12,546 14,000 15,693 17,677
Cash - 3 3 3 3 3
Total Assets 10,948 11,785 12,549 14,003 15,696 17,680
Debt:Revolver - 3 3 3 3 3 New Debt - 890 1,720 3,258 5,059 7,176
Total Debt - 893 1,723 3,261 5,062 7,179
Common Equity 10,948 10,948 10,948 10,948 10,948 10,948 Retained Earnings (Deficit) (55) (121) (206) (314) (448) Total Equity 10,948 10,892 10,827 10,742 10,634 10,500
Total Liabilities & Equity 10,948 11,785 12,549 14,003 15,696 17,680
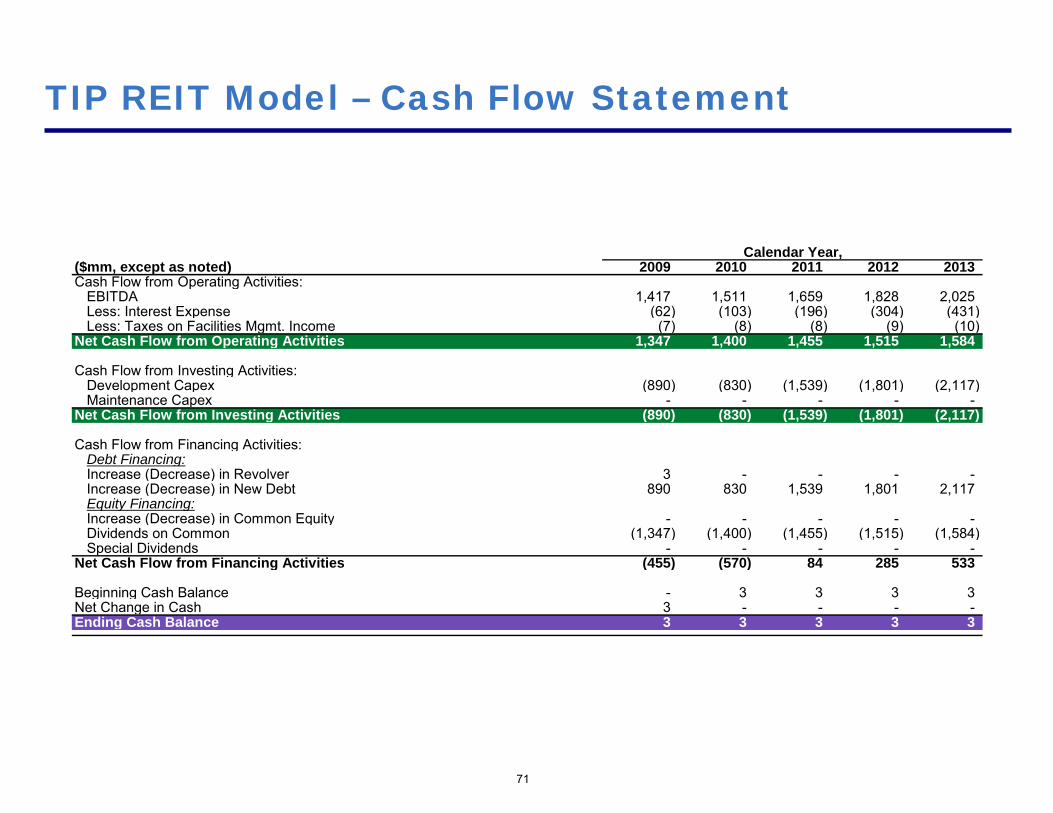
71
TIP REIT Model – Cash Flow Statement
Calendar Year,($mm, except as noted) 2009 2010 2011 2012 2013Cash Flow from Operating Activities:
EBITDA 1,353 1,417 1,511 1,659 1,828 2,025 Less: Interest Expense (205) (62) (103) (196) (304) (431) Less: Taxes on Facilities Mgmt. Income (7) (7) (8) (8) (9) (10)
Net Cash Flow from Operating Activities 1,141 1,347 1,400 1,455 1,515 1,584
Cash Flow from Investing Activities:Development Capex (890) (830) (1,539) (1,801) (2,117) Maintenance Capex - - - - -
Net Cash Flow from Investing Activities (890) (830) (1,539) (1,801) (2,117)
Cash Flow from Financing Activities:Debt Financing:Increase (Decrease) in Revolver 3 - - - - Increase (Decrease) in New Debt 890 830 1,539 1,801 2,117 Equity Financing:Increase (Decrease) in Common Equity - - - - - Dividends on Common (1,141) (1,347) (1,400) (1,455) (1,515) (1,584) Special Dividends - - - - -
Net Cash Flow from Financing Activities (455) (570) 84 285 533
Beginning Cash Balance - 3 3 3 3 Net Change in Cash 3 - - - - Ending Cash Balance - 3 3 3 3 3

72
TIP REIT Model – Rent Build-upPro Forma Calendar Year, CAGR
Assumptions ($mm, except as noted): CY2008 2009 2010 2011 2012 2013 '09 - '13Total Combined Stores - Sq. Ft. Count
Owned Stores 1,435 190 198 207 221 237 256 Combined (Ground-leased) Stores 176 23 23 23 23 23 23 Third-party Leased Stores 73 10 10 10 10 10 10
Total Combined Stores Square Footage 222 231 239 254 270 289 5.7%Total Combined Stores Square Footage Growth 4.0% 3.5% 6.0% 6.5% 7.0%
TIP REIT Stores - Sq. Ft. CountOwned Stores 1,435 Yes 190 198 207 221 237 256
Total TIP REIT Stores Square Footage 190 198 207 221 237 256 6.6%Total TIP REIT Stores Square Footage Growth 4.7% 4.1% 7.0% 7.5% 8.0%
Total Combined DCs & WHs - Sq. Ft. CountOwned DCs & WHs 25 35 35 35 37 39 41 Combined (Ground-leased) DCs & WHs 1 1 1 1 1 1 1 Third-party Leased DCs & WHs 5 7 7 7 7 7 7
Total Combined DCs & WHs Square Footage 44 44 44 46 47 49 3.0%Total DCs & WHs Sq. Ft. vs. Total Combined Stores Sq. Ft. 19.6% 18.9% 18.2% 18.0% 17.5% 17.0%
TIP REIT DCs & WHs - Sq. Ft. CountOwned DCs & WHs 25 Yes 35 35 35 37 39 41
Total TIP REIT DCs & WHs Square Footage 35 35 35 37 39 41 3.7%Total TIP REIT DCs & WHs Square Footage Growth 0.0% 0.0% 5.7% 4.3% 4.8%
Rent / Square Foot - Store Land $7.00 $7.00 $7.18 $7.35 $7.54 $7.73CPI Growth 2.5% 2.5% 2.5% 2.5% 2.5%
Average Growth 2.5% 2.5% 2.5% 2.5% 2.5%
TIP REIT Revenues from Ground-leased Land 1,327 1,389 1,482 1,625 1,789 1,980 9.3%
Rent / Square Foot - DCs & WHs Land $1.25 $1.25 $1.28 $1.31 $1.35 $1.38CPI Growth 2.5% 2.5% 2.5% 2.5% 2.5%
Average Growth 2.5% 2.5% 2.5% 2.5% 2.5%
TIP REIT Revenues from Ground-leased DCs & WHs 44 44 45 49 52 56 6.3%
Total TIP REIT Gross Revenues 1,371 1,433 1,527 1,673 1,842 2,037 9.2%
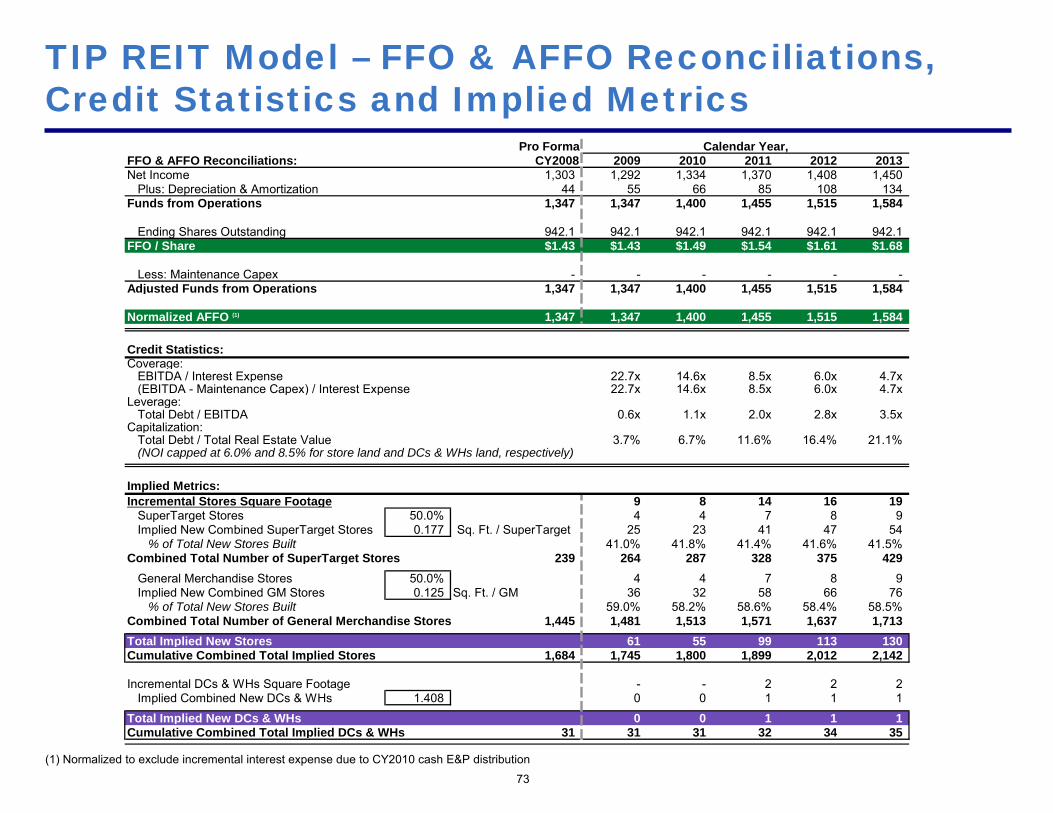
73
TIP REIT Model – FFO & AFFO Reconciliations, Credit Statistics and Implied Metrics
(1) Normalized to exclude incremental interest expense due to CY2010 cash E&P distribution
Pro Forma Calendar Year,FFO & AFFO Reconciliations: CY2008 2009 2010 2011 2012 2013Net Income 1,303 1,292 1,334 1,370 1,408 1,450
Plus: Depreciation & Amortization 44 55 66 85 108 134 Funds from Operations 1,347 1,347 1,400 1,455 1,515 1,584
Ending Shares Outstanding 942.1 942.1 942.1 942.1 942.1 942.1 FFO / Share $1.43 $1.43 $1.49 $1.54 $1.61 $1.68
Less: Maintenance Capex - - - - - - Adjusted Funds from Operations 1,347 1,347 1,400 1,455 1,515 1,584
Normalized AFFO (1) 1,347 1,347 1,400 1,455 1,515 1,584
Credit Statistics:Coverage:
EBITDA / Interest Expense 22.7x 14.6x 8.5x 6.0x 4.7x(EBITDA - Maintenance Capex) / Interest Expense 22.7x 14.6x 8.5x 6.0x 4.7x
Leverage:Total Debt / EBITDA 0.6x 1.1x 2.0x 2.8x 3.5x
Capitalization:Total Debt / Total Real Estate Value 3.7% 6.7% 11.6% 16.4% 21.1%(NOI capped at 6.0% and 8.5% for store land and DCs & WHs land, respectively)
Implied Metrics:Incremental Stores Square Footage 9 8 14 16 19
SuperTarget Stores 50.0% 4 4 7 8 9 Implied New Combined SuperTarget Stores 0.177 Sq. Ft. / SuperTarget 25 23 41 47 54
% of Total New Stores Built 41.0% 41.8% 41.4% 41.6% 41.5%Combined Total Number of SuperTarget Stores 239 264 287 328 375 429
General Merchandise Stores 50.0% 4 4 7 8 9 Implied New Combined GM Stores 0.125 Sq. Ft. / GM 36 32 58 66 76
% of Total New Stores Built 59.0% 58.2% 58.6% 58.4% 58.5%Combined Total Number of General Merchandise Stores 1,445 1,481 1,513 1,571 1,637 1,713 Total Implied New Stores 61 55 99 113 130 Cumulative Combined Total Implied Stores 1,684 1,745 1,800 1,899 2,012 2,142
Incremental DCs & WHs Square Footage - - 2 2 2 Implied Combined New DCs & WHs 1.408 0 0 1 1 1
Total Implied New DCs & WHs 0 0 1 1 1Cumulative Combined Total Implied DCs & WHs 31 31 31 32 34 35
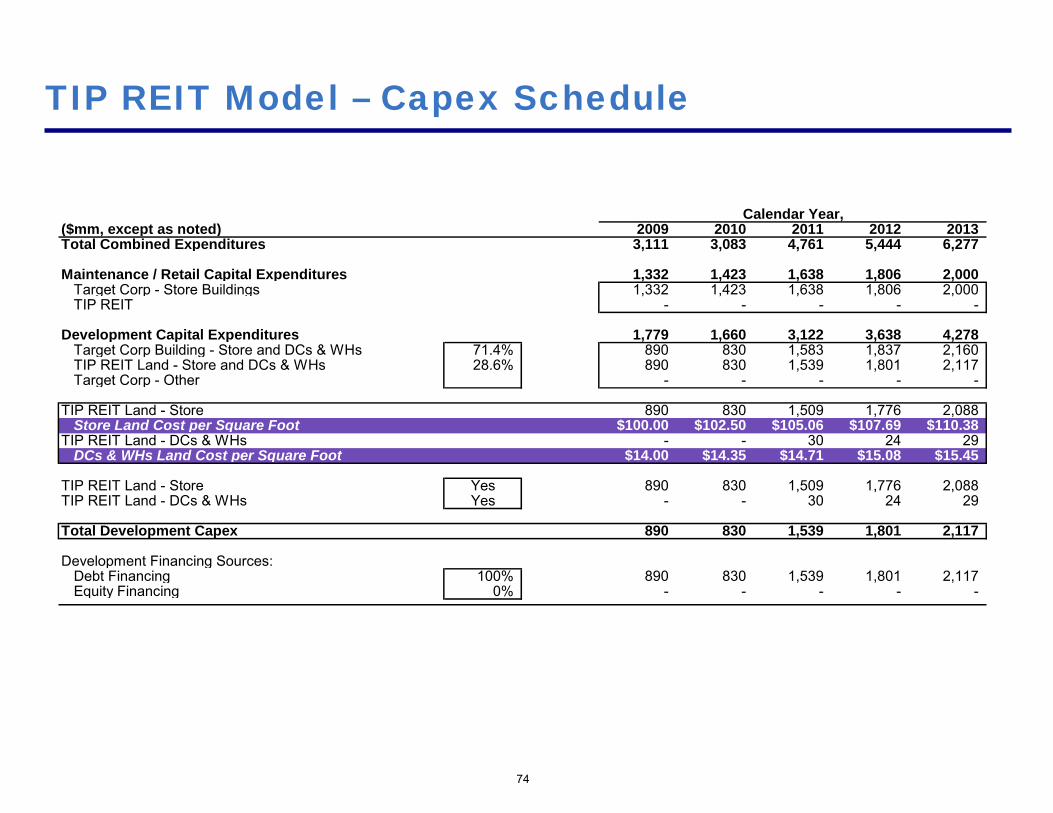
74
TIP REIT Model – Capex Schedule
Calendar Year,($mm, except as noted) 2009 2010 2011 2012 2013Total Combined Expenditures 3,111 3,083 4,761 5,444 6,277
Maintenance / Retail Capital Expenditures 1,332 1,423 1,638 1,806 2,000 Target Corp - Store Buildings 1,332 1,423 1,638 1,806 2,000 TIP REIT - - - - -
Development Capital Expenditures 1,779 1,660 3,122 3,638 4,278 Target Corp Building - Store and DCs & WHs 71.4% 890 830 1,583 1,837 2,160 TIP REIT Land - Store and DCs & WHs 28.6% 890 830 1,539 1,801 2,117 Target Corp - Other - - - - -
TIP REIT Land - Store 890 830 1,509 1,776 2,088 Store Land Cost per Square Foot $100.00 $102.50 $105.06 $107.69 $110.38
TIP REIT Land - DCs & WHs - - 30 24 29 DCs & WHs Land Cost per Square Foot $14.00 $14.00 $14.35 $14.71 $15.08 $15.45
TIP REIT Land - Store Yes 890 830 1,509 1,776 2,088 TIP REIT Land - DCs & WHs Yes - - 30 24 29
Total Development Capex 890 830 1,539 1,801 2,117
Development Financing Sources:Debt Financing 100% 890 830 1,539 1,801 2,117 Equity Financing 0% - - - - -

Model – Target Corp

76
Target Corp Model – Income StatementStatus
Quo REIT Pro Forma Calendar Year, CAGR($mm) CY2009 Adj. CY2009 2010 2011 2012 2013 '09 - '13Retail Sales 66,600 66,600 71,171 78,082 86,068 95,316 9.4%
Base Sales Growth (%) 6.9% 9.7% 10.2% 10.7%Credit Revenue 150 150 160 176 194 215 9.4%
Credit Sales Growth na 6.9% 9.7% 10.2% 10.7%Total Revenue 66,750 66,750 71,331 78,258 86,262 95,530 9.4%
Total Revenue Growth 6.9% 9.7% 10.2% 10.7%
COGS 46,544 46,544 49,632 54,373 60,075 66,521% of Retail Sales 69.9% 69.9% 69.7% 69.6% 69.8% 69.8%
SG&A (excluding D&A and Rent Expense) 13,596 (35) 13,561 14,387 15,708 17,314 19,175% of Retail Sales 20.4% 20.4% 20.2% 20.1% 20.1% 20.1%
Credit Expenses - - - - - - % of Credit Revenue 0.0% 0.0% 0.0% 0.0% 0.0% 0.0%
Retail EBITDAR 6,460 6,495 7,153 8,001 8,678 9,620 10.3%Retail EBITDAR Margin (%) 9.7% 9.8% 10.0% 10.2% 10.1% 10.1%
Credit EBITDAR 150 150 160 176 194 215 9.4%Credit EBITDAR Margin (%) 100.0% na na na na na
EBITDAR (Pre-spin) 6,610 6,645 7,313 8,177 8,872 9,835 10.3%EBITDAR Margin (%) 9.9% 10.0% 10.3% 10.4% 10.3% 10.3%
Current Embedded Facility Management Costs (125) (125) (134) (147) (162) (179)External Facility Mgmt. Payments to TIP REIT 144 144 154 169 186 206
Current Rent Expense 173 173 178 182 187 191Additional Rent Expense 1,433 1,527 1,673 1,842 2,037Pro Forma EBITDA (Post-spin) 6,436 5,020 5,588 6,300 6,819 7,580 10.9%
EBITDA Margin (%) 9.6% 7.5% 7.8% 8.0% 7.9% 7.9%
Depreciation & Amortization 1,940 (55) 1,885 2,007 2,189 2,400 2,642% of Retail Sales 2.8% 2.8% 2.8% 2.8% 2.8%
Operating Income 4,496 3,135 3,581 4,110 4,420 4,938 12.0%
Net Interest (Income) / Expense 333 (31) 302 330 346 463 555Income Tax Provision 1,469 1,077 1,235 1,430 1,504 1,665
Tax Rate (%) 35% 38% 38% 38% 38% 38%Minority Interest 257 (257) 0 0 0 0 0Net Income 2,438 1,757 2,015 2,334 2,453 2,717 11.5%
Net Income Margin (%) 3.7% 2.6% 2.8% 3.0% 2.8% 2.8%
Current Diluted Shares Outstanding 754.7 754.7 726.2 683.8 657.0Shares Repurchase 0.0 (28.5) (42.4) (26.8) (29.3)Share Repurchase from Options 0.0 0.0 0.0 0.0 0.0
Total Shares Outstanding 754.7 726.2 683.8 657.0 627.7Weighted Average Shares Outstanding 754.7 740.4 705.0 670.4 642.3
Earnings per Share ($) $2.33 $2.72 $3.31 $3.66 $4.23 16.1%

77
Target Corp Model – Balance Sheet
StatusQuo REIT Pro Forma Calendar Year,
($mm) CY2009 Adj. CY2009 2010 2011 2012 2013Cash & Equivalents 2,100 (1,600) 500 500 500 500 500Trade Receivables - - - - - - Other Current Assets 9,305 9,305 9,944 10,909 12,025 13,317
Property, Plant & Equipment, gross 38,427 (12,723) 25,704 27,958 31,179 34,823 38,983Accumulated Depreciation (11,205) 941 (10,264) (12,271) (14,461) (16,860) (19,503)Property, Plant & Equipment, net 27,223 (11,782) 15,440 15,686 16,719 17,962 19,480
Other Non-Current Assets 1,277 1,277 1,277 1,277 1,277 1,277Total Assets 39,905 26,523 27,407 29,405 31,765 34,574
Debt 5,925 (890) 5,036 4,595 5,544 5,892 6,697 Other Current Liabilities 10,842 10,842 11,586 12,711 14,011 15,516Other Non-Current Liabilities 2,521 2,521 2,521 2,521 2,521 2,521Total Liabilities 19,288 18,398 18,702 20,776 22,424 24,735
Minority Interest 4,563 (4,563) 0 0 0 0 0Total Equity 16,054 (7,930) 8,124 8,705 8,629 9,340 9,840
Total Equity & Liabilities 39,905 26,523 27,407 29,405 31,765 34,574

78
Target Corp Model – Cash Flow Statement
Calendar Year,($mm) 2010 2011 2012 2013EBITDA 5,020 5,588 6,300 6,819 7,580less: Interest Expense (302) (330) (346) (463) (555)less: Taxes (1,077) (1,235) (1,430) (1,504) (1,665)Share-based Compensation 73 73 73 73 73less: Increase in Net Working Capital 105 159 184 213less: Increase Funding of CC Growth 0 0 0 0 0Cash Flow from Operating Activities 3,714 4,201 4,756 5,110 5,646
Capital Expenditures (2,253) (3,222) (3,643) (4,160)Cash Flow from Investing Activities (2,253) (3,222) (3,643) (4,160)
Issuance of Debt 1,507 2,483 1,815 2,291Repayment of Debt (1,948) (1,534) (1,467) (1,486)Issuance of Equity / (Buy Back) (1,507) (2,483) (1,815) (2,291)Issuance of Dividends to Common 0 0 0 0 0Cash Flow from Financing Activities (1,948) (1,534) (1,467) (1,486)
Beginning Cash Balance 500 500 500 500Change in Cash 0 0 0 0Ending Cash Balance 500 500 500 500
Average Cash Balance 500 500 500 500Interest Income 3.0% 15 15 15 15

79
Target Corp Model – Build-ups and Credit MetricsPro Forma Calendar Year,
Sales Buildup CY2009 2010 2011 2012 2013Square Feet (mm) 231 239 254 270 289$ / Sq. Ft. 288 297 308 318 330Retail Sales 66,600 71,171 78,082 86,068 95,316
Implied Retail Sales Growth (%) 6.9% 9.7% 10.2% 10.7%Sq. Footage Growth (%) 3.5% 6.0% 6.5% 7.0%SSS Growth (%) 3.3% 3.5% 3.5% 3.5%
CapEx Buildup 2009 2010 2011 2012 2013Total System CapEx 3,111 3,083 4,761 5,444 6,277
CapEx as % of Retail Sales 4.7% 4.3% 6.1% 6.3% 6.6%
Maintenance/Retail CapEx 1,332 1,423 1,638 1,806 2,000Additional Cap Ex 0.0 0.0TOTAL Maintenance/Retail CapEx % of total 35.0% 1,332 1,423 1,638 1,806 2,000 – Target Corp 1,423 1,638 1,806 2,000 – TIP REIT (Existing DC & WH) 0 0 0 0
Development CapEx % of total 65.0% 1,779 1,660 3,122 3,638 4,278
Buildings (Tgt Corp) % of Development 50% 890 830 1,583 1,837 2,160 Land % of Development 50% 890 830 1,539 1,801 2,117 – Target Corp 0 0 0 0 0 – TIP REIT 890 830 1,539 1,801 2,117 Other (Target Corp) % of Development 0% 0 0 0 0 0
Facilities Management Business ($mm)Total Current Costs 125 134 147 162 179Growth % 6.9% 9.7% 10.2% 10.7%
Markup to TIP REIT 15% 15% 15% 15% 15%Facilities Management Revenue to TIP REIT 144 154 169 186 206
Credit MetricsLease Adjusted Debt 8 x 1,387 12,851 13,637 14,844 16,228 17,823Actual Debt 5,925 5,036 4,595 5,544 5,892 6,697Total Lease Adjusted Debt 7,312 17,887 18,232 20,388 22,120 24,520
Total Lease Adjusted Debt/EBITDAR 1.1 x 2.7 x 2.5 x 2.5 x 2.5 x 2.5 xTotal Debt / EBITDA 0.9 x 1.0 x 0.8 x 0.9 x 0.9 x 0.9 x
EBITDAR / (Interest + Rent) 13.1 x 3.5 x 3.6 x 3.7 x 3.6 x 3.5 xEBITDA / Interest 19.3 x 16.6 x 16.9 x 18.2 x 14.7 x 13.7 x

The Nominees for Shareholder Choice
May 11, 2009
Pershing Square Capital Management, L.P.

In connection with the 2009 Annual Meeting of Shareholders of Target Corporation (“Target”), Pershing Square Capital Management, L.P. and certain of its affiliates (collectively, “Pershing Square”) filed a definitive proxy statement on Schedule 14A with the Securities and Exchange Commission (the “SEC”) on May 1, 2009 containing information about the solicitation of proxies for use at the 2009 Annual Meeting of Shareholders of Target. The definitive proxy statement and the GOLD proxy card were first disseminated to shareholders of Target on or about May 2, 2009.
SHAREHOLDERS OF TARGET ARE URGED TO READ THE PROXY STATEMENT CAREFULLY BECAUSE IT CONTAINS IMPORTANT INFORMATION. The definitive proxy statement and other relevant documents relating to the solicitation of proxies by Pershing Square are available at no charge on the SEC’s website at http://www.sec.gov. Shareholders can also obtain free copies of the definitive proxy statement and other relevant documents at www.TGTtownhall.com or by calling Pershing Square’s proxy solicitor, D. F. King & Co., Inc., at 1 (800) 290-6427.
Pershing Square and certain of its members and employees and Michael L. Ashner, James L. Donald, Ronald J. Gilson and Richard W. Vague (collectively, the “Participants”) are deemed to be participants in the solicitation of proxies with respect to Pershing Square’s nominees. Detailed information regarding the names, affiliations and interests of the Participants, including by security ownership or otherwise, is available in Pershing Square’s definitive proxy statement.
This presentation contains forward-looking statements. All statements contained in this presentation that are not clearly historical in nature or that necessarily depend on future events are forward-looking, and the words “anticipate,” “believe,” “expect,”“estimate,” “plan,” and similar expressions are generally intended to identify forward-looking statements. These statements are based on current expectations of Pershing Square and currently available information. They are not guarantees of future performance, involve certain risks and uncertainties that are difficult to predict and are based upon assumptions as to future events that may not prove to be accurate. Pershing Square does not assume any obligation to update any forward-looking statements contained in this presentation.
This presentation is for general informational purposes only. It does not have regard to the specific investment objective, financial situation, suitability, or the particular need of any specific person who may receive this presentation, and should not be taken as advice on the merits of any investment decision. The views expressed herein represent the opinions of Pershing Square, which opinions may change at any time and are based on publicly available information with respect to Target. Certain financial information and data used herein have been derived or obtained from filings made with the Securities and Exchange Commission (“SEC”) by Target or other companies that Pershing Square considers comparable or relevant.
Disclaimer
1
Pershing Square has not sought or obtained consent from any third party to the use of previously published information as proxy soliciting material. Any such statements or information should not be viewed as indicating the support of such third party for the views expressed herein. No warranty is made that data or information, whether derived or obtained from filings made with the SEC or from any third party, are accurate. Neither Pershing Square nor any of its affiliates shall be responsible or have any liability for any misinformation contained in any SEC filing or third party report. Pershing Square disclaims any obligation to update theinformation contained herein.
This presentation does not recommend the purchase or sale of any security. Under no circumstances is this presentation to be used or considered an offer to sell or a solicitation of an offer to buy any security. There is no assurance or guarantee with respect to the prices at which any securities of Target will trade. Pershing Square and its affiliates currently hold a substantial amount of common stock and options of Target and may in the future take such actions with respect to its investments in Target as it deemsappropriate including, without limitation, purchasing additional shares of Target common stock or related financial instruments or selling some or all of its beneficial and economic holdings, engaging in any hedging or similar transaction with respect to suchholdings and/or otherwise changing its intention with respect to its investments in Target. Pershing Square may also change its beneficial or economic holdings depending on additions or redemptions of capital. Pershing Square is in the business of trading —buying and selling — securities and other financial instruments. Consequently, Pershing Square’s beneficial ownership of Target common stock and options will vary over time depending on various factors, with or without regard to Pershing Square’s views of Target’s business, prospects or valuation (including the market price of Target common stock), including without limitation, other investment opportunities available to Pershing Square, concentration of positions in the portfolios managed by Pershing Square, conditions in the securities market and general economic and industry conditions.
Disclaimer (cont’d)
2

3
Agenda
Situation Overview
Why Board Change is Warranted
The Nominees for Shareholder Choice
Food Retailing: Jim DonaldCredit Cards: Richard VagueReal Estate: Michael AshnerShareholder Value: Bill AckmanCorporate Governance: Ron Gilson
Target’s Board: Avoiding the Real Issues
Corporate Elections and Shareholder Choice
Situation Overview
Pershing Square
5
Pershing Square is a long-term Target shareholder
Pershing Square initiated its investment in Target in April 2007
We are the third largest beneficial owner of Target
We have ownership of 7.8% of Target
~$1 billion of common stock (3.3% of the company)
~$280 million in stock options (4.5% of the company)(1)
Target is the largest investment in Pershing Square’s portfolio
(1) Unless and until these options are exercised, the underlying shares do not carry voting rights.
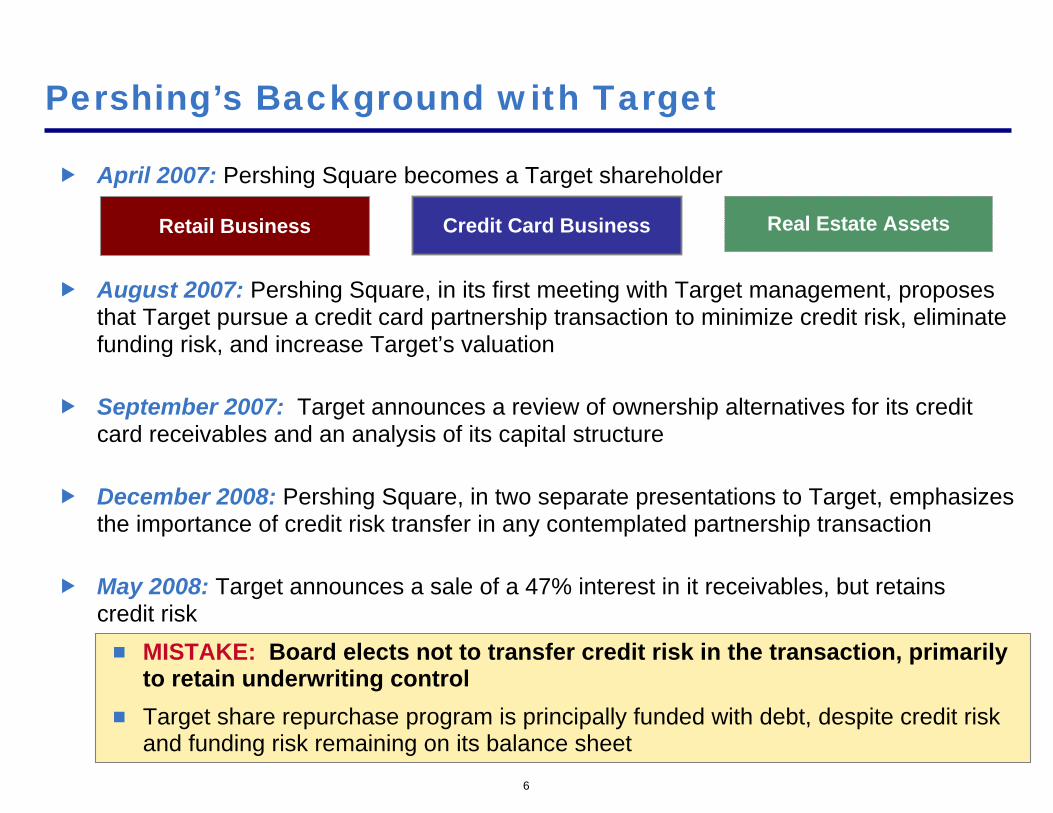
April 2007: Pershing Square becomes a Target shareholder
August 2007: Pershing Square, in its first meeting with Target management, proposes that Target pursue a credit card partnership transaction to minimize credit risk, eliminate funding risk, and increase Target’s valuation
September 2007: Target announces a review of ownership alternatives for its credit card receivables and an analysis of its capital structure
December 2008: Pershing Square, in two separate presentations to Target, emphasizes the importance of credit risk transfer in any contemplated partnership transaction
May 2008: Target announces a sale of a 47% interest in it receivables, but retains credit risk
MISTAKE: Board elects not to transfer credit risk in the transaction, primarily to retain underwriting controlTarget share repurchase program is principally funded with debt, despite credit risk and funding risk remaining on its balance sheet
Pershing’s Background with Target
Credit Card Business Real Estate AssetsRetail Business
6
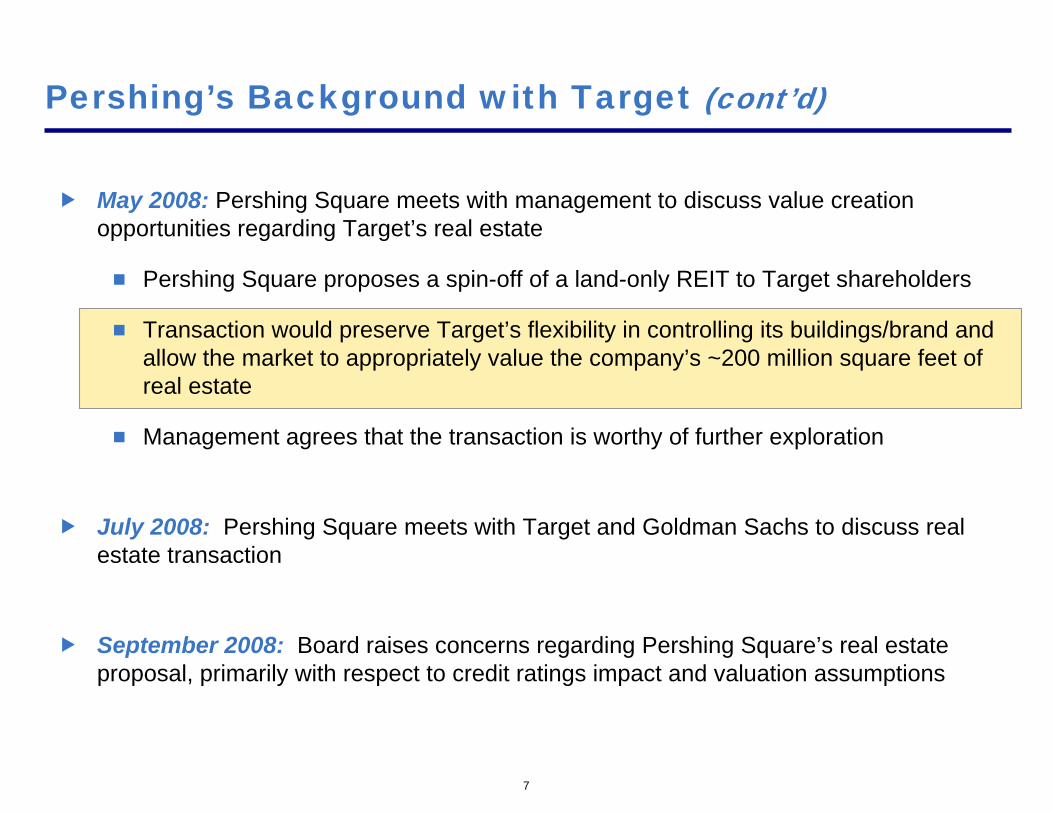
May 2008: Pershing Square meets with management to discuss value creation opportunities regarding Target’s real estate
Pershing Square proposes a spin-off of a land-only REIT to Target shareholders
Transaction would preserve Target’s flexibility in controlling its buildings/brand and allow the market to appropriately value the company’s ~200 million square feet of real estate
Management agrees that the transaction is worthy of further exploration
July 2008: Pershing Square meets with Target and Goldman Sachs to discuss real estate transaction
September 2008: Board raises concerns regarding Pershing Square’s real estate proposal, primarily with respect to credit ratings impact and valuation assumptions
Pershing’s Background with Target (cont’d)
7
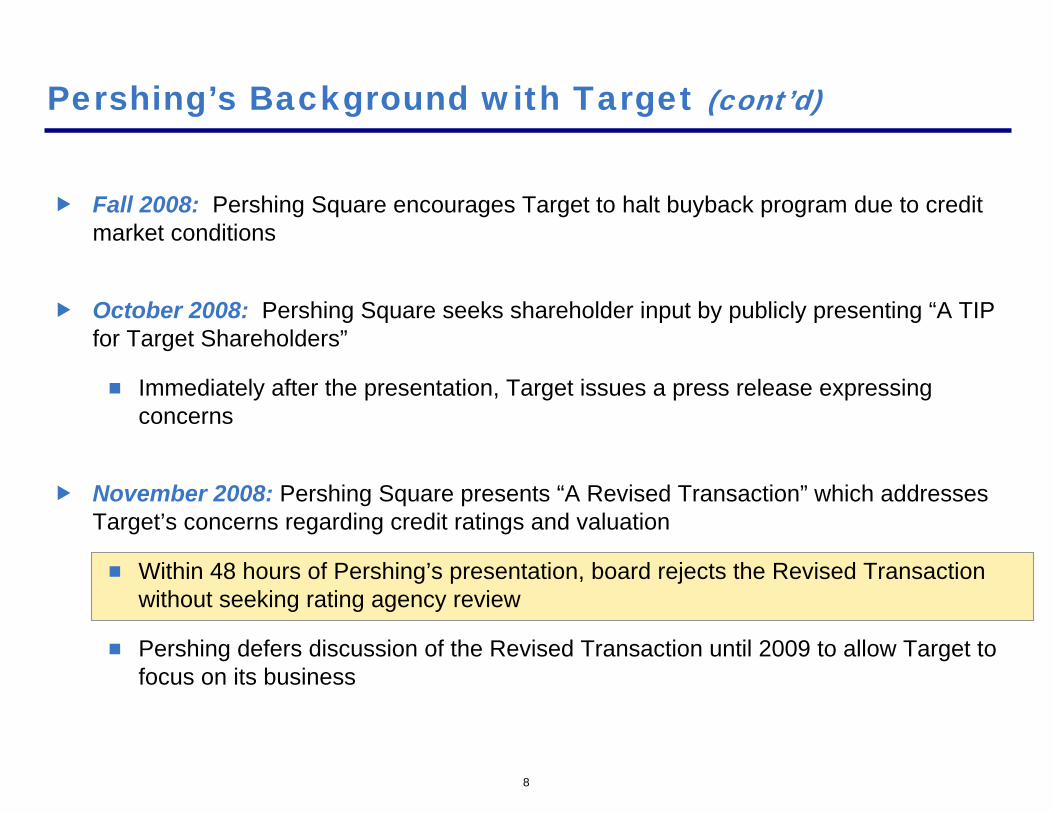
Pershing’s Background with Target (cont’d)
8
Fall 2008: Pershing Square encourages Target to halt buyback program due to credit market conditions
October 2008: Pershing Square seeks shareholder input by publicly presenting “A TIP for Target Shareholders”
Immediately after the presentation, Target issues a press release expressing concerns
November 2008: Pershing Square presents “A Revised Transaction” which addresses Target’s concerns regarding credit ratings and valuation
Within 48 hours of Pershing’s presentation, board rejects the Revised Transaction without seeking rating agency review
Pershing defers discussion of the Revised Transaction until 2009 to allow Target to focus on its business

February 2009: Pershing Square meets with Target and Goldman Sachs to discuss the assumptions behind the board’s decision
Pershing Square learns that the board restricted Goldman Sachs to the narrow task of evaluating Pershing Square’s proposal, rather than fully investigating all potential value creating alternatives for real estate
Pershing Square concludes that the Revised Transaction was not adequately explored by the board or its advisors
February 2009: Pershing Square requests one board seat and one additional independent director
March 2009: Pershing Square presents, in total, four candidates – Bill Ackman and three independent nominees
Board rejects all four candidates, three without explanation
Board did not even meet with two of them (Richard Vague, Michael Ashner)
Pershing’s Background with Target (cont’d)
9

10
Situation Overview
On March 17, 2009, Pershing Square announces the nomination of five independent directors for the open seats on Target’s board
We did so principally because we believe that the incumbent Target board has:
Suboptimal composition
Made significant strategic mistakes that have destroyed shareholder value
Performed key corporate governance duties poorly
Our goal in this election:
Improve Target’s board and help make Target a stronger, more profitable, and more valuable company

Why Board Change is Warranted

Why Board Change is Warranted in Our View
Board’s Suboptimal Composition
⌧ Lacks senior operating experience in key business lines and assets (1)
⌧ Lacks significant shareholder representation
⌧ Average tenure of independents nearly a decade
⌧ 12 incumbent directors serve on 18 other boards (including Citi, Wells Fargo and Goldman)
Board’s Mistakes in Assessing Strategic
Transactions
Board’s Faulty Corporate
Governance
⌧ Board did not exit the credit card business before meeting Pershing Square
⌧ The board-approved credit card transaction structure was a mistake that we believe cost shareholders dearly
⌧ Board did not authorize a full review of all real estate ownership alternatives for maximizing shareholder value
(1) Pershing Square defines senior operating experience as experience in a specific line of business with the director having served as the CEO of a company in that business for a meaningful period of time during his or her career. Pershing Square’s view is not only based on the length of time served by a specific director in the relevant business line, but also on the extent, nature and specialization of each director’s service and the principal responsibilities during that service.
12
⌧ Board lacks a fair and open nominating process
⌧ Compensation plan fails to foster a culture of equity ownership
⌧ Board rejected the request for Universal Proxy thereby limiting shareholder choice
⌧ Interlocking directorships and affiliate transactions

Board Lacks Sufficient Relevant Experience
Credit Card Business
Real Estate AssetsOver 200 million sq ft of
retail real estate
Retail Business
Target’s Current Board
NO Retail senior operating experience
NO Real Estate senior operating experience
NO Credit Card senior operating experience
13
Our view of
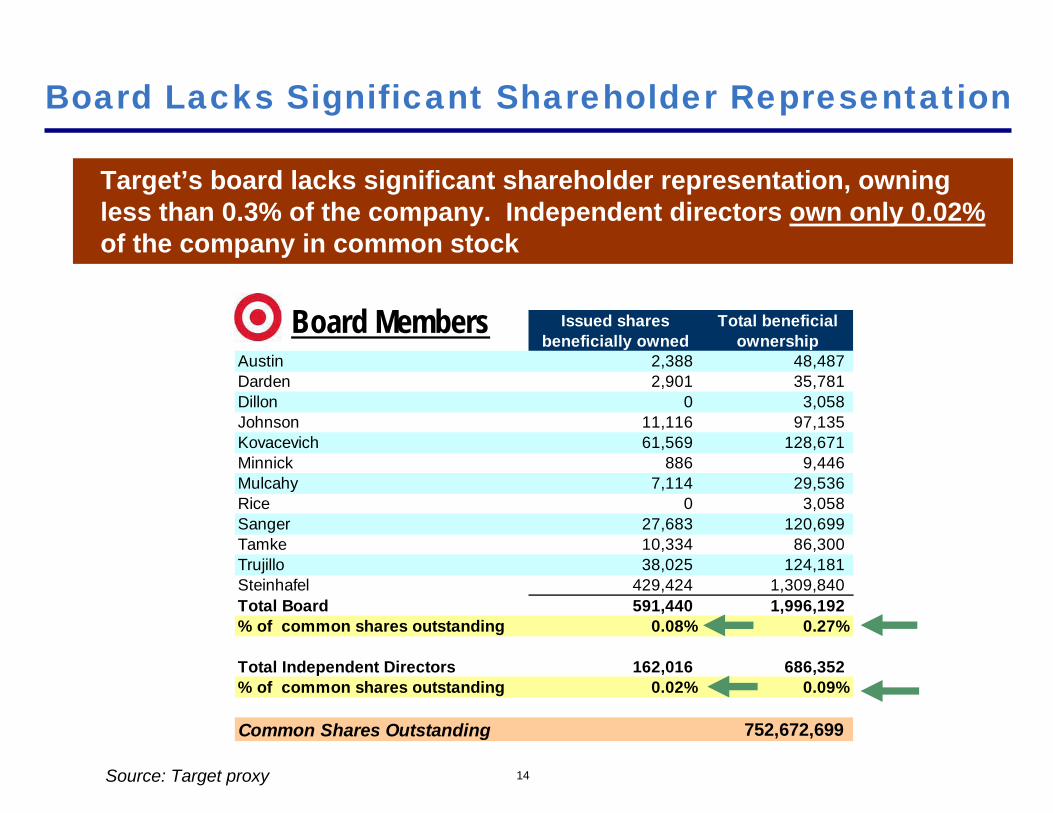
Issued shares Total beneficialbeneficially owned ownership
Austin 2,388 48,487Darden 2,901 35,781Dillon 0 3,058Johnson 11,116 97,135Kovacevich 61,569 128,671Minnick 886 9,446Mulcahy 7,114 29,536Rice 0 3,058Sanger 27,683 120,699Tamke 10,334 86,300Trujillo 38,025 124,181Steinhafel 429,424 1,309,840Total Board 591,440 1,996,192% of common shares outstanding 0.08% 0.27%
Total Independent Directors 162,016 686,352% of common shares outstanding 0.02% 0.09%
Common Shares Outstanding 752,672,699
Board Lacks Significant Shareholder Representation
Target’s board lacks significant shareholder representation, owning less than 0.3% of the company. Independent directors own only 0.02%of the company in common stock
Board Members
14Source: Target proxy

Board Member Current Occupation (Title)
Years on Board
Mary Dillon Executive Vice President and Global Chief Marketing Officer of McDonald’s Corporation
2
Richard Kovacevich Chairman of the Board of Wells Fargo & Company
13 Solomon Trujillo CEO of Telstra Corporation Limited, an Australian
telecommunications company
15
George Tamke Partner with Clayton, Dubilier & Rice, Inc., a private investment firm
10 Calvin Darden Chairman of the Atlanta Beltline, Inc., an urban revitalization project
for the City of Atlanta
6
Anne Mulcahy CEO and Chairman of the Board of Xerox Corp., a document management company
12
Stephen Sanger Retired. Previously, CEO and Chairman of the Board of General Mills, Inc
13
Roxanne Austin President of Austin Investment Advisors, a private investment and consulting firm
7
James Johnson Vice Chairman of Perseus, LLC, a merchant banking private equity firm
13
Mary Minnick Partner of Lion Capital, a private investment firm
4 Derica Rice Senior Vice President and CFO of Eli Lilly and Company
2
Average Tenure of Nearly a DecadeIn
cum
bent
Nom
inee
s
15
The average tenure of the independent directors is approximately 9 years. The average tenure of the incumbent nominees is approximately 10 years

$322
$930
3.7%
12.8%
$0
$100
$200
$300
$400
$500
$600
$700
$800
$900
$1,000
2007A 2008A0.0%
2.0%
4.0%
6.0%
8.0%
10.0%
12.0%
14.0%
Board’s Strategic Mistake: Credit Card
16
Target’s board decided not to transfer credit risk in a credit card transaction, despite Pershing Square’s repeated requests. In 2008, Target’s credit card operating profits fell 65% predominantly due to increased credit risk and bad debt expense
Cre
dit C
ard
EBIT
Credit C
ard EBIT as a %
of average receivables
65% drop
Source: Company filings
$ in millions

Board Lacks Initiative: Real Estate
Target owns over 200 million square feet of high-quality retail real estate
We believe that Target’s real estate has a replacement cost of nearly $40 billion (based on management’s estimates of the current average cost to build its stores and distribution facilities)
Despite this immense value, Target’s board has been unwilling to examine alternatives to unlock real estate value
Notably, the board assigned its advisors the narrow task of onlyevaluating Pershing Square’s TIP REIT spin-off structure
Board would not authorize Goldman Sachs to explore alternative real estate value creation opportunities
17

Is Target’s board nomination process fair, open, and thorough?
Governance: Faulty Nomination Process
18
In our view, the board nomination process is insular, conflicted, and unreceptive to shareholder input
⌧ Nominating Committee Chair Sanger received over $1.25 million in fees and equity compensation since 2003 from incumbent nominee Kovacevich’scompany, Wells Fargo
⌧ Nominating Committee Chair Sanger also serves on Wells Fargo’s compensation committee
⌧ Independent nominees Ashner and Vague were never interviewed
⌧ Nomination Committee Chair Sanger would not give an explanation for the rejection of the nominees
Conflict

Request for a Universal Proxy card: Rejected
Board is Attempting to Limit Choice
19
Pershing Square will pay the expense
Target’s Reasons
Too expensive
Liability concerns
Feasibility confirmed by Broadridge, consent of parties is all that is neededCan be implemented at any time
Reality
Shareholders have expressed disappointment with Target’s position.Target and its nominees should consent to have all nominees named on one proxy card. Even now, this can still be achieved. Shareholders should press this issue with Target
Request to name Target Nominees on Gold card: Ignored
Technology barrier
Too Late
Causes delay and confusion Mitigates confusion and allows shareholders to choose the best nominees from both slates
No liability to Target or its nominees
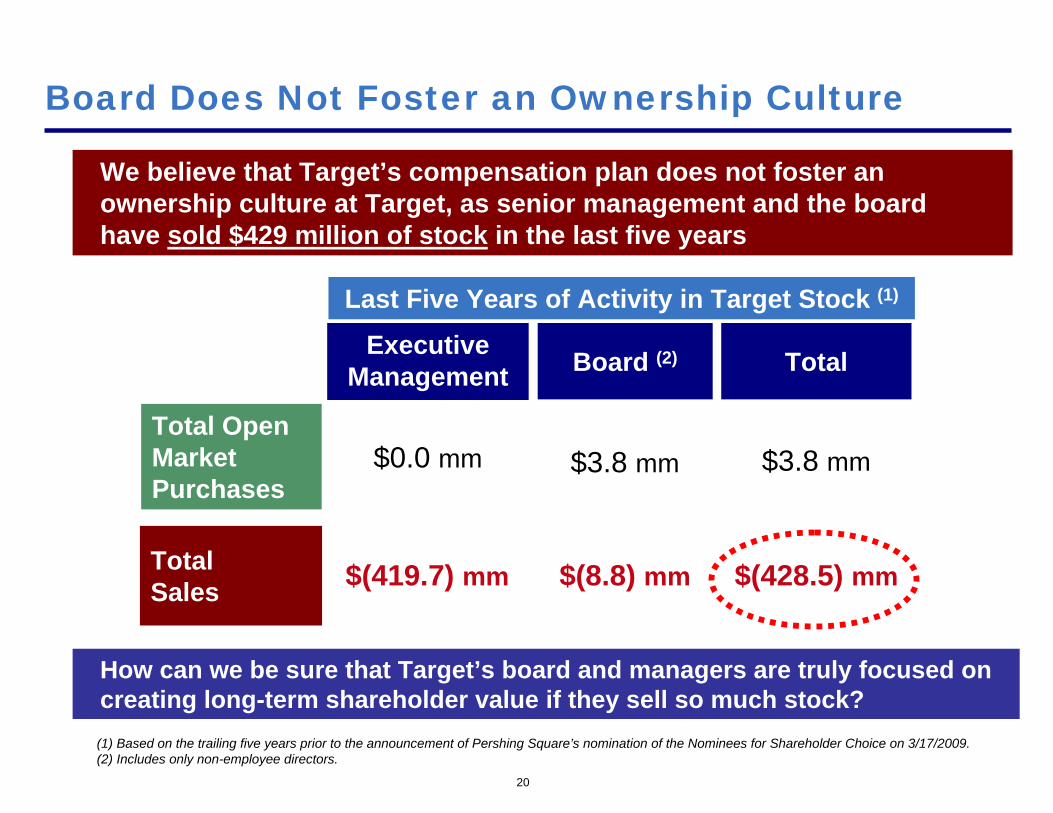
Board Does Not Foster an Ownership Culture
Last Five Years of Activity in Target Stock (1)
Executive Management Board (2)
Total OpenMarketPurchases
Total Sales
Total
$3.8 mm
$(428.5) mm
$3.8 mm$0.0 mm
(1) Based on the trailing five years prior to the announcement of Pershing Square’s nomination of the Nominees for Shareholder Choice on 3/17/2009.(2) Includes only non-employee directors.
$(419.7) mm $(8.8) mm
We believe that Target’s compensation plan does not foster an ownership culture at Target, as senior management and the board have sold $429 million of stock in the last five years
How can we be sure that Target’s board and managers are truly focused on creating long-term shareholder value if they sell so much stock?
20
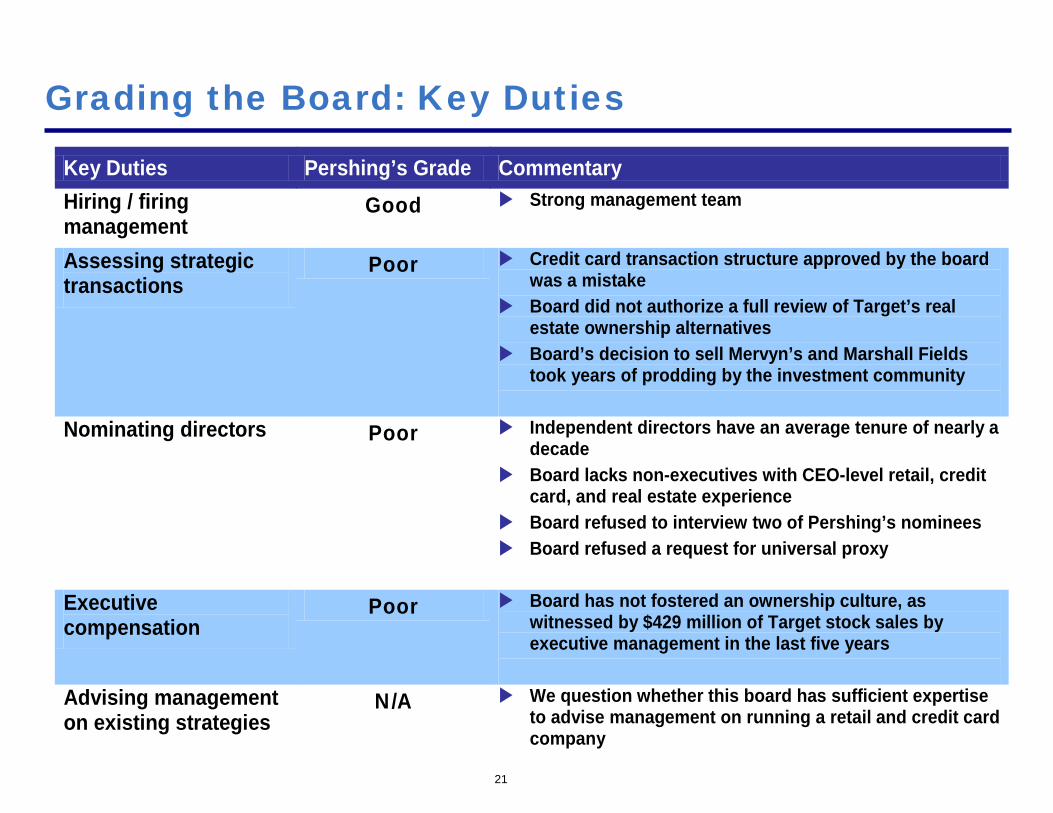
Key Duties Pershing’s Grade Commentary Hiring / firing management
Good Strong management team
Assessing strategic transactions
Poor Credit card transaction structure approved by the board was a mistake
Board did not authorize a full review of Target’s real estate ownership alternatives
Board’s decision to sell Mervyn’s and Marshall Fields took years of prodding by the investment community
Nominating directors
Poor Independent directors have an average tenure of nearly a decade
Board lacks non-executives with CEO-level retail, credit card, and real estate experience
Board refused to interview two of Pershing’s nominees Board refused a request for universal proxy
Executive compensation
Poor Board has not fostered an ownership culture, as witnessed by $429 million of Target stock sales by executive management in the last five years
Advising management on existing strategies
N/A We question whether this board has sufficient expertise to advise management on running a retail and credit card company
Grading the Board: Key Duties
21

22
We believe that Target’s suboptimal board has contributed to the company’s material underperformance during this recession

38.39
58.39
78.39
98.39
118.39
138.39
Underperformance Relative to Wal-Mart
Target
Down 51%
Wal-Mart
Up 11%
23
From the beginning of the fourth quarter of 2007 to the day prior to our announcement of our proposed slate, Target stock declined by 51%. Over the same period, the stock of Wal-Mart, Target’s principal competitor, appreciated 11%, a ~62 percentage point outperformance
Stock price returns
Measured on a 10-year trailing basis ending on the day prior to the announcement of the Nominees for Shareholder Choice, Wal-Mart’s stock price outperformed Target’s stock price by approximately 18%.

Target
Wal-MartUS
24Source: Company filings
Underperformance in Same Store Sales Growth
Year-over-Year Growth Rate of Quarterly Same Store Sales
We believe that Target’s substantial negative returns to its shareholders are reflective of its operating underperformance compared with Wal-Mart
(6.0%)
(4.0%)
(2.0%)
0.0%
2.0%
4.0%
6.0%
4Q07 1Q08 2Q08 3Q08 4Q08

-40.0%
-30.0%
-20.0%
-10.0%
0.0%
10.0%
20.0%
4Q07 1Q08 2Q08 3Q08 4Q08
Wal-Mart
Target
Year-over-Year Growth Rate of Reported Quarterly EPS from Continuing Operations
25Source: Company filings
Underperformance in Earnings Per Share Growth
Since Q4 2007, Target’s earnings per share growth has been significantly less than Wal-Mart’s earnings per share growth

5.6%
5.8%
6.0%
6.2%
6.4%
6.6%
6.8%
7.0%
7.2%
7.4%
7.6%
2005 2006 2007 2008
Target Retail Profitability Should Be Higher
Target6.3%
2008 Retail EBIT margin
Wal-MartUS7.3%
2008 Retail EBIT margin
Retail EBIT Margins
Even before the recession, Target’s retail margins have been deteriorating while Wal-Mart’s margins have remained higher and constant, despite Wal-Mart selling a greater mix of food and other lower margin goods
26Source: Company filings
2006 –2007: Why were Target’s retail margins weaker even during the
strong economy?
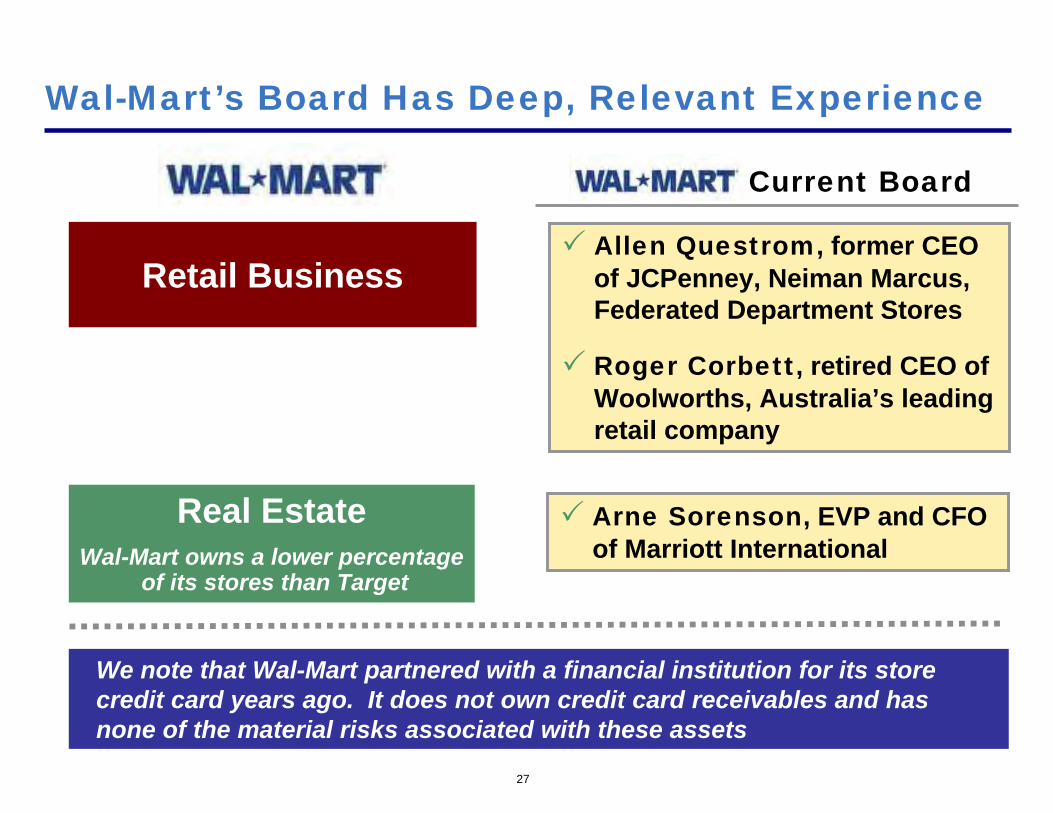
Wal-Mart’s Board Has Deep, Relevant Experience
Real EstateWal-Mart owns a lower percentage
of its stores than Target
Retail Business
Current Board
Allen Questrom, former CEO of JCPenney, Neiman Marcus, Federated Department Stores
Roger Corbett, retired CEO of Woolworths, Australia’s leading retail company
Arne Sorenson, EVP and CFO of Marriott International
We note that Wal-Mart partnered with a financial institution for its store credit card years ago. It does not own credit card receivables and has none of the material risks associated with these assets
27

Is Target’s Board Too Insular?
⌧ Chose board members without relevant senior operating experience in Target’s key business lines and assets
⌧ Rejected significant shareholder representation
⌧ Continually re-elects its own members, despite the lack of relevant senior operating experience
⌧ Ignored major shareholder regarding credit risk
⌧ Refused to authorize full review of alternatives for real estate ownership
⌧ Rejected major shareholder’s request to join the board without explanation
⌧ Refused to interview leading executives Richard Vague or MichaelAshner in its nominating process
28
Pershing Square’s observations of Target’s incumbent board:

77 76 68 17 00
500
1,000
1,500
2,000
2,500
3,000
Retailing is a Constantly Evolving Industry
We believe that a key role of an independent board is to bring an outside perspective to challenge strategies that might have worked in the past but will likely need to evolve over time – contrary to Target’s board’s apparent instinct to maintain the status quo
2,601
239 185 12855
0
500
1,000
1,500
2,000
2,500
3,000
Competitive Landscape — 1993 Competitive Landscape — Today
Number of supercenters Number of supercenters
29

30
In our view, the Nominees for Shareholder Choice will bring much needed “new life” to Target’s insular incumbent board
The Nominees for Shareholder Choice offer deep and relevant experience, major stock ownership, and fresh perspectives
Time for Board Change

Introducing the Nominees for Shareholder Choice
Gold Proxy Card

The Nominees for Shareholder Choice
32
(1) Consisting of 3.3% in shares of common stock and 4.5% in stock options.
Nominee for Shareholder Choice
Significant Relevant Experience
Commentary
•
Jim Donald Food Retailing
• 30 years of grocery experience • Former CEO of Starbucks and Pathmark • Oversaw the development and growth of Wal-Mart’s SuperCenter
business •
Richard Vague Credit Cards • Leading credit card operating executive • Former CEO and co-founder of First USA, the largest VISA credit
card issuer before it was sold to Bank One (now JPMorgan Chase) •
Michael Ashner Real Estate • Established real estate CEO and investor • Currently manages over 20 million sq ft of commercial real estate • Has acquired more than $12 billion of real estate in 45 states
•
Bill Ackman Shareholder Value
• Founder of Pershing Square • Owner of a 7.8% stake in Target (1) • Track record for creating value in consumer and retail businesses
•
Ron Gilson Corporate Governance
• World-renowned expert in the field of corporate governance • Professor of Law and Business at both Stanford Law School and
Columbia University School of Law

33
Nominees Are Entirely Independent
Jim Donald, Richard Vague, Michael Ashner, and Ron Gilson are independent nominees with no commercial relationships with Target or Pershing Square
Each is a highly regarded leader in his area of expertise
Each has his own unique perspective, background, and ideas
Pershing Square has no agreements, understandings, or arrangements with the Nominees for Shareholder Choice, other than they have agreed, if elected, to serve on the board (1)
The Nominees for Shareholder Choice have only one common goal: to help oversee the management of Target for the purpose of creating long-term value for all stakeholders
The Nominees for Shareholder Choice are entirely independent andhave no preconceived agenda other than to maximize shareholder value
If elected, the Nominees for Shareholder Choice will represent the interests of all shareholders using their own independent business judgment
(1) Other than customary indemnifications and expense reimbursement arrangements.

Comparison of Slates
The Incumbent Nominees
The Nominees for Shareholder Choice
34
⌧ Lack senior operating experience in key business lines and assets
⌧ Beneficially own less than 0.05% of the company
⌧ Are accountable for strategic mistakes
⌧ Three out of four incumbent nominees have served for at least a decade
CEO-level operating experience in:RetailCredit cardsReal Estate
Corporate governance expertise
Beneficially own 7.8% of the company (1)
Offer fresh perspectives while preserving board continuity
Entirely independent
(1) Consisting of 3.3% in shares (approximately $1bn in market value) and 4.5% in stock-settled call options (approximately $280mm in market value).
Food Retailing: Jim Donald

Food Retailing is A Critical Growth Initiative
Food retailing represents a critical strategic growth initiative for Target.
We and the company believe that an expanded food presence can help Target increase the frequency of visits from its customers and generate higher and more predictable sales
36

Food: Critical Strategic Growth Initiative
37
“We continue to focus on food as a priority . . . [W]e’venearly doubled our commitment to food over a five to seven-year timeframe.”
Gregg Steinhafel, CEOTarget 2Q’07 Earnings Call, 8/21/07
“We also continue to invest in our food offering in recognition of its importance in driving greater frequency, increasing guest loyalty, and making Target a preferred shopping destination.”
Gregg Steinhafel, CEOTarget 4Q’08 Earnings Call, 2/24/09

2,601
239 185 12855
0
500
1,000
1,500
2,000
2,500
3,000
77 76 68 17 00
500
1,000
1,500
2,000
2,500
3,000
Target: Slow to Innovate with Grocery/Superstores
Competitive Landscape — 1993 Competitive Landscape — Today
Wal-Mart was not always the dominant player in the supercenter / grocery space, but eventually emerged as a clear segment leader
Number of supercenters Number of supercenters
Did Target miss an important opportunity
in food?
38

Increasing Food Could Help Sales Significantly
Target
Wal-MartUS
(8.0%)
(6.0%)
(4.0%)
(2.0%)
0.0%
2.0%
4.0%
6.0%
4Q07 1Q08 2Q08 3Q08 4Q08
39Source: Company filings
In our view, Target’s more limited food offering partially explains why Target’s same-store-sales growth rate has been considerably weaker than Wal-Mart’s in every quarter since Q4 2007
Year-over-Year Growth Rate of Quarterly Same Store Sales

We Believe Target Needs A Retailer on its Board
5.6%
5.8%
6.0%
6.2%
6.4%
6.6%
6.8%
7.0%
7.2%
7.4%
7.6%
2005 2006 2007 2008
Target6.3%
2008 Retail EBIT margin
Wal-MartUS7.3%
2008 Retail EBIT margin
Retail EBIT Margins
Even before the recession, Target’s retail margins have been deteriorating while Wal-Mart’s margins have remained higher and constant, despite Wal-Mart selling a greater mix of food and other lower margin goods
40Source: Company filings
2006 –2007: Why were Target’s retail margins weaker even during the
strong economy?

Why Wasn’t Target More Profitable in the Boom Times?
37.0%
63.0%
ConsumablesConsumables
Non-Consumables
Non-Consumables
59%
41%
Consumables: Typically lower margin goodsNon-consumables (e.g., apparel, home furnishings): Typically higher margin goods
Source: Company filings. For Wal-Mart, consumables incorporate “grocery” and “health & wellness” categories. Includes Wal-Mart US only. For Target, consumables defined as consumables and commodities.
% of 2008 Sales
41
Opportunities to Make Target More Profitable
Given the differences in profitability between Target and Wal-Mart, we believe there are opportunities to improve Target’s retail margins.
Having an experienced retail operator on the board can only help Target become a more profitable company in our view
42

Jim Donald: Food Retailing Leader
Jim Donald served as the CEO of Starbucks Corporation from April 2005 until January 2008. He joined Starbucks in October 2002 as President, North America. Jim served as Chairman, President and CEO of Pathmark Stores, Inc. from 1996 until joining Starbucks in 2005. Jim served as President and Manager of Safeway Inc.’s 130-store Eastern Division from 1994 to 1996. He was responsible for a $2.5 billion business, comprised of 10,000 employees working at 130 stores and two distribution centers. From 1991 until joining Safeway in 1994, Jim was an executive at Wal-Mart Stores, Inc, were he worked on the development and expansion of the Wal-Mart Super Center, supervising all merchandising, distribution, store design and real estate operations. Jim began his career in 1971 as a trainee with Publix Super Markets, Inc. He joined Albertson’s in 1976 and quickly rose through its managerial ranks in the Florida, Alabama and Texas divisions. He was head of Albertson’s operations in Phoenix, Arizona.
Jim Donald
43
Nominee for Shareholder
Choice

Compare Jim Donald with Mary Dillon
Jim DonaldNominee for Shareholder Choice
Mary DillonTarget Incumbent Nominee
EVP and Global Chief Marketing Officer for McDonald’s
Is fast-food marketing experience highly relevant to Target?
Ms. Dillon is not a grocery store operator
Without Ms. Dillon, the board will continue to have marketing expertise – Mary Minnick, Coca Cola’s former President of Marketing
Target does business with McDonald’s
Leading Food Retailing Operating Executive
Over 30-years of food retailing experience
Former CEO Of Pathmark and Starbucks
Oversaw the development of Wal-Mart’s SuperCenters
Helped build out Wal-Mart’s grocery business
Entirely independent
44

Credit Cards: Richard Vague

46
“We have consistent performance ... and we're enjoying double-digit growth rates," Scovanner said. "No one else in the credit-card arena has those attributes. For the life of me, I don't understand why those attributes in combination would cause anyone to want to get into an active mode of analyzing a sale.”
Doug Scovanner, CFOStar Tribune, July 15, 2007
Target Initially Resisted a Transaction for its Receivables

47
Pershing Square Urged Target to Transfer Credit Risk
From August through December 2007, in multiple calls and meetings, Pershing Square endeavored to convince Target to transfer the credit and funding risks associated with its credit card operation to apartnering financial institution
In May, 2008, Target sold a 47% interest in its credit card receivables to JPMorgan Chase
Target elected, however, to retain substantially all of the credit risk and more than half of the funding risks associated with this business segment because of its insistence on retaining underwriting control
We believe this decision was ill-advised, and shareholders have suffered as a result

We Believe Target Made Poor Underwriting Decisions
“Average receivables grew 19.6% over last year, faster than our pace of sales primarily due to changing the product features for yet another group of our higher credit quality Target card accounts to become higher limit Target Visa accounts.”
Doug Scovanner, CFOQ3’07 conference call, 11/20/2007
48
In the summer of 2007, Target converted a large portion of its private label Target card accounts (typically lower FICO score customers with lower credit limits) to Target VISA accounts, thereby giving lower quality credit customers significantly higher credit limits and lower rates. We believe this was a mistake

$322
$930
3.7%
12.8%
$0
$100
$200
$300
$400
$500
$600
$700
$800
$900
$1,000
2007A 2008A0.0%
2.0%
4.0%
6.0%
8.0%
10.0%
12.0%
14.0%
The Results: Significant Profit Declines
49
In our view, as a result of poor underwriting decisions and exposure to credit risk, Target’s credit card operating profits declined 65% in 2008
Cre
dit C
ard
EBIT
Credit C
ard EBIT as a %
of average receivables
65% drop
$ in millions

5.3%5.7%
7.2%
9.3%
3.9%
3.3%
5.9%
5.1%
0.0%
1.0%
2.0%
3.0%
4.0%
5.0%
6.0%
7.0%
8.0%
9.0%
10.0%
2005 2006 2007 2008
Underperforming Relative to Credit Card Peers
50
Target
Credit Card Competitor
Average (JPM, BAC, AXP,
COF, DFS)
In 2008, Target’s net write-offs as a % of average receivables increased to 9.3% from 5.9% the year prior. This compares to 5.7% for Target’s credit card competitors in 2008
~360 bps spread
Net Write-offs as a % of Average Receivables
Source: Company filings

5.6%
7.3%8.4%
14.4%
3.5%
4.5%
6.1%6.6%
0.0%
2.0%
4.0%
6.0%
8.0%
10.0%
12.0%
14.0%
16.0%
2005 2006 2007 2008
Underperforming Relative to Credit Card Peers
51
In 2008, Target’s bad debt expense as a % of average receivables increased to 14.4% from 6.6% the year prior. This compares to 7.3% for Target’s credit card competitors
Target
Credit Card Competitor
Average (JPM, BAC, AXP,
COF, DFS)
Bad Debt Expense as a % of Average Receivables
~710 bps spread
Source: Company filings

Richard Vague: Leading Credit Card Executive
Richard Vague has served as CEO and co-founder of Energy Plus Holdings LLC, a Philadelphia-based, progressive, independent Energy Service Company (ESCO) since 2007. From December 2004 until 2007, Richard served as the Chairman and CEO of Barclays Bank Delaware, a financial institution and credit card issuer. From 2000 until its sale to Barclays PLC in 2004, Richard was CEO of Juniper Financial, a direct consumer credit card bank that he co-founded. From 1984 until 2000, Richard was President and then CEO and Chairman of First USA and Chairman of Paymentech, the merchant processing subsidiary of First USA.
Richard co-founded First USA which grew from a start-up to the single largest Visa credit card issuer in the United States when it was sold to Bank One (now JPMorgan Chase) in 1997.
Richard Vague
52
Nominee for Shareholder
Choice

Veteran credit card industry executive
Co-founder of First USA, serving as its CEO until it was sold to Bank One (now JPMorgan Chase)
Founded and sold Juniper Financial
Valuable operating experience can assist Target achieve recovery in its credit card business
Strong transaction experience and relationships can help Target structure a risk-reducing transaction in the future
Entirely independent
Compare Richard Vague with Richard Kovacevich
Richard Vague Nominee for Shareholder Choice
Richard KovacevichTarget Incumbent Nominee
Chairman of Wells Fargo & Company
Voted to retain the credit risk associated with Target’s credit card business
We believe this decision ultimately led to dramatic profit declines for Target last year
Given the financial crisis, does Mr. Kovacevich have the time to devote to being a Target director?
Target does business with Wells Fargo
53

Real Estate: Michael Ashner
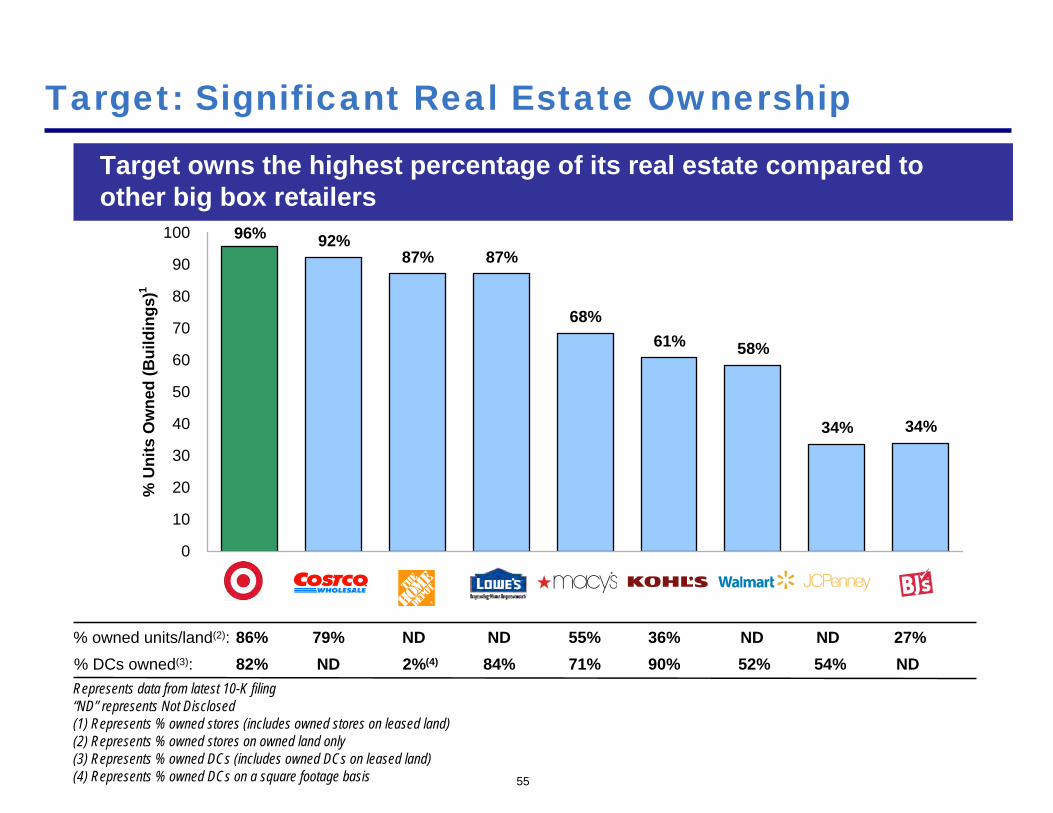
34% 34%
58% 61% 68%
87% 87% 92% 96%
0
10
20
30
40
50
60
70
80
90
100
% U
nits
Ow
ned
(Bui
ldin
gs)1
Target: Significant Real Estate Ownership
Target owns the highest percentage of its real estate compared to other big box retailers
% DCs owned(3): 82% ND 2%(4) 84% 71% 90% 52% 54% ND86% 79% ND ND 55% 36% ND ND 27%% owned units/land(2):
Represents data from latest 10-K filing“ND” represents Not Disclosed(1) Represents % owned stores (includes owned stores on leased land)(2) Represents % owned stores on owned land only(3) Represents % owned DCs (includes owned DCs on leased land)(4) Represents % owned DCs on a square footage basis 55

56
Target: A Leading Owner of Retail Real Estate in the US
Target currently owns approximately 213 million square feet of retail square footage (1), more than any other publicly traded retail real estate company in the U.S. today based on our estimates
(1) Includes owned and combined retail square footage. Excludes leased retail square footage and owned distribution centers square footage (2) Based on the latest company filings(3) Includes consolidated and unconsolidated GLA for the company(4) Based on U.S. properties square footage which the company owns. Excludes international properties square footage(5) Includes square footage of properties which the company owns or has a majority and minority ownership interest(6) Based on pro rata share of GLA in shopping center portfolio(7) Includes total square footage of the anchors (whether owned or leased by the anchor) and mall stores. Excludes future expansion areas(8) Based on actual pro rata ownership of joint venture assets and excluding developments and redevelopments in process and scheduled to commence in 2009(9) Based on wholly-owned and pro rata share of co-investment partnerships. Represents GLA including anchor-owned stores(10) Based on retail GLA owned by the company(11) Includes owned GLA on consolidated and unconsolidated properties
Estimated Total OwnedGLA (sq. ft.) (2)
(mm)
1 Target Corporation 213 (1)
2 General Growth Properties 168 (3)
3 Simon Property Group 153 (4)
4 The Macerich Company 76 (5)
5 Kimco Realty Corporation 74 (6)
6 CBL & Associates Properties 73 (7)
7 Developers Diversified Realty Corporation 67 (8)
8 Regency Centers Corporation 37 (9)
9 Weingarten Realty Investors 34 (10)
10 Pennsylvania Real Estate Investment Trust 26 (11)

The Market Does Not Appreciate Target’s Real Estate
$40/Share(1) Large Cap REITs (1)
Target’s Market Valuation (1)
2009E EV / EBITDA
Real Estate Companies and Private Ground Lease Valuations
2009E EV / EBITDA
7.2x 14.3xRecent “Big Box” Ground
Lease (2)
17.0x
Real estate companies trade at substantially higher multiples ofEBITDA compared to Target or other retailers
57
Pershing Square believes that there may be more efficient ways for Target to structure its real estate business in order to highlight its strong value. Pershing Square, however, does not currently have any specific plans or proposals with respect to Target’s real estate
Note: Target valuation excludes the net book value of the credit card receivables and the operating profit associated with such receivables in order to better compare Target with real estate companies which do not have credit card segments.(1) Based on current stock price as of 05/01/09. Large cap REITs multiples are based on Wall Street consensus estimates.(2) Based on mid-point precedent cap rate of 5.9%.

Questions to Ask
Given the stock market’s discounted valuation of Target’s vast real estate holdings, shouldn’t the board be willing to investigate opportunities to create value?
Pershing Square made several suggestions to Target, including a tax-free 19.9% REIT IPO, which Pershing Square believed would
Improve Target’s access to the capital markets
Maintain its strong investment grade credit ratings
Allow Target to maintain control over its buildings and brand
Highlight the value of Target’s greater than 200 million sq ft of real estate
Pershing Square’s past suggestions may not have been the perfect solution, but why was Target’s board unwilling to explore other real estate strategic alternatives?
58

Michael Ashner: Experienced Real Estate Executive
Michael Ashner has served as the CEO of Winthrop Realty Trust, Inc. since December 31, 2003 and Chairman of the board of directors since April 2004. Michael served as the Executive Chairman of Lexington Realty Trust, a REIT from December 31, 2006 through March 2008. He has also served as the Chairman, President and CEO of Winthrop Realty Partners, L.P. (a real estate investment and management company) since 1996. Michael has served as the Managing Director of AP-USX LLC, which owns a 2.4 million square foot office tower, since 1998. Since 1981, Michael has been the President and principal shareholder of Exeter Capital Corporation, a privately held realestate investment banking firm.
Michael manages over 20 million square feet of commercial real estate and has acquired more than $12 billion of real estate in 45 states, including more than 85,000 apartment units, 50 million square feet of office, retail and industrial space, and 10,000 hotel rooms.
Michael Ashner
59
Nominee for Shareholder
Choice
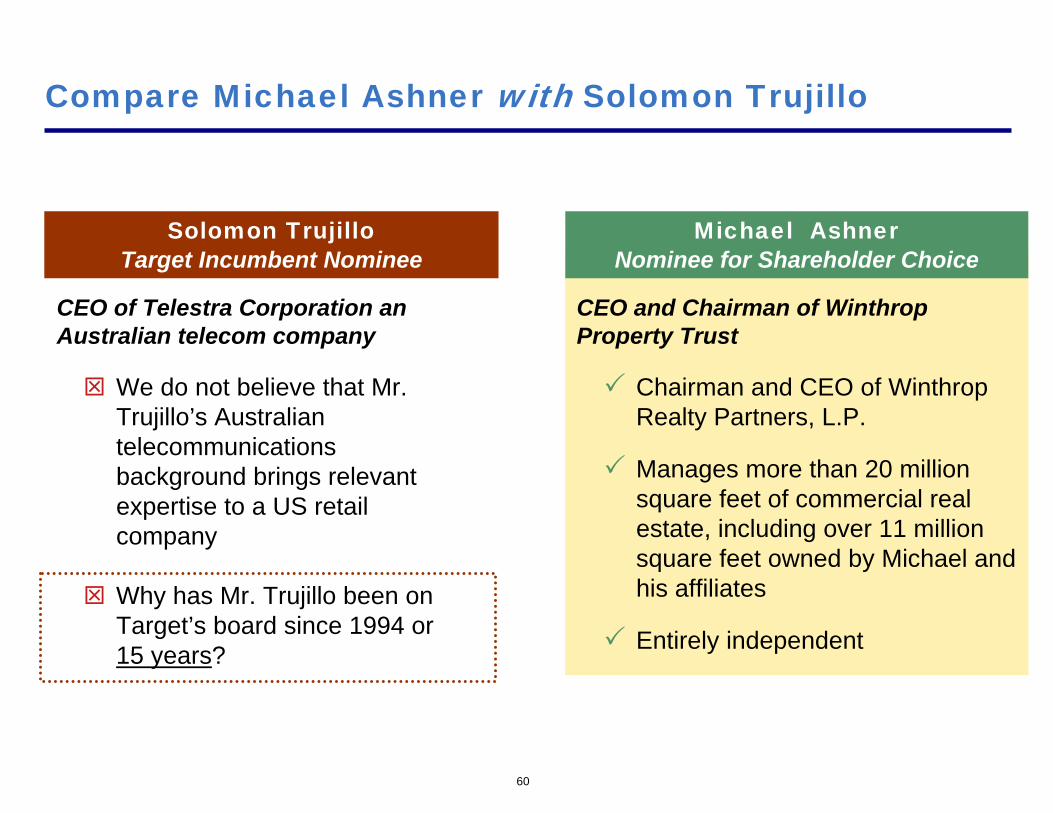
Compare Michael Ashner with Solomon Trujillo
Michael Ashner Nominee for Shareholder Choice
Solomon TrujilloTarget Incumbent Nominee
CEO of Telestra Corporation an Australian telecom company
We do not believe that Mr. Trujillo’s Australian telecommunications background brings relevant expertise to a US retail company
Why has Mr. Trujillo been on Target’s board since 1994 or 15 years?
CEO and Chairman of Winthrop Property Trust
Chairman and CEO of Winthrop Realty Partners, L.P.
Manages more than 20 million square feet of commercial real estate, including over 11 million square feet owned by Michael and his affiliates
Entirely independent
60

Shareholder Value: Bill Ackman
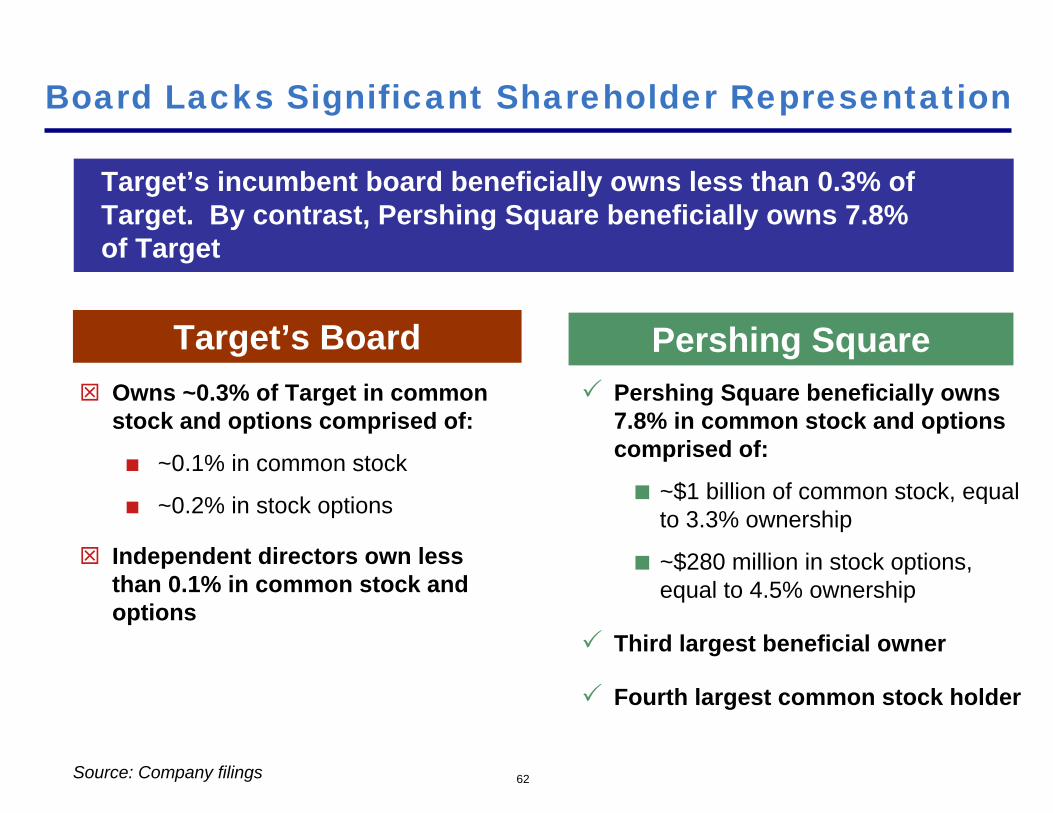
Board Lacks Significant Shareholder Representation
62
Target’s incumbent board beneficially owns less than 0.3% of Target. By contrast, Pershing Square beneficially owns 7.8% of Target
Source: Company filings
Pershing Square Target’s BoardOwns ~0.3% of Target in common stock and options comprised of:
~0.1% in common stock
~0.2% in stock options
Independent directors own less than 0.1% in common stock and options
Pershing Square beneficially owns 7.8% in common stock and options comprised of:
~$1 billion of common stock, equal to 3.3% ownership
~$280 million in stock options, equal to 4.5% ownership
Third largest beneficial owner
Fourth largest common stock holder

William Ackman: Leading Shareholder
Bill Ackman is the founder and managing member of the general partner of Pershing Square Capital Management, L.P.,an investment adviser founded in 2003 and registered with the SEC. Pershing Square is a concentrated research-intensive fundamental value investor in long and occasionally short investments in the public markets, typically focusing on large-cap and mid-cap companies. Bill has significant experience investing in multi-billion dollar retail and consumer companies.
Pershing Square is the third largest beneficial shareholder of Target with 7.8% of the company, including approximately $1 billion in common stock (3.3% of the company) and $280 million in stock options (4.5% of the company) based on recent market prices.
Bill Ackman
63
Nominee for Shareholder
Choice

Founder of Pershing Square, a public equity investment firm
Pershing Square beneficially owns 7.8% in common stock and options (1)
Represents the third largest beneficial owner of Target
Significant investment experience in multi-billion dollar retail and consumer companies
Compare Bill Ackman with George Tamke
Bill AckmanNominee for Shareholder Choice
George TamkeTarget Incumbent Nominee
Partner at Clayton, Dubilier & Rice, a leveraged buyout firm
Owns 0.01% of Target in common stock and options
Serves on the boards of Culligan(Chairman), ServiceMaster (Chairman) and Hertz – all Clayton, Dubilier & Rice portfolio companies
How does Mr. Tamke allocate his time?
Target purchases products and services from “several companies”that are controlled by Clayton, Dubilier & Rice
64
(1) Consisting of 3.3% in shares (approximately $1bn in market value) and 4.5% in stock-settled call options (approximately $280mm in market value).
Pershing Square: Track Record of Success
In our view, Pershing Square has established a track record of creating shareholder value in retail, consumer, and other businesses
65
Canada

Corporate Governance: Ron Gilson

Ron Gilson: Corporate Governance Authority
Ron Gilson is the Meyers Professor of Law and Business, Stanford Law School (1979 to present) and the Marc and Eva Stern Professor of Law and Business, Columbia University School of Law (1992 to present).
Ron is a fellow of the American Academy of Arts and Sciences and the European Corporate Governance Institute. Ron has served on the board of directors of certain of the American Century Mutual Funds, managing over $26 billion in assets, since1995 and has been the Chairman of the board of directors since 2005.
Ron Gilson is one of our country’s preeminent thinkers on corporate governance. We believe that, if elected, Ron’s extensive academic and real world experience as an independent board chair would ensure fair process, fair dealing, and diligent care for the benefit of all shareholders.
67
Ron Gilson
Nominee for Shareholder
Choice
Target’s Board: Avoiding the Real Issues

Target’s Board: Avoiding the Real Issues
We believe the Real Issue of this election is that Target’s board is suboptimal
Lacks significant relevant senior operating experience
Lacks significant shareholder representation
Has made expensive mistakes in assessing strategic transactions
Has failed on key governance duties
In our view, Target’s board has not addressed this issue satisfactorily
Instead, the board, its advisors, and PR team have publicly made what we believe to be misleading statements to dissuade investors from focusing on the CORE ISSUES
69

“Favoring Risk Taking”
Pershing Square’s sizeable derivative position creates an incentive for risk taking
Target is Pershing Square’s largest investment
Pershing Square owns $1 billion in common stock and $280 million in stock options
Unlike the incumbent board, Pershing Square paid cash for its stock options and can extend the life of its options
Target’s management and the board have a greater percentage of their ownership in derivatives than Pershing Square
Pershing Square has been a major buyer of Target shares in recent years unlike members of senior management
Gregg Steinhafel, had not purchased one share of stock during the last five years until 3/18/09 – one day after we nominated directors for the board
Board and executive management have sold $429 million of stock in the last five years
Target’s misleading stance: The ACTUAL FACTS:
70

“Risky Agenda”
Target’s misleading stance:
Pershing Square has launched a proxy contest to push its real estate agenda
The ACTUAL FACTS:
The Nominees for Shareholder Choice are entirely independent
There is no “Bill Ackman slate”
The independent nominees have no pre-conceived real estate agenda
Even if all of the Nominees for Shareholder Choice are elected, two-thirds of Target’s current board will remain, providing board room continuity
Bill Ackman supports exploration of real estate ideas – if you don’t want Target to explore real estate alternatives, don’t vote for him. You can still vote for Jim Donald, Richard Vague, Michael Ashner, and Ronald Gilson
This election is not about “Bill Ackman” but rather about choosing board members with the most relevant experience
“Bill Ackman’s slate of nominees…”
71

Credit Ratings and Risk
Since our first meeting with management, Pershing Square has urged Target to decrease credit risk
Instead, Target’s board chose to maintain credit exposure to the credit card business
Fall 2008, Pershing Square encouraged Target to halt buyback program
In Pershing Square’s view, Target can be an enormously valuable company without the need to over-leverage its business
Pershing Square believes that positioning the company so that it can increase its access to capital may allow it to take advantage ofdistressed real estate opportunities that could result from the current shakeout in the retail industry
Bill Ackman, if elected, does not intend to support any action that will impair Target’s credit ratings
72

“Hasty Selection”
Questions to Ask Target:
Why are the current independent board members the most qualified to serve on the board of Target, a retail and credit card company?
Why does Target’s board continue to nominate its own members and not conduct a professional search for new directors with senior operating experience?
Hasty selection of candidates by Pershing Square is inconsistent with a professional search required by good corporate governance
The Nominees for Shareholder Choice are leaders in food retailing, credit cards, real estate, shareholder value, and corporate governance
The credibility, independence, experience, reputation, and integrity of the Nominees for Shareholder Choice speak for themselves
Target’s misleading stance: Our Response:
73
Target Says:
“We do not believe that Pershing Square's nominees would add value to the Board.”
- Target spokesperson
“Ackman campaign for Target like prize fight”Reuters, 4/18/2009
74
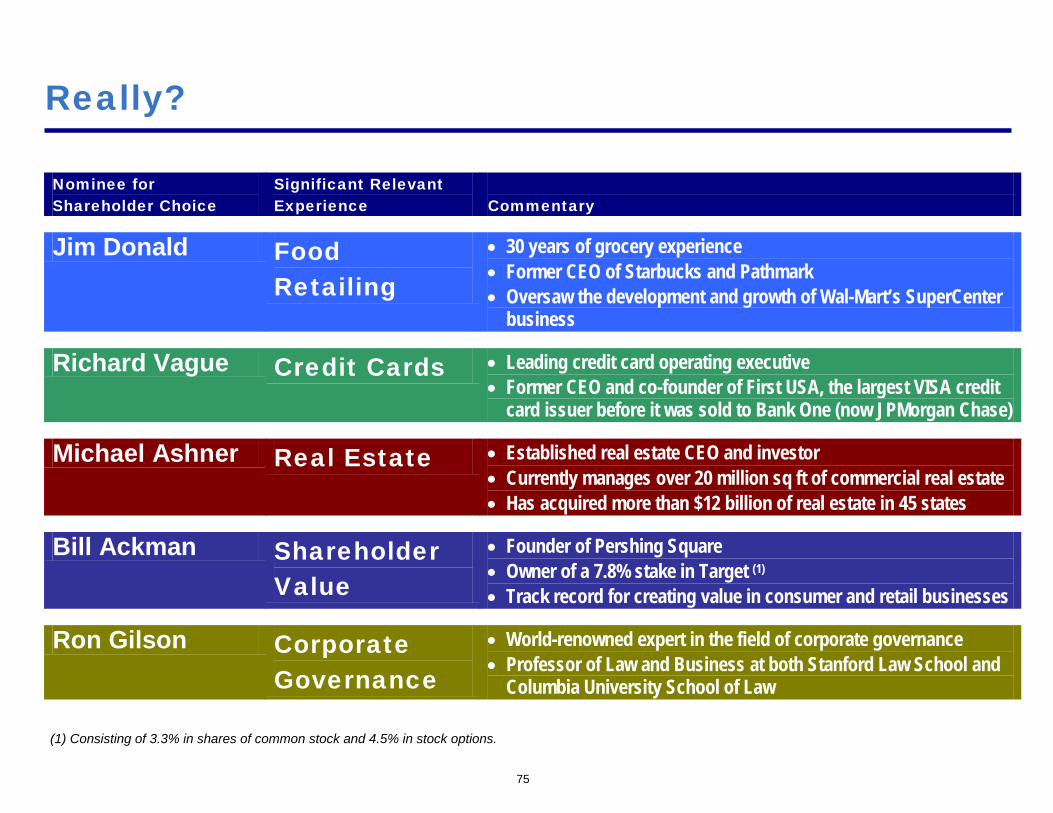
Really?
75
(1) Consisting of 3.3% in shares of common stock and 4.5% in stock options.
Nominee for Shareholder Choice
Significant Relevant Experience
Commentary
•
Jim Donald Food Retailing
• 30 years of grocery experience • Former CEO of Starbucks and Pathmark • Oversaw the development and growth of Wal-Mart’s SuperCenter
business •
Richard Vague Credit Cards • Leading credit card operating executive • Former CEO and co-founder of First USA, the largest VISA credit
card issuer before it was sold to Bank One (now JPMorgan Chase) •
Michael Ashner Real Estate • Established real estate CEO and investor • Currently manages over 20 million sq ft of commercial real estate • Has acquired more than $12 billion of real estate in 45 states
•
Bill Ackman Shareholder Value
• Founder of Pershing Square • Owner of a 7.8% stake in Target (1) • Track record for creating value in consumer and retail businesses
•
Ron Gilson Corporate Governance
• World-renowned expert in the field of corporate governance • Professor of Law and Business at both Stanford Law School and
Columbia University School of Law

Corporate Elections and Shareholder Choice

Pershing Square Offers Shareholder’s a Choice
In this election, you can choose to vote for:
The Nominees for Shareholder Choice, or
Target’s incumbent slate, or
Nominees from each of the two slates
Had Pershing Square not nominated a slate, shareholders would have no viable alternative other than to elect the incumbent nominees
Pershing Square is bringing shareholders an important choice at the Annual Meeting
77

78
How We Think about Voting
How to ChooseConsiderations
Should shareholders be forced to simply choose from competing slates?Should shareholders have the option of choosing the best nominees from all available candidates?
Maintaining Continuity
Incumbent Nominees
vs. Shareholder Nominees
Which candidates have the fewest commercial ties to Target?Is it possible that only incumbents are the best candidates?Are any incumbents accountable for underperformance?
How Should Elections
Work?
This contest is not a change of controlAt least 2/3rds of the incumbent directors will remain on the boardBoard continuity is preservedBoth slates support management continuity
Shareholder choice is good for Target and good for corporate governanceSupport efforts to simplify the voting process and ensure that each vote is counted
Choose continuity and fresh perspectivesChoose the best nominees with the most relevant experience
This is an election is about choosing the best directors for Target
Choose candidates with no conflicting economic interestsChoose fresh perspectivesChoose the best nominees with the most relevant experience
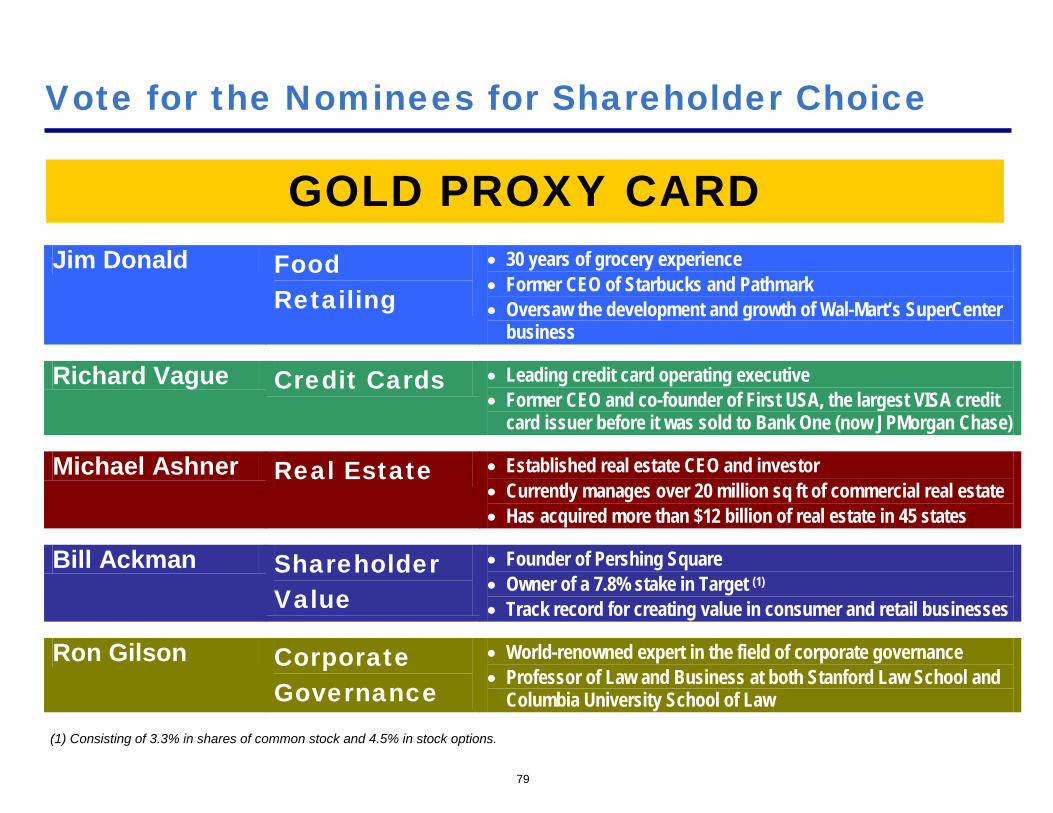
Vote for the Nominees for Shareholder Choice
79
GOLD PROXY CARD
(1) Consisting of 3.3% in shares of common stock and 4.5% in stock options.
•
Jim Donald Food Retailing
• 30 years of grocery experience • Former CEO of Starbucks and Pathmark • Oversaw the development and growth of Wal-Mart’s SuperCenter
business •
Richard Vague Credit Cards • Leading credit card operating executive • Former CEO and co-founder of First USA, the largest VISA credit
card issuer before it was sold to Bank One (now JPMorgan Chase) •
Michael Ashner Real Estate • Established real estate CEO and investor • Currently manages over 20 million sq ft of commercial real estate • Has acquired more than $12 billion of real estate in 45 states
•
Bill Ackman Shareholder Value
• Founder of Pershing Square • Owner of a 7.8% stake in Target (1) • Track record for creating value in consumer and retail businesses
•
Ron Gilson Corporate Governance
• World-renowned expert in the field of corporate governance • Professor of Law and Business at both Stanford Law School and
Columbia University School of Law

The Buck’s Rebound Begins HereMay 27, 2009
Pershing Square Capital Management, L.P.

1
Disclaimer
The analysis and conclusions of Pershing Square Capital Management, L.P. ("Pershing Square") regarding General Growth Properties, Inc. and its affiliates (collectively, “GGP” or the “Company”) are based on publicly available information. Pershing Square recognizes that there may be confidential or otherwise non-public information in the possession of the Company that could lead the Company to disagree with Pershing Square’s conclusions.
The analyses provided include certain estimates and projections prepared with respect to, among other things, the historical and anticipated operating performance of the Company. Such statements, estimates, and projections reflect various assumptions by Pershing Square concerning anticipated results that are inherently subject to significant economic, competitive, and other uncertainties and contingencies and have been included solely for illustrative purposes. No representations, express or implied, are made as to the accuracy or completeness of such statements, estimates or projections or with respect to any other materials herein. Actual results may vary materially from the estimates and projected results contained herein.
Pershing Square advises funds that are in the business of trading - buying and selling - public securities. Pershing Square owns GGP equity, total return swaps, and GGP unsecured debt. It is possible that there will be developments in the future that cause such funds to change their positions regarding the Company and possibly increase, reduce, dispose of, or change the form of their investment in the Company.

2
Agenda
Why We Like General Growth Properties
A Brief History
Not Your Typical Bankruptcy
GGP’s Assets Are Greater Than Its Liabilities

Why Do We Like GGP?
Ala Moana

4
What is GGP?
GGP REITIncludes Retail & Office Properties
GGMIGeneral Growth Management Inc.
MPCMaster Planned Communities
■ Over 200 regional malls (>160mm sq ft) (1) / outdoor shopping centers
■ Over 30 grocery-anchored shopping centers
■ Office properties in Arizona, Nevada and near Maryland / Washington D.C.
■ 1.3bn mall visits per year■ >24,000 tenants■ >3,700 employees (2)
■ Provides management, leasing and marketing services
■ Over 60% of revenue derived from third party (non-GGP) malls
■ Manages many of GGP’sJV malls
■ Develops and sells land for residential and commercial use
■ Land located near Maryland / Washington D.C., Summerlin, NV and Houston, TX
■ ~18,000 saleable acres
________________________________________________(1) Includes anchor GLA and the Company’s pro rata share of JV malls.(2) >400,000 employees including retail tenants.
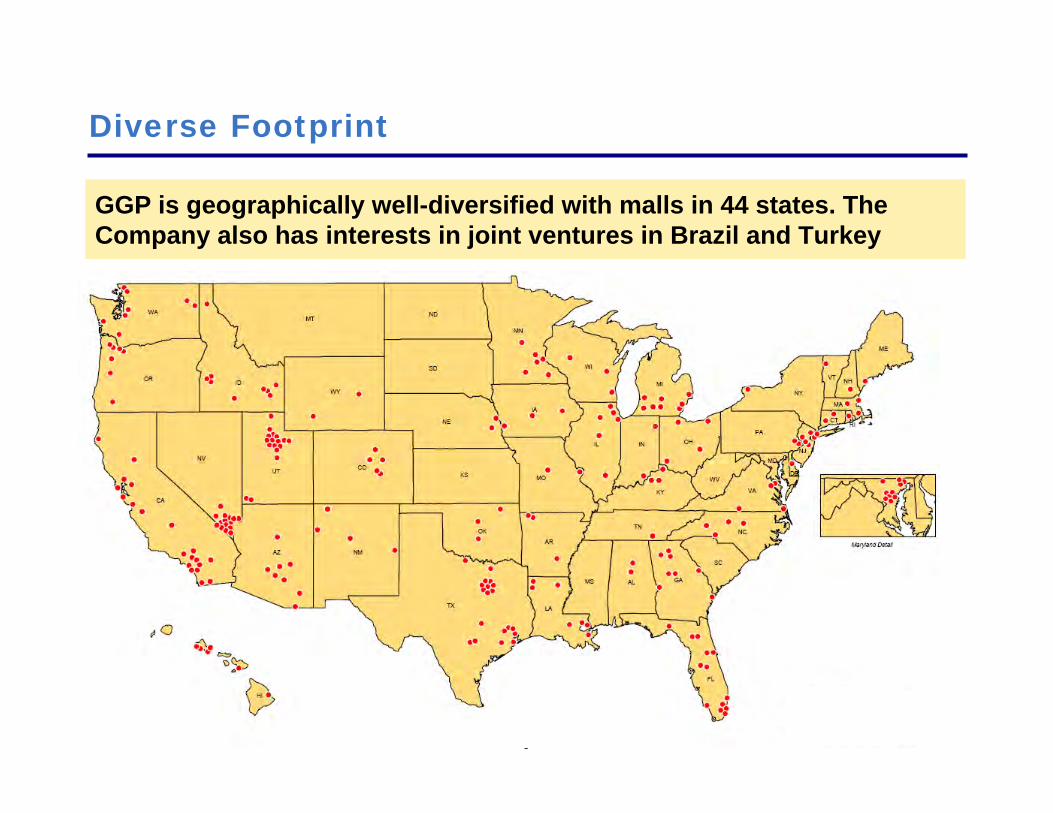
5
Diverse Footprint
GGP is geographically well-diversified with malls in 44 states. The Company also has interests in joint ventures in Brazil and Turkey

6
Diverse Tenant Base
GGP has over 24,000 tenants, with its largest tenant accounting for only 2.7% of revenue as of March 31, 2009
________________________________________________
Source: GGP Q1’09 operating supplement.
Memo:Market Cap
$11.8bn4.0bn2.4bn1.8bn5.0bn3.0bn
PrivatePrivatePrivate
6.0bn

7
High Quality Assets
GGP’s portfolio consists of many of the best malls in America
Other Examples:
Faneuil Hall Marketplace
South Street Seaport
Ward Centers (Honolulu, HI)
Not Included
Green Street assigns an ‘A’ grade to 73 malls in GGP’s portfolio
________________________________________________
Source: Green Street.

8
High Quality Assets (Cont’d)
“Indicative of the strength within our portfolio is the performance of our 50 most productive United States centers. These properties generated average sales per square foot of approximately $648. Not only dothese 50 centers produce tremendous sales per square foot, they also represent approximately 50% of our total mall NOI. This is one more example of the quality of our portfolio, and quality will be more important than ever as we move forward in 2008 and 2009.”
–John Bucksbaum, Chairman and Former CEO, July 31, 2008
Because the NOI from GGP’s highest quality malls should be valued at materially lower cap rates than its lower quality malls, a substantial majority of GGP’s equity value is in the Company’s best assets
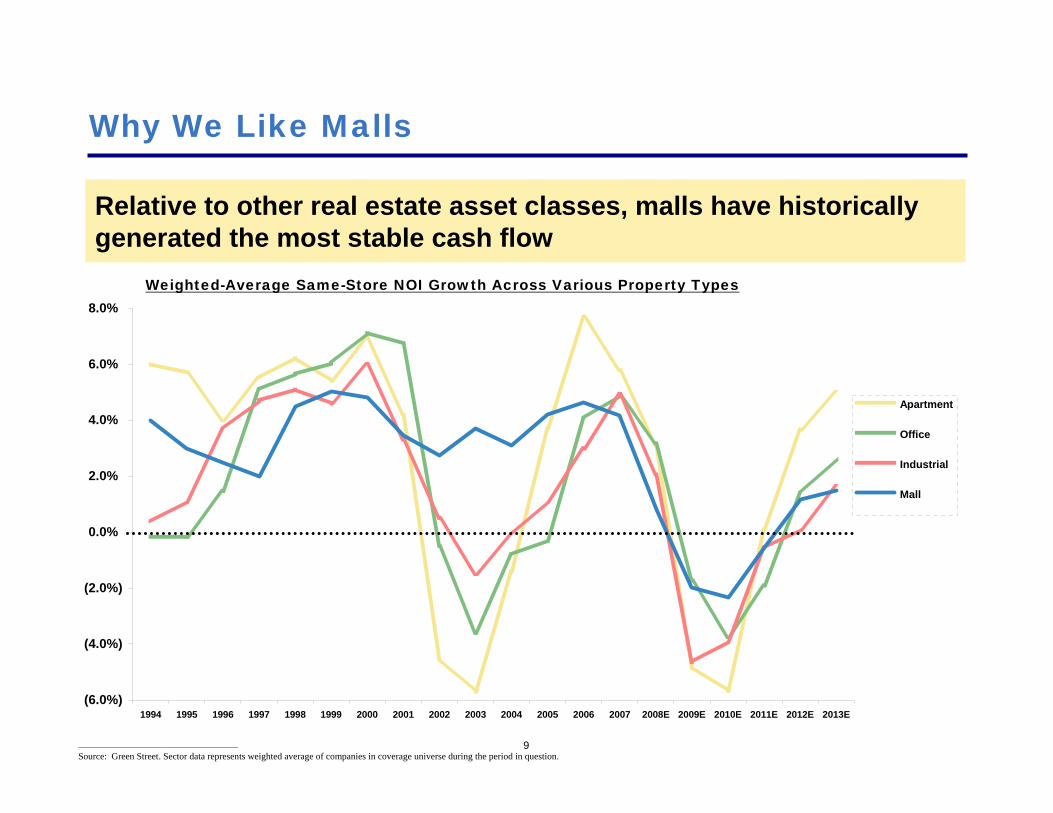
9
(6.0%)
(4.0%)
(2.0%)
0.0%
2.0%
4.0%
6.0%
8.0%
1994 1995 1996 1997 1998 1999 2000 2001 2002 2003 2004 2005 2006 2007 2008E 2009E 2010E 2011E 2012E 2013E
Apartment Office
Industrial
Mall
Why We Like Malls
Relative to other real estate asset classes, malls have historically generated the most stable cash flow
Weighted-Average Same-Store NOI Growth Across Various Property Types
________________________________________________
Source: Green Street. Sector data represents weighted average of companies in coverage universe during the period in question.
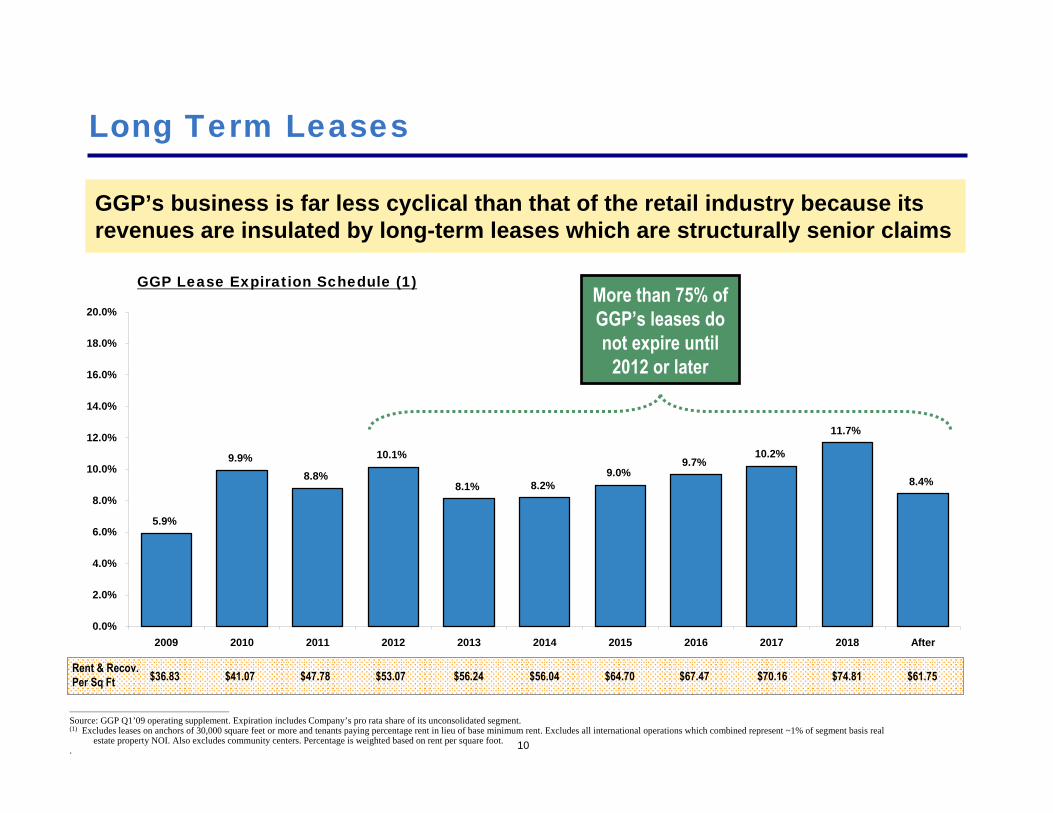
10
Long Term Leases
GGP’s business is far less cyclical than that of the retail industry because its revenues are insulated by long-term leases which are structurally senior claims
GGP Lease Expiration Schedule (1)
5.9%
9.9%8.8%
10.1%
8.1% 8.2%9.0%
9.7%10.2%
11.7%
8.4%
0.0%
2.0%
4.0%
6.0%
8.0%
10.0%
12.0%
14.0%
16.0%
18.0%
20.0%
2009 2010 2011 2012 2013 2014 2015 2016 2017 2018 After
More than 75% of GGP’s leases do not expire until
2012 or later
$36.83 $41.07 $47.78 $53.07 $56.24 $56.04 $64.70 $67.47 $70.16 $74.81 $61.75Rent & Recov.Per Sq Ft
________________________________________________
Source: GGP Q1’09 operating supplement. Expiration includes Company’s pro rata share of its unconsolidated segment.(1) Excludes leases on anchors of 30,000 square feet or more and tenants paying percentage rent in lieu of base minimum rent. Excludes all international operations which combined represent ~1% of segment basis real
estate property NOI. Also excludes community centers. Percentage is weighted based on rent per square foot..

11
Embedded Growth
11
GGP’s long term lease-based revenue model offers embedded growth in good times and mitigates revenue declines in bad times
$37
$41
$48
$53
$56 $56
$65
$67
$70
$75
$62
$30.00
$35.00
$40.00
$45.00
$50.00
$55.00
$60.00
$65.00
$70.00
$75.00
2009 2010 2011 2012 2013 2014 2015 2016 2017 2018 After
GGP Rent & Recoverable Per Sq Ft Expiration Schedule (1)
Average:$56
EmbeddedGrowth
Opportunity
________________________________________________
Source: GGP Q1’09 operating supplement. Expirations include company’s pro rata share of its unconsolidated segment.(1) Data includes significant proportion of short-term leases on inline spaces that are leased for one year. Rents and recoverable common area costs related to these short-term leases are typically much lower than those
related to long-term leases. Any inferences the reader may draw regarding future rent spreads should be made in light of this difference between shrort- and long-term leases..

12
Inflation-Protected
12
Approximately 82% of GGP’s debt is fixed rate
________________________________________________
Source: Q1’09 operating supplement.

13
Why Do We Like GGP?
13
EmbeddedGrowth Opportunity
High QualityBusiness
DiversifiedGeographical Footprint
High QualityAssets
Inflation-ProtectedStable Cash Flows
DiverseTenant Mix

A Brief History
Town and Country Center Cedar Rapids, 1954

15
$0
$10
$20
$30
$40
$50
$60
$70
April-1993:GGP goes public on the NYSE resulting in net cash proceeds of ~$383mm
The Rise of GGP: 1954 – 2007
1954:Brothers Martin & Matthew Bucksbaumfound GGP and open Town & Country Shopping Center in Cedar Rapids, IA
1960:GGP opens Duck Creek Plaza, one of the first malls to have a department store anchor
April-2007:GGP achieves a market cap of ~$20bn
August-2004:Rouse acquisition
GGP paid ~$4bn in dividends
GGP refinanced or paid down ~$32bn of debt
Until Q1’09, GGP never defaulted on a mortgage
During its time as a Public Company
1954 1960 1993 1995 1997 1999 2001 2003 2005 2007

16
The Fall of GGP: 2008 – Current
$0
$10
$20
$30
$40
$50
Jan-08 Apr-08 Jul-08 Oct-08 Feb-09 May-09
March 28, 2008:GGP raises $822mm in a stock offering priced at $36 per share, implying a market cap of ~$12bn.
~$100mm is purchased by an affiliate of the Bucksbaum family
June-July, 2008:The CMBS new issuance market grinds to a halt
September 15, 2008:Lehman Brothers declares bankruptcy. Market cap: ~$9bn
November 12, 2008:GGP market cap hits ~$100mm
November 28, 2008:$900mm of GGP debt comes due
April 16, 2008:GGP voluntarily files for bankruptcy
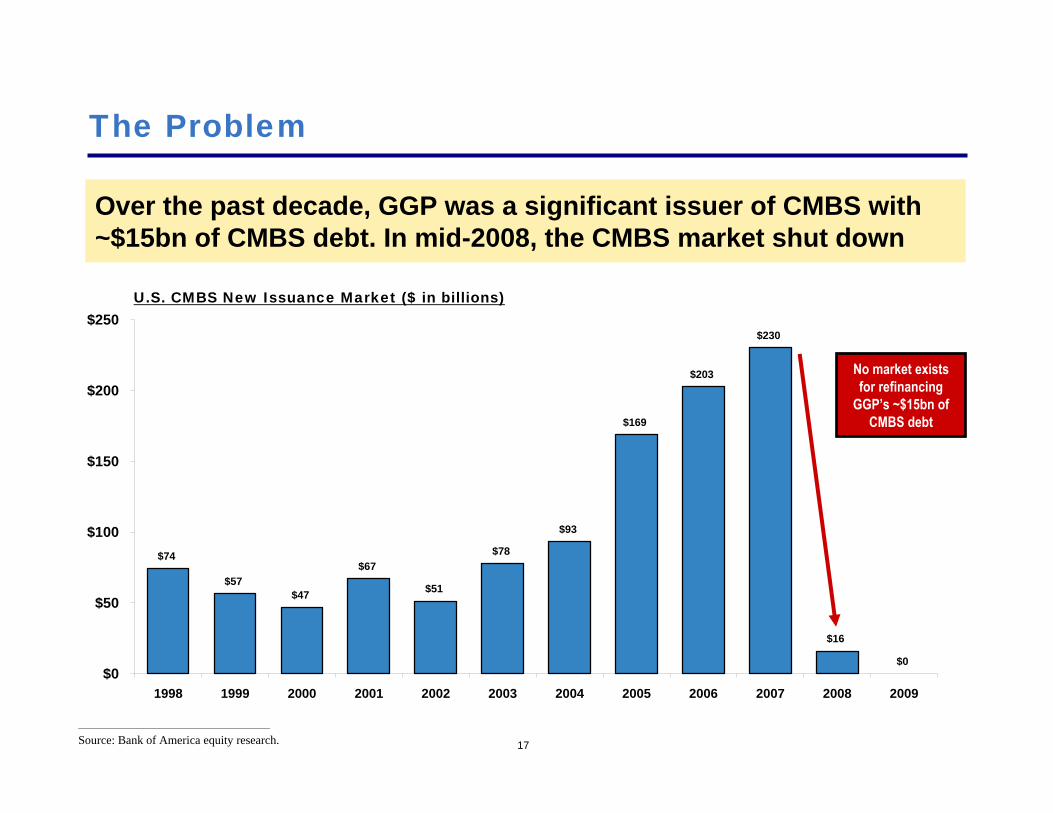
17
$74
$57$47
$67
$51
$78
$93
$169
$203
$230
$16
$0$0
$50
$100
$150
$200
$250
1998 1999 2000 2001 2002 2003 2004 2005 2006 2007 2008 2009
The Problem
Over the past decade, GGP was a significant issuer of CMBS with ~$15bn of CMBS debt. In mid-2008, the CMBS market shut down
________________________________________________
Source: Bank of America equity research.
U.S. CMBS New Issuance Market ($ in billions)
No market exists for refinancing
GGP’s ~$15bn of CMBS debt

18
The Problem (Cont’d)
GGP’s bankruptcy is the result of the unprecedented disruption in the credit markets coinciding with large near-term debt maturities
________________________________________________
Source: GGP Q1’09 operating supplement.

Despite the turmoil in the credit markets, GGP’s operating performance remains strong

20
91.2%90.9% 90.8%
90.5%90.2% 90.1%
88.9%
83.8%
83.0%
84.0%
85.0%
86.0%
87.0%
88.0%
89.0%
90.0%
91.0%
92.0%
Glimcher General Growth Simon PropertyGroup
Taubman Macerich Westfield CBL Pennsylvania REIT
Occupancy as of Q1’09
GGP’s occupancy ranks among the top of its peer group
Glimcher occupancy benefitted in Q1’09 from the signing of temporary tenants to one year leases that had previously been excluded from the occupancy calculation. Occupancy was 90.6% as of Q3’07
________________________________________________
Note: Occupancy is defined as percent of mall shop and freestanding GLA leased.(1) SPG figures are for regional malls only.(2) CBL figures are for stabilized regional malls only (excludes new developments and redevelopments).

21
Trailing Twelve Month Cash NOI
As of Q1’09, GGP’s trailing twelve month cash NOI grew 1.4% on a year over year basis. Adjusting for lease termination income, cash NOI grew 2.4%
TTM Cash NOI ($ in millions)
6.6% 4.0% 5.0% 7.2% 9.2% 12.6% 12.7% 9.7% 5.3% 1.4% Cash NOIGrowth (YoY)
5.7% 5.1% 5.7% 7.6% 9.1% 10.8% 10.9% 8.5% 5.1% 2.4% Adj. Cash NOIGrowth (YoY)
Excl. Termination Income
________________________________________________
Note: NOI figures exclude management fee income and NOI associated with the MPC segment.Cash NOI adjusts for non-cash items such as straight-line rent, lease mark to market adjustments (FAS 141), non-cash ground rent expense and real estate tax stabilization.
$2,211 $2,211 $2,255 $2,328$2,489 $2,542 $2,554 $2,542 $2,524
$2,413
$0
$250
$500
$750
$1,000
$1,250
$1,500
$1,750
$2,000
$2,250
$2,500
$2,750
Q4'06 Q1'07 Q2'07 Q3'07 Q4'07 Q1'08 Q2'08 Q3'08 Q4'08 Q1'09
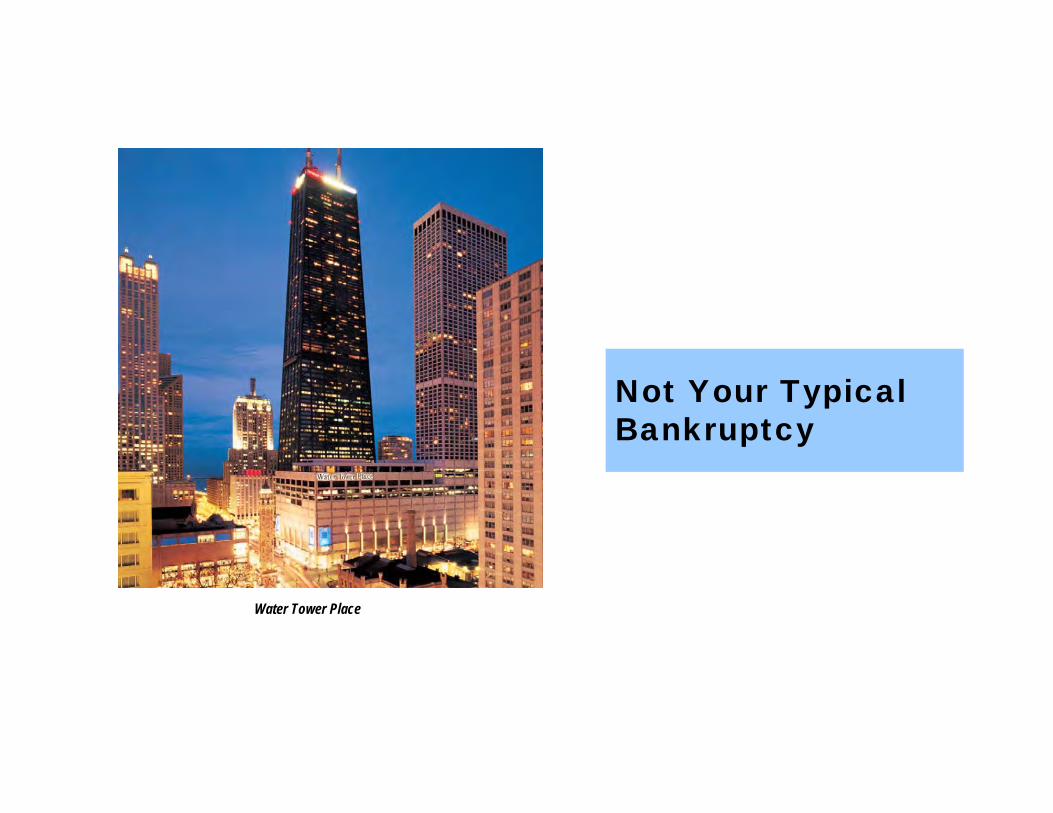
Not Your Typical Bankruptcy
Water Tower Place

Unlike most bankruptcies where equity holders lose most, if not all, of their value, we believe GGP’sbankruptcy provides the ideal opportunity for a fair and equitable restructuring of the Company that preserves value for all constituents: secured lenders, unsecured lenders, employees, and equity holders

24
A Little Personal History
$0
$10
$20
$30
$40
$50
$60
$70
$80
May-92 Jan-93 Oct-93 Jul-94 Apr-95 Dec-95
While in bankruptcy, Alexanders’ stock price appreciated 358%
May 12, 1992:Alexanders files a voluntarypetition for bankruptcy
September 21, 1993:Alexanders’ Plan of Reorganization is confirmed
March 1, 1995:Alexanders emerges from bankruptcy

25
Amerco Bankruptcy
While in bankruptcy, Amerco’s stock price appreciated 456%
$0
$10
$20
$30
$40
$50
$60
$70
$80
Jan-03 Aug-03 Mar-04 Oct-04 May-05 Dec-05
June 20, 2003:Amerco files a voluntary petition for bankruptcy
February 2, 2004:Amerco’s Plan of Reorganization is confirmed
March 15, 2004:Amerco emerges from bankruptcy
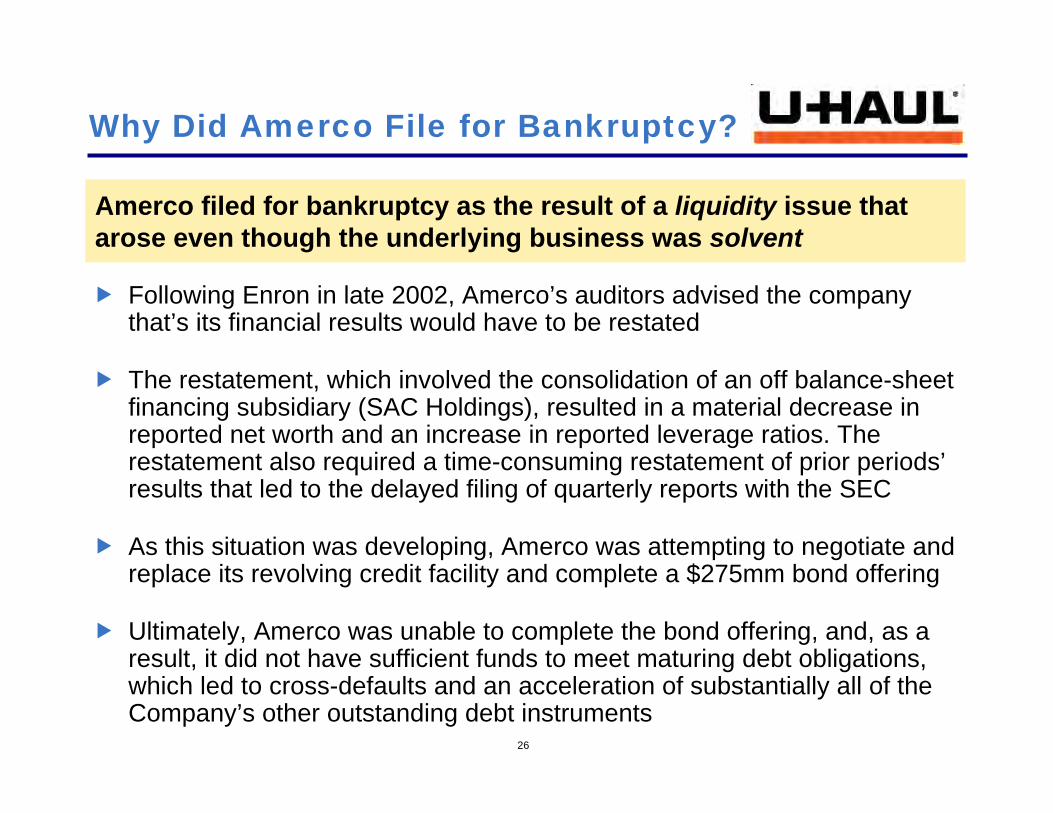
26
Why Did Amerco File for Bankruptcy?
Amerco filed for bankruptcy as the result of a liquidity issue that arose even though the underlying business was solvent
Following Enron in late 2002, Amerco’s auditors advised the company that’s its financial results would have to be restated
The restatement, which involved the consolidation of an off balance-sheet financing subsidiary (SAC Holdings), resulted in a material decrease in reported net worth and an increase in reported leverage ratios. The restatement also required a time-consuming restatement of prior periods’results that led to the delayed filing of quarterly reports with the SEC
As this situation was developing, Amerco was attempting to negotiate and replace its revolving credit facility and complete a $275mm bond offering
Ultimately, Amerco was unable to complete the bond offering, and, as a result, it did not have sufficient funds to meet maturing debt obligations, which led to cross-defaults and an acceleration of substantially all of the Company’s other outstanding debt instruments
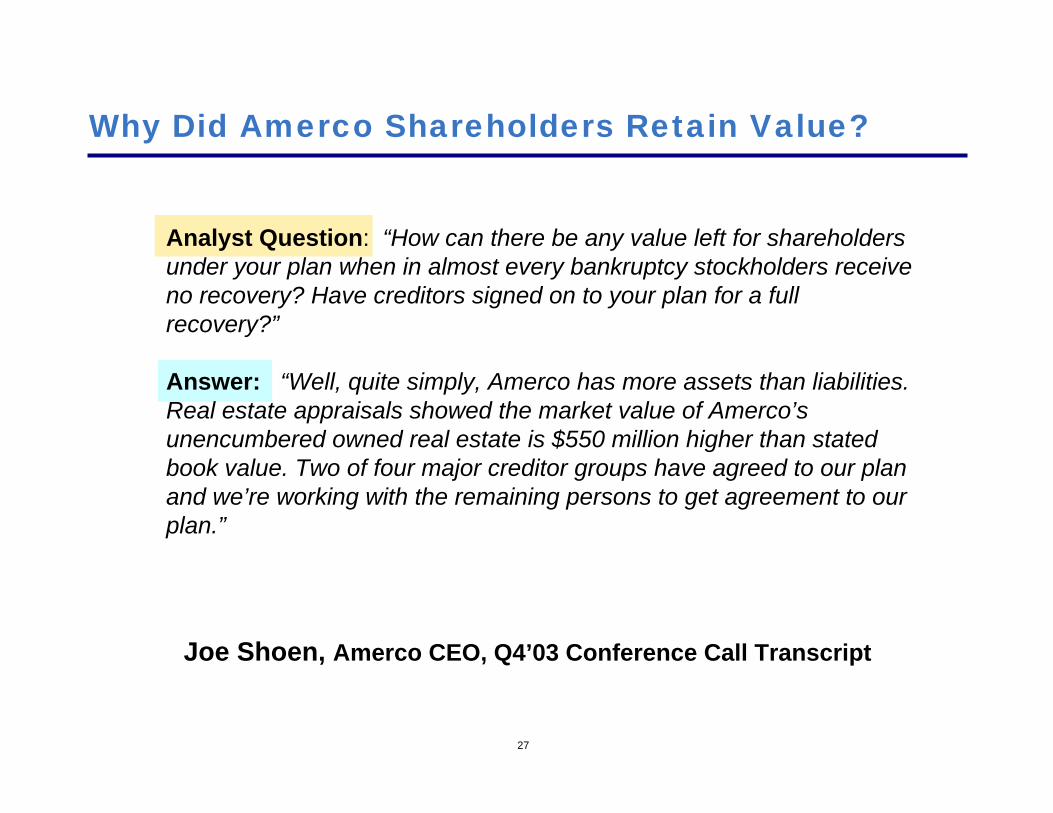
27
Why Did Amerco Shareholders Retain Value?
Analyst Question: “How can there be any value left for shareholders under your plan when in almost every bankruptcy stockholders receive no recovery? Have creditors signed on to your plan for a full recovery?”
Answer: “Well, quite simply, Amerco has more assets than liabilities. Real estate appraisals showed the market value of Amerco’sunencumbered owned real estate is $550 million higher than stated book value. Two of four major creditor groups have agreed to our plan and we’re working with the remaining persons to get agreement to our plan.”
Joe Shoen, Amerco CEO, Q4’03 Conference Call Transcript

28
(b) (2) For the purpose of this subsection, the condition that a plan be fair and equitable with respect to a class includes the following requirements:
(A) With respect to a class of secured claims, the plan provides–(i)(I) that the holders of such claims retain the liens securing such claims, whether the property subject to such liens is retained by the debtor or transferred to another entity, to the extent of the allowed amount of such claim
(B) With respect to a class of unsecured claims–(i) the plan provides that each holder of a claim of such class receive or retain on account of such claim property of a value, as of the effective date of the plan, equal to the allowed amount of such claim
Bankruptcy 101
§ 1129. Confirmation of plan
________________________________________________
Source: U.S. Bankruptcy Code, Title 11, Chapter 11, Subchapter II.
Creditors are entitled to a “fair and equitable” plan of reorganization

29
Bankruptcy 101 (Cont’d)
A “fair and equitable” plan only entitles creditors to recover 100% of the amount of their claims. When a debtor’s asset value exceeds the amount of its liabilities, equity holders are entitled to the residual value
“Although many of the factors interpreting ‘fair and equitable’ are specified in paragraph (2), others, which were explicated in thedescription of section 1129(b) in the House report, were omitted from the House amendment to avoid statutory complexity and because they would undoubtedly be found by a court to be fundamental to “fair and equitable” treatment of a dissenting class. For example, a dissenting class should be assured that no senior class receives more than 100 percent of the amount of its claims.”
Congressional Record – HouseRegarding the Bankruptcy Reform Act of 1978
H.R. 7330, 95th Cong., 1st Sess. 201 September 28, 1978
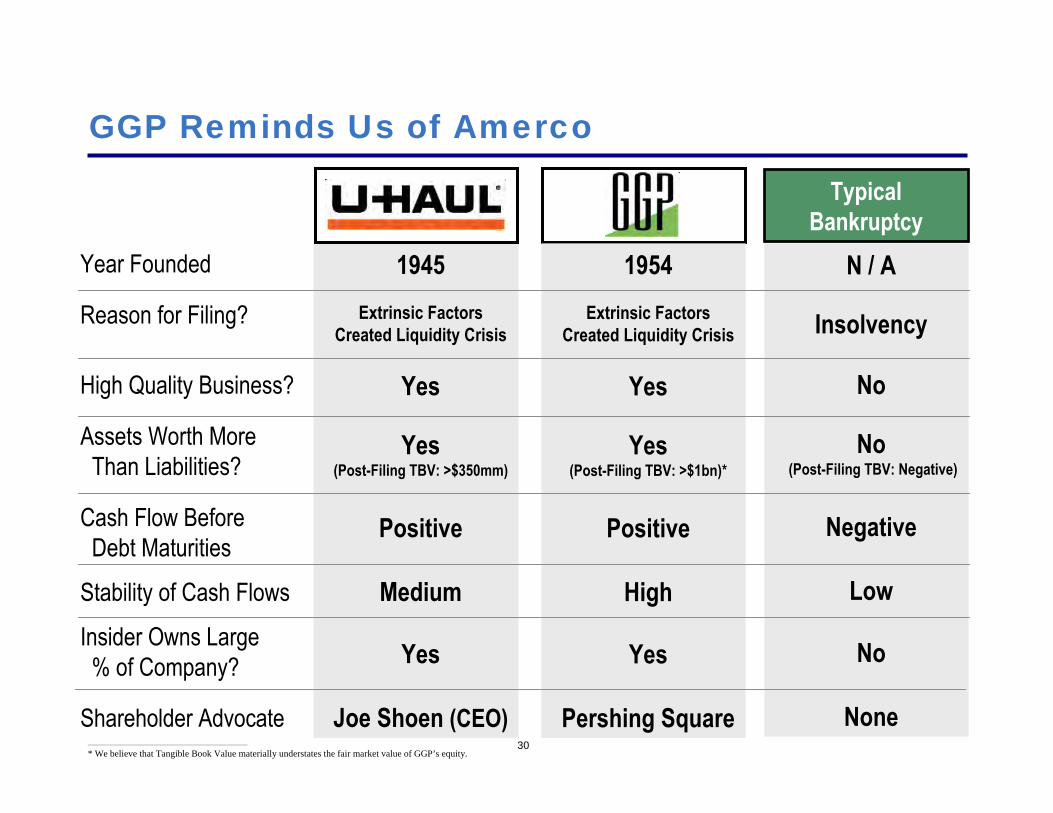
30
GGP Reminds Us of Amerco
Year Founded
Reason for Filing?
High Quality Business?
Assets Worth MoreThan Liabilities?
Cash Flow BeforeDebt Maturities
Stability of Cash Flows
Insider Owns Large% of Company?
Shareholder Advocate
1945Extrinsic Factors
Created Liquidity Crisis
Yes
Yes(Post-Filing TBV: >$350mm)
Positive
Medium
Yes
Joe Shoen (CEO)
TypicalBankruptcy
1954Extrinsic Factors
Created Liquidity Crisis
Yes
Yes(Post-Filing TBV: >$1bn)*
Positive
High
Yes
Pershing Square
N / A
Insolvency
No
No(Post-Filing TBV: Negative)
Negative
Low
No
None________________________________________________
* We believe that Tangible Book Value materially understates the fair market value of GGP’s equity.
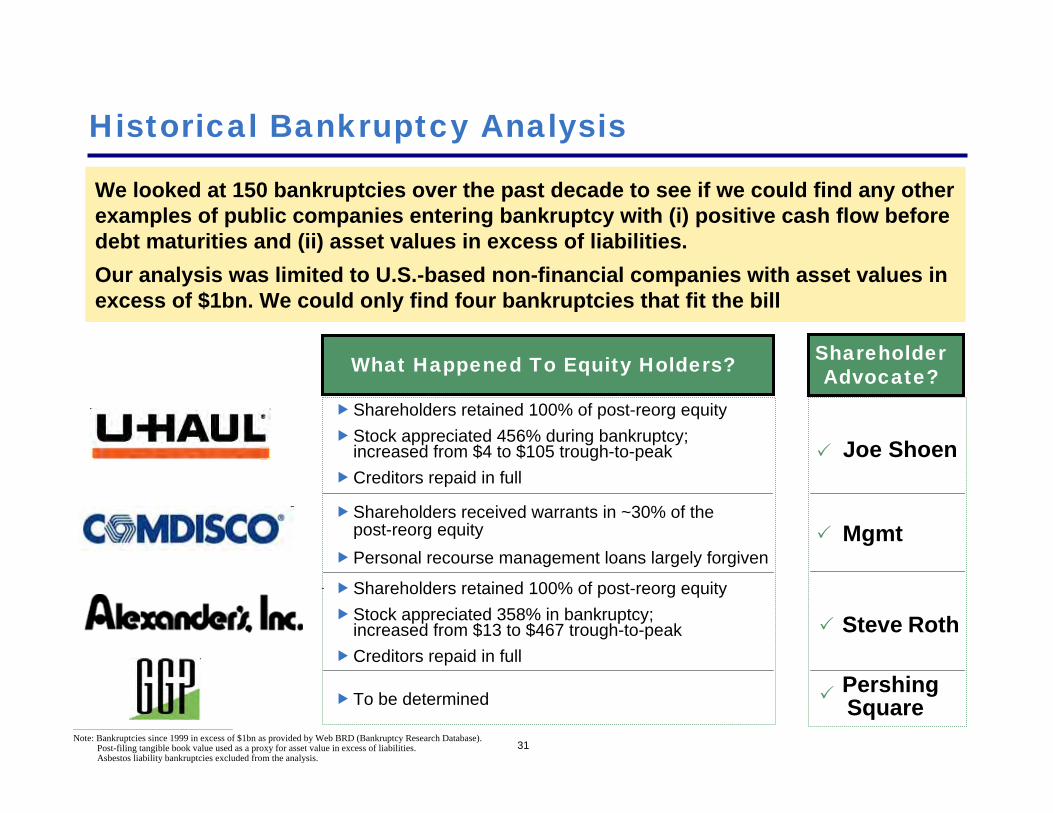
31
Historical Bankruptcy Analysis
We looked at 150 bankruptcies over the past decade to see if we could find any other examples of public companies entering bankruptcy with (i) positive cash flow before debt maturities and (ii) asset values in excess of liabilities.Our analysis was limited to U.S.-based non-financial companies with asset values in excess of $1bn. We could only find four bankruptcies that fit the bill
What Happened To Equity Holders?
________________________________________________
Note: Bankruptcies since 1999 in excess of $1bn as provided by Web BRD (Bankruptcy Research Database).Post-filing tangible book value used as a proxy for asset value in excess of liabilities.Asbestos liability bankruptcies excluded from the analysis.
Shareholders retained 100% of post-reorg equityStock appreciated 456% during bankruptcy; increased from $4 to $105 trough-to-peakCreditors repaid in full
Shareholders received warrants in ~30% of thepost-reorg equityPersonal recourse management loans largely forgiven
Shareholders retained 100% of post-reorg equityStock appreciated 358% in bankruptcy; increased from $13 to $467 trough-to-peakCreditors repaid in full
To be determined
ShareholderAdvocate?
Joe Shoen
Mgmt
Steve Roth
Pershing Square

32
Incentives of Various Constituencies in a Typical Bankruptcy
Post-reorganization equity is often underpriced as a result of the incentives of the various constituencies in a bankruptcy process
Liquidate? Valuation Rationale
SecuredCreditors
UnsecuredCreditors
Management
Full recovery of claimLoan to ownEliminate unsecured leverage
Desire to be fulcrum securityAim to receive 100% of post-reorganization equity
“Hit with your eyes closed”POR projectionsLow-struck optionsMinimize post-reorg leverage
Depends
No
No
Low
>Secured ; <Equity
Conservative
Given the incentives of the various parties involved in a typical bankruptcy, equity holders require a shareholder advocate to protect their interests

Given the incentives of the various constituencies in bankruptcy, what is the best way for GGP to reorgan-ize that preserves value for secured lenders, unsecured lenders, employ-ees, and equity holders?

34
A Simple Solution
A seven-year extension of GGP’s secured and unsecured loans at their existing interest rates would provide the Company with sufficient time to use cash flow from operations to delever its balance sheet. With a seven-year extension, we believe the Company would be able to repay existing creditors in full
Benefits of this Approach:
Secured and unsecured lenders receive 100% of the present value of their claims
Prevents the liquidation of assets at “fire-sale” prices
Preserves value for equity holders
GGP platform remains intact
Preserves jobs
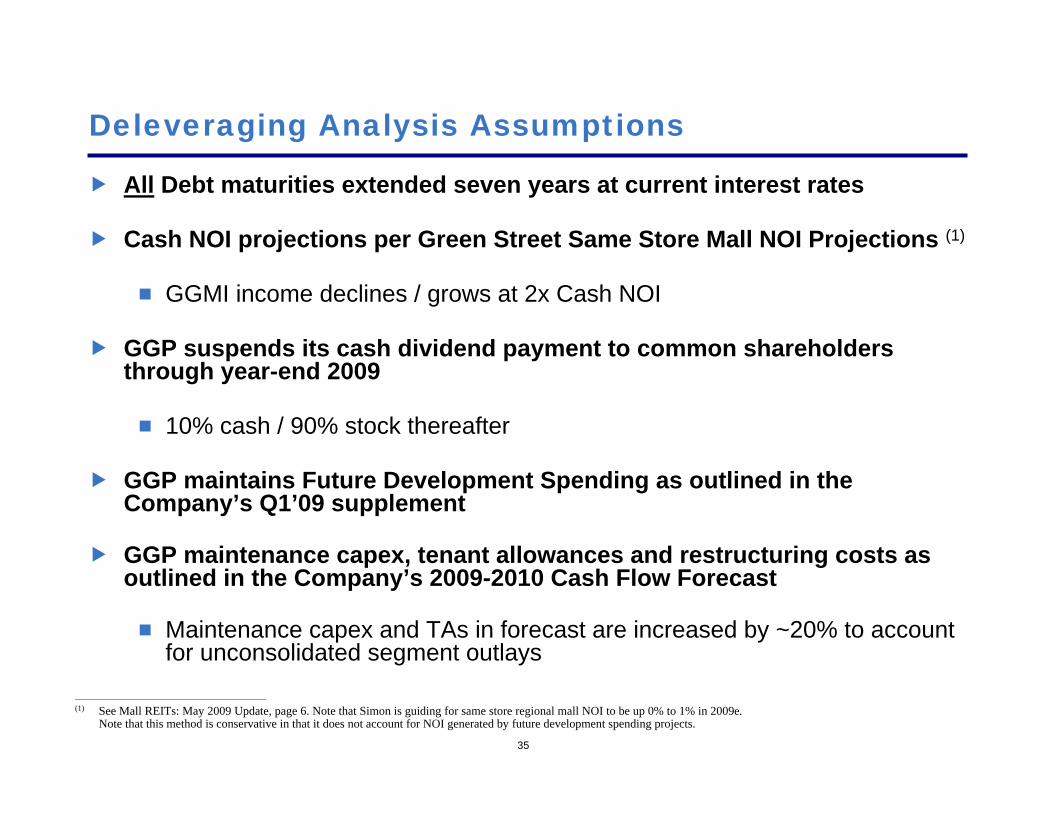
35
Deleveraging Analysis Assumptions
All Debt maturities extended seven years at current interest rates
Cash NOI projections per Green Street Same Store Mall NOI Projections (1)
GGMI income declines / grows at 2x Cash NOI
GGP suspends its cash dividend payment to common shareholders through year-end 2009
10% cash / 90% stock thereafter
GGP maintains Future Development Spending as outlined in the Company’s Q1’09 supplement
GGP maintenance capex, tenant allowances and restructuring costs as outlined in the Company’s 2009-2010 Cash Flow Forecast
Maintenance capex and TAs in forecast are increased by ~20% to account for unconsolidated segment outlays
________________________________________________(1) See Mall REITs: May 2009 Update, page 6. Note that Simon is guiding for same store regional mall NOI to be up 0% to 1% in 2009e.
Note that this method is conservative in that it does not account for NOI generated by future development spending projects.

36
(US$ in millions, except per unit data) Seven Year Period2008a 2009e 2010e 2011e 2012e 2013e 2014e 2015e Total
Cash Flow Available for Debt RepurchaseCash NOI (excl MPC) $2,542 $2,481 $2,412 $2,390 $2,411 $2,462 $2,536 $2,612Growth 5.3% (2.4%) (2.8%) (0.9%) 0.9% 2.1% 3.0% 3.0%
Plus / Less: MPCs (1) 73 (38) 15 25 50 75 75Plus: Fee income 98 92 91 92 96 102 108Less: Overhead from recurring ops (2) (269) (272) (274) (277) (280) (283) (286)Less: Restructuring / Strategic costs (180) (112) - - - - - Less: Maint Capex / TAs (156) (197) (200) (200) (205) (205) (210)Less: Development capex (183) (99) (138) (138) (140) (140) (145)Less: Other (incl income taxes, pfd distributions) (50) (28) (30) (30) (30) (30) (30)Less: Pro Forma Interest expense 6.04% (1,698) (1,693) (1,687) (1,676) (1,662) (1,642) (1,616)Less: Cash dividend (10% cash) - (16) (6) (6) (15) (29) (47)
Cash Flow Available for Debt Repurchase $115 $48 $160 $202 $277 $385 $462 $1,648
Illustrative Equity ValuePropco Enterprise Value (@ 7.5% cap rate) $33,082 $32,155 $31,866 $32,153 $32,828 $33,813 $34,827Plus: Cash / GGMI / Dvlpmt Pipeline / MPC (3) 3,119 3,119 3,119 3,119 3,119 3,119 3,119 Less: Total Debt (EOP) (28,059) (28,011) (27,851) (27,649) (27,372) (26,987) (26,525)
Illustrative Equity Value $8,141 $7,263 $7,134 $7,623 $8,575 $9,944 $11,420Per Share $25.47 $22.73 $22.32 $23.85 $26.83 $31.12 $35.74
Seven-year maturity extensions coupled with a reduced cash dividend would allow GGP to delever its balance sheet and create a substantial equity cushion
________________________________________________(1) Assumes proceeds from ~$90mm sale of Bridgeland improve cash flow in 2009e. Aside from Bridgeland adjustment, cash flows based on 2009-2010 Cash Flow Forecast filed by the Company.(2) Represents annualized Q1’09 overhead expense. Adjusts for seasonality and $38mm of restructuring costs included in overhead line items. Ignores the potential for incremental cost saves. (3) See valuation section for details.
Illustrative Deleveraging Analysis
SubstantialEquity
Cushion

37
(US$ in millions, except per unit data) Seven Year Period2008a 2009e 2010e 2011e 2012e 2013e 2014e 2015e Total
Cash Flow Available for Debt RepurchaseCash NOI (excl MPC) $2,542 $2,481 $2,412 $2,390 $2,411 $2,462 $2,536 $2,612Growth 5.3% (2.4%) (2.8%) (0.9%) 0.9% 2.1% 3.0% 3.0%
Plus / Less: MPCs (1) 73 (38) 15 25 50 75 75Plus: Fee income 98 92 91 92 96 102 108Less: Overhead from recurring ops (2) (269) (272) (274) (277) (280) (283) (286)Less: Restructuring / Strategic costs (180) (112) - - - - - Less: Maint Capex / TAs (156) (197) (200) (200) (205) (205) (210)Less: Development capex (183) (99) (138) (138) (140) (140) (145)Less: Other (incl income taxes, pfd distributions) (50) (28) (35) (35) (35) (35) (35)Less: Pro Forma Interest expense (3) 6.45% (1,392) (1,392) (1,392) (1,392) (1,392) (1,392) (1,392)
Cash Flow Available for Dividend $421 $366 $457 $487 $557 $658 $728 $3,673Cash Dividend Yield 2.9% 2.7% 3.4% 3.6% 3.9% 4.3% 4.4%
Illustrative Equity ValuePropco Enterprise Value (@ 7.5% cap rate) $33,082 $32,155 $31,866 $32,153 $32,828 $33,813 $34,827Plus: Cash / GGMI / Dvlpmt Pipeline / MPC (4) 3,119 3,119 3,119 3,119 3,119 3,119 3,119 Less: Total Debt (EOP) (21,588) (21,588) (21,588) (21,588) (21,588) (21,588) (21,588)
Illustrative Equity Value $14,613 $13,686 $13,397 $13,684 $14,359 $15,344 $16,358Per Share (Adj for dilution from debt conversion) $25.12 $22.22 $21.31 $22.21 $24.32 $27.40 $30.58 Average% of Equity Required for Unsecureds to get 100% of Claim 45.1% 48.1% 49.2% 48.1% 45.9% 42.9% 40.3% 45.6%
Illustrative Deleveraging Analysis: Unsecured Debt Converts into Equity
Alternatively, 100% of GGP’s unsecured lenders could be converted into equity. Under this scenario, GGP would be able to pay a meaningful cash dividend
In this scenario, Unsecureds
would require ~45% of post-reorg equity to be made-whole
________________________________________________
Note: Assumes $6.6bn of GGP’s unsecured debt converts fully into equity.(1) Assumes proceeds from ~$90mm sale of Bridgeland improve cash flow in 2009e. Aside from Bridgeland adjustment, cash flows based on 2009-2010 Cash Flow Forecast filed by the Company.(2) Represents annualized Q1’09 overhead expense. Adjusts for seasonality and $38mm of restructuring costs included in overhead line items. Ignores the potential for incremental cost saves.(3) Assumes weighted average interest expense of unsecured debt is 4.7%.(4) See valuation section for details.
Using conservative assumptions, GGP would be able to pay a
4.4% dividend yield by year 7

What if our “Simple Solution” cannot be achieved consensually?
The Bankruptcy Code offers the ability for debtors to “cram down”creditors so long as each class of creditor receives the present value of their claims

If a creditor is not paid in cash or property upon emergence, it must receive future payments, the present value of which equals its bankruptcy claim
“Plans that invoke the cram down power often provide for installment payments over a period of years rather than a single payment. In such circumstances, the amount of each installment must be calibrated to ensure that, over time, the creditor receives disbursements whose total present value equals or exceeds that of the allowed claim.”
– Opinion of Justice Stevens, Till v. SCS Credit Corp
What interest rate must the debtor pay over time on its obligations to its creditors in a cram down?

41
The Till Precedent
In the case of Till v. SCS Credit Corp. (2004), the U.S. Supreme Court established a precedent upon which to adjust interest rates in the bankruptcy context:
If an “efficient” market exists for the debt, then the court may apply the “market rate,” which is the rate that the market will bear for the proposed loan
Absent an efficient market, the court is to apply a “formula approach” involving setting the rate at the prevailing prime rate plus a “risk adjustment” rategenerally between 1% and 3%
GGP falls into this category
If There is an Efficient Market:
Absent an Efficient Market:
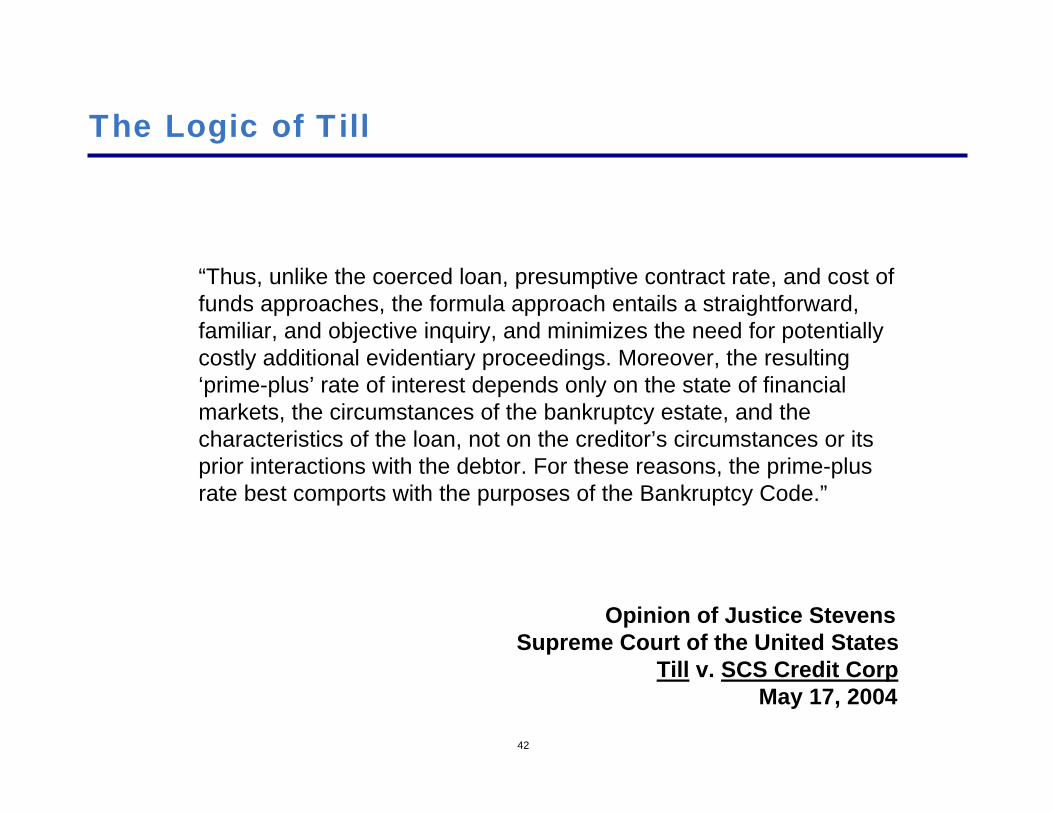
42
The Logic of Till
“Thus, unlike the coerced loan, presumptive contract rate, and cost of funds approaches, the formula approach entails a straightforward, familiar, and objective inquiry, and minimizes the need for potentially costly additional evidentiary proceedings. Moreover, the resulting ‘prime-plus’ rate of interest depends only on the state of financial markets, the circumstances of the bankruptcy estate, and the characteristics of the loan, not on the creditor’s circumstances or its prior interactions with the debtor. For these reasons, the prime-plus rate best comports with the purposes of the Bankruptcy Code.”
Opinion of Justice StevensSupreme Court of the United States
Till v. SCS Credit CorpMay 17, 2004

43
The Progeny of Till
Since the Supreme Court ruling in 2004, Till has been applied innumerous bankruptcy proceedings
Cases: Rate: Source:In re Bivens Prime + 2.25% 317 B.R. 755, 769 (Bankr.N.D.Ill.2004)
In re Cachu Prime + 0.5% 321 B.R. 716, 725 (Bankr.E.D.Cal.2004)
In re Cantwell Prime + 1.0% 336 B.R. 688, 45 (Bankr.D.N.J.2006)
In re Flores Prime + 1.0% Not Reported in B.R. (Bankr.D.N.J.2006)
In re Harken Prime + 3.0% Not Reported in B.R. (Bankr.N.D.Iowa.2004)
In re Pokrzywinski Prime + 1.5% 311 B.R. 846, 850-51 (Bankr.E.D.Wis.2004)
In re Prussia Associates Prime + 1.5% 322 B.R. 572, 44 (Bankr.E.D.Pa.2005)
________________________________________________
Note: The above list is not meant to be comprehensive.

44
In re Prussia Associates
The Bankruptcy Court’s ruling in the case of Prussia Associates, a limited partnership that owns and operates one hotel in King of Prussia, PA, shows that even if an efficient market is deemed to exist, the Court might still opt for a “prime-plus” formula approach
“The Court is constrained, therefore, to conclude that, although this case presented an occasion upon which it indeed made sense to inquire as to what the relevant market rate of interest might be, the totality of the evidence presented did not permit a sufficiently informed conclusion to be drawn. Put differently, this case demonstrates that the mere existence of an efficient market does not guarantee that the short-comings of the coerced loan approach to rate setting, as described in Till, will automatically be overcome. The Court will thus fall back upon Till, and the formula approach, as the preferred means for setting the interest rate herein.”
Opinion of Judge RaslavichUnited States Bankruptcy Court, E.D. Pennsylvania
In re Prussia AssociatesApril 5, 2005

45
In re Prussia Associates (Cont’d)
“The prime rate as of today is 5.75%. This rate, therefore, will be the applicable base rate. The risk premium, per Till, will normally fluctuate between 1% and 3%. The appropriate size of the adjustment, per Till, will depend on factors such as the circumstances of the estate, the nature of the security and the duration and feasibility of the reorganization plan. The creditor bears the burden of proof on this issue. In this instance, [the Creditor] has raised certain legitimate questions as to the feasibility of the Debtor’s plan; however it has done little to overcome the evidence which indicates both that the Debtor’s operations are improving apace, and that the value of Fremont’s collateral is appreciating steadily. The Court thus views the risks attendant to the proposed loan as neither negligible nor extreme. Based upon this, the Court will require the addition of a 1.5% risk premium to the aforesaid prime rate for the recast [Creditor] loan.”
Opinion of Judge RaslavichUnited States Bankruptcy Court, E.D. Pennsylvania
In re Prussia AssociatesApril 5, 2005
The Court ruled that the appropriate mortgage rate should be set at Prime + 1.5% (7.25%), despite the Creditor’s contention that the “market rate” was 9.72%
We note that GGP is a
higher quality, lower risk
business than Prussia
Associates, which owns
one hotel, the Valley Forge
Hilton

46
What Factors Will the Court Consider in Determining the Appropriate Risk Adjustment Spread for GGP?
Based on these precedents, we believe the court could confirm a plan at a rate that is lower than GGP’s current weighted average interest rate
“The appropriate size of [the] risk adjustment depends, of course, on such factors as the circumstances of the estate, the nature of the security, and the duration and feasibility of the reorganization plan”
– Opinion of Justice Stevens, Till v. SCS Credit Corp
Circumstances of the Estate
Nature of the Security
Duration and Feasibility of
POR
Cash flow in excess of interest expenseNOI has increased since the issuance of >95% of GGP’s outstanding loansIn the process of deleveragingCutting costs, lowering development spending and reducing cash dividend
OversecuredEquivalent in value to the present value of the creditors’ claim
Seven years, though debt paydownbegins day oneHighly feasible PORNegiligible risk of nonpayment
Prime-plus0.5% 1.0%
Appropriate Risk-Adjustment Rate:

47
The Prime Rate May be Sufficient
In light of GGP’s highly diversified, high quality portfolio, in a reorganizationwhere the unsecured debt converts to equity, the court may deem the Prime rate plus 0% to be a sufficient rate of interest on GGP’s secured debt
Footnote 18:
“We note that, if the court could somehow be certain a debtor would complete his plan, the prime rate would be adequate to compensate any secured creditors forced to accept cram down loans”
– Opinion of Justice Stevens, Till v. SCS Credit Corp.

What If GGP’s Debt Were Re-Priced to Till-Mandated Rates?

49
(US$ in millions, except per unit data) Seven Year Period2008a 2009e 2010e 2011e 2012e 2013e 2014e 2015e Total
Cash Flow Available for Debt RepurchaseCash NOI (excl MPC) $2,542 $2,481 $2,412 $2,390 $2,411 $2,462 $2,536 $2,612Growth 5.3% (2.4%) (2.8%) (0.9%) 0.9% 2.1% 3.0% 3.0%
Plus / Less: MPCs (1) 73 (38) 15 25 50 75 75Plus: Fee income 98 92 91 92 96 102 108Less: Overhead from recurring ops (2) (269) (272) (274) (277) (280) (283) (286)Less: Restructuring / Strategic costs (180) (112) - - - - - Less: Maint Capex / TAs (156) (197) (200) (200) (205) (205) (210)Less: Development capex (183) (99) (138) (138) (140) (140) (145)Less: Other (incl income taxes, pfd distributions) (50) (28) (35) (35) (35) (35) (35)Less: Pro Forma Interest expense (3) (1,161) (1,134) (1,107) (1,076) (1,042) (1,002) (958)Less: Cash dividend (10% cash) - (126) (120) (124) (137) (155) (177)
Cash Flow Available for Debt Repurchase $652 $498 $622 $679 $770 $893 $985 $5,099
Illustrative Equity ValuePropco Enterprise Value (@ 7.5% cap rate) $33,082 $32,155 $31,866 $32,153 $32,828 $33,813 $34,827Plus: Cash / GGMI / Dvlpmt Pipeline / MPC (4) 3,119 3,119 3,119 3,119 3,119 3,119 3,119 Less: Total Debt (EOP) (27,522) (27,024) (26,402) (25,723) (24,953) (24,060) (23,075)
Illustrative Equity Value $8,679 $8,251 $8,583 $9,548 $10,993 $12,871 $14,871Per Share $27.16 $25.82 $26.86 $29.88 $34.40 $40.28 $46.53
Illustrative Deleveraging Analysis: Prime [3.25%] + 0.75% for Secured; Prime + 1.50% for Unsecured
A plan that sets GGP’s secured debt and unsecured debt to Prime + 0.75% and Prime + 1.50%, respectively, would allow for substantial deleveraging and further increase the probability of a highly successful reorganization
________________________________________________(1) Assumes proceeds from ~$90mm sale of Bridgeland improve cash flow in 2009e. Aside from Bridgeland adjustment, cash flows based on 2009-2010 Cash Flow Forecast filed by the Company.(2) Represents annualized Q1’09 overhead expense. Adjusts for seasonality and $38mm of restructuring costs included in overhead line items. Ignores the potential for incremental cost saves.(3) Sets secured debt interest rate at Prime + 0.75% (4.00%) and unsecured debt interest rate at Prime + 1.50% (4.75%).(4) See valuation section for details.

50
GGP is not the exception – many REITs have the same problem
A liquidation will lead to a windfall for the secured creditors
It will destroy the GGP franchise
A liquidation will put downward pressure on real estate values impairing other borrowers’ ability to refinance
Nearly all REITs and other leveraged real estate owners will likely suffer the same fate if GGP is forced to liquidate
What’s the Alternative?
________________________________________________
Source: Green Street estimates (5/14/09).

Valuation
The Grand Canal Shoppes

Because creditors are not entitled to get more than 100% of their claim, valuation will play an important role in determining the extent to which GGP equity holders receive value in the bankruptcy process

53
Simon is the Best Comp for GGP REIT
Based on size, similarity of portfolio quality and relevant operating metrics, Simon represents the best comp for GGP
________________________________________________
Source: Green Street (May 14, 2009).
Note that ~20% of Simon’s GLA relates to the Mills portfolio. These properties have lower occupancy and rent per square foot than traditional regional malls and deserve a lower valuation than typical GGP assets
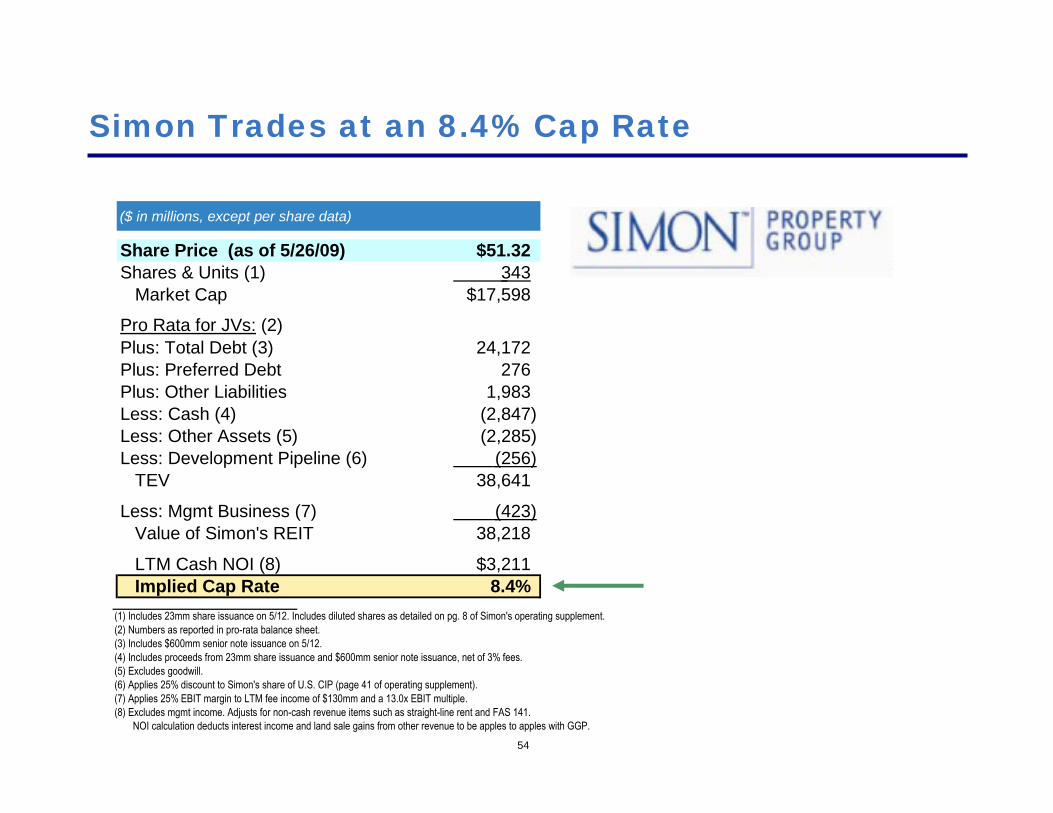
54
Simon Trades at an 8.4% Cap Rate
($ in millions, except per share data)
Share Price (as of 5/26/09) $51.32Shares & Units (1) 343
Market Cap $17,598
Pro Rata for JVs: (2)Plus: Total Debt (3) 24,172 Plus: Preferred Debt 276 Plus: Other Liabilities 1,983 Less: Cash (4) (2,847) Less: Other Assets (5) (2,285) Less: Development Pipeline (6) (256)
TEV 38,641
Less: Mgmt Business (7) (423) Value of Simon's REIT 38,218
LTM Cash NOI (8) $3,211Implied Cap Rate 8.4%
(1) Includes 23mm share issuance on 5/12. Includes diluted shares as detailed on pg. 8 of Simon's operating supplement. (2) Numbers as reported in pro-rata balance sheet.(3) Includes $600mm senior note issuance on 5/12.(4) Includes proceeds from 23mm share issuance and $600mm senior note issuance, net of 3% fees.(5) Excludes goodwill.(6) Applies 25% discount to Simon's share of U.S. CIP (page 41 of operating supplement).(7) Applies 25% EBIT margin to LTM fee income of $130mm and a 13.0x EBIT multiple.(8) Excludes mgmt income. Adjusts for non-cash revenue items such as straight-line rent and FAS 141.
NOI calculation deducts interest income and land sale gains from other revenue to be apples to apples with GGP.

55
Simon Debt Maturity Schedule
With ~$11bn of debt maturities coming due by 2012, we note that Simon has meaningful liquidity risk. We believe that Simon’s current valuation reflects a downward adjustment for liquidity risk and the likelihood of future equity dilution
________________________________________________
Source: Green Street (May 14, 2009).

56
Value of GGP REIT
Note that GGP’s 2006 Loan Agreement uses
a 6.75% Retail Cap Rate in its calculation of Capitalization Value for covenant purposes
($ in millions, except per share data) Low High
LTM Cash NOI (1) $2,524 $2,524Cap Rate 8.5% 7.5%
Implied Value of GGP's REIT $29,689 $33,647
Pro Rata for JVs: (2)Less: Total Debt (3) (28,174) (28,174) Less: Preferred Debt (121) (121) Less: Other Liabilities (4) (1,585) (1,585) Plus: Cash (5) 722 722 Plus: Other Assets (6) 1,777 1,777 Plus: Development Pipeline (7) 603 603
Implied Equity Value 2,911 6,870
Per Share $9.11 $21.50
Simon’s cap rate suggests the value of GGP REIT, not including GGMI and MPC, is somewhere between $9 and $22 per share.
(1) Excludes mgmt income. Adjusts for non-cash revenue items such as straight-line rent, FAS 141, and non- cash ground rent expense.(2) Applies 50% share to condensed balance sheet of unconsolidated real estate affiliates in 10-Q.(3) Includes $400mm DIP loan.(4) Excludes book value of deferred tax liabilities as these mostly relate to MPC. These are taken into account when valuing the MPC segment.(5) Includes $400mm DIP proceeds.(6) Excludes goodwill.(7) 40% discount to book value.
We believe the market assigns ≥100bp risk premium for Simon’s
refinancing risk
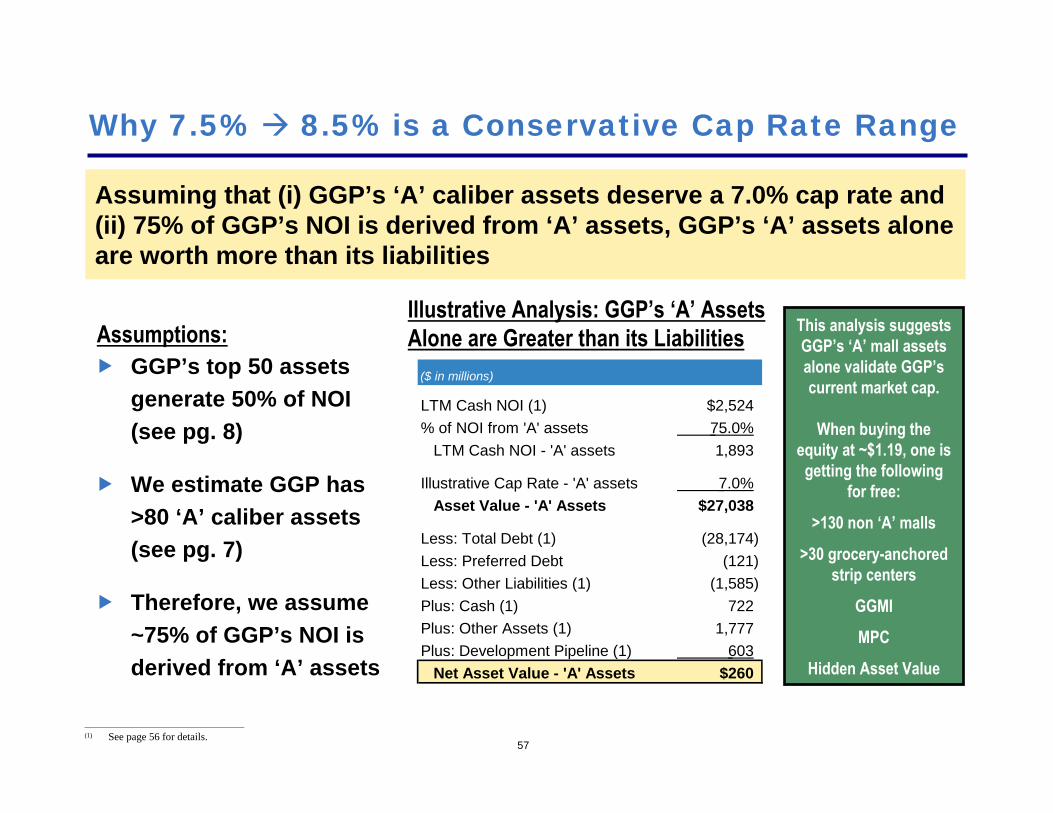
57
Why 7.5% 8.5% is a Conservative Cap Rate Range
Assuming that (i) GGP’s ‘A’ caliber assets deserve a 7.0% cap rate and (ii) 75% of GGP’s NOI is derived from ‘A’ assets, GGP’s ‘A’ assets alone are worth more than its liabilities
GGP’s top 50 assets generate 50% of NOI (see pg. 8)
We estimate GGP has >80 ‘A’ caliber assets(see pg. 7)
Therefore, we assume ~75% of GGP’s NOI is derived from ‘A’ assets
Assumptions:Illustrative Analysis: GGP’s ‘A’ AssetsAlone are Greater than its Liabilities
________________________________________________(1) See page 56 for details.
($ in millions)
LTM Cash NOI (1) $2,524% of NOI from 'A' assets 75.0%
LTM Cash NOI - 'A' assets 1,893
Illustrative Cap Rate - 'A' assets 7.0% Asset Value - 'A' Assets $27,038
Less: Total Debt (1) (28,174) Less: Preferred Debt (121) Less: Other Liabilities (1) (1,585) Plus: Cash (1) 722 Plus: Other Assets (1) 1,777 Plus: Development Pipeline (1) 603
Net Asset Value - 'A' Assets $260
This analysis suggests GGP’s ‘A’ mall assets alone validate GGP’scurrent market cap.
When buying the equity at ~$1.19, one is
getting the following for free:
>130 non ‘A’ malls
>30 grocery-anchored strip centers
GGMI
MPC
Hidden Asset Value

58
4.0%
5.0%
6.0%
7.0%
8.0%
9.0%
10.0%
Jan-86
Jan-87
Jan-88
Jan-89
Jan-90
Jan-91
Jan-92
Jan-93
Jan-94
Jan-95
Jan-96
Jan-97
Jan-98
Jan-99
Jan-00
Jan-01
Jan-02
Jan-03
Jan-04
Jan-05
Jan-06
Jan-07
Jan-08
Jan-09
Apartment Office Industrial Mall
Historical Mall Cap Rates
Since 1986, Malls have traded at an average cap rate of 7.6%, and this average was achieved in much higher long-term interest rate markets
Historical Cap Rate Across Various Property Types
________________________________________________
Source: Green Street. Cap rates are weighted by (% NOI from primary property type times market cap). Data from January, 1986 through February, 2009.
MallAverage:
7.6%

59
Value of GGMI
GGMI is one of the few national platforms capable of providing management and leasing services to regional retail centers.We estimate its value to be between $1 and $2 per share
CB Richard Ellis trades at
~15x NTM EBIT
________________________________________________(1) Pershing Square estimate.
($ in millions, except per share data)Low High
LTM Management Income & other fees $100 $100
EBIT Margin (1) 25.0% 35.0%
LTM EBIT $25 $35
Multiple 13.0x 17.0x
Value of GGMI $326 $596Per Share $1.02 $1.87
GGMI likely deserves a higher multiple given that CB Richard Ellis’s fee stream is more transaction driven
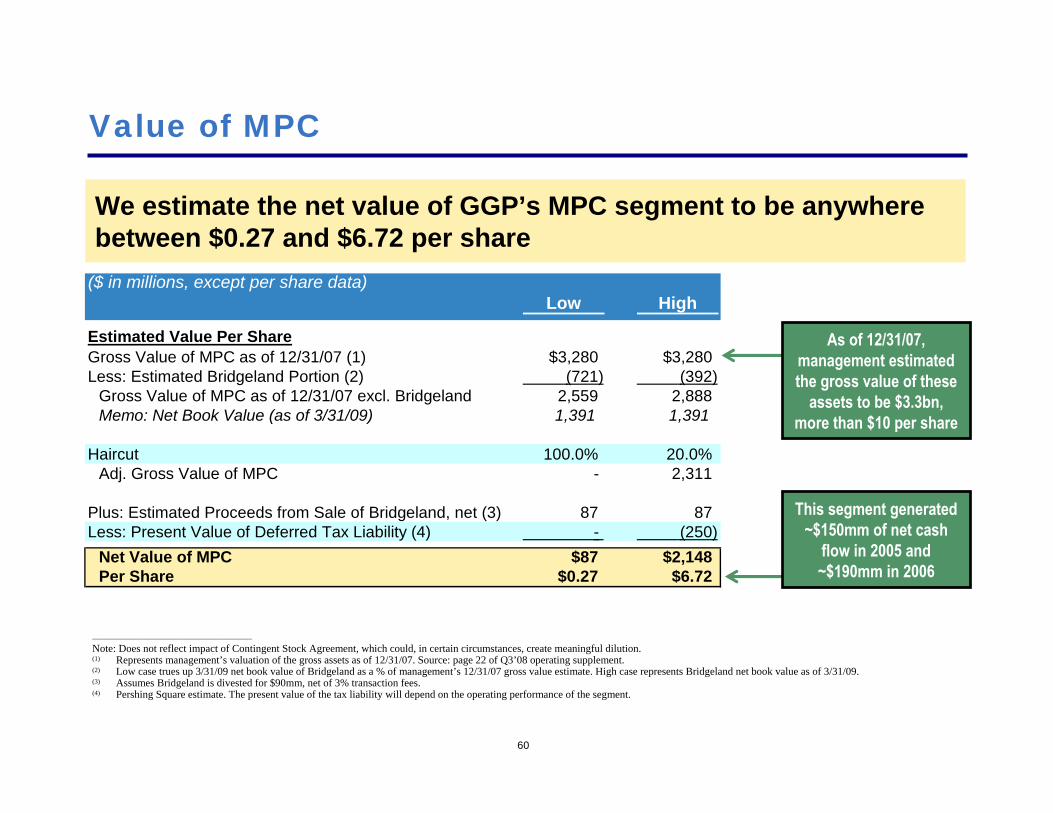
60
Value of MPC
We estimate the net value of GGP’s MPC segment to be anywhere between $0.27 and $6.72 per share
________________________________________________
Note: Does not reflect impact of Contingent Stock Agreement, which could, in certain circumstances, create meaningful dilution.(1) Represents management’s valuation of the gross assets as of 12/31/07. Source: page 22 of Q3’08 operating supplement.(2) Low case trues up 3/31/09 net book value of Bridgeland as a % of management’s 12/31/07 gross value estimate. High case represents Bridgeland net book value as of 3/31/09.(3) Assumes Bridgeland is divested for $90mm, net of 3% transaction fees.(4) Pershing Square estimate. The present value of the tax liability will depend on the operating performance of the segment.
As of 12/31/07, management estimated the gross value of these
assets to be $3.3bn, more than $10 per share
This segment generated ~$150mm of net cash
flow in 2005 and ~$190mm in 2006
($ in millions, except per share data)Low High
Estimated Value Per ShareGross Value of MPC as of 12/31/07 (1) $3,280 $3,280Less: Estimated Bridgeland Portion (2) (721) (392)
Gross Value of MPC as of 12/31/07 excl. Bridgeland 2,559 2,888Memo: Net Book Value (as of 3/31/09) 1,391 1,391
Haircut 100.0% 20.0%Adj. Gross Value of MPC - 2,311
Plus: Estimated Proceeds from Sale of Bridgeland, net (3) 87 87Less: Present Value of Deferred Tax Liability (4) - (250)
Net Value of MPC $87 $2,148Per Share $0.27 $6.72

61
Hidden Asset Value: Las Vegas
“Fashion Show is a little bit of a different situation. The income there continues to grow very significantly, well ahead of our comp NOI average, and we expect that to continue. There are other things that we've been telling people for years that we're trying to get done there, including getting a certain portion of the project land in the Northeast corner under control, where we might be able to do additional development of that site, given its highly lucrative location right on the strip. So we wanted that flexibility.”
–Bernie Freibaum, Former CFO of GGP, Q1’08 earnings transcript
GGP’s Las Vegas assets have option value as future development sites
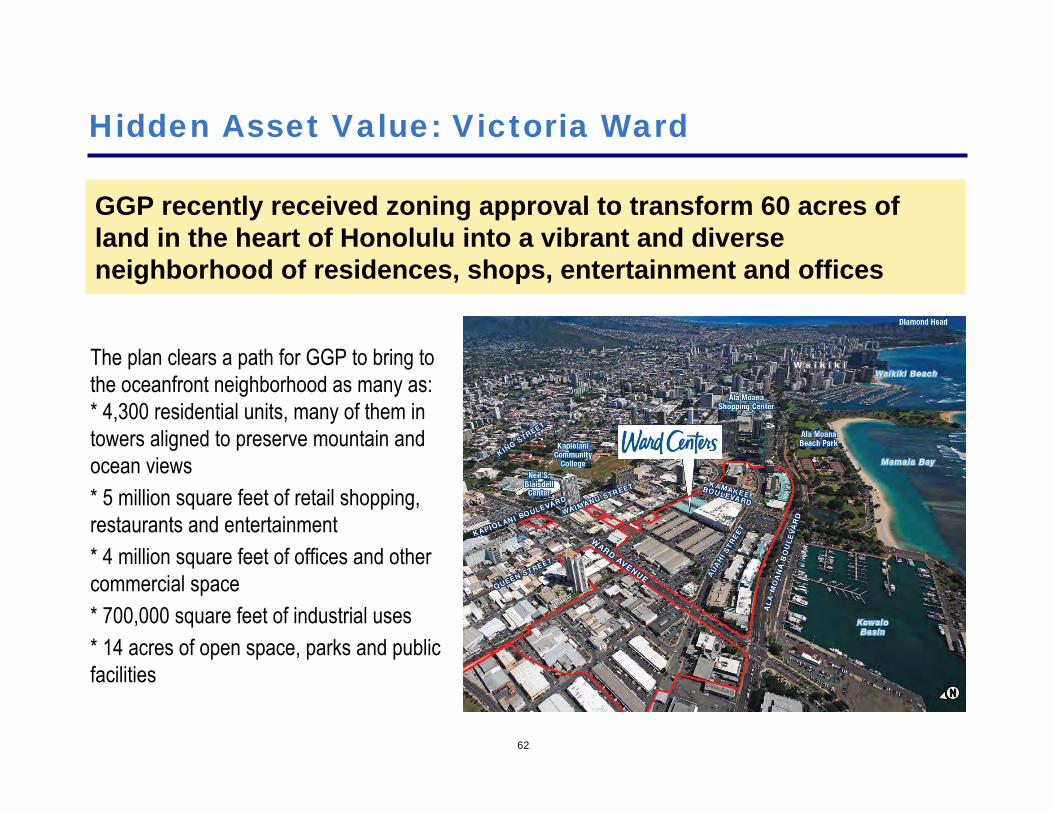
62
Hidden Asset Value: Victoria Ward
GGP recently received zoning approval to transform 60 acres of land in the heart of Honolulu into a vibrant and diverse neighborhood of residences, shops, entertainment and offices
The plan clears a path for GGP to bring to the oceanfront neighborhood as many as:* 4,300 residential units, many of them in towers aligned to preserve mountain and ocean views* 5 million square feet of retail shopping, restaurants and entertainment* 4 million square feet of offices and other commercial space* 700,000 square feet of industrial uses* 14 acres of open space, parks and public facilities

63
Hidden Asset Value: Park West
In 2007, GGP spent $105mm developing its Park West property in Peoria, AZ. Based on the recent photograph below, we estimate that this property has the potential to generate substantially more NOI. There are likely other properties like Park West that are currently under-earning in GGP’s portfolio

64
Hidden Asset Value: Non-Recourse Financing
Relative to other REITs, GGP’s capital structure consists of a high amount of non-recourse mortgage debt
The substantial majority of GGP’s ~$22bn of secured financing is non-recourse
GGP’s liabilities are one of its most valuable assets. Non-recourse debt gives the Company a put option at the mortgage amount on properties worth substantially less than their associated mortgage
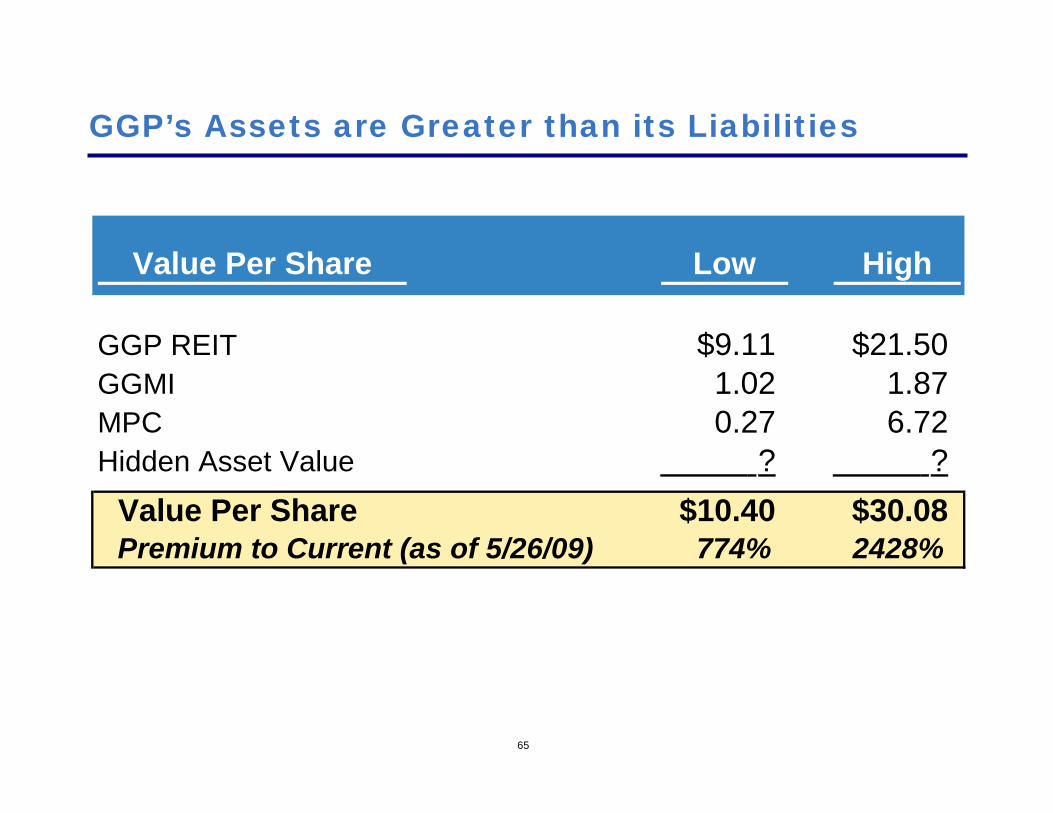
65
GGP’s Assets are Greater than its Liabilities
Value Per Share Low High
GGP REIT $9.11 $21.50GGMI 1.02 1.87 MPC 0.27 6.72 Hidden Asset Value ? ?
Value Per Share $10.40 $30.08Premium to Current (as of 5/26/09) 774% 2428%

66
What’s the Downside?
Using our most conservative assumptions, and assuming the conversion of all unsecured debt into equity at the cap rate implied by GGP equity’s current fair market value of $380mm, equity need only retain 5.5% of the post-reorganization company to break even at today’s stock price
Conservative Assumptions:
Cap rate of 9.4% based on the current market cap of $380mm
GGMI is worth $1.02 per share
MPC is worth $0.27 per share
No value assigned to hidden asset value opportunities
________________________________________________
Note: Current implied market cap based on $1.19 stock price as of 5/26/09.
Illustrative Stock Price at Various Cap Rates and Post-Reorganization Ownership Levels:
Does theCap Rate Unsecured
Ownership 7.5% 8.0% 8.5% 9.0% 9.4% 10.0% Convert?
5.5% $2.37 $2.01 $1.69 $1.41 $1.19 $0.93 Yes10.0% 4.34 3.68 3.10 2.58 2.18 1.71 Yes20.0% 8.68 7.36 6.20 5.17 4.36 3.42 Yes30.0% 13.02 11.04 9.30 7.75 6.54 5.12 Yes40.0% 17.36 14.73 12.40 10.34 8.72 6.83 Yes50.0% 21.70 18.41 15.51 12.92 10.90 8.54 Yes60.0% 26.04 22.09 18.61 15.51 13.08 10.25 Yes
100.0% 22.79 16.21 10.40 5.24 1.19 (3.53) No
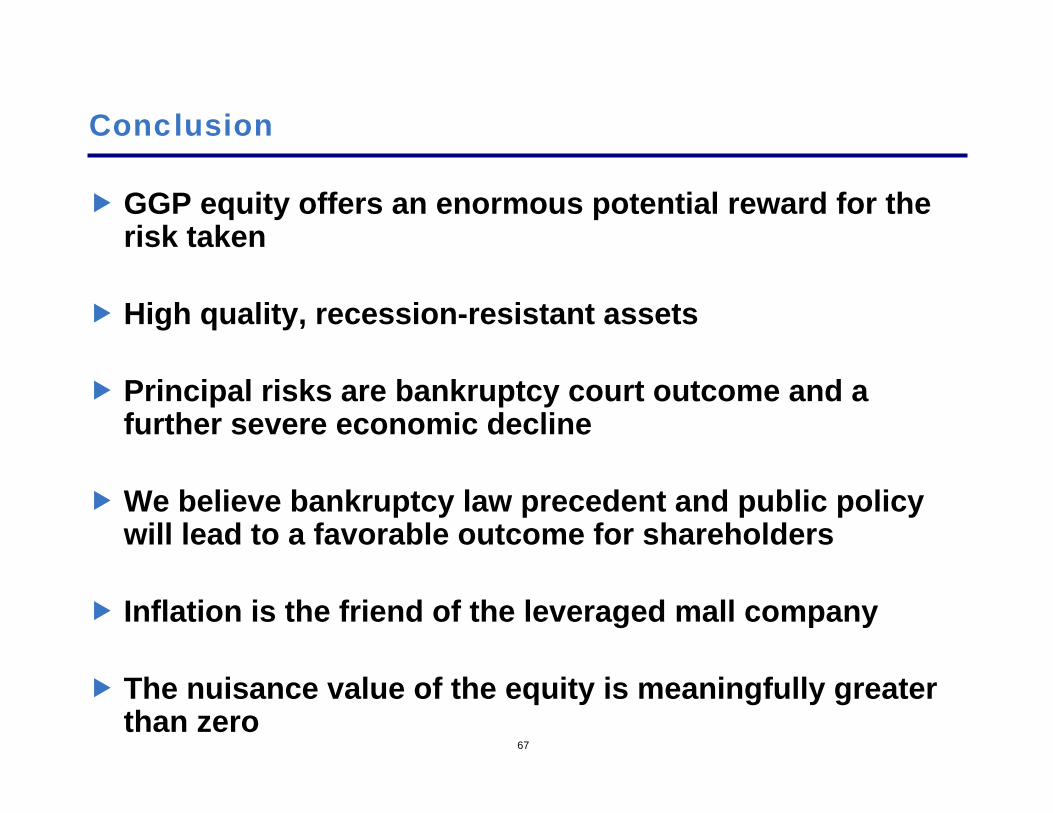
67
Conclusion
GGP equity offers an enormous potential reward for the risk taken
High quality, recession-resistant assets
Principal risks are bankruptcy court outcome and a further severe economic decline
We believe bankruptcy law precedent and public policy will lead to a favorable outcome for shareholders
Inflation is the friend of the leveraged mall company
The nuisance value of the equity is meaningfully greater than zero

“O” No!October 6, 2009
Pershing Square Capital Management, L.P.

DisclaimerThe analyses and conclusions of Pershing Square Capital Management, L.P. ("Pershing Square") contained in this presentation are based on publicly available information. Pershing Square recognizes that there may be confidential information in the possession of the companies discussed in the presentation that could lead these companies to disagree with Pershing Square’s conclusions. This presentation and the information contained herein is not a recommendation or solicitation to buy or sell any securities.
The analyses provided may include certain statements, estimates and projections prepared with respect to, among other things, the historical and anticipated operating performance of the companies, access to capital markets and the values of assets and liabilities. Such statements, estimates, and projections reflect various assumptions by Pershing Square concerning anticipated results that are inherently subject to significant economic, competitive, and other uncertainties and contingencies and have been included solely for illustrative purposes. No representations, express or implied, are made as to the accuracy or completeness of such statements, estimates or projections or with respect to any other materials herein. Actual results may vary materially from the estimates and projected results contained herein.
Funds managed by Pershing Square and its affiliates own investments in real estate investment trust including long investments (e.g., General Growth Properties, Inc.) as well as short investments (e.g., Realty Income Corporation). With respect to short investments, such investments may include, without limitation, credit-default swaps, equity put options and short sales of common stock.
Pershing Square manages funds that are in the business of trading - buying and selling – securities and financial instruments. It is possible that there will be developments in the future that cause Pershing Square to change its position regarding the companies discussed in this presentation. Pershing Square may buy, sell, cover or otherwise change the form of its investment regarding such companies for any or no reason. Pershing Square hereby disclaims any duty to provide any updates or changes to the analyses contained here including, without limitation, the manner or type of any Pershing Square investment.
1

We Are Short Realty Income
Realty Income (“O”) is a Triple-Net-Lease REIT Owns standalone retail properties which it triple-net-
leases to middle-market retailers
Provides sale / leaseback financing to below investment grade and unrated businesses
Capitalization: Enterprise value: $4.3 billion
Equity market value: $2.7 billion
Total Debt (and preferred) / Enterprise value: ~40%
Recent valuation multiples: ‘09E Cap rate: 7.3% (2)
Annualized current dividend yield: 6.8%
Ticker: “O”
Stock price: $25 (1)
2
1) Based on a five-day average price of $25.34 for the period 9/28/09 – 10/2/09.
2) Cap rate based on 2009E Cash NOI of $316mm.
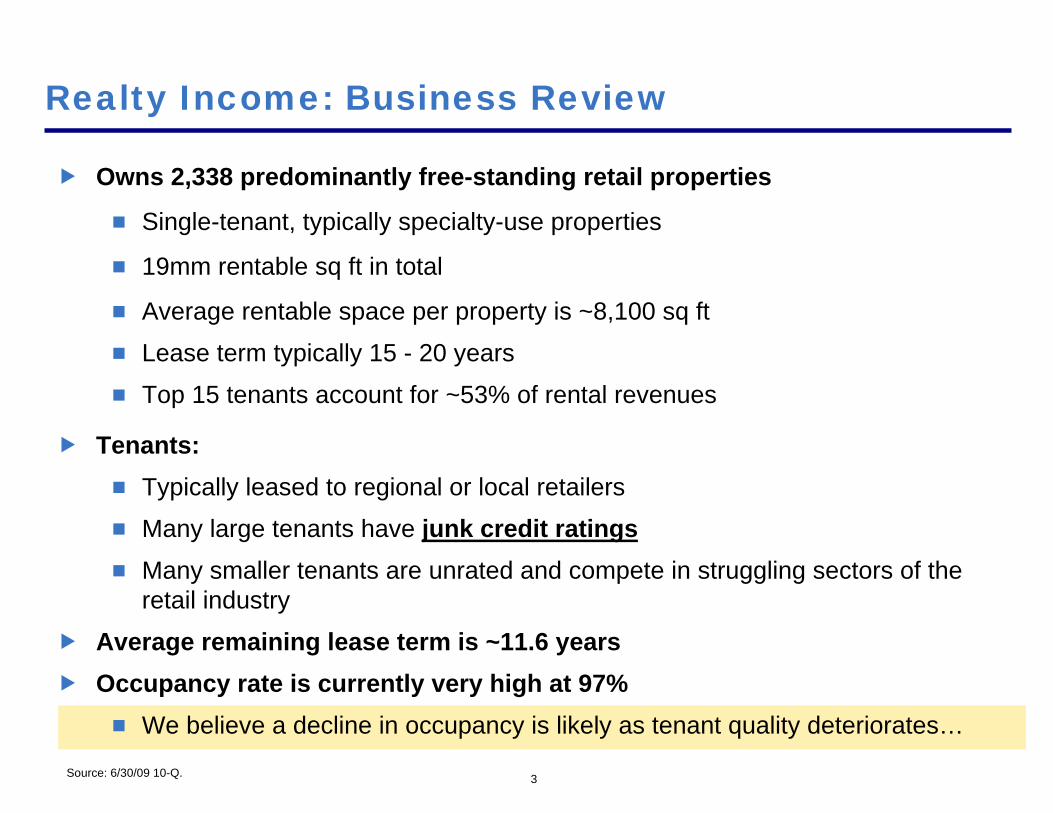
Realty Income: Business Review
Owns 2,338 predominantly free-standing retail properties
Single-tenant, typically specialty-use properties
19mm rentable sq ft in total
Average rentable space per property is ~8,100 sq ft
Lease term typically 15 - 20 years
Top 15 tenants account for ~53% of rental revenues
Tenants: Typically leased to regional or local retailers
Many large tenants have junk credit ratings Many smaller tenants are unrated and compete in struggling sectors of the
retail industry
Average remaining lease term is ~11.6 years Occupancy rate is currently very high at 97%
We believe a decline in occupancy is likely as tenant quality deteriorates…
3Source: 6/30/09 10-Q.

Realty Income: Specialty-Use Properties
Spring Hill, FLFormer Day Care Center5,371 sq ft
Wichita, KSFormer Restaurant3,129 sq ft
Alexandria, LAFormer Mexican Restaurant5,858 sq ft
Richmond, INFormer Audio / Video Store6,449 sq ft
Hurst, TXFormer Video Rental Store7,366 sq ft
Tucker, GAFormer Auto Repair Shop24,132 sq ft
Below are properties listed on Realty Income’s website(www.realtyincome.com) as for sale
4
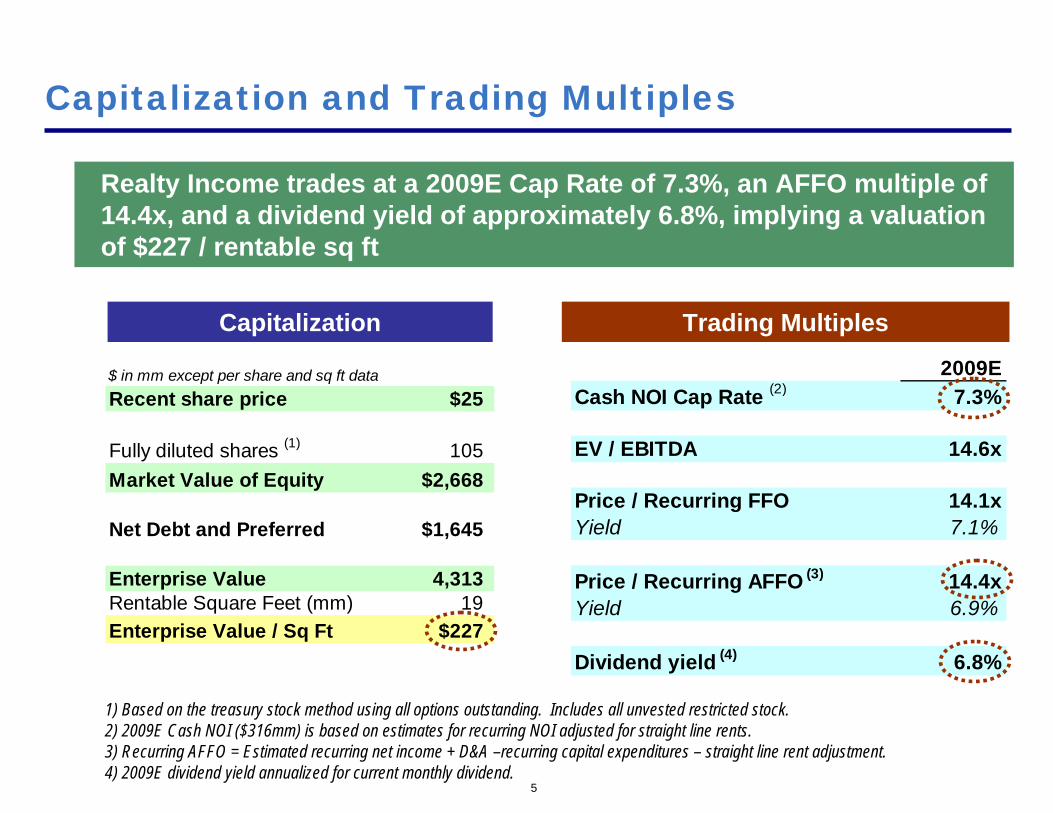
$ in mm except per share and sq ft dataRecent share price $25
Fully diluted shares (1) 105Market Value of Equity $2,668
Net Debt and Preferred $1,645
Enterprise Value 4,313Rentable Square Feet (mm) 19Enterprise Value / Sq Ft $227
2009ECash NOI Cap Rate (2) 7.3%
EV / EBITDA 14.6x
Price / Recurring FFO 14.1xYield 7.1%
Price / Recurring AFFO (3) 14.4xYield 6.9%
Dividend yield (4) 6.8%
Capitalization and Trading Multiples
5
Capitalization Trading Multiples
Realty Income trades at a 2009E Cap Rate of 7.3%, an AFFO multiple of 14.4x, and a dividend yield of approximately 6.8%, implying a valuation of $227 / rentable sq ft
1) Based on the treasury stock method using all options outstanding. Includes all unvested restricted stock.2) 2009E Cash NOI ($316mm) is based on estimates for recurring NOI adjusted for straight line rents.3) Recurring AFFO = Estimated recurring net income + D&A –recurring capital expenditures – straight line rent adjustment. 4) 2009E dividend yield annualized for current monthly dividend.

The “Monthly Dividend Company”
Realty Income pays a dividend every month. It aggressively markets itself to retail investors as the “Monthly Dividend Company.”
6
Realty Income’s stated business purpose is to maintain and grow its monthly dividend…
7
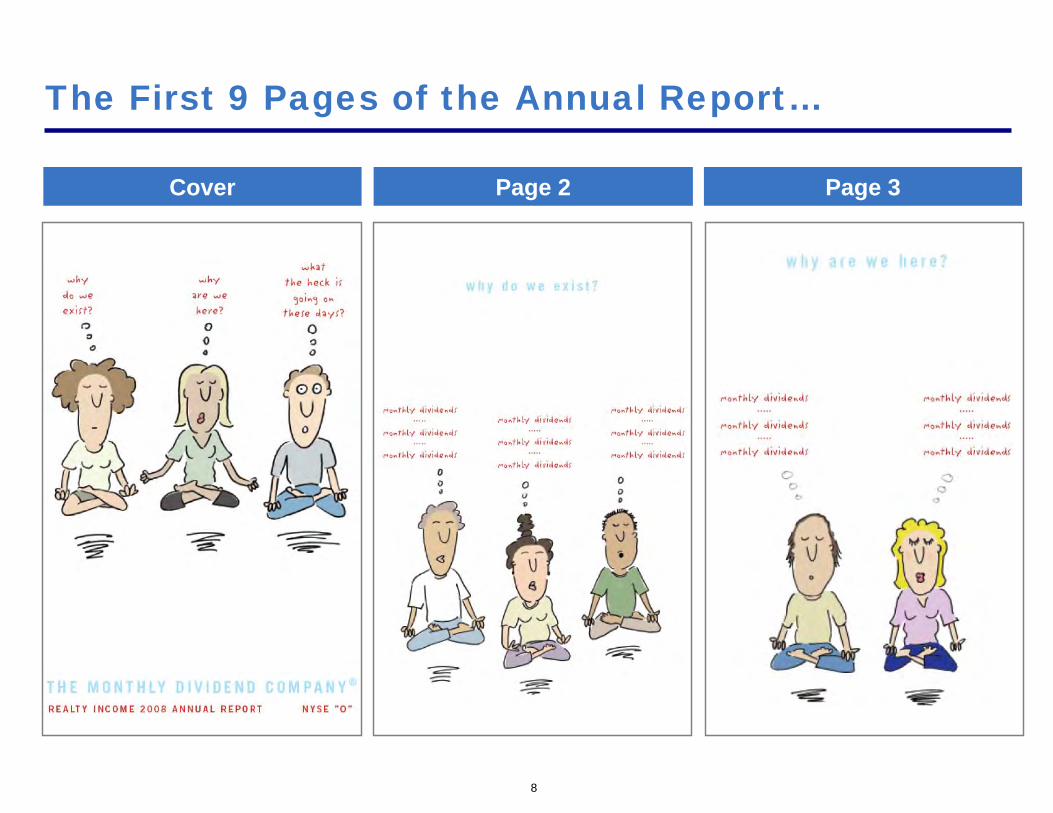
The First 9 Pages of the Annual Report…
Cover Page 2 Page 3
8

First 9 Pages of the Annual Report (Cont’d)…
Page 4 Page 5 Page 6
9
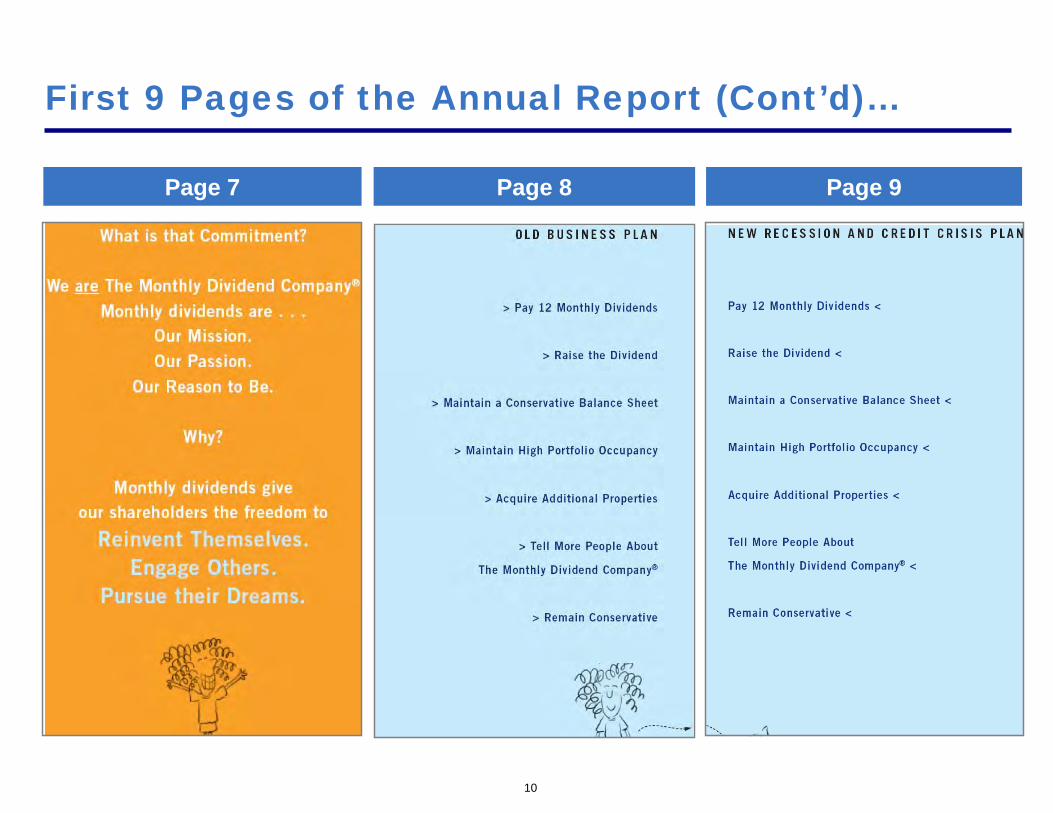
First 9 Pages of the Annual Report (Cont’d)…
Page 7 Page 8 Page 9
10

Short Thesis: Investment Highlights
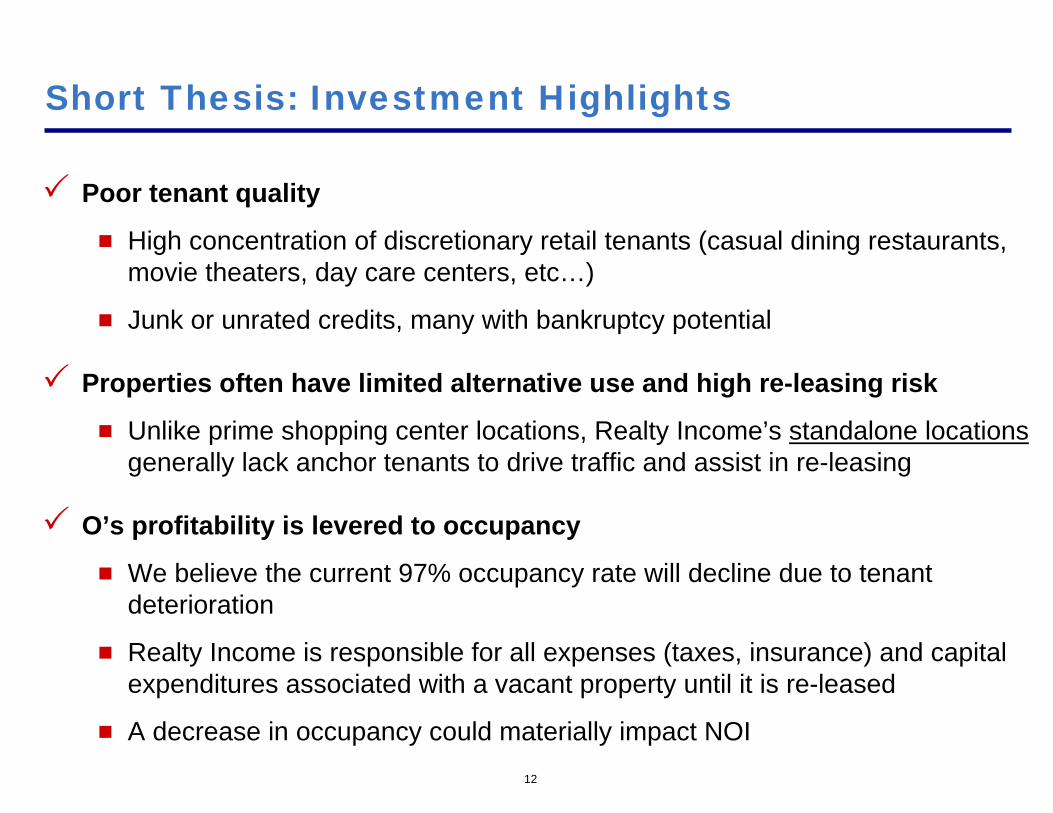
Short Thesis: Investment Highlights
Poor tenant quality
High concentration of discretionary retail tenants (casual dining restaurants, movie theaters, day care centers, etc…)
Junk or unrated credits, many with bankruptcy potential
Properties often have limited alternative use and high re-leasing risk
Unlike prime shopping center locations, Realty Income’s standalone locationsgenerally lack anchor tenants to drive traffic and assist in re-leasing
O’s profitability is levered to occupancy
We believe the current 97% occupancy rate will decline due to tenant deterioration
Realty Income is responsible for all expenses (taxes, insurance) and capital expenditures associated with a vacant property until it is re-leased
A decrease in occupancy could materially impact NOI12

Balance sheet assets doubled from 1/1/05 – 12/31/07 O was a leveraged lender to private equity during the real estate and credit
bubbles
Dividend coverage is minimal If O misses its dividend, the Company’s reason for being is in question
O trades at a substantial–and we believe unjustified–premium to private market valuations Asking prices for properties similar to O’s are at a 10%-11% cap rate We don’t believe that O shareholders are being paid appropriately for tenant risk
We believe that the “monthly dividend” marketing tactic has created demand for O stock from retail investors who may not value the company appropriately
At a 9.5% Cap Rate and a 7.5% decline in NOI, Realty Income would have a stock price of ~$14 (down ~46%)
Investment Highlights (cont’d)
13

Tenants: O Does Not Disclose Its Tenants
14
Unlike many other REITs, Realty Income does not disclose its tenants Simon Property Group, for example, discloses tenants representing as little
as 0.2% of its minimum rental income
Limited transparency as to: Names of tenants
Credit of tenants
Average credit rating of total tenant pool
Individual tenant contribution to revenue
Analysts and investors have asked for more tenant disclosure, but the Company has refused
QUESTION: Why?
ANSWER: We believe that O’s tenant quality is poor and the company is concerned about the impact of transparency on its stock price

Tenants: O Does Not Disclose Its Tenants
Analyst: “I was just wondering if the RV dealer, Camping World, that's at that 1.2 times, 1.22 times [EBITDAR-to-rent coverage] at the low end, if they're one of the ones that only discloses annually? I was just surprised to see that that 1.22 didn't move.”
Company Representative: “Right. We do not discuss the individual business of tenants, so I wouldn't comment to that.”
Analyst: “Okay.”
Company Representative: “And we never referred to them as that tenant.”
Analyst: “The other thing is Rite Aid announced that they're seeking rent relief on 500 stores earlier this quarter -- or I guess in the second quarter. Of the 24 Rite Aids that are in your portfolio, do you have any exposure? I mean it's obviously not their whole -- their entire store base. It's just a fraction of their system. I'm just wondering if you have any exposure to that.”
Company Representative: “Yes, it's not our policy to comment on our individual tenants and what they're doing. We could sit here all day. We have 118 tenants. And a lot of times on these calls, people get mentioned who aren't our tenants, so that's the policy we'll maintain.”
Q1 2009 Earnings Call Q2 2009 Earnings Call
15

Tenants: Discretionary Consumer Risk
16
Although Realty Income does not disclose its tenants, it provides tenant industry information
Realty Income As ofTenant Industries 6/30/09Restaurants 21%
Convenience stores 17%
Theaters 9%
Child care 8%
Automotive tire services 7%
Health and fitness 6%
Automotive service 5%
Drug stores 4%
Motor vehicle dealerships 3%
Sporting goods 2%
Home improvement 2%
Other 16%
Total 100%
The vast majority of its tenants are discretionary, regional retailers
Nearly 40% are restaurants (predominantly casual dining restaurants) and convenience stores
Source: 6/30/09 10-Q

Largest Tenants Are Poor Credits
17
Sources for tenants: Compiled using Wall Street Research, O’s filings, O’s website, various press reports and O’s earnings conference calls.1) Source: Moody’s, April 2009. Based on Moody’s estimates post emergence from bankruptcy.2) Source: Company filings, LTM ended June 2009. Capitalized operating rents calculated at 8x rent expense.3) Based on Learning Care Group (parent company) S&P corporate ratings, leverage estimate for LTM ended June 2009.4) Source: S&P, leverage estimate for LTM ended June 2009.5) Source: Moody’s, leverage estimate for LTM ended June 2009.6) Based on Citi sell-side report entitled, “Realty Income Corp (O): Non-Investment Grade Tenant Credit Weakness and Margin Pressure Add Risk,” dated 8/1/08.
We list below some of Realty Income’s largest tenants that we have been able to identify. They are all junk credits with high leverage
Estimated ~20% of Realty
Income’srevenues (6)
Tenant
Description
Credit Rating
Commentary
Buffets (owns Ryan’s Grill Buffet Bakery)
Casual dining / steak-buffet restaurants
Junk: Caa1 Adj. Debt / EBITDAR: 6.5x (1)
Emerged from bankruptcy in 2009
Pantry Regional convenience store operator (Southeast US)
Junk: B+ Adj. Debt / EBITDAR: 5.0x (2)
Bonds trade at 9.75% yield
La Petite Academy (Learning Care Group)
Day care operator Junk: B- Adj. Debt/ EBITDAR: 7.4x (3) Morgan Stanley
Private Equity LBO
Kerasotes Showplace Theatres
Movie theatre chain Junk: B- Adj. Debt/ EBITDAR: 5.9x (4)
Knowledge Learning Corp. (Children’s World)
Day care operator Junk: B1 Adj. Debt/ EBITDAR: 4.7x (5)

Other Major Tenants Are Also a Major Concern…
18
Source for Adj. Debt / EBITDAR: Company filings (capitalized operating rents calculated at 8x rent expense) and recent credit rating agency reports.Sources for tenants: Compiled using Wall Street Research, O filings, O’s website, various press reports and O’s earnings conference calls.1) We define a major tenant as renting 10 or more Realty Income properties OR involved in a sale/leaseback transaction with O for $30m or greater.
Other major tenants are mostly regional discretionary retailers, including several 2005-2007 vintage LBOs. Some tenants have already filed Chapter 11 and we believe many could be forced to liquidate
Realty Income major
tenants(1)
Listed in no particular order Tenant
Description
Leverage / Commentary
NPC International Casual dining restaurants
Largest Pizza Hut franchisee
Adj. Debt / EBITDAR: 5.7x
Merrill Lynch PE LBO (2006)
Midas Retail automotive services
Adj. Debt/ EBITDAR: 5.8x
Big 10 Tires Tire retailer Filed for Chapter 11 (4/2/09)
Friendly’s Casual dining / ice cream distributor
Sun Capital LBO (2007)
Rite Aid Drug store chain Adj. Debt/ EBITDAR: 9.6x
Bonds trade between 10 - 13%+ yield
Pier 1 Imports Specialty retailer of home furnishings
LTM EBITDA is negative
Sports Authority Specialty apparel retailer
Leonard Green LBO (2006)
Mezz. Loan implied yield of ~18%
Circle K Convenience store operator
O provided $100.5m of sale-leaseback financing for Alimentation Couche-Tard acquisition of Circle K

If a Tenant Files for Bankruptcy…
Tenant bankruptcy filings raise a number of issues:
Tenants in Chapter 11 could choose to reject their lease(s)
Vacant properties have re-leasing risk, typically require significant capital investment and brokerage commissions, and may be re-leased at materially lower rents
Tenants armed with market and/or bankruptcy leverage will likely seek to renegotiate rents
19

Balance Sheet Doubled from 1/1/05 – 12/31/07
20
$500
$1,000
$1,500
$2,000
$2,500
$3,000
$3,500
1998 1999 2000 2001 2002 2003 2004 2005 2006 2007 2008
Realty Income Total Assets
During the peak of the real estate and credit bubbles, Realty Income’s assets more than doubled from $1.4bn to $3.1bn as the company became a financing source for LBOs and corporate M&A
1/1/05
–12/3
1/07
Cred
it Bub
ble Realty Income provided financing for the following LBOs:
Note: Realty Income entered into a sale/leaseback transaction with Friendly’s in October 2007, shortly after the August 2007 LBO of Friendly’s by Sun Capital.
$1.4bn
$3.1bn
Year Financing Amount
Transaction
LBO Firm
2006 $350mm $860mm LBO of Ryan’s Restaurants (acquired by Buffets)
Caxton-Iseman Capital (owner of Buffets)
2007 Undisclosed amount Sale/LB for 160 restaurants
~$340mm LBO of Friendly’s Restaurants
Sun Capital

Decline in Recurring 2009E NOI (1)
0.0% -2.5% -5.0% -7.5% -10.0%
Recurring AFFO/share (2) $1.76 $1.76 $1.68 $1.61 $1.53 $1.46
Current annualized dividend $1.71 $1.71 $1.71 $1.71 $1.71
Dividend coverage 103% 98% 94% 89% 85%
Required Dividend Decrease NA -2% -6% -11% -15%
Dividend Coverage is Minimal
21
Dividend coverage is minimal. Small declines in NOI will stress the company’s ability to maintain its dividend
Minimal roomfor error
1) Calculation of AFFO assumes $21mm of G&A expenses, $3mm of capex and straight line rent adjustments, and $86mm of interest expense.2) Recurring AFFO = Recurring Net Income + D&A – Cap Ex – straight line rent adjustment.

What Could Happen If…?
Despite having no debt maturities until 2013, Realty Income could face significant problems if its tenants continue to go bankrupt Even a small decline in NOI could prevent the company from funding
its current dividend from operating cash flow
Liquidity from O’s current revolver may be at risk if there are sufficient asset writedowns or sufficient reductions in FFO(1) (2)
Asset writedowns could be caused by tenant bankruptcies and / or declines in real estate values
Current cash on hand represents only about 2.5 months of dividends
O may need to reduce its cash dividend which we expect would adversely impact its stock price Many retail shareholders own the stock for its monthly dividend
We believe that O’s stock price depends on its ability to maintain its monthly dividend
22
1) Dividends and Other Restricted Payments covenant: Per the Credit Agreement (5/15/08), quarterly dividends and share repurchases may not exceed 95% of FFO plus preferred dividends for each of the trailing four quarters.2) Minimum Tangible Net Worth covenant: Per the Credit Agreement (5/15/08), we estimate that O must maintain a Tangible Net Worth of ~$1.3bn and that Tangible Net Worth is currently ~$1.6bn (as of 6/30/09) implying that O has an approximate $0.3bn cushion under that credit facility. O’s Net PPE is approximately $2.8bn.
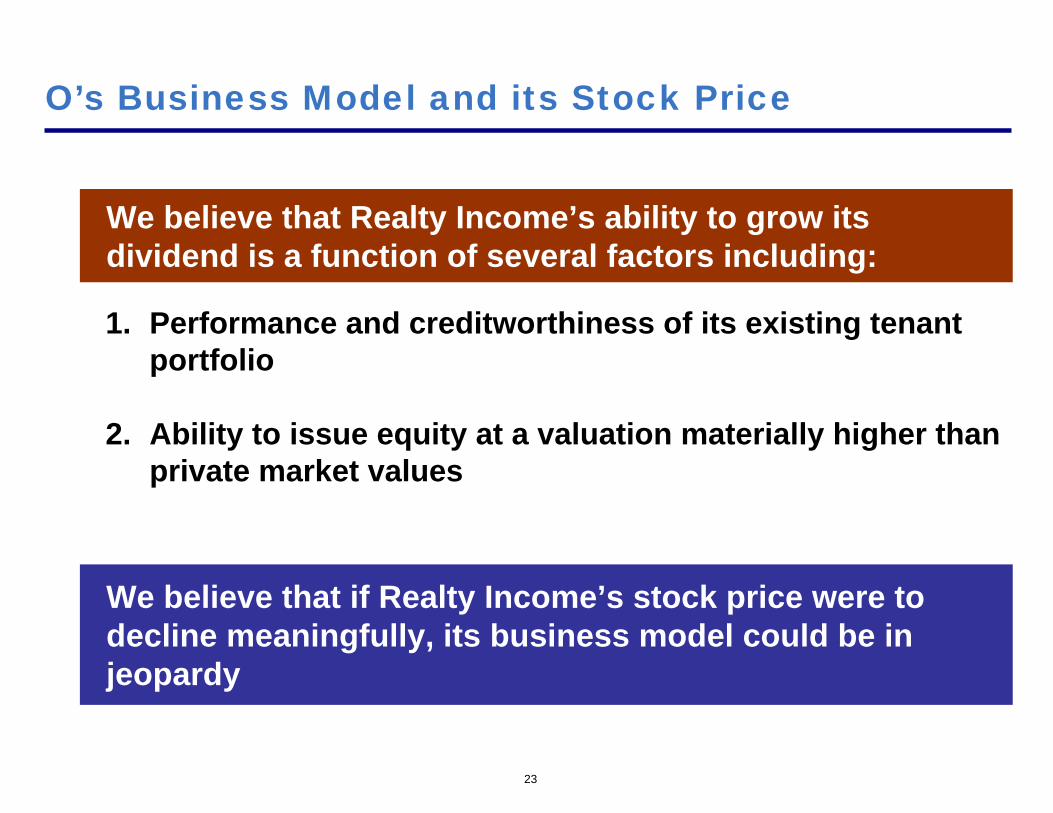
O’s Business Model and its Stock Price
1. Performance and creditworthiness of its existing tenant portfolio
2. Ability to issue equity at a valuation materially higher than private market values
We believe that Realty Income’s ability to grow its dividend is a function of several factors including:
We believe that if Realty Income’s stock price were to decline meaningfully, its business model could be in jeopardy
23

Equity Offerings: “Ceiling on Valuation”
24
Since 2005, Realty Income has issued equity to the public five times at an average price of $25 and at ranges from $23.79 - $26.82
Average price of equity
offerings: $25.15
Given O’s recent stock price of ~$25, we would not be surprised if Realty Income issues equity soon, based on this history
Denotes equity offering
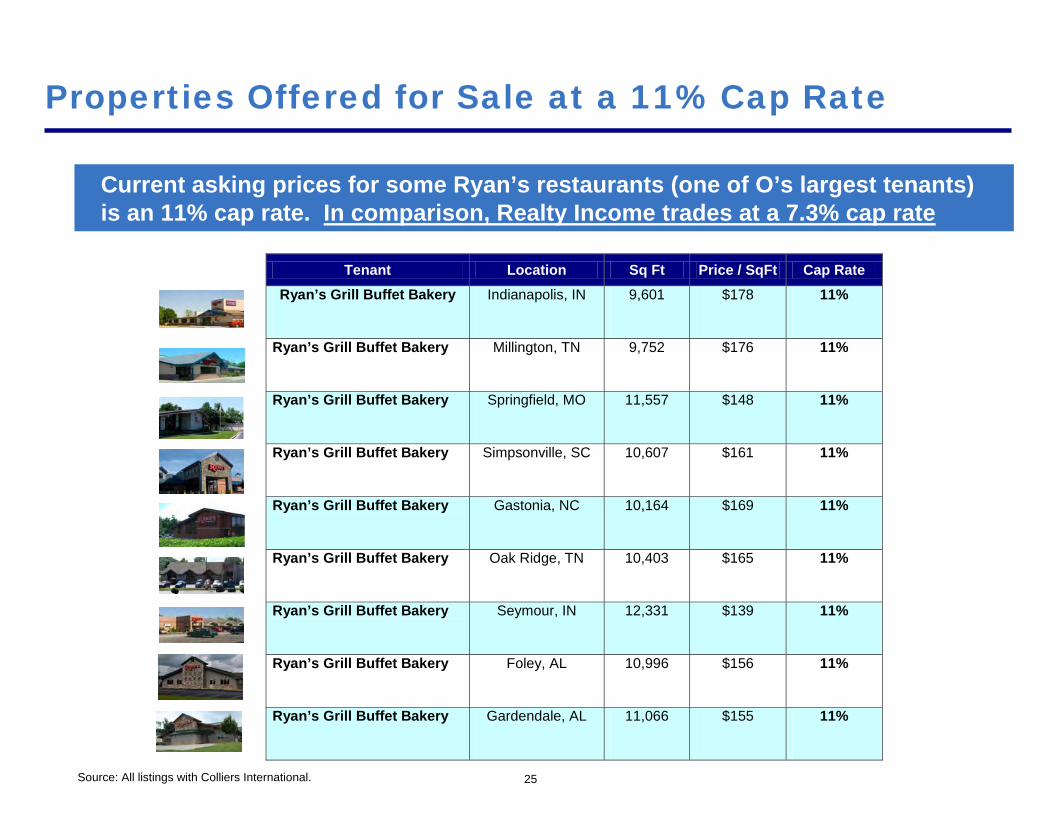
Properties Offered for Sale at a 11% Cap Rate
25
Current asking prices for some Ryan’s restaurants (one of O’s largest tenants) is an 11% cap rate. In comparison, Realty Income trades at a 7.3% cap rate
Source: All listings with Colliers International.
Tenant Location Sq Ft Price / SqFt Cap Rate Ryan’s Grill Buffet Bakery Indianapolis, IN 9,601 $178 11%
Ryan’s Grill Buffet Bakery Millington, TN 9,752 $176 11%
Ryan’s Grill Buffet Bakery Springfield, MO 11,557 $148 11%
Ryan’s Grill Buffet Bakery Simpsonville, SC 10,607 $161 11%
Ryan’s Grill Buffet Bakery Gastonia, NC 10,164 $169 11%
Ryan’s Grill Buffet Bakery Oak Ridge, TN 10,403 $165 11%
Ryan’s Grill Buffet Bakery Seymour, IN 12,331 $139 11%
Ryan’s Grill Buffet Bakery Foley, AL 10,996 $156 11%
Ryan’s Grill Buffet Bakery Gardendale, AL 11,066 $155 11%
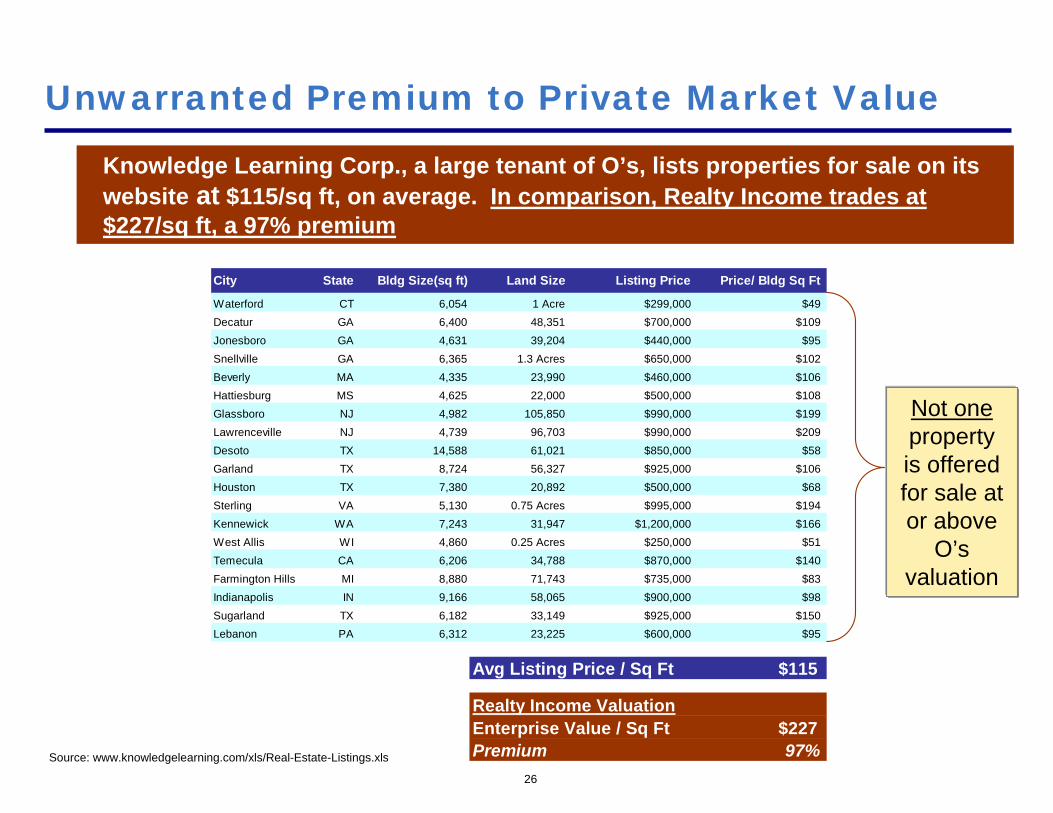
Unwarranted Premium to Private Market Value
Knowledge Learning Corp., a large tenant of O’s, lists properties for sale on its website at $115/sq ft, on average. In comparison, Realty Income trades at $227/sq ft, a 97% premium
Not oneproperty is offered for sale at or above
O’s valuation
26
Source: www.knowledgelearning.com/xls/Real-Estate-Listings.xls
City State Bldg Size(sq ft) Land Size Listing Price Price/ Bldg Sq Ft
Waterford CT 6,054 1 Acre $299,000 $49Decatur GA 6,400 48,351 $700,000 $109Jonesboro GA 4,631 39,204 $440,000 $95Snellville GA 6,365 1.3 Acres $650,000 $102Beverly MA 4,335 23,990 $460,000 $106Hattiesburg MS 4,625 22,000 $500,000 $108Glassboro NJ 4,982 105,850 $990,000 $199Lawrenceville NJ 4,739 96,703 $990,000 $209Desoto TX 14,588 61,021 $850,000 $58Garland TX 8,724 56,327 $925,000 $106Houston TX 7,380 20,892 $500,000 $68Sterling VA 5,130 0.75 Acres $995,000 $194Kennewick WA 7,243 31,947 $1,200,000 $166West Allis WI 4,860 0.25 Acres $250,000 $51Temecula CA 6,206 34,788 $870,000 $140Farmington Hills MI 8,880 71,743 $735,000 $83Indianapolis IN 9,166 58,065 $900,000 $98Sugarland TX 6,182 33,149 $925,000 $150Lebanon PA 6,312 23,225 $600,000 $95
Avg Listing Price / Sq Ft $115
Realty Income ValuationEnterprise Value / Sq Ft $227Premium 97%

Management’s View on Private Market Valuations
27
“In talking about cap rates -- I mentioned this last quarter, but I think it really is worthwhile saying -- and that is if you look back on the 40 years that we've been doing this and kind of follow cap rates, from 2005 to 2008, we were buying kind of in the 8.4% to 8.7% cap rate range, and in those years bought about $1.5 billion worth of property. And I'd probably estimate that we were 75 to 100 basis points in cap rate above where the one-off market was, which was really a function of buying in bulk and you get a better price and a better cap rate.”
“From 2003 to 2004, the caps were around 9.5, and if you go back to when we went public in '94 and take it to 2003, I went back and looked, and the cap rates from during that period were always between 10 and 11. And then going back and looking at transactions going all the way back before '94, cap rates were pretty much always up 11% or so.”
“So I really think that kind of the 7 and 8 caps that you saw at retail and even some of the 9 caps on the institutional transaction, like a lot of assets in many different areas, were a function of the abundant and cheap financing that was out there, and it shouldn't be too surprising to see cap rates moving up again.”
--Tom Lewis, Realty Income, CEO
Q2 2009 Conference Call

If private market cap rates today for Realty Income-type properties are between 10% - 11%, then why should Realty Income trade at a 7.3% cap rate?
Why is a ~40% premium to NAV justified?
28

RE Index Versus Realty Income Since 1/1/2008
29
Despite its tenant exposure, Realty income has outperformed the U.S. real estate index (1) by ~35% since January 1, 2008
1) As measured by iShares Dow Jones Real Estate Index Fund
Insider Ownership and Selling
30
Realty Income does not foster an ownership culture
Despite restricted stock grants, insiders own less than 1.5% of the company
The top three executives (CEO, COO, CFO) own less than 1% of the company despite having an average tenure at the company of 18 years
CEO, COO and CFO have not made an open market stock purchase in over six years
Material insider selling
On August 3, 2009, CEO Tom Lewis sold ~20% of his holdings at $23.69, below today’s stock price
On the same day, COO Gary Malino sold ~9% of his holdings
Insider Ownership and Selling
31
Are Insiders and Shareholders playing on an even field?
Why should Management be permitted to sell stock knowing the identity of all tenants and their creditworthiness while shareholders are kept in the dark?
We believe that the SEC should immediately require Realty Income to disclose to all shareholders a list of its tenants andfinancial information sufficient to assess their creditworthiness
We believe that there is no competitive or other business reasonwhy Realty Income should not be required to do so

“Short” Sensitivity Analysis
Stock price return (from $25) at various cap rates and decline rates in 2009E Cash NOI
Stock price at various cap rates and decline rates in 2009E Cash NOI
Cap
rate
Cap
rate
32
Assuming 2009E recurring Cash NOI of $316mm, if NOI drops only 5% to 10% and O’s cap rate increases to 9.5% to 10.5%, Realty Income’s stock price could decline ~43% to ~60% from recent prices
Decline in 2009E Cash NOI$17.93 -2.5% -5.0% -7.5% -10.0% -12.5%
8.5% $19 $18 $17 $16 $159.0% $17 $16 $15 $14 $149.5% $15 $14 $14 $13 $12
10.0% $14 $13 $12 $11 $1110.5% $12 $12 $11 $10 $911.0% $11 $10 $10 $9 $8
Decline in 2009E Cash NOI-2.5% -5.0% -7.5% -10.0% -12.5%
8.5% -26% -29% -33% -36% -40%9.0% -33% -37% -40% -43% -46%9.5% -40% -43% -46% -49% -53%
10.0% -46% -49% -52% -55% -58%10.5% -52% -54% -57% -60% -63%11.0% -57% -59% -62% -65% -67%
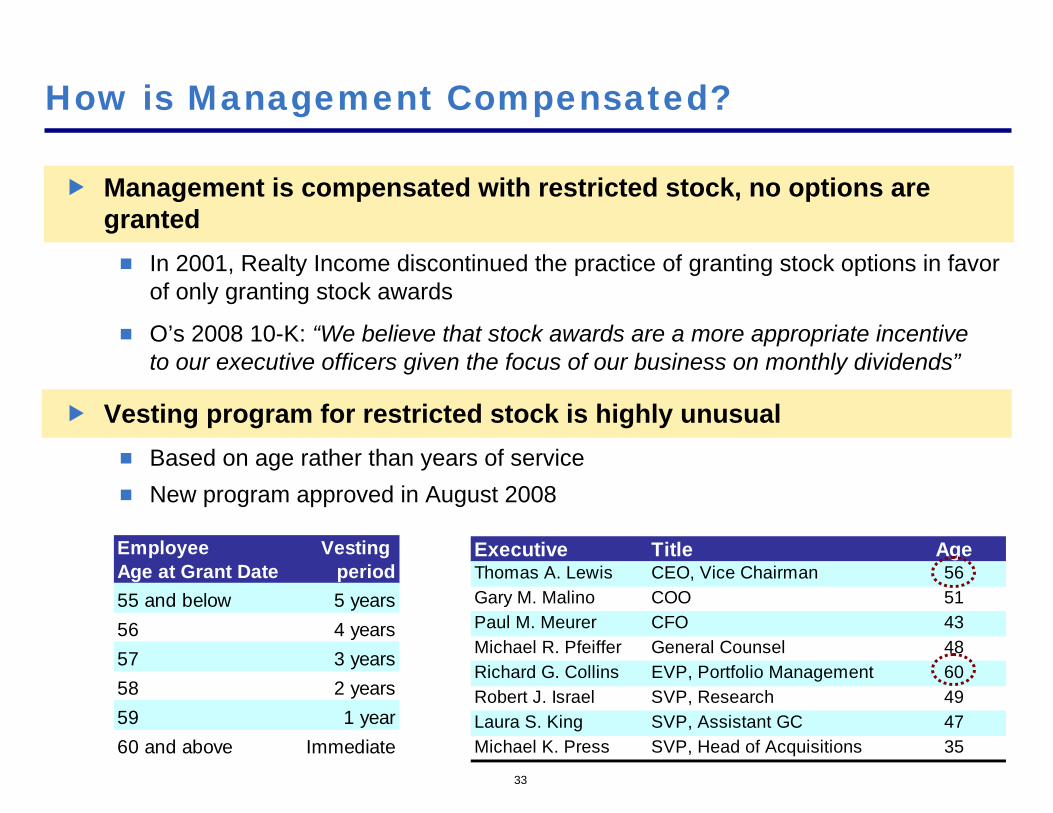
Management is compensated with restricted stock, no options are granted In 2001, Realty Income discontinued the practice of granting stock options in favor
of only granting stock awards
O’s 2008 10-K: “We believe that stock awards are a more appropriate incentive to our executive officers given the focus of our business on monthly dividends”
Vesting program for restricted stock is highly unusual Based on age rather than years of service New program approved in August 2008
Executive Title AgeThomas A. Lewis CEO, Vice Chairman 56Gary M. Malino COO 51Paul M. Meurer CFO 43Michael R. Pfeiffer General Counsel 48Richard G. Collins EVP, Portfolio Management 60Robert J. Israel SVP, Research 49Laura S. King SVP, Assistant GC 47Michael K. Press SVP, Head of Acquisitions 35
How is Management Compensated?
33
Employee Vesting Age at Grant Date period55 and below 5 years56 4 years57 3 years58 2 years59 1 year60 and above Immediate

Conclusion
We believe that Realty Income’s current shareholders are not being sufficiently compensated for the company’s tenant risk Shareholders and investors should demand transparency from O’s management
regarding its tenants
If tenant deterioration continues… Realty Income’s cash flow may not be sufficient to pay its current dividend
We believe that the SEC should require Reality Income to disclose its tenants because without this information it is nearly impossible to value the company and its associated risks
At $25 and a 7.3% cap rate, we believe there is little downside to the short ~40% premium to current private market valuations
Company has historically issued stock at these levels
“Ceiling on valuation”
34

Prisons’ Dilemma
October 20, 2009
Pershing Square Capital Management, L.P.

Disclaimer
The analyses and conclusions of Pershing Square Capital Management, L.P. ("Pershing Square") contained in this presentation are based on publicly available information. Pershing Square recognizes that there may be confidential information in the possession of the companies discussed in the presentation that could lead these companies to disagree with Pershing Square’s conclusions. This presentation and the information contained herein is not a recommendation or solicitation to buy or sell any securities.
The analyses provided may include certain statements, estimates and projections prepared with respect to, among other things, the historical and anticipated operating performance of the companies, access to capital markets and the values of assets and liabilities. Such statements, estimates, and projections reflect various assumptions by Pershing Square concerning anticipated results that are inherently subject to significant economic, competitive, and other uncertainties and contingencies and have been included solely for illustrative purposes. No representations, express or implied, are made as to the accuracy or completeness of such statements, estimates or projections or with respect to any other materials herein. Actual results may vary materially from the estimates and projected results contained herein.
Funds managed by Pershing Square and its affiliates have invested in common stock and total return swaps on Corrections Corporation of America (“CXW”). Pershing Square manages funds that are in the business of trading – buying and selling – securities and financial instruments. It is possible that there will be developments in the future that cause Pershing Square to change its position regarding CXW. Pershing Square may buy, sell, cover or otherwise change the form of its investment in CXW for any reason. Pershing Square hereby disclaims any duty to provide any updates or changes to the analyses contained here including, without limitation, the manner or type of any Pershing Square investment.
Corrections Corporation of America
Ticker: “CXW”
Stock price: $24.50 (1)
1) All financials in this presentation assume a share price of $24.50.
Corrections Corp owns and operates private prisons
Owns the land and building at most of its facilities
Largest private prison company
Fifth largest prison manager behind California, the Bureau of Prisons, Texas and Florida
Capitalization: Enterprise value: $4.1 billion
Equity market value: $2.9 billion
Recent valuation multiples:’09e Cap rate: 12.2%
’09e P / Free Cash Flow Per Share: 13.3x
2

Overview of CXW
ManagedFacilities
Owned & ManagedFacilities
■ CXW operates facilities on the government’s behalf, but does not own the underlying property
■ 20 managed facilities■ 25,916 beds■ ~14% Facility EBITDA margin■ Subject to higher competition
■ CXW owns the land and building for the vast majority of its owned & managed facilities
■ 44 owned & managed facilities■ 61,054 beds■ ~35% Facility EBITDA margin■ High-multiple, high-margin business
________________________________________________
Note: Facility EBITDA is before G&A.
3
~90% of Facility EBITDA
CXW operates its business in two segments: Owned & Managed Facilities and Managed Facilities
~10% of Facility EBITDA
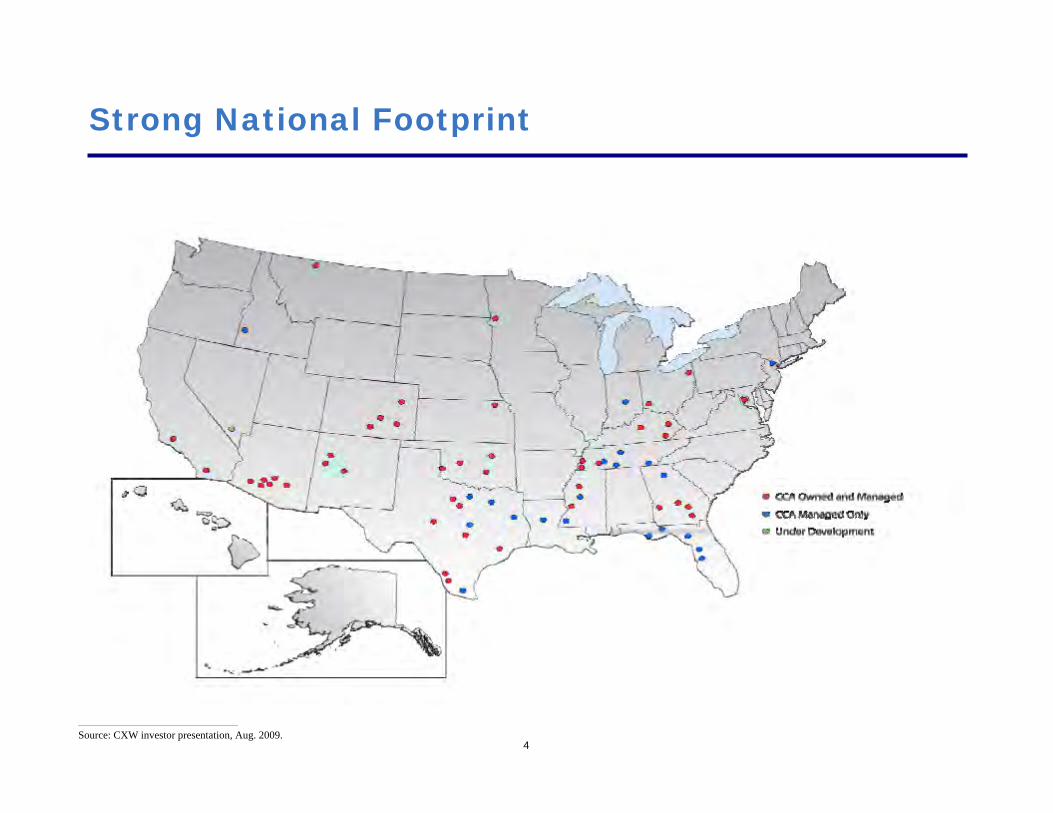
4
Strong National Footprint
________________________________________________
Source: CXW investor presentation, Aug. 2009.

5
Tenants Unlikely to Default
Alaska
Arizona
Hawaii
Kentucky
Minnesota
Oklahoma
Vermont
Other States
________________________________________________
Source: CXW investor presentation, Aug. 2009.
CXW provides services under management contracts to all three federal agencies, 19 state agencies, the District of Columbia and multiple local agencies
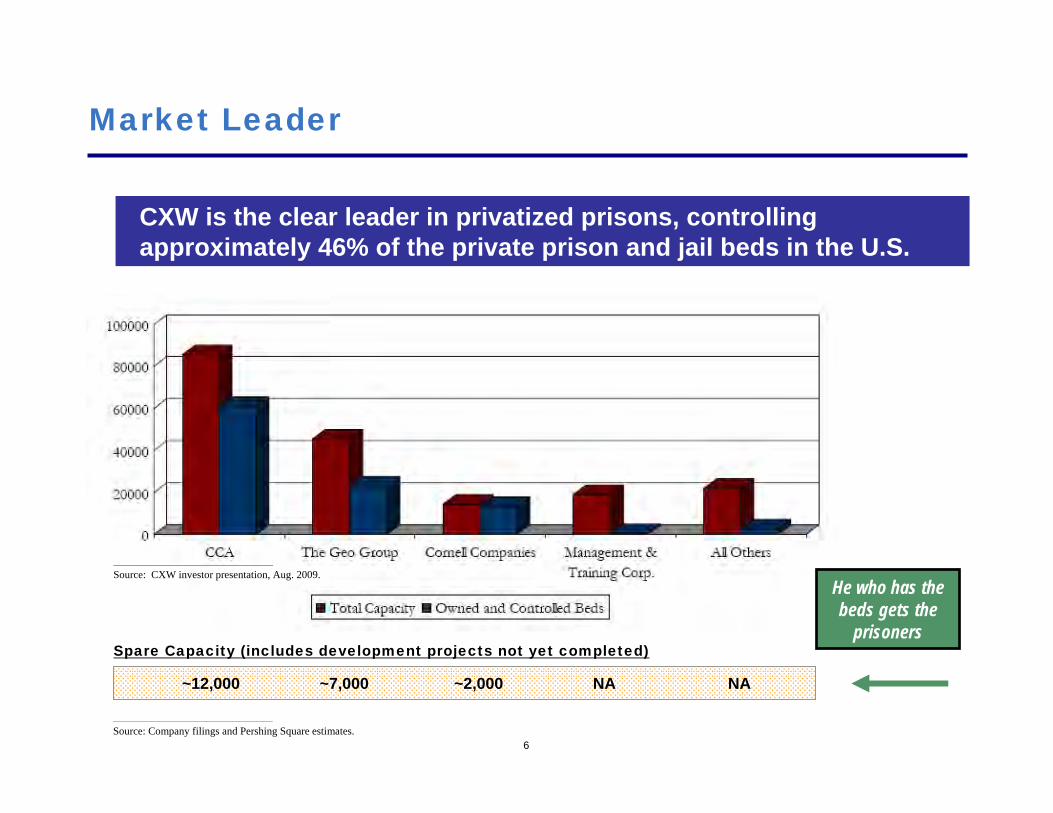
6
Market Leader
~12,000 ~7,000 ~2,000 NA NA
Spare Capacity (includes development projects not yet completed)
________________________________________________
Source: Company filings and Pershing Square estimates.
He who has the beds gets the
prisoners
CXW is the clear leader in privatized prisons, controlling approximately 46% of the private prison and jail beds in the U.S.
________________________________________________
Source: CXW investor presentation, Aug. 2009.

7
Large and Under-penetrated Market
________________________________________________
Source: Bureau of Justice Statistic: Prison Inmates at Midyear 2008, CXW investor presentation, Aug. 2009.
CXW addresses a total U.S. market that exceeds $65bn, of which only ~8% is outsourced. Privatized beds have grown from nearly 11,000 in 1990 to over 185,000 today (17% CAGR)

8
Supply / Demand Imbalance
________________________________________________
Source: CXW investor presentation, Aug. 2009.
Across the state of California, facilities are running at 170% of designed capacity
Public-sector correctional systems are currently operating at, or in excess of, design capacity

9
Competitive Advantage: State vs. Private
________________________________________________
Source: CXW investor presentation, Aug. 2009.
CXW has historically outperformed the public sector in safety and security

~1.5 yrs
<$70k
~$16k
New
Competitive Advantage: State vs. Private (Cont’d)
Lead Time for Prison Build
Cost to Build / Bed
Annual OpEx / Inmate (1)
Average Age of Facility
5 to 8 yrs
~$100-$150k
$24k
Old
State / Federal Private
________________________________________________(1) Source: 2007 Pew Charitable Trusts report – “Public Safety, Public Spending – Forecasting America’s Prison Population 2007 – 2011.” Annual Operating
Cost per Inmate for the year 2005. States vary widely; for instance, California had a $34k annual operating cost per inmate in 2005.
As a private company, CXW has cost and efficiency advantages compared with its largest competitor
10

11
Increasing Market Penetration
Because of constraints in new public prison construction, private prison operators were able to capture 49% of the incremental growth in U.S. inmate populations in 2007
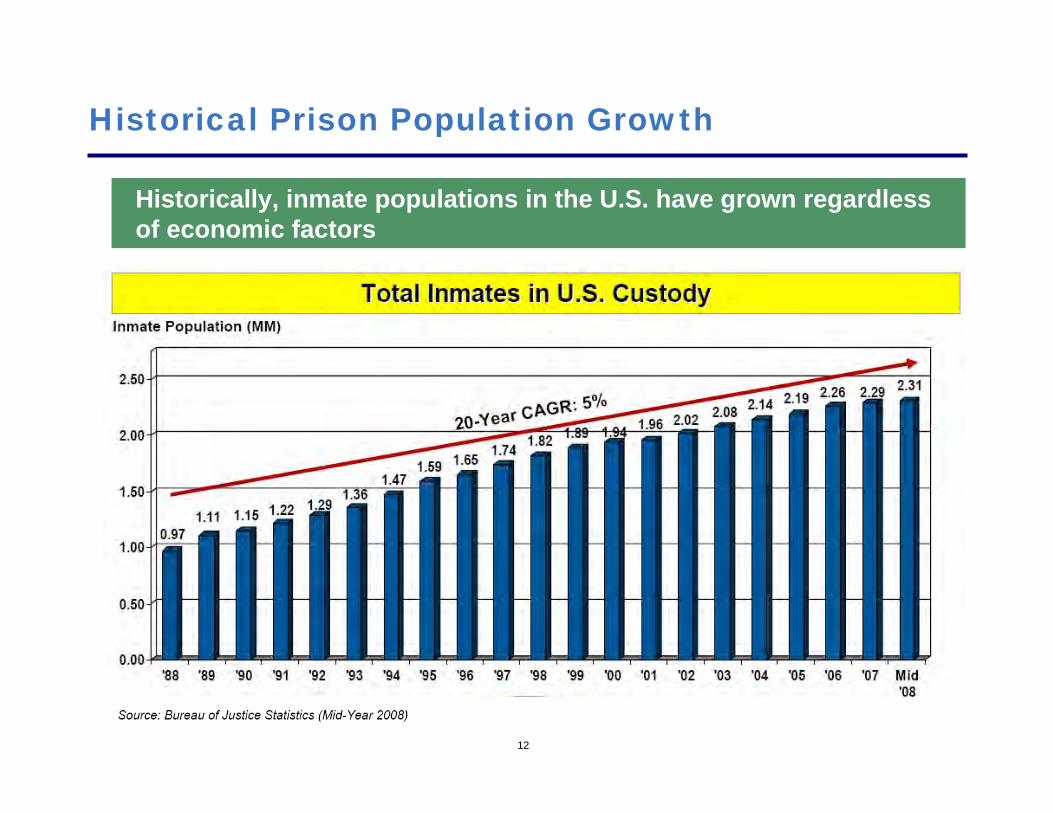
12
Historical Prison Population Growth
Historically, inmate populations in the U.S. have grown regardless of economic factors

13
Prison Populations Expected to Rise

14
Federal Demand Drives Growth
Federal demand alone could fill CXW’s ~12,000 bed inventory over the coming years
The Federal Bureau of Prisons (“BOP”) is currently operating at 137% of rated capacity, with a stated desire to operate closer to 115%
The BOP projects that between 2008 and 2011 its population will grow by ~19,000 inmates, with just over 12,000 new beds planned for development by 2012
The United States Marshals Service (“USMS”) has a population of about 60,000-65,000 and has grown 8%-10% per annum over the last five years
Since 1994, Immigration and Customs Enforcement (“ICE”) detainee populations have grown by over 300% to ~35,000
________________________________________________(1) Based on 172,827 inmates in BOP facilities as of 9/26/09. Source: BOP website.
Assumes the shift from 137% to 115% takes place over the next three years.(2) The BOP projects its inmate population will grow by ~19,000 inmates from 2008 to 2011
but has only planned the development of ~12,000 beds.(3) Assumes ~5% growth of USMS / ICE inmate populations over the next three years.(4) Includes 2,572 beds not yet developed. Source: CXW investor presentation, Aug. 2009.
Federal Demand Drivers BedsBOP: Shift from 137% to 115% capacity (1) 28,000BOP: Undeveloped growth (2) 7,000 USMS / ICE (3) 15,000
Incremental Federal Demand 50,000
CXW inventory (as of 8/1/09) (4) 11,979 Incr. Federal Demand as % of Inventory 417%Capture Rate Required to Fill Inventory 24%

15
State Demand Drives Growth
“Of the 19 state customers that CCA does business with, we are currently estimating that those states will have an incremental growth that will be twice as much as their funded plan capacity by 2013.”
– Damon Hininger, CEO, Q1 Earnings Call
State prison populations are projected to increase by more than 90,000 over the next three years. If CXW can capture ~13% of this demand, it could achieve 100% occupancy

Supply / Demand Imbalance Drives Growth
Potential upside to our
estimates
We estimate CXW’s owned beds represent
>40% of the industry’s spare
capacity
If private prisons can capture just 25% of the incremental growth in the U.S. inmate population, CXW should achieve >98% occupancy in its Owned & Managed business by 2012. Private prison operators captured 49% of the growth in 2007 as state budget pressures have postponed new prison construction
16
(1) Source ('04-'07): Bureau of Justice Statistics and Office of Detention Trustee Statistics. Excludes juvenile, jail and ICE population.Source ('08-'12): In 2007, Pew Charitable Trust estimated there will be an incremental 153,000 prisoners by YE 2011.This analysis assumes an incremental 140,000 prisoners by YE 2012.
(2) Source ('04-'07): Bureau of Justice Statistics and Office of Detention Trustee Statistics. Excludes juvenile, jail and ICE population.Assumes 35% private capture rate in 2008 and 25% private capture rate going forward.
(Beds in thousands) Potential Growth Opportunity2004a 2005a 2006a 2007a 2008a 2009e 2010e 2011e 2012e
Market Analysis
Total Inmate Population (MM) (1) 1,546 1,580 1,627 1,655 1,677 1,701 1,726 1,760 1,795Growth 2.1% 2.2% 3.0% 1.7% 1.3% 1.4% 1.5% 1.9% 2.0%
Private Inmate Pop'n (000s) (2) 107 114 126 139 147 153 159 168 177Growth 5.0% 6.8% 10.7% 10.7% 5.6% 4.1% 4.2% 5.3% 5.2%% Private 6.9% 7.2% 7.7% 8.4% 8.8% 9.0% 9.2% 9.5% 9.8%
Incremental Private InmatesIncremental Total Inmates 32 33 48 27 22 24 26 34 35Private Capture Rate (2) 16.1% 21.6% 25.5% 49.1% 35.0% 25.0% 25.0% 25.0% 25.0%
Incremental Private Inmates 5 7 12 13 8 6 6 8 9
CXW Capture Rate (Owned only) 27.7% 18.5% 33.6% 33.4% 43.6% 40.0% 40.0% 40.0% 40.0%
Incremental CXW Beds (Owned) 1.4 1.3 4.1 4.5 3.4 2.4 2.6 3.4 3.5Occupancy (Owned) 90.3% 88.3% 93.9% 98.6% 94.5% 87.5% 89.8% 93.2% 98.7%
Memo: Pershing Square ForecastIncremental CXW Beds (Owned) 1.4 1.3 4.1 4.5 3.4 1.9 2.0 3.3 2.5Occupancy (Owned) 90.3% 88.3% 93.9% 98.6% 94.5% 86.6% 88.0% 91.5% 95.5%
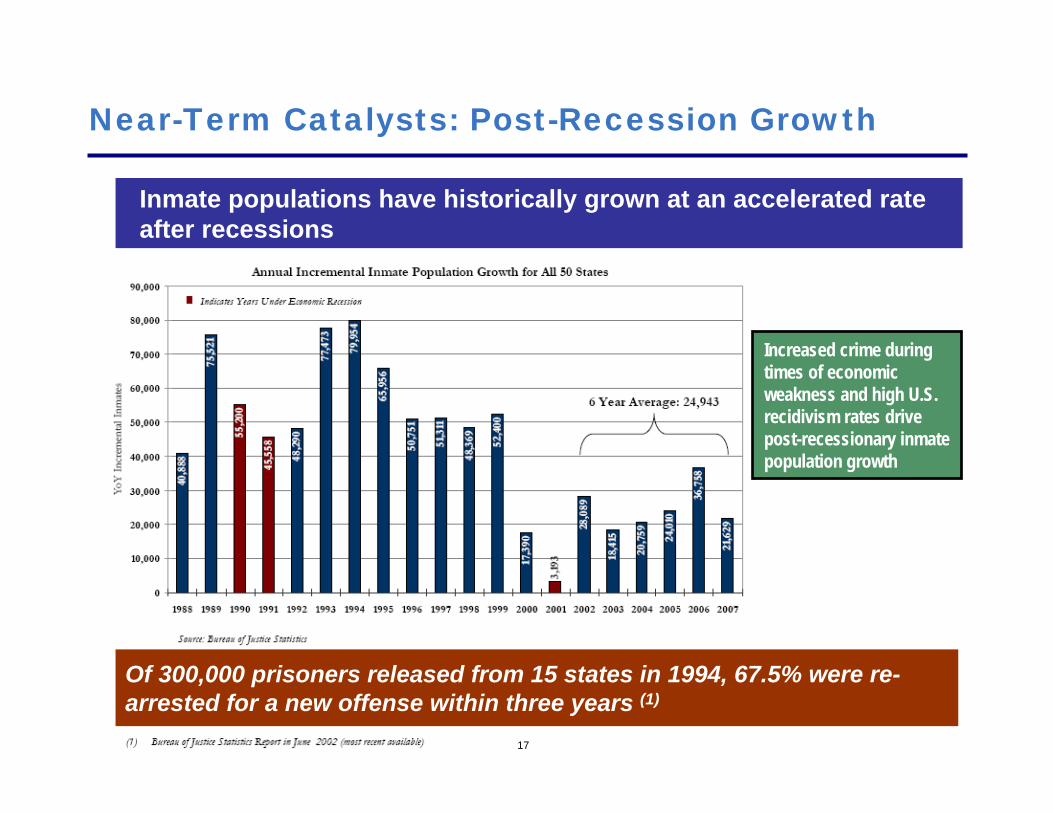
17
Near-Term Catalysts: Post-Recession Growth
Increased crime during times of economic weakness and high U.S. recidivism rates drive post-recessionary inmate population growth
Of 300,000 prisoners released from 15 states in 1994, 67.5% were re-arrested for a new offense within three years (1)
Inmate populations have historically grown at an accelerated rate after recessions
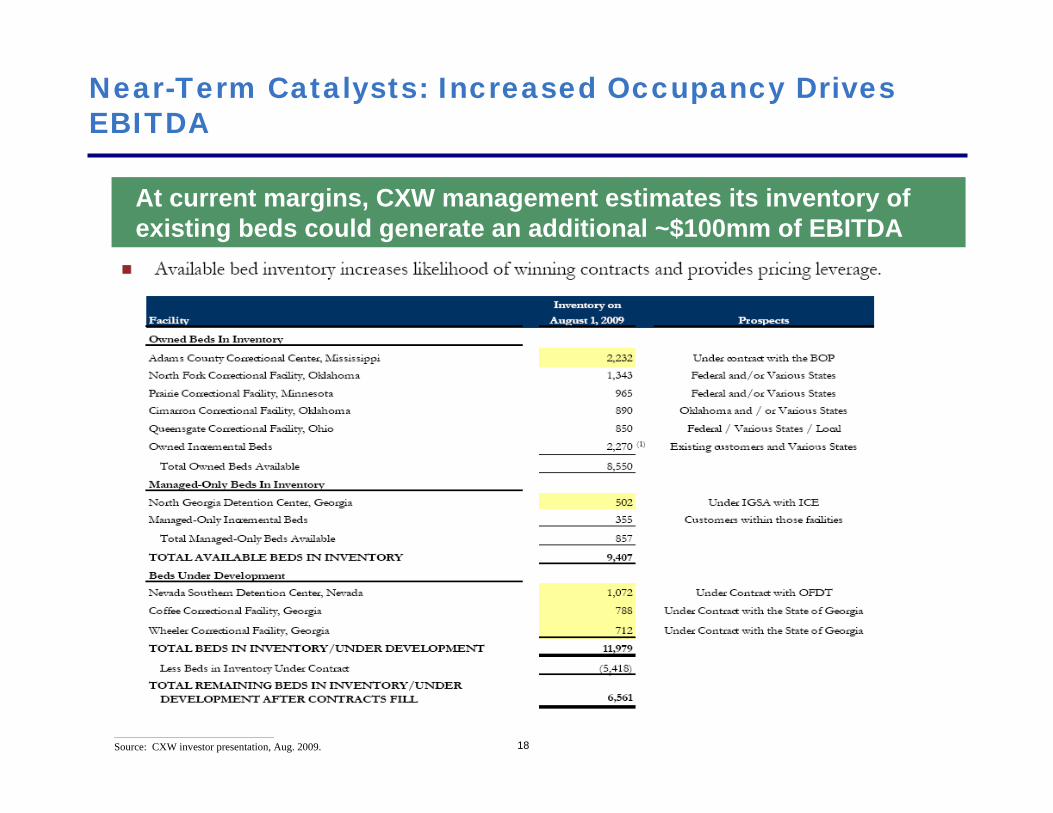
18
Near-Term Catalysts: Increased Occupancy Drives EBITDA
________________________________________________
Source: CXW investor presentation, Aug. 2009.
At current margins, CXW management estimates its inventory of existing beds could generate an additional ~$100mm of EBITDA

19
Near-Term Catalysts: Operating Leverage
Management derives its ~$100mm estimate by applying CXW’s Q2’09 margin to the lease-up of its existing inventory; however, approximately 84% of the costs in CXW’s Owned & Managed Facilities segment are fixed
Implies ~$100mm of incremental EBITDA
Implies ~$230mm of incremental EBITDA
________________________________________________
Source: CXW Q2’09 financial supplement. See page 33 of the CXW investor presentation for details of the assumptions used to derive management’s ~$100mm estimate.(1) The vast majority of CXW’s fixed expense is labor. Also includes utilities, property taxes, insurance, repairs & maintenance and other similar expenses.(2) Includes legal, medical, food, welfare and other similar expenses.(3) This analysis is illustrative. We note that there will be some amount of incremental fixed expense associated with the ramp-up of CXW’s inventory as staffing requirements increase with occupancy.
We further note that some of the beds in CXW’s inventory have not yet been developed, and therefore do not yet have associated fixed expenses.
CXW Facilities (Owned-only) Q2'09
Revenue per man-day $66.88Less: Fixed expense per man-day (1) (32.74) Less: Variable expense per man-day (2) (10.68)
Facility EBITDA per Man-Day $23.46Margin 35.1%
Contribution Margin Analysis: (3)Revenue per man-day $66.88Less: Variable expense per man-day (10.68)
Facility EBITDA per Incremental Man-Day $56.20Contribution Margin 84.0%
While this contribution margin analysis implies $230mm of incremental EBITDA, we believe the actual number will be somewhere between $100mm and $230mm

Near-Term Catalysts: Stock Buyback
Quarter Ended,Q108a Q208a Q308a Q408a Q109a Q209a Q309e Q409e
WASO 126.1 126.5 126.5 126.1 120.6 115.7 117.3 117.3Growth (YoY) (4.4%) (8.6%) (7.3%) (7.0%)
CXW’s repurchase of 10.7 million shares in Q4 ’08 – Q2 ’09 (~8.5% of total shares) provides a tailwind for NTM free cash flow per share growth
20
Recent Share Repurchases
Per Timeframe Shares (mm) Amount (mm) Share
November through December 31 1.1 $16.6 $15.09January through February 1.4 21.4 $15.29February through May 8.2 87.0 $10.61
Total 10.7 $125.0 $11.68
Memo: Remaining Buyback Authorization $25.0

Strong Free Cash Flow Generation
Because prisons are made of concrete and steel, depreciation expense meaningfully exceeds maintenance capex. As a result, CXW’s free cash flow per share is substantially greater than earnings per share
21________________________________________________
Source: CXW investor presentation, Aug. 2009.
$0.40$0.53
$0.61
$0.86
$1.07$1.20
$0.59 $0.64
$0.84
$1.06
$1.40
$1.73
$0.00
$0.20
$0.40
$0.60
$0.80
$1.00
$1.20
$1.40
$1.60
$1.80
$2.00
2003a 2004a 2005a 2006a 2007a 2008a
Diluted EPS Normalized FCFPS

22
Strong Balance Sheet
As of Q2’09, CXW’s interest coverage ratio was 5.4x. Its next debt maturity is not until 2012. Its cash interest expense is less than 6%, and more than 80% of its debt is fixed rate
________________________________________________
Source: CXW investor presentation, Aug. 2009.

23
High Returns on Capital
________________________________________________
Source: CXW investor presentation, Aug. 2009.

24
Culture of Equity Ownership
Board and management own more than 6 million shares of CXW (1)
________________________________________________
Source: CXW March 31, 2009 proxy and Bloomberg.(1) Includes shares that could be purchased upon exercise of stock options at March 1, 2009 or within 60 days thereafter.(2) William Rusak was succeeded by Brian Collins on September 14, 2009.(3) Based on 117,681,012 shares outstanding as of March 1, 2009. Deems shares that could be purchased upon exercise of stock options as shares outstanding.
Total BeneficialName of Beneficial Owner Title Ownership (1)William F. Andrews Director 525,523John D. Ferguson Chairman 1,711,455Donna M. Alvarado Director 50,916Lucius E. Burch, III Director 1,282,934John D. Correnti Director 83,124Dennis W. DeConcini Director 5,500John R. Horne Director 100,166C. Michael Jacobi Director 97,700Thurgood Marshall, Jr. Director 72,998Charles L. Overby Director 47,284John R. Prann, Jr. Director 87,232Joseph V. Russell Director 352,410Henri L. Wedell Director 1,377,920Damon Hininger Chief Executive Officer 20,489Todd J. Mullenger Chief Financial Officer 134,072G.A. Puryear, IV General Counsel 159,295Richard P. Seiter Chief Corrections Officer 144,742William K. Rusak (2) Chief of Human Resources 91,984
All Directors & Exexutive Officers as a Group 6,453,308Percent of Common Stock Beneficially Owned (3) 5.4%

Valuation
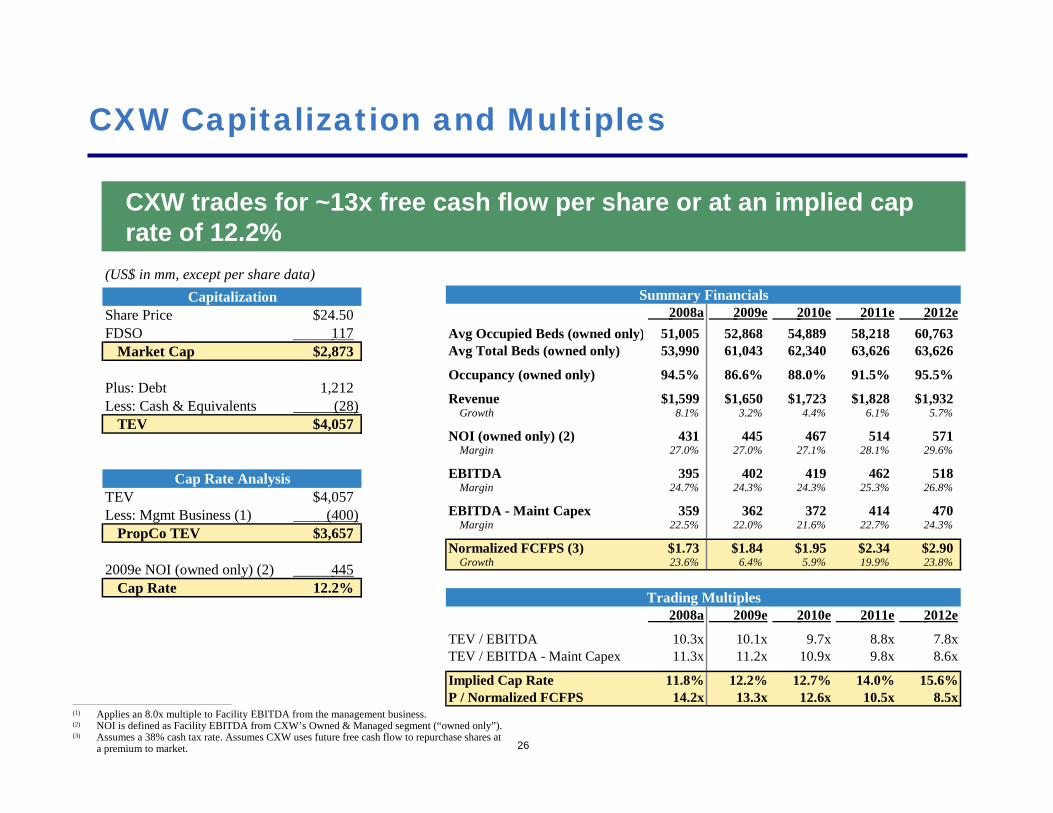
26
CXW Capitalization and Multiples
CXW trades for ~13x free cash flow per share or at an implied cap rate of 12.2%
________________________________________________(1) Applies an 8.0x multiple to Facility EBITDA from the management business.(2) NOI is defined as Facility EBITDA from CXW’s Owned & Managed segment (“owned only”).(3) Assumes a 38% cash tax rate. Assumes CXW uses future free cash flow to repurchase shares at
a premium to market.
(US$ in mm, except per share data)Capitalization
Share Price $24.50FDSO 117
Market Cap $2,873
Plus: Debt 1,212Less: Cash & Equivalents (28)
TEV $4,057
Cap Rate AnalysisTEV $4,057Less: Mgmt Business (1) (400)
PropCo TEV $3,657
2009e NOI (owned only) (2) 445 Cap Rate 12.2%
Summary Financials2008a 2009e 2010e 2011e 2012e
Avg Occupied Beds (owned only) 51,005 52,868 54,889 58,218 60,763Avg Total Beds (owned only) 53,990 61,043 62,340 63,626 63,626
Occupancy (owned only) 94.5% 86.6% 88.0% 91.5% 95.5%
Revenue $1,599 $1,650 $1,723 $1,828 $1,932Growth 8.1% 3.2% 4.4% 6.1% 5.7%
NOI (owned only) (2) 431 445 467 514 571Margin 27.0% 27.0% 27.1% 28.1% 29.6%
EBITDA 395 402 419 462 518Margin 24.7% 24.3% 24.3% 25.3% 26.8%
EBITDA - Maint Capex 359 362 372 414 470Margin 22.5% 22.0% 21.6% 22.7% 24.3%
Normalized FCFPS (3) $1.73 $1.84 $1.95 $2.34 $2.90Growth 23.6% 6.4% 5.9% 19.9% 23.8%
Trading Multiples2008a 2009e 2010e 2011e 2012e
TEV / EBITDA 10.3x 10.1x 9.7x 8.8x 7.8xTEV / EBITDA - Maint Capex 11.3x 11.2x 10.9x 9.8x 8.6x
Implied Cap Rate 11.8% 12.2% 12.7% 14.0% 15.6%P / Normalized FCFPS 14.2x 13.3x 12.6x 10.5x 8.5x

$0
$5
$10
$15
$20
$25
$30
$35
Jan-07 Jul-07 Feb-08 Sep-08 Mar-09 Oct-09$35,000
$45,000
$55,000
$65,000
$75,000
$85,000
$95,000
$105,000
StockPrice
TEV / Bed
27
Historical Stock Chart
46,681 48,933 50,909 53,464 59,184 61,054
Owned & Managed Available Beds
$24.50
125.3 125.6 126.1 126.5 120.6 115.7
Weighted Average Shares Outstanding

28
Opportunity for Multiple Expansion
________________________________________________
Source: Capital IQ, Pershing Square estimates.
5x
8x
11x
14x
Jan-07 Jul-07 Feb-08 Sep-08 Mar-09 Oct-09
TEV / Forward EBITDA
9.8x
Pre-Lehman Average:
11.5x
85.9% 87.1% 88.9% 89.8% 89.6% 90.1%
Owned & Managed as % of Facility EBITDA (TTM)
CXW’s earnings quality has improved since 2007 as its Owned & Managedsegment now accounts for more than 90% of Facility EBITDA

Real Estate
Government
Secular
~2%
None
High
Local Monopoly
Oligopoly
Low
Principal Asset
Primary Tenant
Growth Opportunity
Maint Capex as % of Revenue
Tenant Allowances
Return on New Development
Competition for Existing Units
Competition for New Construction
Cyclicality
Key Attributes of Corrections Corp
CXW has credit-worthy tenants, requires limited
maintenance capex, and enjoys excellent
competitive dynamics – all
features of a high quality real estate
business
29
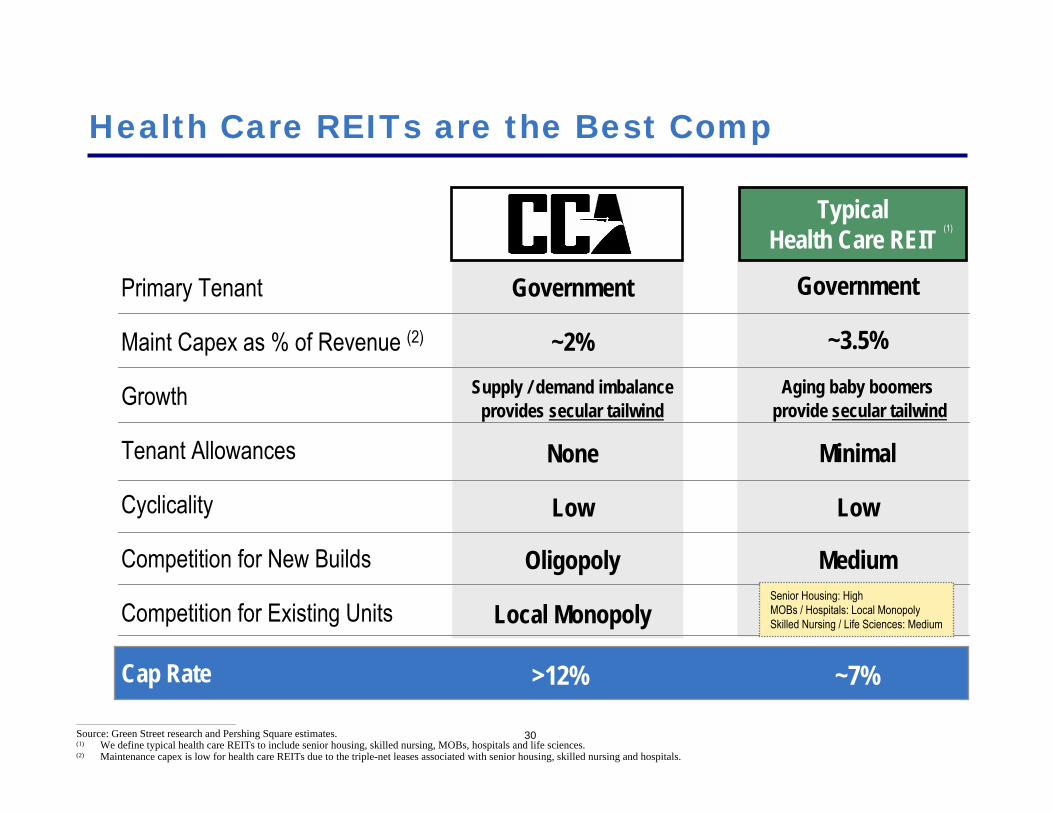
Government
~2%Supply / demand imbalance
provides secular tailwind
None
Low
Oligopoly
Local Monopoly
Government
~3.5%Aging baby boomers
provide secular tailwind
Minimal
Low
Medium
Health Care REITs are the Best Comp
Primary Tenant
Maint Capex as % of Revenue (2)
Growth
Tenant Allowances
Cyclicality
Competition for New Builds
Competition for Existing Units
Cap Rate
TypicalHealth Care REIT (1)
________________________________________________
Source: Green Street research and Pershing Square estimates.(1) We define typical health care REITs to include senior housing, skilled nursing, MOBs, hospitals and life sciences.(2) Maintenance capex is low for health care REITs due to the triple-net leases associated with senior housing, skilled nursing and hospitals.
Senior Housing: HighMOBs / Hospitals: Local MonopolySkilled Nursing / Life Sciences: Medium
>12% ~7%
30

31
Illustrative Sum-Of-The-Parts Valuation
CXW is composed of two businesses: an operating company (“OpCo”) and a real estate company (“PropCo”)
Illustrative OpCo / PropCo Financials
($ in millions)2010e 2011e 2012e
OpCoCXW Revenue (owned-only) $1,349 $1,449 $1,543Rent as % of Revenue 25.0% 25.0% 25.0%
Illustrative Rent 337 362 386Per Bed $5,411 $5,692 $6,062
CXW EBITDA 419 462 518Less: Rent (337) (362) (386)
PF EBITDA $82 $100 $132PF Margin 4.7% 5.5% 6.8%
PropCoRental Revenue $337 $362 $386
NOI $337 $362 $386Margin 100.0% 100.0% 100.0%
Less: Cash expenses (10) (10) (10) AFFO 327 352 376 Margin 97.0% 97.2% 97.4%
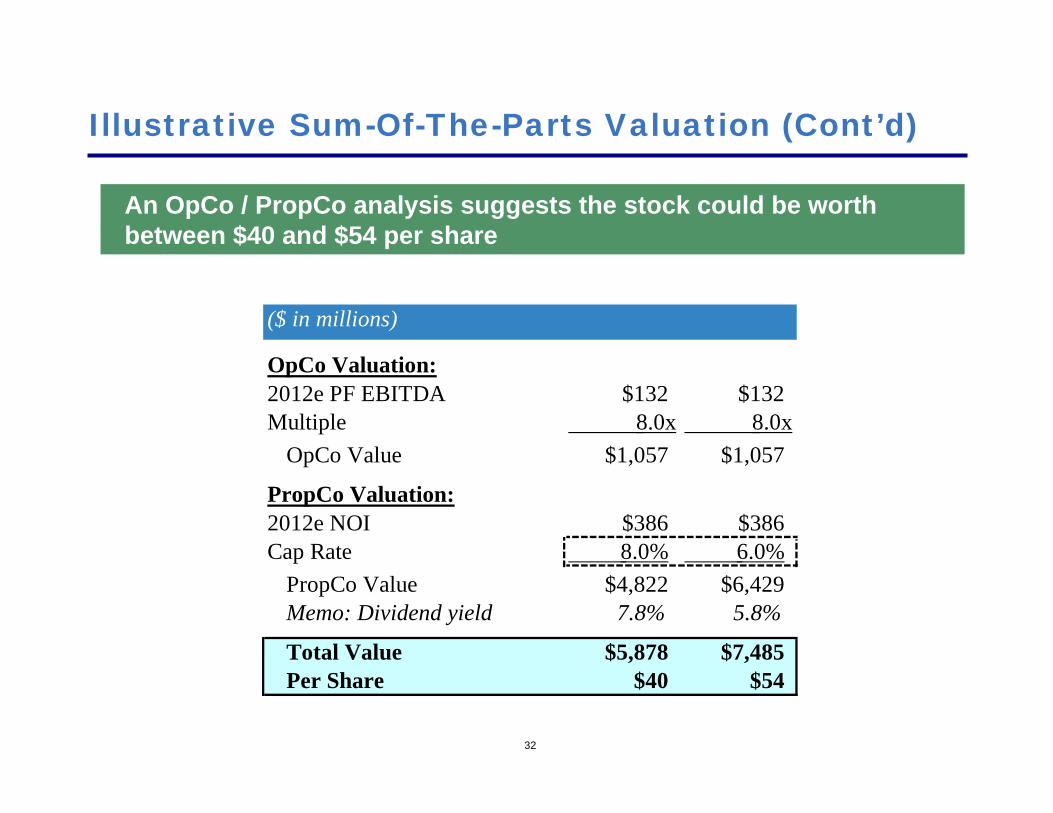
Illustrative Sum-Of-The-Parts Valuation (Cont’d)
32
An OpCo / PropCo analysis suggests the stock could be worth between $40 and $54 per share
($ in millions)
OpCo Valuation:2012e PF EBITDA $132 $132Multiple 8.0x 8.0x
OpCo Value $1,057 $1,057
PropCo Valuation:2012e NOI $386 $386Cap Rate 8.0% 6.0%
PropCo Value $4,822 $6,429Memo: Dividend yield 7.8% 5.8%
Total Value $5,878 $7,485Per Share $40 $54

CXW used to be a REIT…
IPO’d in July-97 at $21 per share and immediately traded up to $29
Upon its formation, CCA Prison Realty Trust purchased 9 correctional facilities from Old CCA for $308mm. It then leased the facilities to Old CCA pursuant to long-term, non-cancellable triple-net leases with built-in rent escalators
Within five months of its IPO, CCA Prison Realty Trust used the remaining proceeds from its IPO and its revolver to purchase three additional facilities from Old CCA
By December-97, CCA Prison Realty Trust’s stock had moved up to the $40s, trading at a ~5% cap rate and a ~4% dividend yield
CCA Prison Realty Trust was a Huge Success
From 1997 through 1999, CXW operated as two separate companies: CCA Prison Realty Trust (a REIT), and Old CCA (the operating company)
33

$0
$10
$20
$30
$40
$50
$60
$70
$80
Jan-99 Feb-01 Mar-03 May-05 Jun-07 Jul-09
CXW used to be a REIT… (Cont’d)
New Prison Realty saddled itself with debt to fund new prison builds
Before the new prisons had been completed and could generate revenue, OpCo’soperating fundamentals began to decline and occupancy fell
OpCo struggled to maintain profitability and rental payments to New Prison Realty soon had to be deferred
As a result, New Prison Realty’s stock price declined precipitously, limiting its ability to raise liquidity. This was further exacerbated by a shareholder lawsuit stemming from the fall in the stock price
By the Summer of 2000, CXW was on the verge of default and had to raise dilutive capital to restructure and avoid bankruptcy
New Prison Realty was not a Success
On January 1, 1999, Old CCA and CCA Prison Realty Trust merged to form an even larger REIT, “New Prison Realty.” In order for New Prison Realty to qualify as a REIT, it had to spin off its management business (“OpCo”)
34
35
Why Did New Prison Realty Fail?
It had too much leverage
It had an overly aggressive development plan
Its tenant, OpCo, was also over-leveraged (1)
New Prison Realty did not fail because it was a REIT, it failed because:
________________________________________________(1) “The rates on the Operating Company leases were set with the intention that the public stockholders of New Prison Realty would receive as much of the benefit as possible from owning and
operating the correctional and detention facilities…. In fact, the Operating Company lease rates were set so that Operating Company was projected to lose money for the first several years of its existence.” Source: CXW 2002 10-K.
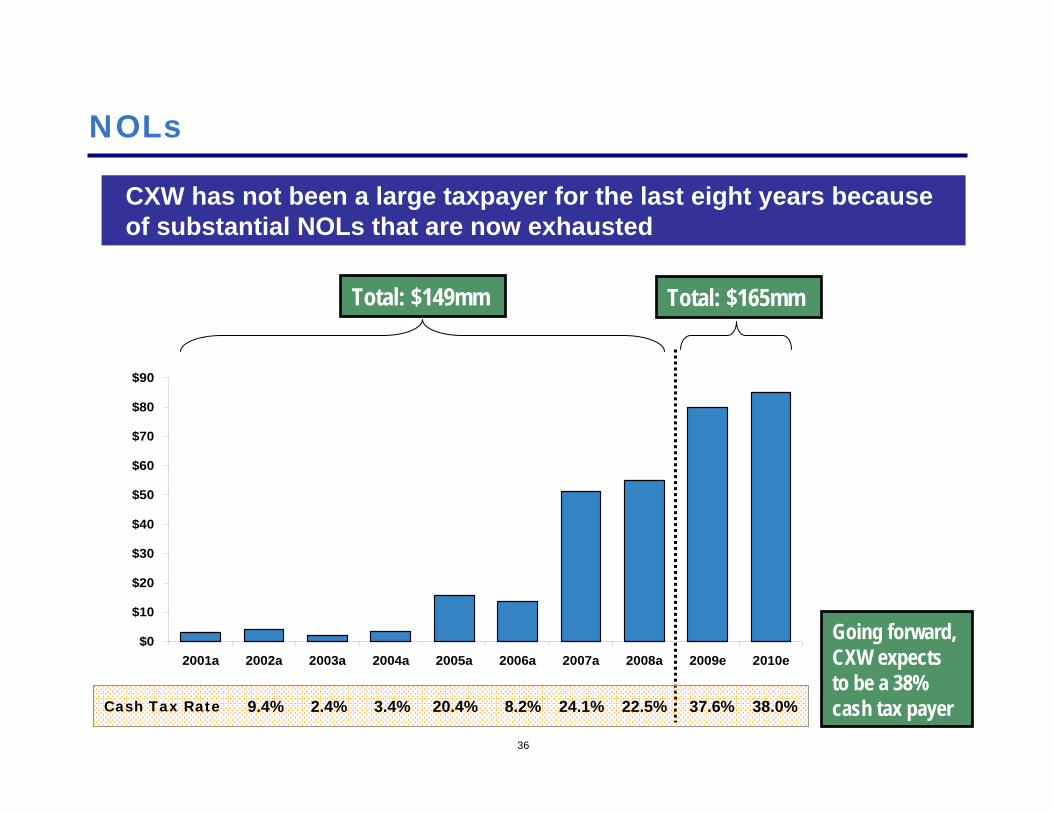
36
NOLs
$0
$10
$20
$30
$40
$50
$60
$70
$80
$90
2001a 2002a 2003a 2004a 2005a 2006a 2007a 2008a 2009e 2010e
Total: $149mm Total: $165mm
Going forward, CXW expects to be a 38% cash tax payer9.4% 2.4% 3.4% 20.4% 8.2% 24.1% 22.5% 37.6% 38.0%Cash Tax Rate
CXW has not been a large taxpayer for the last eight years because of substantial NOLs that are now exhausted

25.7% 26.0%
19.7% 19.9%18.4%
14.1%
11.9%10.6% 10.1% 9.3%
0%
5%
10%
15%
20%
25%
30%
2001a 2002a 2003a 2004a 2005a 2006a 2007a 2008a 2009e 2010e37
Owned vs. Managed
Managed EBITDA as a % of Facility EBITDA
Since 2000, CXW has increasingly shifted away from a business focused on the management of prisons toward a business focused on the ownership of prisons

38
“The other thing I would point out is before we'd even sell stock, that there's a lot of value in these assets. I hear people talking to me about regional malls selling at six cap rates or parking garages selling at five cap rates or 20 times cash flow and you think about -- or highways selling at 50 times cash flow, you think about prisons as infrastructure or some type of real estate asset, I think these could be even sold and harvested in some fashion to avoid selling stock in the future. So there are a number of things that we could do to finance our growth, but just with respect to cash flow and leverage, we could go quite a ways.”
– Irving Lingo, Former-CFO of Corrections Corp, Q2’06 Earnings Call
Management Gets It
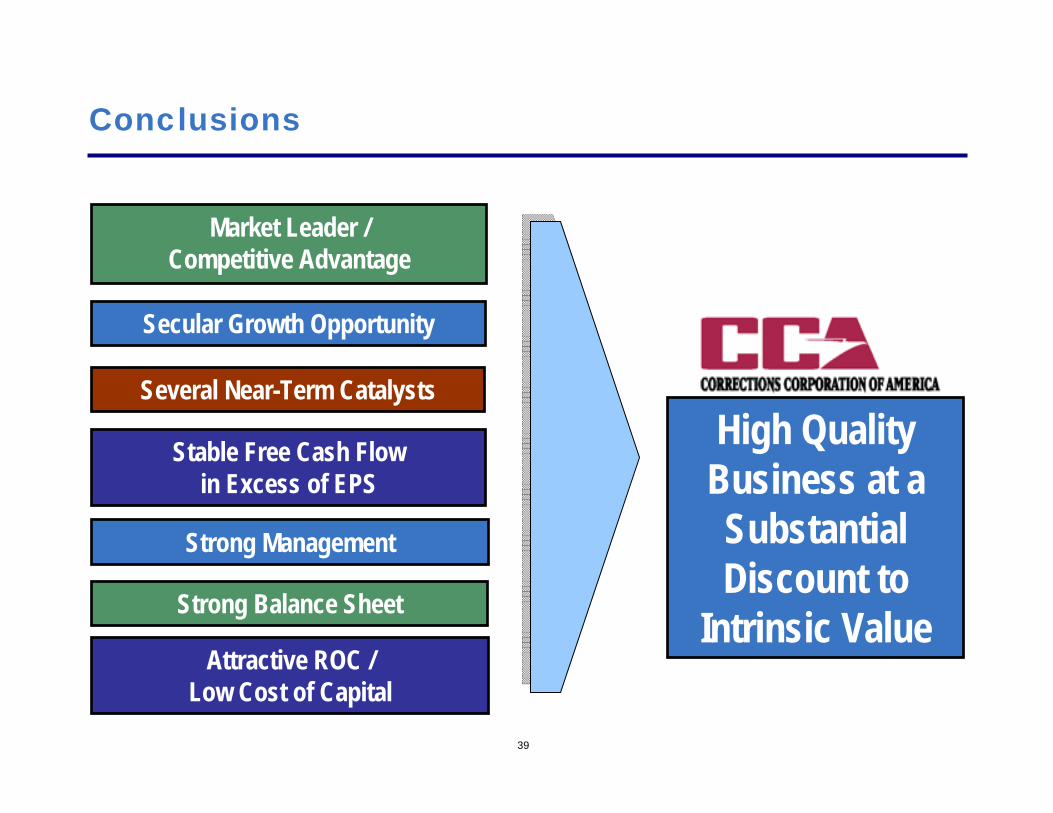
39
Conclusions
High QualityBusiness at a Substantial Discount to
Intrinsic ValueStrong Balance Sheet
Secular Growth Opportunity
Attractive ROC /Low Cost of Capital
Several Near-Term Catalysts
Market Leader / Competitive Advantage
Stable Free Cash Flow in Excess of EPS
Strong Management

If You Wait For The Robins,Spring Will Be Over*
December 7, 2009
Pershing Square Capital Management, L.P.

1
Disclaimer
The analyses and conclusions of Pershing Square Capital Management, L.P. ("Pershing Square") contained in this presentation are based on publicly available information. Pershing Square recognizes that there may be confidential information in the possession of the companies discussed in the presentation that could lead these companies to disagree with Pershing Square’s conclusions. This presentation and the information contained herein is not a recommendation or solicitation to buy or sell any securities.
The analyses provided may include certain statements, estimates and projections prepared with respect to, among other things, the historical and anticipated operating performance of the companies, access to capital markets and the values of assets and liabilities. Such statements, estimates, and projections reflect various assumptions by Pershing Square concerning anticipated results that are inherently subject to significant economic, competitive, and other uncertainties and contingencies and have been included solely for illustrative purposes. No representations, express or implied, are made as to the accuracy or completeness of such statements, estimates or projections or with respect to any other materials herein. Actual results may vary materially from the estimates and projected results contained herein.
Funds managed by Pershing Square and its affiliates have invested in long and short positions of certain mall REITs, including long positions in General Growth Properties Inc. Pershing Square manages funds that are in the business of actively trading – buying and selling – securities and financial instruments. Pershing Square may currently or in the future change its position regarding any of the securities it owns. Pershing Square reserves the right to buy, sell, cover or otherwise change the form of its investment in any company for any reason. Pershing Square hereby disclaims any duty to provide any updates or changes to the analyses contained here including, without limitation, the manner or type of any Pershing Square investment.
________________________________________________
* Warren E. Buffett, “Buy American. I am,” New York Times (10/16/08).

2
At the Beginning of 2009, The World was a Very Different Place for Mall REITs
The U.S. economy was on the verge of a depression
The U.S. consumer had hit the wall
Credit markets were closed
Mall REIT balance sheets were dangerously leveraged
Cap rates increased and transactions stopped as bid-ask spreads widened
Bankruptcy risk and tenant “right-sizing” initiatives were expected to result in massive store closures
Rent relief was a serious concern
Tenant sales were expected to fall off a cliff
SinceThen…

The U.S. Economy has Recovered
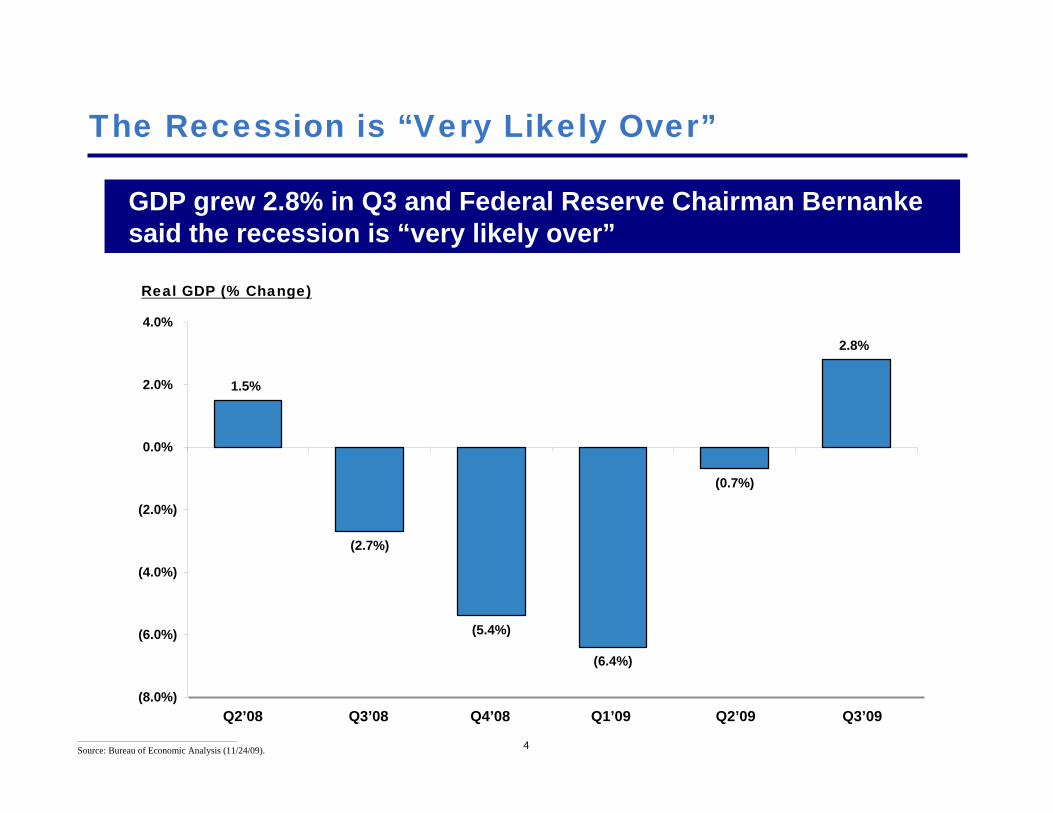
4
The Recession is “Very Likely Over”
________________________________________________
Source: Bureau of Economic Analysis (11/24/09).
GDP grew 2.8% in Q3 and Federal Reserve Chairman Bernanke said the recession is “very likely over”
Real GDP (% Change)
1.5%
(2.7%)
(5.4%)
(6.4%)
(0.7%)
2.8%
(8.0%)
(6.0%)
(4.0%)
(2.0%)
0.0%
2.0%
4.0%
Q2’08 Q3’08 Q4’08 Q1’09 Q2’09 Q3’09

5
9.4%
9.7%9.8%
10.2%
10.0%
8.5%
9.0%
9.5%
10.0%
10.5%
July August September October November
Unemployment Down in November
________________________________________________
Source: Bureau of Labor Statistics (12/4/09).
The U.S. unemployment rate improved 20bps in November
U.S. Unemployment Rate

6
Housing Market Showing Signs of Recovery
________________________________________________
Source: Census Bureau, Haver Analytics, Barclays Capital (November 2009).
New home inventories are falling sharply and are projected to continue to do so

The U.S. Consumer is Beginning to Bounce Back
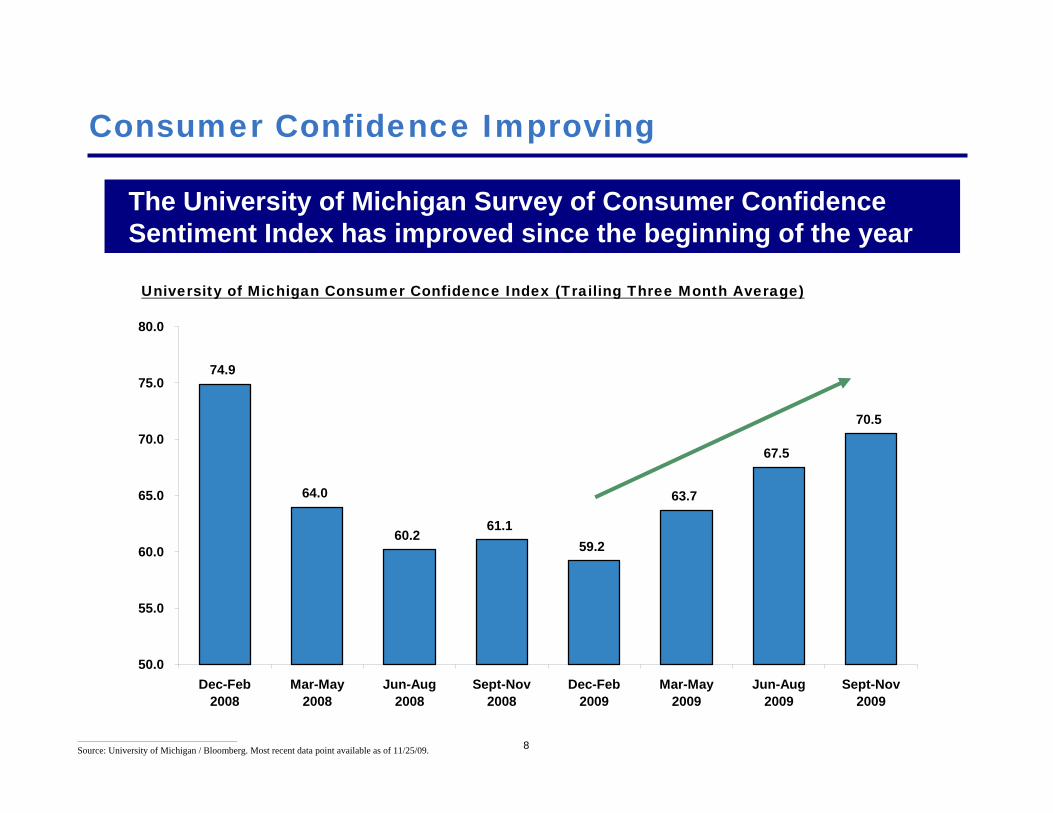
8
Consumer Confidence Improving
________________________________________________
Source: University of Michigan / Bloomberg. Most recent data point available as of 11/25/09.
The University of Michigan Survey of Consumer Confidence Sentiment Index has improved since the beginning of the year
University of Michigan Consumer Confidence Index (Trailing Three Month Average)
74.9
64.0
60.261.1
59.2
63.7
67.5
70.5
50.0
55.0
60.0
65.0
70.0
75.0
80.0
Dec-Feb2008
Mar-May2008
Jun-Aug2008
Sept-Nov2008
Dec-Feb2009
Mar-May2009
Jun-Aug2009
Sept-Nov2009

The Credit Markets Have Improved

10
Financial Markets Normalizing
________________________________________________
Source: FRB, FDIC, Haver Analytics, Barclays Capital (November 2009).
Overnight bank lending markets have stabilized and debt issuance is beginning to pick up
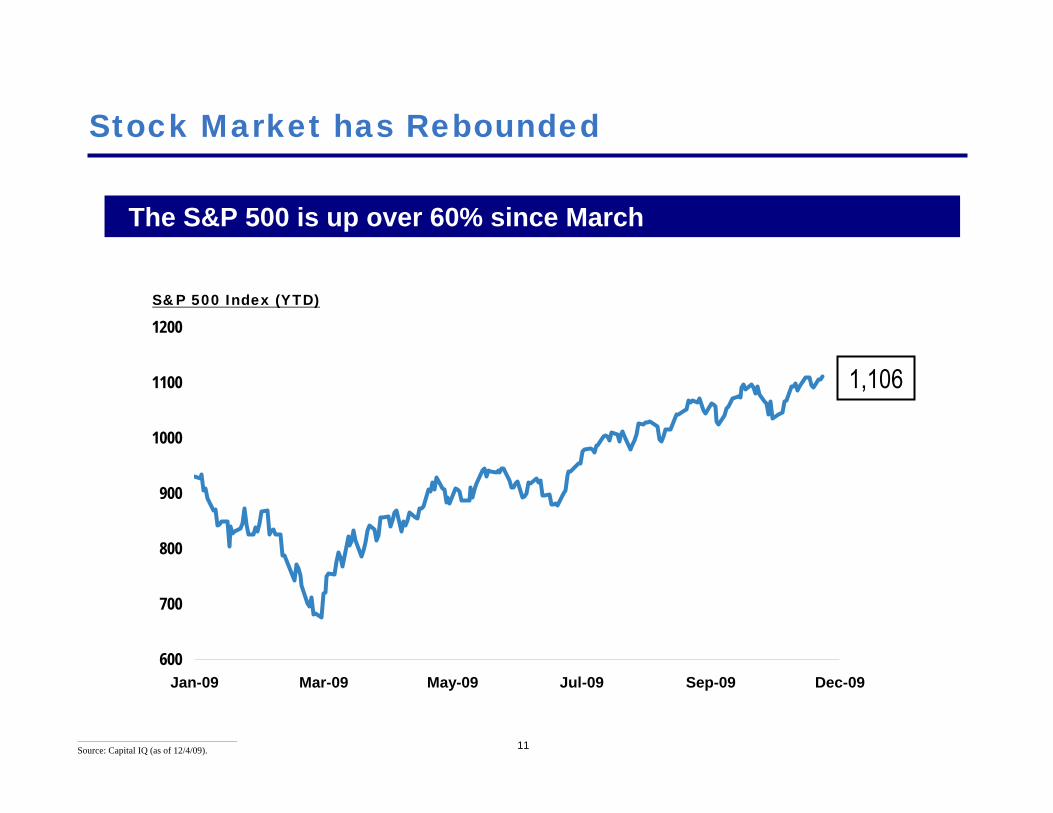
11
Stock Market has Rebounded
________________________________________________
Source: Capital IQ (as of 12/4/09).
The S&P 500 is up over 60% since March
600
700
800
900
1000
1100
1200
Jan-09 Mar-09 May-09 Jul-09 Sep-09 Dec-09
S&P 500 Index (YTD)
1,106

12
REIT Stocks have Rebounded
The IYR REIT Index has doubled since March
$45
20
25
30
35
40
45
50
Jan-09 Mar-09 May-09 Jul-09 Sep-09 Dec-09
IYR REIT Index (YTD)
________________________________________________
Source: Capital IQ (as of 12/4/09).
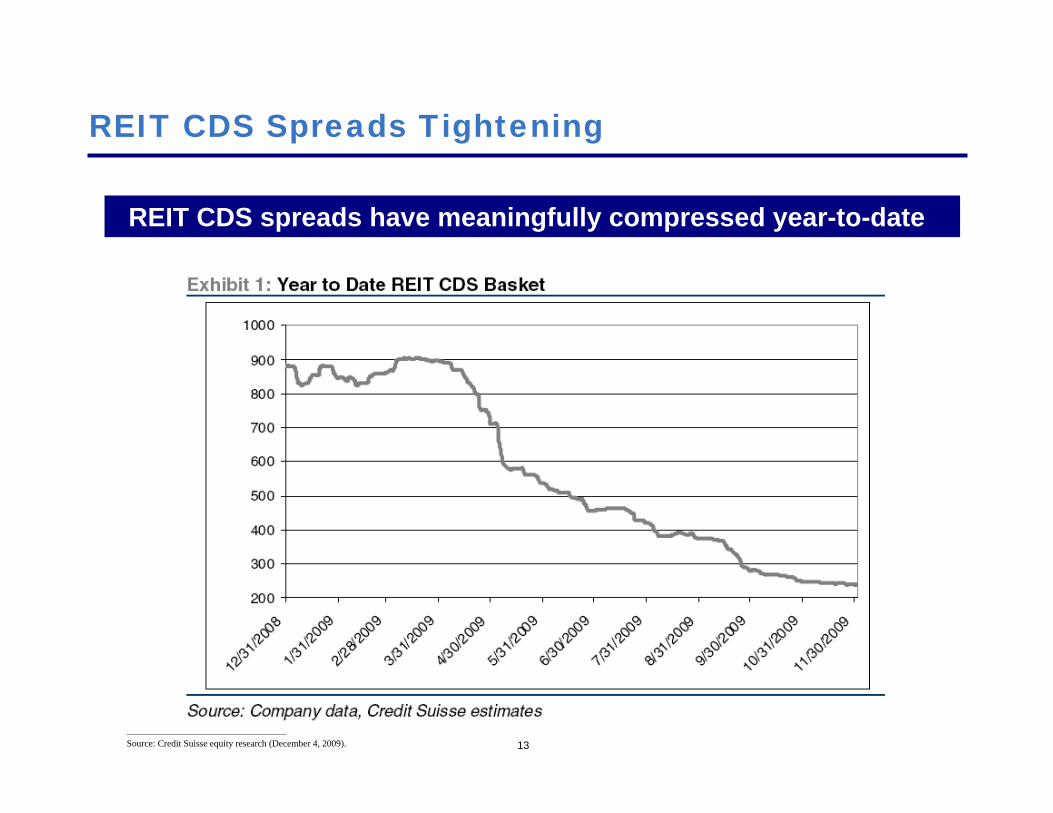
13
REIT CDS Spreads Tightening
REIT CDS spreads have meaningfully compressed year-to-date
________________________________________________
Source: Credit Suisse equity research (December 4, 2009).

14
________________________________________________
Source: Goldman Sachs Global Investment Research (December 2, 2009). Includes AMB Property Corp (AMB), ProLogis(PLD), Boston Properties (BXP), DDR Corp (DDR), Vornado (VNO), Brandywine Realty (BDN), Kimco (KIM), Avalonbay (AVB), Alexandria Real Estate (ARE), Ventas (VTR) and Simon Property Group (SPG).
Over the past three months, REITs have been able to issue large amounts of low-cost debt
Closed on October 8, 2009
$400mm loan
Five year term
Blended interest of 4.225%
DDR TALF Deal
“Based on secondary market trading, if Simon were to issue debt today, an issuance of five year unsecured debt could potentially be completed at a cost of 5% or less”
– Credit Suisse Equity Research, December 4, 2009
REIT Cost of Debt Improving
Mall REIT Balance Sheets Have Strengthened
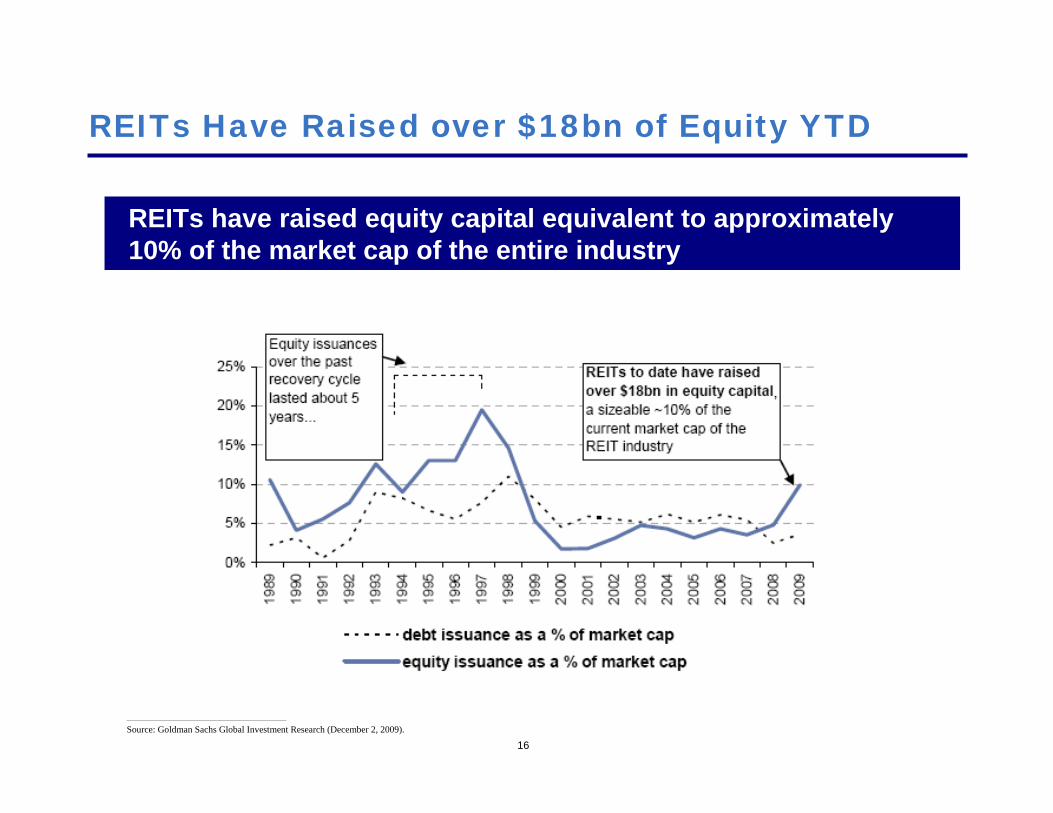
16
REITs Have Raised over $18bn of Equity YTD
REITs have raised equity capital equivalent to approximately 10% of the market cap of the entire industry
________________________________________________
Source: Goldman Sachs Global Investment Research (December 2, 2009).
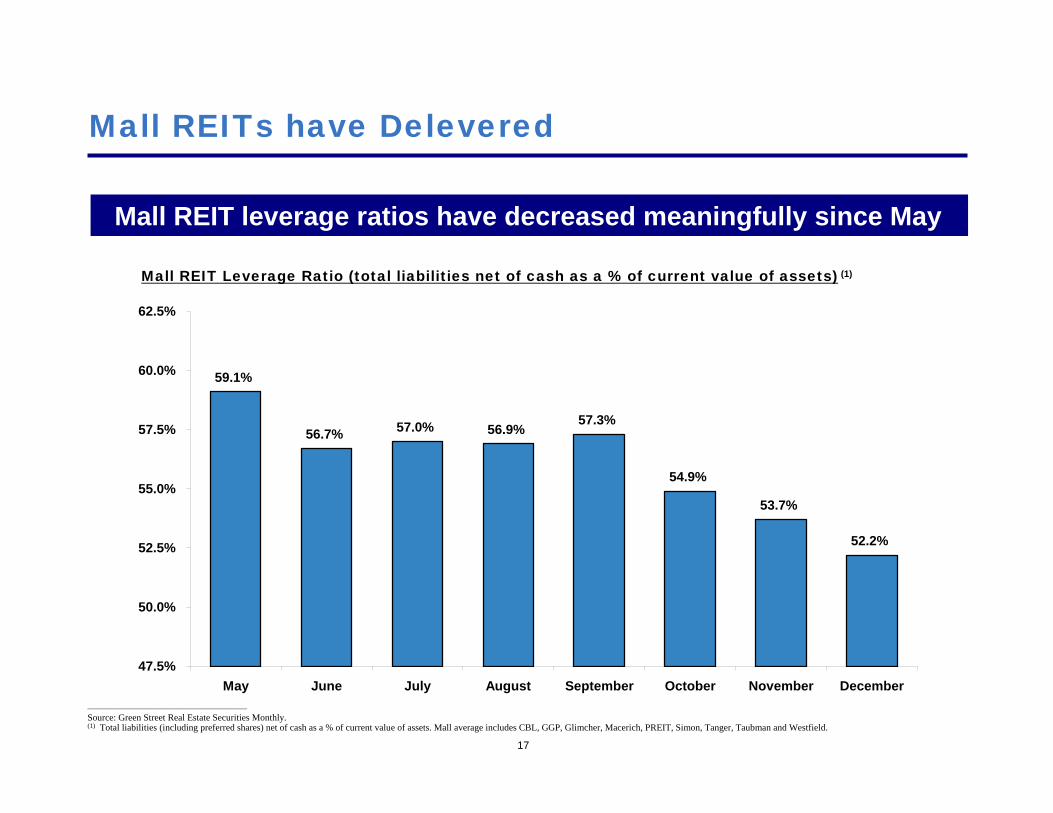
17
Mall REITs have Delevered
Mall REIT leverage ratios have decreased meaningfully since May
59.1%
56.7% 57.0% 56.9%57.3%
54.9%
53.7%
52.2%
47.5%
50.0%
52.5%
55.0%
57.5%
60.0%
62.5%
May June July August September October November December
Mall REIT Leverage Ratio (total liabilities net of cash as a % of current value of assets) (1)
________________________________________________
Source: Green Street Real Estate Securities Monthly.(1) Total liabilities (including preferred shares) net of cash as a % of current value of assets. Mall average includes CBL, GGP, Glimcher, Macerich, PREIT, Simon, Tanger, Taubman and Westfield.

Cap Rates Have Declined Substantially
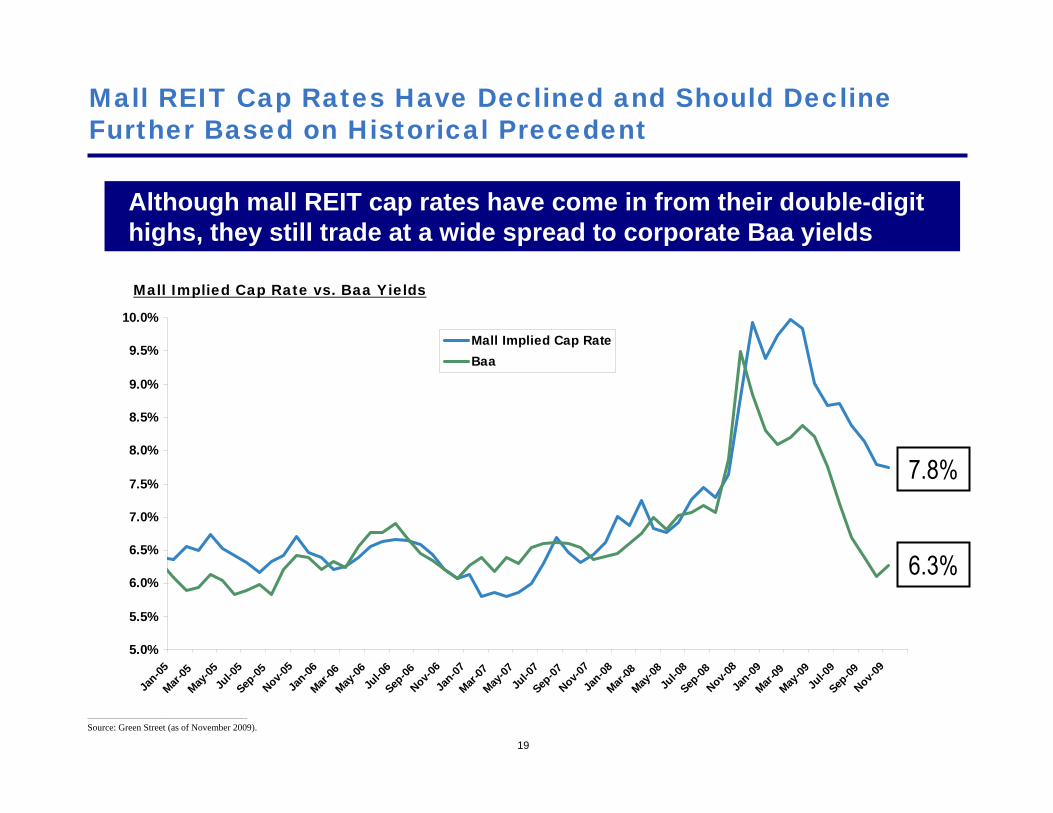
19
Mall REIT Cap Rates Have Declined and Should Decline Further Based on Historical Precedent
Although mall REIT cap rates have come in from their double-digit highs, they still trade at a wide spread to corporate Baa yields
5.0%
5.5%
6.0%
6.5%
7.0%
7.5%
8.0%
8.5%
9.0%
9.5%
10.0%
Jan-05
Mar-05
May-05
Jul-0
5Sep
-05Nov-0
5Ja
n-06Mar
-06May
-06Ju
l-06
Sep-06
Nov-06
Jan-07
Mar-07
May-07
Jul-0
7Sep
-07Nov-0
7Ja
n-08Mar
-08May
-08Ju
l-08
Sep-08
Nov-08
Jan-09
Mar-09
May-09
Jul-0
9Sep
-09Nov-0
9
Mall Implied Cap RateBaa
Mall Implied Cap Rate vs. Baa Yields
7.8%
6.3%
________________________________________________
Source: Green Street (as of November 2009).

Store Closure Fears were Overblown

21
White Knights
Although there have been some tenant bankruptcies year-to-date, white knight buyers have minimized store liquidations
Selected Bankruptcies White Knight
Comments
Eddie Bauer Jun-09
Golden Gate Aug-09
In July, CCMP bid $202mm for Eddie Bauer w/ plan to liquidate 121 of 371 stores
In August, Golden Gate beat out CCMP w/ $286mm bid
Golden Gate plans to keep “the substantial majority” of the company’s stores open
Ritz Camera Feb-09
David Ritz Jul-09
David Ritz and RCI Acquisition LLC beat out three liquidators at auction
Ritz will attempt to keep all the remaining 375 stores open, though some closures still expected
Filene’s May-09
Vornado / Syms Jun-09
In May, Crown Acquisition bid $22mm for Filene’s w/ plan to liquidate 8 stores
In June, a joint venture formed by Syms and Vornado beat out Crown w/ a $62.4mm bid
Vornado / Syms plan to operate Filene’s remaining 22 outlets and re-open a location in Boston
J. Jill Out of court
Golden Gate Jun-09
At the beginning of 2009, Talbots had been considering winding down its J. Jill concept
In June, Golden Gate acquired the J. Jill retail chain for $75mm
Golden Gate plans to keep open 204 of the existing 279 locations open
Store closures that have arisen in bankruptcy have tended to be in low-quality, underperforming locations

22
Liquidations Could Be Good For Malls
Retailers with successful concepts are acquiring leases from liquidating retailers, allowing malls to refresh their product offerings with concepts that should drive increased traffic
Selected Liquidations
Strategic Acquirer(s)
Comments
Gottschalks Jan-09
Forever 21 Jun-09
Gottschalks auctioned to liquidation company, Great American Group
13 retail spaces sold to Forever 21 on June 10, 2009
Joe’s Sports Mar-09
Dick’s Sporting Goods Jul-09
Joe’s Sports sold to liquidator Gordon Brothers for $61mm
6 retail spaces sold to Dick’s Sporting Goods in July, which will be opened by year-end
Mervyn’s Jul-08
Forever 21 / Kohls Dec-08
In December, Kohls and Forever 21 acquired 46 Mervyn’s leases for $6.25mm
Forever 21 primarily focused on Mervyn’s mall-based locations
Speculation that Forever 21 has acquired additional Mervyn’s spaces since December
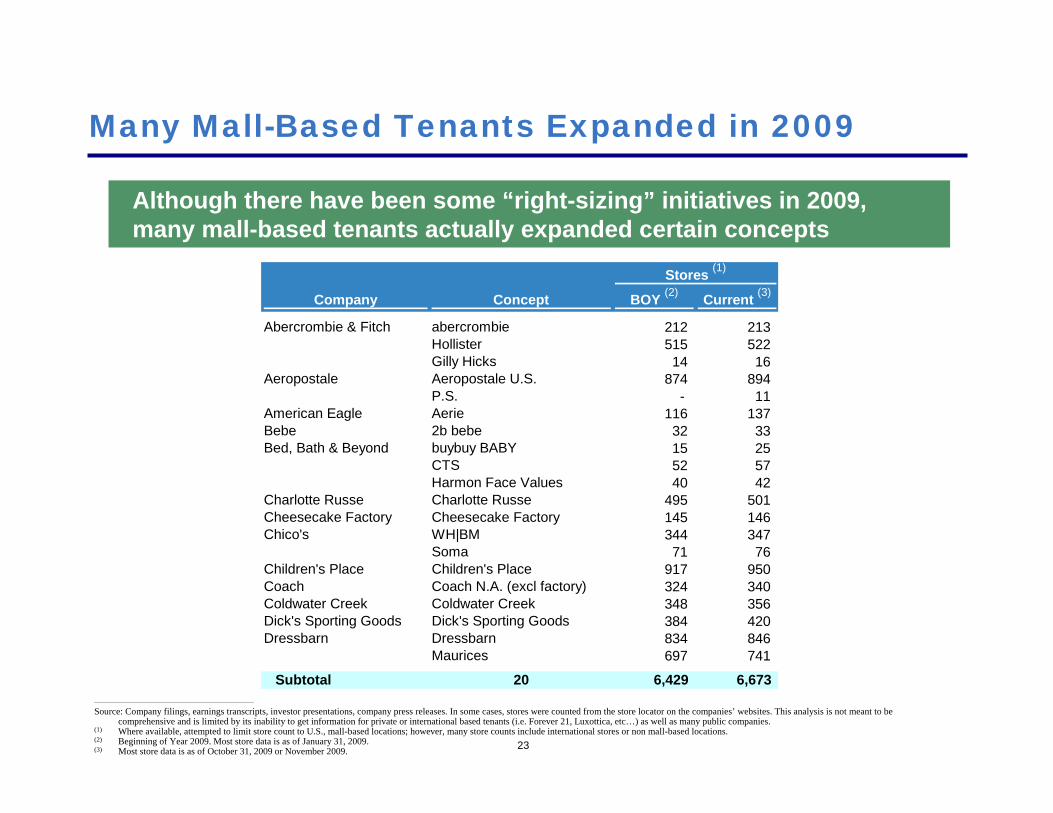
23
Many Mall-Based Tenants Expanded in 2009
Although there have been some “right-sizing” initiatives in 2009, many mall-based tenants actually expanded certain concepts
________________________________________________
Source: Company filings, earnings transcripts, investor presentations, company press releases. In some cases, stores were counted from the store locator on the companies’ websites. This analysis is not meant to be comprehensive and is limited by its inability to get information for private or international based tenants (i.e. Forever 21, Luxottica, etc…) as well as many public companies.
(1) Where available, attempted to limit store count to U.S., mall-based locations; however, many store counts include international stores or non mall-based locations.(2) Beginning of Year 2009. Most store data is as of January 31, 2009.(3) Most store data is as of October 31, 2009 or November 2009.
Stores (1)
Company Concept BOY (2) Current (3)
Abercrombie & Fitch abercrombie 212 213 Hollister 515 522 Gilly Hicks 14 16
Aeropostale Aeropostale U.S. 874 894 P.S. - 11
American Eagle Aerie 116 137 Bebe 2b bebe 32 33 Bed, Bath & Beyond buybuy BABY 15 25
CTS 52 57 Harmon Face Values 40 42
Charlotte Russe Charlotte Russe 495 501 Cheesecake Factory Cheesecake Factory 145 146 Chico's WH|BM 344 347
Soma 71 76 Children's Place Children's Place 917 950 Coach Coach N.A. (excl factory) 324 340 Coldwater Creek Coldwater Creek 348 356 Dick's Sporting Goods Dick's Sporting Goods 384 420 Dressbarn Dressbarn 834 846
Maurices 697 741
Subtotal 20 6,429 6,673
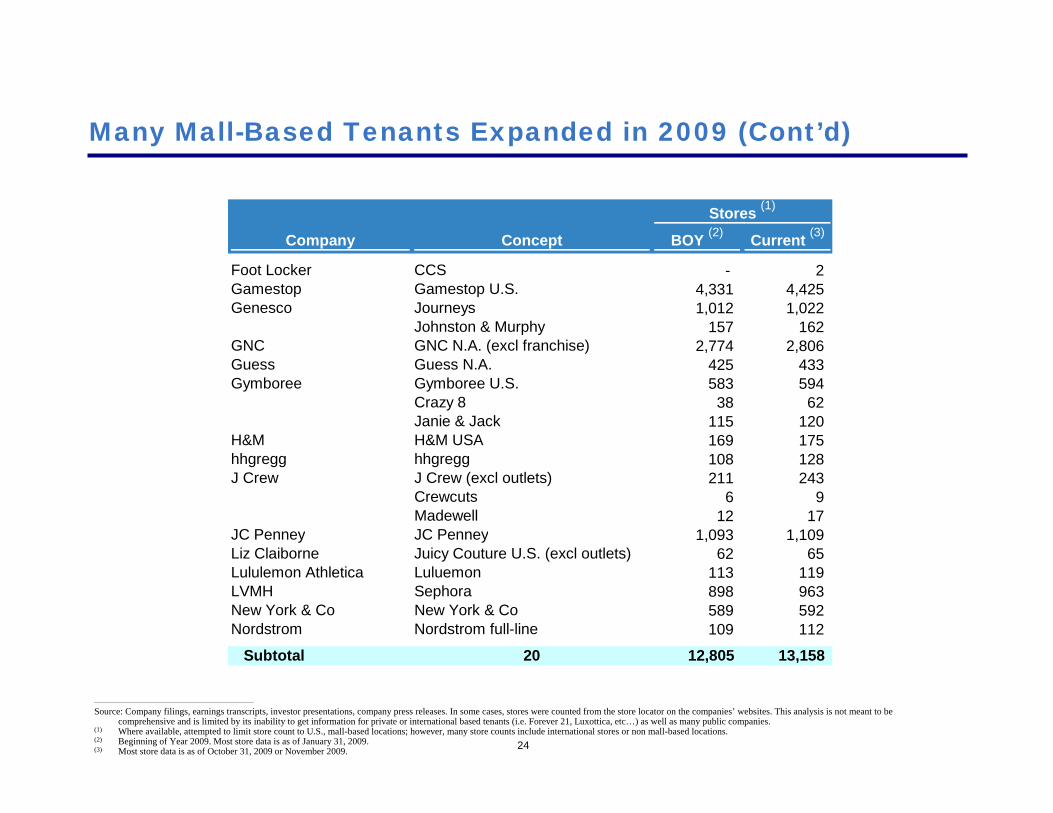
24
Many Mall-Based Tenants Expanded in 2009 (Cont’d)
________________________________________________
Source: Company filings, earnings transcripts, investor presentations, company press releases. In some cases, stores were counted from the store locator on the companies’ websites. This analysis is not meant to be comprehensive and is limited by its inability to get information for private or international based tenants (i.e. Forever 21, Luxottica, etc…) as well as many public companies.
(1) Where available, attempted to limit store count to U.S., mall-based locations; however, many store counts include international stores or non mall-based locations.(2) Beginning of Year 2009. Most store data is as of January 31, 2009.(3) Most store data is as of October 31, 2009 or November 2009.
Stores (1)
Company Concept BOY (2) Current (3)
Foot Locker CCS - 2 Gamestop Gamestop U.S. 4,331 4,425 Genesco Journeys 1,012 1,022
Johnston & Murphy 157 162 GNC GNC N.A. (excl franchise) 2,774 2,806 Guess Guess N.A. 425 433 Gymboree Gymboree U.S. 583 594
Crazy 8 38 62 Janie & Jack 115 120
H&M H&M USA 169 175 hhgregg hhgregg 108 128 J Crew J Crew (excl outlets) 211 243
Crewcuts 6 9 Madewell 12 17
JC Penney JC Penney 1,093 1,109 Liz Claiborne Juicy Couture U.S. (excl outlets) 62 65 Lululemon Athletica Luluemon 113 119 LVMH Sephora 898 963 New York & Co New York & Co 589 592 Nordstrom Nordstrom full-line 109 112
Subtotal 20 12,805 13,158

25
Many Mall-Based Tenants Expanded in 2009 (Cont’d)
________________________________________________
Source: Company filings, earnings transcripts, investor presentations, company press releases. In some cases, stores were counted from the store locator on the companies’ websites. This analysis is not meant to be comprehensive and is limited by its inability to get information for private or international based tenants (i.e. Forever 21, Luxottica, etc…) as well as many public companies.
(1) Where available, attempted to limit store count to U.S., mall-based locations; however, many store counts include international stores or non mall-based locations.(2) Beginning of Year 2009. Most store data is as of January 31, 2009.(3) Most store data is as of October 31, 2009 or November 2009.
Stores (1)
Company Concept BOY (2) Current (3)
Payless Stride Rite 355 360 Restoration Hardware Restoration Hardware (excl outlets) 101 109 Rue21 Rue21 449 537 Stage Stores Bealls, Palais Royal, Peebles, Goody's 739 751 Talbots Talbots 587 589 The Buckle The Buckle 387 405 The Gap Banana Republic N.A. 573 582 The Limited Victoria's Secret 1,043 1,046
Henri Bendel 5 9 Tiffany & Co Tiffany U.S. 76 78 Urban Outfitters Urban Outfitters 142 151
Anthropologie 121 133 Free People 30 34
VF Corp VF-operated retail stores 698 733 Wet Seal Wet Seal 409 420 Williams-Sonoma West Elm 36 40
Williams-Sonoma Home 10 11 Zumiez Zumiez 343 378
Subtotal 18 6,104 6,366
Total 58 25,338 26,197

26
92.2% 92.5% 92.6% 92.5%
90.9% 91.0%91.4%
85.0%
87.5%
90.0%
92.5%
95.0%
97.5%
100.0%
Q1'08 Q2'08 Q3'08 Q4'08 Q1'09 Q2'09 Q3'09
Mall Occupancy is Stable
In Q3’09, occupancy was up 40bps sequentially
Occupancy is stable despite deterioration in lower-quality malls
Mall REIT Occupancy (GGP & Simon) (1)
________________________________________________(1) Average of Simon and GGP. Simon data excludes regional Mills malls.

27
Survival of the Largest
Comparing the occupancy performance of Simon & GGP to that of smaller mall REITs shows the benefit of scale in leasing negotiations
Large Mall REIT Occupancy vs. Small Mall REIT Occupancy (1)
________________________________________________(1) Average regional mall occupancy. Excludes anchors.
Glimcher is excluded from the analysis as its occupancy includes temporary tenants that are excluded from other mall REIT reported occupancy metrics.
2.4% 2.7% 2.7% 2.7% 3.3% 3.4% 3.6%Difference
91.4%91.0%90.9%
92.5%92.6%92.5%92.2%
87.8%87.6%87.5%
89.8%89.9%89.8%89.8%
85.0%
87.5%
90.0%
92.5%
95.0%
Q1'08 Q2'08 Q3'08 Q4'08 Q1'09 Q2'09 Q3'09
Large Mall REITs (GGP & Simon)
Small Mall REITs(TCO, PEI, MAC)

28
Bad Debt Expense
Mall REIT provisions for doubtful accounts have not increased materially
TTM Provision for Doubtful Accounts as a % of TTM Revenue (GGP & Simon) (1)
________________________________________________(1) Average of Simon and GGP. GGP data only includes revenue from the mall segment
(i.e. excluding MPCs and GGMI).
0.47% 0.47%
0.32%0.41%
0.30% 0.33%
0.46% 0.47%
0.61%
0.80%0.87% 0.82%
0.00%
0.50%
1.00%
1.50%
2.00%
Q4'06 Q1'07 Q2'07 Q3'07 Q4'07 Q1'08 Q2'08 Q3'08 Q4'08 Q1'09 Q2'09 Q3'09

Tenants Are Much Better Capitalized

30
60%70%80%90%
100%110%120%130%140%150%160%170%180%
Jan-09 Mar-09 May-09 Jul-09 Sep-09 Dec-09
S&P 500 Mall REIT Tenant Index
30
Mall REIT tenant stock prices have outperformed the S&P 500 by more than 30% year-to-date
________________________________________________
Source: Capital IQ. Stock price data through December 4, 2009.(1) Market cap weighted average index of GGP’s publicly traded top 10 tenants (Gap, Limited, Abercrombie, Foot Locker, American Eagle, JC Penney, Macy’s and Genesco).
(1)
+50%
+19%
Tenant Stock Price Performance
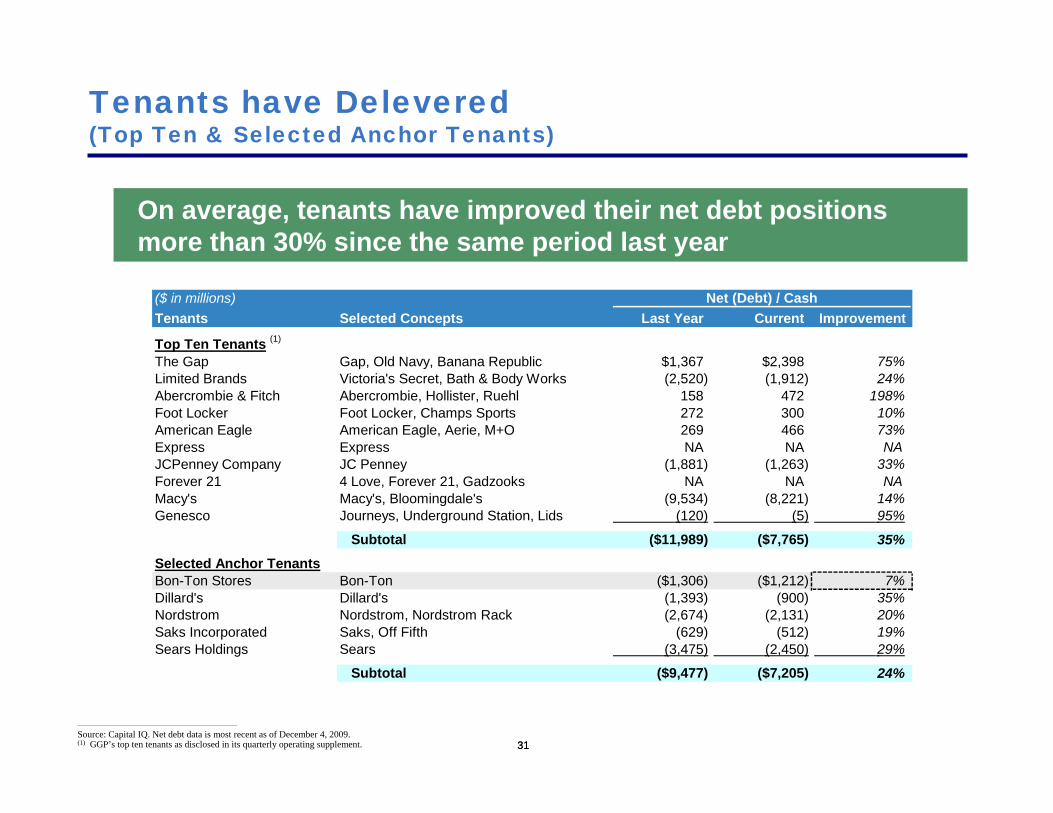
3131
On average, tenants have improved their net debt positions more than 30% since the same period last year
________________________________________________
Source: Capital IQ. Net debt data is most recent as of December 4, 2009.(1) GGP’s top ten tenants as disclosed in its quarterly operating supplement.
Tenants have Delevered(Top Ten & Selected Anchor Tenants)
($ in millions) Net (Debt) / CashTenants Selected Concepts Last Year Current Improvement
Top Ten Tenants (1)
The Gap Gap, Old Navy, Banana Republic $1,367 $2,398 75% Limited Brands Victoria's Secret, Bath & Body Works (2,520) (1,912) 24% Abercrombie & Fitch Abercrombie, Hollister, Ruehl 158 472 198% Foot Locker Foot Locker, Champs Sports 272 300 10% American Eagle American Eagle, Aerie, M+O 269 466 73% Express Express NA NA NAJCPenney Company JC Penney (1,881) (1,263) 33% Forever 21 4 Love, Forever 21, Gadzooks NA NA NAMacy's Macy's, Bloomingdale's (9,534) (8,221) 14% Genesco Journeys, Underground Station, Lids (120) (5) 95%
Subtotal ($11,989) ($7,765) 35% Selected Anchor TenantsBon-Ton Stores Bon-Ton ($1,306) ($1,212) 7% Dillard's Dillard's (1,393) (900) 35% Nordstrom Nordstrom, Nordstrom Rack (2,674) (2,131) 20% Saks Incorporated Saks, Off Fifth (629) (512) 19% Sears Holdings Sears (3,475) (2,450) 29%
Subtotal ($9,477) ($7,205) 24%

32
($ in millions) Net (Debt) / CashTenants Selected Concepts Last Year Current Improvement
Selected In-line TenantsAnntaylor Anntaylor, Anntaylor Loft $73 $136 87% Aeropostale Aeropostale, P.S. kids 107 286 166% Bebe Stores Bebe, Bebe Sport, 2b bebe 120 201 68% Borders Borders, Waldenbooks (487) (375) 23% The Buckle The Buckle 118 94 (21%) Chico's Fas Chico's, Soma, WH | BM 256 423 65% Claire's Stores Claire's, Icing (2,382) (2,364) 1% The Children's Place The Children's Place 101 102 1% Coach Coach 407 970 138% Hot Topic Hot Topic, Torrid 60 91 52% Liz Claiborne Juicy Couture, Kate Spade, Lucky Brand (924) (803) 13% Pacfic Sunwear Stores D.E.M.O., Pacsun (38) 16 141% RadioShack Radioshack 63 169 170% Tiffany & Co. Tiffany & Co. (661) (378) 43% Wet Seal Wet Seal, Arden B 125 141 13% Zales Corporation Zales, Piercing Pagoda (329) (442) (34%) Zumiez Zumiez 62 82 33%
Subtotal ($3,329) ($1,652) 50%
Total ($24,795) ($16,622) 33%
32
On average, tenants have improved their net debt positions more than 30% since the same period last year
________________________________________________
Source: Capital IQ. Net debt data is most recent as of December 4, 2009.(1) GGP’s top ten tenants as disclosed in its quarterly operating supplement.
Tenants have Delevered (Cont’d)(Selected In-line Tenants)

3333
At the beginning of 2009, Bon-Ton was perceived to be on the verge of bankruptcy. Today, it’s stock has increased more than 10 times. In November, it secured a 3.5 year extension on its $750mm credit facility
Case Study: Bon-Ton
$0
$2
$4
$6
$8
$10
$12
$14
$16
Jan-09 Mar-09 May-09 Jul-09 Sep-09 Nov-09
$13
Bon-Ton Stock Price Performance (YTD)
________________________________________________
Source: Capital IQ (as of 12/4/09).

3434
Like Bon-Ton, many feared Claire’s would seek bankruptcy protection. Year-to-date, its debt has traded up more than 4 times
Case Study: Claire’s
________________________________________________
Source: Bloomberg.

3535
Zales’ net debt increased YoY primarily as the result of accelerating its payment of vendor merchandise receipts into Fiscal Q1. Going forward, its liquidity should benefit from the recently passed Business Assistance Act of 2009, which extends the period for which companies can carry-back NOLs
Case Study: Zales
“The recently-enacted Business Assistance Act of 2009, which extended the carry-back period for net operating losses from two to five years, is expected to provide a significant cash refund and tax benefit to us in fiscal 2010.”
– Matt Appel, CFO of Zales Corp., November 24, 2009
We expect many other retailers will benefit from the Business Assistance Act
Rent Relief Has Been Minimal

3737
Simon expects to lose less than 2bps of total revenue as the result of rent relief concessions in 2009
Rent Relief Less of an Issue than Originally Anticipated
“Our 2009 rent relief total will be under $10 million, as in the $7 million to $8 million range. But as I think we said on the call last quarter, we hadn’t seen much of it year-to-date. So it’s a little back-end weighted, and as you look at the impact of average base rent it could have a nominal impact. But it’s a small number in the context of the size of our income statements.”
– Steve Sterrett, CFO of Simon Property Group, October 30, 2009

Tenant Sales are Down, but Inventoriesare Down Even More While Retailer CashFlows Have Improved Materially

39
A New Paradigm: Sales vs. Cash Flow
Old Paradigm:Focus on Sales
From 2003 to 2007, retailers achieved high sales with bloated cost structures. Driven by Wall Street’s insatiable demand for same-store sales growth, retailers overspent to achieve high rates of same-store sales growth
Even though mall REITs derive a small percentage of NOI from overage rent, retail real estate investors and landlords have focused disproportionately on tenant sales
New Paradigm:Focus on Cash Flow
In 2009, retailers have used the economic crisis to re-shape their cost structures and improve inventory management to generate more cash flow at meaningfully lower sales levels
Retailer focus has shifted from growing sales to improving profit margins and increasing cash flow
As same-store sales again begin to increase, retailer profitability should accelerate

40
($ in millions) Inventory Memo:Tenants Last Year Current Decrease Nov SSS
Top Ten Tenants (1)
The Gap $2,224 $1,999 (10%) 0% Limited Brands 1,648 1,426 (13%) 3% Abercrombie & Fitch 505 347 (31%) (17%) Foot Locker 1,262 1,228 (3%) NAAmerican Eagle 422 425 1% (2%) Express NA NA NA NAJCPenney Company 4,471 4,018 (10%) (6%) Forever 21 NA NA NA NAMacy's 7,161 6,622 (8%) (6%) Genesco 380 360 (5%) NA
Subtotal / Wtd Avg $18,072 $16,425 (9%) (5%) Selected Anchor TenantsBon-Ton Stores $979 $901 (8%) (6%) Dillard's 2,243 1,752 (22%) (11%) Nordstrom 1,278 1,193 (7%) 2% Saks Incorporated 1,016 799 (21%) (26%) Sears Holdings 11,364 10,805 (5%) NA
Subtotal / Wtd Avg $49,152 $44,876 (9%) (9%)
40
Comparing November same-store sales to October inventory levels partially explains why tenant sales were down in November
________________________________________________
Source: Capital IQ. inventory data is most recent as of December 4, 2009.(1) GGP’s top ten tenants as disclosed in its quarterly operating supplement.
It’s Hard to Increase Sales when there is Less on the Shelves(Top Ten & Selected Anchor Tenants)
Inventories have declined more than same-store sales

41
($ in millions) Inventory Memo:Tenants Last Year Current Decrease Nov SSSSelected In-line TenantsAnntaylor $275 $211 (23%) NAAeropostale 207 222 7% 7% Bebe Stores 49 37 (26%) NABorders 1,257 1,157 (8%) NAThe Buckle 118 118 0% 1% Chico's Fas 187 160 (15%) NAClaire's Stores 149 139 (7%) NAThe Children's Place 233 251 8% (13%) Coach 402 338 (16%) NAHot Topic 95 91 (3%) (10%) Liz Claiborne 549 410 (25%) NAPacfic Sunwear Stores 234 168 (28%) NARadioShack 681 737 8% NATiffany & Co. 1,639 1,542 (6%) NAWet Seal 41 40 (3%) (5%) Zales Corporation 985 902 (8%) NAZumiez 82 76 (7%) (9%)
Subtotal / Wtd Avg $7,181 $6,599 (8%) (4%)
Total $74,406 $67,900 (9%) (6%)
41
Comparing November same-store sales to October inventory levels partially explains why tenant sales were down in November
________________________________________________
Source: Capital IQ. inventory data is most recent as of December 4, 2009.(1) GGP’s top ten tenants as disclosed in its quarterly operating supplement.
Inventories have declined more than same-store sales
It’s Hard to Increase Sales when there is Less on the Shelves(Selected In-line Tenants)

42
($ in millions) Cash Flow from Operations InventoryTenants Q3'08 Q3'09 Improvement Decrease
Top Ten Tenants (1)
The Gap $272 $432 59% (10%) Limited Brands (244) (114) 53% (13%) Abercrombie & Fitch NA NA NA (31%) Foot Locker NA NA NA (3%) American Eagle 76 65 (15%) 1% Express NA NA NA NAJCPenney Company (189) (30) 84% (10%) Forever 21 NA NA NA NAMacy's (275) (52) 81% (8%) Genesco NA NA NA (5%)
Subtotal ($361) $301 183% (9%) Selected Anchor TenantsBon-Ton Stores NA NA NA (8%) Dillard's (69) 78 214% (22%) Nordstrom 83 104 25% (7%) Saks Incorporated NA NA NA (21%) Sears Holdings (962) (35) 96% (5%)
Subtotal ($1,697) $430 125% (9%)
42
Tenant cash flows have gone from materially negative to materially positive. This is all the more impressive given that Q3 is usually cash flow negative for retailers as they prepare for the holidays
________________________________________________
Source: Capital IQ. Most Q3 periods ended in October.(1) GGP’s top ten tenants as disclosed in its quarterly operating supplement.
Lower Inventory = Higher Cash Flow(Top Ten & Selected Anchor Tenants)
Inventory declines, coupled with cost reduction measures, has resulted in materially higher tenant cash flows

43
($ in millions) Cash Flow from Operations InventoryTenants Q3'08 Q3'09 Improvement DecreaseSelected In-line TenantsAnntaylor ($1) $8 715% (23%) Aeropostale NA NA NA 7% Bebe Stores 15 (10) (168%) (26%) Borders NM NM NM (8%) The Buckle NA NA NA 0% Chico's Fas 1 56 3893% (15%) Claire's Stores NA NA NA (7%) The Children's Place 61 79 29% 8% Coach 77 241 214% (16%) Hot Topic 14 17 22% (3%) Liz Claiborne (121) (101) 17% (25%) Pacfic Sunwear Stores (7) (7) (5%) (28%) RadioShack 54 (20) (137%) 8% Tiffany & Co. 1 99 8909% (6%) Wet Seal 10 7 (36%) (3%) Zales Corporation NA NA NA (8%) Zumiez NA NA NA (7%)
Subtotal $104 $369 253% (8%)
Total ($1,953) $1,100 156% (9%)
43
Tenant cash flows have gone from materially negative to materially positive. This is all the more impressive given that Q3 is usually cash flow negative for retailers as they prepare for the holidays
________________________________________________
Source: Capital IQ. Most Q3 periods ended in October.(1) GGP’s top ten tenants as disclosed in its quarterly operating supplement.
Lower Inventory = Higher Cash Flow (Cont’d)(Selected In-line Tenants)
Inventory declines, coupled with cost reduction measures, has resulted in materially higher tenant cash flows
Which is better for the landlord,tenant sales growth or tenantcash flow growth?
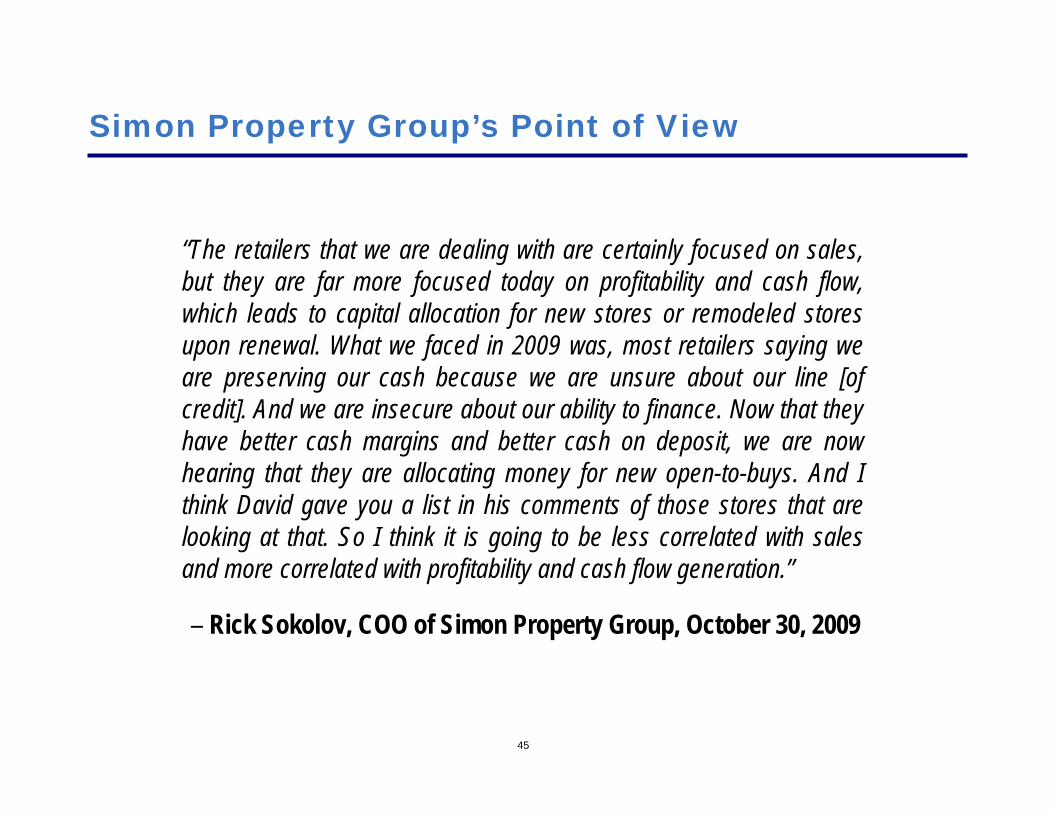
45
Simon Property Group’s Point of View
“The retailers that we are dealing with are certainly focused on sales, but they are far more focused today on profitability and cash flow, which leads to capital allocation for new stores or remodeled stores upon renewal. What we faced in 2009 was, most retailers saying we are preserving our cash because we are unsure about our line [ofcredit]. And we are insecure about our ability to finance. Now that they have better cash margins and better cash on deposit, we are now hearing that they are allocating money for new open-to-buys. And I think David gave you a list in his comments of those stores that are looking at that. So I think it is going to be less correlated with sales and more correlated with profitability and cash flow generation.”
– Rick Sokolov, COO of Simon Property Group, October 30, 2009

46
On the sales side, I want to talk about sales and talk about our leasing activity and our leasing spread. As you know in the fourth quarter of last year, sales were off in general around 15% give or take, for most of the major mall owners including ourselves. That was a disastrous comp sales decrease from a retailer's viewpoint. Because it was totally unexpected from the retailer's viewpoint. As a result of that, it put the retailers into a freeze mode, not only into a freeze mode, they even got into a cutback mode, because it was totally unexpected. Over the course of this year, the retailers made major changes in their cost structure, major changes in their inventory levels and major changes in their business plan. Made plans for their businesses to be down roughly 10 to 15%.
In February this year, we told you that we anticipated that for the first three quarters of this year, that we anticipated double digit sales declines, and at the time, frankly, that was not a very thrilling prospect. In fact, we've had double digit sales declines, off 12% in the first quarter, 11% in the second quarter, 9% in the third. But we're seeing a moderation in the decreases, but more importantly, and I said this on the last call, is that you have to be careful about the comp sales, because this year the difference between the first three quarters of this year and the fourth quarter of last year is that our retailers planned to have their sales be off at this level. This was their business plan. They are meeting their business plan.
They are maintaining their margins. So being off 10% when you plan to be off 10% and you keep your margin is a significantly different situation than being off 15% when it wasn't your plan and your margins were decimated. As a consequence of that, it's put our retailers into a mood where they're willing to talk about new leasing and we're able to look at beginning to have some pickup in store growth. The moods of the retailers, and you've heard this on the other conference calls with our peers, is improving dramatically. They went from being in a freeze mode in the fourth quarter of last year, to things began to fall out in the second quarter of this year around ICSC. Now we're really having positive conversations with our retailers about how they can grow their business and how we can grow our business together.
– Art Coppola, Chairman & CEO of Macerich, November 5, 2009
Macerich’s Point of View
Summary

48
At the Beginning of 2009, The World was a Very Different Place for Mall REITs
The U.S. economy was on the verge of a depression
The U.S. consumer had hit the wall
Credit markets were closed
Mall REIT balance sheets were dangerously leveraged
Cap rates increased and transactions stopped as bid-ask spreads widened
Bankruptcy risk and tenant “right-sizing” initiatives were expected to result in massive store closures
Rent relief was a serious concern
Tenant sales were expected to fall off a cliff
SinceThen…

49
The U.S. economy has recovered
The U.S. consumer is beginning to bounce back
The credit markets have improved
Mall REIT balance sheets have strengthened
Cap rates have declined substantially
Store closure fears were overblown
Tenants are much better capitalized
Rent relief has been minimal
Tenant sales are down, but inventories are down even more while retailer cash flows have improved materially
The World has Improved Dramatically

Why We Are Optimistic About the Next Five Years

51
We Performed a Bottoms Up Analysis to Inform Our Outlook for Mall REITs
Using public information we analyzed:
Store expansion plans for 2010 and beyond
New concepts either currently being rolled out or upcoming
Revenue forecasts
Profit forecasts
Source of data for our analysis:Evaluated tenant websites, public filings, earnings transcripts, investor presentations and press releases; mall REIT earnings transcripts; industry trade publications and news articles to develop a sense of tenant expansions and new concepts on tap for 2010 and beyond
Gathered consensus equity research estimates for tenant revenue and EBITDA projections through 2010 and 2011

52
Expansions / New Concepts
________________________________________________
Note: This list is not meant to be comprehensive. It is based off publicly disclosed expansion / new concept plans. Some of these tenants are also considering selectively closing stores as well.
Though there will continue to be store closures in 2010, there will be store openings as well. More than half the companies we reviewed were either planning to add new stores or roll out new concepts
Aeropostale A'gaci American EagleRolling out 25-30 PS Kids new concept in '10 Growing store counts (per Simon) Plans to expand 77kids pop-up concept to a 25 Aeropostale stores in 2010 permanent brick & mortar store in 2010Apple Bebe Bed Bath & Beyond20-25 domestic stores in 2010 6 new stores in 2010 Expects to continue to add buybuy Baby
Expanding 2b bebe & PH8 concepts locationsBest Buy The Buckle Build-A-BearSees Best Buy Mobile as a growth vehicle Continues to expand and has added 18 Sees potential for 350 stores in N.A.
going forward stores YTDCalifornia Pizza Kitchen Charlotte Russe Cheesecake FactoryGrowing store counts (per Simon) On track to open 20 stores in F2009 Testing Grand Lux and Rock Pan Asian
Already signed 11 leases for 2010 Kitchen conceptsChico's The Children's Place CJ Banks40 new stores in 2010 Rolling out new Tech II store format Will opportunistically pursue storeExpanding Soma concept expansions in 2010, incl jewelry conceptCoach Coldwater Creek Cotton On20 new stores in N.A. in 2010 Sees opportunity to grow store base when Australian retailer looking to expand store
margins improve base from 600 to the 1,000s

53
Expansions / New Concepts (Cont’d)
________________________________________________
Note: This list is not meant to be comprehensive. It is based off publicly disclosed expansion / new concept plans. Some of these tenants are also considering selectively closing stores as well.
Dave & Buster's Destination Maternity Dick's Sporting GoodsGrowing store counts (per Simon) 12 to 17 stores in 2010 Sees potential for 800 stores nationwide
Opening new multi-brand store concept (~420 in Oct-09)Dressbarn Five Below Footlocker15 Dressbarn stores in 2010 Aggressive growth plan -- 100+ stores in Plans to build out its CCS new concept in35 Maurices in 2010 the next 3 years 2010Forever 21 Gamestop GenescoRapid expansion in 2009 300 US stores in 2010 60 to 70 stores in 2010, incl recentlyRolling out Faith21 line acquired Sports Fanatic conceptGNC Guess GymboreeTesting new prototype store 60 accessory stores in 2010 (new concept) Goal of opening a minimum of 50 Crazy 8Plans to open more domestic stores in stores next year
2010 than 2009 (>30)H&M hhgregg J CrewFlagged US as market where it plans to At least 45 new stores in 2010 Considering rollout of Madewell concept
grow the most in 2010Jones Apparel Group Jos A Bank LimitedRolling out 6 Shoe Woo test stores by end Accelerating expansion plan to open 30 to 40 Expanding Henri Bendel in US
of F2009 stores in 2010

54
Expansions / New Concepts (Cont’d)
________________________________________________
Note: This list is not meant to be comprehensive. It is based off publicly disclosed expansion / new concept plans. Some of these tenants are also considering selectively closing stores as well.
Liz Claiborne Lululemon MattelRolling out LCNY new concept Sees potential for over 300 stores in N.A. Expects to open more American Girl stores
(119 in Oct-09) stores over timeMichael Kors Microsoft NordstromGrowing store counts (per Simon) Rolling out retail store to compete with Apple 3 full-line stores in 2010
(new concept) 15 Rack stores in 2010Pandora Jewelry Payless Red RobinHas expanded to 10 US stores since Growing Sperry TopSider stores (per Simon) Growing store counts (per Simon)
opening first store in NC in 2007 Looking to expand Stride Rite in 2010Restoration Hardware Rue21 Saks (Off Fifth)Rolling out Baby & Child concept Sees opportunity to grow store base from Growing store counts (per Simon)
527 to >1,000 in 5 yrsRolling out Rue21! larger box concept
Sephora Stage Stores TargetPursuing expansions in US, France and Increase from ~750 to 1,000 stores by Looking to grow store base, but they are
China 2014 constrained by new shopping center dvlpmtLooking to move into existing malls
Tiffany TJ Maxx Urban OutfittersObjective to open 14 stores (net) in F2009 Growing store counts (per Simon) 50 new stores next yearExperimenting w/ new, smaller conceptVF Corp Wet Seal Williams SonomaSelectively opening stores Sees opportunity to nearly double its US Rolling out PBteen conceptExpects to open 80 stores in F2009 store base (~400 stores)
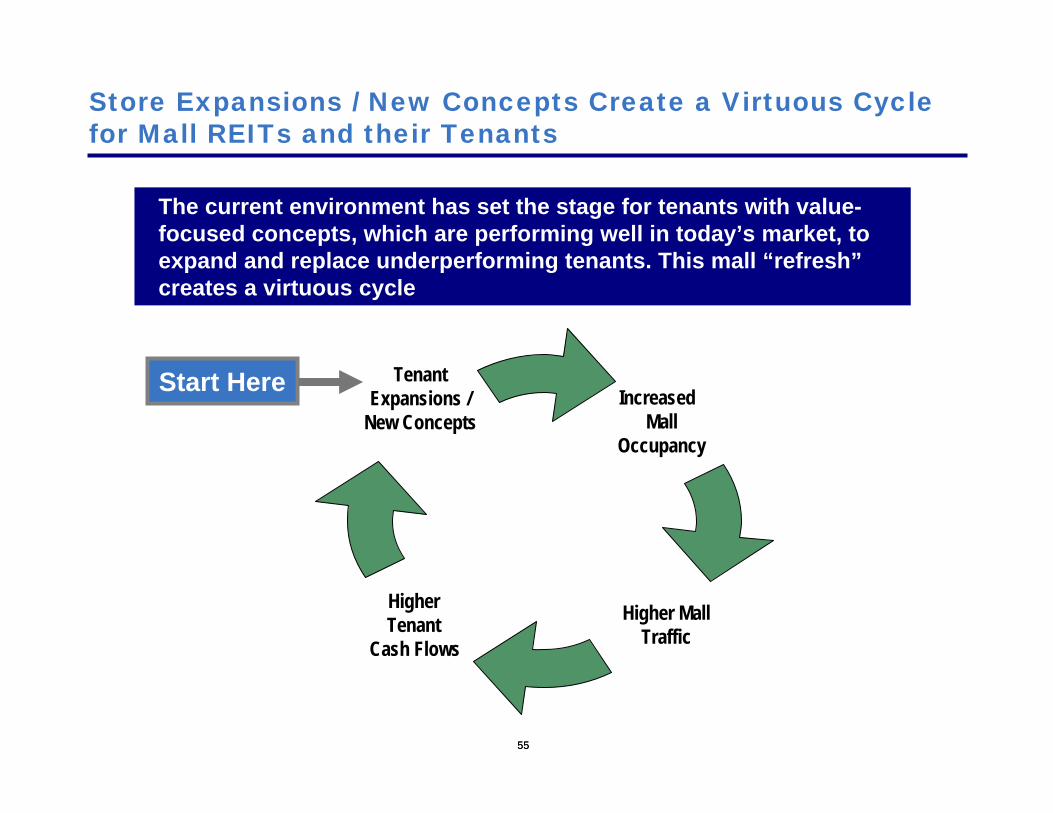
5555
The current environment has set the stage for tenants with value-focused concepts, which are performing well in today’s market, to expand and replace underperforming tenants. This mall “refresh”creates a virtuous cycle
Store Expansions / New Concepts Create a Virtuous Cycle for Mall REITs and their Tenants
Increased Mall
Occupancy
Higher Tenant
Cash Flows
Tenant Expansions /
New Concepts
Higher MallTraffic
Start Here

5656
Supply Constraints Enhance Virtuous Cycle
________________________________________________
Source: Goldman Sachs equity research November 2009.
“And frankly, when you look at the capital situation today, the construction in the retail sector is at a 20-year low. We certainly anticipate it will remain there, and the lack of new supply can only hopefully help the demand side for the existing product.”
– Rick Sokolov, COO of Simon Property Group, December 4, 2009

5757
Low Store Build-out Costs Enhance Virtuous Cycle
“A lot of contractors out there, you have a lot of architect firms, you have a lot of vendors that are doing fixtures, a lot of them are very aggressive right now and doing deals. So if you’re going to grow and open up stores, there’s an opportunity to really drive down your build-out costs there .”
– John Smith, SVP of Development, Collective Brands, October 6, 2009
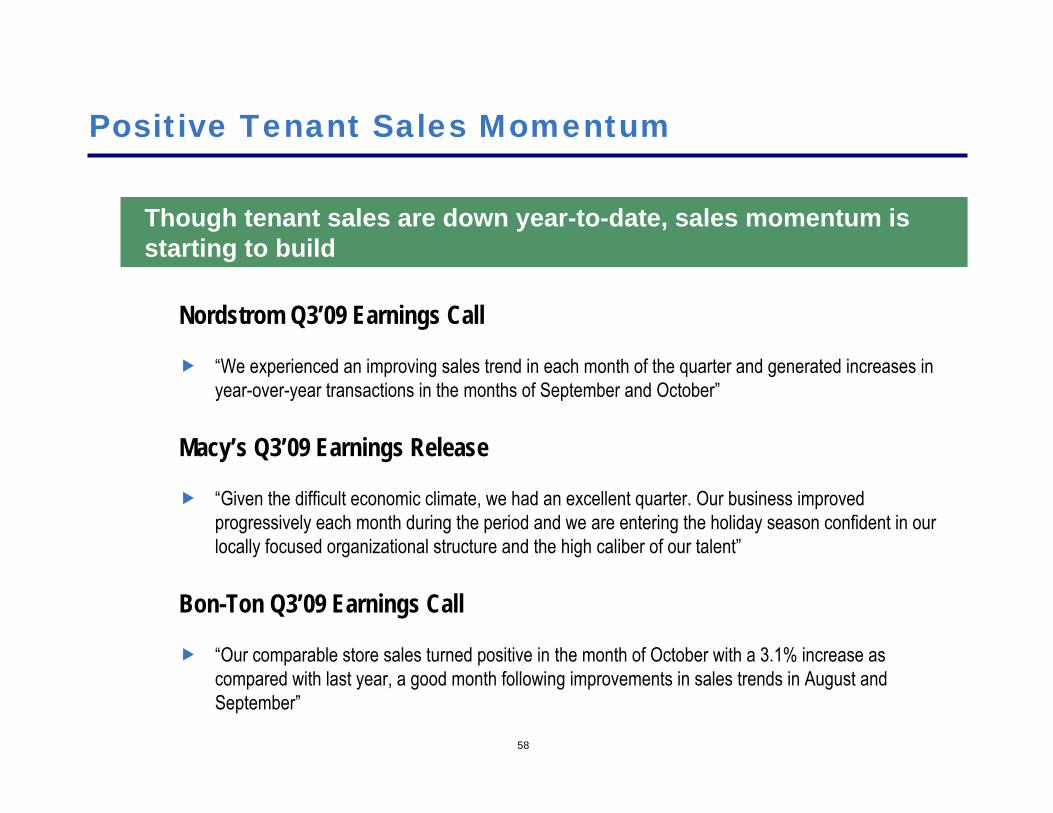
58
Nordstrom Q3’09 Earnings Call
“We experienced an improving sales trend in each month of the quarter and generated increases in year-over-year transactions in the months of September and October”
Macy’s Q3’09 Earnings Release
“Given the difficult economic climate, we had an excellent quarter. Our business improved progressively each month during the period and we are entering the holiday season confident in our locally focused organizational structure and the high caliber of our talent”
Bon-Ton Q3’09 Earnings Call
“Our comparable store sales turned positive in the month of October with a 3.1% increase as compared with last year, a good month following improvements in sales trends in August and September”
Though tenant sales are down year-to-date, sales momentum is starting to build
Positive Tenant Sales Momentum

59
Positive sales momentum has culminated in rising consensus revenue estimates for mall-based retailers. Wall Street is now forecasting 2.6% and 3.5% revenue growth in 2010 and 2011, respectively
Wall Street Anticipates Tenant Revenue Growth
________________________________________________
Source: Capital IQ consensus estimates as of December 5, 2009. (1) Based on GGP’s top ten tenants as disclosed in its quarterly operating supplement. An analysis of other publicly traded mall-based
retailers results in similar growth expectations.(2) Consensus revenue growth weighted average is weighted by each tenant as a % of GGP’s revenue (as disclosed in GGP’s quarterly
operating supplement).
($ in millions) Weight Consensus Revenue Estimates (CY) Consensus Revenue GrowthTenants Selected Concepts Factor (2) 2008a 2009e 2010e 2011e 2009e 2010e 2011e
Top Ten Tenants (1)
The Gap Gap, Old Navy, Banana Republic 2.9% $14,526 $14,149 $14,324 $14,672 (2.6%) 1.2% 2.4% Limited Brands Victoria's Secret, Bath & Body Works 2.6% 9,043 8,528 8,612 8,799 (5.7%) 1.0% 2.2% Abercrombie & Fitch Abercrombie, Hollister, Ruehl 2.3% 3,450 3,002 3,235 3,533 (13.0%) 7.8% 9.2% Foot Locker, Inc. Foot Locker, Champs Sports, Footaction 2.3% 5,237 4,796 4,803 4,842 (8.4%) 0.1% 0.8% American Eagle American Eagle, Aerie, M+O 1.5% 2,989 2,956 3,093 3,238 (1.1%) 4.7% 4.7% Express Express 1.3% NA NA NA NA NA NA NAJCPenney Company JC Penney 1.3% 18,846 17,583 17,760 18,115 (6.7%) 1.0% 2.0% Forever 21 4 Love, Forever 21, Gadzooks 1.2% NA NA NA NA NA NA NA Macy's Macy's, Bloomingdale's, Lord & Taylor 1.1% 24,892 23,448 23,838 23,908 (5.8%) 1.7% 0.3% Genesco Journeys, Underground Station, Lids 1.1% 1,552 1,563 1,621 1,726 0.7% 3.7% 6.5%
Total / Wtd Avg 17.6% $80,534 $76,024 $77,286 $78,834 (5.8%) 2.6% 3.5%

60
($ in millions) Weight Consensus EBITDA Estimates (CY) Consensus EBITDA Margin CommentsTenants Selected Concepts Factor (2) 2008a 2009e 2010e 2011e 2008a 2009e 2010e 2011e '10e Margin > '08a?
Top Ten Tenants (1)
The Gap Gap, Old Navy, Banana Republic 2.9% $2,116 $2,280 $2,399 $2,382 14.6% 16.1% 16.8% 16.2% YesLimited Brands Victoria's Secret, Bath & Body Works 2.6% 1,061 1,099 1,182 1,279 11.7% 12.9% 13.7% 14.5% YesAbercrombie & Fitch Abercrombie, Hollister, Ruehl 2.3% 695 349 477 594 20.2% 11.6% 14.7% 16.8% NoFoot Locker, Inc. Foot Locker, Champs Sports, Footaction 2.3% 286 252 269 311 5.5% 5.3% 5.6% 6.4% YesAmerican Eagle American Eagle, Aerie, M+O 1.5% 440 392 486 551 14.7% 13.3% 15.7% 17.0% YesExpress Express 1.3% NA NA NA NA NA NA NA NA NAJCPenney Company JC Penney 1.3% 1,604 1,156 1,355 1,494 8.5% 6.6% 7.6% 8.2% NoForever 21 4 Love, Forever 21, Gadzooks 1.2% NA NA NA NA NA NA NA NA NAMacy's Macy's, Bloomingdale's, Lord & Taylor 1.1% 2,680 2,481 2,722 2,851 10.8% 10.6% 11.4% 11.9% YesGenesco Journeys, Underground Station, Lids 1.1% 113 123 135 145 7.3% 7.9% 8.3% 8.4% Yes
Total / Wtd Avg 17.6% $8,995 $8,132 $9,026 $9,608 12.2% 11.1% 12.4% 13.0% Yes
Wall Street Anticipates Tenant Margin Expansion
________________________________________________
Source: Capital IQ consensus estimates as of December 5, 2009. (1) Based on GGP’s top ten tenants as disclosed in its quarterly operating supplement. An analysis of other publicly traded mall-based
retailers results in similar margin expectations.(2) Consensus EBITDA margin weighted average is weighted by each tenant as a % of GGP’s revenue (as disclosed in GGP’s quarterly
operating supplement).
Cost cutting and inventory management initiatives will help tenant margins expand despite lower 2009 sales
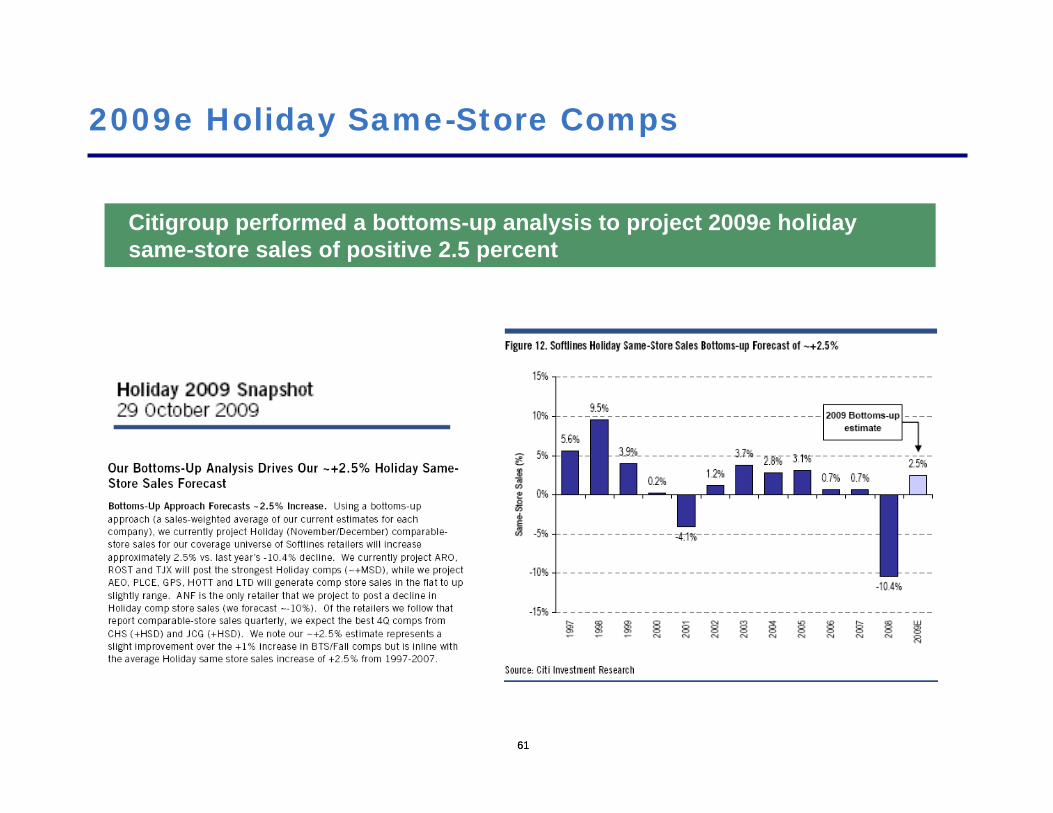
6161
2009e Holiday Same-Store Comps
Citigroup performed a bottoms-up analysis to project 2009e holiday same-store sales of positive 2.5 percent

6262
Mall Traffic Trending Up
Citigroup also anticipates improving Holiday 2009 mall traffic
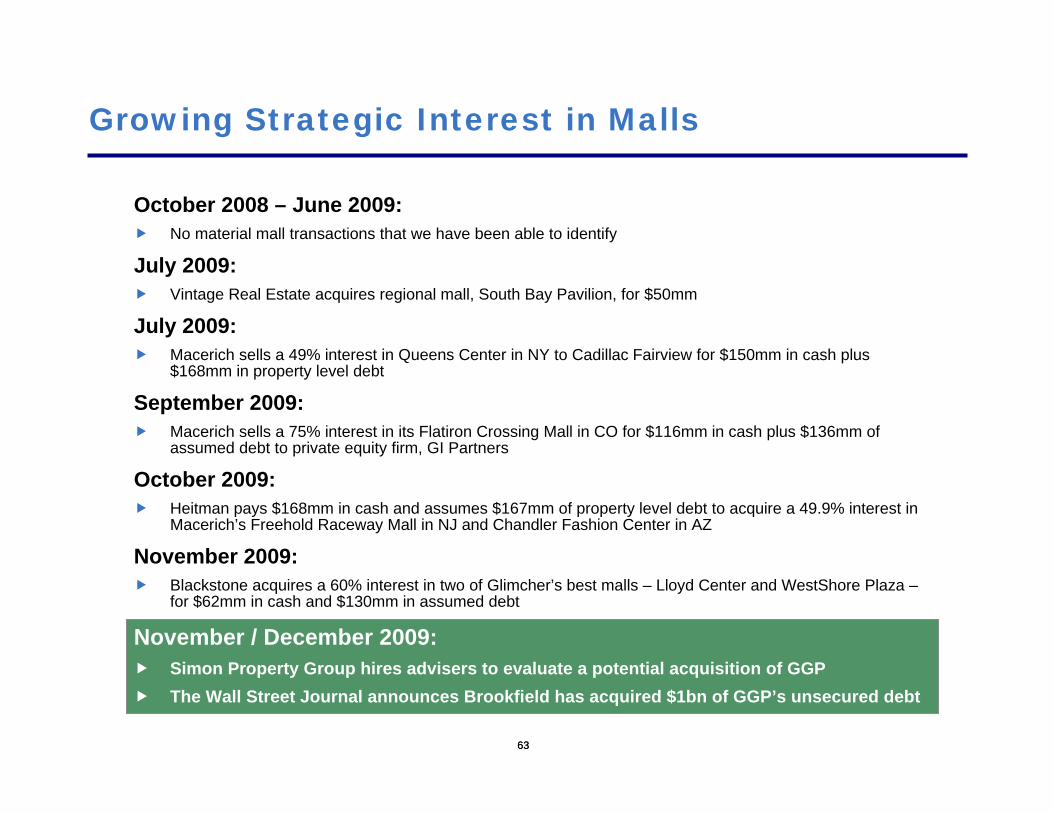
63
October 2008 – June 2009:No material mall transactions that we have been able to identify
July 2009:Vintage Real Estate acquires regional mall, South Bay Pavilion, for $50mm
July 2009:Macerich sells a 49% interest in Queens Center in NY to Cadillac Fairview for $150mm in cash plus $168mm in property level debt
September 2009:Macerich sells a 75% interest in its Flatiron Crossing Mall in CO for $116mm in cash plus $136mm of assumed debt to private equity firm, GI Partners
October 2009:Heitman pays $168mm in cash and assumes $167mm of property level debt to acquire a 49.9% interest in Macerich’s Freehold Raceway Mall in NJ and Chandler Fashion Center in AZ
November 2009:Blackstone acquires a 60% interest in two of Glimcher’s best malls – Lloyd Center and WestShore Plaza –for $62mm in cash and $130mm in assumed debt
November / December 2009:Simon Property Group hires advisers to evaluate a potential acquisition of GGPThe Wall Street Journal announces Brookfield has acquired $1bn of GGP’s unsecured debt
63
Growing Strategic Interest in Malls

6464
Mall REITs are Still Cheap
All of the principal drivers of mall valuations are favorable in the current economic environment
Principal Drivers of Mall Valuation Current Environment 1. Occupancy
Store liquidations have been less than anticipated Many retailers are planning expansions in 2010 New mall construction is on hold Economics of new store openings are attractive
2. Risk-Free Rate
10-yr Treasury yield of 3.4%; 10-yr TIPS yield 1.3%; other inflation protected assets trade at very low yields
Corporate BBBs yield ~6% Mall cap rates are estimated to be ~7 to 8%
3. Tenant Creditworthiness
Tenant stock prices are up over 50% year-to-date Tenant cash flows have improved and margins are
projected to expand Tenant balance sheets have strengthened
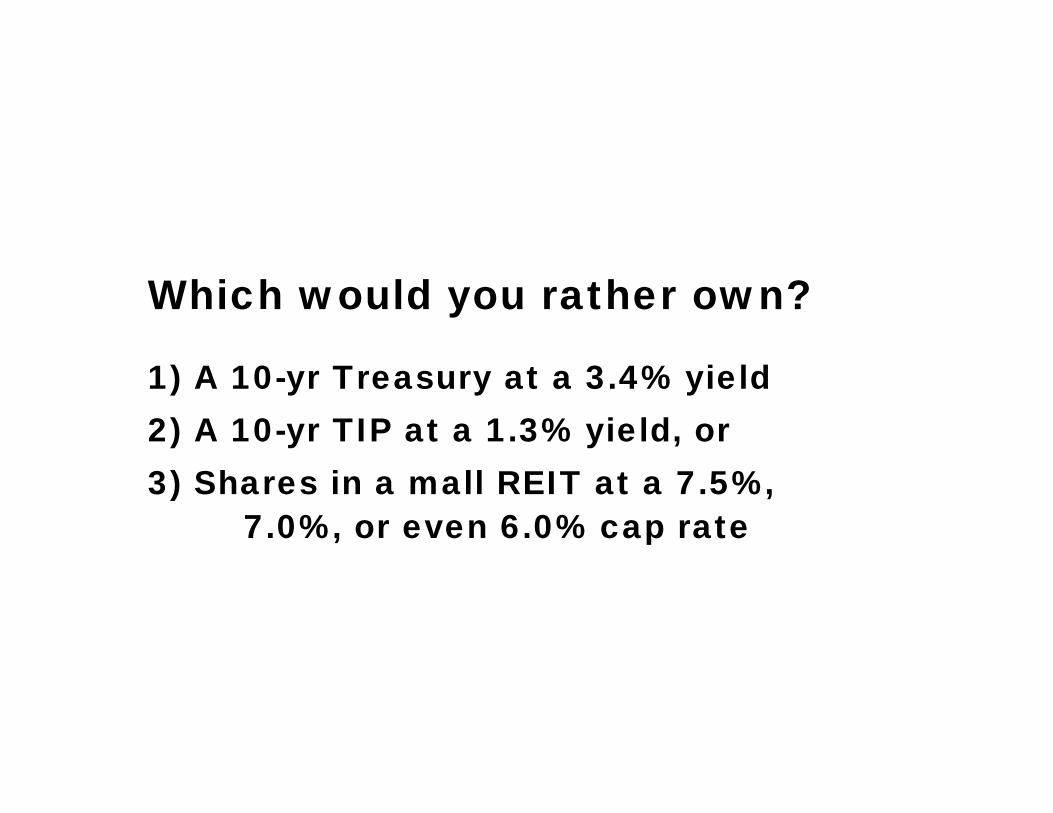
Which would you rather own?
1) A 10-yr Treasury at a 3.4% yield2) A 10-yr TIP at a 1.3% yield, or3) Shares in a mall REIT at a 7.5%,
7.0%, or even 6.0% cap rate

66
What are the Characteristics of the Ideal Mall REIT Best Positioned to Perform in the Current Environment?
LiabilitiesAssets
■ Secured, non-recourse debta portfolio of options is more valuable than an option on a portfolio
■ Fixed-rate debtprovides a hedge against inflation
■ Low interest rates
■ Long-dated maturities
■ A healthy amount of leverageprovides upside for return on equity
■ Good liabilities are an asset
■ Established national platformprovides leverage when dealing with tenants who are looking to expand or reposition stores
■ High-quality malls, B+ to A+
■ Established tenant relationships
■ Low in-place occupancy costs
■ Diverse footprint
■ Lease-up / redevelopment opportunities

6767
Conclusion
During one of the worst recessions in over 50 years, mall REITs and their tenants have proven to be highly resilient
Consumer spending does not need to return to 2007 levels for mall REITs and their tenants to outperform
Store closures of underperforming tenants is a long-term positive for the mall industry
Tenant cash flows and balance sheets have massively improved over the last twelve months
Many opportunistic retailers have substantial growth plans. Retailers on the sidelines are just like those investors who didn’t buy stocks in the spring
General Growth Properties“Fool’s Gold”
We Think Current Equity Investors Will Be Disappointed in the Company’s
Reorganization
December 14, 2009 Hovde Capital Advisors LLC

Table of Contents
• Thesis (p.3)
• The Demise of Malls in America (p.4‐11)
• The Beginning of the End (p.12‐14)
• Valuation Analysis (p.15‐31)
• Commercial Real Estate Valuation (p.32‐35)
• Potential Roadblocks (p.36)
• Disclosures (p.37‐38)
December 14, 2009 Hovde Capital Advisors LLC 2

Our Thesis• Due to highly leveraged acquisitions near the peak of the cycle, a decline in
the overall economy, and insufficient capital spending, we believe the assets of General Growth no longer support the current capital structure.
• In our view: ‐‐ the company’s cash flows are insufficient to service the debt and pay for maintenance capital at its malls; and ‐‐ the bankruptcy is not just the result of a liquidity problem; it is a cash flow and loan‐to‐value problem.
• We believe the value of the assets no longer exceed the value of the debt, in contrast to several recent analyses.
• Despite recent upward move in the GGWPQ share price, we believe current equity investors are likely to be left with little in the restructured entity.
NOTE: THAT FUNDS ADVISED BY HOVDE CAPITAL ADVISORS, LLC AND ONE OF ITS PRINCIPALS HAVE SHORT POSITIONS IN GGWPQ. SEE ADDITIONAL IMPORTANT DISCLOSURES AT PAGES 26 AND 27.
December 14, 2009 3Hovde Capital Advisors LLC

The Demise of Malls in America
Structural Change in Retail Consumption and Distribution
December 14, 2009 4Hovde Capital Advisors LLC

Consumers Are Saving More and Spending Less
December 14, 2009 Hovde Capital Advisors LLC 5
‐4
‐2
0
2
4
6
8
10
12
14
16
1952
1954
1956
1958
1960
1962
1964
1966
1968
1970
1972
1974
1976
1978
1980
1982
1984
1986
1988
1990
1992
1994
1996
1998
2000
2002
2004
2006
2008
Percen
tage
Personal Savings Rate (% of Disposable Income)
Source: U.S. Bureau of Economic Analysis.

Consumers Have Less Access to Credit
December 14, 2009 Hovde Capital Advisors LLC 6
Source: Federal Reserve.
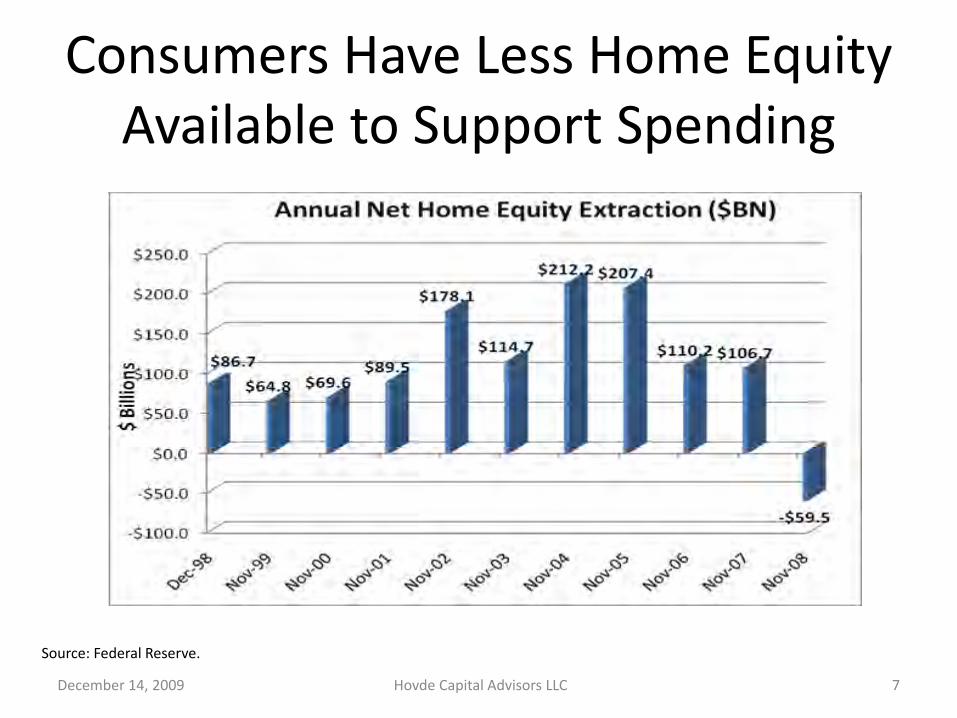
Consumers Have Less Home Equity Available to Support Spending
December 14, 2009 Hovde Capital Advisors LLC 7
Source: Federal Reserve.

Consumers Are Focused on Value• Given lower levels of discretionary income and higher savings rates, we
believe consumers are seeking more value in their consumption habits.• This is evident in the outperformance of discount retailers versus broader
retail sales. These retailers tend to be discounters and in non‐mall locations, typically stand alone or located in strip centers and power centers.
• In our view, outlets are also likely to gain share, which we think is demonstrated in the recently announced acquisition of Prime Outlets by Simon Properties Group (NYSE:SPG). The outlet business offers consumers better value, offers retailers lower occupancy costs, and provides landlords with better margins.
• Online shopping has experienced tremendous growth in share of retail spending as consumers seek value and efficiency.
• These trends do not bode well for mall fundamentals since neither are mall based.
December 14, 2009 Hovde Capital Advisors LLC 8

Non‐Mall Retailers Are Seeing Improving Performance
December 14, 2009 Hovde Capital Advisors LLC 9Source: Bloomberg.
Same-Store Retail Sales (% Chg.)Nov-09 Oct-09 Sep-09 Aug-09 Jul-09 Jun-09 May-09 Apr-09 Mar-09 Feb-09 Jan-09 Dec-08
Non-Mall Average 1.2 2.8 1.4 (0.9) (4.0) (4.4) (1.8) (1.7) (2.7) (3.4) (8.5) (4.8)
BJ's Wholesale Club Inc 1.0 3.7 5.5 2.2 1.8 2.7 4.0 (4.9) 8.5 8.2 7.6 5.9
Cato Corp/The 2.0 - 6.0 5.0 (3.0) (3.0) (3.0) 11.0 6.0 8.0 (10.0) (2.0)
Costco Wholesale Corp 2.0 4.0 4.0 2.0 (1.0) 1.0 1.0 - 4.0 4.0 5.0 2.0
Kohl's Corp 3.3 1.4 5.5 0.2 0.4 (5.6) (0.4) (6.2) (4.3) (1.6) (13.4) (1.4)
Nordstrom: Rack Stores 3.3 5.9 - 3.8 (0.5) 0.6 2.2 4.4 0.1 (0.6) (2.2) (1.8)
Old Navy North Amer 6.0 14.0 13.0 4.0 (8.0) (7.0) 3.0 1.0 - (13.0) (34.0) (16.0)
Rite Aid Corp (0.8) (0.5) (0.3) (1.9) (0.6) (0.6) 0.6 1.8 (0.7) (0.9) 1.0 (0.2)
Ross Stores Inc 8.0 9.0 8.0 6.0 4.0 1.0 4.0 6.0 3.0 1.0 (2.0) -
Stage Stores Inc (12.5) (0.1) (5.6) (9.5) (11.9) (12.6) (7.2) (1.5) (15.0) (8.6) (13.1) (4.9)
Stein Mart Inc (7.2) (4.9) (5.4) (8.9) (5.5) (8.0) 0.2 (12.3) (1.4) (12.2) (16.7) (8.5)
Target Corp (1.5) (0.1) (1.7) (2.9) (6.5) (6.2) (6.1) 0.3 (6.3) (4.1) (3.3) (4.1)
TJX Cos Inc 8.0 10.0 7.0 5.0 4.0 4.0 5.0 3.0 2.0 - (4.0) -
Walgreen Co 3.9 (6.2) (17.6) (16.6) (25.5) (23.0) (27.0) (24.6) (31.2) (24.2) (25.8) (31.2)
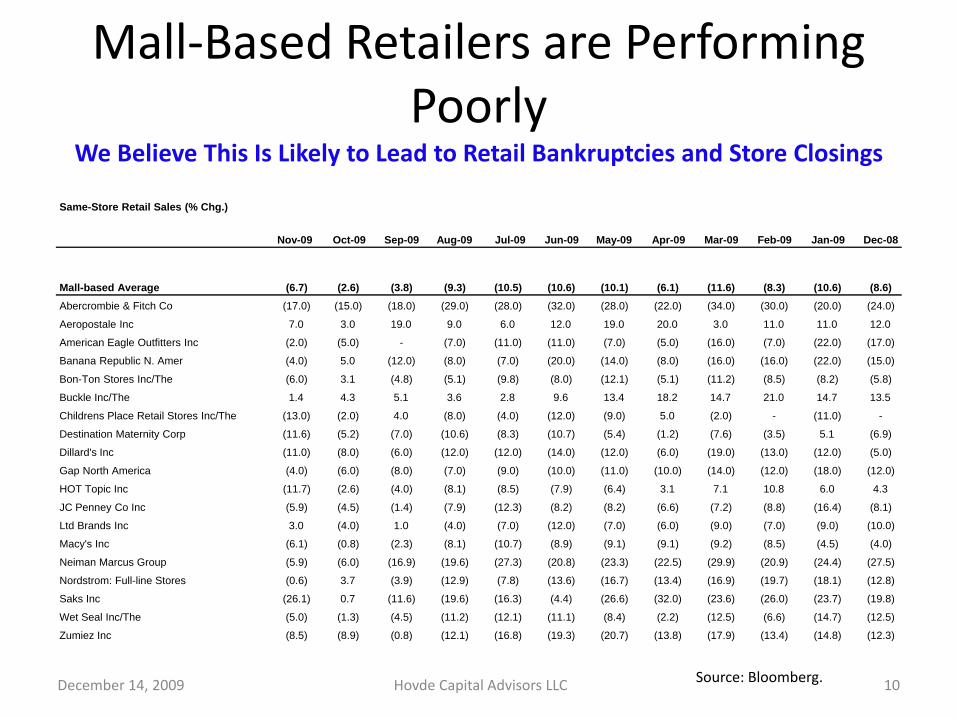
Mall‐Based Retailers are Performing Poorly
We Believe This Is Likely to Lead to Retail Bankruptcies and Store Closings
December 14, 2009 Hovde Capital Advisors LLC 10Source: Bloomberg.
Same-Store Retail Sales (% Chg.)
Nov-09 Oct-09 Sep-09 Aug-09 Jul-09 Jun-09 May-09 Apr-09 Mar-09 Feb-09 Jan-09 Dec-08
Mall-based Average (6.7) (2.6) (3.8) (9.3) (10.5) (10.6) (10.1) (6.1) (11.6) (8.3) (10.6) (8.6)Abercrombie & Fitch Co (17.0) (15.0) (18.0) (29.0) (28.0) (32.0) (28.0) (22.0) (34.0) (30.0) (20.0) (24.0)
Aeropostale Inc 7.0 3.0 19.0 9.0 6.0 12.0 19.0 20.0 3.0 11.0 11.0 12.0
American Eagle Outfitters Inc (2.0) (5.0) - (7.0) (11.0) (11.0) (7.0) (5.0) (16.0) (7.0) (22.0) (17.0)
Banana Republic N. Amer (4.0) 5.0 (12.0) (8.0) (7.0) (20.0) (14.0) (8.0) (16.0) (16.0) (22.0) (15.0)
Bon-Ton Stores Inc/The (6.0) 3.1 (4.8) (5.1) (9.8) (8.0) (12.1) (5.1) (11.2) (8.5) (8.2) (5.8)
Buckle Inc/The 1.4 4.3 5.1 3.6 2.8 9.6 13.4 18.2 14.7 21.0 14.7 13.5
Childrens Place Retail Stores Inc/The (13.0) (2.0) 4.0 (8.0) (4.0) (12.0) (9.0) 5.0 (2.0) - (11.0) -
Destination Maternity Corp (11.6) (5.2) (7.0) (10.6) (8.3) (10.7) (5.4) (1.2) (7.6) (3.5) 5.1 (6.9)
Dillard's Inc (11.0) (8.0) (6.0) (12.0) (12.0) (14.0) (12.0) (6.0) (19.0) (13.0) (12.0) (5.0)
Gap North America (4.0) (6.0) (8.0) (7.0) (9.0) (10.0) (11.0) (10.0) (14.0) (12.0) (18.0) (12.0)
HOT Topic Inc (11.7) (2.6) (4.0) (8.1) (8.5) (7.9) (6.4) 3.1 7.1 10.8 6.0 4.3
JC Penney Co Inc (5.9) (4.5) (1.4) (7.9) (12.3) (8.2) (8.2) (6.6) (7.2) (8.8) (16.4) (8.1)
Ltd Brands Inc 3.0 (4.0) 1.0 (4.0) (7.0) (12.0) (7.0) (6.0) (9.0) (7.0) (9.0) (10.0)
Macy's Inc (6.1) (0.8) (2.3) (8.1) (10.7) (8.9) (9.1) (9.1) (9.2) (8.5) (4.5) (4.0)
Neiman Marcus Group (5.9) (6.0) (16.9) (19.6) (27.3) (20.8) (23.3) (22.5) (29.9) (20.9) (24.4) (27.5)
Nordstrom: Full-line Stores (0.6) 3.7 (3.9) (12.9) (7.8) (13.6) (16.7) (13.4) (16.9) (19.7) (18.1) (12.8)
Saks Inc (26.1) 0.7 (11.6) (19.6) (16.3) (4.4) (26.6) (32.0) (23.6) (26.0) (23.7) (19.8)
Wet Seal Inc/The (5.0) (1.3) (4.5) (11.2) (12.1) (11.1) (8.4) (2.2) (12.5) (6.6) (14.7) (12.5)
Zumiez Inc (8.5) (8.9) (0.8) (12.1) (16.8) (19.3) (20.7) (13.8) (17.9) (13.4) (14.8) (12.3)

Online Sales Are Gaining ShareEstimated Quarterly U.S. Retail E‐commerce Sales as a Percent of Total
Quarterly Retail Sales:4th Quarter 1999 2nd Quarter 2009
Percent of Total
December 14, 2009 Hovde Capital Advisors LLC 11
Source: U.S. Census Bureau.

The Rouse Company Acquired November 2004
The Beginning of the End
December 14, 2009 12Hovde Capital Advisors LLC

The Rouse Company Acquisition
• Purchase price: $14.3 billion.• Portfolio of 37 regional malls (and various office assets) and
$2 billion of land and lots, mostly in Summerlin (Las Vegas) – reports from market participants as noted on the next page suggest land prices in this market have fallen dramatically, and, in some cases, the land has an implied value of zero or even negative values.
• Capitalization rate of 5.3% ‐ implies over $4 billion destruction of estimated asset value at today’s market prices, assuming an 8% cap rate.
• $400 million of goodwill – not only do we believe it was purchased at near‐peak values, it was overvalued when they bought it!
December 14, 2009 13Hovde Capital Advisors LLC
Source: Rouse Company SEC filings.

The Rouse Company Acquisition
• Las Vegas land is now worth materially less than in 2004. We think there is little value in the master planned community assets of General Growth.
• “…finished lots are trading at a discount and the underlying land at many
nonprime locations for residential development has virtually no value in
today’s distressed market, Cherney says. There is more pain to come in this
Vegas land market. The fundamentals of supply and demand are alive and well
and will ensure further declines into 2009. This washout is far from over.” ‐
Craig Cherney, director of Western operations of Philadelphia‐based American Land Fund as quoted in the
Las Vegas Sun, March 1, 2009.
December 14, 2009 14Hovde Capital Advisors LLC
Valuation Analysis
December 14, 2009 15Hovde Capital Advisors LLC
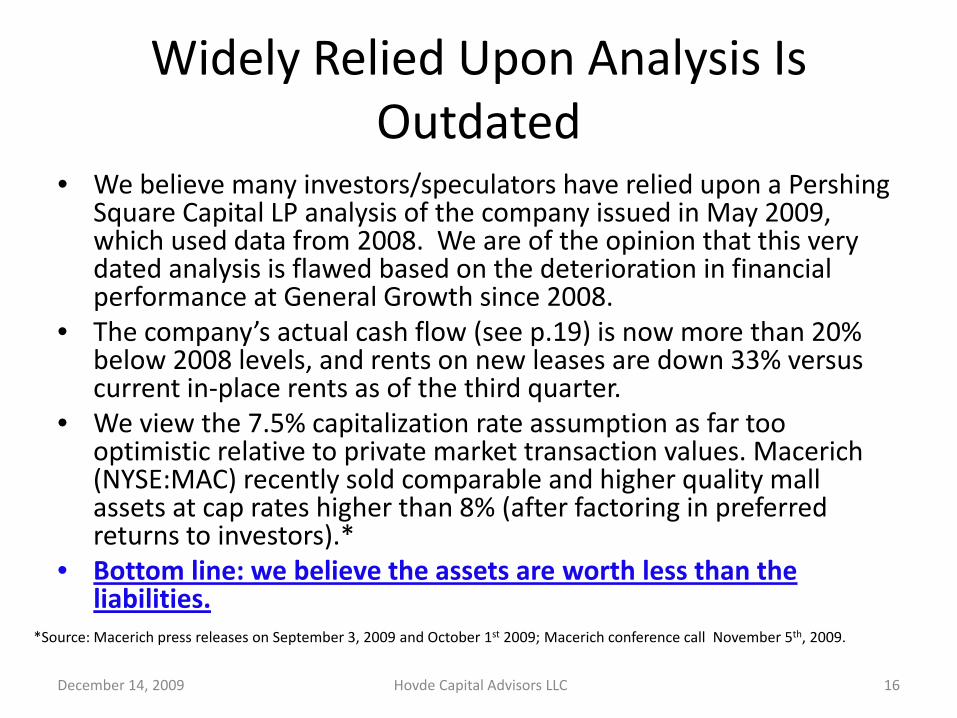
Widely Relied Upon Analysis Is Outdated
• We believe many investors/speculators have relied upon a Pershing Square Capital LP analysis of the company issued in May 2009, which used data from 2008. We are of the opinion that this very dated analysis is flawed based on the deterioration in financial performance at General Growth since 2008.
• The company’s actual cash flow (see p.19) is now more than 20% below 2008 levels, and rents on new leases are down 33% versus current in‐place rents as of the third quarter.
• We view the 7.5% capitalization rate assumption as far too optimistic relative to private market transaction values. Macerich (NYSE:MAC) recently sold comparable and higher quality mall assets at cap rates higher than 8% (after factoring in preferred returns to investors).*
• Bottom line: we believe the assets are worth less than the liabilities.
December 14, 2009 16Hovde Capital Advisors LLC
*Source: Macerich press releases on September 3, 2009 and October 1st 2009; Macerich conference call November 5th, 2009.

Leverage is a Significant Valuation Factor
• Pershing Square uses Simon Properties Group (NYSE:SPG) as a comparable in their analysis without giving consideration to leverage. Simon is moderately leveraged, with debt to EBITDA of 6x, and is an investment grade rated credit. General Growth’s leverage is in excess of 16x and would still be in excess of 12x even if all of the unsecured debt was converted to equity.
• There are no comparably leveraged public companies in the mall sector, but those that are more highly leveraged trade at a significant discount to those with less leverage. Clearly companies with less leverage trade at premium valuations as shown on the following page.
December 14, 2009 17Hovde Capital Advisors LLC
Source: General Growth third quarter 2009 supplemental package; Simon Property Group third quarter 2009 supplemental package.
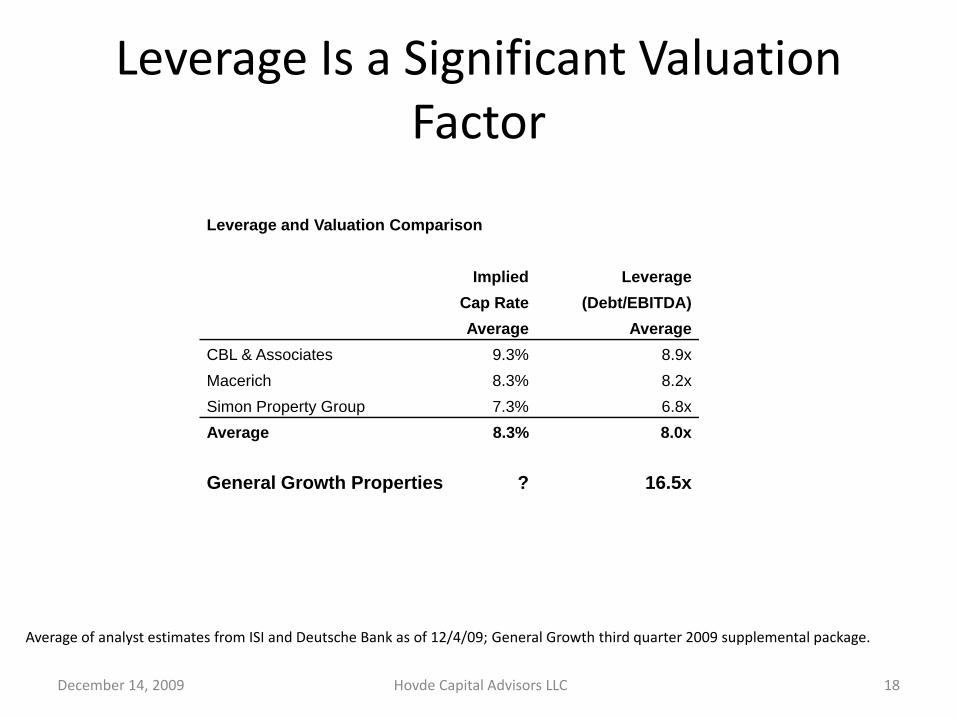
Leverage Is a Significant Valuation Factor
Average of analyst estimates from ISI and Deutsche Bank as of 12/4/09; General Growth third quarter 2009 supplemental package.
Leverage and Valuation Comparison
Implied Leverage Cap Rate (Debt/EBITDA)Average Average
CBL & Associates 9.3% 8.9xMacerich 8.3% 8.2xSimon Property Group 7.3% 6.8xAverage 8.3% 8.0x
General Growth Properties ? 16.5x
December 14, 2009 18Hovde Capital Advisors LLC

Cash Flows Have Collapsed
This is the starting point for Pershing Square’s analysis.
This is the reality of today (‐27% yr/yr).
December 14, 2009 19Hovde Capital Advisors LLC
Source: Third quarter 2009 General Growth supplemental package.

Rents Are Rolling Down DramaticallyNew lease rates are 33% lower than in‐place rents. This is not good for the NOI outlook.
December 14, 2009 20Hovde Capital Advisors LLC
Source: Third quarter 2009 General Growth supplemental package.

NOI Sensitivity Drives Valuation
• The decline in NOI since 2008 drives a decline in enterprise value of $3.8‐$4.3 billion under the Pershing Square valuation framework.
• Applying Q3 annualized NOI to the Pershing Square valuation analysis, the implied equity value per share of the company today is NEGATIVE $5.03 at an 8.5% cap rate and +$5.73 at a 7.5% cap rate.
December 14, 2009 21Hovde Capital Advisors LLC
Source: “The Buck’s Rebound Begins Here” dated May 27, 2009 – Pershing Capital Management, L.P. (p. 56) and Hovde Capital Advisors LLC analysis (see page 30).

Recent Comparable Transactions Indicate Cap Rates Are Higher
• *Macerich’s (NYSE: MAC) sale of JV interest in Queens Center (NYC, NY) to Cadillac Fairview Corporation at a “low 7% cap” – per company management.
• This mall generates $876/square foot in sales versus General Growth’s $409/square foot.
December 14, 2009 22Hovde Capital Advisors LLC
*Source: Macerich press release July 30, 2009; Macerich conference call November 5th, 2009; third quarter 2009 General Growth supplemental package.

Recent Comparable Transactions Indicate Cap Rates Are Higher
• *Macerich’s (NYSE: MAC) sale of JV interests in malls to Heitman and GI Partners at a “less than 100 basis points over the 7.5% cap rate on average.” – per Arthur Coppola (11/5/09 conference call). Thus we infer the effective implied cap rate is in the 8.0%‐8.5% range.
• These malls generate $443‐$500/square foot in sales versus General Growth’s $409/square foot.
December 14, 2009 23Hovde Capital Advisors LLC
*Source: Macerich press releases on September 3, 2009 and October 1st, 2009; Macerich conference call November 5th, 2009.
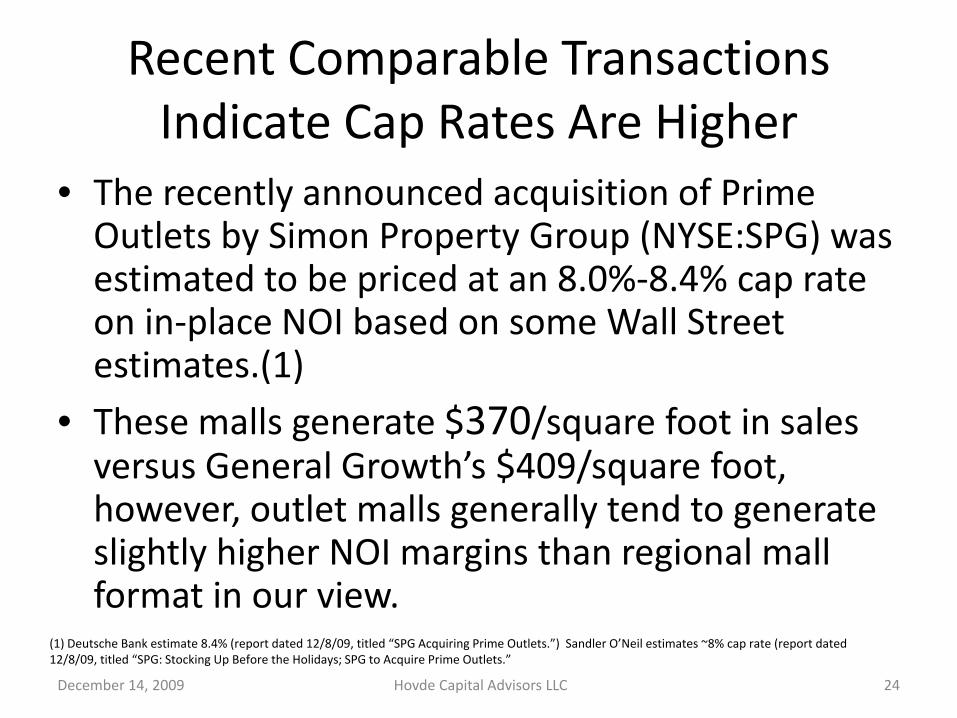
Recent Comparable Transactions Indicate Cap Rates Are Higher
• The recently announced acquisition of Prime Outlets by Simon Property Group (NYSE:SPG) was estimated to be priced at an 8.0%‐8.4% cap rate on in‐place NOI based on some Wall Street estimates.(1)
• These malls generate $370/square foot in sales versus General Growth’s $409/square foot, however, outlet malls generally tend to generate slightly higher NOI margins than regional mall format in our view.
December 14, 2009 24Hovde Capital Advisors LLC
(1) Deutsche Bank estimate 8.4% (report dated 12/8/09, titled “SPG Acquiring Prime Outlets.”) Sandler O’Neil estimates ~8% cap rate (report dated 12/8/09, titled “SPG: Stocking Up Before the Holidays; SPG to Acquire Prime Outlets.”

What Is the Appropriate Cap Rate?
• Based on recent comparable transactions, the use of a cap rate below 8% seems disconnected with reality in our view.
• We would argue a cap rate in the 8.5% range or higher would be more appropriate for the General Growth portfolio, given the below average productivity of its malls* and the fact that it is experiencing significant declines in new rents that in our opinion will drive lower revenues and NOI for some period of time.
December 14, 2009 25Hovde Capital Advisors LLC
* Source: based on Q3-09 disclosures from Macerich and Simon Properties Group.

Interest Coverage Is Unsustainable(This is cash flow problem, not just a liquidity problem)
Interest coverage has fallen to
minimal levels (1.17x) – this is before capital expenditures.
December 14, 2009 26Hovde Capital Advisors LLC
Source: Third quarter 2009 General Growth supplemental package.

Amortizing Secured Debt Will Further Reduce Debt Service Capacity
• Recent agreement with $9.7 billion of secured creditors requires that interest‐only debt now amortizes principal on a 30 year schedule.
• This will add over $300 million of annual debt service initially, which steps up over time, i.e. increasing amortization.
• By our estimates, this will initially drive the company’s debt service coverage ratio to 1.0x or below based on the company’s trailing 12‐month EBITDA as of 9/09.
• Based on the company’s projections, debt service coverage for the properties secured by these loans will be 1.0x in 2010, before considering mandatory principal paydowns and other cash costs.
December 14, 2009 27Hovde Capital Advisors LLC
Source: US_ACTIVE:\43244255\04\47658.0008, debtor’s plan filed 12/1/09; third quarter 2009 General Growth supplemental package.

Creditors Will Take the Cash
• Cash ($2/share) will likely be paid out to creditors in the form of fees and reimbursement of legal expenses.
• According to documents recently filed in bankruptcy court, General Growth will be forced to pay $423.2 million in extension fees, servicer fees and expenses, catch‐up amortization payments, accrued interest, the funding of certain escrows and other expenses.
• This is only related to the agreement on $9.7 billion of secured loans, so we believe the cost to secure agreements to restructure the remaining $12 billion of debt will likely cost significantly more if the costs are comparable to this agreement.
• Given our view that the cash costs of the restructurings will likely exceed the company’s current cash position, we believe additional claims will likely be settled in equity ownership, suggesting little if any recovery for common shareholders.
December 14, 2009 28Hovde Capital Advisors LLC
Source: US_ACTIVE:\43244255\04\47658.0008, Exhibit 3, filed 12/7/09.

ValuationPershing Square’s Analysis Uses Dated NOI
This is from 2008
This is Q3 annualized NOI, and rents are rolling down sharply (‐33%), which will drive lower NOI.
Pershing Square Analysis Framework
More Realistic Scenario($ in millions, except per share data) Low High
LTM Cash NOI $ 2,524 $ 2,524 $ 2,200 (1) $ 2,200 (1) Cap Rate 8.5% 7.5% 8.5% 7.5%
Implied Value of GGP's REIT 29,694 33,653 25,882 29,333
Pro Rata for JVs:
Less: Total Debt (28,174) (28,174) (28,174) (28,174)
Less: Preferred Debt (121) (121) (121) (121)
Less: Other Liabilities (1,585) (1,585) (1,585) (1,585)
Plus: Cash 722 722 0 0
Plus: Other Assets 1,777 1,777 1,777 1,777
Plus: Development Pipeline 603 603 603 603
Implied Equity Value $ 2,916 $ 6,875 $ (1,618) $ 1,833
Per Share $ 9.11 $ 21.50 $ (5.06) $ 5.73
Cash will be paid to
creditors in fees and
recovery of legal expenses.
(1) See calculation of NOI on the page 30.
December 14, 2009 29Hovde Capital Advisors LLC
Source: “The Buck’s Rebound Begins Here” dated May 27, 2009 – Pershing Square Capital Management, L.P. (p. 56) and Hovde Capital Advisors LLC analysis.

Calculation of Today’s NOI
Net Operating Income Calculation (as of Q3-09)(figures in 000s)
Consolidated & JV Share NOI (as reported) $ 585,203 Less: lease termination fees $ 3,859 Less: above/below-market rents $ 3,121 Less: straight lined rents $ 11,478 Less: tenant allowances & leasing costs $ 16,620 Less: capital expenditures $ 3,362 Plus: non-cash ground rent expense $ 1,823 Total NOI $ 548,586
Total Annualized NOI (x4) $ 2,194,344
December 14, 2009 30Hovde Capital Advisors LLC
Source: Third quarter 2009 General Growth supplemental package.
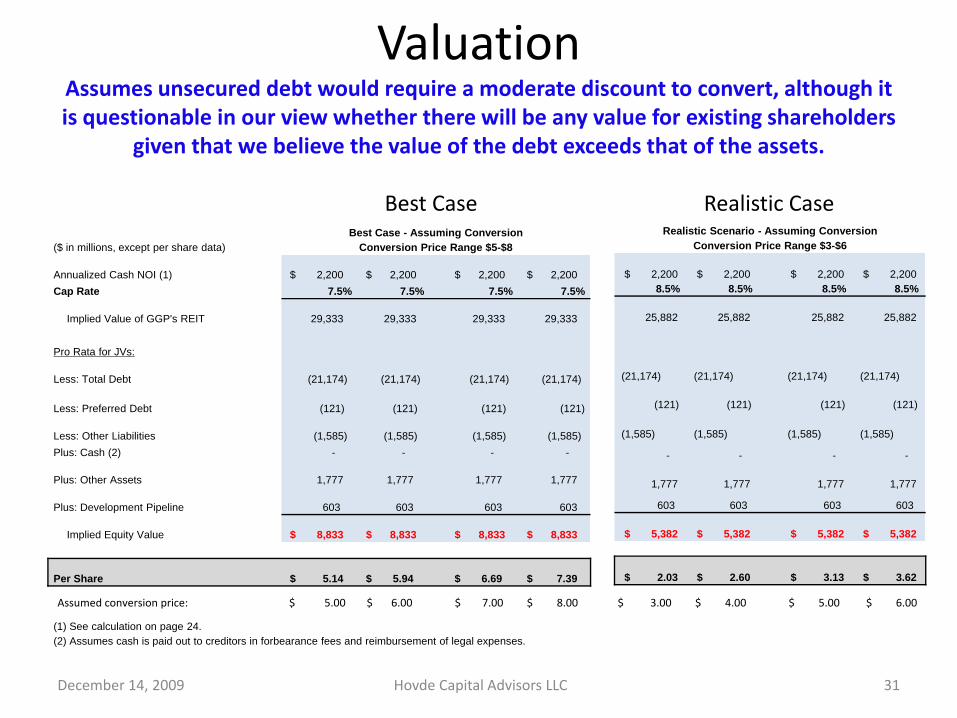
ValuationAssumes unsecured debt would require a moderate discount to convert, although it is questionable in our view whether there will be any value for existing shareholders
given that we believe the value of the debt exceeds that of the assets.
Best Case Realistic Case
December 14, 2009 31Hovde Capital Advisors LLC
Best Case - Assuming Conversion($ in millions, except per share data) Conversion Price Range $5-$8
Annualized Cash NOI (1) $ 2,200 $ 2,200 $ 2,200 $ 2,200 Cap Rate 7.5% 7.5% 7.5% 7.5%
Implied Value of GGP's REIT 29,333 29,333 29,333 29,333
Pro Rata for JVs:
Less: Total Debt (21,174) (21,174) (21,174) (21,174)
Less: Preferred Debt (121) (121) (121) (121)
Less: Other Liabilities (1,585) (1,585) (1,585) (1,585)Plus: Cash (2) - - - -
Plus: Other Assets 1,777 1,777 1,777 1,777
Plus: Development Pipeline 603 603 603 603
Implied Equity Value $ 8,833 $ 8,833 $ 8,833 $ 8,833
Per Share $ 5.14 $ 5.94 $ 6.69 $ 7.39
(1) See calculation on page 24.(2) Assumes cash is paid out to creditors in forbearance fees and reimbursement of legal expenses.
Assumed conversion price: $ 5.00 $ 6.00 $ 7.00 $ 8.00 $ 3.00 $ 4.00 $ 5.00 $ 6.00
Realistic Scenario - Assuming ConversionConversion Price Range $3-$6
$ 2,200 $ 2,200 $ 2,200 $ 2,200 8.5% 8.5% 8.5% 8.5%
25,882 25,882 25,882 25,882
(21,174) (21,174) (21,174) (21,174)
(121) (121) (121) (121)
(1,585) (1,585) (1,585) (1,585)
- - - -
1,777 1,777 1,777 1,777
603 603 603 603
$ 5,382 $ 5,382 $ 5,382 $ 5,382
$ 2.03 $ 2.60 $ 3.13 $ 3.62

Commercial Real Estate Valuation Analysis
December 14, 2009 32Hovde Capital Advisors LLC
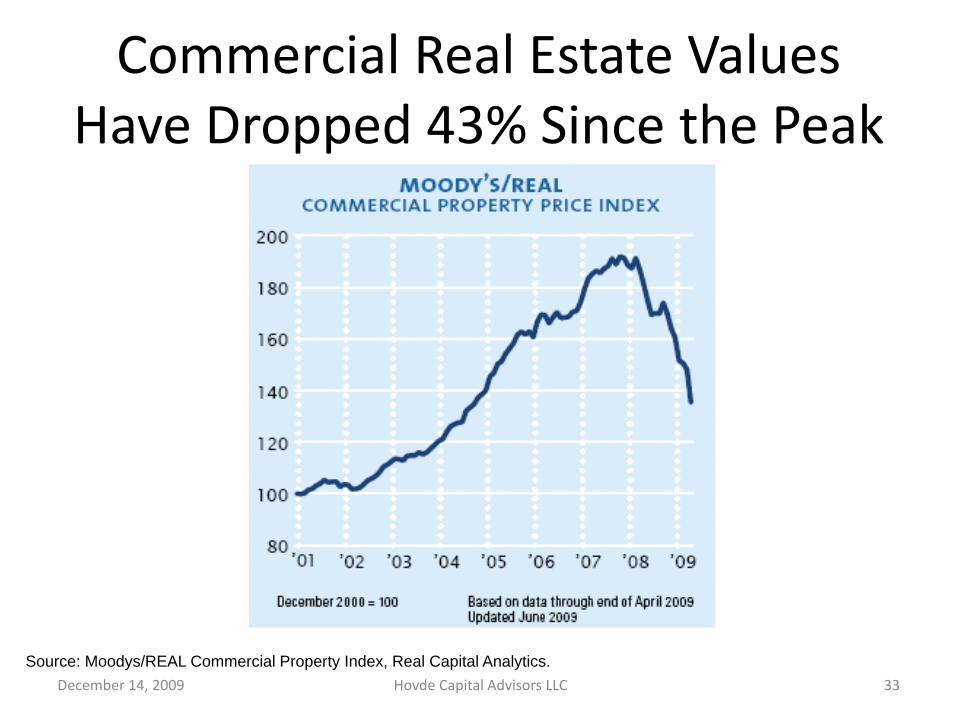
Commercial Real Estate Values Have Dropped 43% Since the Peak
December 14, 2009 Hovde Capital Advisors LLC 33
Source: Moodys/REAL Commercial Property Index, Real Capital Analytics.

Capitalization Rates Have Moved Significantly Higher Since the Peak
December 14, 2009 Hovde Capital Advisors LLC 34
5.00%
6.00%
7.00%
8.00%
9.00%
10.00%
11.00%
Jan‐01
Apr‐01
Jul‐0
1
Oct‐01
Jan‐02
Apr‐02
Jul‐0
2
Oct‐02
Jan‐03
Apr‐03
Jul‐0
3
Oct‐03
Jan‐04
Apr‐04
Jul‐0
4
Oct‐04
Jan‐05
Apr‐05
Jul‐0
5
Oct‐05
Jan‐06
Apr‐06
Jul‐0
6
Oct‐06
Jan‐07
Apr‐07
Jul‐0
7
Oct‐07
Jan‐08
Apr‐08
Jul‐0
8
Oct‐08
Jan‐09
Apr‐09
Jul‐0
9
Oct‐09
Capitalization Rates
Apartment Industrial Office ‐ CBD Office ‐ Sub Strip All Core
Source: Real Capital Analytics.
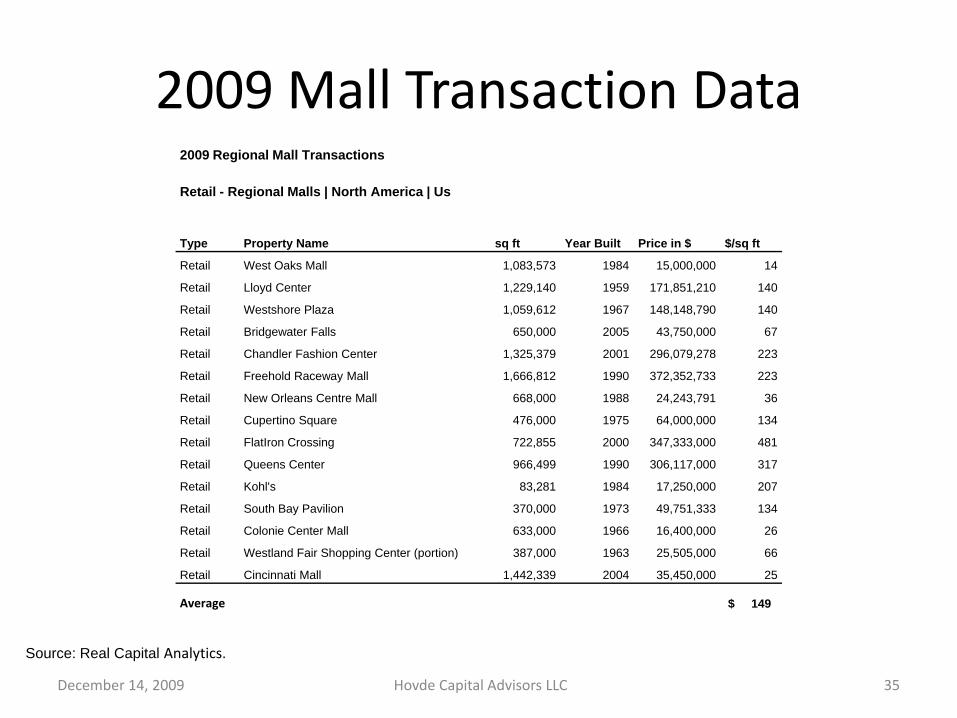
2009 Mall Transaction Data
December 14, 2009 Hovde Capital Advisors LLC 35
2009 Regional Mall Transactions
Retail - Regional Malls | North America | Us
Type Property Name sq ft Year Built Price in $ $/sq ft
Retail West Oaks Mall 1,083,573 1984 15,000,000 14
Retail Lloyd Center 1,229,140 1959 171,851,210 140
Retail Westshore Plaza 1,059,612 1967 148,148,790 140
Retail Bridgewater Falls 650,000 2005 43,750,000 67
Retail Chandler Fashion Center 1,325,379 2001 296,079,278 223
Retail Freehold Raceway Mall 1,666,812 1990 372,352,733 223
Retail New Orleans Centre Mall 668,000 1988 24,243,791 36
Retail Cupertino Square 476,000 1975 64,000,000 134
Retail FlatIron Crossing 722,855 2000 347,333,000 481
Retail Queens Center 966,499 1990 306,117,000 317
Retail Kohl's 83,281 1984 17,250,000 207
Retail South Bay Pavilion 370,000 1973 49,751,333 134
Retail Colonie Center Mall 633,000 1966 16,400,000 26
Retail Westland Fair Shopping Center (portion) 387,000 1963 25,505,000 66
Retail Cincinnati Mall 1,442,339 2004 35,450,000 25
Average $ 149
Source: Real Capital Analytics.
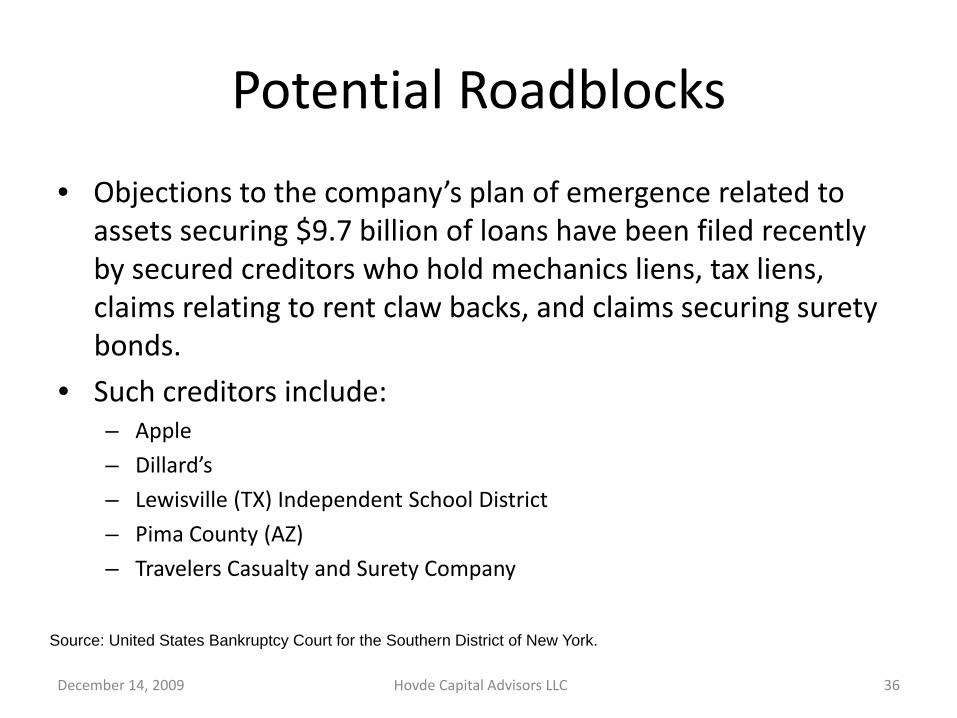
Potential Roadblocks
• Objections to the company’s plan of emergence related to assets securing $9.7 billion of loans have been filed recently by secured creditors who hold mechanics liens, tax liens, claims relating to rent claw backs, and claims securing surety bonds.
• Such creditors include:– Apple
– Dillard’s
– Lewisville (TX) Independent School District
– Pima County (AZ)
– Travelers Casualty and Surety Company
December 14, 2009 Hovde Capital Advisors LLC 36
Source: United States Bankruptcy Court for the Southern District of New York.
Disclosures
• Funds advised by Hovde Capital Advisors, LLC and one of its principals have established short positions in the common stock of General Growth Properties (OTC: GGWPQ) and in the common stock of Macerich (NYSE: MAC). One of the principals has established a short position in Saks (NYSE: SKS). Their positions in these stocks and others may change without further notice.
• Neither the funds advised by or any affiliates of Hovde Capital Advisors, LLC hold positions in any other companies mentioned in this document other than those mentioned above.
December 14, 2009 37Hovde Capital Advisors LLC

Disclosures Continued
• The opinions and views express in this document and the analysis set forth therein may change and Hovde Capital Advisors, LLC is not undertaking to update its opinions, views or analysis.
• Although the factual information contained in this document is believed to be accurate, Hovde Capital Advisors, LLC does not warrant its accuracy or completeness.
• This document is not intended to be, and should not be construed as, investment advice or a recommendation to buy or to sell any security.
December 14, 2009 Hovde Capital Advisors LLC 38

GGP Part IIMay 26, 2010
Pershing Square Capital Management, L.P.

1
Disclaimer
The analyses and conclusions of Pershing Square Capital Management, L.P. ("Pershing Square") contained in this presentation are based on publicly available information. Pershing Square recognizes that there may be confidential information in the possession of the companies discussed in the presentation that could lead these companies to disagree with Pershing Square’s conclusions. This presentation and the information contained herein is not a recommendation or solicitation to buy or sell any securities.
The analyses provided may include certain statements, estimates and projections prepared with respect to, among other things, the historical and anticipated operating performance of the companies, access to capital markets and the values of assets and liabilities. Such statements, estimates, and projections reflect various assumptions by Pershing Square concerning anticipated results that are inherently subject to significant economic, competitive, and other uncertainties and contingencies and have been included solely for illustrative purposes. No representations, express or implied, are made as to the accuracy or completeness of such statements, estimates or projections or with respect to any other materials herein.
Pershing Square manages funds that are in the business of actively trading – buying and selling –securities and financial instruments. In particular, funds managed by Pershing Square and its affiliates have invested in long and short positions of certain mall REITs, including long debt and equity positions in General Growth Properties Inc. and other commitments to recapitalize that company. Pershing Square may currently or in the future change its position regarding any of the securities it owns. Pershing Square reserves the right to buy, sell, cover or otherwise change the form of its investment in any company for any reason. Pershing Square hereby disclaims any duty to provide any updates or changes to the analyses contained here including, without limitation, the manner or type of any Pershing Square investment.

2
Pershing Square Capital Management, L.P.
At Last Year’s Ira Sohn Conference, We Delivered a 67-page Presentation on General Growth Entitled:
2
The Buck’s Rebound Begins HereMay 27, 2009

3
On Page 34 of The Buck’s Rebound Begins Here, We Proposed the Following Solution for GGP to Address Its Bankruptcy
A seven-year extension of GGP’s secured and unsecured loans at their existing interest rates would provide the Company with sufficient time to use cash flow from operations to delever its balance sheet. With a seven-year extension, we believe the Company would be able to repay existing creditors in full
Benefits of this Approach:
Secured and unsecured lenders receive 100% of the present value of their claims
Prevents the liquidation of assets at “fire-sale” prices
Preserves value for equity holders
GGP platform remains intact
Preserves jobs________________________________________________
Source: See page 34 of “The Buck’s Rebound Begins Here,” May 27, 2009.

4
All of GGP’s property-level debtors have consensually agreed to extend $15bn of secured debt
The weighted average contract interest rate for these loans is 5.07%, which is lower than the original interest rate
The weighted average duration of the loans is 6.5 years from January 1, 2010
GGP has avoided a “fire-sale” of its assets
Equity value has been enhanced
While we suggested a maturity extension of GGP’s unsecured debt, the vast majority of it will be repaid at emergence
4
GGP’s Bankruptcy has Progressed Largely as We Expected
(1)
(1)
________________________________________________(1) Source: GGP Press Release (4/29/10).

55
GGP has Secured a Commitment for Enough Capital to Repay its Unsecured Creditors in Full at Par Plus Accrued
________________________________________________(1) Source: GGP Press Release (5/3/10).

6
The Buck Has Rebounded
Though GGP’s stock price has risen more than 1000% over the past year, its TEV has only increased 12%. This compares to Simon Property Group (“SPG” or “Simon”) whose TEV has risen 29% over the same period
$14
GGP Stock Price Performance
________________________________________________
Source: Capital IQ (as of 5/28/10).
GGP traded at$1.19 as of lastyear’s Ira SohnConference
$0
$2
$4
$6
$8
$10
$12
$14
$16
$18
$20
Jan-09 Apr-09 Jul-09 Oct-09 Feb-10 May-10

A Little Context…

8
At the Beginning of 2009, The World was a Very Different Place for Mall REITs
The U.S. economy was in a serious recession
The U.S. consumer had hit the wall
Mall REITs had limited access to capital
Cap rates increased and transactions stopped as bid-ask spreads widened
Bankruptcy risk and tenant “right-sizing” initiatives were expected to result in massive store closures
Rent relief was a serious concern
Tenant sales were expected to continuously decline
SinceThen…

9
U.S. Economy Recovering
________________________________________________
Source: Bureau of Economic Analysis (5/27/10).
U.S. Real GDP growth has been positive the past three quarters
Real GDP (% Change)
Q2’08 Q3’08 Q4’08 Q1’09 Q2’09 Q3’09 Q4’09 Q1’10
1.5%
(2.7%)
(5.4%)
(6.4%)
(0.7%)
2.2%
5.6%
3.0%
(8.0%)
(6.0%)
(4.0%)
(2.0%)
0.0%
2.0%
4.0%
6.0%
8.0%
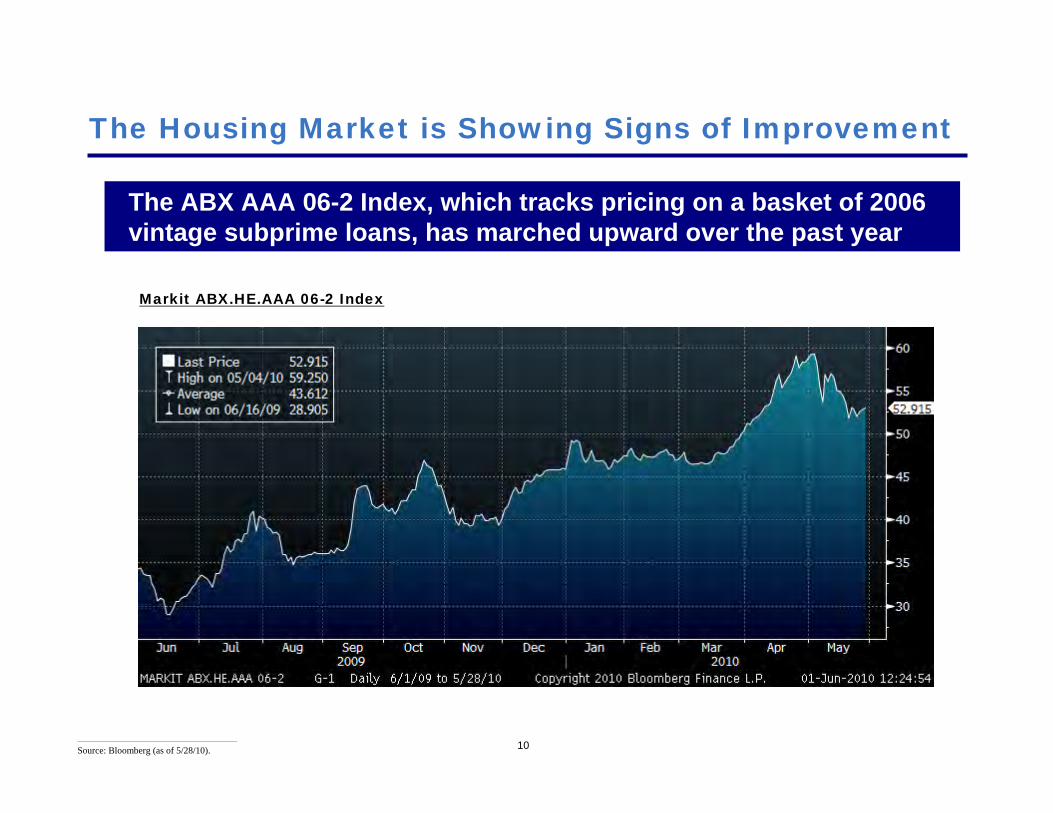
10
The Housing Market is Showing Signs of Improvement
________________________________________________
Source: Bloomberg (as of 5/28/10).
The ABX AAA 06-2 Index, which tracks pricing on a basket of 2006 vintage subprime loans, has marched upward over the past year
Markit ABX.HE.AAA 06-2 Index
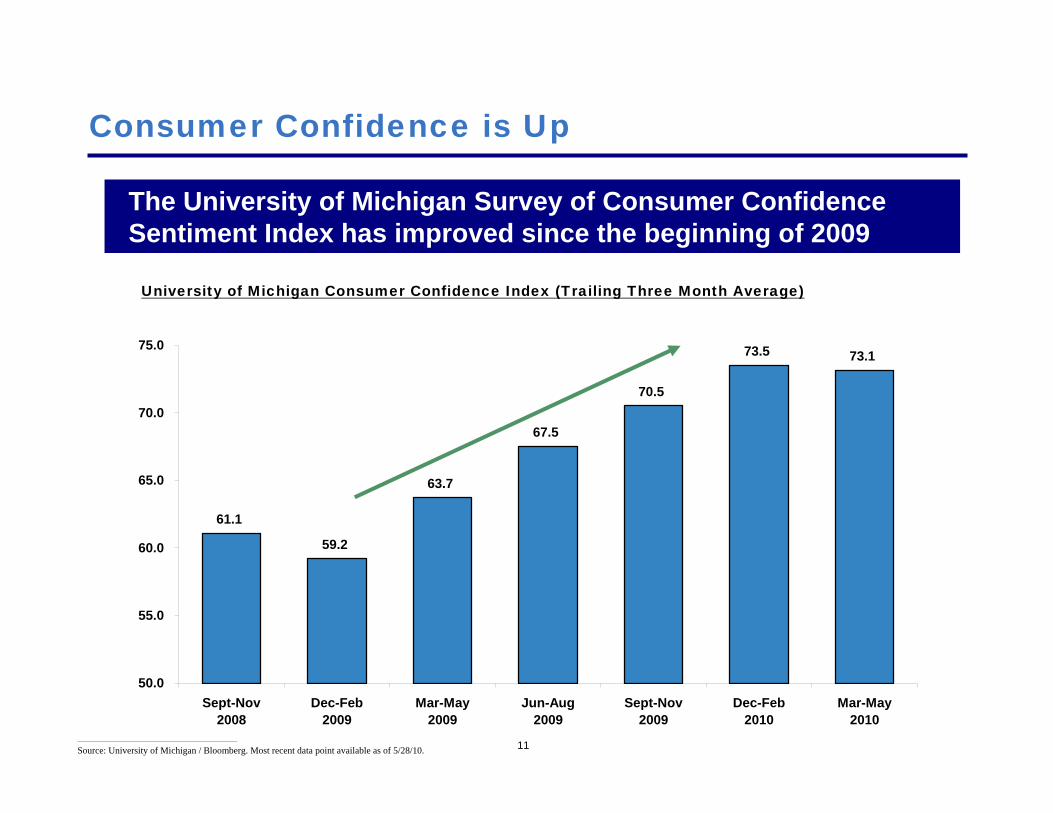
11
Consumer Confidence is Up
________________________________________________
Source: University of Michigan / Bloomberg. Most recent data point available as of 5/28/10.
The University of Michigan Survey of Consumer Confidence Sentiment Index has improved since the beginning of 2009
University of Michigan Consumer Confidence Index (Trailing Three Month Average)
61.1
59.2
63.7
67.5
70.5
73.5 73.1
50.0
55.0
60.0
65.0
70.0
75.0
Sept-Nov2008
Dec-Feb2009
Mar-May2009
Jun-Aug2009
Sept-Nov2009
Dec-Feb2010
Mar-May2010

12
Personal Savings Rate Reverting
After peaking in May 2009, the U.S. personal savings rate has reverted to near its 10-yr average
U.S. Personal Saving as a Percentage of Disposable Personal Income
________________________________________________
Source: Bloomberg / Bureau of Economic Analysis (as of 5/28/10). Most recent data point as of Apr-10.
3.6%Average:
2.8%
LTM
0.0%
1.0%
2.0%
3.0%
4.0%
5.0%
6.0%
7.0%
Apr-00 Apr-01 Apr-02 Apr-03 Apr-04 Apr-05 Apr-06 Apr-07 Apr-08 Apr-09 Apr-10
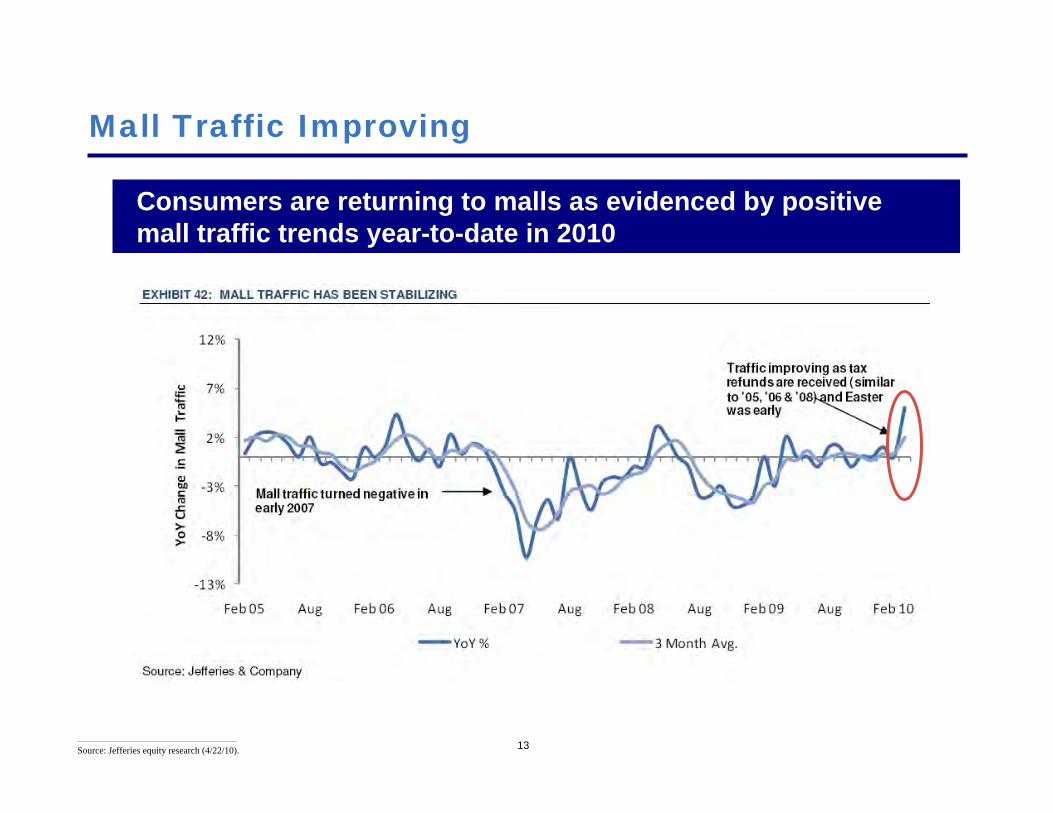
13
Mall Traffic Improving
Consumers are returning to malls as evidenced by positive mall traffic trends year-to-date in 2010
________________________________________________
Source: Jefferies equity research (4/22/10).

1414
Retail Construction Remains at a 20-Year Low
________________________________________________
Source: Goldman Sachs equity research November 2009.
“And frankly, when you look at the capital situation today, the construction in the retail sector is at a 20-year low. We certainly anticipate it will remain there, and the lack of new supply can only hopefully help the demand side for the existing product.”
– Rick Sokolov, COO of Simon Property Group, December 4, 2009
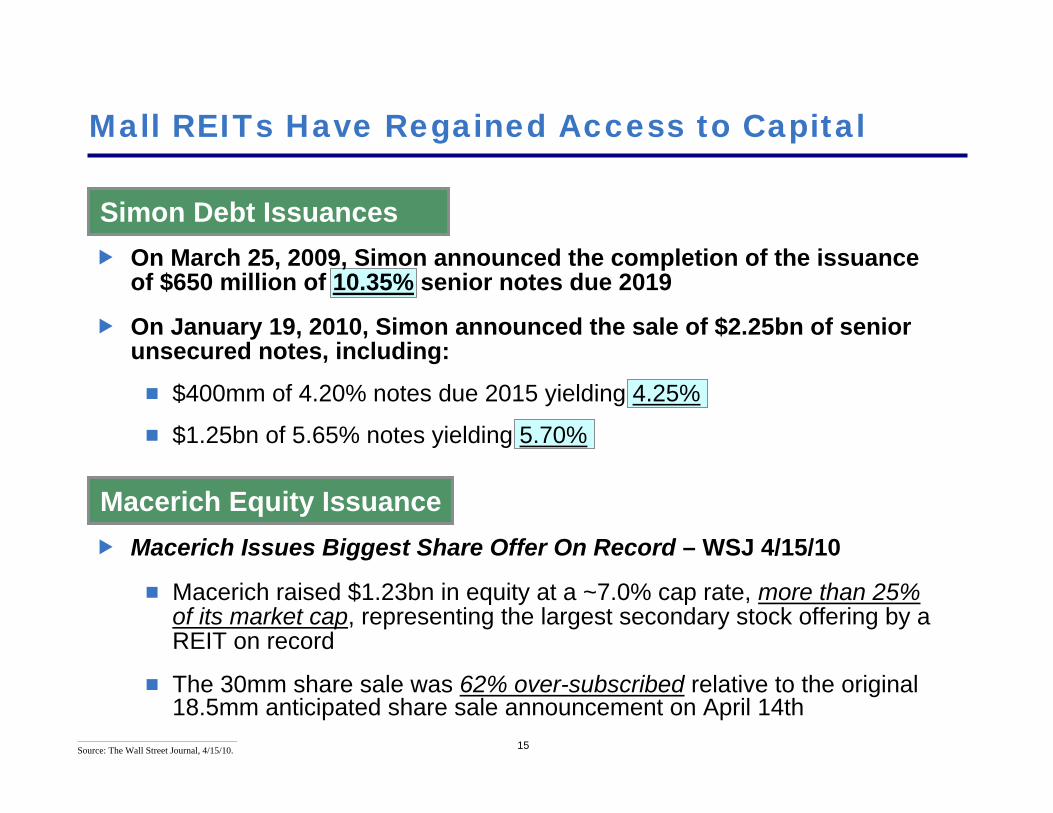
15
Mall REITs Have Regained Access to Capital
________________________________________________
Source: The Wall Street Journal, 4/15/10.
On March 25, 2009, Simon announced the completion of the issuance of $650 million of 10.35% senior notes due 2019
On January 19, 2010, Simon announced the sale of $2.25bn of senior unsecured notes, including:
$400mm of 4.20% notes due 2015 yielding 4.25%
$1.25bn of 5.65% notes yielding 5.70%
Macerich Issues Biggest Share Offer On Record – WSJ 4/15/10
Macerich raised $1.23bn in equity at a ~7.0% cap rate, more than 25%of its market cap, representing the largest secondary stock offering by a REIT on record
The 30mm share sale was 62% over-subscribed relative to the original 18.5mm anticipated share sale announcement on April 14th
Simon Debt Issuances
Macerich Equity Issuance
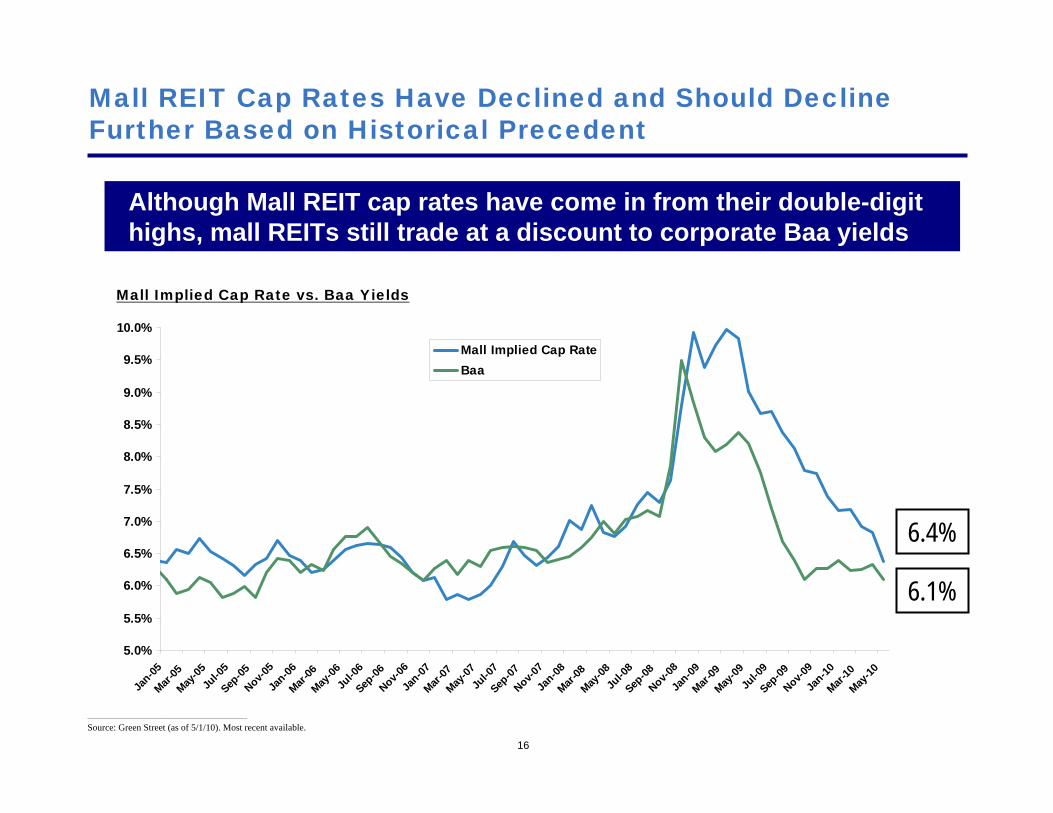
16
5.0%
5.5%
6.0%
6.5%
7.0%
7.5%
8.0%
8.5%
9.0%
9.5%
10.0%
Jan-05
Mar-05
May-05
Jul-0
5Sep
-05Nov-0
5Ja
n-06Mar
-06May
-06Ju
l-06
Sep-06
Nov-06
Jan-07
Mar-07
May-07
Jul-0
7Sep
-07Nov-0
7Ja
n-08Mar
-08May
-08Ju
l-08
Sep-08
Nov-08
Jan-09
Mar-09
May-09
Jul-0
9Sep
-09Nov-0
9Ja
n-10Mar
-10May
-10
Mall Implied Cap RateBaa
Mall REIT Cap Rates Have Declined and Should Decline Further Based on Historical Precedent
Although Mall REIT cap rates have come in from their double-digit highs, mall REITs still trade at a discount to corporate Baa yields
Mall Implied Cap Rate vs. Baa Yields
6.4%
6.1%
________________________________________________
Source: Green Street (as of 5/1/10). Most recent available.

17
Tenant Bankruptcies Have Decreased
________________________________________________
Source: Taubman quarterly financial supplements.
Taubman’s reported tenant bankruptcies dropped to 0% in Q1’10
Taubman Reported Tenant Bankruptcy Filings as a % of Total Tenants
0.1%
1.0%
1.1%
0.9%
1.1%
0.8%
0.0%0.0%
0.3%
0.6%
0.9%
1.2%
1.5%
Q3'08 Q4'08 Q1'09 Q2'09 Q3'09 Q4'09 Q1'10

18
Tenant CDS Spreads Have Narrowed
Mall tenant CDS spreads have narrowed approximately 400 basis points from peak levels seen in 2009
139bps
GGP Top 10 Tenants CDS Basket
________________________________________________
Note: Represents an equal-weighted basket of CDS prices for GGP’s top 10 tenants (where CDS pricing is available), which include Gap, Limited, JC Penney and Macy’s.Source: Bloomberg (5/28/10).
0bps
100bps
200bps
300bps
400bps
500bps
600bps
Jan-09 Mar-09 May-09 Jul-09 Sep-09 Nov-09 Jan-10 Mar-10 May-10

1919
Simon expects to lose less than 2bps of total revenue as the result of rent relief concessions in 2009
Rent Relief Less of an Issue than Originally Anticipated
“Our 2009 rent relief total will be under $10 million, as in the $7 million to $8 million range. But as I think we said on the call last quarter, we hadn’t seen much of it year-to-date. So it’s a little back-end weighted, and as you look at the impact of average base rent it could have a nominal impact. But it’s a small number in the context of the size of our income statements.”
– Steve Sterrett, CFO of Simon Property Group, October 30, 2009

20
Mall Leasing Activity Picking Up Substantially
“Retail leasing activity increased significantly in the first quarter of 2010, with total in-line and outparcel tenant leasing deals covering 1.36 million square feet signed, an increase of 21% over the same period of last year. Within total deals, the number of new lease deals grew 84%, representing new deal square footage of approximately 284 thousand square feet. Although rents remain below 2007 peak levels, they have stabilized. As sales continue their upward trend, the Company expects lease rates to reflect those increases over time.”
– GGP Q1’10 Operating Supplement

21
Tenant Sales Growing Quickly
________________________________________________
Source: “Why the Sad Face Mall Sector?” Credit Suisse equity research (4/26/10).
Anchor tenant same store sales have turned from negative in late 2008 and 2009 to materially positive so far in 2010
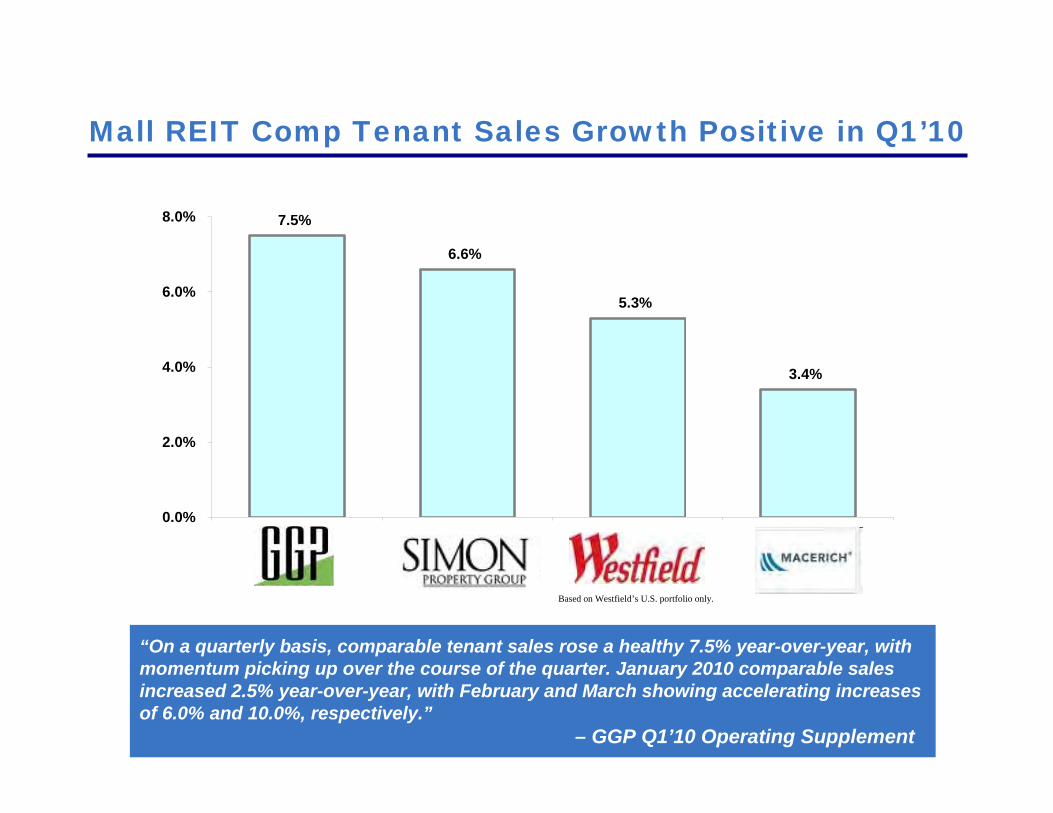
22
Mall REIT Comp Tenant Sales Growth Positive in Q1’10
7.5%
6.6%
5.3%
3.4%
0.0%
2.0%
4.0%
6.0%
8.0%
Based on Westfield’s U.S. portfolio only.
“On a quarterly basis, comparable tenant sales rose a healthy 7.5% year-over-year, with momentum picking up over the course of the quarter. January 2010 comparable sales increased 2.5% year-over-year, with February and March showing accelerating increases of 6.0% and 10.0%, respectively.”
– GGP Q1’10 Operating Supplement

23
The U.S. economy has recovered
The U.S. consumer is bouncing back
Mall traffic is increasing
Demand for mall REIT debt and equity capital is high
Cap rates have declined substantially
Store closure fears were overblown
Tenants are much better capitalized
Rent relief has been minimal
Tenant sales have returned to growth
The World has Improved Dramatically
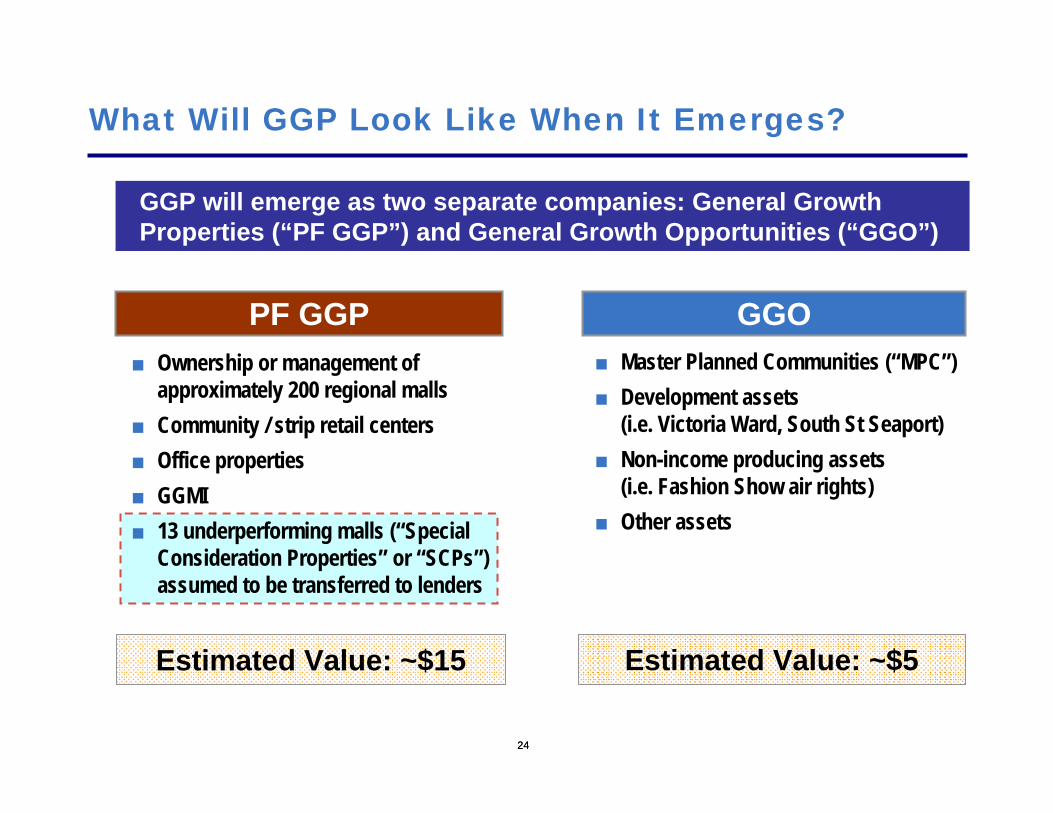
24
■ Ownership or management of approximately 200 regional malls
■ Community / strip retail centers■ Office properties■ GGMI■ 13 underperforming malls (“Special
Consideration Properties” or “SCPs”) assumed to be transferred to lenders
What Will GGP Look Like When It Emerges?
GGOPF GGP■ Master Planned Communities (“MPC”)■ Development assets
(i.e. Victoria Ward, South St Seaport)■ Non-income producing assets
(i.e. Fashion Show air rights)■ Other assets
24
Estimated Value: ~$15
GGP will emerge as two separate companies: General Growth Properties (“PF GGP”) and General Growth Opportunities (“GGO”)
Estimated Value: ~$5

PF GGP
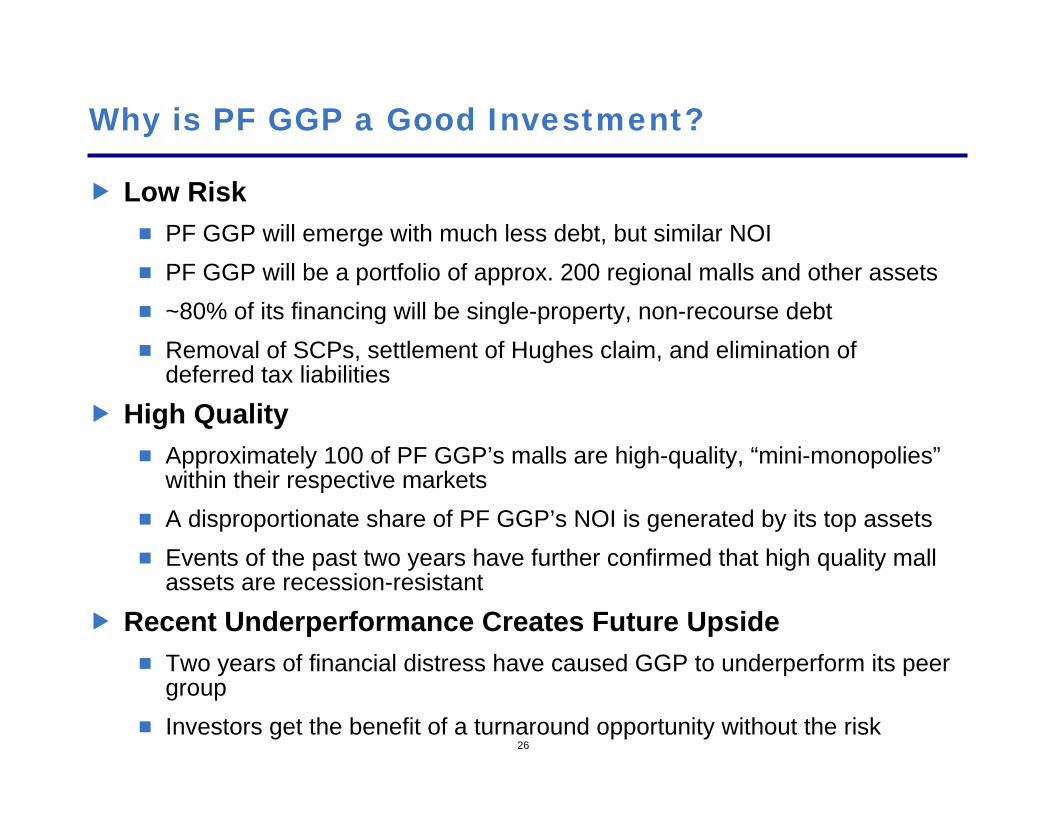
26
Why is PF GGP a Good Investment?
Low RiskPF GGP will emerge with much less debt, but similar NOIPF GGP will be a portfolio of approx. 200 regional malls and other assets~80% of its financing will be single-property, non-recourse debtRemoval of SCPs, settlement of Hughes claim, and elimination of deferred tax liabilities
High QualityApproximately 100 of PF GGP’s malls are high-quality, “mini-monopolies”within their respective marketsA disproportionate share of PF GGP’s NOI is generated by its top assetsEvents of the past two years have further confirmed that high quality mall assets are recession-resistant
Recent Underperformance Creates Future UpsideTwo years of financial distress have caused GGP to underperform its peer groupInvestors get the benefit of a turnaround opportunity without the risk

27
Why is PF GGP a Good Investment? (Cont’d)
Over the past twelve months, the credit quality of the “bonds”has improved as tenant credit quality has strengthened and their CDS spreads have narrowed
Leasing up the mall adds new “bonds” and incremental cash flow to the portfolio with minimal capital investment
The “bonds” represent a diverse group of retailers, restaurants and entertainment concepts, and if a tenant defaults, it can be replaced at little cost
Malls have a 50-year track record of stability and strong performance
This “bond” portfolio is inflation-protected due to percentage rent and the rollover of 10-15% of leases per annum
A mall is like a trust which holds a portfolio of bonds
28
The Value of Non-Recourse Debt
Non-recourse financing creates material value for all real estate portfolios, but mall portfolios in particular
The reason is that B minus and lower malls have potential catastrophic risk. For example, a mall might lose key anchor tenants, or be disintermediated by a better located mall, which could cause a mall to lose 80% or more of its value
If such events were to destroy the value of a mall, the exposure to an investor with non-recourse financing is limited to its equity in the mall because the property can be “sold” to the lender for the mortgage amount
If a mall is a portfolio of bonds, then a mall REIT is a portfolio of portfolios of bonds
On the other hand, a mall REIT primarily financed with unsecured, recourse debt (i.e. Simon or Westfield) is analogous to an investor’s portfolio with margin debt, where the failure of a portion of the portfolio can destroy large amounts, if not 100%, of the equity value
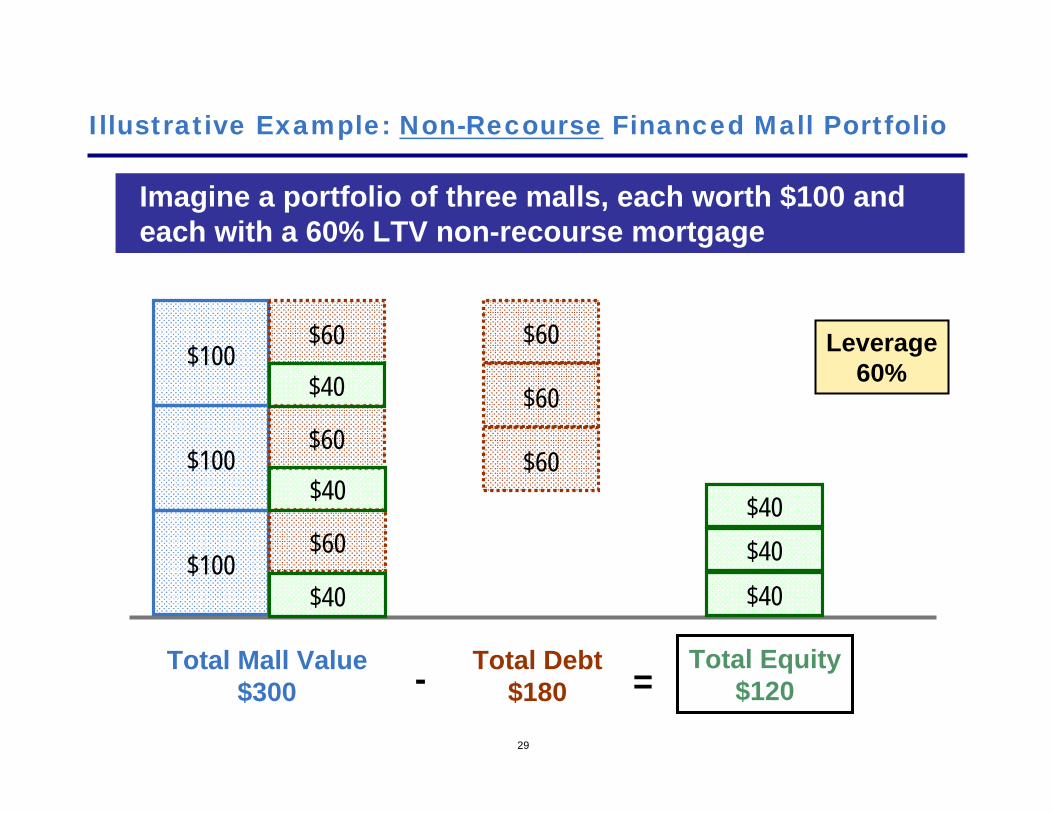
29
Illustrative Example: Non-Recourse Financed Mall Portfolio
Imagine a portfolio of three malls, each worth $100 and each with a 60% LTV non-recourse mortgage
$100$60
$100$60
$100$60
Total Mall Value$300
Total Debt$180
Total Equity$120- =
Leverage60%
$40
$40
$40
$60
$60
$60
$40$40$40

30
Illustrative Example: Non-Recourse Financed Mall Portfolio (Cont’d)
$100$60
$100$60
$0
Total Mall Value$200
Total Debt$120
Total Equity$80- =
$40
$40
$60
$60
$40$40
Now assume one of the malls suffers catastrophic risk. One-third of the equity value is lost, and leverage remains the same
Leverage60%
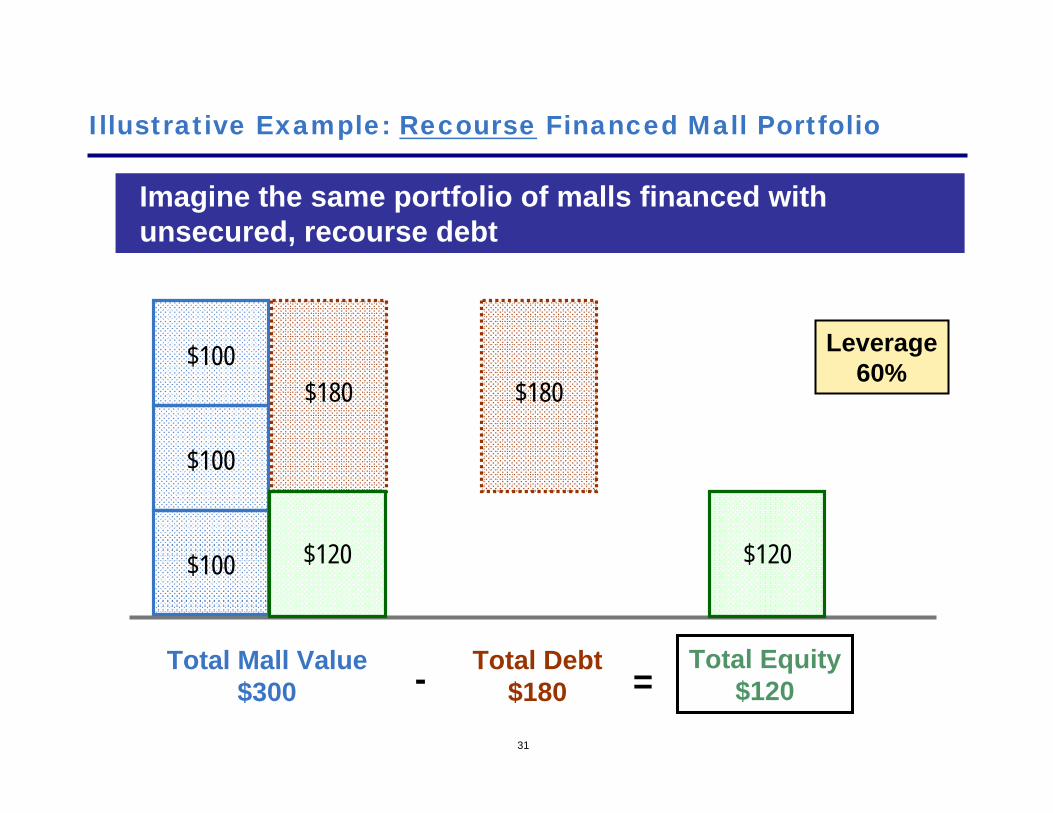
31
Illustrative Example: Recourse Financed Mall Portfolio
Imagine the same portfolio of malls financed with unsecured, recourse debt
$100
$100
$100
Total Mall Value$300
Total Debt$180
Total Equity$120- =
Leverage60%
$180
$120
$180
$120

32
Illustrative Example: Recourse Financed Mall Portfolio (Cont’d)
$100
$100
Total Mall Value$200
Total Debt$180
Total Equity$20- =
$180 $180
$20
$0
Leverage90%
If one of the malls dies, equity value is nearly wiped out. Given the covenants associated with recourse debt, the destruction of value would likely be even more severe

33
PF GGP Operating Metrics
The disposition of Special Consideration Properties (SCPs) and GGO assets materially enhances PF GGP’s operating metrics
TTMTenant Occup.
GLA (4) Sales PSF Occup. Cost
GGP (1) 65.3 $411 90.5% 14.6%
Less: SCPs / Highland (2) 3.9 250 82.5% 18.0%Less: GGO Malls (3) 2.0 325 82.5% 17.0%
PF GGP 59.4 $424 91.3% 14.3%
(1) Source: GGP Q1'10 supplement pgs. 31-32.(2) See appendix for details.(3) Includes Victoria Ward, Landmark Mall, Rio West, South Street Seaport, Redlands Mall, Riverwalk Marketplace, Park West and Cottonwood Mall.
See Exhibit E docket #4874 for full list of GGO assets. Source for tenant sales, occupancy and occupancy cost: Pershing Square estimates.(4) Mall and freestanding gross leasable area (excludes anchors). Units in millions of sq ft.
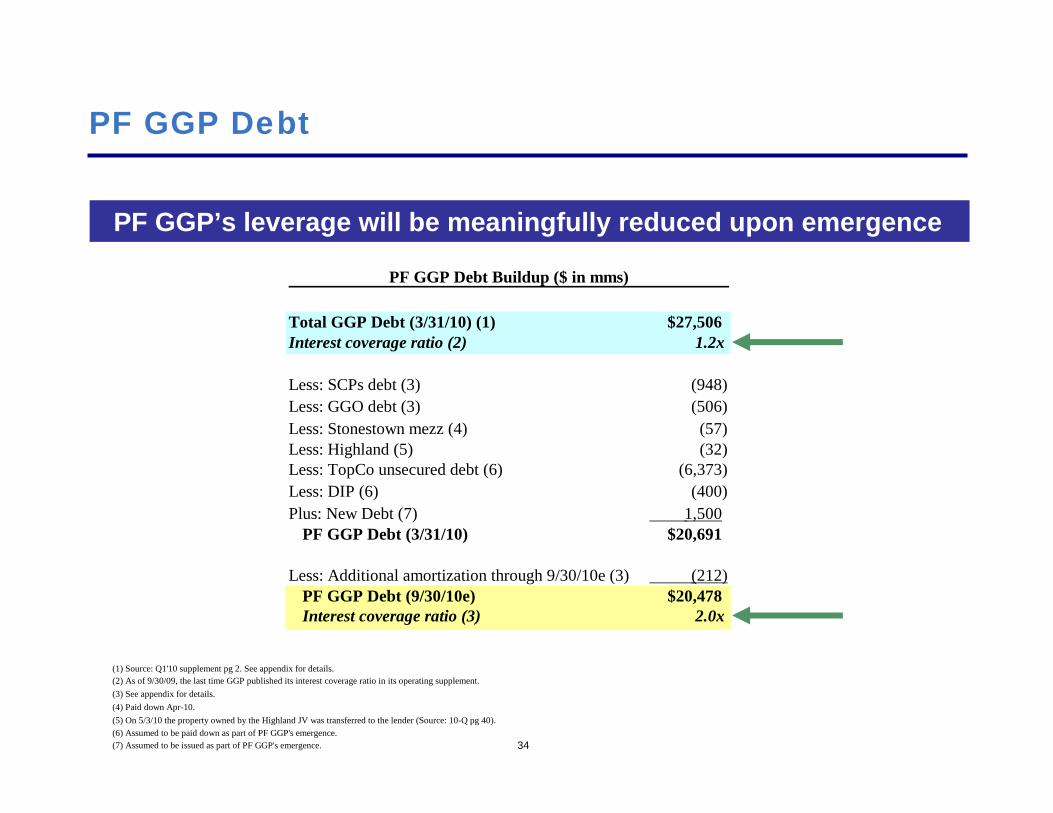
34
PF GGP Debt
PF GGP’s leverage will be meaningfully reduced upon emergence
(1) Source: Q1'10 supplement pg 2. See appendix for details.(2) As of 9/30/09, the last time GGP published its interest coverage ratio in its operating supplement.(3) See appendix for details.(4) Paid down Apr-10.(5) On 5/3/10 the property owned by the Highland JV was transferred to the lender (Source: 10-Q pg 40).(6) Assumed to be paid down as part of PF GGP's emergence.(7) Assumed to be issued as part of PF GGP's emergence.
PF GGP Debt Buildup ($ in mms)
Total GGP Debt (3/31/10) (1) $27,506Interest coverage ratio (2) 1.2x
Less: SCPs debt (3) (948)Less: GGO debt (3) (506)Less: Stonestown mezz (4) (57) Less: Highland (5) (32) Less: TopCo unsecured debt (6) (6,373) Less: DIP (6) (400) Plus: New Debt (7) 1,500
PF GGP Debt (3/31/10) $20,691
Less: Additional amortization through 9/30/10e (3) (212) PF GGP Debt (9/30/10e) $20,478Interest coverage ratio (3) 2.0x

35
PF GGP Cash NOI
Despite the dispositions of SCPs and GGO assets, PF GGP’s net operating income will be relatively unaffected
(1) Source: GGP operating supplements. See appendix for detail.(2) One-time revenue/expense impacts arising due to the bankruptcy. These are non-recurring items.
Assumes 2009 and LTM are equal. Source: GGP Q4'09 operating supplement pg 7.(3) One-time additional property upkeep costs. This reflects "catch-up" R&M spend.
Assumes 2009 and LTM are equal. Source: GGP Q4'09 operating supplement pg 7.(4) Represents drag to GGP NOI from PF GGP development projects. Source: Pershing Square estimate.(5) Represents LTM cash NOI attributable to the SCP malls and GGO assets that are assumed
to not be included in PF GGP cash NOI post-emergence. Excludes MPC NOI.Source: Pershing Square estimate.
PF GGP Adj Cash NOI Buildup ($ in mms)
LTM GGP Cash NOI (1) $2,360
Plus: Bankruptcy claims revenue/expense impact (2) 25Plus: One-time R&M spend (3) 16Plus: Real estate tax expense from dvlpmt projects (4) 5Less: SCPs / GGO / Highland LTM cash NOI (5) (115)
LTM PF GGP Adj Cash NOI $2,290
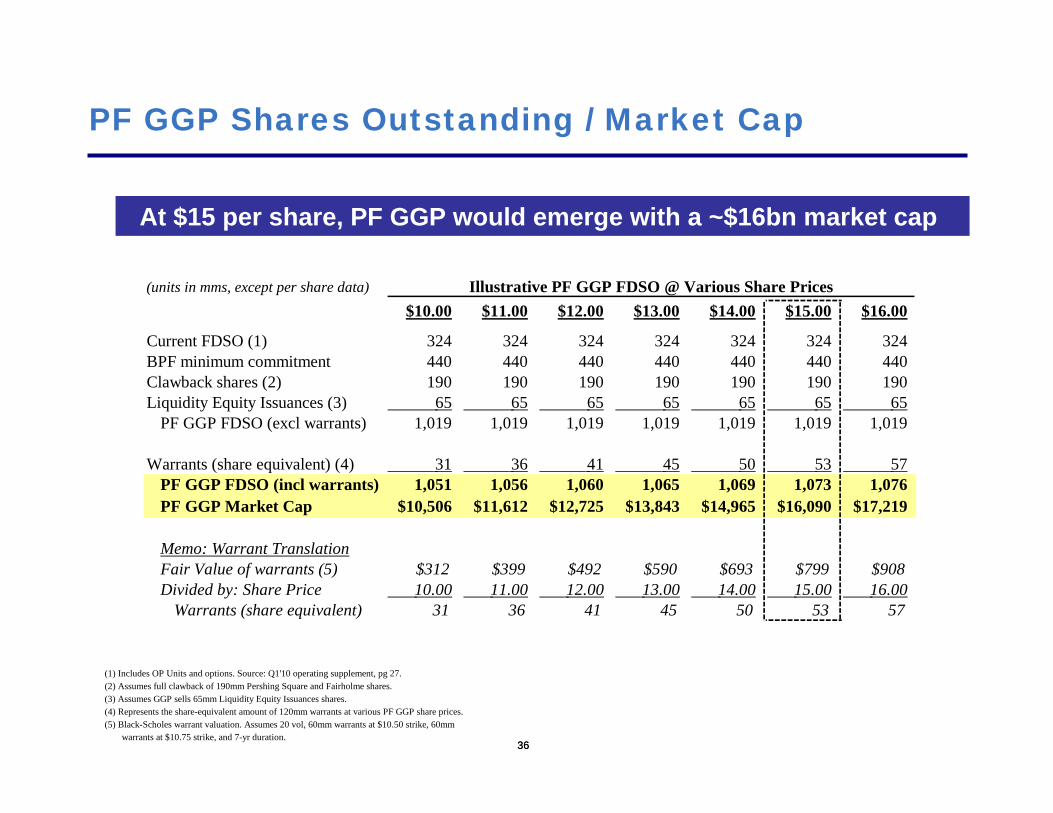
36
PF GGP Shares Outstanding / Market Cap
36
At $15 per share, PF GGP would emerge with a ~$16bn market cap
(1) Includes OP Units and options. Source: Q1'10 operating supplement, pg 27.(2) Assumes full clawback of 190mm Pershing Square and Fairholme shares.(3) Assumes GGP sells 65mm Liquidity Equity Issuances shares.(4) Represents the share-equivalent amount of 120mm warrants at various PF GGP share prices.(5) Black-Scholes warrant valuation. Assumes 20 vol, 60mm warrants at $10.50 strike, 60mm
warrants at $10.75 strike, and 7-yr duration.
(units in mms, except per share data) Illustrative PF GGP FDSO @ Various Share Prices$10.00 $11.00 $12.00 $13.00 $14.00 $15.00 $16.00
Current FDSO (1) 324 324 324 324 324 324 324BPF minimum commitment 440 440 440 440 440 440 440Clawback shares (2) 190 190 190 190 190 190 190Liquidity Equity Issuances (3) 65 65 65 65 65 65 65
PF GGP FDSO (excl warrants) 1,019 1,019 1,019 1,019 1,019 1,019 1,019
Warrants (share equivalent) (4) 31 36 41 45 50 53 57 PF GGP FDSO (incl warrants) 1,051 1,056 1,060 1,065 1,069 1,073 1,076PF GGP Market Cap $10,506 $11,612 $12,725 $13,843 $14,965 $16,090 $17,219
Memo: Warrant TranslationFair Value of warrants (5) $312 $399 $492 $590 $693 $799 $908Divided by: Share Price 10.00 11.00 12.00 13.00 14.00 15.00 16.00
Warrants (share equivalent) 31 36 41 45 50 53 57

37
PF GGP Would Be the Second Largest U.S. REIT
37
Top 5 REITs in the IYR REIT Index by Rank (as of 5/28/10)
At $15 per share, PF GGP would be the second largest REIT in the index
________________________________________________
Source: Market cap data from Green Street Real Estate Securities Monthly (as of 6/1/10).
REIT % of IYR Mkt Cap
1. Simon Property Group 8.7% $29,987
PF GGP 0.0% 16,090
2. Vornado 5.0% 15,016
3. Equity Residential 4.4% 13,297
4. Public Storage 4.3% 15,456
5. Boston Properties 3.8% 12,341
15. Macerich 1.9% 5,782

38
PF GGP Will Be A “Must-Own” REIT Stock
38
Shareholder overlap among public REITs is extremely high due to a large, dedicated REIT investor universe
Dedicated REIT investors closely track REIT indexes
As a result of GGP’s bankruptcy, it was removed from REIT indexes
When PF GGP emerges from bankruptcy, it will once again be added to the real estate indexes. This will make it a “must-own” equity

39
Simon Crossholdings Analysis
39
There is enormous shareholder overlap among the top five REITs in the IYR. On average, the same 25 holders own ~60% of the top five REITs, yet they currently own less than 1% of GGP. In order to obtain similar ownership of PF GGP, they must buy 60% or $9bn of PF GGP
Equity Public Boston(units in millions) Simon Vornado Residential Storage Properties Macerich GGP
Top 25 Holders Shares Value Shares Value Shares Value Shares Value Shares Value Shares Value Shares ValueThe Vanguard Group 25 $2,120 14 $1,073 24 $1,068 11 $1,034 12 $922 9 $364 - - BlackRock 20 1,668 13 975 22 977 11 969 11 833 9 359 0 0 Cohen & Steers 17 1,464 6 444 11 476 8 680 4 336 6 229 - - State Street Global Advisors 13 1,117 8 579 13 555 6 559 6 481 3 130 0 2 Fidelity Investments 11 965 7 524 8 341 6 505 4 286 6 224 0 5 Stichting Pensioenfonds 9 789 6 489 12 519 5 490 5 400 2 68 - - ING Investment Mgmt 9 761 7 567 8 332 2 149 2 145 12 496 - - Morgan Stanley Inv Mgmt 8 660 5 392 17 734 3 288 4 299 1 30 0 0 Invesco 8 657 5 358 7 311 3 316 4 290 4 163 0 0 PGGM 10 852 4 280 5 225 2 194 3 213 3 128 - - LaSalle Investment Mgmt 6 529 5 343 6 251 3 311 3 213 1 21 - - Old Mutual Asset Mgmt 4 346 5 393 7 312 3 285 3 200 3 115 1 17 RREEF 7 547 1 99 3 150 3 317 4 335 2 96 - - AEW Capital Mgmt 5 416 3 211 6 285 2 212 3 236 3 108 - - T. Rowe Price Group 5 387 3 192 3 149 1 132 2 155 2 97 - - Security Capital Research 3 266 1 98 6 254 2 185 3 231 2 76 - - Frank Russell 4 325 2 154 4 168 2 180 2 125 2 64 - - STB Asset Mgmt 4 310 2 189 3 139 2 160 2 171 0 3 - - Northern Trust 3 291 2 152 3 150 2 146 2 129 1 31 - - Principal Global Investors 4 328 1 108 2 102 2 159 2 151 1 27 2 24 Dimensional Fund Advisors 3 265 2 152 3 134 2 168 2 116 1 40 0 0 Goldman Sachs Asset Mgmt 5 436 1 66 0 14 1 118 2 178 0 3 0 6 TIAA-CREF 3 250 2 133 2 106 2 148 2 127 1 51 0 3 Nikko Asset Mgmt 3 241 2 159 3 118 1 130 2 137 0 16 - - Adelante Capital Mgmt 3 218 2 126 3 142 1 126 2 117 1 31 - -
Top 25 Holders 193 $16,209 109 $8,255 182 $8,010 88 $7,961 90 $6,826 74 $2,971 4 $57% of Mkt Cap (1) 66% 60% 64% 52% 65% 57% 0%
________________________________________________
Source: Capital IQ as of 5/21/10. (1) % of market cap is based on Capital IQ market cap estimates, which tend to rely solely on basic shares outstanding.
% of GGP market cap is based on PF GGP market cap at $15 per share.

40
Not Your Typical Public Offering
40
PF GGP’s emergence from bankruptcy will be tantamount to an initial public offering (IPO)
Unlike traditional IPOs where buyers have all the leverage, PF GGP’s equity is already fully committed pre-offering. As a result, rather than be a forced seller, PF GGP can achieve a high value execution
Under the terms of the Brookfield, Fairholme, and Pershing Square agreement, PF GGO can sell up to 255 million shares at prices of $10.50 or greater (1)
________________________________________________(1) Assumes full clawback of 190mm Pershing Square and Fairholme shares.
Assumes GGP sells full amount of 65mm Liquidity Equity Issuances shares.

41
PF GGP IPO Supply / Demand Dynamic
41
SupplyDemand
Anticipated PF GGP IPO Supply
Clawback shares (2) 190Liquidity Equity Issuances (3) 65
PF GGP IPO Share Supply 255
PF GGP share price 15.00$
Anticipated Supply $3,825
(1) Based on Simon Crossholdings Analysis.(2) Assumes full clawback of 190mm Pershing Square and Fairholme shares.(3) Assumes GGP sells 65mm Liquidity Equity Issuances shares.
($ and shares in millions)
Anticipated Demand fromthe Dedicated REIT Universe
PF GGP Market Cap (@$15) 16,090$
Top 25 REIT Investorsaverage % of Mkt Cap (1) 60.0%
Anticipated Demand $9,654

42
Illustrative PF GGP Valuation at Various Share Prices
42
At $15 per share, PF GGP would trade at a 6.6% cap rate, in linewith comparable mall REITs
(1) Target Net Debt as of the original Cornerstone Investment Agreement. Target Net Debt is an estimate of GGP's net debt as of 9/30/10e.Target Net Debt includes PF GGP and GGO liabilities. In addition, Target Net Debt includes non-debt liabilities, such as accrued interest andPermitted Claims (i.e. the KEIP), among other things. Therefore, Target Net Debt includes the Company's estimate of bankruptcy "exit costs."Furthermore, Target Net Debt includes the following: $1.5bn of New Debt, debt associated with GGP's international subsidiaries, and preferred stock.Source: pg 75 of docket #4874. See appendix for details.
(2) SCP debt needs to be removed from Target Net Debt to arrive at an estimate of PF GGP debt upon emergence (assumed to be 9/30/10e).This assumes GGP "hands back the keys" on SCP malls. This is a Pershing Square assumption as the outcome is TBD. Source: pg 17 of Q1'10 10-Q.See appendix for details.
(3) Debt associated with properties going to GGO needs to be removed from Target Net Debt to arrive at an estimate of PF GGP debt.GGO debt includes debt associated with Victoria Ward, GGP's headquarters leasehold, the Bridgelands MPC and GGP's pro rata share of theWoodlands MPC debt. Debt estimate is derived from GGP's public filings and may not exactly reconcile to GGP's 9/30/10e estimate of such debt.See appendix for details.
(4) Brazil debt included in Target Net Debt is $110.4mm (Source: Cornerstone Investment Agreement.) GGP's share of this debt as of 3/31/10 was $95.2mm. Source: Q1'10 supplement pg 2.
(5) See Excess Sources appendix page for details. Excess Sources are treated as cash and offset Target Net Debt. Bankruptcy "exit costs"are excluded from uses in the Excess Sources calculation because they are included as Permitted Claims in Target Net Debt.Excess Sources will likely be higher than presented, to the extent GGO's IPO Participation is greater than permitted liabilities.
(6) Includes GGP's other liabilities that are not accounted for as part of Target Net Debt. See appendix for details.(7) See appendix for details. Excludes goodwill.(8) Applies 25% EBIT margin assumption to LTM management income of $80mm. Applies 7.5x
multiple to implied LTM EBIT. Source for LTM fee income: GGP operating supplements.(9) PF GGP development assets including Christiana Mall, Fashion Place, St Louis Galleria. Source: Q1'10 operating supplement.(10) 9/30/10e PF GGP debt less $500mm of Proportionally Consolidated Unrestricted Cash.
(units in mms, except per share data) Illustrative PF GGP Cap Rate @ Various Share Prices Memo:$10.00 $11.00 $12.00 $13.00 $14.00 $15.00 $16.00 $9.00
Price $10.00 $11.00 $12.00 $13.00 $14.00 $15.00 $16.00 $9.00PF GGP FDSO (incl warrants) 1,051 1,056 1,060 1,065 1,069 1,073 1,076 1,045
Market Cap $10,506 $11,612 $12,725 $13,843 $14,965 $16,090 $17,219 $9,408
Target Net Debt (1) $22,971 $22,971 $22,971 $22,971 $22,971 $22,971 $22,971 $22,971Less: SCPs debt (2) (948) (948) (948) (948) (948) (948) (948) (948)Less: GGO debt (3) (506) (506) (506) (506) (506) (506) (506) (506)Less: Highland debt (32) (32) (32) (32) (32) (32) (32) (32)Less: Brazil adjustment (4) (15) (15) (15) (15) (15) (15) (15) (15)Less: Excess Sources (5) (1,678) (1,729) (1,780) (1,831) (1,882) (1,933) (1,984) (1,678)Plus: Other liabilities (6) 1,345 1,345 1,345 1,345 1,345 1,345 1,345 1,345Less: Other assets (7) (1,686) (1,686) (1,686) (1,686) (1,686) (1,686) (1,686) (1,686)
TEV $29,957 $31,012 $32,074 $33,141 $34,212 $35,287 $36,364 $28,859
Less: GGMI (8) (151) (151) (151) (151) (151) (151) (151) (151)Less: Development assets (9) (183) (183) (183) (183) (183) (183) (183) (183)
Adj TEV $29,623 $30,678 $31,740 $32,807 $33,878 $34,953 $36,030 $28,525
PF GGP LTM Adj Cash NOI 2,290 2,290 2,290 2,290 2,290 2,290 2,290 2,290 Cap Rate 7.7% 7.5% 7.2% 7.0% 6.8% 6.6% 6.4% 8.0%
Net Debt / TEV (10) 66.7% 64.4% 62.3% 60.3% 58.4% 56.6% 54.9% 69.2%

43
GGP Currently Trades at a Meaningful Cap Rate Spread to Simon
43
At a $14 share price, PF GGP trades at an 8.0% implied cap rate net of GGO(1)
________________________________________________
Source: “Why the Sad Face Mall Sector?” Credit Suisse equity research (4/26/10). (1) See previous page for details.

44
PF GGP Will Have An Industry Leading Balance Sheet
Interest Rate
Debt duration
Non-Recourse
Leverage Ratio
5.21%
5.3 yrs
78%
57%
5.50%
5.2 yrs
< 52%
50%
NA
7.0 yrs
< 20%
49%
5.49%
3.2 yrs
< 89%
53%
Although PF GGP will have slightly more leverage than its peers on an absolute basis, it will have a long-dated, laddered debt maturity profile. We believe a reasonable amount of non-recourse leverage, especially if the debt is high-quality, is more of an asset than a liability
Pro Forma(1) (2) (3) (4)
(5)
(1) See appendix for PF GGP balance sheet details. PF GGP Leverage Ratio represents Net Debt / Adj TEV at $15 per share.(2) Source: Simon operating supplements. Assumes 100% of mortgage debt is non-recourse. Most likely, some of
this debt is recourse but disclosure is unavailable.(3) Source: Westfield financial results. Data as of Q4'09 if Q1'10 data is unavailable.(4) Source: Macerich operating supplements. Adjusted to reflect April 25, 2010 paydown of $690mm line of credit and
April 7, 2010 paydown of $24mm Carmel Plaza loan. Adjusted to reflect refinancing and extension of Vintage Faire Mall loan.Assumes 100% of mortgage debt is non-recourse. Most likely, some of this debt is recourse but disclosure is unavailable.
(5) Source: Green Street Real Estate Securities Monthly (as of 6/1/10).

45
PF GGP Will Have Industry Leading Operating Metrics
Sales per Sq Ft
Occupancy
Occup. Cost
Tenants SalesGrowth (Q1’10)
Cap Rate
$424
91.3%
14.3%
7.5%
8.0%
PF GGP will have the added benefit of near-term growth as it refocuses on its operations post-emergence and corrects for the under-performance that resulted from its bankruptcy
Pro Forma(1) (2) (3)
$420
91.0%
15.1%
6.6%
6.6%
$400
92.1%
17.0%
5.3%
6.0%
$416
91.2%
14.2%
3.4%
7.0%(5)
(4)
(1) Simon malls only. Includes regional mall portfolio, the Mills, Mills regional malls, and malls included in Other Properties (excl Highland Mall).Source: Simon operating supplements and 10-K. See later pages for Simon Malls operating metrics details.
(2) Based on Westfield's U.S. mall portfolio only. Data as of Q4'09 if unavailable in Q1'10 financial results. Source: Westfield financial results.(3) Source: Macerich operating supplements.(4) Source for Macerich / Westfield: "U.S. Mall REITs May '10 Update" Green Street 5/19/10. See PF GGP Operating Metrics for PF GGP
occupancy cost details. See appendix for details on Simon's occupancy cost.(5) Source for Macerich / Westfield: Green Street Real Estate Securities Monthly (as of 6/1/10). PF GGP cap rate based on implied share price
of $9 net of GGO. See appendix for details on Simon's cap rate.

46
Aliansce
Sales per Sq Ft
Occupancy
Occup. Cost
Tenants SalesGrowth (Q1’10)
Cap Rate
$540
98.0%
13.4%
16.5%
~11%
(1) (2) (2)
$420
91.0%
15.1%
6.6%
6.6%
$400
92.1%
17.0%
5.3%
6.0%
$416
91.2%
14.2%
3.4%
7.0%
GGP owns 35% of Aliansce, a Brazilian mall developer, which went public in January. Pershing Square is the second largest owner with roughly 14% of the total shares outstanding
(2)
(1) Source: Aliansce Q1'10 financial results and Pershing Square estimates.(2) See previous page for details.

47
A Word On Simon’s Reported Operating Metrics
47
Beginning in Q1’10, Simon consolidated its Premium Outlets segment into its Regional Malls segment. This caused its newly reported Regional Malls segment’s occupancy and sales per square foot to appear to increase meaningfully
________________________________________________
Source: Simon operating supplements.

48
A Word On Simon’s Reported Operating Metrics (Cont’d)
48
We note that Simon’s Regional Mall portfolio excludes several regional malls in The Mills and Mills Regional Malls segments
In our view, these assets should be included in Simon’s Regional Malls portfolio
Simon has also transferred certain of its underperforming malls into its Other Properties segment
For example, Highland Mall, a joint venture between Simon and GGP that was 51% occupied as of 12/31/09, was recently transferred back to the lender
Highland Mall was included in Simon’s Regional Mall portfolio as of 12/31/08, but showed up in its Other Properties segment as of 12/31/09. This further served to increase Simon’s reported Regional Mall occupancy and sales per square foot as of Q1’10
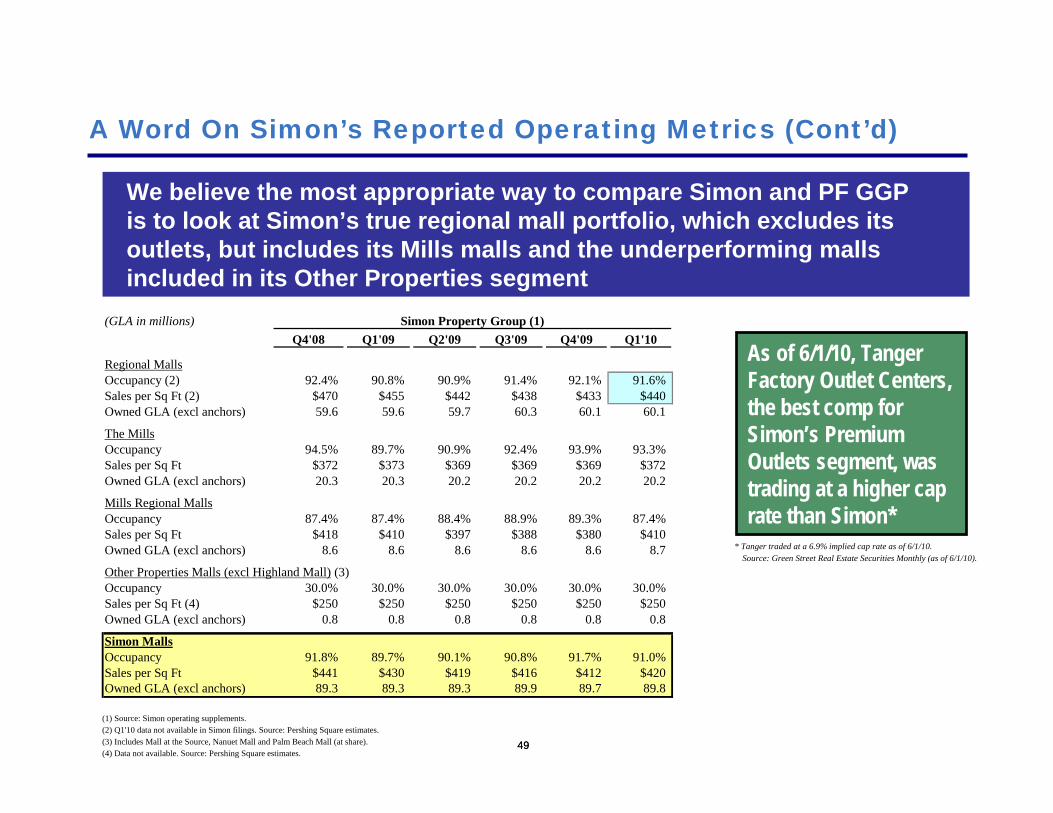
49
A Word On Simon’s Reported Operating Metrics (Cont’d)
49
We believe the most appropriate way to compare Simon and PF GGP is to look at Simon’s true regional mall portfolio, which excludes its outlets, but includes its Mills malls and the underperforming malls included in its Other Properties segment
(GLA in millions) Simon Property Group (1)Q4'08 Q1'09 Q2'09 Q3'09 Q4'09 Q1'10
Regional MallsOccupancy (2) 92.4% 90.8% 90.9% 91.4% 92.1% 91.6%Sales per Sq Ft (2) $470 $455 $442 $438 $433 $440Owned GLA (excl anchors) 59.6 59.6 59.7 60.3 60.1 60.1
The MillsOccupancy 94.5% 89.7% 90.9% 92.4% 93.9% 93.3%Sales per Sq Ft $372 $373 $369 $369 $369 $372Owned GLA (excl anchors) 20.3 20.3 20.2 20.2 20.2 20.2
Mills Regional MallsOccupancy 87.4% 87.4% 88.4% 88.9% 89.3% 87.4%Sales per Sq Ft $418 $410 $397 $388 $380 $410Owned GLA (excl anchors) 8.6 8.6 8.6 8.6 8.6 8.7
Other Properties Malls (excl Highland Mall) (3)Occupancy 30.0% 30.0% 30.0% 30.0% 30.0% 30.0%Sales per Sq Ft (4) $250 $250 $250 $250 $250 $250Owned GLA (excl anchors) 0.8 0.8 0.8 0.8 0.8 0.8
Simon MallsOccupancy 91.8% 89.7% 90.1% 90.8% 91.7% 91.0%Sales per Sq Ft $441 $430 $419 $416 $412 $420Owned GLA (excl anchors) 89.3 89.3 89.3 89.9 89.7 89.8
(1) Source: Simon operating supplements.(2) Q1'10 data not available in Simon filings. Source: Pershing Square estimates.(3) Includes Mall at the Source, Nanuet Mall and Palm Beach Mall (at share).(4) Data not available. Source: Pershing Square estimates.
As of 6/1/10, TangerFactory Outlet Centers, the best comp for Simon’s Premium Outlets segment, was trading at a higher cap rate than Simon*
* Tanger traded at a 6.9% implied cap rate as of 6/1/10.Source: Green Street Real Estate Securities Monthly (as of 6/1/10).

GGO

51
What is General Growth Opportunities?
GGO’s portfolio features some of the best real estate development assets in the country. We believe GGO will have the balance sheet and the intellectual and operating capital to take full advantage of these opportunities
General Growth Opportunities (Select Assets)
MPC Development Non-Income/Other
■ Summerlin■ Columbia■ Woodlands■ Bridgeland
■ Victoria Ward■ South St. Seaport■ Summerlin Center■ Landmark Mall■ Park West
■ Fashion Show■ Princeton Land■ 110 N. Wacker

52
GGO IPO Participation
Under the terms of the fully executed Cornerstone Investment Agreement, GGO will retain 80% of every dollar PF GGP raises above $10 per share, up to the value of the ~$300mm deferred tax liabilities and the Hughes claim. This IPO Participation allows GGO to benefit from a successful PF GGP capital raise
(1) Assume 65mm Shares
GGO IPO Participation at a $15/share GGP Offering($ in millions, except per share data)
GGP Shares Issued
Total Proceeds
Proceeds above $10
GGO % Share
GGO $ Share
Clawback Shares 190 2,850$ 950$ 80% 760$ Liquidity Shares (1) 65 975 325 80% 260
255 3,825$ 1,275$ 1,020$
Sensitivity of GGO IPO Participation to GGP Offer Price
GGP Offer Price 10.00$ 11.00$ 12.00$ 13.00$ 14.00$ 15.00$ 16.00$ GGO IPO Participation -$ 204$ 408$ 612$ 816$ 1,020$ 1,224$
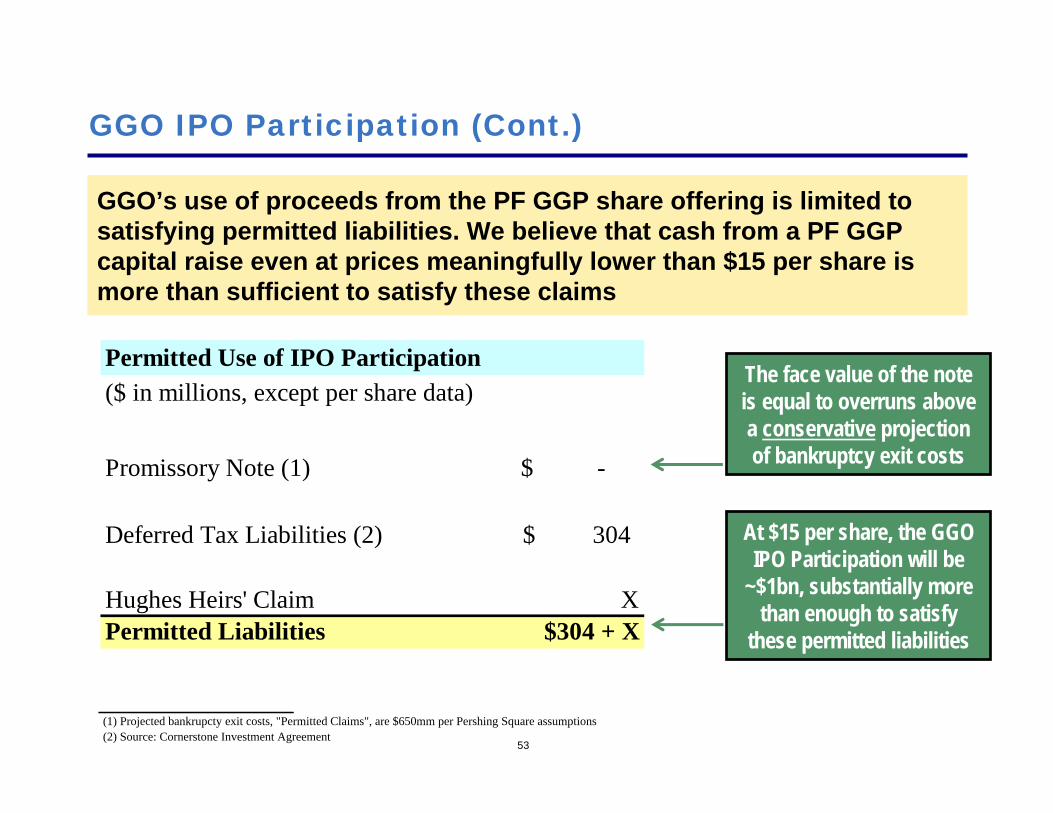
53
GGO IPO Participation (Cont.)
GGO’s use of proceeds from the PF GGP share offering is limited to satisfying permitted liabilities. We believe that cash from a PF GGP capital raise even at prices meaningfully lower than $15 per share is more than sufficient to satisfy these claims
The face value of the note is equal to overruns above a conservative projection of bankruptcy exit costs
At $15 per share, the GGO IPO Participation will be
~$1bn, substantially more than enough to satisfy
these permitted liabilities
Permitted Use of IPO Participation($ in millions, except per share data)
Promissory Note (1) -$
Deferred Tax Liabilities (2) 304$
Hughes Heirs' Claim XPermitted Liabilities $304 + X
(1) Projected bankrupcty exit costs, "Permitted Claims", are $650mm per Pershing Square assumptions(2) Source: Cornerstone Investment Agreement

54
Hughes Claim
GGP can settle the claim in bankruptcy at an estimation hearing
Settlement is based on a 12/31/09 valuation of Summerlin MPC
We expect the company to settle this claim at a reasonable number
Post settlement, GGO will have 100% ownership of Summerlin(from 50%)
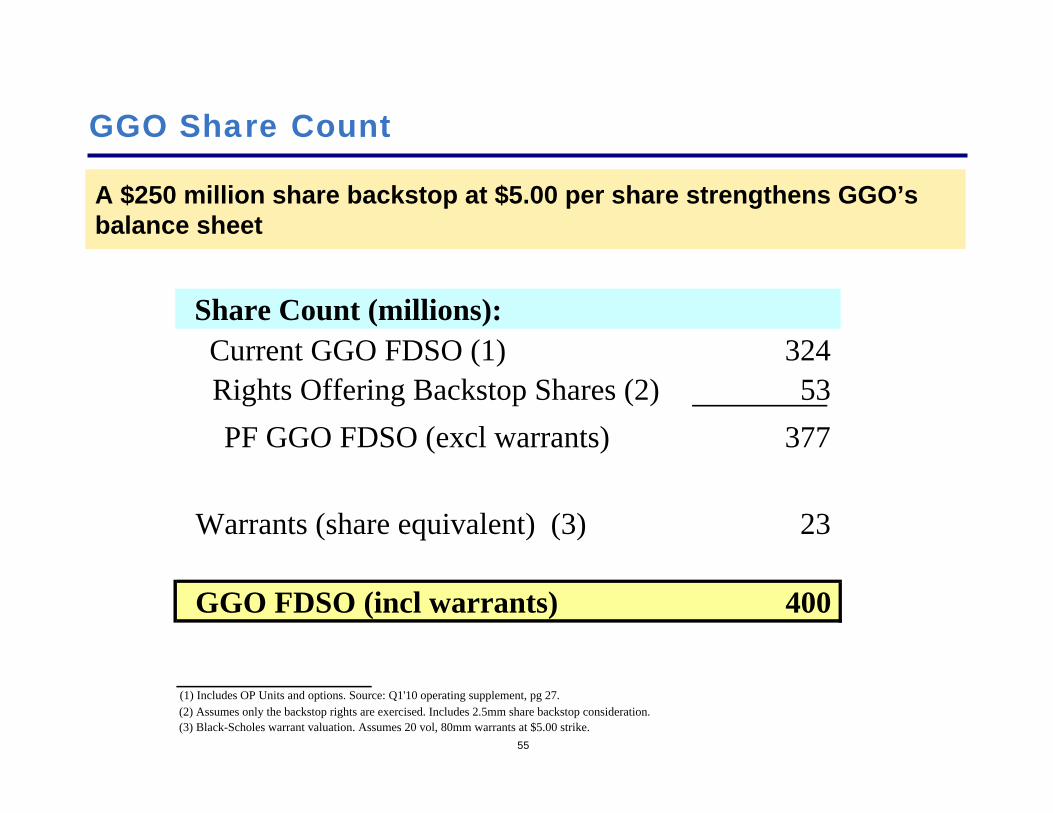
55
GGO Share Count
A $250 million share backstop at $5.00 per share strengthens GGO’sbalance sheet
(1) Includes OP Units and options. Source: Q1'10 operating supplement, pg 27.(2) Assumes only the backstop rights are exercised. Includes 2.5mm share backstop consideration.(3) Black-Scholes warrant valuation. Assumes 20 vol, 80mm warrants at $5.00 strike.
Share Count (millions):Current GGO FDSO (1) 324Rights Offering Backstop Shares (2) 53PF GGO FDSO (excl warrants) 377
Warrants (share equivalent) (3) 23
GGO FDSO (incl warrants) 400
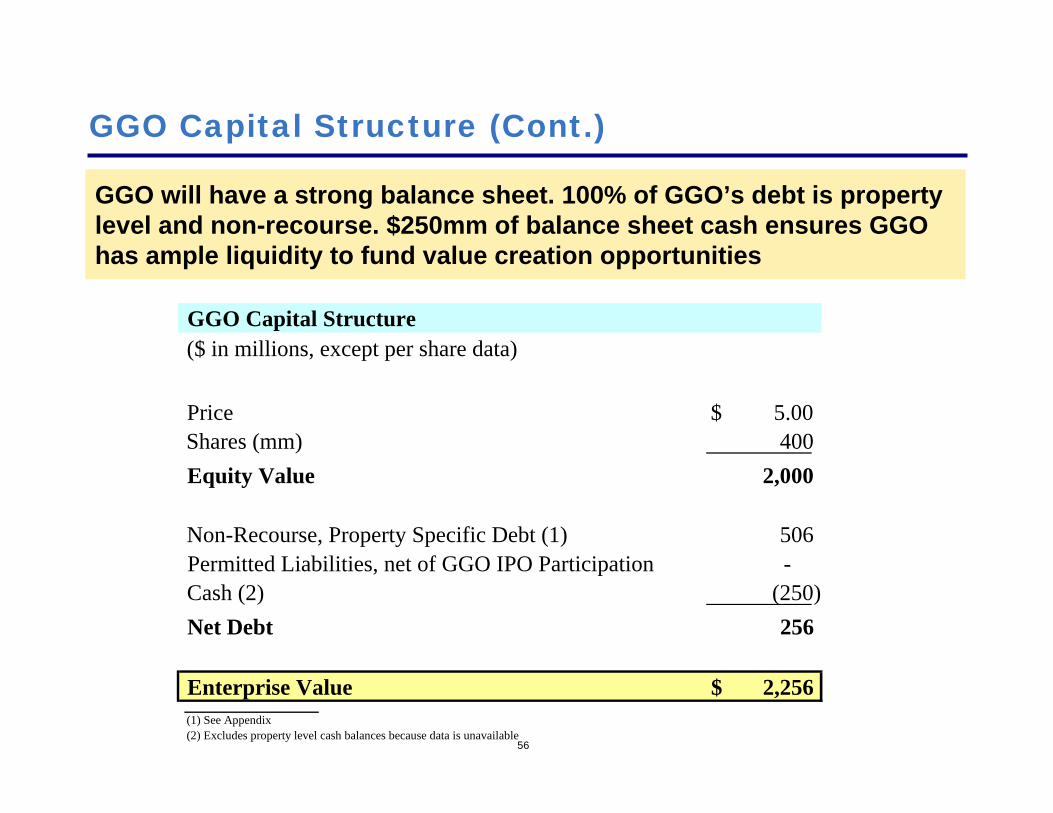
56
GGO Capital Structure (Cont.)
GGO will have a strong balance sheet. 100% of GGO’s debt is property level and non-recourse. $250mm of balance sheet cash ensures GGO has ample liquidity to fund value creation opportunities
(1) See Appendix(2) Excludes property level cash balances because data is unavailable
GGO Capital Structure($ in millions, except per share data)
Price 5.00$ Shares (mm) 400Equity Value 2,000
Non-Recourse, Property Specific Debt (1) 506Permitted Liabilities, net of GGO IPO Participation -Cash (2) (250)Net Debt 256
Enterprise Value 2,256$

57
MPC Portfolio
MPC Portfolio
Bridgeland Summerlin WoodlandsMaryland, MPCs
■ 11,400 acres outside of Houston, TX
■ Collection of properties between DC and Baltimore
■ 22,500 acre community west of Las Vegas
■ Successful JV MPC near Houston, TX

58
Development Asset: Victoria Ward
GGP recently received zoning approval to transform 60 acres of land in the heart of Honolulu into a vibrant and diverse neighborhood of residences, shops, entertainment and offices
The plan clears a path for GGP to bring to the oceanfront neighborhood as many as:
4,300 residential units, many of them in towers aligned to preserve mountain and ocean views
5 million square feet of retail shopping, restaurants and entertainment
4 million square feet of offices and other commercial space
700,000 square feet of industrial uses
14 acres of open space, parks and public facilities

59
Development Asset: Victoria Ward (Cont’d)
1.43 acres of land sold for $26mm ($18mm / acre) here in June-07 (1)
________________________________________________(1) See appendix for details.

60
Development Asset: South St. Seaport
Before the market turned, GGP was exploring a billion dollar redevelopment of South St. Seaport
Highlights of the development include:
400,000 square feet of retail space
A 286 room hotel and a smaller 163 room boutique
103 residential units
Nearly 5 acres of open space

61
Development Asset: South St. Seaport (Cont’d)

62
Non-Income Producing Asset: Fashion Show Air Rights
GGO owns the air rights above the Fashion Show Mall in Las Vegas
¹Source: "Vegas Land Values Soaring Sky High", Glenn Haussman, Hotel Interactive, 5/25/2007
This 48 acre, three-story property is located across from the Wynn and Encore, the most lucrative part of the Las Vegas Strip
In 2007, nearby North Vegas Strip land sold for $34mm/acre¹
Fashion Show’s location is within walking distance of 75% of the city’s more than 150,000 hotel rooms
Located adjacent to Fashion Show is The Venetian, The Palazzo, and Sands Expo Center – the largest hotel convention complex in the world
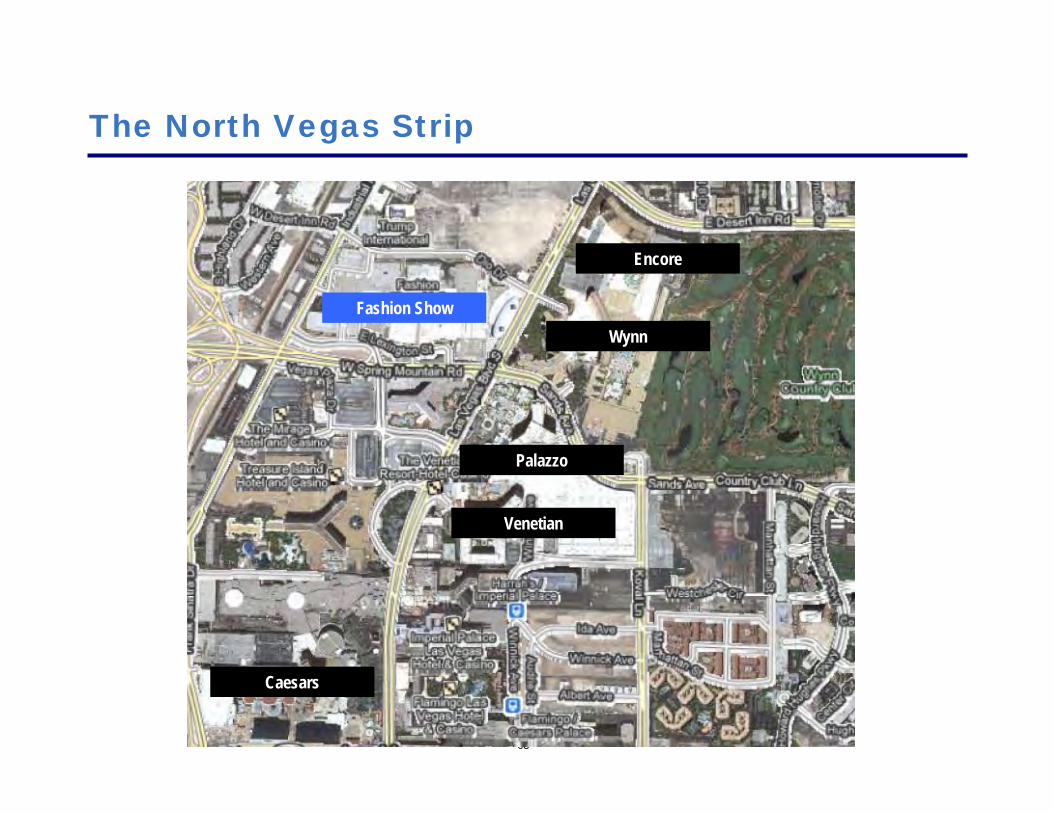
63
The North Vegas Strip
Fashion ShowWynn
Encore
Venetian
Palazzo
Caesars

Conclusion
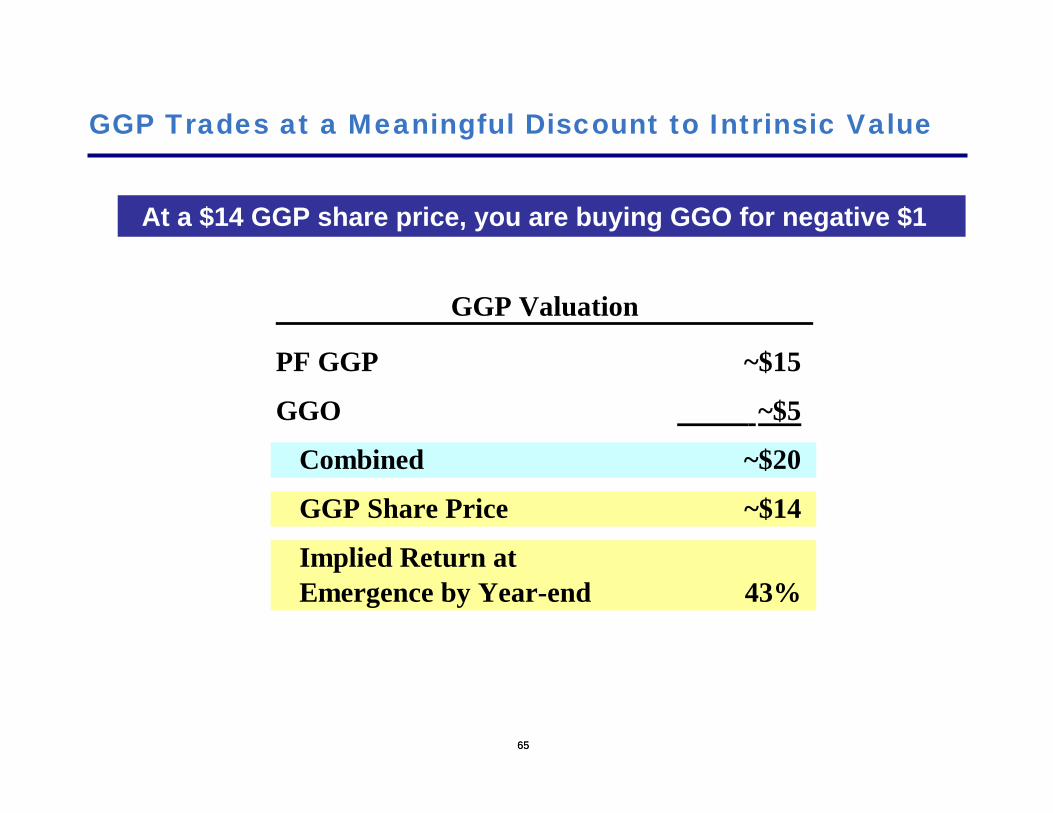
6565
GGP Trades at a Meaningful Discount to Intrinsic Value
At a $14 GGP share price, you are buying GGO for negative $1
GGP Valuation
PF GGP ~$15
GGO ~$5
Combined ~$20
GGP Share Price ~$14
Implied Return atEmergence by Year-end 43%

Over the years, people have accused me of talking my book.
For my best investment idea…

6767
Buy Christine Richard’s Book, and Tell Your Friends

6868
And one more thing…
We have accumulated ~150mm shares of Citigroup during the past several weeks…

Appendix

7070
SCPs / Highland Mall
(1) Source: Exhibit C, docket #3660.Source for debt balance / interest rate / duration: 5/12/10 8-K.
(2) Source for malls: Q1 10-Q pg. 21-22. Data presented pro rata (i.e. if GGP owns 50%, 50% of the GLA is shown).Source for debt balance / interest rate / duration: Q3'08 supplement.Source for subtotal debt balance (as of 3/31/10): Q1 10-Q, pg 22.
(3) On 5/3/10 the property owned by the Highland JV was transferred to the lender (Source: 10-Q pg 40).Source for debt detail: Simon Q1'10 supplement.Source for occupancy: Simon 10-K.Source for duration: Q3'08 operating supplement.
(4) Source: Pershing Square estimates.Note: Occupancy costs are higher at underperforming malls because sales are low but rents are locked in.
(5) Mall and freestanding gross leasable area (excludes anchor space).
(units in millions, except per unit data) Balance Sheet Data Operating Metrics (4)Interest Duration Sales Occup
GLA (5) Debt Rate (yrs) PSF Occup CostConsolidated Properties (1)Eagle Ridge Mall 0.2 $47 5.41% 5.5Oviedo Marketplace 0.3 51 5.12% 3.8Grand Traverse Mall 0.3 84 5.02% 3.8Country Hills Plaza 0.1 13 6.04% 6.2Moreno Valley Mall 0.3 86 5.96% 3.8Lakeview Square 0.3 41 5.81% 5.9Northgate Mall 0.3 44 5.88% 6.4Bay City Mall 0.2 24 5.30% 3.8Mall St. Vincent 0.2 49 6.30% 4.3Southland Center 0.3 107 4.97% 3.8Chapel Hills Mall 0.4 114 5.04% 3.8Chico Mall 0.2 56 4.74% 3.8Piedmont Mall 0.2 33 5.98% 6.4
Subtotal 3.3 $750 5.38% 4.3
Unconsolidated Properties (2)Silver City 0.2 66 4.95% 1.2Montclair 0.3 134 5.88% 1.5
Subtotal 0.5 $198 5.57% 1.4
SCPs 3.7 $948 5.42% 3.7
Highland Mall (3) 0.2 32 6.83% 1.3 51.1%
SCPs / Highland 3.9 $980 5.47% 3.6 $250 82.5% 18.0%

7171
GGP Debt Detail – GGO
Note: Most recent debt balance reported assumed to be 3/31/10 balance.True balance is actually less as amortization has occurred since mostrecent reported debt balance.
Note: All GGO debt sits at the property-level and is non-recourse.Note: Excludes debt which may arise to the extent there is a GGO Promissory Note.
We believe the amount of this note will be $0.
Debt($ in 000s) Debt BalanceGGO Debt Balance as of: SourceVictoria Ward Cmbd $213,889 3/31/10 5/12/10 8-K110 N. Wacker 45,943 9/30/08 Q3'08 suppBridgelands MPC 29,812 12/31/09 10-KWoodlands MPC 216,343 9/30/08 Q3'08 supp
GGO Debt $505,987
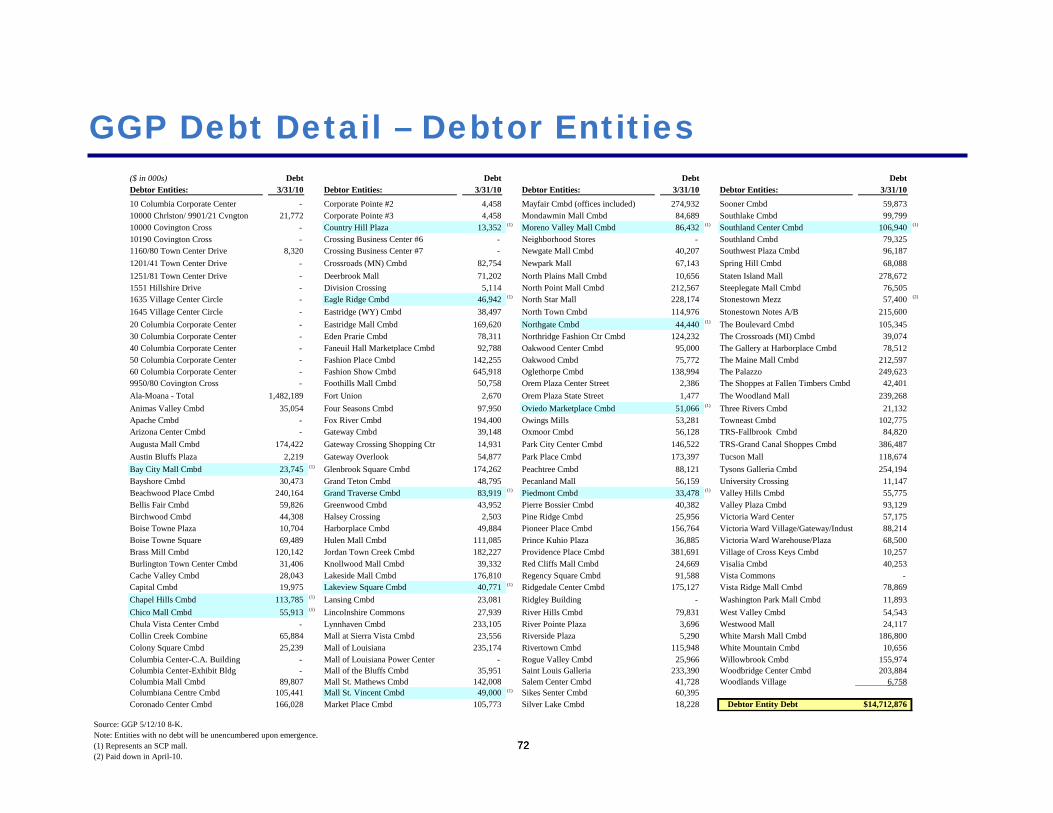
7272
GGP Debt Detail – Debtor Entities
Source: GGP 5/12/10 8-K.Note: Entities with no debt will be unencumbered upon emergence.(1) Represents an SCP mall.(2) Paid down in April-10.
($ in 000s) Debt Debt Debt DebtDebtor Entities: 3/31/10 Debtor Entities: 3/31/10 Debtor Entities: 3/31/10 Debtor Entities: 3/31/1010 Columbia Corporate Center - Corporate Pointe #2 4,458 Mayfair Cmbd (offices included) 274,932 Sooner Cmbd 59,87310000 Chrlston/ 9901/21 Cvngton 21,772 Corporate Pointe #3 4,458 Mondawmin Mall Cmbd 84,689 Southlake Cmbd 99,79910000 Covington Cross - Country Hill Plaza 13,352 (1) Moreno Valley Mall Cmbd 86,432 (1) Southland Center Cmbd 106,940 (1)
10190 Covington Cross - Crossing Business Center #6 - Neighborhood Stores - Southland Cmbd 79,3251160/80 Town Center Drive 8,320 Crossing Business Center #7 - Newgate Mall Cmbd 40,207 Southwest Plaza Cmbd 96,1871201/41 Town Center Drive - Crossroads (MN) Cmbd 82,754 Newpark Mall 67,143 Spring Hill Cmbd 68,0881251/81 Town Center Drive - Deerbrook Mall 71,202 North Plains Mall Cmbd 10,656 Staten Island Mall 278,6721551 Hillshire Drive - Division Crossing 5,114 North Point Mall Cmbd 212,567 Steeplegate Mall Cmbd 76,5051635 Village Center Circle - Eagle Ridge Cmbd 46,942 (1) North Star Mall 228,174 Stonestown Mezz 57,400 (2)
1645 Village Center Circle - Eastridge (WY) Cmbd 38,497 North Town Cmbd 114,976 Stonestown Notes A/B 215,60020 Columbia Corporate Center - Eastridge Mall Cmbd 169,620 Northgate Cmbd 44,440 (1) The Boulevard Cmbd 105,34530 Columbia Corporate Center - Eden Prarie Cmbd 78,311 Northridge Fashion Ctr Cmbd 124,232 The Crossroads (MI) Cmbd 39,07440 Columbia Corporate Center - Faneuil Hall Marketplace Cmbd 92,788 Oakwood Center Cmbd 95,000 The Gallery at Harborplace Cmbd 78,51250 Columbia Corporate Center - Fashion Place Cmbd 142,255 Oakwood Cmbd 75,772 The Maine Mall Cmbd 212,59760 Columbia Corporate Center - Fashion Show Cmbd 645,918 Oglethorpe Cmbd 138,994 The Palazzo 249,6239950/80 Covington Cross - Foothills Mall Cmbd 50,758 Orem Plaza Center Street 2,386 The Shoppes at Fallen Timbers Cmbd 42,401Ala-Moana - Total 1,482,189 Fort Union 2,670 Orem Plaza State Street 1,477 The Woodland Mall 239,268Animas Valley Cmbd 35,054 Four Seasons Cmbd 97,950 Oviedo Marketplace Cmbd 51,066 (1) Three Rivers Cmbd 21,132Apache Cmbd - Fox River Cmbd 194,400 Owings Mills 53,281 Towneast Cmbd 102,775Arizona Center Cmbd - Gateway Cmbd 39,148 Oxmoor Cmbd 56,128 TRS-Fallbrook Cmbd 84,820Augusta Mall Cmbd 174,422 Gateway Crossing Shopping Ctr 14,931 Park City Center Cmbd 146,522 TRS-Grand Canal Shoppes Cmbd 386,487Austin Bluffs Plaza 2,219 Gateway Overlook 54,877 Park Place Cmbd 173,397 Tucson Mall 118,674Bay City Mall Cmbd 23,745 (1) Glenbrook Square Cmbd 174,262 Peachtree Cmbd 88,121 Tysons Galleria Cmbd 254,194Bayshore Cmbd 30,473 Grand Teton Cmbd 48,795 Pecanland Mall 56,159 University Crossing 11,147Beachwood Place Cmbd 240,164 Grand Traverse Cmbd 83,919 (1) Piedmont Cmbd 33,478 (1) Valley Hills Cmbd 55,775Bellis Fair Cmbd 59,826 Greenwood Cmbd 43,952 Pierre Bossier Cmbd 40,382 Valley Plaza Cmbd 93,129Birchwood Cmbd 44,308 Halsey Crossing 2,503 Pine Ridge Cmbd 25,956 Victoria Ward Center 57,175Boise Towne Plaza 10,704 Harborplace Cmbd 49,884 Pioneer Place Cmbd 156,764 Victoria Ward Village/Gateway/Indust 88,214Boise Towne Square 69,489 Hulen Mall Cmbd 111,085 Prince Kuhio Plaza 36,885 Victoria Ward Warehouse/Plaza 68,500Brass Mill Cmbd 120,142 Jordan Town Creek Cmbd 182,227 Providence Place Cmbd 381,691 Village of Cross Keys Cmbd 10,257Burlington Town Center Cmbd 31,406 Knollwood Mall Cmbd 39,332 Red Cliffs Mall Cmbd 24,669 Visalia Cmbd 40,253Cache Valley Cmbd 28,043 Lakeside Mall Cmbd 176,810 Regency Square Cmbd 91,588 Vista Commons - Capital Cmbd 19,975 Lakeview Square Cmbd 40,771 (1) Ridgedale Center Cmbd 175,127 Vista Ridge Mall Cmbd 78,869Chapel Hills Cmbd 113,785 (1) Lansing Cmbd 23,081 Ridgley Building - Washington Park Mall Cmbd 11,893Chico Mall Cmbd 55,913 (1) Lincolnshire Commons 27,939 River Hills Cmbd 79,831 West Valley Cmbd 54,543Chula Vista Center Cmbd - Lynnhaven Cmbd 233,105 River Pointe Plaza 3,696 Westwood Mall 24,117Collin Creek Combine 65,884 Mall at Sierra Vista Cmbd 23,556 Riverside Plaza 5,290 White Marsh Mall Cmbd 186,800Colony Square Cmbd 25,239 Mall of Louisiana 235,174 Rivertown Cmbd 115,948 White Mountain Cmbd 10,656Columbia Center-C.A. Building - Mall of Louisiana Power Center - Rogue Valley Cmbd 25,966 Willowbrook Cmbd 155,974Columbia Center-Exhibit Bldg - Mall of the Bluffs Cmbd 35,951 Saint Louis Galleria 233,390 Woodbridge Center Cmbd 203,884Columbia Mall Cmbd 89,807 Mall St. Mathews Cmbd 142,008 Salem Center Cmbd 41,728 Woodlands Village 6,758 Columbiana Centre Cmbd 105,441 Mall St. Vincent Cmbd 49,000 (1) Sikes Senter Cmbd 60,395Coronado Center Cmbd 166,028 Market Place Cmbd 105,773 Silver Lake Cmbd 18,228 Debtor Entity Debt $14,712,876
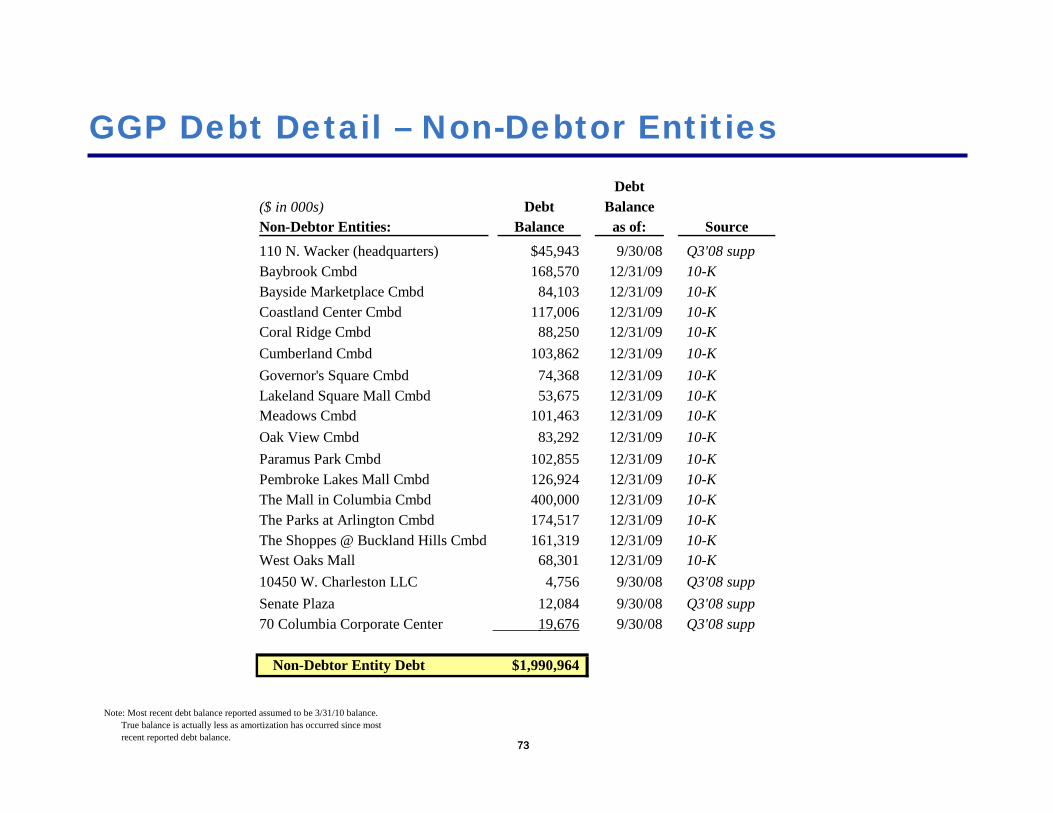
7373
GGP Debt Detail – Non-Debtor Entities
Note: Most recent debt balance reported assumed to be 3/31/10 balance.True balance is actually less as amortization has occurred since mostrecent reported debt balance.
Debt($ in 000s) Debt BalanceNon-Debtor Entities: Balance as of: Source110 N. Wacker (headquarters) $45,943 9/30/08 Q3'08 suppBaybrook Cmbd 168,570 12/31/09 10-KBayside Marketplace Cmbd 84,103 12/31/09 10-KCoastland Center Cmbd 117,006 12/31/09 10-KCoral Ridge Cmbd 88,250 12/31/09 10-KCumberland Cmbd 103,862 12/31/09 10-KGovernor's Square Cmbd 74,368 12/31/09 10-KLakeland Square Mall Cmbd 53,675 12/31/09 10-KMeadows Cmbd 101,463 12/31/09 10-KOak View Cmbd 83,292 12/31/09 10-KParamus Park Cmbd 102,855 12/31/09 10-KPembroke Lakes Mall Cmbd 126,924 12/31/09 10-KThe Mall in Columbia Cmbd 400,000 12/31/09 10-KThe Parks at Arlington Cmbd 174,517 12/31/09 10-KThe Shoppes @ Buckland Hills Cmbd 161,319 12/31/09 10-KWest Oaks Mall 68,301 12/31/09 10-K10450 W. Charleston LLC 4,756 9/30/08 Q3'08 suppSenate Plaza 12,084 9/30/08 Q3'08 supp70 Columbia Corporate Center 19,676 9/30/08 Q3'08 supp
Non-Debtor Entity Debt $1,990,964
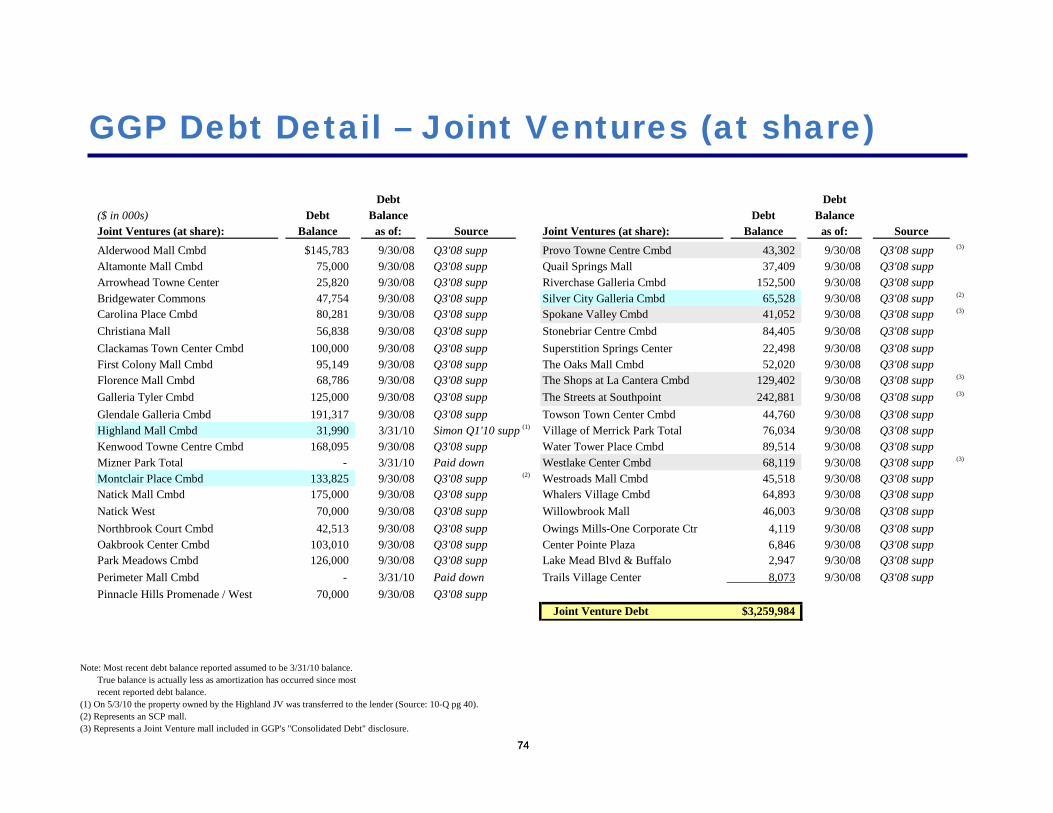
7474
GGP Debt Detail – Joint Ventures (at share)
Note: Most recent debt balance reported assumed to be 3/31/10 balance.True balance is actually less as amortization has occurred since mostrecent reported debt balance.
(1) On 5/3/10 the property owned by the Highland JV was transferred to the lender (Source: 10-Q pg 40).(2) Represents an SCP mall.(3) Represents a Joint Venture mall included in GGP's "Consolidated Debt" disclosure.
Debt Debt($ in 000s) Debt Balance Debt BalanceJoint Ventures (at share): Balance as of: Source Joint Ventures (at share): Balance as of: SourceAlderwood Mall Cmbd $145,783 9/30/08 Q3'08 supp Provo Towne Centre Cmbd 43,302 9/30/08 Q3'08 supp (3)
Altamonte Mall Cmbd 75,000 9/30/08 Q3'08 supp Quail Springs Mall 37,409 9/30/08 Q3'08 suppArrowhead Towne Center 25,820 9/30/08 Q3'08 supp Riverchase Galleria Cmbd 152,500 9/30/08 Q3'08 suppBridgewater Commons 47,754 9/30/08 Q3'08 supp Silver City Galleria Cmbd 65,528 9/30/08 Q3'08 supp (2)
Carolina Place Cmbd 80,281 9/30/08 Q3'08 supp Spokane Valley Cmbd 41,052 9/30/08 Q3'08 supp (3)
Christiana Mall 56,838 9/30/08 Q3'08 supp Stonebriar Centre Cmbd 84,405 9/30/08 Q3'08 suppClackamas Town Center Cmbd 100,000 9/30/08 Q3'08 supp Superstition Springs Center 22,498 9/30/08 Q3'08 suppFirst Colony Mall Cmbd 95,149 9/30/08 Q3'08 supp The Oaks Mall Cmbd 52,020 9/30/08 Q3'08 suppFlorence Mall Cmbd 68,786 9/30/08 Q3'08 supp The Shops at La Cantera Cmbd 129,402 9/30/08 Q3'08 supp (3)
Galleria Tyler Cmbd 125,000 9/30/08 Q3'08 supp The Streets at Southpoint 242,881 9/30/08 Q3'08 supp (3)
Glendale Galleria Cmbd 191,317 9/30/08 Q3'08 supp Towson Town Center Cmbd 44,760 9/30/08 Q3'08 suppHighland Mall Cmbd 31,990 3/31/10 Simon Q1'10 supp (1) Village of Merrick Park Total 76,034 9/30/08 Q3'08 suppKenwood Towne Centre Cmbd 168,095 9/30/08 Q3'08 supp Water Tower Place Cmbd 89,514 9/30/08 Q3'08 suppMizner Park Total - 3/31/10 Paid down Westlake Center Cmbd 68,119 9/30/08 Q3'08 supp (3)
Montclair Place Cmbd 133,825 9/30/08 Q3'08 supp (2) Westroads Mall Cmbd 45,518 9/30/08 Q3'08 suppNatick Mall Cmbd 175,000 9/30/08 Q3'08 supp Whalers Village Cmbd 64,893 9/30/08 Q3'08 suppNatick West 70,000 9/30/08 Q3'08 supp Willowbrook Mall 46,003 9/30/08 Q3'08 suppNorthbrook Court Cmbd 42,513 9/30/08 Q3'08 supp Owings Mills-One Corporate Ctr 4,119 9/30/08 Q3'08 suppOakbrook Center Cmbd 103,010 9/30/08 Q3'08 supp Center Pointe Plaza 6,846 9/30/08 Q3'08 suppPark Meadows Cmbd 126,000 9/30/08 Q3'08 supp Lake Mead Blvd & Buffalo 2,947 9/30/08 Q3'08 suppPerimeter Mall Cmbd - 3/31/10 Paid down Trails Village Center 8,073 9/30/08 Q3'08 suppPinnacle Hills Promenade / West 70,000 9/30/08 Q3'08 supp
Joint Venture Debt $3,259,984

7575
GGP Debt Detail – Other Debt
Note: Most recent debt balance reported assumed to be 3/31/10 balance.True balance is actually less as amortization has occurred since mostrecent reported debt balance.
Debt($ in 000s) Debt BalanceOther Debt Balance as of: SourceBridgelands MPC $29,812 12/31/09 10-KWoodlands MPC 216,343 9/30/08 Q3'08 suppHomart I 245,115 3/31/10 5/12/10 8-KIvanhoe Capital 93,713 3/31/10 5/12/10 8-KTurkey 57,221 9/30/08 Q3'08 suppDIP 400,000 3/31/10 5/12/10 8-K
Unsecured Debt:Exchangeable debt 1,550,000 3/31/10 5/12/10 8-KRouse debt 2,245,000 3/31/10 5/12/10 8-KRevolver 590,000 3/31/10 5/12/10 8-KSenior term loan 1,987,500 3/31/10 5/12/10 8-K
TopCo Unsecured Debt 6,372,500
TRUPS 206,200 3/31/10 5/12/10 8-K
Other Debt $7,620,904

7676
GGP Debt Detail – 3/31/10 Reconciliation
Note: Excludes mark-to-market debt discounts which would make the reported debt balance lower.Excludes GGP's share of Brazil debt ($95.2mm as of 3/31/10). GGP has no obligations for furthercontributions to its Brazilian subsidiary, Aliansce.
(1) Represents amortization that has occurred since the most recent reported date of GGP's debt.For example, much of GGP's JV debt, reported as of 9/30/08, amortizes each month.Data for which specific debt has been amortized, and in what amounts, is unavailable.
(2) Source: GGP Q1'10 operating supplement, pg 2.
($ in 000s) DebtTotal GGP Debt Balance
Debtor entity debt $14,712,876Non-Debtor entity debt 1,990,964Joint Venture debt 3,259,984Other debt 7,620,904
Subtotal 27,584,728
Less: Amortization (1) (78,406)
Total GGP Debt (3/31/10) (2) $27,506,322

7777
PF GGP Debt Detail
(1) Source: Q1'10 supplement pg 2. See appendix for details.(2) As of 9/30/09, the last time GGP published its interest coverage ratio in its operating supplement.(3) See appendix for details.(4) Paid down Apr-10.(5) On 5/3/10 the property owned by the Highland JV was transferred to the lender (Source: 10-Q pg 40).(6) Assumed to be paid down as part of PF GGP's emergence.(7) Assumed to be issued as part of PF GGP's emergence.
PF GGP Debt Buildup ($ in mms)
Total GGP Debt (3/31/10) (1) $27,506Interest coverage ratio (2) 1.2x
Less: SCPs debt (3) (948)Less: GGO debt (3) (506)Less: Stonestown mezz (4) (57) Less: Highland (5) (32) Less: TopCo unsecured debt (6) (6,373) Less: DIP (6) (400) Plus: New Debt (7) 1,500
PF GGP Debt (3/31/10) $20,691
Less: Additional amortization through 9/30/10e (3) (212) PF GGP Debt (9/30/10e) $20,478Interest coverage ratio (3) 2.0x

7878
PF GGP Debt Detail – Interest / Duration / Non-Recourse
($ in millions) Cash Duration Non- Pct Non-PF GGP Debt Detail Amt Interest (Years) Recourse Recourse
Debtor entities (1) $14,618 5.07% 6.3 $11,718 80.2%Plus: Oakwood (2) 95 2.75% 4.2 - - Less: Consolidated SCPs (3) (750) 5.38% 4.3 (710) 94.7%Less: Victoria Ward (4) (214) 5.24% 4.9 (214) 100.0%Less: Stonestown mezz (5) (57) 5.79% 3.8 (57) 100.0%
PF GGP Confirmed Debtors 13,692 5.03% 6.4 10,737 78.4%
Non-debtor consolidated debt (6) 2,530 5.68% 3.1 2,530 100.0%Less: 110 N Wacker (4) (46) 5.14% 0.5 (46) 100.0%Less: Bridgeland (4) (30) 6.50% 14.8 (30) 100.0%
PF GGP Non-Debtors 2,455 5.68% 3.0 2,455 100.0%
JV Debt (excl Consolidated JVs) (7) 2,946 5.61% 2.1 2,946 100.0%Less: Woodlands (4) (216) 5.69% 3.5 (216) 100.0%Less: Highland (8) (32) 6.92% 1.3 (32) 100.0% Less: JV SCPs (Silver City / Montclair) (198) 5.57% 1.4 (198) 100.0%
PF GGP Pro Rata JV Debt 2,499 5.59% 2.0 2,499 100.0%
Homart / Ivanhoe (9) 339 5.89% 2.8 339 100.0%TRUPs (9) 206 1.70% 26.0 - - New Debt (10) 1,500 5.75% 3.0 - -
PF GGP Debt (3/31/10) $20,691 5.21% 5.3 $16,029 77.5%
PF GGP LTM Adj Cash NOI (11) $2,300Plus: LTM GGMI income (12) 80Plus: LTM interest income 7Less: Overhead (13) (260)
PF GGP LTM EBITDA $2,127
PF GGP Cash Interest 1,078 PF GGP Interest Coverage 2.0x
(1) Includes all Secured Assset Loans, excluding Oakwood, Homart and Ivanhoe. Source: 5/12/10 8-K.Cash interest / duration as provided in GGP's 4/29/10 press release.Amount that is non-recourse deducts $2.9bn. Source: Q1'10 10-Q pg 29.
(2) Interest rate assumed to be L+225. Source: docket #5225 and 5206.(3) Assumes $40mm is recourse to GGP.(4) This debt will be going to GGO.(5) Paid down Apr-10.(6) See Non-Debtor Consolidated Debt appendix page for details.(7) See JV Debt (excluding Consolidated JVs) appendix page for details.(8) On 5/3/10 the property owned by the Highland JV was transferred to the lender (Source: 10-Q pg 40).
Interest rate / duration assumptions from Q3'08 operating supplement.(9) Source: 5/12/10 8-K.(10) Assumes new debt issued at 5.75% cash interest with 3 year duration.
This debt will be issued at market rates. Note Simon issued 5-yr notes in Jan-10 yielding 4.25%.(11) See PF GGP Cash NOI slide for details.(12) LTM GGMI income as of 3/31/10. Source: operating supplements, see "Management fees and
other corporate revenues."(13) Source: 2009 Annual Letter to Shareholders. Note "over the coming months, [GGP] intend[s]
to introduce many other innovations to improve the efficiency and effectiveness of the Company."

7979
GGP Debt Detail – Non-Debtor Consolidated Debt
Source: Interest rates per the Q3'08 GGP operating supplement. Many of these interest rates, especially to theextent loans have been refinanced or are floating, may have changed since 9/30/08.
Source: Maturities per the Q3'08 operating supplement.(1) For loans with maturity dates preceding 3/31/10, we have assumed they were refinanced with 1/1/14 maturity dates
and with 5.75% interest rates. Source: Pershing Square assumption.(2) Source: Q3'08 operating supplement. Reported as "Houston Land Notes." The current interest rate is likely
lower to the extent this debt is floating. Maturity date assumption is the midpoint of 2017-2033.(3) Represents amortization that has occurred since the most recent reported date of GGP's debt.(4) Source: Q1'10 supplement pg. 29.(5) Source: 5/12/10 8-K.
($ in 000s) Debt DurationNon-Debtor Consolidated Debt Balance Interest Maturity (Yrs)110 N. Wacker (headquarters) 45,943 5.14% 10/11/10 0.5Baybrook Cmbd 168,570 5.75% 1/1/14 3.8 (1)
Bayside Marketplace Cmbd 84,103 6.00% 7/1/14 4.3Coastland Center Cmbd 117,006 5.75% 1/1/14 3.8Coral Ridge Cmbd 88,250 5.75% 1/1/14 3.8 (1)
Cumberland Cmbd 103,862 5.75% 1/1/14 3.8 (1)
Governor's Square Cmbd 74,368 5.75% 1/1/14 3.8 (1)
Lakeland Square Mall Cmbd 53,675 5.24% 10/1/13 3.5Meadows Cmbd 101,463 5.54% 8/1/13 3.3Oak View Cmbd 83,292 5.75% 1/1/14 3.8 (1)
Paramus Park Cmbd 102,855 4.97% 10/1/15 5.5Pembroke Lakes Mall Cmbd 126,924 5.06% 4/11/13 3.0The Mall in Columbia Cmbd 400,000 5.87% 10/1/12 2.5The Parks at Arlington Cmbd 174,517 5.75% 1/1/14 3.8 (1)
The Shoppes @ Buckland Hills Cmbd 161,319 5.01% 7/2/12 2.3West Oaks Mall 68,301 5.36% 8/1/13 3.310450 W. Charleston LLC 4,756 6.84% 12/31/18 8.8Senate Plaza 12,084 5.79% 7/1/13 3.370 Columbia Corporate Center 19,676 10.15% 10/1/10 0.5
Bridgelands MPC (2) 29,812 6.50% 1/1/25 14.8
Consolidated JV DebtProvo Towne Centre Cmbd 43,302 5.91% 4/5/12 2.0Spokane Valley Cmbd 41,052 5.91% 4/5/12 2.0The Shops at La Cantera Cmbd 129,402 5.29% 6/7/10 0.2The Streets at Southpoint 242,881 5.45% 4/6/12 2.0Westlake Center Cmbd 68,119 8.00% 2/1/11 0.8
Non-Debtor Consolidated Debt 2,545,532 5.68% 4/18/13 3.1
Less: Amortization (3) (15,163)
Non-Debtor Consolidated Debt (3/31/10) 2,530,369 5.68% 4/18/13 3.1
Memo: Alternative BuildupConsolidated Debt (3/31/10) (4) 24,560,733 Less: Total Debtor Debt (3/31/10) (5) (22,030,364)
Non-Debtor Consolidated Debt (3/31/10) 2,530,369

8080
GGP Debt Detail – Joint Venture Debt (excluding Consolidated JVs)
($ in 000s)Joint Venture Debt Debt Duration Joint Venture Debt Debt Duration(Excl Consolidated JVs) Balance Interest Maturity (Yrs) (Excl Consolidated JVs) Balance Interest Maturity (Yrs)Alderwood Mall Cmbd 145,783 5.03% 7/6/10 0.3 Quail Springs Mall 37,409 6.87% 6/5/15 5.2Altamonte Mall Cmbd 75,000 5.19% 2/1/13 2.8 Riverchase Galleria Cmbd 152,500 5.78% 10/3/11 1.5Arrowhead Towne Center 25,820 6.92% 10/3/11 1.5 Silver City Galleria Cmbd 65,528 4.95% 6/10/11 1.2 (2)
Bridgewater Commons 47,754 5.27% 1/2/13 2.8 Stonebriar Centre Cmbd 84,405 5.30% 12/11/12 2.7Carolina Place Cmbd (1) 80,281 4.60% 1/11/14 3.8 Superstition Springs Center 22,498 3.45% 9/9/11 1.4Christiana Mall 56,838 4.61% 8/2/10 0.3 The Oaks Mall Cmbd 52,020 5.87% 12/3/12 2.7Clackamas Town Center Cmbd 100,000 6.35% 10/5/12 2.5 Towson Town Center Cmbd 44,760 5.75% 1/1/14 3.8 (3)
First Colony Mall Cmbd 95,149 5.68% 10/3/11 1.5 Village of Merrick Park Total 76,034 5.94% 8/8/11 1.4Florence Mall Cmbd 68,786 5.04% 9/10/12 2.4 Water Tower Place Cmbd 89,514 5.04% 9/1/10 0.4Galleria Tyler Cmbd 125,000 5.46% 10/11/11 1.5 Westroads Mall Cmbd 45,518 5.83% 12/3/12 2.7Glendale Galleria Cmbd 191,317 5.01% 10/1/12 2.5 Whalers Village Cmbd 64,893 5.63% 11/8/10 0.6Highland Mall Cmbd 31,990 6.92% 7/8/11 1.3 (2) Willowbrook Mall 46,003 7.00% 4/1/11 1.0Kenwood Towne Centre Cmbd 168,095 5.58% 12/1/10 0.7 Owings Mills-One Corporate Ctr 4,119 8.50% 12/1/11 1.7Mizner Park Total - - - - Center Pointe Plaza 6,846 6.38% 1/2/17 6.8Montclair Place Cmbd 133,825 5.88% 9/12/11 1.5 (2) Lake Mead Blvd & Buffalo 2,947 7.30% 7/15/23 13.3Natick Mall Cmbd 175,000 5.74% 10/7/11 1.5 Trails Village Center 8,073 8.24% 7/10/23 13.3Natick West 70,000 5.82% 10/7/11 1.5 Woodlands MPC 216,343 5.69% 10/9/13 3.5 (3)
Northbrook Court Cmbd 42,513 7.17% 9/1/11 1.4 Turkey 57,221 6.72% 1/1/18 7.8 Oakbrook Center Cmbd 103,010 5.12% 10/1/12 2.5 Joint Venture Debt 3,008,792 5.61% 4/27/12 2.1Park Meadows Cmbd 126,000 6.00% 7/5/12 2.3Perimeter Mall Cmbd - - - - Less: Amortization (4) (63,203) Pinnacle Hills Promenade / West 70,000 5.84% 12/8/11 1.7
Joint Venture Debt (3/31/10) (5) 2,945,589 5.61% 4/27/12 2.1
Source: Interest rates per the Q3'08 GGP operating supplement. Many of these interest rates, especially to theextent loans have been refinanced or are floating, may have changed since 9/30/08.
Source: Maturities per the Q3'08 operating supplement.(1) GGP extended this loan at 4.5975% in Jan-10. Source: 1/25/10 press release.(2) Represents an SCP mall. On 5/3/10 the property owned by the Highland JV was transferred to the lender (Source: 10-Q pg 40).(3) For loans with maturity dates preceding 3/31/10, we have assumed they were refinanced with 1/1/14 maturity dates
and with 5.75% interest rates. Source: Pershing Square assumption.(4) Represents amortization that has occurred since the most recent reported date of GGP's debt.(5) Source: Q1'10 supplement pg. 29.

8181
PF GGP Debt Detail – 9/30/10e Reconciliation
Target Net Debt Reconciliation ($ in mms)
Target Net Debt (9/30/10e) (1) $22,971Plus: Proportionally Consolidated Unrestricted Cash (2) 500Less: Permitted Claims (3) (650)Less: Accrued interest (4) (625)Less: Bridgelands/Woodlands (5) (246)Less: Brazil (6) (110)Less: Pfd stock (7) (121)Less: SCP debt / Highland (5) (980)Less: Other GGO debt (5) (260)
PF GGP Debt (9/30/10e) $20,478
PF GGP Debt (3/31/10) (8) 20,691
Additional Amortization Through 9/30/10e ($212)
(1) Target Net Debt as of the original Cornerstone Investment Agreement. Target Net Debt is an estimate of GGP's net debt as of 9/30/10e.Target Net Debt includes PF GGP and GGO liabilities. In addition, Target Net Debt includes non-debt liabilities, such as accrued interest andPermitted Claims (i.e. the KEIP), among other things. Therefore, Target Net Debt includes the Company's estimate of bankruptcy "exit costs."Furthermore, Target Net Debt includes the following: $1.5bn of New Debt, debt associated with GGP's international subsidiaries, and preferred stock.Source: pg 75 of docket #4874.
(2) Source: Original Cornerstone Investment Agreement.(3) Represents Pershing Square's estimate of bankruptcy "exit costs," including the KEIP, transaction costs, etc.
Pershing Square estimates this $650mm estimate could be more than $200mm too high.(4) Includes accrued interest on unsecured debt, DIP loan, Homart/Ivanhoe, TRUPs, pfd stock, and secured debt. Pershing Square estimate.(5) As of 3/31/10. Projected 9/30/10e balances included in Target Net Debt may differ than 3/31/10 actual debt balances due to interim amortization.(6) Per the Cornerstone Investment Agreement. GGP's share of this debt as of 3/31/10 was $95.2mm. Source: Q1'10 supplement pg 2.(7) Source: Q1'10 supplement pg 2.(8) See appendix for details.

8282
PF GGP Cap Rate Detail – Excess Sources
($ in mms, except per share data) Illustrative PF GGP Equity Raise Price$10.00 $11.00 $12.00 $13.00 $14.00 $15.00 $16.00
Emergence SourcesNew Debt (1) $1,500 $1,500 $1,500 $1,500 $1,500 $1,500 $1,500BPF (pre-clawback) (2) 4,400 4,400 4,400 4,400 4,400 4,400 4,400Clawback (3) 1,900 1,938 1,976 2,014 2,052 2,090 2,128Liquidity Equity Issuances (4) 650 663 676 689 702 715 728
Emergence Sources 8,450 8,501 8,552 8,603 8,654 8,705 8,756
Emergence UsesTopCo unsecured debt (5) 6,373 6,373 6,373 6,373 6,373 6,373 6,373DIP loan (5) 400 400 400 400 400 400 400
Emergence Uses 6,773 6,773 6,773 6,773 6,773 6,773 6,773
Excess Sources $1,678 $1,729 $1,780 $1,831 $1,882 $1,933 $1,984
(1) New Debt is included as a source of funds because the corresponding liability is included in Target Net Debt.The estimated fee to raise the New Debt is also included as a Permitted Claim in the Target Net Debt amount.
(2) Represents PF GGP's sale of 440mm shares to BPF at $10 per share. (250mm to B, 190mm to PF).(3) Subject to the 80/20 GGO IPO Participation, PF GGP is entitled to keep 20% of excess proceeds raised above $10.
To the extent GGO's 80% IPO Participation exceeds permitted liabilities, PF GGP will be entitled to keep more cashthan presented above.
(4) Assumes GGP sells 65mm Liquidity Equity Issuances shares. GGP is entitled to keep 20% of excess proceedsraised above $10.
(5) TopCo unsecured debt, which includes GGP's convert, Rouse debt, term loan, and revolver, and the DIP loan are treated asuses of funds because they are excluded from Target Net Debt as part of the Reinstatement Adjustment Amount.
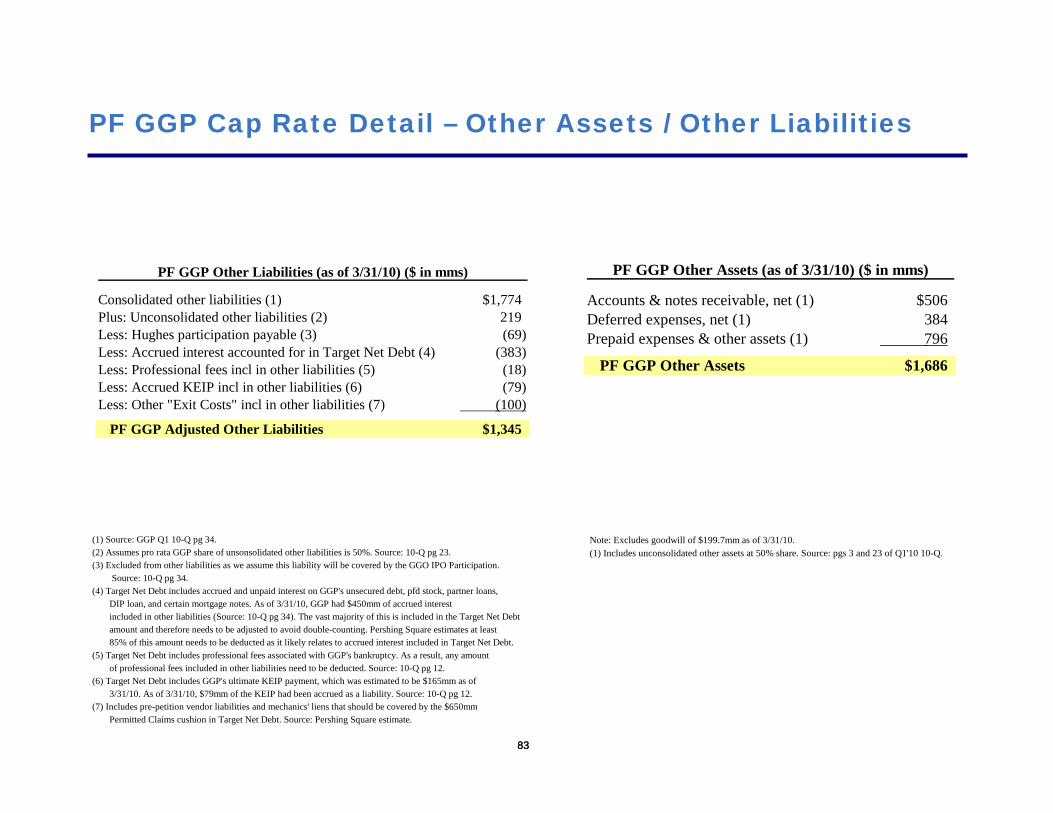
8383
PF GGP Cap Rate Detail – Other Assets / Other Liabilities
PF GGP Other Liabilities (as of 3/31/10) ($ in mms)
Consolidated other liabilities (1) $1,774Plus: Unconsolidated other liabilities (2) 219Less: Hughes participation payable (3) (69)Less: Accrued interest accounted for in Target Net Debt (4) (383)Less: Professional fees incl in other liabilities (5) (18)Less: Accrued KEIP incl in other liabilities (6) (79)Less: Other "Exit Costs" incl in other liabilities (7) (100)
PF GGP Adjusted Other Liabilities $1,345
PF GGP Other Assets (as of 3/31/10) ($ in mms)
Accounts & notes receivable, net (1) $506Deferred expenses, net (1) 384Prepaid expenses & other assets (1) 796
PF GGP Other Assets $1,686
Note: Excludes goodwill of $199.7mm as of 3/31/10.(1) Includes unconsolidated other assets at 50% share. Source: pgs 3 and 23 of Q1'10 10-Q.
(1) Source: GGP Q1 10-Q pg 34.(2) Assumes pro rata GGP share of unsonsolidated other liabilities is 50%. Source: 10-Q pg 23.(3) Excluded from other liabilities as we assume this liability will be covered by the GGO IPO Participation.
Source: 10-Q pg 34.(4) Target Net Debt includes accrued and unpaid interest on GGP's unsecured debt, pfd stock, partner loans,
DIP loan, and certain mortgage notes. As of 3/31/10, GGP had $450mm of accrued interestincluded in other liabilities (Source: 10-Q pg 34). The vast majority of this is included in the Target Net Debtamount and therefore needs to be adjusted to avoid double-counting. Pershing Square estimates at least85% of this amount needs to be deducted as it likely relates to accrued interest included in Target Net Debt.
(5) Target Net Debt includes professional fees associated with GGP's bankruptcy. As a result, any amountof professional fees included in other liabilities need to be deducted. Source: 10-Q pg 12.
(6) Target Net Debt includes GGP's ultimate KEIP payment, which was estimated to be $165mm as of3/31/10. As of 3/31/10, $79mm of the KEIP had been accrued as a liability. Source: 10-Q pg 12.
(7) Includes pre-petition vendor liabilities and mechanics' liens that should be covered by the $650mmPermitted Claims cushion in Target Net Debt. Source: Pershing Square estimate.

8484
GGP Detail – LTM Cash NOI
($ in millions) GGP Cash Net Operating Income (1)2Q09a 3Q09a 4Q09a 1Q10a LTM
Minimum rents $596 $584 $605 $593Tenant recoveries 263 257 248 254Overage rents 7 12 30 12Other 35 32 48 27
Total Property Revenues $901 $884 $931 $885
Less: Real estate taxes (81) (82) (81) (85)Less: Repairs & maintenance (58) (65) (82) (41)Less: Marketing (8) (9) (16) (9)Less: Other property operating costs (127) (136) (138) (157)Less: Provision for doubtful accounts (11) (7) (7) (8)
NOI $616 $585 $607 $586
Less: Straight-line rent adj. (13) (11) 1 (13)Less: FAS 141 adj. (lease mark to mkt) (4) (3) (2) (1)Plus: Non-cash ground rent expense 2 2 2 2Plus: Real estate tax stabilisation adj. 1 1 1 1
GGP Cash NOI $602 $573 $609 $575 $2,360
(1) Source: GGP operating supplements.

8585
Simon Cap Rate Detail – LTM Cash NOI
Source: Simon operating supplements.(1) Simon includes interest income in other revenue. This needs to be backed out to create an apples to apples
comparison with GGP.(2) Simon does not disclose the amount of interest income and gains on land sales from its unconsolidated
segment. Assumes the ratio of interest income and gains on land sales in other revenue is similar to theratio of consolidated other income to total share. For example, Q1'10 reported consolidated interest incomewas $7.714mm. Multiplying this by 1.302x results in assumed total share interest income of $10.047mm.
(3) Source: See Footnotes to Reconciliation of Consolidated Net Income to FFO in Simon's operating supplementsfor straight-line rent and FAS 141 adjustments.
($ in millions) 4Q08a 1Q09a 2Q09a 3Q09a 4Q09a 1Q10a LTMMinimum rent $807 $746 $754 $754 $806 $758Overage rent 63 21 26 33 58 26Tenant reimbursements 393 345 345 356 376 342Other income 92 68 56 57 92 80 Less: Interest income (1) (2) (15) (9) (9) (10) (13) (10) Less: Gains on land sales (2) (5) (0) (3) (0) (19) (2)
Total Revenue $1,334 $1,171 $1,168 $1,191 $1,300 $1,194
Less: Property operating costs (172) (161) (168) (180) (164) (157)Less: Real estate taxes (106) (112) (106) (99) (108) (114)Less: Repairs & maintenance (47) (33) (30) (29) (43) (34)Less: Advertising & promotion (42) (24) (25) (29) (39) (25)Less: Provision for credit losses (10) (17) (9) (0) (2) 3 Less: Other (41) (35) (40) (36) (44) (35)
NOI $916 $789 $791 $817 $901 $830
Less: Straight-line rent adj. (3) (9) (11) (7) (8) (6) (5) Less: FAS 141 adj. (lease mark to mkt) (3) (9) (7) (13) (6) (6) (5)
Cash NOI $899 $772 $770 $803 $889 $821 $3,284
Memo: Other incomeConsolidated portion 62 45 35 36 71 56 Total share 92 68 56 57 92 80 Ratio 32.2% 33.6% 37.7% 35.8% 22.9% 30.2%

8686
Simon Cap Rate Detail – Cap Rate Buildup
(1) Includes Series I preferred shares and options (Source: Simon Q1'10 operating supplement).(2) As reported in Simon's pro rata balance sheet (Source: Simon Q1'10 operating supplement).(3) Excludes $20mm of goodwill (Source: Simon 2009 10-K).(4) Simon's share of U.S. CIP (page 36 of Q1'10 operating supplement).(5) Applies 25% EBIT margin to LTM fee income of $122mm and a 7.5x EBIT multiple.(6) See Simon LTM Cash NOI appendix page for details.
(units in millions, except per share data)Share Price (as of 5/28/10) $85.03Shares & Units (1) 352
Market Cap $29,906
Pro Rata for JVs: (2)Plus: Total Debt 24,250 Plus: Preferred Debt 126 Plus: Other Liabilities 1,845 Less: Cash (3,609) Less: Other Assets (3) (2,445) Less: Development Pipeline (4) (35)
TEV $50,038
Less: Mgmt Business (5) (229) Value of Simon's REIT $49,809
LTM Cash NOI (6) $3,284Implied Cap Rate 6.6%

8787
Simon Occupancy Cost Detail
Occup. Cost Buildup Memo:GGP (1) Simon GGPQ4'07 Q4'09 Q4'09
Rent per sq ft $35.32 (2) $40.04 (5) NARecoverable common area costs per sq ft 9.58 13.58 NA
Rent & recoverable common area costs per sq ft $44.90 (3) $53.62 $47.09 (8)
Rent & recoverable common area costs PSF / rent PSF 1.27x 1.34x (6) NA
Reported Tenant Sales per Square Foot $444 (3) $433 (5) $393 (8)
Rent & recoverable common area costs / tenant sales 10.1% 12.4% 12.0%
Occupancy Cost 12.5% (3) 15.1% 14.6% (8)
Adjustment Factor (4) 1.24x 1.22x (7) 1.22x
Note: Unlike GGP, Simon does not disclose occupancy cost data. The exercise above uses historical reportedGGP data to attempt to back into Simon's implied Regional Malls occupancy cost. Actual data may vary.
(1) Represents Consolidated Portfolio (i.e. excl unconsolidated). This is done because GGP does not discloserent per sq ft metrics on a pro rata basis.
(2) GGP used to report rent per sq ft instead of rent & recoverable common area costs per sq foot before Q1'07.Represents GGP Q4'06 consolidated rent per sq ft of $34.29 with assumed 3% YoY growth (same as Q4'06 reported growth).Source: GGP Q4'06 operating supplement.
(3) Source: GGP Q4'07 operating supplement.(4) Represents the ratio of Occupancy Cost to rent & recoverable common area costs / tenant sales.(5) Source: Simon Q4'09 operating supplement.(6) Assumes Simon's ratio of rent and recoverable common area costs PSF / rent PSF is 1.34x based on GGP's
historical ratio of 1.27x. Simon derives approximately 5% more of its revenue from tenant reimbursements than GGP. (7) Based on GGP's adjustment factor as of Q4'09.(8) Source: GGP Q4'09 operating supplement.

8888
GGO Detail – Victoria Ward Comp

Wait to Rate:
How To Save The Rating Agencies
(and the Capital Markets)May 26, 2010
Pershing Square Capital Management, L.P.
1
Disclaimer
The analyses and conclusions of Pershing Square Capital Management, L.P. ("Pershing Square") contained in
this presentation are based on publicly available information. Pershing Square recognizes that there may be
confidential information in the possession of the companies discussed in the presentation that could lead
these companies to disagree with Pershing Square’s conclusions. This presentation and the information
contained herein is not a recommendation or solicitation to buy or sell any securities.
The analyses provided may include certain statements, estimates and projections prepared with respect to,
among other things, the historical and anticipated operating performance of the companies, access to capital
markets and the values of assets and liabilities. Such statements, estimates, and projections reflect various
assumptions by Pershing Square concerning anticipated results that are inherently subject to significant
economic, competitive, and other uncertainties and contingencies and have been included solely for
illustrative purposes. No representations, express or implied, are made as to the accuracy or completeness of
such statements, estimates or projections or with respect to any other materials herein. Actual results may
vary materially from the estimates and projected results contained herein.
Funds managed by Pershing Square and its affiliates have invested in long and short positions in various
securities and financial instruments. Pershing Square manages funds that are in the business of actively
trading – buying and selling – securities and financial instruments. Pershing Square may currently or in the
future change its position regarding any of the securities it owns. Pershing Square reserves the right to buy,
sell, cover or otherwise change the form of its investment in any company for any reason. Pershing Square
hereby disclaims any duty to provide any updates or changes to the analyses contained here including,
without limitation, the manner or type of any Pershing Square investment.

2
The Context
Where they have failedWhat they do well
■ Rating agencies overstated the
ratings of structured finance
securities and bond insurers
like MBI, ABK, FNM, FRE and
AIG
■ Rating agencies are generally
good at rating the debts of
corporate issuers
Various proposals have been floated to address the problem. As currently
proposed, we believe that none will succeed as comprehensive reform
Rating agencies were material contributors to the credit crisis as
their inaccurate ratings allowed for the issuance of trillions of
dollars of securities and derivatives which generated trillions of
dollars of losses globally
3
What Are the Principal Problems?
Problems are caused by corrupting incentives at the original
issuance of a security or derivative by an issuer
� Investors – Overly relied on ratings rather than their own due diligence and are often subject to ratings-based investment limitations
� Issuers/Banks – Are incentivized to get highest ratings with highest yielding (riskiest) assets
� NRSROs – Are conflicted by how they are paid; without high ratings, agencies do not earn fees on new issue transactions
� “Success Fee” model leads to competition and grade inflation among NRSROs for new issuers and new product ratings

4
What Are the Principal Problems? (Cont’d)
Regulators and investors with ratings-based mandates have been ill-
served by the NRSROs before and throughout the credit crisis
� Rating agencies have failed to meet expectations:
� Act as Underwriters – in substance, have acted as part of the underwriting team for new issues
� Are Slow to Downgrade – are incentivized to keep ratings stable so new issues can continue to be sold and rated
� Are Loath to Pass Judgment on Themselves – did initially forbear from downgrading financial guarantors (e.g., MBI, ABK, FNM, FRE, AIG), as simultaneous downgrades would be triggered on thousands of othersecurities, putting NRSROs in the uncomfortable position of questioning their own prior ratings

5
How Do You Solve These Problems?
Make a new law
“New Issue Ratings Moratorium. Prior to the date 60 days after the issuance of
a new fixed income security, it shall be unlawful for any NRSRO to:
(1) Have any contact with issuers, sponsors, servicers, trustees or underwriters of
such security during such period,
(2) Comment publicly on, or issue ratings regarding, any such security, or
(3) Otherwise participate in the structuring, underwriting, offering or sale of such
securities during such period.
Notwithstanding the foregoing, NRSROs shall at all times be permitted to:
(a) Conduct due diligence based solely on publicly available information of the
issuer or otherwise related to the security in respect of future ratings for such
issuer or security, and
(b) At all times broadly publish their ratings standards, procedures and
methodologies.”
Our suggested rider to the Restoring American Financial Stability Act of 2010
6
How Do You Solve These Problems? (Cont’d)
� Allow Non-NRSROs to Publish During New Issue Moratorium – Firms can (1) apply to be qualified as NRSROs and be subject to the new issue ratings moratorium or (2) choose to be non-NRSROs and compete for business from investors during the moratorium on the basis of the quality of their research
� Creates incentive for the development of an “Investor Pays” model for non-NRSRO rating agencies who will seek to fill the ratings void left by the New Issue Ratings Moratorium on NRSROs
� Insist on NRSRO Accountability – The SEC should be required to revoke a ratings agency’s NRSRO status if it consistently underperforms its peers
� While the SEC currently has the power to revoke NRSRO status, it has failed to exercise that power likely because of the lack of credible alternatives to NRSROs
� Bright line rules requiring the exercise of that power after material consistent underperformance could address the breakdown caused by the SEC’s past regulatory forbearance
Buyside analysts will develop into credible alternatives and even new NRSROs
7
How Do You Solve These Problems? (Cont’d)
Make a new lawRepealing NRSRO legal exemptions will mitigate undue reliance on ratings
� Re-Thinking Reg FD – The SEC should repeal the NRSRO exemption from fair disclosure rules that currently allow rating agencies access to issuers’ material non-public information
� Investors justified their over-reliance on ratings in large part on account of NRSRO information advantages. Repeal of the SEC’s Reg FD exemption would reduce reliance premised on information asymmetries
� Prospectus Delivery Requirements – Each issuer that seeks an NRSRO rating should be required to include in its bond offering prospectus all information that a reasonable investor would need to form an investment decision
� Any information that could reasonably be expected to impact ratings should be viewed – by definition – as material and therefore should be disclosed in prospectuses and in on-going public disclosures
� Improved disclosure requirements would improve the accuracy of fundamental analysis and level the playing field among market participants

8
What Are the Impacts of Our Proposed Changes?
Old Paradigm:
� Investors – overly relied on ratings and
performed inadequate due diligence
� Issuers/Banks – structured deals to
minimally achieve desired ratings
thresholds through negotiations with rating
agencies
� NRSROs – monopolized ratings, became
an essential participant in underwriting
process which was corrupted by the
success fee payment scheme
� Investor Pay Research – “Investor Pays”
ratings model is virtually nonexistent
New Paradigm:
� Investors – will need to do their own due
diligence and will benefit from truly
independent ratings/research
� Issuers/Banks – ratings opinion
uncertainty will force them to “under-
promise and over-deliver” creating
margins of safety above ratings targets
� NRSROs – will “call ‘em like they see
‘em” and will be completely removed from
the structuring and underwriting process
� Investor Pay Research – creates
opportunity for “Investor Pays” ratings
and research to develop as non-NRSRO
analysts will be permitted to publish pre-
offering and during the blackout period
9
How Should Ratings Agencies Be Compensated?
� New Fee Arrangements – Ratings fees should be “set aside” and paid over time by issuers to NRSROs and failure to pay fees would be deemed an “Event of Default” for issuers
�Base Fee – a minimum fee will be paid in quarterly increments over the life of the bond to those NRSROs that pre-commit to rate a new bond after the 60-day moratorium and to continue to update those ratings over the bond’s life
�Ranking Fee – a portion of the remaining set aside will be paid in annual increments based on investor-determined annual rankings of each NRSRO
�Performance Fee – the remaining set aside will be paid in annual increments to the NRSROs based on the performance of the bond relative to the ratings designated by each participating NRSRO

10
What Are the Impacts of Our Proposed Changes?
Old Paradigm:
� Investors – had no impact on NRSRO
compensation
� Issuers/Banks – had the ability to
manipulate the process through NRSRO
compensation to achieve desired ratings
� NRSROs – received full, upfront
payments which were unrelated to the
ratings performance for that issue
� Investor Pay Research – “Investor Pays”
ratings model is virtually nonexistent
New Paradigm:
� Investors – will help allocate ratings fees,
closer to an “Investor Pays” model
� Issuers/Banks – will have no ability to
set compensation or even choose which
NRSROs will rate a bond
� NRSROs – will be paid over time, with a
large percentage of compensation based
on performance; material consistent
underperformance assures loss of
NRSRO status
� Investor Pay Research – will create
market opportunity which will improve
independent research for buyside
investors

11
Conclusion
� The steps toward regaining confidence are deceptively simple:
� Exclude the NRSRO rating agencies from the initial offering and underwriting process
� Create incentives for fundamental research and valuation analysis by investors
� Create the market opportunity for “Investor Pays” research and ratings to develop
� Create a payment regime that focuses on NRSRO performance and the quality of their ratings over time and aligns their interest with investors
� Failure to address fundamental flaws in the legacy ratings system is not an option
The combination of increased buyside due diligence coupled with mitigation of conflicts of interest and a new payment scheme can restore the integrity of ratings
Not for Public Distribution
How To Make A Fortune*November 3, 2010
Pershing Square Capital Management, L.P.
* My compliance team cautions you that this is a tongue in cheek title
1
Not for Public Distribution
Disclaimer
The analyses and conclusions of Pershing Square Capital Management, L.P. ("Pershing Square") contained in this presentation are based on publicly available information.
The analyses provided may include certain statements, estimates and projections prepared with respect to, among other things, historical and anticipated performance of certain assets, and the values of assets and liabilities. Such statements, estimates, and projections reflect various assumptions by Pershing Square concerning anticipated results that are inherently subject to significant economic, competitive, and other uncertainties and contingencies and have been included solely for illustrative purposes. No representations, express or implied, are made as to the accuracy or completeness of such statements, estimates orprojections or with respect to any other materials herein.
This presentation and the information contained herein is not a recommendation or solicitation to buy or sell any securities.
Pershing Square hereby disclaims any duty to provide any updates or changes to the analyses contained in this presentation.
2
Not for Public Distribution
What We Look for in Our Investments
Low valuation
Forced Sellers
Attractive capital structure
Favorable long-term supply dynamics
Favorable long-term demand dynamics
Out-of-favor

3
Not for Public Distribution
We Believe We’ve Identified an Investment with:
A low valuationLowest valuation in at least a generation
Forced sellersA large number of distressed transactions
Extremely attractive financing availableHigh LTV, low-rate, fixed-rate, long-dated, non-recourse debt, pre-payable without penalty
Favorable long-term supply dynamicsShort-term oversupplied market, but long-term supply is controlled
Favorable long-term demand dynamicsDemographically driven demand growth
Out-of-favorCurrently, this is a somewhat shunned asset class

Not for Public Distribution
So… How Can You Make A Fortune?
5
Not for Public Distribution
The American Dream - On Sale

Not for Public Distribution
What Happened?

7
Not for Public Distribution
Freely Available
Credit
Relaxed lending standards
Financial “innovation”
CDO Demand
What Happened in the Credit Markets?
More Leverage /
More Buyers
Increasing Asset Values
Decreasing Defaults
Source: “Who’s Holding the Bag?,” PSCM, May 2007
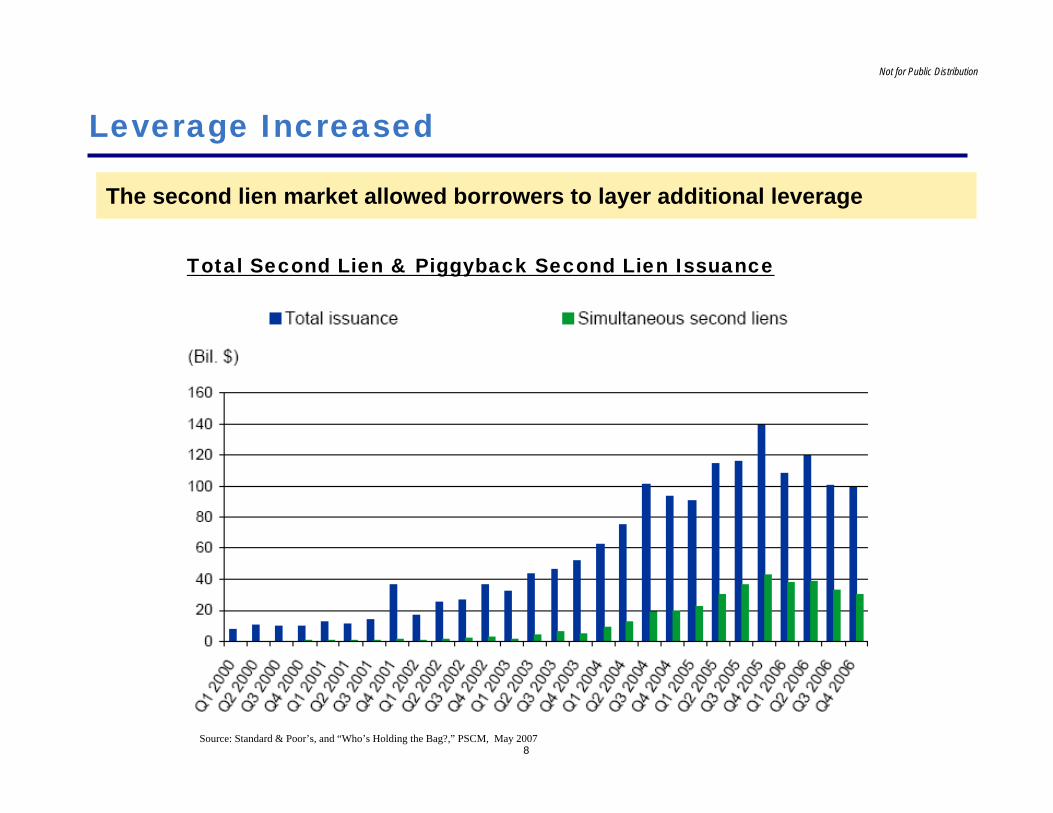
8
Not for Public Distribution
Leverage Increased
Source: Standard & Poor’s, and “Who’s Holding the Bag?,” PSCM, May 2007
The second lien market allowed borrowers to layer additional leverage
Total Second Lien & Piggyback Second Lien Issuance

9
Not for Public Distribution
Financial “Innovation”
The popularity of Interest Only and Negative Amortization loans grew rapidly
Source: Loan Performance, Credit Suisse
2%1%
4%6%
25%
29%
23%
0%
5%
10%
15%
20%
25%
30%
35%
2000 2001 2002 2003 2004 2005 2006
IO and Neg. Amortization Originations (% of dollar volume)

10
Not for Public Distribution
The ABS Market Provided Liquidity for Originators
Source: Thompson Financial, Deutsche Bank, “Who’s Holding the Bag?,” PSCM, May 2007
Sub-prime and Second-lien ABS Issuance Volume
Facilitated by Rating Agencies and Bond Insurers

11
Not for Public Distribution
Asset Values Went Up
Between January 2001 and June 2006 home prices rose at a 13% CAGR
50
70
90
110
130
150
170
190
210
230
250
Jan-87 Jan-89 Jan-91 Jan-93 Jan-95 Jan-97 Jan-99 Jan-01 Jan-03 Jan-05 Jan-07 Jan-09
Source: Case-Shiller Home Price Indices
Home Price Appreciation (Case-Shiller 10-City Index)
Not for Public Distribution
Valuation

13
Not for Public Distribution
50
70
90
110
130
150
170
190
210
230
250
Jan-87 Jan-89 Jan-91 Jan-93 Jan-95 Jan-97 Jan-99 Jan-01 Jan-03 Jan-05 Jan-07 Jan-09
Asset Values Have Declined Meaningfully
Home prices are down 28% nationwide
Home Price Appreciation (Case-Shiller 10-City Index)
Source: Case-Shiller Home Price Indices

14
Not for Public Distribution
109117
122127
134
117
134 130 133 137
125 126 127 128124 120
109 110
128
150
170178
60
80
100
120
140
160
180
200
1989
1990
1991
1992
1993
1994
1995
1996
1997
1998
1999
2000
2001
2002
2003
2004
2005
2006
2007
2008
2009
2010
Housing is More Affordable Today
Falling home prices and lower interest rates dramatically improved affordability¹. Median family income is now 78% higher than what is required to qualify for a loan to purchase the median price single family home using 80% loan-to-value, fixed-rate financing
Source: National Association of Realtors¹Affordability = Median Income/Qualifying Income
NAR National Housing Affordability Index – Fixed Rate Composite
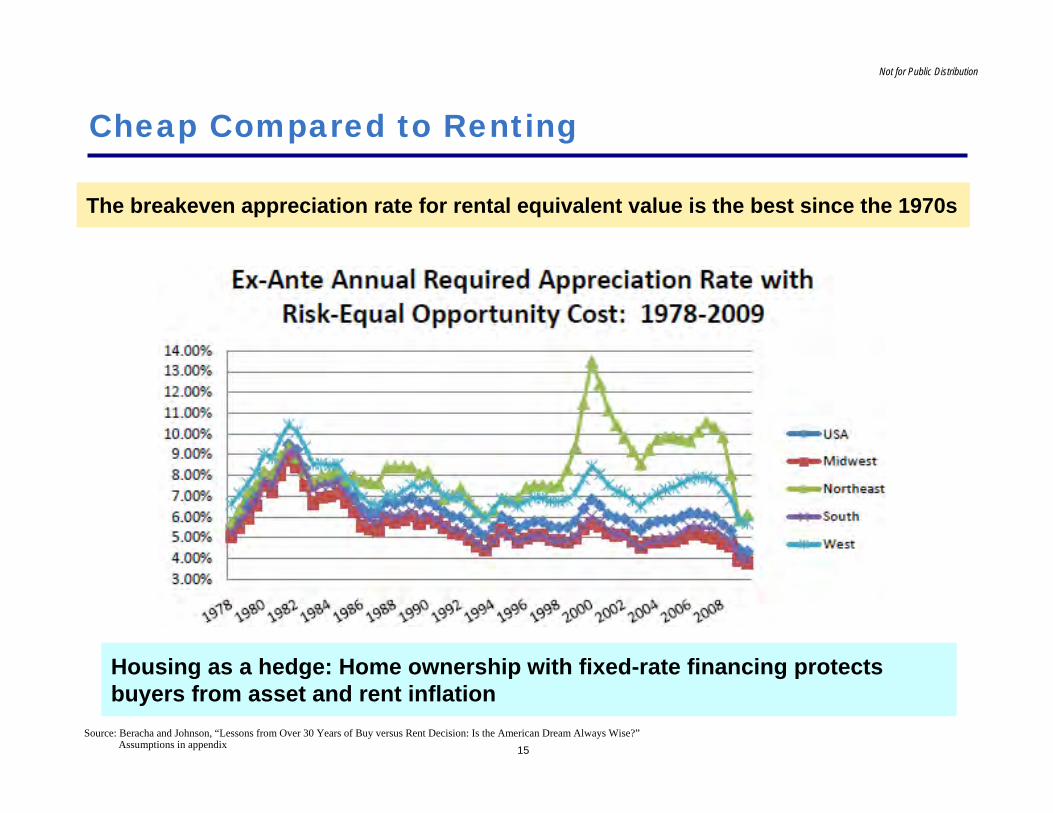
15
Not for Public Distribution
Cheap Compared to Renting
The breakeven appreciation rate for rental equivalent value is the best since the 1970s
Source: Beracha and Johnson, “Lessons from Over 30 Years of Buy versus Rent Decision: Is the American Dream Always Wise?”Assumptions in appendix
Housing as a hedge: Home ownership with fixed-rate financing protects buyers from asset and rent inflation

Not for Public Distribution
Forced Sellers

17
Not for Public Distribution
Foreclosures and Short Sales
Nationwide, ~30% of sellers are in or are approaching foreclosure
Distressed Sales (% of total re-sales)
Source: Deutsche Bank, “Whither the distressed inventory flood”
Long-term the foreclosure crisis is good for housing. Over-priced and over-leveraged homes will be transitioned to new, stable owners at more reasonable prices and on more favorable financing terms
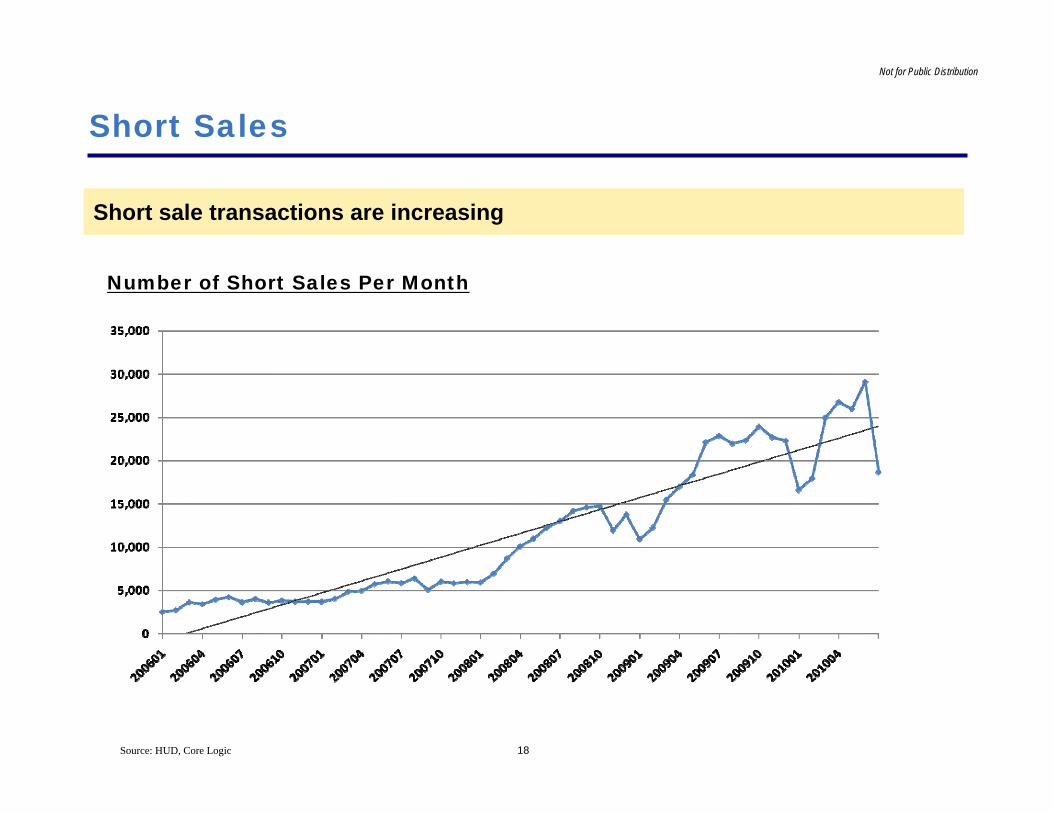
18
Not for Public Distribution
Short Sales
Short sale transactions are increasing
Number of Short Sales Per Month
Source: HUD, Core Logic
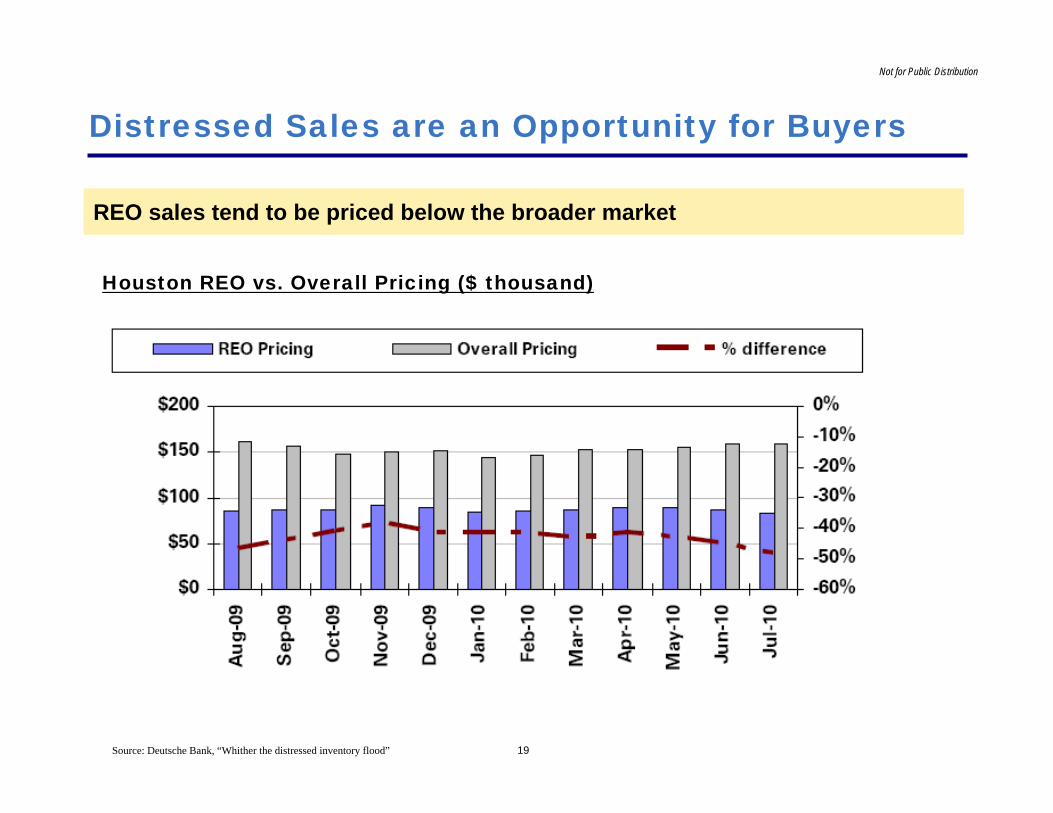
19
Not for Public Distribution
Distressed Sales are an Opportunity for Buyers
REO sales tend to be priced below the broader market
Houston REO vs. Overall Pricing ($ thousand)
Source: Deutsche Bank, “Whither the distressed inventory flood”
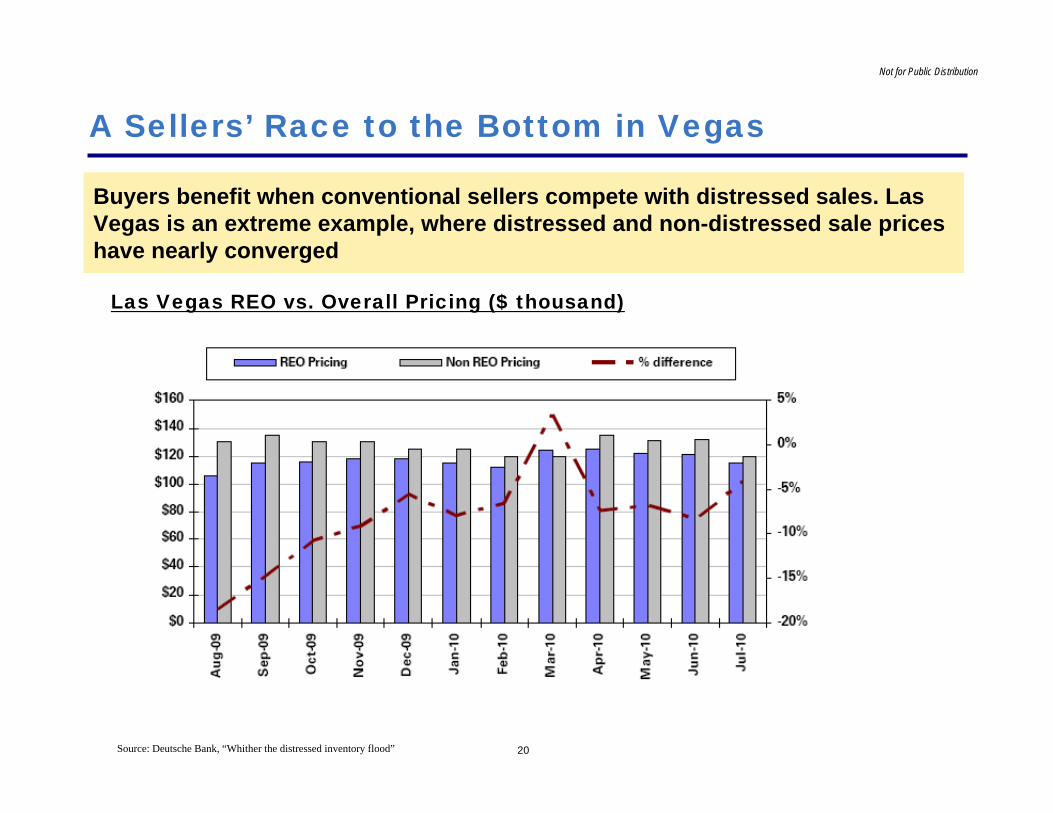
20
Not for Public Distribution
A Sellers’ Race to the Bottom in Vegas
Buyers benefit when conventional sellers compete with distressed sales. Las Vegas is an extreme example, where distressed and non-distressed sale prices have nearly converged
Las Vegas REO vs. Overall Pricing ($ thousand)
Source: Deutsche Bank, “Whither the distressed inventory flood”

Not for Public Distribution
Financing

22
Not for Public Distribution
3%
5%
7%
9%
11%
13%
15%
17%
19%
1973 1977 1982 1987 1992 1997 2002 2007
Mortgage Rates are Very Low
Mortgage rates have fallen to historically low levels. Fixed 30-year rates are now below 4.5% for the first time in the history of the Freddie Mac lender survey
30-Year Fixed-Rate 80% LTV Mortgage
Source: Freddie Mac

23
Not for Public Distribution
What Makes a Home Mortgage So Attractive?
Low Fixed Rate – 4.43% APR
Long Term – 30-Year Amortization
High LTV – 80% (97% for FHA loans)
Non-Recourse – Loans are explicitly or effectively non-recourse
Adequate Financing Available – $417k to $730k, depending on location
No Prepayment Penalties – Creates refinancing optionality
Tax Deductible Interest – More valuable with coming tax increases
Typical Conforming Mortgage Term Sheet
No other business or investor can get financing on such favorable terms

24
Not for Public Distribution
The Mortgage Market Benefits from Government Support
Support from the federal government provides qualified borrowers with access to credit on favorable terms
GSE and FHA mortgages are now >90% of the origination market
The target Fed Funds rate is 0%
The Fed has purchased more than one trillion dollars of MortgageBacked Securities
FHA high LTV refinancing programs are helping distressed borrowers

25
Not for Public Distribution
What Are the True Economics of Home Ownership?
Our Assumptions:Conventional Loan Transaction CostsDown Payment 20% Closing Costs (% of Purchase Price) 2%Mortgage 30yr Fixed Rate Selling Fees (% of Sale Price) 6%Interest Rate 4.40%
Annual FeesFHA Loan Property Taxes (% of Home Value) 1.50%Down Payment 3.5% Maint. + Insurance (% of Home Value) 2.00%Mortgage 30yr Fixed Rate Annual expenses grow with home appreciationInterest Rate 4.25%Upfront Mtge Insurance (Financed) 1.00% Tax RateAnnual Mtge Insur. Premium (First 5yrs) 0.90% Income Tax Rate 25%
RentImplied rent grows with home appreciation
Holding Period10 Years
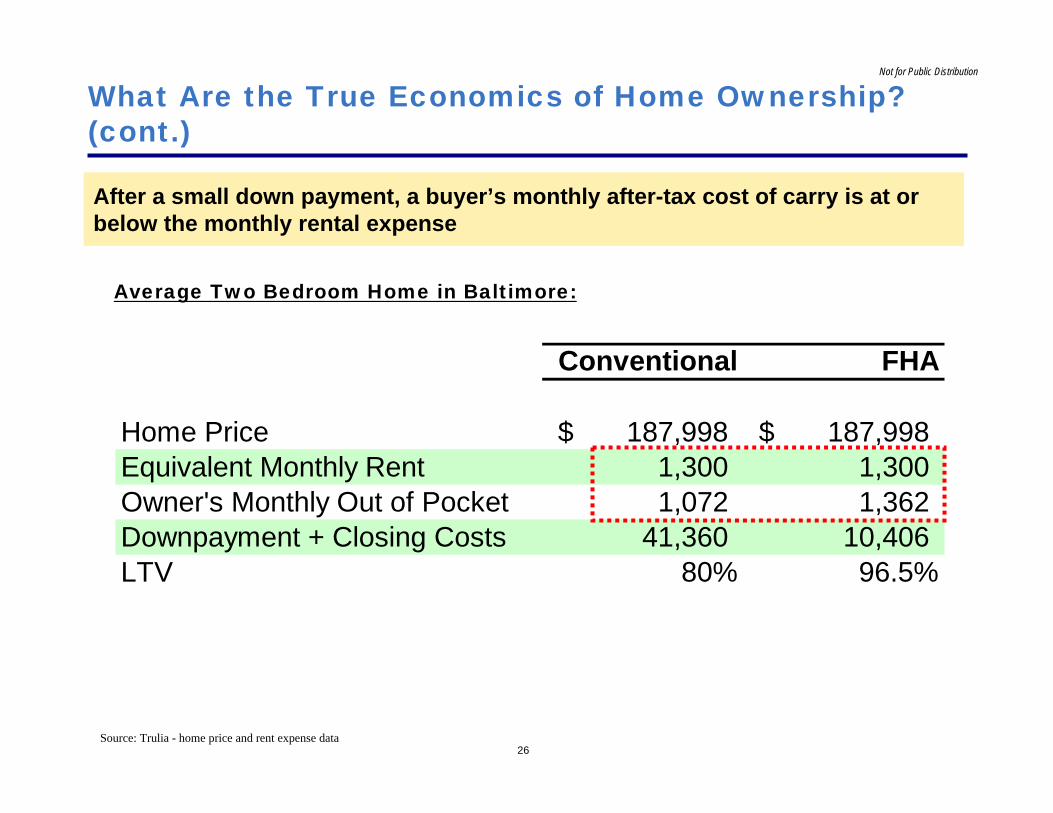
26
Not for Public Distribution
Conventional FHA
Home Price 187,998$ 187,998$ Equivalent Monthly Rent 1,300 1,300 Owner's Monthly Out of Pocket 1,072 1,362 Downpayment + Closing Costs 41,360 10,406 LTV 80% 96.5%
What Are the True Economics of Home Ownership? (cont.)
After a small down payment, a buyer’s monthly after-tax cost of carry is at or below the monthly rental expense
Average Two Bedroom Home in Baltimore:
Source: Trulia - home price and rent expense data

27
Not for Public Distribution
The Benefits of Low-Cost, High-LTV Financing
Homebuyers can make an excellent after-tax return on their equity investment, even under modest appreciation assumptions
Conventional 80% Financing
If the borrower has the opportunity to refinance at better rates, returns would be even higher
IRR Assuming 10yr HoldAnnual Appreciation
Residual Return
Current Return Total
Multiple of Equity
1% 3.8% 6.6% 10.4% 2.7x2% 6.9% 6.8% 13.7% 3.6x3% 9.5% 7.0% 16.5% 4.6x4% 11.8% 7.3% 19.1% 5.7x5% 14.0% 7.5% 21.5% 7.0x6% 15.9% 7.8% 23.7% 8.4x
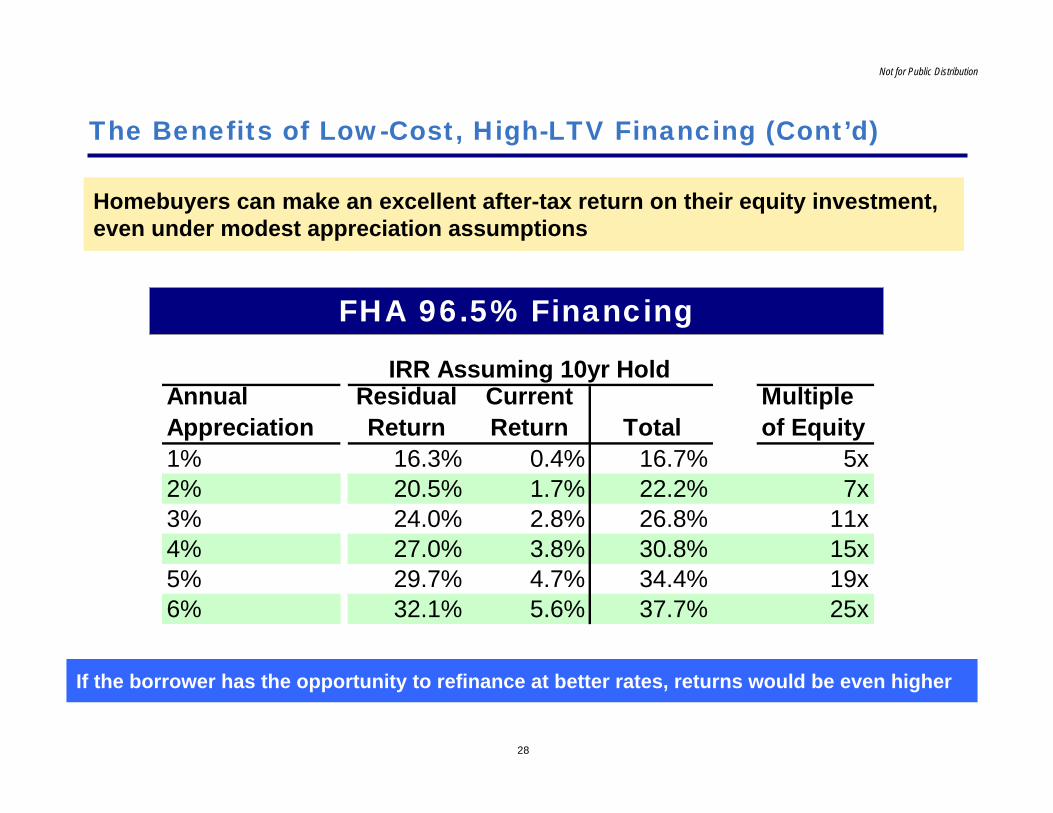
28
Not for Public Distribution
The Benefits of Low-Cost, High-LTV Financing (Cont’d)
Homebuyers can make an excellent after-tax return on their equity investment, even under modest appreciation assumptions
FHA 96.5% Financing
If the borrower has the opportunity to refinance at better rates, returns would be even higher
IRR Assuming 10yr HoldAnnual Appreciation
Residual Return
Current Return Total
Multiple of Equity
1% 16.3% 0.4% 16.7% 5x2% 20.5% 1.7% 22.2% 7x3% 24.0% 2.8% 26.8% 11x4% 27.0% 3.8% 30.8% 15x5% 29.7% 4.7% 34.4% 19x6% 32.1% 5.6% 37.7% 25x

Not for Public Distribution
Favorable Long-Term Demand Dynamics
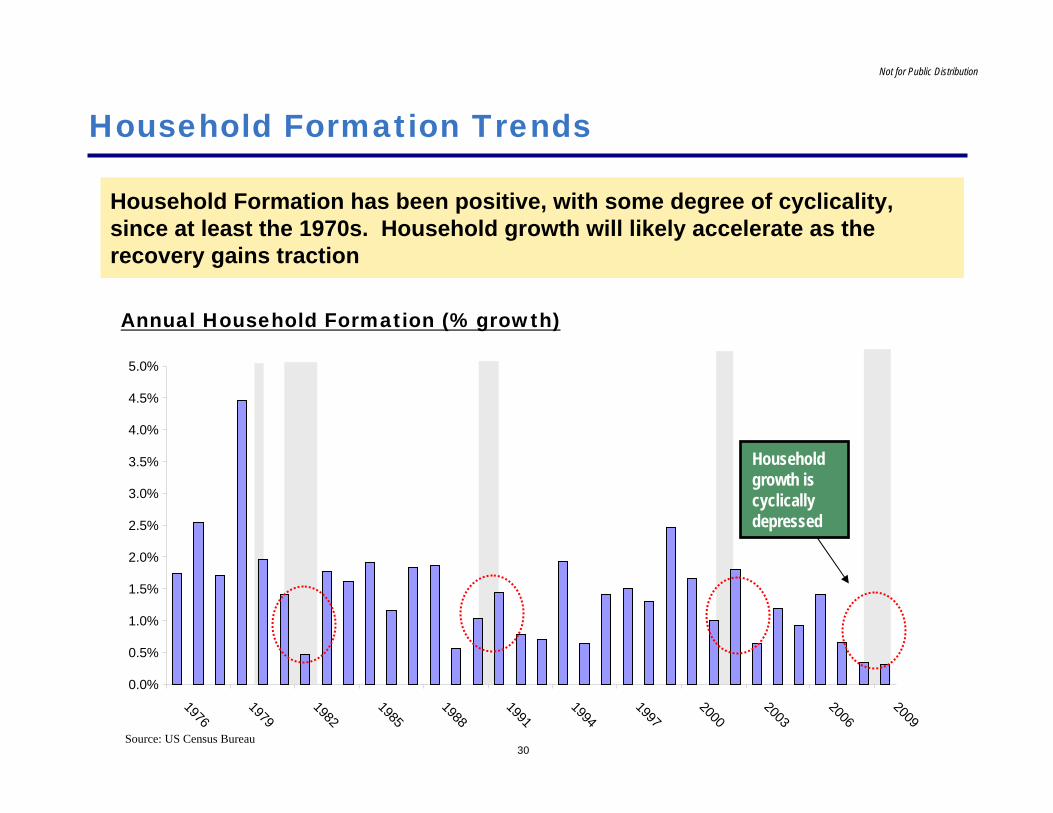
30
Not for Public Distribution
Household Formation Trends
Household Formation has been positive, with some degree of cyclicality, since at least the 1970s. Household growth will likely accelerate as the recovery gains traction
Annual Household Formation (% growth)
Source: US Census Bureau
0.0%
0.5%
1.0%
1.5%
2.0%
2.5%
3.0%
3.5%
4.0%
4.5%
5.0%
1976
1979
1982
1985
1988
1991
1994
1997
2000
2003
2006
2009
Household growth is cyclically depressed

31
Not for Public Distribution
60
61
62
63
64
65
66
67
68
69
70
1983 1986 1989 1992 1995 1998 2001 2004 2007 2010
Homeownership Rates have Normalized
Homeownership rates have declined to pre-bubble levels. While ownership is above pre-2000 rates, higher affordability and an aging population should support an ownership rate near today’s level
Source: US Census
Homeownership (% of households)

32
Not for Public Distribution
The Number of Owner Households Will Rebound
Accelerating household formation and a stabilization of the homeownership rate should lead to growth in owner households
Source: US Census Bureau, BLS, Maximus Advisors
(Household Formation x Homeownership Rate) + [Number of Households x (Change in Homeownership Rate)]Change in Owner Households =

33
Not for Public Distribution
Long-Term Demand for Housing
Source: Joint Center for Housing Studies, Harvard University, “Updated 2010-2020 Household and New Home Demand Projections”¹Applies 66% to all figures excluding: Vacant Rental (0%) and Second Homes (100%)
Projected Long-Term Demand for New Housing Units (single and multi-family)
Household Formation
Growth needed to maintain constant vacancy rate
LT Annual Single Family Home Demand 1,101 1,253 X Homeownership Rate Assumed: 66%¹

Not for Public Distribution
Favorable Long-Term Supply Dynamics

35
Not for Public Distribution
0
2
4
6
8
10
12
14
20112010200920082007200620052004200320022001
Mon
ths
of S
uppl
y (6
Mon
th L
ead)
-25%
-20%
-15%
-10%
-5%
0%
5%
10%
15%
20%
Hom
e Pr
ices
(YoY
%, I
nver
ted)
Temporarily Elevated Inventory Levels
In the short-term, for-sale homes and shadow inventory will weigh on home prices. This provides an opportunity to buy a long-term investment at an attractive valuation in a market facing short-term distress
Source: US Census Bureau
Change in Home Prices vs. Months of Inventory
Supply
Price

36
Not for Public Distribution
New Supply Growth Will be Slow
Builders have sharply reduced their construction capacity, increasing lead times when the market does recover
Sources: Deustche Bank, “Builder Community Analysis”¹Toll Brothers Management
Community Counts for Public Builders
It can take three to seven years to get land permitted in many of the more desirable markets¹

37
Not for Public Distribution
0
500
1,000
1,500
2,000
2,500
3,000
1959 1963 1967 1971 1975 1979 1983 1987 1991 1995 1999 2003 2007
Housing Starts are Now Below Long-Term Demand Growth
Housing starts have fallen sharply and are now lower than at any time in at least the past 50 years. Starts today are less than half of average long-term demand
Seasonally Adjusted Housing Starts (thousands)
Source: Chart: US Census Bureau¹Joint Center for Housing Studies, Harvard University, “Updated 2010-2020 Household and New Home Demand Projections”
Projected LT Demand:
1.1-1.25mm new single family
homes per year
New Supply Growth Will be
Slow
InventoryDepletion

Not for Public Distribution
Out-of-favor

39
Not for Public Distribution
“The U.S. housing market is headed for a complete and total nightmare”
- Business Insider, August 2010
“So even at 89 cents a share, it still looks pretty bleak out there for General Growth Shareholders”
- Businessweek, April 2009
Everybody Else is Afraid
The best investments we have made are the ones no one else would touch
“Now They Tell Us: Experts say housing is a lousy investment and it always will be”
- Yahoo Finance, August 2010

Not for Public Distribution
Concluding Thoughts

41
Not for Public Distribution
Why Now?
Interest rates won’t stay this low forever
New monetary easing increases the risk of inflation
Even with the current inventory levels, at today’s valuations, it is unlikely we will see another substantial decline in prices
Forced selling may abate as lenders’ balance sheets improve
Generally, there is more liquidity on the way down than on the way up
An economic recovery could cause housing to recover faster than many people think

42
Not for Public Distribution
The Housing Purchase is One of the Most Emotional Investment Decisions a Family Can Make
Increase inBuyer
Confidence
Decision toPurchase
HousingPrices
Increase
Once a family is able to purchase a home, the decision is based on psychological factors:
Confidence in the, and one’s, future
The fear of missing the opportunity to buy at the bottom
These psychological factors have self-reinforcing qualities that are similar to the forces that drive financial markets
Catalyst
43
Not for Public Distribution
An Institutionally Under-Owned Asset Class
Institutional investors have almost no exposure to single-family home rental properties (“SFHRPs”) as an asset class
Low valuation, high current yield and long-term appreciation potential make SFHRPs an intelligent investment for institutional investors
Despite these investment characteristics, we are unaware of any large pools of capital that have been raised to pursue this opportunity. This will change

44
Not for Public Distribution
The SFHRP Investment Opportunity Is Best Understood By Analogy
For the vast majority of the 20th century, timber was never considered an institutional asset class
Led by forward thinking investors, institutional investments in timberland emerged in the USA in the 1980s
With the advent of timber institutional management organizations (TIMOs) and timber REITs, institutional timberland investments have grown significantly
DANA Limited estimated that institutional investors had invested ~$50bn in timberlands as of early 2008
In 2007, the first timber ETF launched
The same features that attracted institutional investors to timber: current yield, inflation-protection, portfolio diversification, demand for “hard assets,” and the ability to create long-term tax-deferred gains, also apply to SFHRPs
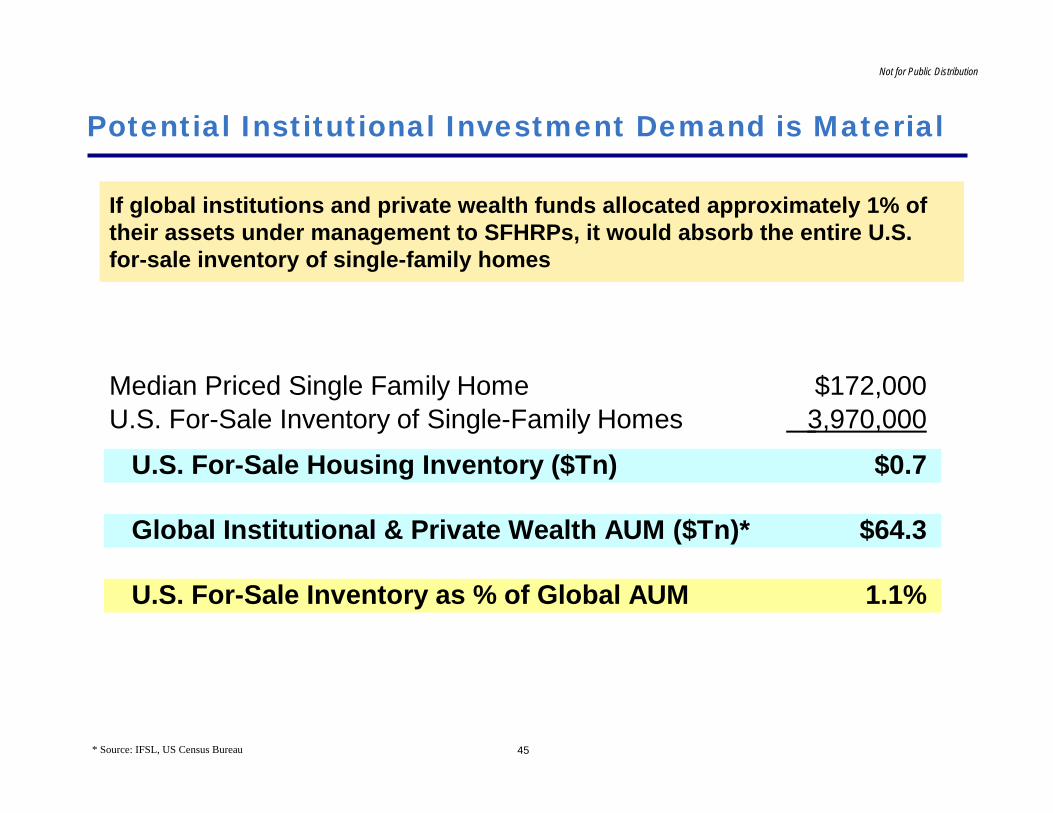
45
Not for Public Distribution
Potential Institutional Investment Demand is Material
If global institutions and private wealth funds allocated approximately 1% of their assets under management to SFHRPs, it would absorb the entire U.S. for-sale inventory of single-family homes
* Source: IFSL, US Census Bureau
Median Priced Single Family Home $172,000U.S. For-Sale Inventory of Single-Family Homes 3,970,000
U.S. For-Sale Housing Inventory ($Tn) $0.7
Global Institutional & Private Wealth AUM ($Tn)* $64.3
U.S. For-Sale Inventory as % of Global AUM 1.1%
Not for Public Distribution
Appendix

47
Not for Public Distribution
Appendix – Buy vs. Rent Assumptions:
Source: Beracha and Johnson, “Lessons from Over 30 Years of Buy versus Rent Decision: Is the American Dream Always Wise?”
Home Buyer's Assumptions Renter's AssumptionsDown Payment 20% Down Payment seeds investment portfolioMortgage 30yr Fixed Rate Diff between mtge and rent is investedClosing Costs 2% Portfolio is made of stocks and bondsHolding Period 8 Years Rent Growth Same as home appreciationSelling Fees 6% Income Tax Rate 25%Income Tax Rate 25% Capital Gains 20%Capital Gains 20%Property Taxes - Annual 1.50%Maint. + Insur - Annual 2.00%Annual expenses grow with appreciation
Linked to Win
September 14, 2011
Pershing Square Capital Management, L.P.
The analyses and conclusions of Pershing Square Capital Management, L.P. ("Pershing Square") contained in this presentation are based on publicly available information. Pershing Square recognizes that there may be confidential information in the possession of instruments of state, governments and other interested parties discussed in the presentation that could lead those constituents and other market participants to disagree with Pershing Square’s conclusions. This presentation and the information contained herein is not investment advice or a recommendation or solicitation to buy or sell any securities, currencies or other investment instruments. All investments involve risk, including the loss of principal.
The analyses provided may include certain statements, estimates and projections prepared with respect to, among other things, historical and anticipated events, access to and changes in capital markets and the values of currencies, assets and liabilities. Such statements, estimates, and projections reflect various assumptions by Pershing Square concerning anticipated results that are inherently subject to significant political, regulatory, economic, competitive, and other uncertainties and contingencies and have been included solely for illustrative purposes. No representations or warranties, express or implied, are made as to the accuracy or completeness of such statements, estimates or projections or with respect to any other materials herein and Pershing Square disclaims any liability with respect thereto. Actual results may vary materially from the estimates and projected results contained herein.
Funds managed by Pershing Square and its affiliates own U.S. dollars, Hong Kong dollars and options on the Hong Kong dollar. Pershing Square manages funds that are in the business of trading - buying and selling –securities and other financial instruments. It is likely that there will be developments in the future that cause Pershing Square to change its position regarding such investments. Pershing Square may buy, sell, cover or otherwise change the form of these investments for any or no reason. Pershing Square hereby disclaims any duty to any recipient hereof or to provide any updates or changes to the analyses contained here including, without limitation, the manner or type of any Pershing Square investment.
Disclaimer

Structure of the Presentation
I. The Context
II. The History
III. The Current State of Play
IV. Our Prediction of What is Likely to Happen
V. The Investment Opportunity
VI. Why Now?

I. The Context

4
The US Economy TodayThe US Economy Today

5
Real GDP Growth (%QoQ – Annualized, Seasonally Adj. )
U.S. economic growth remains sluggishU.S. economic growth remains sluggish
GDP Growth – U.S.
________________________________________________
Source: Bloomberg.

GDP – U.S.
6
U.S. GDP is still below the Q4 ’07 peakU.S. GDP is still below the Q4 ’07 peak
Annualized Real GDP (Billion USD, 2005 Dollars)
Still below Q4 ’07 peak
________________________________________________
Source: Bloomberg.

Unemployment – U.S.
7
Unemployment in the U.S. remains stubbornly high at over 9%Unemployment in the U.S. remains stubbornly high at over 9%
Unemployment Rate (%)
________________________________________________
Source: Bloomberg.
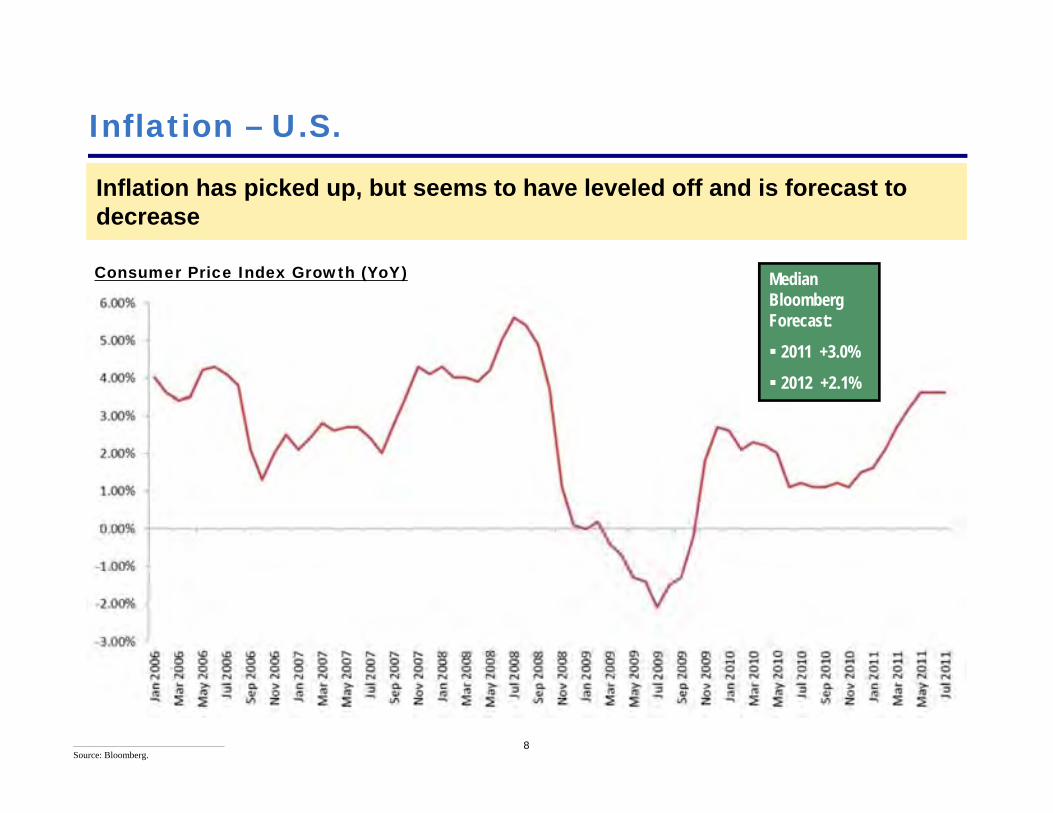
Inflation – U.S.
8
Inflation has picked up, but seems to have leveled off and is forecast to decrease Inflation has picked up, but seems to have leveled off and is forecast to decrease
Consumer Price Index Growth (YoY) Median Bloomberg Forecast:
2011 +3.0%
2012 +2.1%
________________________________________________
Source: Bloomberg.

Home Prices – U.S.
9
U.S. Home Prices are down 32% from peak and have not recoveredU.S. Home Prices are down 32% from peak and have not recovered
Home Price Index (Case Shiller Home Price 10-City Index)
-32% from peak
________________________________________________
Source: Bloomberg.
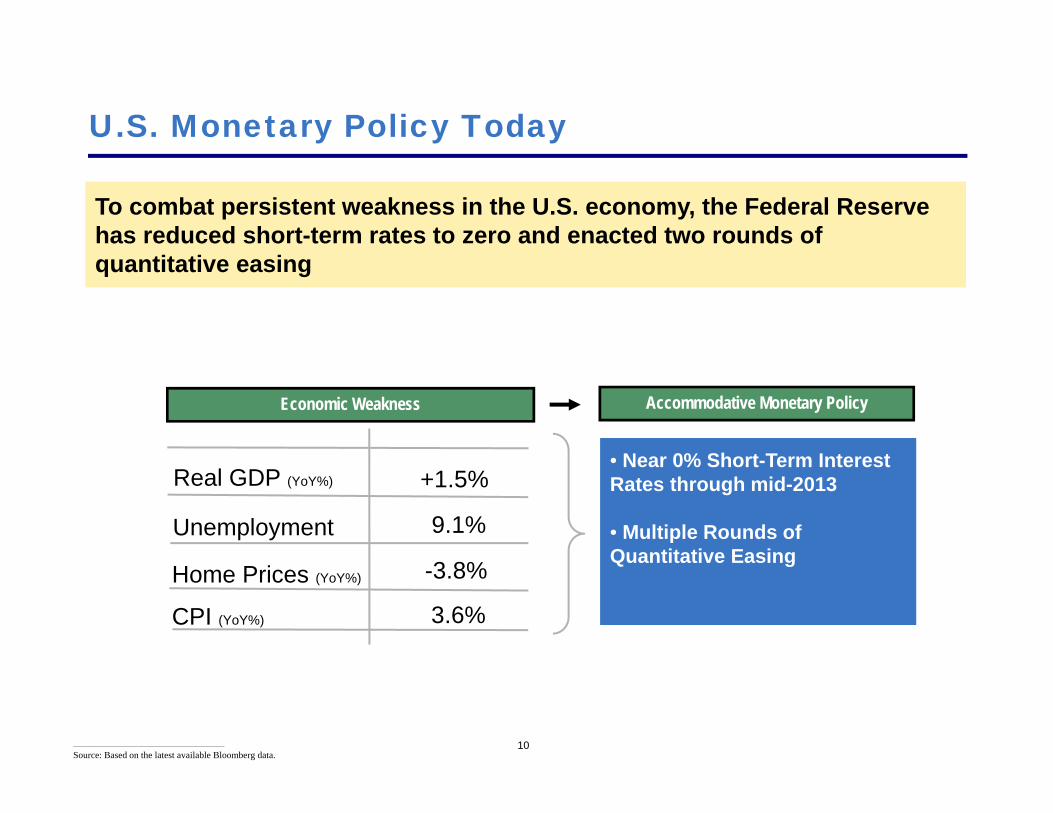
U.S. Monetary Policy Today
10
To combat persistent weakness in the U.S. economy, the Federal Reserve has reduced short-term rates to zero and enacted two rounds of quantitative easing
To combat persistent weakness in the U.S. economy, the Federal Reserve has reduced short-term rates to zero and enacted two rounds of quantitative easing
Real GDP (YoY%)
Unemployment
Home Prices (YoY%)
CPI (YoY%)
+1.5%
9.1%
-3.8%
3.6%
Accommodative Monetary Policy
• Near 0% Short-Term Interest Rates through mid-2013
• Multiple Rounds of Quantitative Easing
• Near 0% Short-Term Interest Rates through mid-2013
• Multiple Rounds of Quantitative Easing
Economic Weakness
________________________________________________
Source: Based on the latest available Bloomberg data.

U.S. Monetary Policy Will Remain Extremely Accommodative:
11
“The committee currently anticipates that economic conditions –including low rates of resource utilization and a subdued outlook for inflation over the medium run – are likely to warrant exceptionally low levels for the federal funds rate at least through mid-2013” - Federal Reserve statement, August 2011
“The committee currently anticipates that economic conditions –including low rates of resource utilization and a subdued outlook for inflation over the medium run – are likely to warrant exceptionally low levels for the federal funds rate at least through mid-2013” - Federal Reserve statement, August 2011
________________________________________________
Source: Press, Release August 9, 2011 – Board of Governors of the Federal Reserve System (http://www.federalreserve.gov/newsevents/press/monetary/20110809a.htm).

12
Compare with Economy XCompare with Economy X

Real GDP Growth (YoY)
Economy X has recovered strongly from the global recessionEconomy X has recovered strongly from the global recession
GDP Growth – Economy X
________________________________________________
Source: Bloomberg.
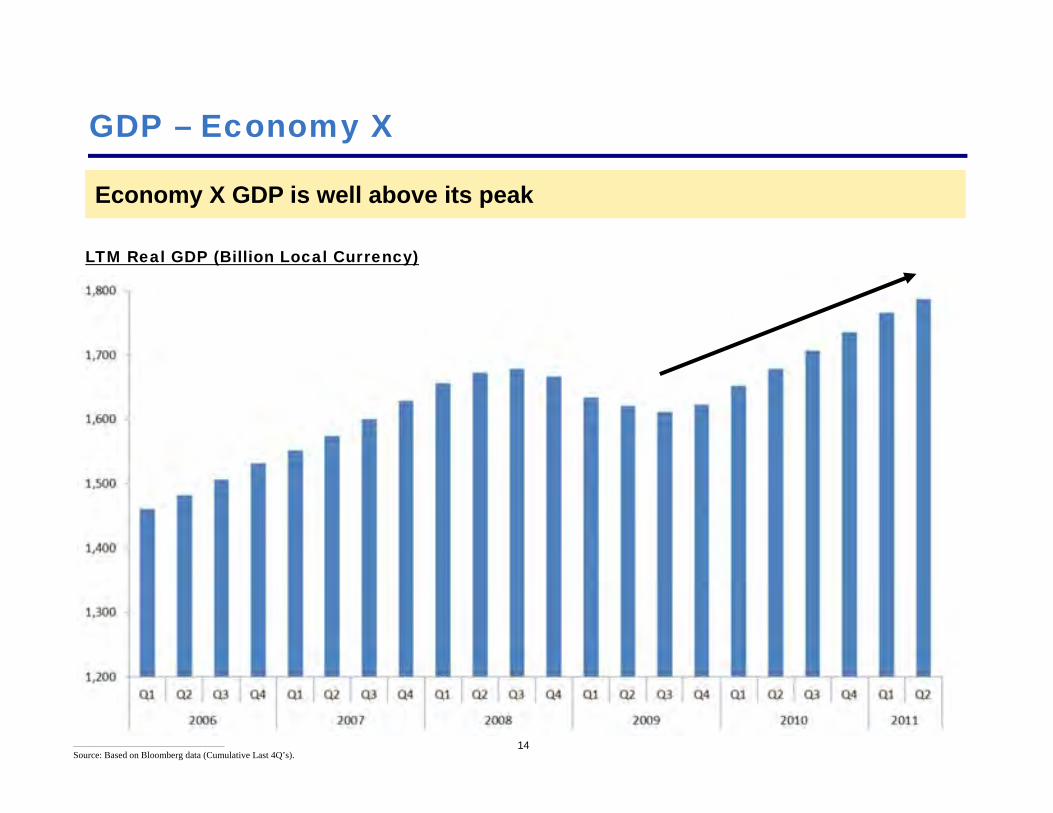
GDP – Economy X
14
Economy X GDP is well above its peakEconomy X GDP is well above its peak
LTM Real GDP (Billion Local Currency)
________________________________________________
Source: Based on Bloomberg data (Cumulative Last 4Q’s).

Unemployment – Economy X
15
Unemployment is 3.4% and back to pre-recession lows Unemployment is 3.4% and back to pre-recession lows
Unemployment Rate (%)
________________________________________________
Source: Bloomberg.
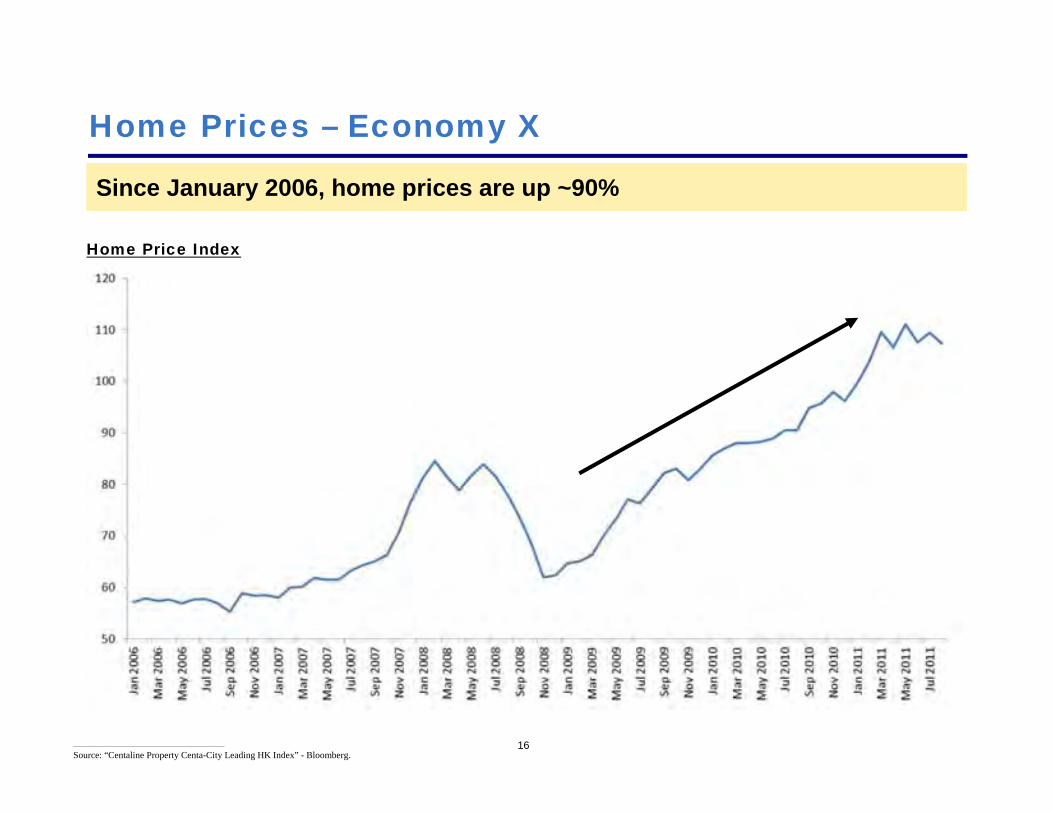
Home Prices – Economy X
16
Since January 2006, home prices are up ~90%Since January 2006, home prices are up ~90%
Home Price Index
________________________________________________
Source: “Centaline Property Centa-City Leading HK Index” - Bloomberg.

Inflation – Economy X
17
Inflation is accelerating and is now nearly 6% Inflation is accelerating and is now nearly 6%
Underlying Consumer Price Index Growth (YoY)
________________________________________________
Source: “Monthly Report on the Consumer Price Index” - Census and Statistics Department, Hong Kong SAR Government. (http://www.censtatd.gov.hk/products_and_services/products/publications/statistical_report/prices_household_expenditure/index_cd_B1060001_dt_detail.jsp).

Economy X’s Monetary Policy Mirrors the US’s
18
Despite surging growth and inflation, Economy X’s monetary policy mirrors that of the United States with a near-zero interest-rate policy and large amounts of money printing
Despite surging growth and inflation, Economy X’s monetary policy mirrors that of the United States with a near-zero interest-rate policy and large amounts of money printing
Real GDP (YoY%)
Unemployment %
Home Prices (YoY%)
CPI (YoY%)
Economy X U.S.
+5.1% +1.5%
3.4% 9.1%
+18.5% -3.8%
+5.8% +3.6%
________________________________________________
Source: Based on the latest available Bloomberg data. Press Release, August 22, 2011 – Census and Statistics Department, Hong Kong SAR Government (http://www.censtatd.gov.hk/press_release/press_releases_on_statistics/index.jsp?sID=2798&sSUBID=19062&displayMode=D).

19
Who is Economy X?Who is Economy X?
Why would Economy X have the same monetary policy as the United States?
Why would Economy X have the same monetary policy as the United States?

Economy X = Hong KongEconomy X = Hong Kong
The Hong Kong Dollar’s (HKD) peg to the U.S. Dollar (USD) forces Hong Kong to import the U.S.’s ultra-accommodative monetary policy, despite its much stronger economy
The Hong Kong Dollar’s (HKD) peg to the U.S. Dollar (USD) forces Hong Kong to import the U.S.’s ultra-accommodative monetary policy, despite its much stronger economy
Why Does Hong Kong share U.S. monetary policy?

II. The History

The Hong Kong Dollar Over Time
22
Hong Kong has implemented several different currency regimes, demonstrating a pattern of change and adaptation during times of stressHong Kong has implemented several different currency regimes, demonstrating a pattern of change and adaptation during times of stress
Sterling PegSterling Peg Dollar PegDollar Peg
HKD/USD (inverted)
Free Floating Free Floating
HK
D S
treng
th
’98 W
eak S
ide
Com
mitm
ent
’98 W
eak S
ide
Com
mitm
ent
’05 S
trong
Sid
e Co
mm
itmen
t’05
Stro
ng S
ide
Com
mitm
ent
________________________________________________
Source: “Hong Kong’s Linked Exchange Rate System” – Hong Kong Monetary Authority, p.34 (http://www.info.gov.hk/hkma/eng/public/hkmalin/index.htm).
7.75 to 7.85 Band7.75 to 7.85 Band
Sterling Link Adopted (1935)
23
By 1935, facing a dramatic rise in the price of silver and a shrinking money supply, Hong Kong abandoned silver as backing for its currency
HK replaced the silver link with a Sterling-based currency board
At the time, HK was a British colony and Sterling was a major reserve currency

Denomination of Foreign Currency Reserves 1950-1982
The Sterling Peg (1935-1972)
Sterling’s role as an international reserve currency was displaced by the USD after WWIISterling’s role as an international reserve currency was displaced by the USD after WWII
Sterling
________________________________________________
Source: “The Decline of Sterling: Managing the Retreat of an International Currency, 1945-1992” - Catherine R. Schenk, p.23.

Sterling Link Abandoned (1972)
25
In 1949 and in 1967, Sterling was devalued. Shortly after the 1967 devaluation, the HKD was revalued by 10% against Sterling to preserve its purchasing power
In 1949 and in 1967, Sterling was devalued. Shortly after the 1967 devaluation, the HKD was revalued by 10% against Sterling to preserve its purchasing power
HKD/USD (inverted)
HK
D S
treng
th
1967 14% Sterling devaluation –
Countered by +10% HKD revaluation
1967 14% Sterling devaluation –
Countered by +10% HKD revaluation
________________________________________________
Source: “Hong Kong’s Linked Exchange Rate System” - Hong Kong Monetary Authority, p.34 (http://www.info.gov.hk/hkma/eng/public/hkmalin/index.htm).
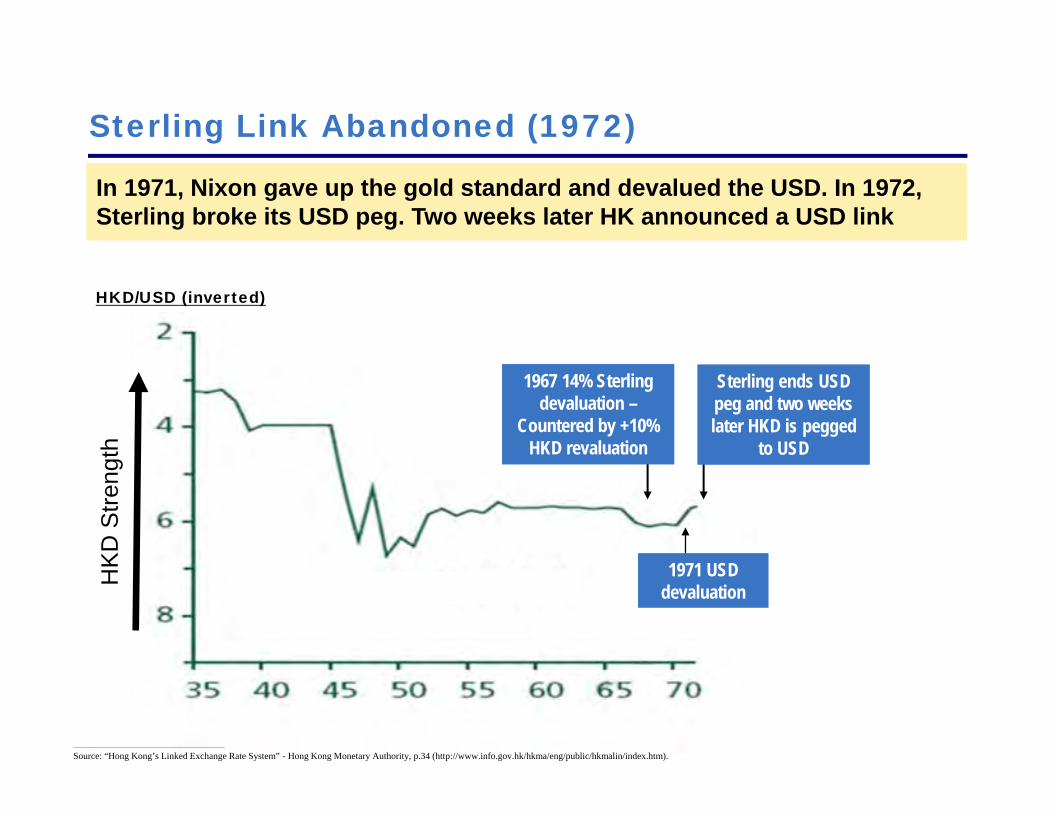
Sterling Link Abandoned (1972)
26
In 1971, Nixon gave up the gold standard and devalued the USD. In 1972, Sterling broke its USD peg. Two weeks later HK announced a USD linkIn 1971, Nixon gave up the gold standard and devalued the USD. In 1972, Sterling broke its USD peg. Two weeks later HK announced a USD link
HKD/USD (inverted)
HK
D S
treng
th
1967 14% Sterling devaluation –
Countered by +10% HKD revaluation
1967 14% Sterling devaluation –
Countered by +10% HKD revaluation
1971 USD devaluation1971 USD
devaluation
________________________________________________
Source: “Hong Kong’s Linked Exchange Rate System” - Hong Kong Monetary Authority, p.34 (http://www.info.gov.hk/hkma/eng/public/hkmalin/index.htm).
Sterling ends USD peg and two weeks later HKD is pegged
to USD
Sterling ends USD peg and two weeks later HKD is pegged
to USD
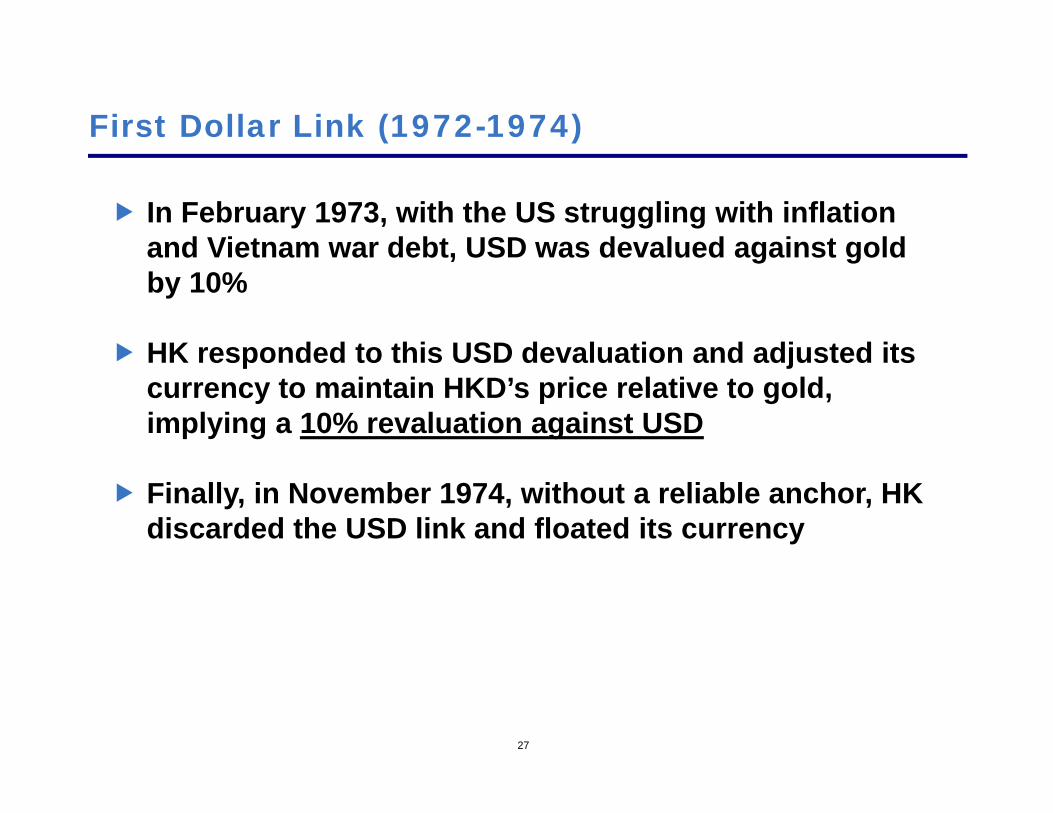
First Dollar Link (1972-1974)
27
In February 1973, with the US struggling with inflation and Vietnam war debt, USD was devalued against gold by 10%
HK responded to this USD devaluation and adjusted its currency to maintain HKD’s price relative to gold, implying a 10% revaluation against USD
Finally, in November 1974, without a reliable anchor, HK discarded the USD link and floated its currency

The Float (1974-1983)
28
Until 1982, the Float worked reasonably well despite HK’s lacking a formal central bank. The commercial banks were made responsible for managing the system, leaving the HKD vulnerable to a crisis
Until 1982, the Float worked reasonably well despite HK’s lacking a formal central bank. The commercial banks were made responsible for managing the system, leaving the HKD vulnerable to a crisis
HKD/USD
HK
D W
eakn
ess
________________________________________________
Source: Bloomberg.

The Float Ends in Crisis (1983)
29
In September 1983, negotiations over the UK’s agreement to transfer control of HK to the Mainland sparked a crisis of confidence in the HKD, leading to bank runs and food shortages. A rapid decline in the HKD ensued
In September 1983, negotiations over the UK’s agreement to transfer control of HK to the Mainland sparked a crisis of confidence in the HKD, leading to bank runs and food shortages. A rapid decline in the HKD ensued
29
HKD/USD
HK
D W
eakn
ess
Black Saturday (9/24/1983) HKD hits an all time low: 9.60
________________________________________________
Source: Bloomberg.

The Float Ends in Crisis (1983) Cont.
30________________________________________________
Source: “Hong Kong SAR’s Monetary and Rate Challenges” - Catherine Schenk, p149-50.30
Fear Grips Hong KongFear Grips Hong KongPanic Overwhelms the StreetsPanic Overwhelms the Streets

The Dollar Link (1983 – Present)
31
To stem the panic, authorities adopted a currency board and a USD peg. While the initial workings of the currency board were basic, the strength of the USD and the simplicity of the currency board made it credible
To stem the panic, authorities adopted a currency board and a USD peg. While the initial workings of the currency board were basic, the strength of the USD and the simplicity of the currency board made it credible
HKD/USD
Floating Rate
Resumption of the USD peg, this time at 7.80 HKD/USD
HK
D W
eakn
ess
’98 Weak Side Intervention Commitment
’98 Weak Side Intervention Commitment
’05 Strong Side Intervention Commitment
’05 Strong Side Intervention Commitment
Creation of 7.75 to 7.85 BandCreation of 7.75 to 7.85 Band
________________________________________________
Source: Bloomberg.

32
Why Did HK Choose the USD as an Anchor in 1983?
“The crucial factor is that there should be confidence that the anchor currency will be managed responsibly by its central bank.”
- Tony Latter, Former HKMA Deputy Chief Executive and co-architect of the peg
“The crucial factor is that there should be confidence that the anchor currency will be managed responsibly by its central bank.”
- Tony Latter, Former HKMA Deputy Chief Executive and co-architect of the peg
US monetary policy established tremendous credibility in the Volcker era
There was no other viable anchor – Precious metals had been discredited and Sterling was a secondary currency
The US was a major HK trading partner
The USD was commonly used in international trade and finance
________________________________________________
Source: “Hong Kong’s Money: The History, Logic and Operation of the Currency Peg” - Tony Latter, p.56.

33
This publically available HK government policy memo details the HK government’s thinking at the time:This publically available HK government policy memo details the HK government’s thinking at the time:
How do we know what the HK government was thinking when the peg was introduced in 1983?
________________________________________________
Source: “Stabilization of the Exchange Rate” (http://www.sktsang.com/ArchiveI/1983.pdf).
We will get back to this memo later in the presentation…
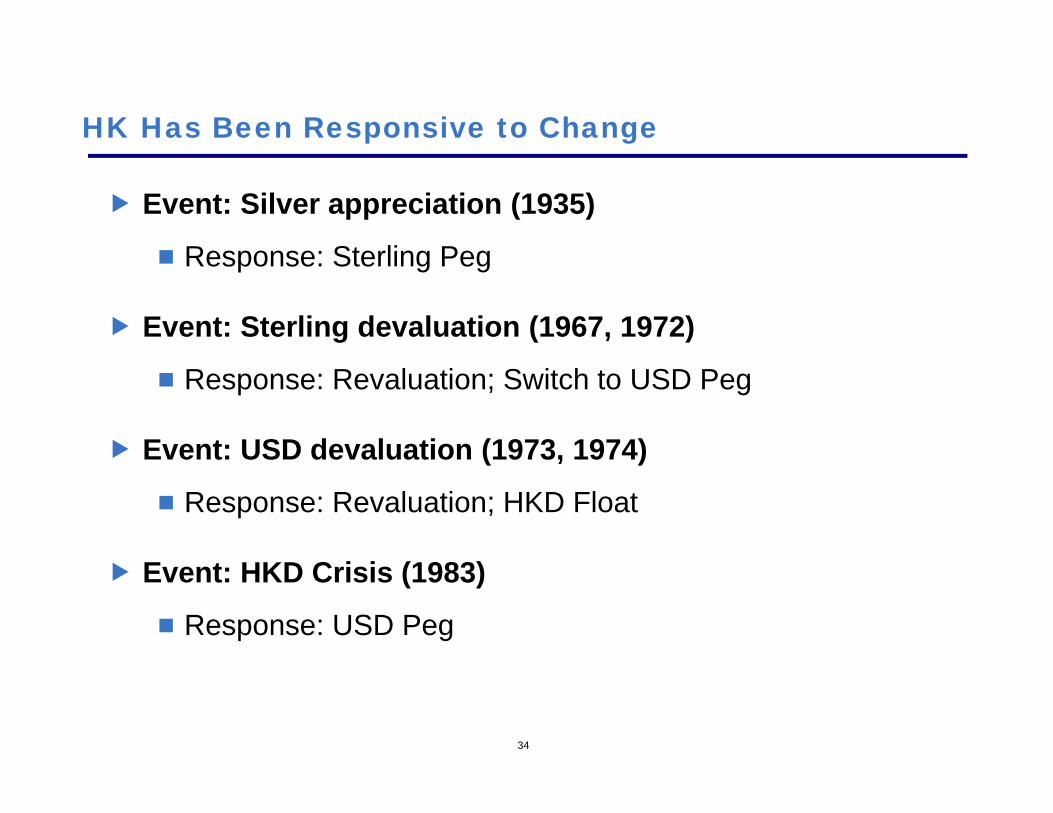
34
HK Has Been Responsive to Change
Event: Silver appreciation (1935)
Response: Sterling Peg
Event: Sterling devaluation (1967, 1972)
Response: Revaluation; Switch to USD Peg
Event: USD devaluation (1973, 1974)
Response: Revaluation; HKD Float
Event: HKD Crisis (1983)
Response: USD Peg

III. The Current State of Play

Hong Kong
36
Population: 7.1mm
GDP by Sector: Finance 26%, Trade 27%, Public Administration 18%, Transportation 9%
Economic Freedom: Ranked #1 for 17 consecutive years by the Heritage Foundation
History:
•British colonial rule (1842-1997)
•Reversion to Chinese sovereignty (1997)
•“One Country, Two Systems” (1997-2047)
•Harmonization with the Mainland (2047 - Onward)
________________________________________________
Source: “Hong Kong Yearbook 2010” - Information Service Department, Hong Kong SAR Government, p.49 (http://www.yearbook.gov.hk/2010/en/index.html).Picture - (http://www.expatify.com/hong-kong/navigating-the-residential-neighborhoods-of-hong-kong.html).
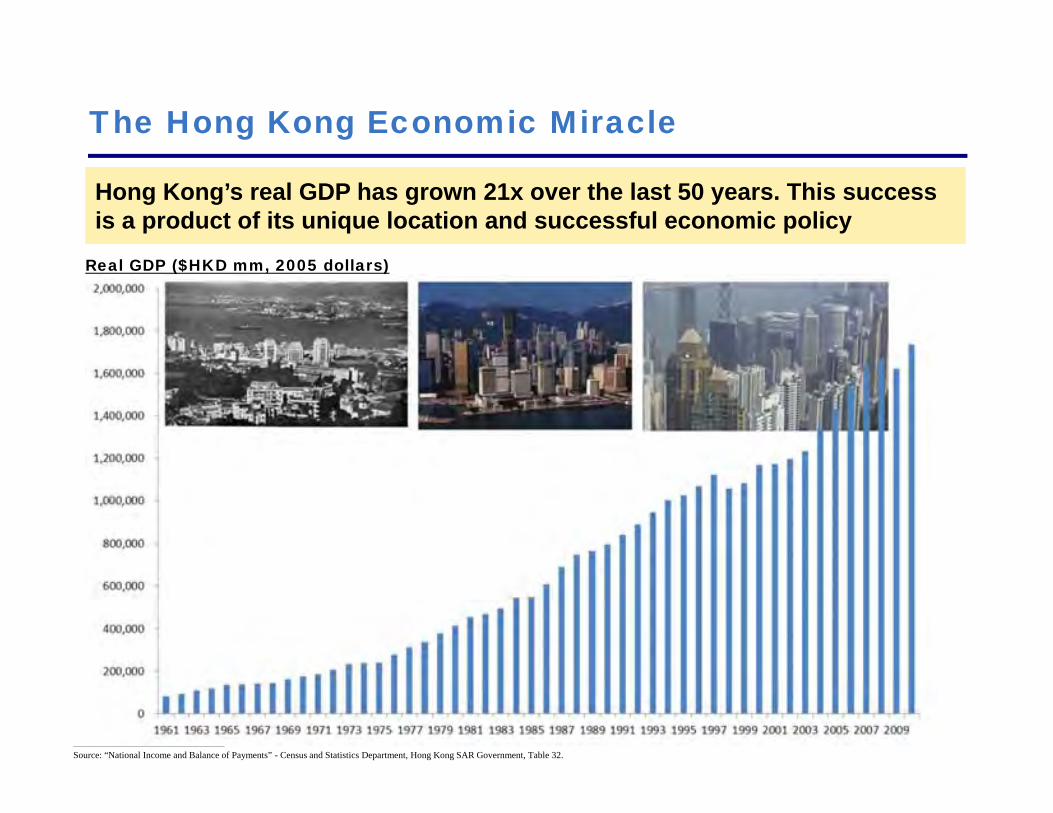
Hong Kong’s real GDP has grown 21x over the last 50 years. This success is a product of its unique location and successful economic policyHong Kong’s real GDP has grown 21x over the last 50 years. This success is a product of its unique location and successful economic policy
The Hong Kong Economic Miracle
Real GDP ($HKD mm, 2005 dollars)
________________________________________________
Source: “National Income and Balance of Payments” - Census and Statistics Department, Hong Kong SAR Government, Table 32.

The Basic Law, HK’s constitution, allows for a broad range of currency regimes
Consequently, unlike many currency boards, the HKD system can be quickly and easily amended
Any change would be made through an administrative process involving the Financial Secretary, the Chief Executive, and the Monetary Authority (HKMA), with likely consultation with Mainland authorities
HK’s Currency Regime is Tremendously Flexible
39
The Linked Exchange Rate System (LERS)The Linked Exchange Rate System (LERS)
The LERS
Since 1983, the LERS has kept the HKD pegged to the USD at a rate of ~7.80 HKD/USD
The HKMA has established a 7.75 to 7.85 HKD/USD trading band for the currency
The price of the HKD is kept within the trading band through a series of arbitrage and automatic intervention mechanisms

How the LERS System Works
Capital Inflow
Market Participants Buy HKD
Upward Pressure On Exchange Rate
Currency Board Sells HKD at 7.75
Monetary Base Expands
Interest Rates Fall
Downward Pressure On Exchange Rate Back Towards 7.80 HKD/USD
Strong Side Defense:7.75 HKD/USD
Strong Side Defense:7.75 HKD/USD
Capital Outflow
Market Participants Sell HKD
Downward Pressure On Exchange Rate
Currency Board Buys HKD at 7.85
Monetary Base Contracts
Interest Rates Rise
Upward Pressure On Exchange Rate Back Towards 7.80 HKD/USD
Weak Side Defense:7.85 HKD/USD
Weak Side Defense:7.85 HKD/USD

A Lot Has Changed Since 1983…
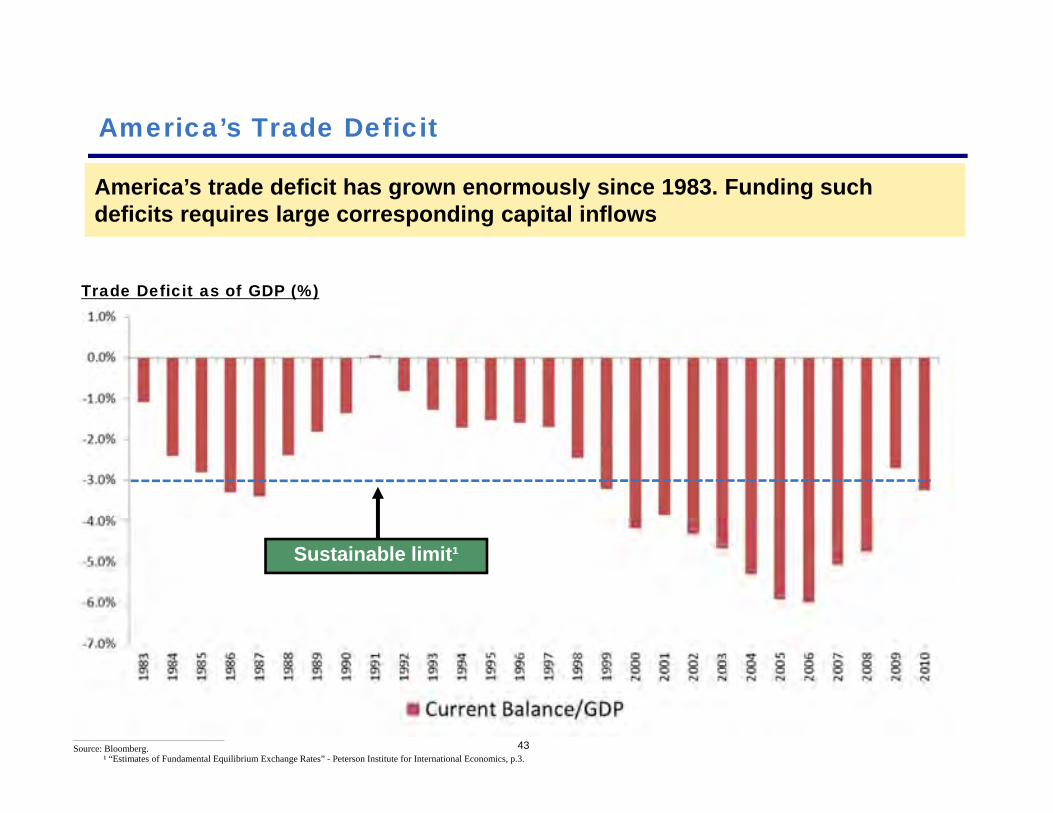
43
America’s trade deficit has grown enormously since 1983. Funding such deficits requires large corresponding capital inflowsAmerica’s trade deficit has grown enormously since 1983. Funding such deficits requires large corresponding capital inflows
America’s Trade Deficit
Trade Deficit as of GDP (%)
Sustainable limit¹
________________________________________________
Source: Bloomberg.¹ “Estimates of Fundamental Equilibrium Exchange Rates” - Peterson Institute for International Economics, p.3.

44
Hong Kong’s large trade surplus reflects its position as a global trading and financial services center, as well as the relative cheapness of its currency Hong Kong’s large trade surplus reflects its position as a global trading and financial services center, as well as the relative cheapness of its currency
Hong Kong’s Trade Surplus
Trade Surplus/ Deficit(% of GDP)
________________________________________________
Source: “National Income and Balance of Payments” - Census and Statistics Department, Hong Kong SAR Government, Table 42.

45
The U.S. has suffered from decades of chronic deficitsThe U.S. has suffered from decades of chronic deficits
America’s Debt Crisis
Deficit/GDP (%)
________________________________________________
Source: Bloomberg.

46
America’s fiscal position has worsened considerably since 1983. S&P recently downgraded the U.S., citing poor leadership from Washington in solving the U.S.’s serious budget problems
America’s fiscal position has worsened considerably since 1983. S&P recently downgraded the U.S., citing poor leadership from Washington in solving the U.S.’s serious budget problems
America’s Debt Crisis – The US is No Longer AAA
Debt/GDP (%)
________________________________________________
Source: Bloomberg.Treasury Direct (http://www.treasurydirect.gov/govt/reports/pd/histdebt/histdebt_histo4.htm).
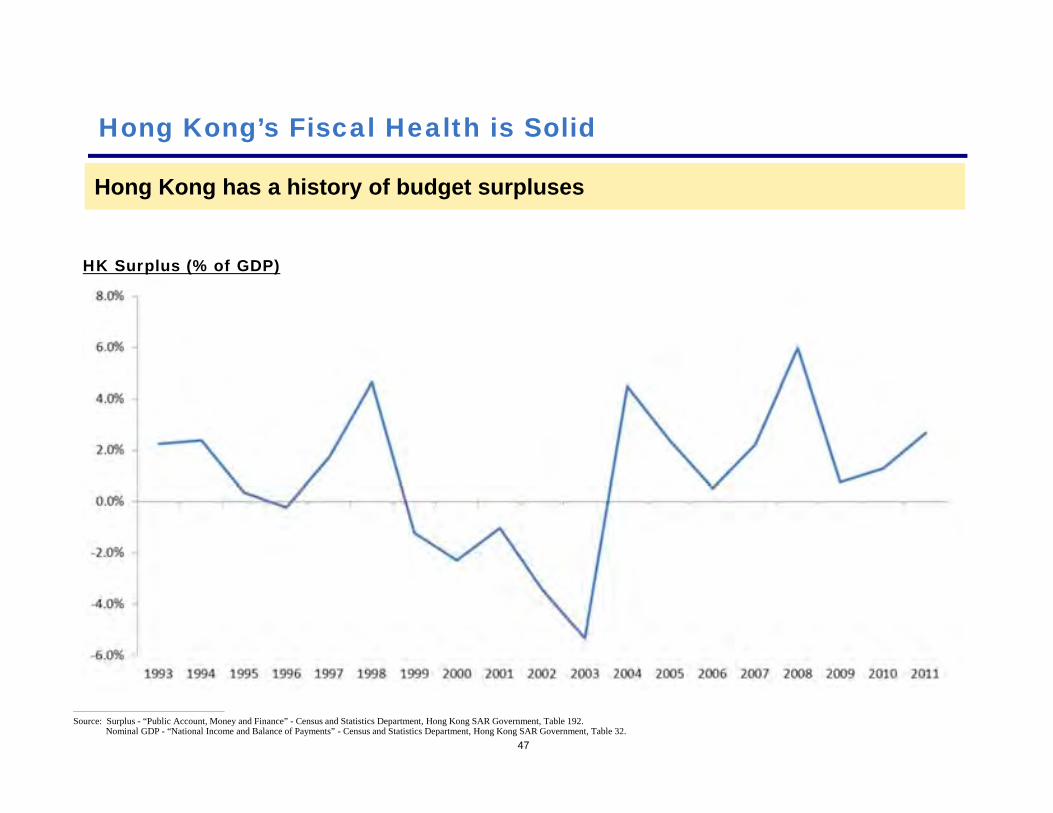
47
Hong Kong has a history of budget surplusesHong Kong has a history of budget surpluses
Hong Kong’s Fiscal Health is Solid
HK Surplus (% of GDP)
________________________________________________
Source: Surplus - “Public Account, Money and Finance” - Census and Statistics Department, Hong Kong SAR Government, Table 192.Nominal GDP - “National Income and Balance of Payments” - Census and Statistics Department, Hong Kong SAR Government, Table 32.

48
HK has built a USD $77bn foreign currency fiscal reserve, or $294bn (~126% of trailing GDP) including the funds backing the currency board and other assetsHK has built a USD $77bn foreign currency fiscal reserve, or $294bn (~126% of trailing GDP) including the funds backing the currency board and other assets
HK’s Fiscal Health is Strong – 2010 S&P AAA Upgrade
Foreign Currency Assets (% of GDP)
________________________________________________
Source: Foreign Currency Assets - Bloomberg (Adjusted for HKD).Nominal GDP - “National Income and Balance of Payments” - Census and Statistics Department, Hong Kong SAR Government, Table 32.

Evolving American Monetary Policy
49
Since the recent financial crisis, the Federal Reserve has struggled to stimulate the US economy, resorting to massive quantitative easing and promises of extended ultra-low interest rates
Since the recent financial crisis, the Federal Reserve has struggled to stimulate the US economy, resorting to massive quantitative easing and promises of extended ultra-low interest rates
Fed Balance Sheet (Billion) Fed Funds (%)
QE II
________________________________________________
Source: Bloomberg.
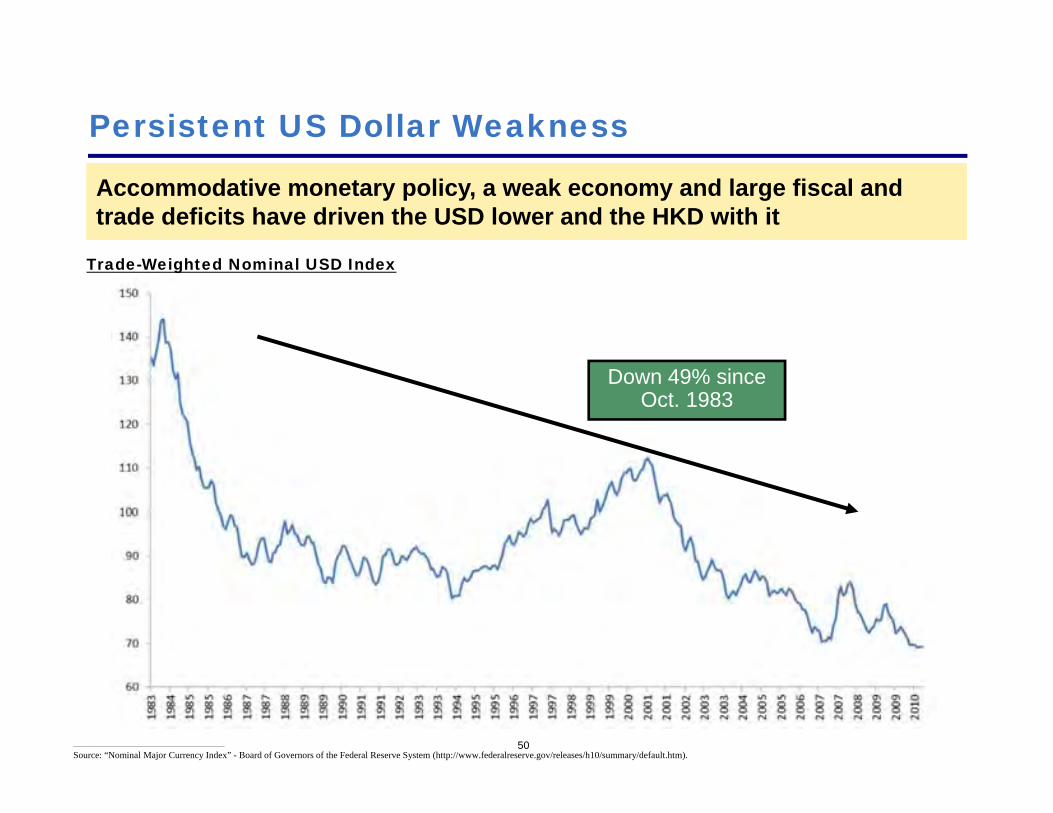
Persistent US Dollar Weakness
50
Accommodative monetary policy, a weak economy and large fiscal and trade deficits have driven the USD lower and the HKD with itAccommodative monetary policy, a weak economy and large fiscal and trade deficits have driven the USD lower and the HKD with it
Trade-Weighted Nominal USD Index
Down 49% since Oct. 1983
________________________________________________
Source: “Nominal Major Currency Index” - Board of Governors of the Federal Reserve System (http://www.federalreserve.gov/releases/h10/summary/default.htm).
51
“The success of a currency board arrangement, and its acceptability to local people and businesses, depend to a considerable extent on the anchor currency being reasonably stable.”
- Tony Latter, Former HKMA deputy chief executive and co-architect of the peg
“The success of a currency board arrangement, and its acceptability to local people and businesses, depend to a considerable extent on the anchor currency being reasonably stable.”
- Tony Latter, Former HKMA deputy chief executive and co-architect of the peg
________________________________________________
Source: “Hands On, Hands Off?: The Nature and Process of Economic Policy in Hong Kong” - Tony Latter, p.75.

52
Links with China are growingLinks with China are growing

Hong Kong’s trade with America has fallen as a percentage of total trade, while trade with China is booming Hong Kong’s trade with America has fallen as a percentage of total trade, while trade with China is booming
53
% of Hong Kong’s Total Trade
Trade Links with China are Growing
________________________________________________
Source: “External Trade“ - Census and Statistics Department, Hong Kong SAR Government, Table 60.
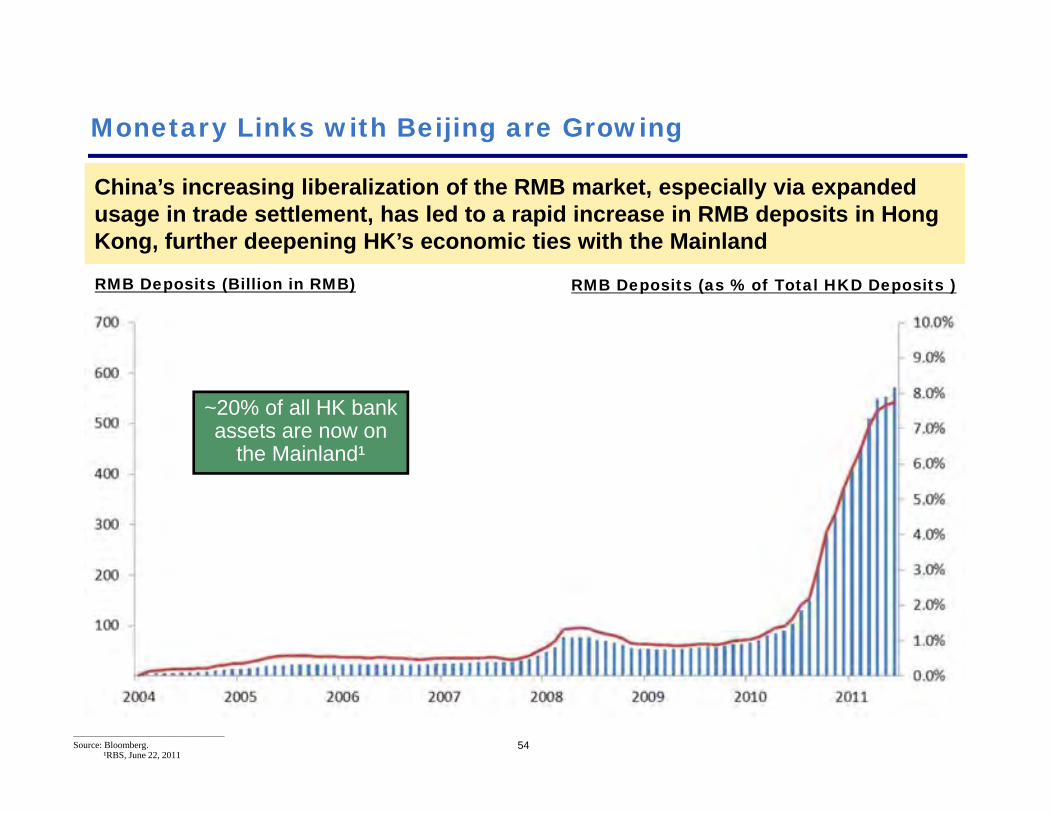
54
China’s increasing liberalization of the RMB market, especially via expanded usage in trade settlement, has led to a rapid increase in RMB deposits in Hong Kong, further deepening HK’s economic ties with the Mainland
China’s increasing liberalization of the RMB market, especially via expanded usage in trade settlement, has led to a rapid increase in RMB deposits in Hong Kong, further deepening HK’s economic ties with the Mainland
Monetary Links with Beijing are Growing
RMB Deposits (Billion in RMB) RMB Deposits (as % of Total HKD Deposits )
________________________________________________
Source: Bloomberg.¹RBS, June 22, 2011
~20% of all HK bank assets are now on
the Mainland¹

55
The USD Peg Has Materially Reduced the Market Value of the HKD
The USD Peg Has Materially Reduced the Market Value of the HKD
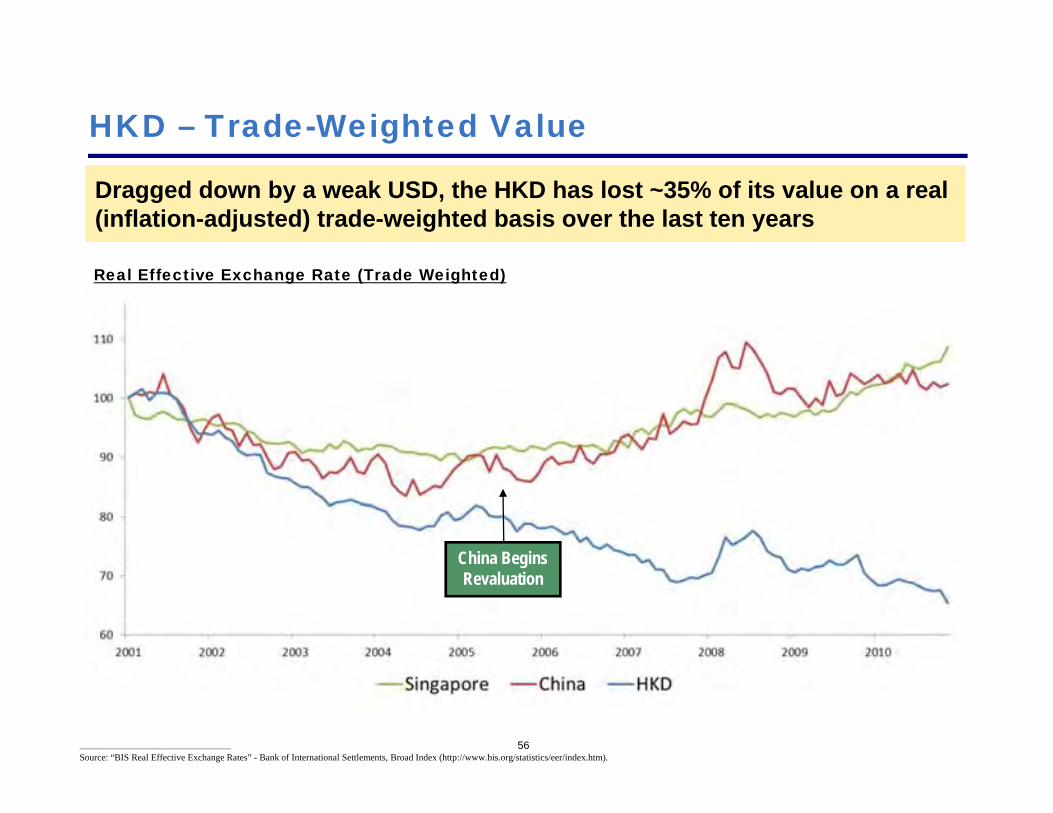
56
HKD – Trade-Weighted Value
Dragged down by a weak USD, the HKD has lost ~35% of its value on a real (inflation-adjusted) trade-weighted basis over the last ten yearsDragged down by a weak USD, the HKD has lost ~35% of its value on a real (inflation-adjusted) trade-weighted basis over the last ten years
China Begins Revaluation
Real Effective Exchange Rate (Trade Weighted)
________________________________________________
Source: “BIS Real Effective Exchange Rates” - Bank of International Settlements, Broad Index (http://www.bis.org/statistics/eer/index.htm).
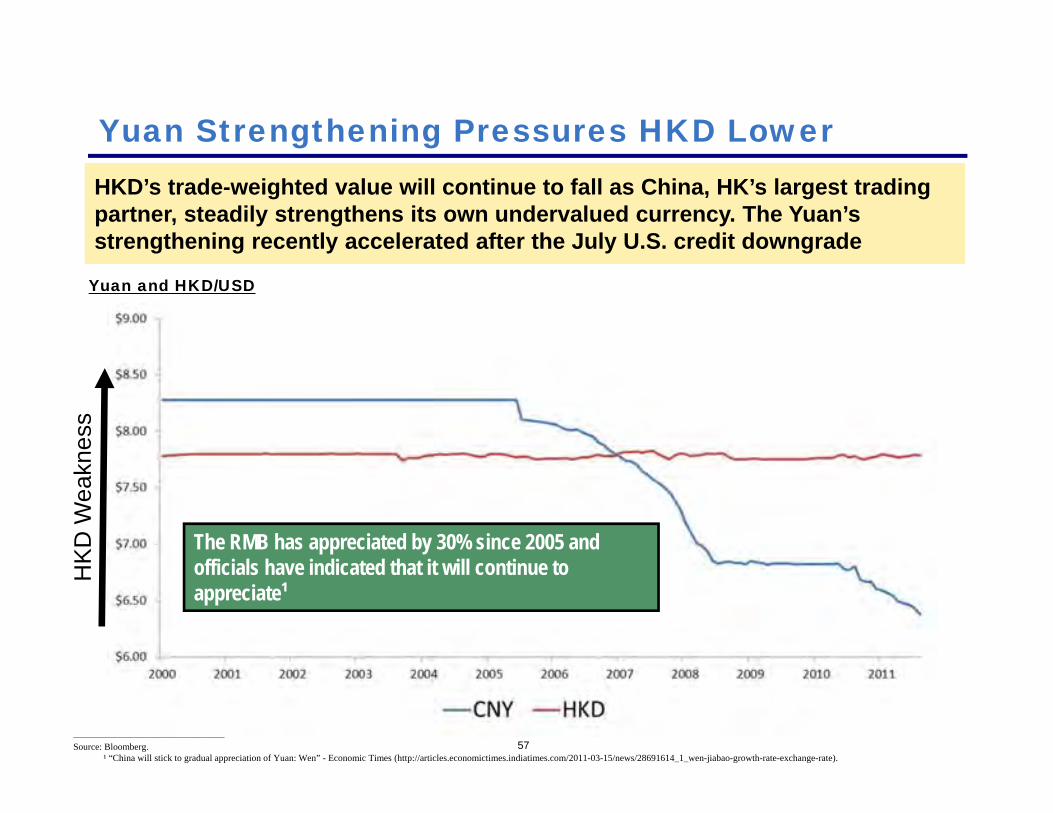
57
HKD’s trade-weighted value will continue to fall as China, HK’s largest trading partner, steadily strengthens its own undervalued currency. The Yuan’s strengthening recently accelerated after the July U.S. credit downgrade
HKD’s trade-weighted value will continue to fall as China, HK’s largest trading partner, steadily strengthens its own undervalued currency. The Yuan’s strengthening recently accelerated after the July U.S. credit downgrade
Yuan Strengthening Pressures HKD Lower
Yuan and HKD/USD
The RMB has appreciated by 30% since 2005 and officials have indicated that it will continue to appreciate¹
________________________________________________
Source: Bloomberg.¹ “China will stick to gradual appreciation of Yuan: Wen” - Economic Times (http://articles.economictimes.indiatimes.com/2011-03-15/news/28691614_1_wen-jiabao-growth-rate-exchange-rate).
HK
D W
eakn
ess

Valuation Summary
58
Economist models and changes in trade-weighted real exchange rates indicate that the HKD is materially undervalued relative to a basket of its trading partners
Economist models and changes in trade-weighted real exchange rates indicate that the HKD is materially undervalued relative to a basket of its trading partners
% Undervalued:% Undervalued = (7.80/Fair Value) -1
________________________________________________
Source: “Economic Research: GS DEER” - Goldman Sachs, Q2 2011 Trade Weighted Misalignment. “Currency valuation from a macro perspective” - Barclays Capital, June 14, 2011, p.3.“Estimates of Fundamental Equilibrium Exchange” – Peterson Institute for International Economics, Real Effective Exchange Rate, May 2011.
Model % Undervalued (Multi‐Lateral)Decline in Real Trade-Weighted Value - Last 10yrs 54%Goldman Sachs DEER Model 26%Barclays PPP Model 33%Undervaluation 26% ‐ 54%
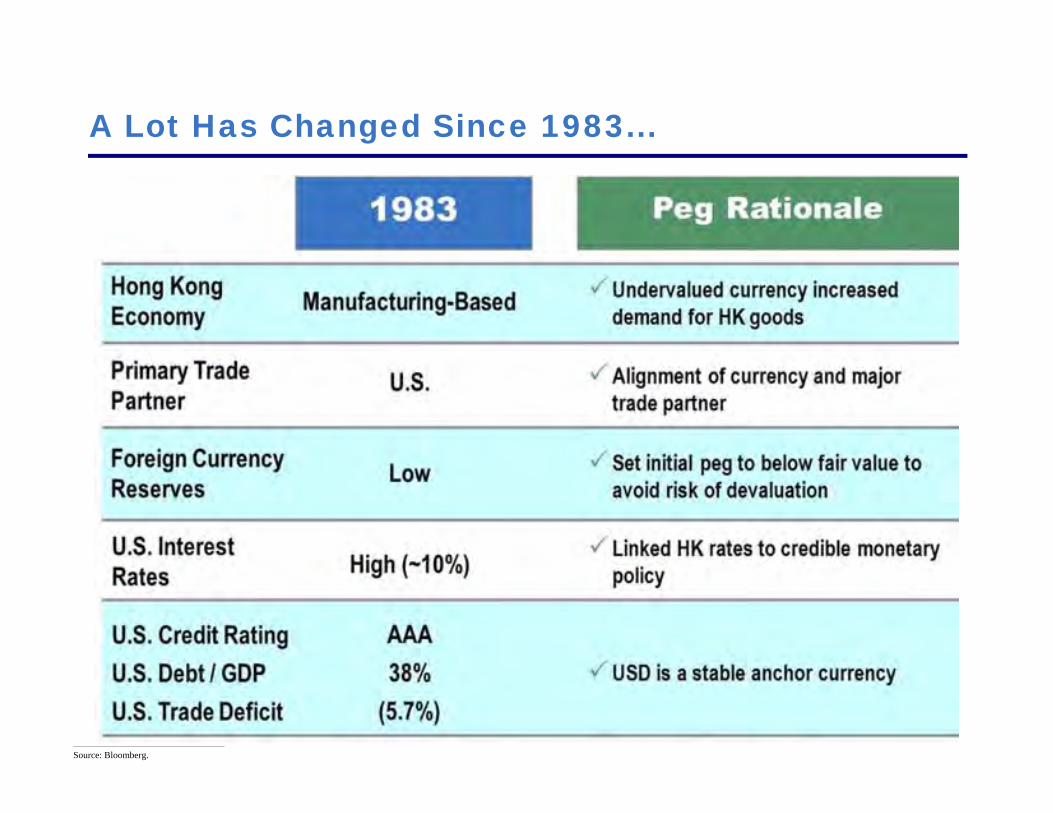
A Lot Has Changed Since 1983...
________________________________________________
Source: Bloomberg.
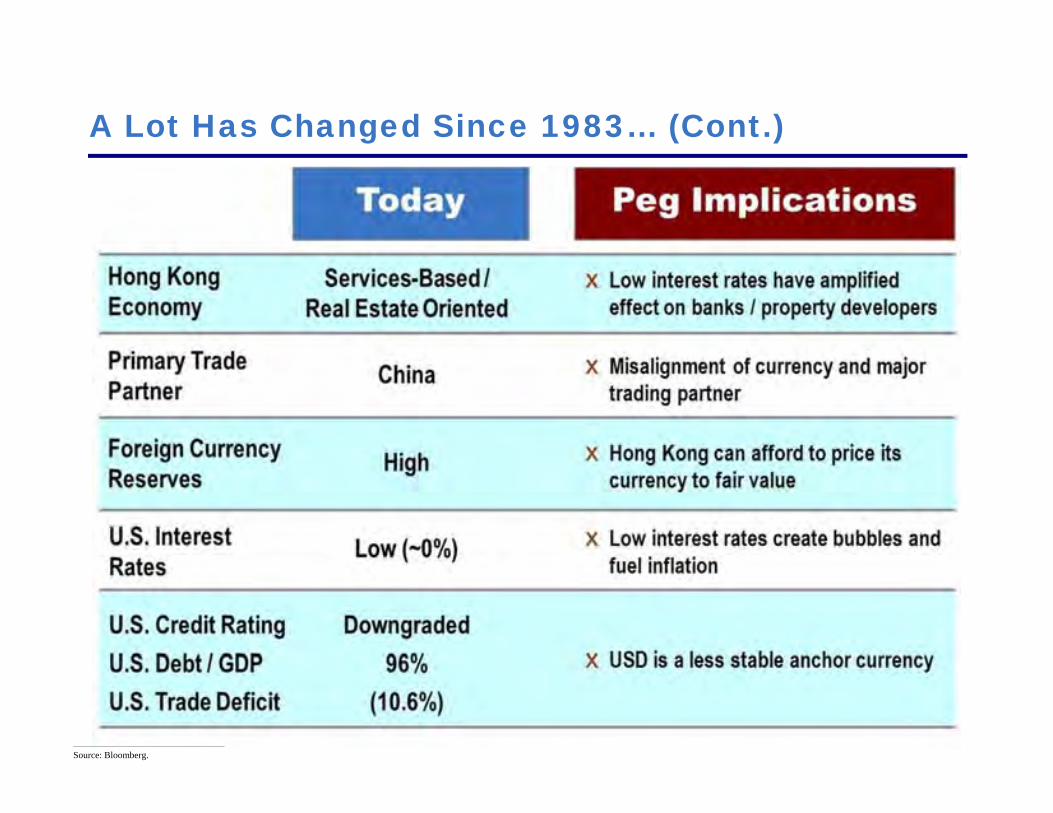
A Lot Has Changed Since 1983… (Cont.)
________________________________________________
Source: Bloomberg.
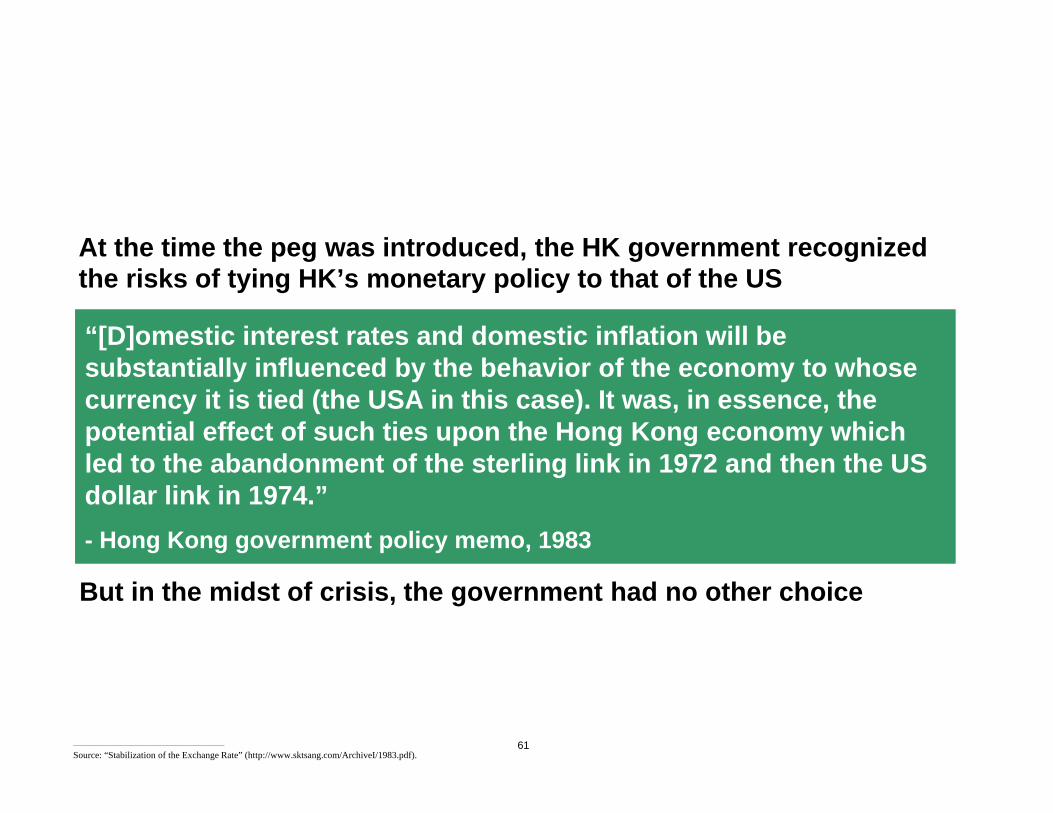
At the time the peg was introduced, the HK government recognized the risks of tying HK’s monetary policy to that of the US
61
“[D]omestic interest rates and domestic inflation will be substantially influenced by the behavior of the economy to whose currency it is tied (the USA in this case). It was, in essence, the potential effect of such ties upon the Hong Kong economy which led to the abandonment of the sterling link in 1972 and then the US dollar link in 1974.”- Hong Kong government policy memo, 1983
“[D]omestic interest rates and domestic inflation will be substantially influenced by the behavior of the economy to whose currency it is tied (the USA in this case). It was, in essence, the potential effect of such ties upon the Hong Kong economy which led to the abandonment of the sterling link in 1972 and then the US dollar link in 1974.”- Hong Kong government policy memo, 1983
________________________________________________
Source: “Stabilization of the Exchange Rate” (http://www.sktsang.com/ArchiveI/1983.pdf).
But in the midst of crisis, the government had no other choice

Impact of the Peg on HK

63
Consumer price inflation in Hong Kong is acceleratingConsumer price inflation in Hong Kong is accelerating
Inflation – A growing concern
Underlying Inflation (% YoY)
The HKMA recently increased its 2011 inflation expectation to 5.5% from 4.5%
________________________________________________
Source: “Monthly Report on the Consumer Price Index” - Census and Statistics Department, Hong Kong SAR Government.

64
HK Residential Price Index (Centaline Property Centa-City Leading Hong Kong Index)
Prices in Hong Kong’s residential real estate market are soaringPrices in Hong Kong’s residential real estate market are soaring
Asset Bubbles Building - Residential Real Estate
________________________________________________
Source: Bloomberg.
222% Increase

65________________________________________________
Source: “Hong Kong Property” - Citi, May 2011, p.51.
HK Residential Price to Income Ratio
Residential valuations are approaching Pre-Asian Financial Crisis levelsResidential valuations are approaching Pre-Asian Financial Crisis levels
Asset Bubbles Building - Residential Real Estate

66
HK Commercial Price Index
Prices in Hong Kong’s commercial real estate market are increasing rapidlyPrices in Hong Kong’s commercial real estate market are increasing rapidly
Asset Bubbles Building - Commercial Real Estate
Class A office market stats:
Vacancy Rate: ~2%
Rent (% yoy): ~+18%
Cap Rates: ~3%
________________________________________________
Source: “Half-Yearly Monetary and Financial Stability Report - March 2011” - Hong Kong Economy, HK Commercial Price Index , p. 38 (http://www.hkeconomy.gov.hk/en/reports/index.htm).1 CBRE Data – Prepared for Pershing Square.

How the USD Link Contributes to Inflation

How Does the Peg Cause Inflation
The USD peg and the vastly divergent US and HK economies impact the HK economy through various channels
Rapid Expansion of the Monetary Base
Imported Low Short-Term Rates
Diminished Purchasing Power

69
Rapid Expansion of the Monetary BaseRapid Expansion of the Monetary Base

In 2008 and 2009, attracted by its safe-haven status and undervaluation, investors flooded into HKD, pushing the rate to 7.75 and forcing the HKMA to print money to defend the strong side of the band
In 2008 and 2009, attracted by its safe-haven status and undervaluation, investors flooded into HKD, pushing the rate to 7.75 and forcing the HKMA to print money to defend the strong side of the band
The Monetary Costs of Intervention
70
HKD/USD
Weak-side Intervention Level
Strong-side Intervention LevelStrong-side Intervention
HK
D W
eakn
ess
________________________________________________
Source: Bloomberg.
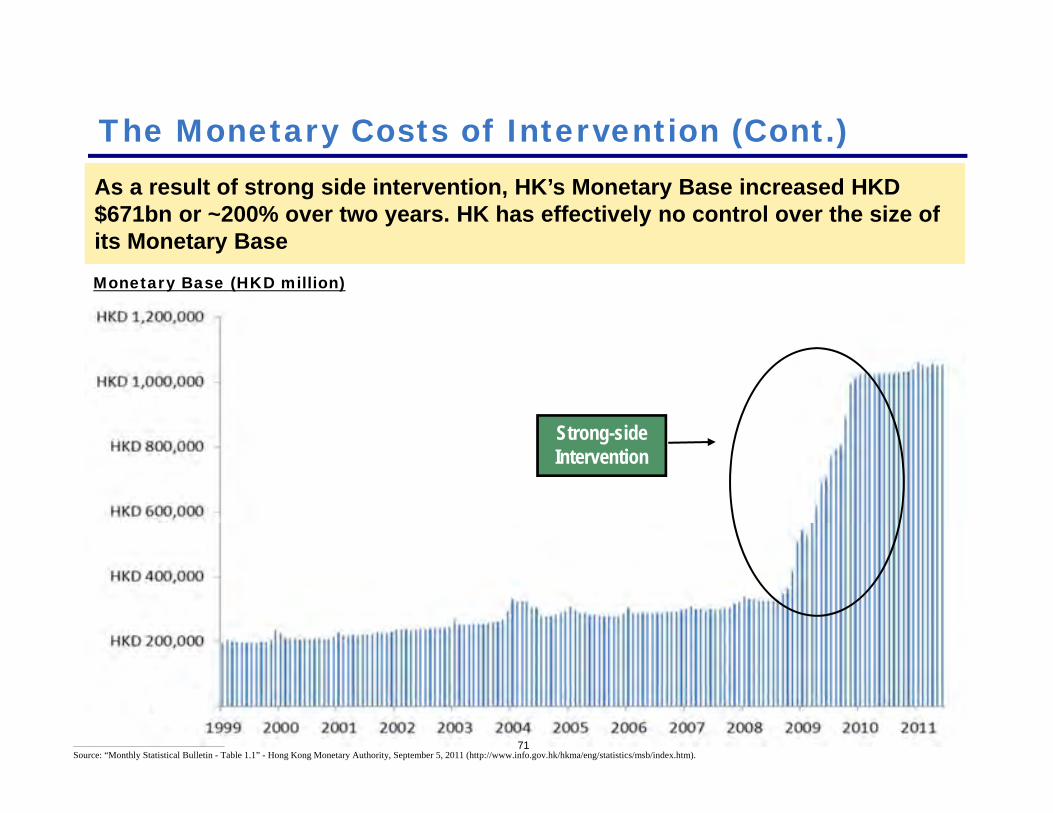
71
Monetary Base (HKD million)
As a result of strong side intervention, HK’s Monetary Base increased HKD $671bn or ~200% over two years. HK has effectively no control over the size of its Monetary Base
As a result of strong side intervention, HK’s Monetary Base increased HKD $671bn or ~200% over two years. HK has effectively no control over the size of its Monetary Base
The Monetary Costs of Intervention (Cont.)
Strong-side Intervention
________________________________________________
Source: “Monthly Statistical Bulletin - Table 1.1” - Hong Kong Monetary Authority, September 5, 2011 (http://www.info.gov.hk/hkma/eng/statistics/msb/index.htm).

72________________________________________________
Source: “Overheating Emerging Markets: Temperature Gauge” - The Economist (http://www.economist.com/blogs/dailychart/2011/06/overheating-emerging-markets-0).
Private Credit Growth less Nominal GDP Growth – 12 Months
Growth in base money supply has contributed to HK having one of the fastest rates of credit growth in the worldGrowth in base money supply has contributed to HK having one of the fastest rates of credit growth in the world
Rapid Credit Growth
Same figure for the US: -3%

The Strong Side Defense Risks Further Money Printing
The HKD’s widely recognized undervaluation increases the likelihood that the HKMA will need to print more money to keep the HKD within the band
With short-term interest rates already near zero, rates can’t fall any further to discourage investors from holding the HKD

74
Imported Low Short-Term Interest RatesImported Low Short-Term Interest Rates

Arbitrageurs take advantage of the peg and keep Hong Kong short-term rates (HIBOR) in line with LIBOR, irrespective of the suitability of such rates for Hong Kong
Arbitrageurs take advantage of the peg and keep Hong Kong short-term rates (HIBOR) in line with LIBOR, irrespective of the suitability of such rates for Hong Kong
75
1-Month HIBOR and LIBOR Rates
Tied to U.S. Short-Term Interest Rates
Home mortgage rates in HK today are only ~2%
________________________________________________
Source: Bloomberg.

Interest-rate parity with the US means Hong Kong suffers frequently from inappropriately high and low real interest ratesInterest-rate parity with the US means Hong Kong suffers frequently from inappropriately high and low real interest rates
76
High Negative Real Interest Rates Today
Real Interest Rates (1-Month HIBOR less Underlying CPI)
+10% real interest rates post the Asian Financial
crisis retarded Hong Kong’s recovery
High negative real interest rates have contributed Hong Kong’s current and prior asset bubbles
________________________________________________
Source: Bloomberg.“Monthly Report on the Consumer Price Index” - Census and Statistics Department, Hong Kong SAR Government, Underlying Inflation.

77
Diminished Purchasing PowerDiminished Purchasing Power
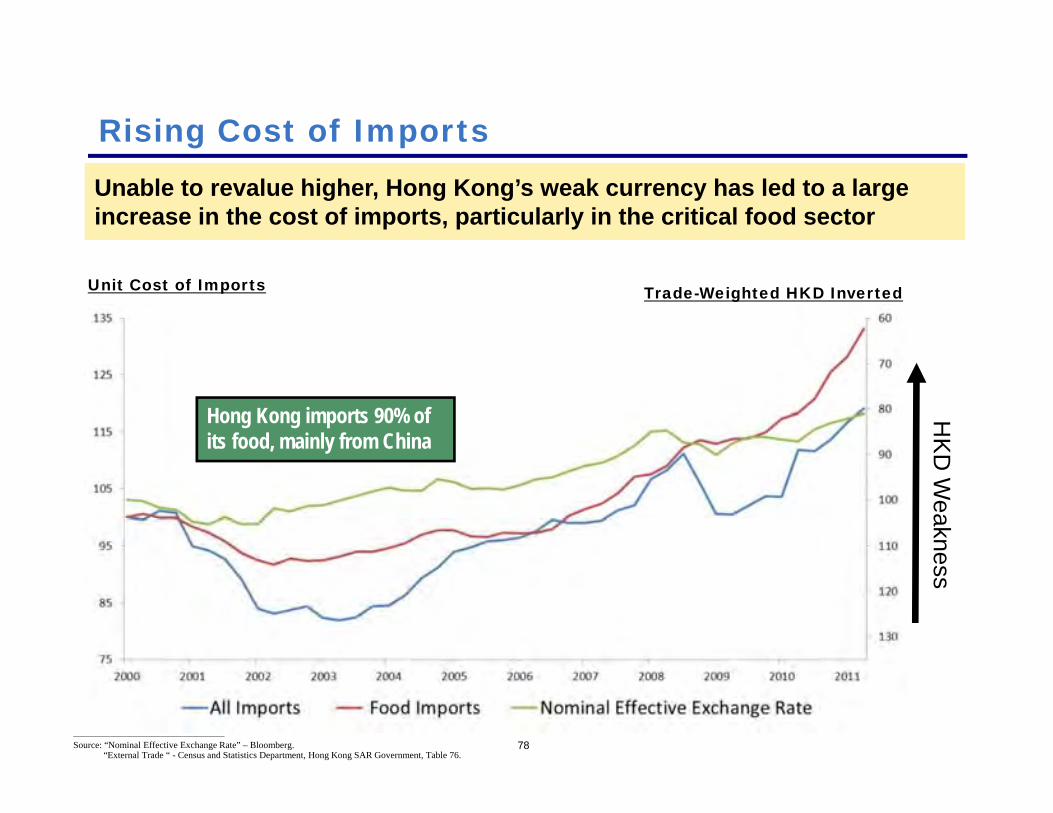
Unable to revalue higher, Hong Kong’s weak currency has led to a large increase in the cost of imports, particularly in the critical food sectorUnable to revalue higher, Hong Kong’s weak currency has led to a large increase in the cost of imports, particularly in the critical food sector
78
Rising Cost of Imports
Unit Cost of Imports
Hong Kong imports 90% of its food, mainly from China
HK
D W
eakness
Trade-Weighted HKD Inverted
________________________________________________
Source: “Nominal Effective Exchange Rate” – Bloomberg.“External Trade “ - Census and Statistics Department, Hong Kong SAR Government, Table 76.

Partly attracted to HK by the cheap HKD, visitors from the Mainland are flocking to HK, pressuring local prices upwardPartly attracted to HK by the cheap HKD, visitors from the Mainland are flocking to HK, pressuring local prices upward
79
Mainland Tourists Flocking to HK
Mainland visitors (% YoY)
Mainland visits in 2011 is on pace for ~27mm, ~4x the population of HK
________________________________________________
Source: “Half - Yearly Economic Report” - Hong Kong SAR Government, p.111 (http://www.hkeconomy.gov.hk/en/pdf/er_11q2.pdf).
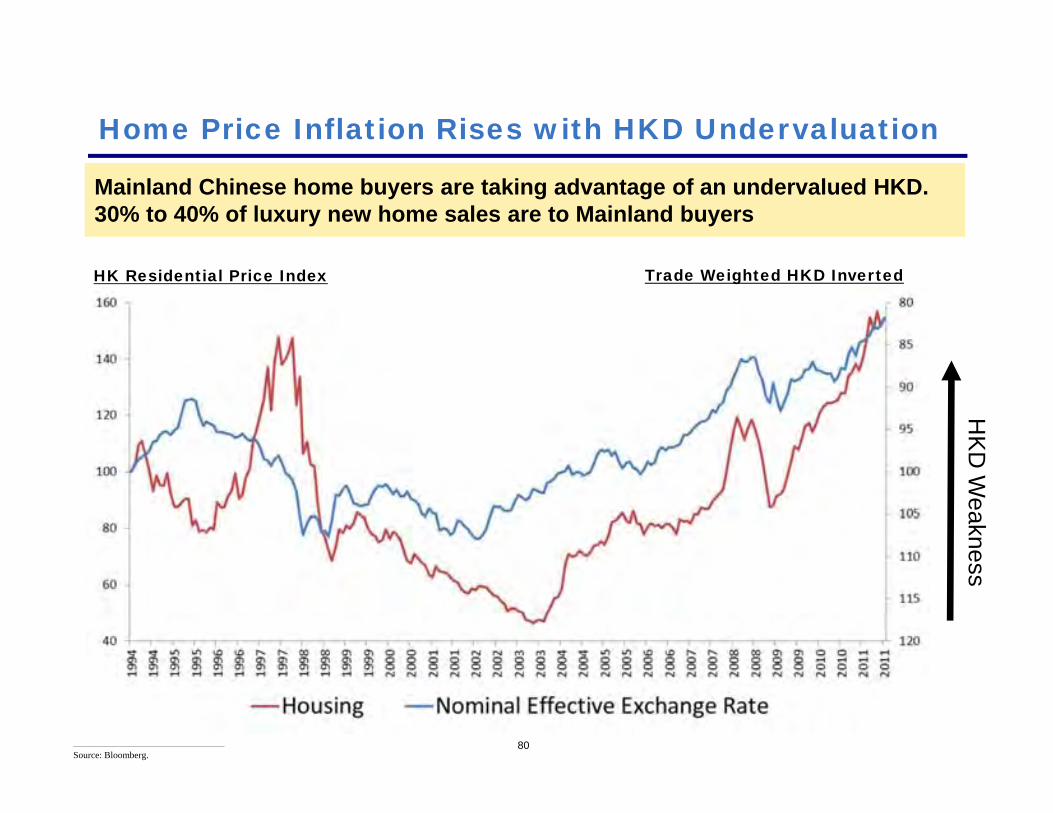
80
HK Residential Price Index
Mainland Chinese home buyers are taking advantage of an undervalued HKD. 30% to 40% of luxury new home sales are to Mainland buyers Mainland Chinese home buyers are taking advantage of an undervalued HKD. 30% to 40% of luxury new home sales are to Mainland buyers
Home Price Inflation Rises with HKD Undervaluation
Trade Weighted HKD Inverted
HK
D W
eakness
________________________________________________
Source: Bloomberg.

Consumer Price Inflation Rises with HKD Undervaluation
81
Underlying CPI Index (YoY)
There is a direct correlation between weak HKD and HK inflationThere is a direct correlation between weak HKD and HK inflation
Trade Weighted HKD Inverted
HK
D W
eakness
________________________________________________
Source: Bloomberg.“Monthly Report on the Consumer Price Index” - Census and Statistics Department, Hong Kong SAR Government, Underlying Inflation .

HK’s Inflation Problem Will Likely Get Worse
82
Near zero US short-term interest rates for two years or more
Despite high inflation, the HKD is still undervalued by ~30%
HKD’s undervaluation will only worsen as the RMB appreciates
Broad money supply (M2) has not yet grown to reflect the full impact of the massive 2008/2009 Monetary Base expansion
Undervaluation increases the risk that the HKMA will need to print more HKD to keep the currency within the band
The HKMA estimates that HK has no spare resource capacity to absorb further demand growth¹
________________________________________________
Source: ¹ “Half - Yearly Monetary and Financial Stability Report” - Hong Kong Monetary Authority, March 2010, p.33.

83
Emerging-Market Overheating Index
The Economist ranks HK near the top of its list of emerging-markets at risk of overheating The Economist ranks HK near the top of its list of emerging-markets at risk of overheating
Significant Risk of Overheating
Countries were measured across six different economic
indicators of overheating
Inflation
GDP Growth
Employment
Credit
Interest
Current Account
________________________________________________
Source: “Overheating Emerging Markets: Temperature Gauge” - The Economist (http://www.economist.com/blogs/dailychart/2011/06/overheating-emerging-markets-0).

Growing Social Risks
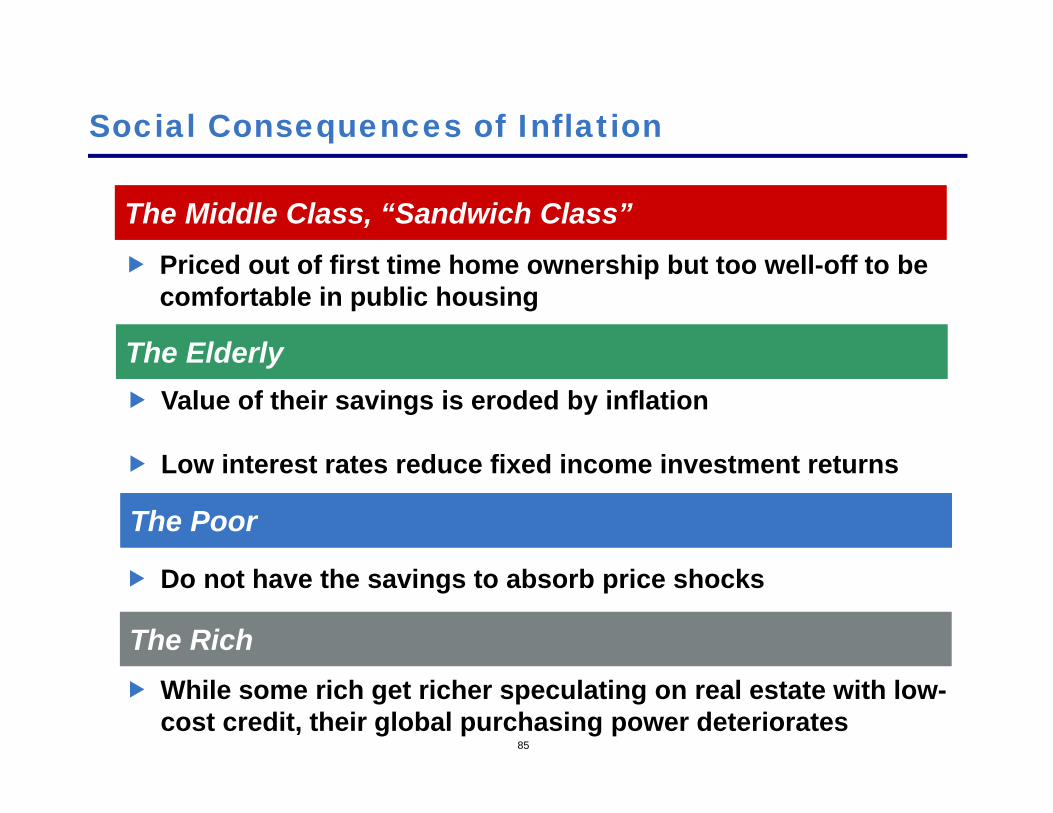
Social Consequences of Inflation
85
The ElderlyThe Elderly
The Poor The Poor
The RichThe Rich
The Middle Class, “Sandwich Class”The Middle Class, “Sandwich Class”
Value of their savings is eroded by inflation
Low interest rates reduce fixed income investment returns
Do not have the savings to absorb price shocks
Priced out of first time home ownership but too well-off to be comfortable in public housing
While some rich get richer speculating on real estate with low-cost credit, their global purchasing power deteriorates

Hong Kong’s Wealth Gap
86________________________________________________
Source: Pictures - Zoe Li, William McCallum, Christopher DeWolf (http://jmsc.hku.hk/hkstories/content/view/659/8786/) and (http://www.lcscapes.com/HK-VerticalHousing/LC-HK_VerticalHousing.html).
Hong Kong’s rich-poor gap is Asia’s widest according to UN dataHong Kong’s rich-poor gap is Asia’s widest according to UN data

20.0
25.0
30.0
35.0
40.0
45.0
Japan
Norw
ay
Czech
Republic
Germ
any
France
Sw
itzerland
Australia
United
Kingdom
Italy New
Zealand
United
States
Hong K
ongBeijing Has Taken Notice of HK’s Inequality
87
In 2009, Chinese Premier Wen Jiabao called on the Chief Executive of Hong Kong to address “deep rooted contradictions in Hong Kong” in reference to Hong Kong’s persistent and troubling wealth gap.
In 2009, Chinese Premier Wen Jiabao called on the Chief Executive of Hong Kong to address “deep rooted contradictions in Hong Kong” in reference to Hong Kong’s persistent and troubling wealth gap.
More Inequality
Gini Coefficient (2007)
The Gini Coefficient is a Measure of Wealth Inequality
________________________________________________
Source: “Human Development Report 2009” - United Nation Development Programme, p.195 (http://hdr.undp.org/en/contacts/about/undp/).

Flat Real Wages
88
Gains from economic growth have not been evenly spread. Average wages have been flat for many years despite very low unemployment and strong productivity growth
Gains from economic growth have not been evenly spread. Average wages have been flat for many years despite very low unemployment and strong productivity growth
Real Wages in Hong Kong – Indexed to 2003 = 100
________________________________________________
Source: “Real Wages” - Bloomberg.“Census and Statistics Department” Hong Kong SAR Government, Productivity Index, table 103.

Housing Affordability is Squeezing the Middle Class
89
HK is one of the least affordable places in the world. With the home ownership rate at only ~53%, home price appreciation only benefits a small percentage of the population
HK is one of the least affordable places in the world. With the home ownership rate at only ~53%, home price appreciation only benefits a small percentage of the population
Housing Affordability Index – (Median Home Price/Median Annual Household Income)
0
2
4
6
8
10
12
Hon
g K
ong
Syd
ney
Van
couv
er
Hon
olul
u
San
Fran
cisc
o
Lond
on
San
Die
go
New
Yor
k
Los
Ang
eles
Mon
treal
Toro
nto
NYC Housing is nearly twice as Affordable as
Hong Kong’s
________________________________________________
Source: “7th Annual Demographic International Housing Affordability Survey: 2011” - Performance Urban Planning, p.10.

Apartment Rents Are Among the Highest in the World
90
World’s 20 most expensive locations to rent a two bedroom apartment
In 2010, Hong Kong was the third most expensive market for two bedroom rental apartments, up from ninth place in 2009In 2010, Hong Kong was the third most expensive market for two bedroom rental apartments, up from ninth place in 2009
Luxury rents in Hong Kong are up 23% YoY
________________________________________________
Source: “15% Rental Increase Makes Singapore 5th Most Expensive Locations Globally” - ECA International (http://www.eca-international.com/news/press_releases/show_press_release?ArticleID=7309).

91
“Housing is of course a social and an economic issue. However, if dealt with inappropriately, it will also become a political issue.”
-Wang GuangyaDirector of Hong Kong and Macau Affairs Office of the State Council of the People’s Republic of China
“Housing is of course a social and an economic issue. However, if dealt with inappropriately, it will also become a political issue.”
-Wang GuangyaDirector of Hong Kong and Macau Affairs Office of the State Council of the People’s Republic of China
A high-level Beijing official has expressed concern that the housing situation may become politically destabilizing:
________________________________________________
Source: “Wang Guangya Talking About Housing Market When Visiting HK: Housing Issues May Become a Political Issue if Inappropriately Deal With” – June 15, 2011 (translation).
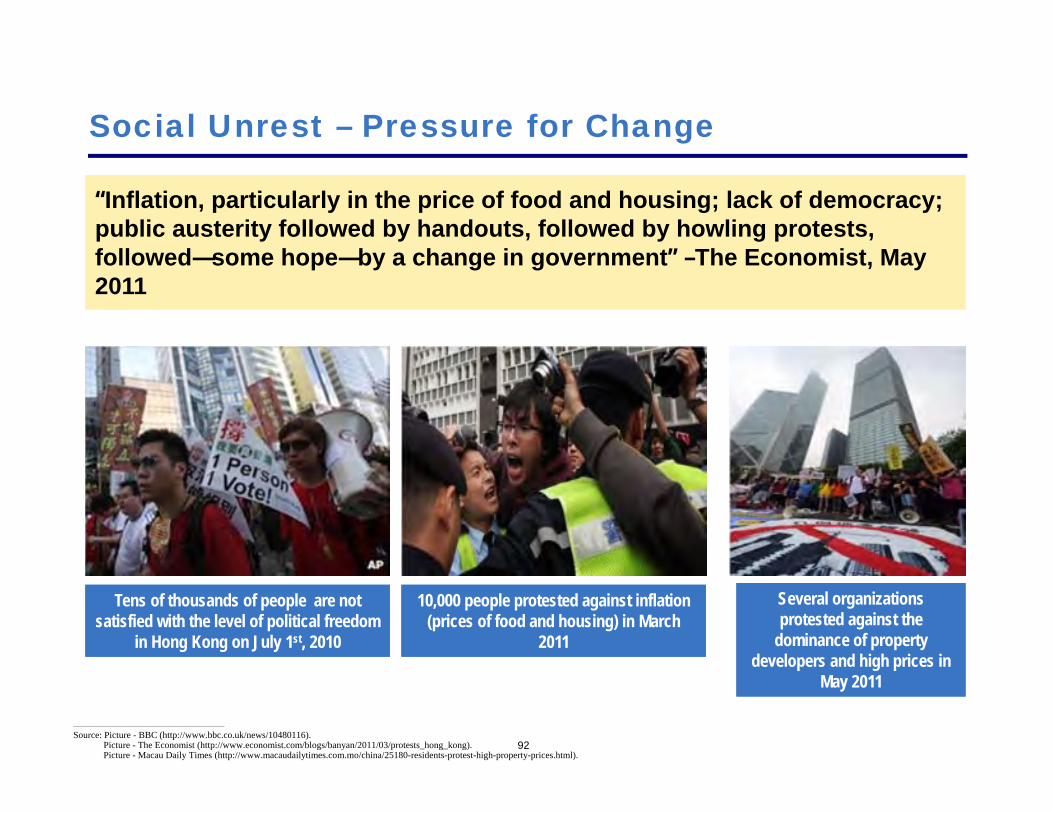
92
Social Unrest – Pressure for Change
“Inflation, particularly in the price of food and housing; lack of democracy; public austerity followed by handouts, followed by howling protests, followed—some hope—by a change in government” –The Economist, May 2011
“Inflation, particularly in the price of food and housing; lack of democracy; public austerity followed by handouts, followed by howling protests, followed—some hope—by a change in government” –The Economist, May 2011
Tens of thousands of people are not satisfied with the level of political freedom
in Hong Kong on July 1st, 2010
Tens of thousands of people are not satisfied with the level of political freedom
in Hong Kong on July 1st, 2010
10,000 people protested against inflation (prices of food and housing) in March
2011
10,000 people protested against inflation (prices of food and housing) in March
2011
Several organizations protested against the
dominance of property developers and high prices in
May 2011
Several organizations protested against the
dominance of property developers and high prices in
May 2011
________________________________________________
Source: Picture - BBC (http://www.bbc.co.uk/news/10480116).Picture - The Economist (http://www.economist.com/blogs/banyan/2011/03/protests_hong_kong).Picture - Macau Daily Times (http://www.macaudailytimes.com.mo/china/25180-residents-protest-high-property-prices.html).

More…Social Unrest
93
This year, 218,000 people, the most since the massive 2003 civil liberty protests, marched in Hong Kong's annual July 1st rallyThis year, 218,000 people, the most since the massive 2003 civil liberty protests, marched in Hong Kong's annual July 1st rally
“They aren’t happy with the fact that they do not see an improvement in living standards, despite the good economic statistics.” – Bloomberg July 1st , 2011
“They aren’t happy with the fact that they do not see an improvement in living standards, despite the good economic statistics.” – Bloomberg July 1st , 2011
________________________________________________
Source: Pictures - Seattle Pi (http://www.seattlepi.com/news/article/Marchers-vent-anger-on-Hong-Kong-prices-policies-1448544.php).
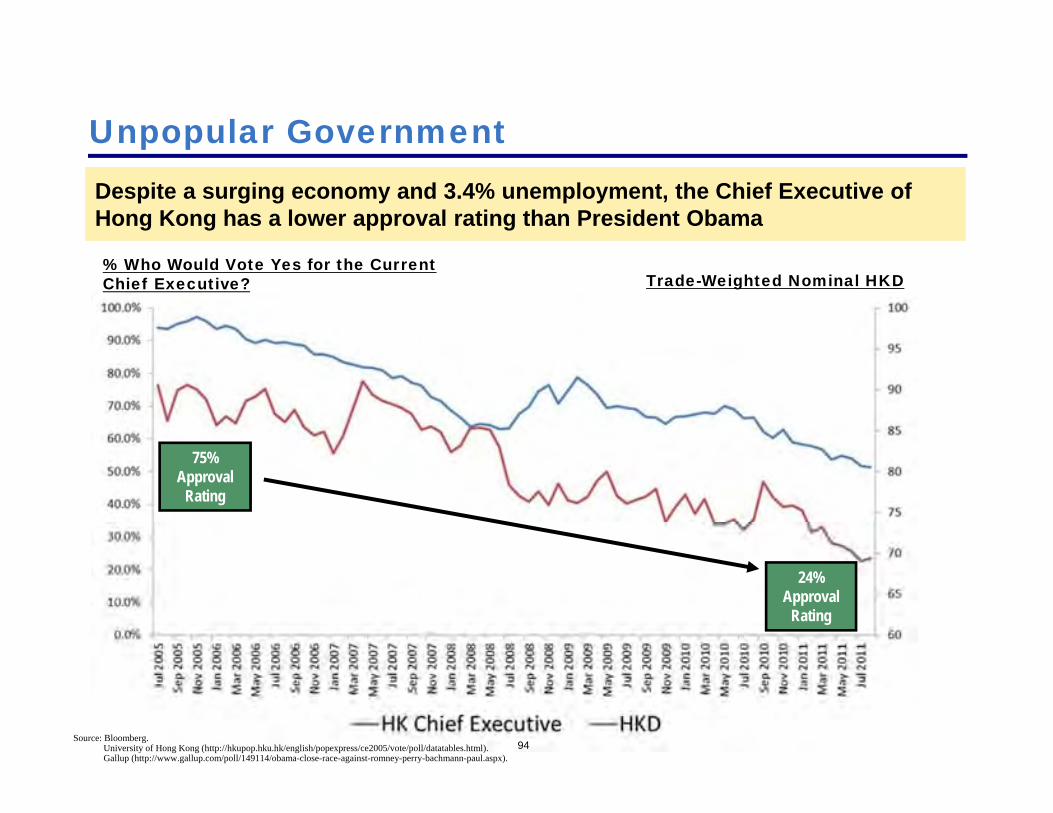
Unpopular Government
94
Despite a surging economy and 3.4% unemployment, the Chief Executive of Hong Kong has a lower approval rating than President ObamaDespite a surging economy and 3.4% unemployment, the Chief Executive of Hong Kong has a lower approval rating than President Obama
Source: Bloomberg.University of Hong Kong (http://hkupop.hku.hk/english/popexpress/ce2005/vote/poll/datatables.html). Gallup (http://www.gallup.com/poll/149114/obama-close-race-against-romney-perry-bachmann-paul.aspx).
% Who Would Vote Yes for the Current Chief Executive?
24% Approval
Rating
75% Approval
Rating
Trade-Weighted Nominal HKD

95
The Call for Change is Growing Louder
Major business publications, prominent investors, local politicians, and economists have all recently questioned the suitability of the pegMajor business publications, prominent investors, local politicians, and economists have all recently questioned the suitability of the peg
“Hong Kong Faces Heat on Dollar Peg”– Financial Times, November 2010“Hong Kong Faces Heat on Dollar Peg”– Financial Times, November 2010
Recent Headlines
“Hong Kong Should End Peg to U.S. Dollar, Deutsche Bank Says” –Bloomberg, November 2010
“Hong Kong Should End Peg to U.S. Dollar, Deutsche Bank Says” –Bloomberg, November 2010
“The Peg will be History” – The Standard, January 2010“The Peg will be History” – The Standard, January 2010
________________________________________________
Source: Picture - Hong Kong Business (http://hongkongbusiness.hk/).

96
“A link to a basket of currencies or ‘no link at all’ is ‘more desirable’”¹– Marc Faber – March 2011“A link to a basket of currencies or ‘no link at all’ is ‘more desirable’”¹– Marc Faber – March 2011
“Continuous appreciation of the Renminbi means diminishing purchasing power of the Hong Kong dollar…The problem cannot be tackled unless we abolish the linked rate in Hong Kong.”²– The Honourable Chan Kin-Por, Legislative Council Member & Chief Executive of Munich Re Hong Kong – January 2011
“Continuous appreciation of the Renminbi means diminishing purchasing power of the Hong Kong dollar…The problem cannot be tackled unless we abolish the linked rate in Hong Kong.”²– The Honourable Chan Kin-Por, Legislative Council Member & Chief Executive of Munich Re Hong Kong – January 2011
“I think it’s a case of a frog boiling in water…It could happen sooner than people think given the rapid rise in circulation of the currency [RMB]”³ – Peter Redward, Barclays Economist – October 2010
“I think it’s a case of a frog boiling in water…It could happen sooner than people think given the rapid rise in circulation of the currency [RMB]”³ – Peter Redward, Barclays Economist – October 2010
“The merits of reform are high and the cost of the relevant option is low.”4 – James Grant – May 2011“The merits of reform are high and the cost of the relevant option is low.”4 – James Grant – May 2011
InvestorInvestor
AnalystAnalyst
EconomistEconomist
PoliticianPolitician
Diverse Voices are Calling for Change
Source: ¹“It’s time to end the HK$ peg” - Hong Kong Business, March 10, 2011. ² Legislative Council Transcript of January 6, 2011 meeting.³“Hong Kong May have to revalue in 2 years, Barclays says” - Bloomberg Businessweek, October 26, 2010. 4 Grant’s Interest Rate Observer, May 2011.

Fiscal and Regulatory Measures Have Been Inadequate
Housing – Efforts have failed to reduce prices meaningfully
LTV caps on new mortgages
Transaction tax on homes sold soon after purchase
Home Supply – Increased land sales
Introduction of a Minimum Wage
Rent Relief
Utility Subsidy
Cash Handouts
HK has implemented a series of unsuccessful “macro-prudential” reforms to deal with its inflation and wealth gap problems. These efforts do not address the underlying cause of the problems and in some cases are actually inflationary (e.g. cash handouts)
HK has implemented a series of unsuccessful “macro-prudential” reforms to deal with its inflation and wealth gap problems. These efforts do not address the underlying cause of the problems and in some cases are actually inflationary (e.g. cash handouts)
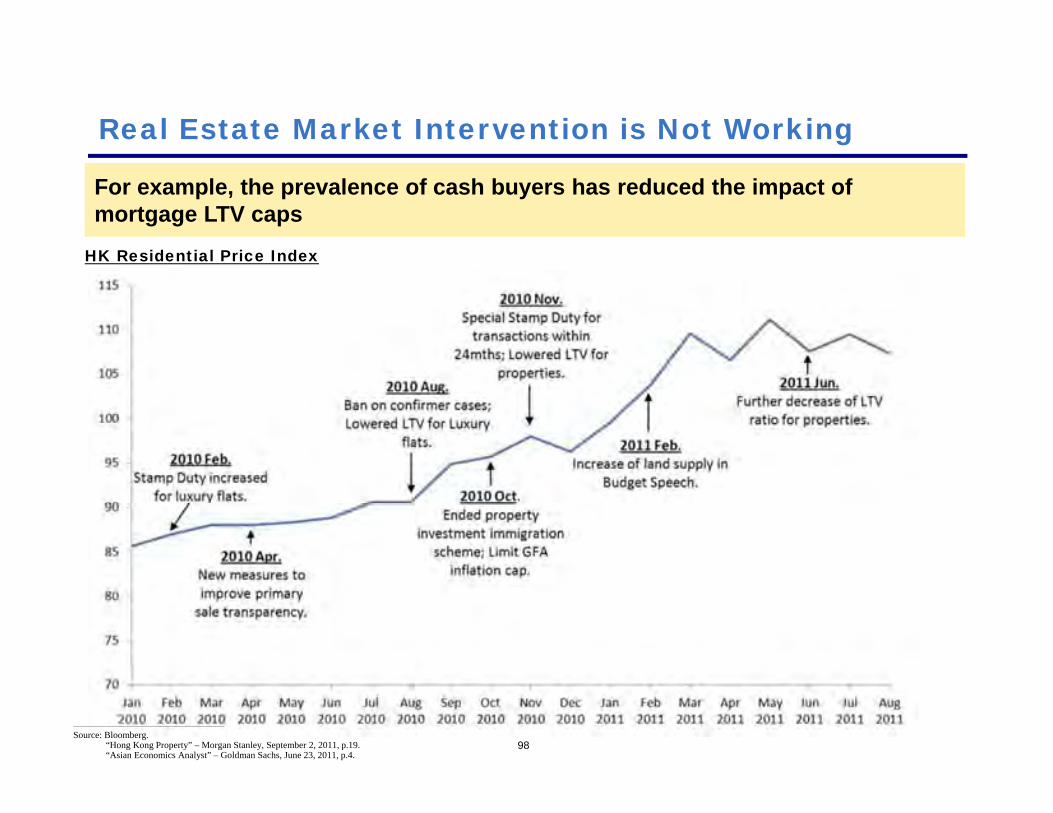
98
HK Residential Price Index
For example, the prevalence of cash buyers has reduced the impact of mortgage LTV capsFor example, the prevalence of cash buyers has reduced the impact of mortgage LTV caps
Real Estate Market Intervention is Not Working
________________________________________________
Source: Bloomberg.“Hong Kong Property” – Morgan Stanley, September 2, 2011, p.19.“Asian Economics Analyst” – Goldman Sachs, June 23, 2011, p.4.

IV. Our Prediction of What is Likely to Happen

Reminder
100
The history demonstrates that Hong Kong has modified its exchange rate system to address major economic changesThe history demonstrates that Hong Kong has modified its exchange rate system to address major economic changes
Sterling PegSterling Peg Dollar PegDollar Peg
HKD/USD (inverted)
Free Floating Free Floating
HK
D S
treng
th
’98 W
eak S
ide
Com
mitm
ent
’98 W
eak S
ide
Com
mitm
ent
’05 S
trong
Sid
e Co
mm
itmen
t’05
Stro
ng S
ide
Com
mitm
ent
________________________________________________
Source: “Hong Kong’s Linked Exchange Rate System” – Hong Kong Monetary Authority, p.34 (http://www.info.gov.hk/hkma/eng/public/hkmalin/index.htm).
7.75 to 7.85 Band7.75 to 7.85 Band

101
The only effective way to mitigate inflation and a potential real estate bubble is to allow the HKD to appreciateThe only effective way to mitigate inflation and a potential real estate bubble is to allow the HKD to appreciate
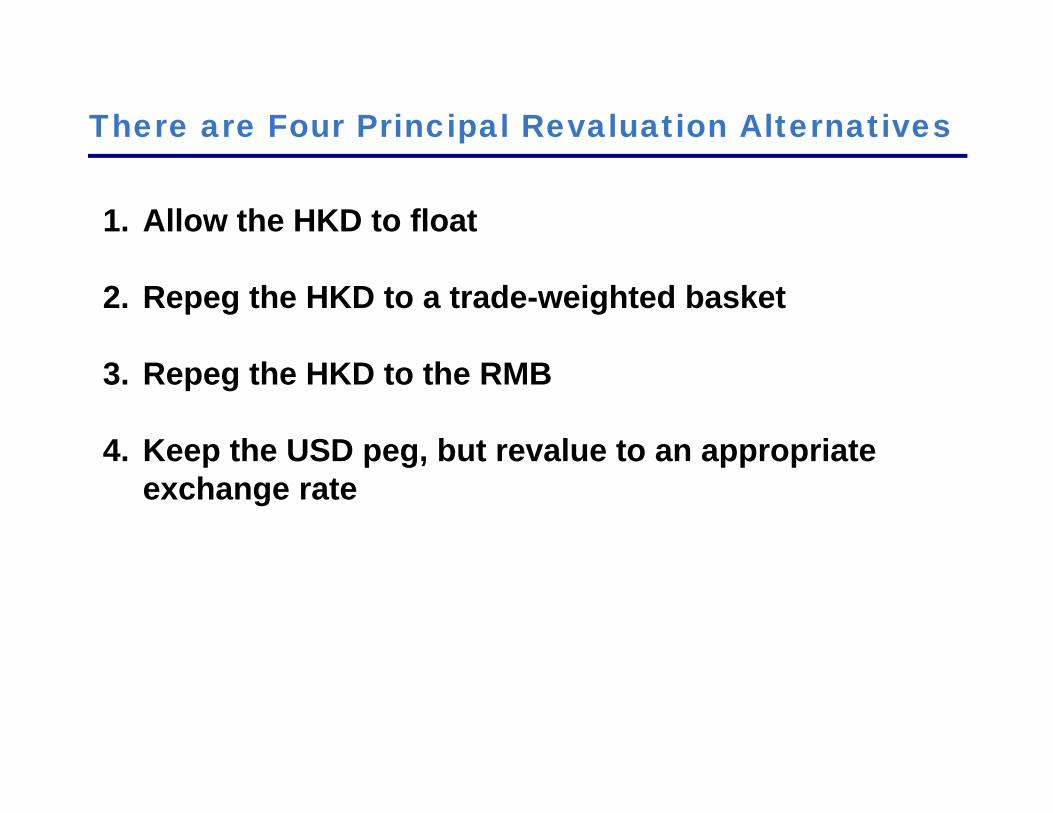
There are Four Principal Revaluation Alternatives
1. Allow the HKD to float
2. Repeg the HKD to a trade-weighted basket
3. Repeg the HKD to the RMB
4. Keep the USD peg, but revalue to an appropriate exchange rate
103
Alternative One – Float
Full monetary independence The exchange rate would absorb economic shocks
Large trade flows make it difficult for the monetary authority to manage money supplyA floating exchange rate could be volatileHK had a bad experience when it allowed its currency to float between 1974 and 1983
Cons:
Pros:
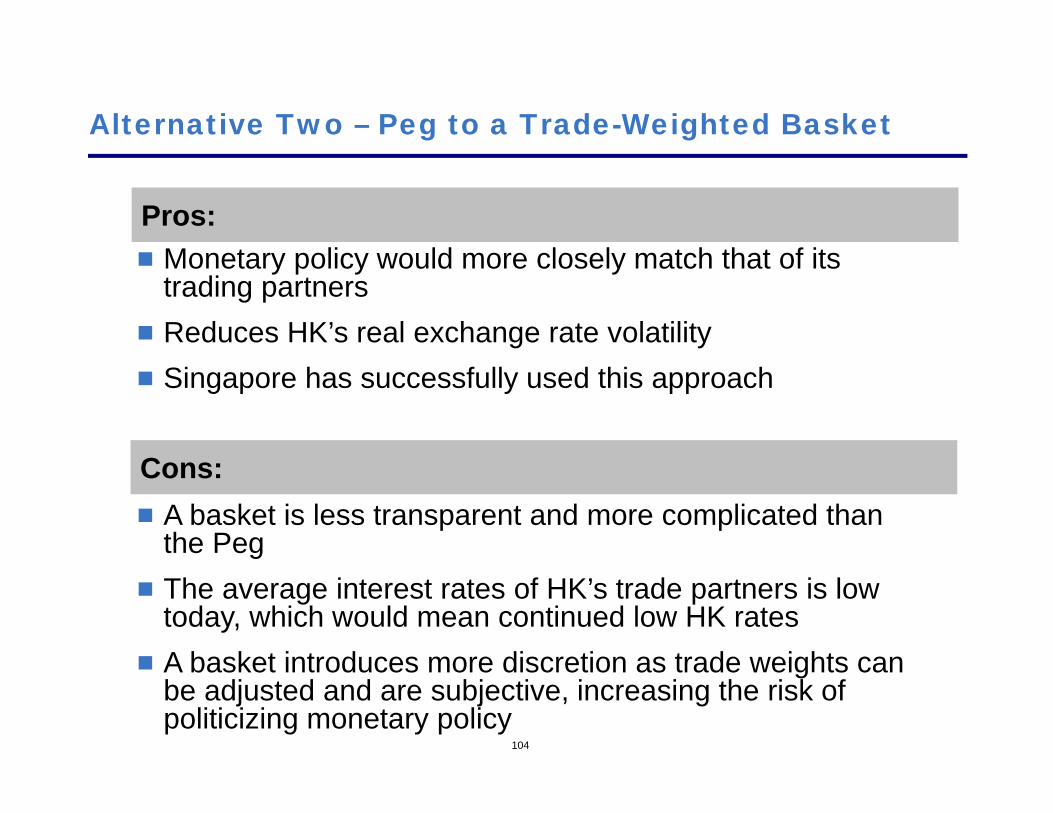
104
Alternative Two – Peg to a Trade-Weighted Basket
Monetary policy would more closely match that of its trading partnersReduces HK’s real exchange rate volatilitySingapore has successfully used this approach
A basket is less transparent and more complicated than the PegThe average interest rates of HK’s trade partners is low today, which would mean continued low HK ratesA basket introduces more discretion as trade weights can be adjusted and are subjective, increasing the risk of politicizing monetary policy
Cons:
Pros:

Alt. Three – A Direct or Basket RMB Link is Inevitable
HK’s deepening economic ties with the Mainland make a direct or basket RMB link the widely understood best long-term solution to solving the pressures of the USD link
While the HKMA has said that it does not support an RMB link now, it has laid out preconditions, which we believe will likely be met in the coming years
The biggest impediment to an RMB peg today is the lack of capital account convertibility of the RMB
But we believe full capital account convertibility is inevitable and coming soon…But we believe full capital account convertibility is inevitable and coming soon…

106
“I should say it is quite possible for China to realise yuan convertibility by 2015.”
– Li Daokui, People’s Bank of China (PBOC) Monetary Policy Committee, September 2011
“I should say it is quite possible for China to realise yuan convertibility by 2015.”
– Li Daokui, People’s Bank of China (PBOC) Monetary Policy Committee, September 2011
________________________________________________
Source: “Yuan Will Be Fully Convertible by 2015, Chinese Officials Tell EU Chamber” – Bloomberg, September 8, 2011 (http://www.bloomberg.com/news/2011-09-08/yuan-to-be-fully-convertible-by-2015-eu-chamber.html).“China Yuan Likely Convertible by 2015” – Thompson Reuters – September 9, 2011.
The RMB is rapidly internationalizing in the current account and full convertibility is possible by 2015:

107
The extremely divergent economic characteristics of HK and the US make the status quo unsustainable, destructive, and a distortion to the HK economy
The extremely divergent economic characteristics of HK and the US make the status quo unsustainable, destructive, and a distortion to the HK economy
The HKD will likely be pegged to the RMB or to an RMB-led basket within the coming years. All that is needed is an interim solution…
The HKD will likely be pegged to the RMB or to an RMB-led basket within the coming years. All that is needed is an interim solution…

108
We believe the HK government will repeg the HKD at a stronger exchange rate to the USD while leaving the LERS intact
We believe the HK government will repeg the HKD at a stronger exchange rate to the USD while leaving the LERS intact
Contemporaneous with this revaluation, we believe the HKMA may indicate that the HKD will eventually be pegged to the RMB or to an RMB-led basket when the RMB is fully convertible
Contemporaneous with this revaluation, we believe the HKMA may indicate that the HKD will eventually be pegged to the RMB or to an RMB-led basket when the RMB is fully convertible

Why Does This Make Sense?
The current LERS is simple, transparent, and credible so a continuation of the current system makes sense
A revaluation can be achieved quickly
Only an interim solution is needed because the RMB will be convertible in coming years
No other interim change will be necessary

110
How much should the HKD be allowed to appreciate?How much should the HKD be allowed to appreciate?

Considerations
The exchange rate should be adjusted sufficiently to quell speculation about further appreciation
But not so much that the currency would become overvalued
A wider trading band could be introduced to provide greater flexibility in a volatile world
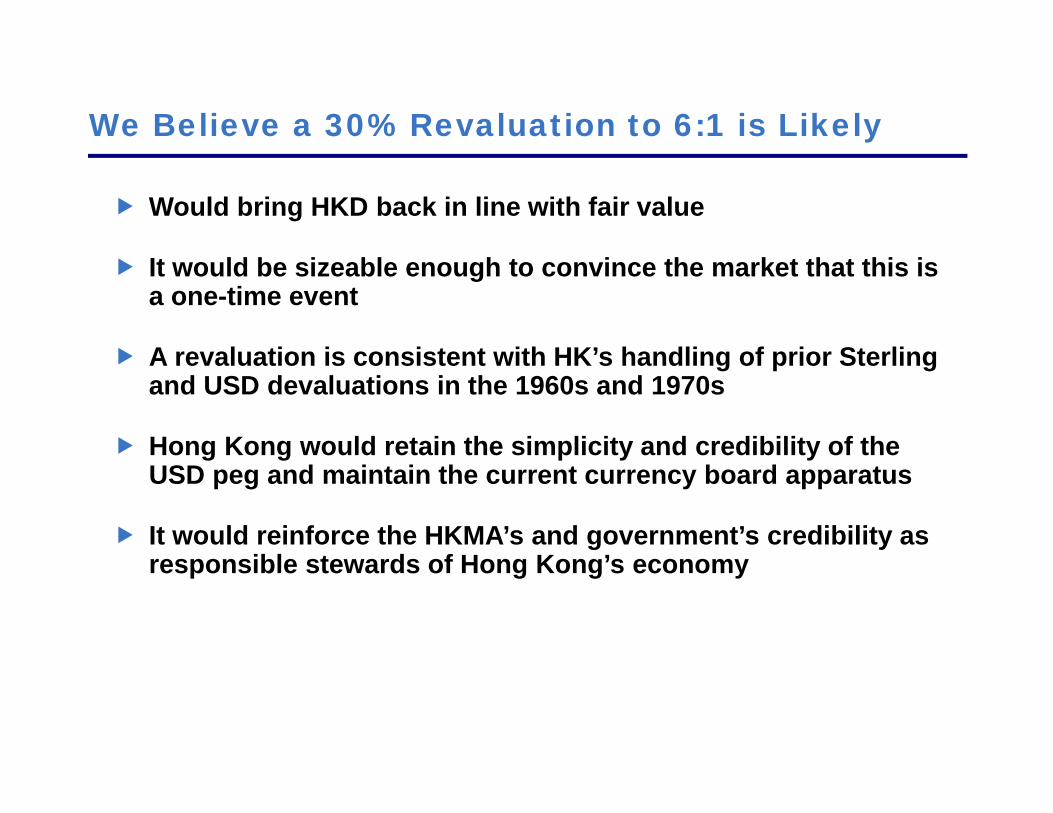
We Believe a 30% Revaluation to 6:1 is Likely
Would bring HKD back in line with fair value
It would be sizeable enough to convince the market that this is a one-time event
A revaluation is consistent with HK’s handling of prior Sterling and USD devaluations in the 1960s and 1970s
Hong Kong would retain the simplicity and credibility of the USD peg and maintain the current currency board apparatus
It would reinforce the HKMA’s and government’s credibility as responsible stewards of Hong Kong’s economy

Revaluation: How are Stakeholders Affected?
Citizens: The purchasing power of savings would instantly rise
The cost of food imports (~30% of the poorest half’s spending)¹ would drop immediately
Real estate appreciation would moderate and rents should stabilize over time
The Banks: HKMA data show that banks would not suffer large FX or loan losses on a revaluation²
The HKMA:Has sufficient foreign reserves to ensure that the Monetary Base is covered
Mainland China: A revaluation could be seen as evidence that HK is addressing its social divide and political tensions
________________________________________________
Source: ¹ “Half-yearly Hong Kong Economic Report 2011” – Hong Kong SAR Government, p. 97. ² “Foreign Currency Position” and “Asset Quality of Retail Banks” – Hong Kong Monetary Authority (http://www.info.gov.hk/hkma/eng/statistics/msb/index.htm).

V. Investment Opportunity

Three Ways to Make Money
Buy HKD Outright
Buy HKD with USD Leverage
Buy HKD Call Options

Buy HKD Outright
The HKMA’s commitment to support HKD at 7.85 HKD/USD limits the downside to owning HKD to ~1%, making the HKD effectively a one-way bet
The HKMA’s 7.85 HKD/USD defense is credible:
The HKD is materially undervalued
HK has substantial international reserves, at ~2.2x the Monetary Base
The HKMA’s successful defense of the HKD during the Asian Financial Crisis makes its credibility unquestioned

117
Purchase HKD with USD Leverage
Similar short-term interest rates and the HKMA’s pledge to support HKD at 7.85, means investors can cheaply and safely purchase HKD on USD leverage
Similar short-term interest rates and the HKMA’s pledge to support HKD at 7.85, means investors can cheaply and safely purchase HKD on USD leverage
Reflects the cost of financing for a bank. Institutional and individual investors will pay a
higher rate (~35bps more)
12-Month %Total Return (from 7.80)Leverage:
(Notional/Equity) 7.85
(Weak Side) 6.24
(25% Reval) 5.78
(35% Reval)4.0x -3% 100% 140%6.0x -5% 149% 209%8.0x -6% 199% 279%
10.0x -8% 249% 349%12.0x -9% 298% 418%14.0x -11% 348% 488%16.0x -12% 398% 558%18.0x -14% 447% 627%20.0x -16% 497% 697%
12 Month Financing Cost (Fixed)HIBOR 0.67%LIBOR 0.82%Carry -0.15%

118
HKD Call Options
HKD call options are extremely cheapHKD call options are extremely cheap
USD received = value of HKD purchased at strike price converted back at spot (6.00)
________________________________________________
Source: Indicative broker quote September 8, 2011.
Option TermsNotional 1,000,000,000$ 1,000,000,000$ 1,000,000,000$ Strike (HKD/USD rate) 7.80 7.50 7.00 Premium (% of notional) 0.83% 0.57% 0.27%Premium Dollars (USD) 8,300,000$ 5,650,000$ 2,700,000$
Payouts at Exercise (Revaluation to 6.00, +30%)USD Received 1,300,000,000$ 1,250,000,000$ 1,166,666,667$ USD Spent (notional) 1,000,000,000 1,000,000,000 1,000,000,000 Payoff 300,000,000$ 250,000,000$ 166,666,667$
Payoff/Premium 36x 44x 62x

.0x
10.0x
20.0x
30.0x
40.0x
50.0x
60.0x
70.0x
10% 15% 20% 25% 30% 35% 40%
119
HKD Call Options are Cheap
The HKD options market implies that the probability of a revaluation is extremely remote. We think a ~30% revaluation is likely, giving investors a ~44x payout on one-year 7.50 strike options
The HKD options market implies that the probability of a revaluation is extremely remote. We think a ~30% revaluation is likely, giving investors a ~44x payout on one-year 7.50 strike options
Payout as Multiple of Premium
% Revaluation% Revaluation
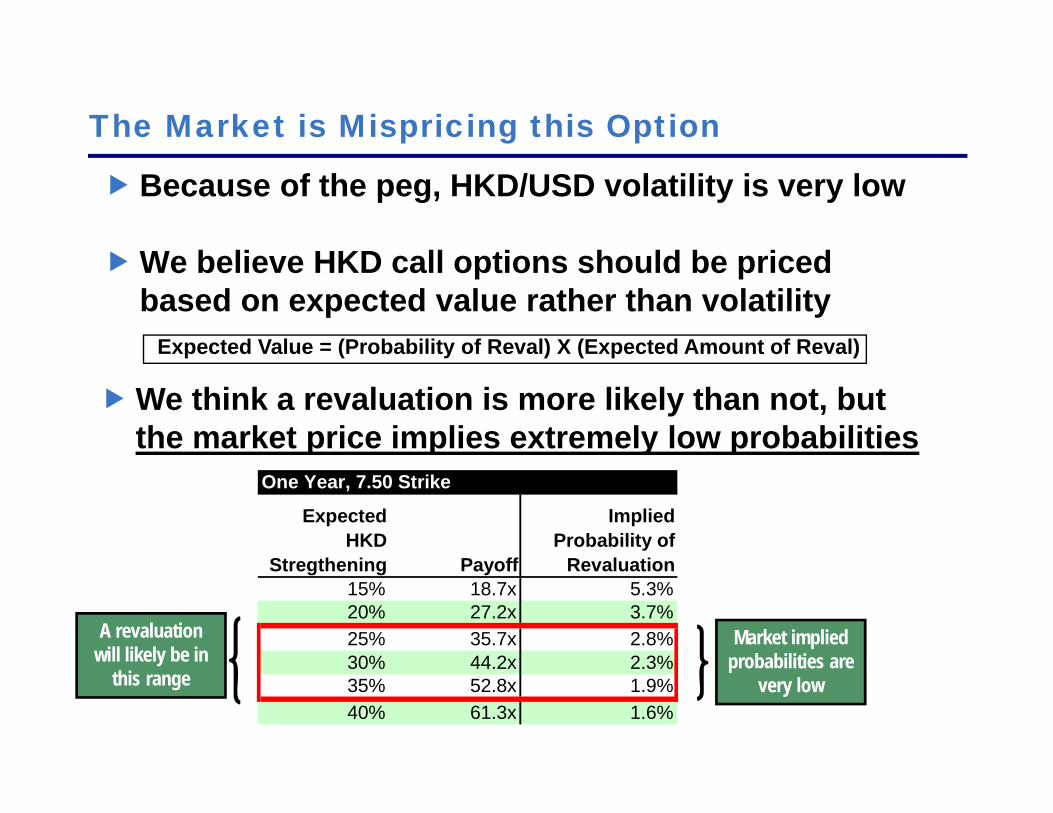
The Market is Mispricing this Option
Because of the peg, HKD/USD volatility is very low
We believe HKD call options should be priced based on expected value rather than volatility
We think a revaluation is more likely than not, but the market price implies extremely low probabilities
A revaluation will likely be in
this range
Market implied probabilities are
very low
One Year, 7.50 Strike
Expected HKD
Stregthening Payoff
Implied Probability of
Revaluation15% 18.7x 5.3%20% 27.2x 3.7%25% 35.7x 2.8%30% 44.2x 2.3%35% 52.8x 1.9%40% 61.3x 1.6%
Expected Value = (Probability of Reval) X (Expected Amount of Reval)

121
A falling USD puts more pressure on HK authorities to actA falling USD puts more pressure on HK authorities to act
The HKD is a cheap hedge against a weakening USD:

VI. Why Now?
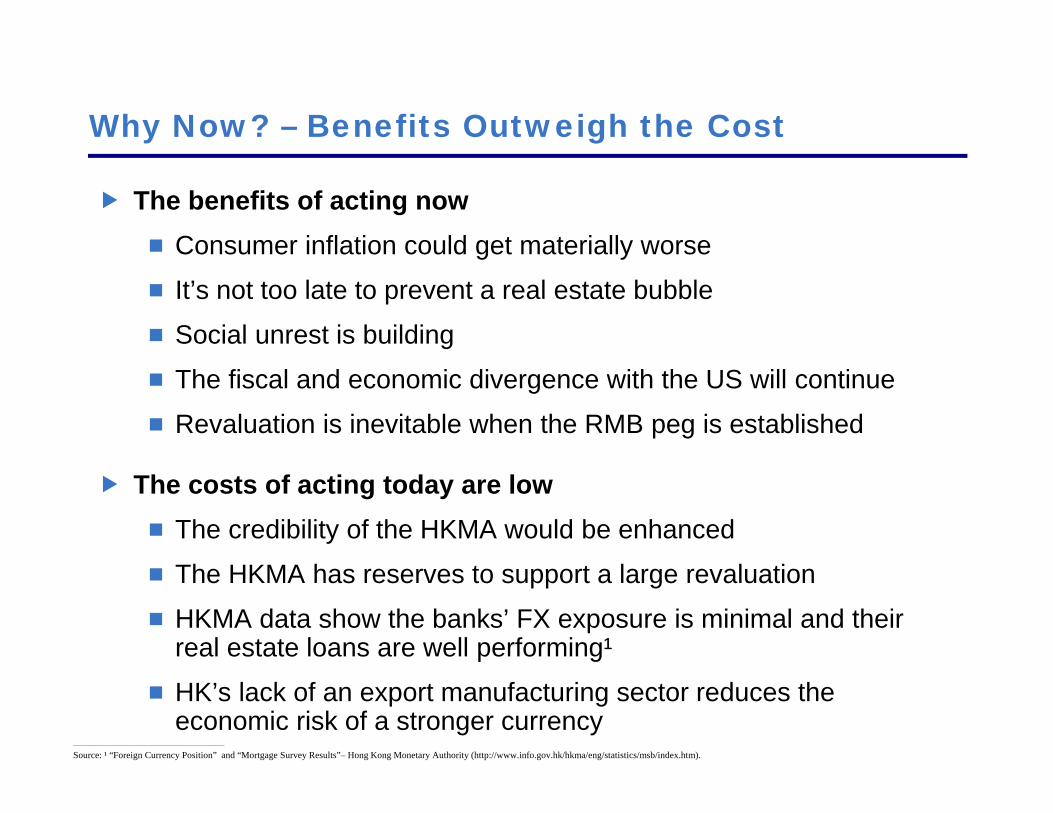
Why Now? – Benefits Outweigh the Cost
The benefits of acting nowConsumer inflation could get materially worse
It’s not too late to prevent a real estate bubble
Social unrest is building
The fiscal and economic divergence with the US will continue
Revaluation is inevitable when the RMB peg is established
The costs of acting today are lowThe credibility of the HKMA would be enhanced
The HKMA has reserves to support a large revaluation
HKMA data show the banks’ FX exposure is minimal and their real estate loans are well performing¹
HK’s lack of an export manufacturing sector reduces the economic risk of a stronger currency
________________________________________________
Source: ¹ “Foreign Currency Position” and “Mortgage Survey Results”– Hong Kong Monetary Authority (http://www.info.gov.hk/hkma/eng/statistics/msb/index.htm).
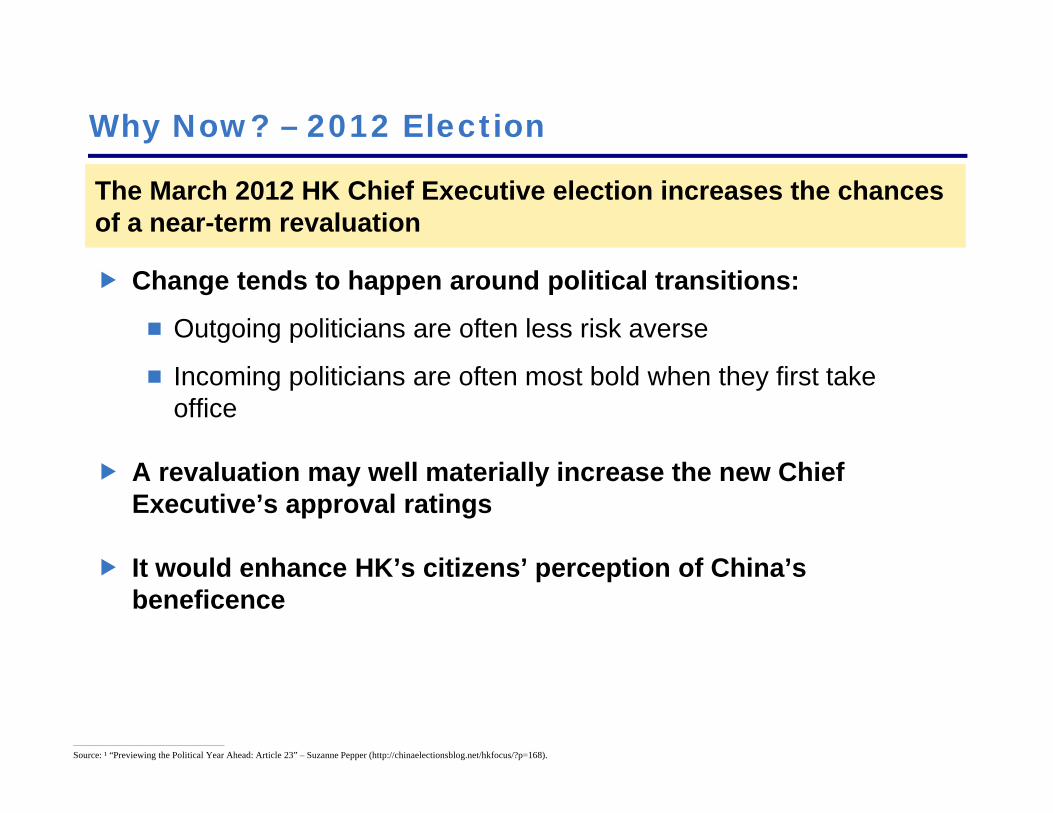
Why Now? – 2012 Election
Change tends to happen around political transitions:
Outgoing politicians are often less risk averse
Incoming politicians are often most bold when they first take office
A revaluation may well materially increase the new Chief Executive’s approval ratings
It would enhance HK’s citizens’ perception of China’s beneficence
The March 2012 HK Chief Executive election increases the chances of a near-term revaluationThe March 2012 HK Chief Executive election increases the chances of a near-term revaluation
________________________________________________
Source: ¹ “Previewing the Political Year Ahead: Article 23” – Suzanne Pepper (http://chinaelectionsblog.net/hkfocus/?p=168).

Revaluing Now Mitigates the Financial Risk to the HKMA
The conventional wisdom is that central banks (CBs) can defend the strong side of their currency without limit by simply printing an unlimited amount of money
The reality is different:
The CB loses money on a revaluation, because a revaluation reduces the value of foreign assets on their balance sheet
Printing money expands and leverages the CB’s balance sheet, making it more costly to revalue
Printing money is highly inflationary
Because the Basic Law requires the HKMA to back its Monetary Base 100% with international reserves, printing money could severely limit the HKMA’s future revaluation options

Revaluing Now Mitigates Financial Risk to the HKMA
Balance Sheet, Dec. 2007 Balance Sheet, July 2011
Pre-InterventionPre-Intervention Post-InterventionPost-Intervention
Leverage: 56%
Leverage: 75%
The HKMA’s 2008/2009 intervention, in response to over HKD $600bn of money flows, greatly increased the size and leverage of its balance sheet
The HKMA’s 2008/2009 intervention, in response to over HKD $600bn of money flows, greatly increased the size and leverage of its balance sheet
________________________________________________
Source: “Monthly Statistical Bulletin – Table 8.2” – Hong Kong Monetary Authority, July 2011 (http://www.info.gov.hk/hkma/eng/statistics/msb/index.htm).

127
We believe it would be imprudent for Hong Kong to print more moneyWe believe it would be imprudent for Hong Kong to print more money

128
1) Reducing inflation and the risk of asset bubbles in HK enhances HK’s status as a stable, economically successful, AAA rated region
1) Reducing inflation and the risk of asset bubbles in HK enhances HK’s status as a stable, economically successful, AAA rated region
2) Allowing the HKD to appreciate only increases the credibility of the HKD as a store of value2) Allowing the HKD to appreciate only increases the credibility of the HKD as a store of value
The principal argument against a revaluation is that it might harm the HKMA’s credibility. We believe this is false for two reasons:
129
Some observers have suggested a revaluation would be inconsistent with the HKMA’s public statementsSome observers have suggested a revaluation would be inconsistent with the HKMA’s public statements

130
“It will be acceptable to indicate eventual possible appreciation in the event of confidence returning to such a degree as to produce unduly rapid monetary expansion, but such an indication must carry complete conviction that the rate would only ever be adjusted in that direction.”
- Internal Hong Kong government policy memo, 1983
However, an upward revaluation was explicitly contemplated in 1983 when the LERS was introduced:
________________________________________________
Source: “Stabilization of the Exchange Rate” (http://www.sktsang.com/ArchiveI/1983.pdf).

131
“Any statement which can be interpreted as hinting at the possibility of depreciating the announced rate would sabotage the scheme from the onset.”
- Hong Kong government policy memo, 1983
“Any statement which can be interpreted as hinting at the possibility of depreciating the announced rate would sabotage the scheme from the onset.”
- Hong Kong government policy memo, 1983
A peg depends on confidence and credibility. Any hint of devaluation would compromise the integrity of the link:
________________________________________________
Source: “Stabilization of the Exchange Rate” (http://www.sktsang.com/ArchiveI/1983.pdf).

132
"The Hong Kong dollar peg has been working well since its adoption in 1983. It's the foundation for the stability of the currency and financial system in Hong Kong so we have no intention to make any change"
– Norman Chan, HKMA Chief – August 2011
"The Hong Kong dollar peg has been working well since its adoption in 1983. It's the foundation for the stability of the currency and financial system in Hong Kong so we have no intention to make any change"
– Norman Chan, HKMA Chief – August 2011
________________________________________________
Sources: “Linked Exchange Rate System” – Hong Kong Monetary Authority, August 2011 (http://www.info.gov.hk/hkma/eng/insight/20110815e.htm).
As such, anytime observers have questioned the link, the HKMA has issued a prompt statement to quell speculation
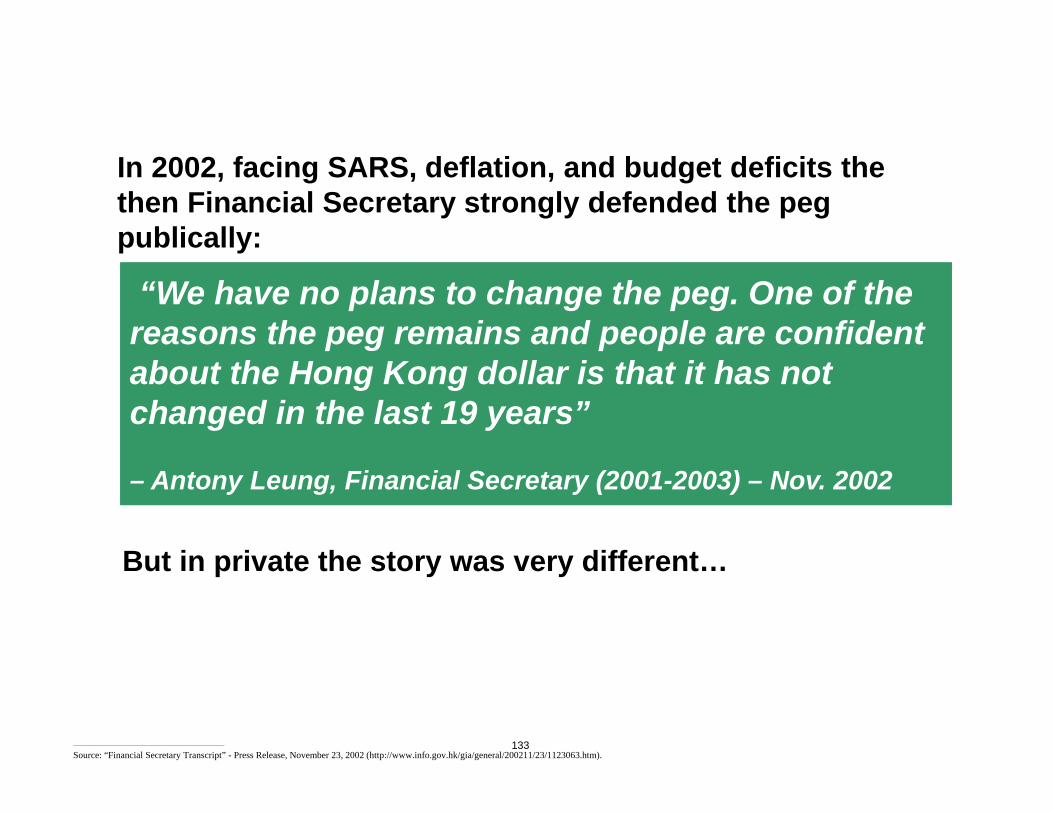
133
“We have no plans to change the peg. One of the reasons the peg remains and people are confident about the Hong Kong dollar is that it has not changed in the last 19 years”
– Antony Leung, Financial Secretary (2001-2003) – Nov. 2002
“We have no plans to change the peg. One of the reasons the peg remains and people are confident about the Hong Kong dollar is that it has not changed in the last 19 years”
– Antony Leung, Financial Secretary (2001-2003) – Nov. 2002
In 2002, facing SARS, deflation, and budget deficits the then Financial Secretary strongly defended the peg publically:
But in private the story was very different…
________________________________________________
Source: “Financial Secretary Transcript” - Press Release, November 23, 2002 (http://www.info.gov.hk/gia/general/200211/23/1123063.htm).
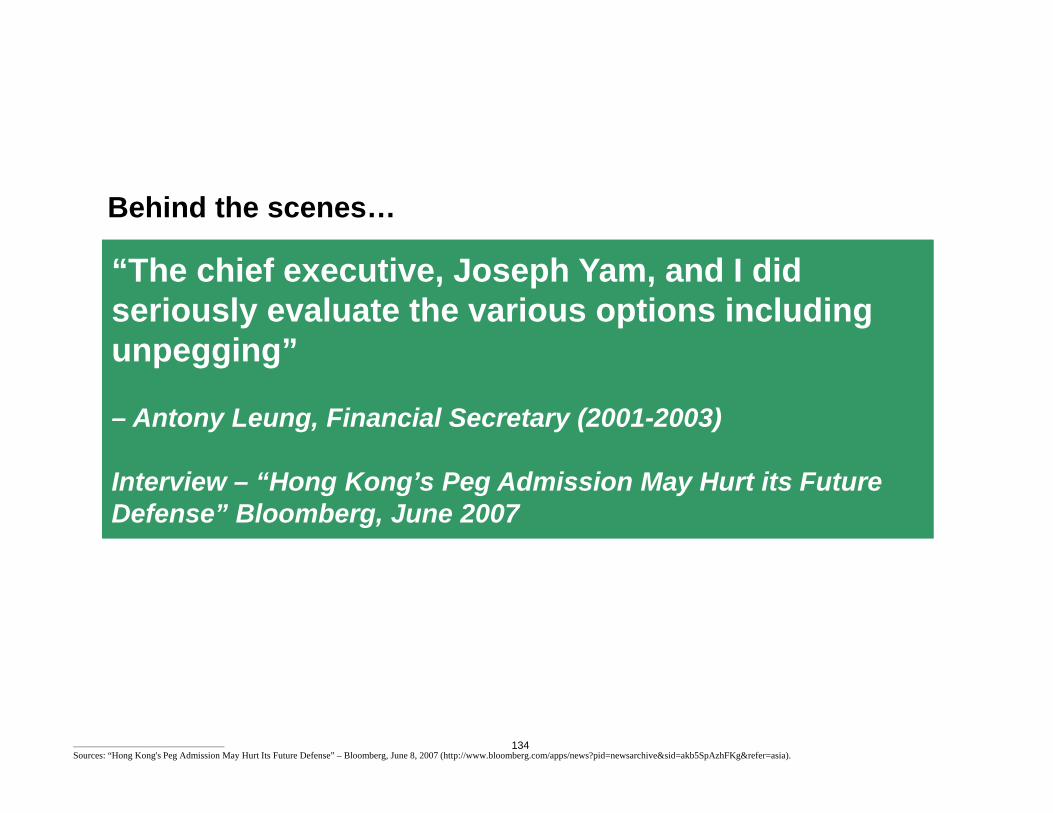
134
“The chief executive, Joseph Yam, and I did seriously evaluate the various options including unpegging”
– Antony Leung, Financial Secretary (2001-2003)
Interview – “Hong Kong’s Peg Admission May Hurt its Future Defense” Bloomberg, June 2007
“The chief executive, Joseph Yam, and I did seriously evaluate the various options including unpegging”
– Antony Leung, Financial Secretary (2001-2003)
Interview – “Hong Kong’s Peg Admission May Hurt its Future Defense” Bloomberg, June 2007
Behind the scenes…
________________________________________________
Sources: “Hong Kong's Peg Admission May Hurt Its Future Defense” – Bloomberg, June 8, 2007 (http://www.bloomberg.com/apps/news?pid=newsarchive&sid=akb5SpAzhFKg&refer=asia).

135
“Numerous commission [HK’s Commission on Strategic Development – One of the HK government’s most prominent] members who, in Fung’s words, ‘have the ear of senior officials’ are arguing that the HKD-USD peg should be floated shortly after the Chinese RMB surpasses the HKD in value.”
Internal US Treasury Memo, “Hong Kong Dollar Peg’s Future Under Consideration by Government Advisory Body” – April 2006
We also know from a document WikiLeaks released August 30th, 2011 that in 2006 a float was seriously considered by members of an important HK government commission:
________________________________________________
Sources: Wikileaks, August 30, 2011 (http://wikileaks.org/cable/2006/04/06HONGKONG1383.html).
136
“[T]he HKMA might choose a hot and boring Friday afternoon in mid-summer, when most fund managers and top government officials had gone vacationing, and announce the floating of the Hong Kong dollar.”
-Shu-ki TsangAcademic Economist and HKMA Advisory Board Member, Currency Board Sub-Committee
“[T]he HKMA might choose a hot and boring Friday afternoon in mid-summer, when most fund managers and top government officials had gone vacationing, and announce the floating of the Hong Kong dollar.”
-Shu-ki TsangAcademic Economist and HKMA Advisory Board Member, Currency Board Sub-Committee
A prominent member of the HKMA committee responsible for advising on the peg suggests a revaluation could happen when the market least expects:
________________________________________________
Source: “Commitment to Exit Strategies from a CBA” – Hong Kong Baptist University (http://sktsang.computancy.com/attrachment/Tsang20000506.pdf).

137
We have every reason to believe HK decision makers will approach the HKD peg question with the same diligence and rationality they have used in the past
We have every reason to believe HK decision makers will approach the HKD peg question with the same diligence and rationality they have used in the past

Economic and Monetary Policy Making in HK
Since its inception in 1993, the HKMA has built a reputation as one of the most credible monetary authorities in the world
The HKMA is known for its intelligence, transparency, and prudent oversight of the economy and banking system
Most importantly, the HKMA and other important decision makers in Hong Kong have a track record of behaving in an economically rational manner

139
Unlike some other currency regimes, HK’s peg can be modified through a purely administrative process. No legislative action is required
Unlike some other currency regimes, HK’s peg can be modified through a purely administrative process. No legislative action is required
Repegging is easy and quick to execute:

A highly undervalued currency
In Sum:In Sum:
+An extraordinary investment opportunity=
A highly undervalued option

Q & A


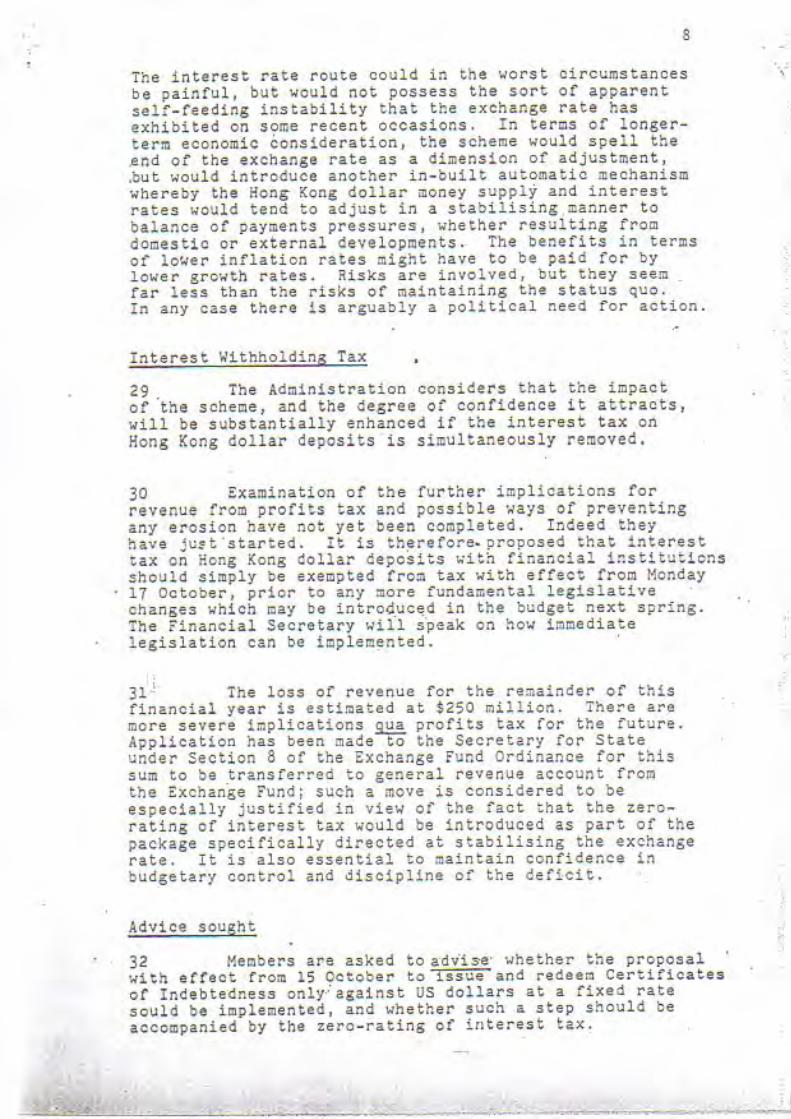

Pershing Square Capital Management, L.P.
A Homespun FortuneOctober 18, 2011
Disclaimer
The analyses and conclusions of Pershing Square Capital Management, L.P. ("Pershing Square") contained inthis presentation are based on publicly available information. Pershing Square recognizes that there may beconfidential information in the possession of the companies discussed in this presentation that could leadthese companies to disagree with Pershing Square’s conclusions. This presentation and the informationcontained herein is not investment advice or a recommendation or solicitation to buy or sell any securities.All investments involve risk, including the loss of principal.
The analyses provided may include certain statements, estimates and projections prepared with respect to,among other things, the historical and anticipated operating performance of the companies discussed in thispresentation, access to capital markets, market conditions and the values of assets and liabilities. Suchstatements, estimates, and projections reflect various assumptions by Pershing Square concerninganticipated results that are inherently subject to significant economic, competitive, and other uncertaintiesand contingencies and have been included solely for illustrative purposes. No representations, express orimplied, are made as to the accuracy or completeness of such statements, estimates or projections or withrespect to any other materials herein and Pershing Square disclaims any liability with respect thereto. Actualresults may vary materially from the estimates and projected results contained herein.
Funds managed by Pershing Square and its affiliates are invested in Fortune Brands Home & Security, Inc.(“FBHS”) common stock and cash settled derivative financial instruments based on the price of FBHScommon stock. Pershing Square manages funds that are in the business of trading – buying and selling –securities and financial instruments. It is possible that there will be developments in the future that causePershing Square to change its position regarding FBHS. Pershing Square may buy, sell, cover or otherwisechange the form of its investment in FBHS for any reason. Pershing Square hereby disclaims any duty toprovide any updates or changes to the analyses contained here including, without limitation, the manner ortype of any Pershing Square investment.
1
Fortune Brands Home & Security
2
FBHS (or the “Company”) is a leading North Americanresidential building products company
Manufacturer of:FaucetsKitchen and bath cabinetsSecurity and storage productsWindows and doors
Equity market capitalization of ~$2.0bn
Enterprise valuation of ~$2.5bn
Spun-off from Fortune Brands on October 4, 2011
Ticker: “FBHS”
Recent stockprice: $13 (1)
(1) Based on stock price as of Friday, October 14 2011.

Snapshot of FBHS
Plumbing#1 Faucet brand in North AmericaStable business driven by replacementdemand and “low ticket” remodeling projects
3
Kitchen & Bath Cabinetry
Windows and Doors
Security and Storage
#1 N. American kitchen and bath cabinet makerLeveraged to housing recovery
#1 Padlock brand in North AmericaStable, recurring cash flowsGood growth potential
Leveraged to housing recovery
Investment Highlights
4
Secular Winner…
Industry leader with significant scale and strong market positions
Winning new business and growing as financially leveraged competitorsremain defensive
Strong management team -- highly experienced operators
…And Cyclical Winner
Well-positioned when the housing market normalizes
Cyclical growth will not require capital investment above normal levels
Immense operating leverage: EBITDA can be 3x in a normalized housing market
Platform Business
Highly fragmented industry is ripe for consolidation
Opportunities to leverage scale and distribution through acquisitions inadjacent categories (i.e. electronic security, bath accessories)
Investment Highlights
5(1) See page 31 for valuation analysis.
Attractive ValuationCurrent valuation assumes minimal housing recovery over the next five years
Immense upside potentialIf housing starts improve by 2016, stock is worth ~$18 to $27 today, dependingon the strength of recovery
Midpoint of valuation analysis is ~$22 per share today, up about 70%(1)
Minimal downsideIf housing starts don’t improve, FBHS can still shrink capacity toget to an attractive level of profitability
Classic spin-off dynamicsOrphaned stock: October 4th spin-off
Most Fortune Brands shareholders owned it for Beam, a non-cyclical business
Strong balance sheetFlexibility to make opportunistic acquisitions
Limits downside risk as we wait for the housing markets to recover

FBHS: Business Overview

Plumbing
7
FinancialsCommentaryManufactures faucets,accessories, and kitchen sinksunder the #1 Moen brand
Large installed base helps winreplacement sales
Faucets are a “small ticket”remodeling expenditure – anaffordable way to improve thelook of the bathroom/kitchen
Generally a stable categorywhere branding and innovationcan drive marketplace gains
Variable-cost business model
The Plumbing segment, which contributed 54% of FBHS pre-corporate2010 EBIT, has performed exceptionally well in the downturn due toboth marketplace gains and the “small ticket” aspect of the category
$ in millionsPlumbing FY 2008 FY 2009 FY 2010
Revenue $967 $835 $924Growth (14)% 11 %
EBIT $171 $117 $133Margin 17.6 % 14.0 % 14.3 %
% of FBHS Revenues 26% 28% 29%% of FBHS pre-corp EBIT 48% 81% 54%

Kitchen & Bath Cabinets FY 2008 FY 2009 FY 2010Revenue $1,552 $1,126 $1,189
Growth (27)% 6 %EBIT $141 $4 $31
Margin 9.1 % 0.4 % 2.6 %
% of FBHS Revenues 41% 37% 37%% of FBHS pre-corp EBIT 40% 3% 13%
Kitchen & Bath Cabinets
8
#1 North American manufacturer of kitchen and bath cabinets
Key brands include: Aristokraft, Omega, and Diamond
Well-balanced distribution channels and flexible supply chain allow for differentiatedprice points and multiple levels of cabinet customization
Distributes through dealers, wholesalers, home centers, and large builders
Highly geared to “big ticket” remodeling projects and new home construction
Currently winning new business against competitors like Masco
High fixed-cost business model
The Cabinets segment is barely profitable today as demand for newhomes and “big ticket” remodeling projects has diminished drastically
$ in millions
The segment has significant excesscapacity, which is pressuringmargins today, but will allow forexplosive growth when the housingmarkets recover

Security & Storage FY 2008 FY 2009 FY 2010Revenue $571 $495 $520
Growth (13)% 5 %EBIT $59 $42 $61
Margin 10.3 % 8.4 % 11.7 %
% of FBHS Revenues 15% 16% 16%% of FBHS pre-corp EBIT 17% 29% 25%
Security and Storage
FinancialsCommentary
Manufactures Masterlockpadlocks and Waterloo storageproducts
Historically stable demand incore padlock market
FBHS exploring opportunitiesto expand Masterlock brandthrough acquisitions
Good potential to grow inadjacent categories (electronicsecurity and monitoring)
Masterlock is a great business with a strong marketplace position,stable cash flows, minimal capex requirements and good growthpotential in adjacent categories
$ in millions
Security and Storage contributed 25% ofFBHS’s 2010 EBIT
9

Windows and Doors
FinancialsCommentary
Manufactures fiberglass andsteel residential and patio doorsystems and vinyl-framedwindows
Key brands includeTherma-Tru Doors andSimonton Windows
Currently lapping difficultcomparisons driven by 2010federal tax credits for energyefficiency
EBIT Margins remain depressed as thesegment is significantly leveraged to newhome construction
FBHS’s Windows and Doors segment contributed only 8% of total pre-corporate EBIT in 2010.
$ in millions
10
Windows & Doors FY 2008 FY 2009 FY 2010Revenue $668 $551 $601
Growth (18)% 9 %EBIT ($17) ($19) $21
Margin (2.6)% (3.4)% 3.4 %
% of FBHS Revenues 18% 18% 19%% of FBHS pre-corp EBIT (5)% (13)% 8 %

2006 2007 2008 2009 2010 LTM($ in millions)
Revenue $4,694 $4,551 $3,759 $3,007 $3,234 $3,261Growth (3)% (17)% (20)% 8 % 1 %
% of Peak 100 % 97 % 80 % 64 % 69 % 69 %
EBITDA $816 $703 $435 $195 $288 $264Margin 17.4 % 15.4 % 11.6 % 6.5 % 8.9 % 8.1 %Growth (11)% (25)% (44)% 37 % (9)%% of Peak 100 % 86 % 53 % 24 % 35 % 32 %
EBIT $668 $553 $301 $81 $180 $160Margin 14.2 % 12.2 % 8.0 % 2.7 % 5.6 % 4.9 %Growth (15)% (34)% (66)% 107 % (12)%% of Peak 100 % 83 % 45 % 12 % 27 % 24 %
Memo:Housing Starts 1,812 1,342 900 555 586 569
Growth (26)% (33)% (38)% 6 % (3)%
FBHS: Margins Significantly Depressed
11
Consolidated EBIT margins are currently at ~5%, well below peak levelsof 14% reached in 2006.
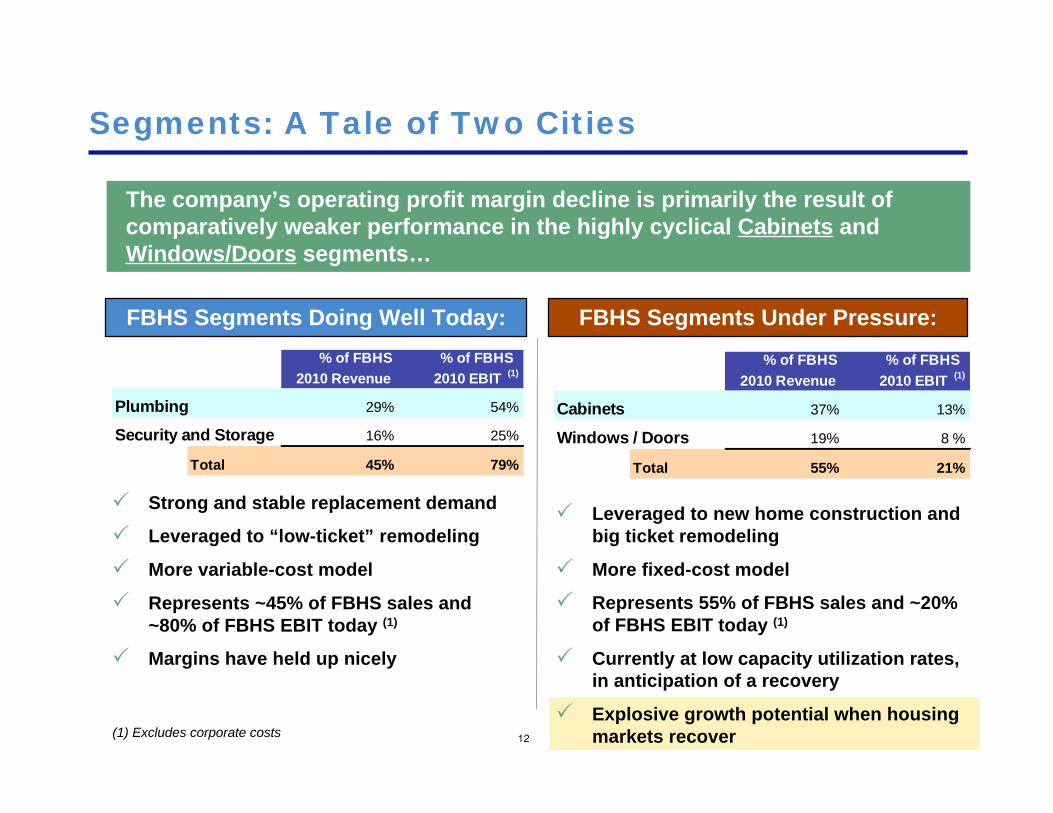
Segments: A Tale of Two Cities
The company’s operating profit margin decline is primarily the result ofcomparatively weaker performance in the highly cyclical Cabinets andWindows/Doors segments…
FBHS Segments Doing Well Today: FBHS Segments Under Pressure:% of FBHS % of FBHS
2010 Revenue 2010 EBIT (1)
Plumbing 29% 54%
Security and Storage 16% 25%
Total 45% 79%
% of FBHS % of FBHS 2010 Revenue 2010 EBIT (1)
Cabinets 37% 13%
Windows / Doors 19% 8 %
Total 55% 21%
Strong and stable replacement demand
Leveraged to “low-ticket” remodeling
More variable-cost model
Represents ~45% of FBHS sales and~80% of FBHS EBIT today (1)
Margins have held up nicely
Leveraged to new home construction andbig ticket remodeling
More fixed-cost model
Represents 55% of FBHS sales and ~20%of FBHS EBIT today (1)
Currently at low capacity utilization rates,in anticipation of a recovery
Explosive growth potential when housingmarkets recover12(1) Excludes corporate costs

2004 2005 2006 2007 2008 2009Employees 21,171 21,480 27,729 22,771 18,409 15,834
Y-o-Y Change 1 % 29 % (18)% (19)% (14)%Change Since Peak (18)% (34)% (43)%
Manufacturing Plants 48 53 64 56 47 41Y-o-Y Change 10 % 21 % (13)% (16)% (13)%Change Since Peak (13)% (27)% (36)%
Restructured the Business in the Downturn…
The Company substantially improved its cost structure by reducing itsfootprint between 2006 and 2009. Manufacturing facilities andemployee count have been reduced by roughly 40%.
13

…But Kept Enough Capacity for a Recovery
Currently operating at ~60% capacity overall, in anticipation of arecovery
Lower levels of capacity at highly cyclical segments (Cabinet andWindow/Doors)
Higher levels of capacity in more stable segments (Plumbing andSecurity)
Footprint is currently right-sized to support $5bn in sales (at 1.5mmnew housing starts)
Current sales base is ~$3.3bn
FBHS is well-positioned to accelerate profit growth as volumes grow ina recovery scenario
14

% of 2010 2010 NormalizedRevenue Margins Margins
Cabinets 37 % 2.6 % 10 %
Plumbing 29 % 14.3 % 15 %
Windows Doors 19 % 3.4 % 8 %
Security & Storage 16 % 11.7 % 12 %
Segment 7.6 % 11 %
Corp. Expense as % of Rev (2.0)% (1.4)%
Total 5.6 % 10 %
What If Capacity Were Reduced Further?
If management becomes more bearish about a recovery, it can reducecapacity further and shrink the cost base. We believe that if thebusiness were right-sized to the current sales base of ~$3.3bn, EBITmargins could be approximately 10%
15
Capacityreduction

Secular Winner: Growing in the Downturn
16
Winning New Business: Driving Sales through Innovation:
Martha Stewart Living cabinetryline at Home Depot
In-stock cabinetry at Lowe’srolling out in 2011
Waterloo storage productsrolling out Husky GarageOrganization at Home Depot
Moen “Spot Resist” finishDeveloped new finish thateliminates water spotting and fingerprinting
Strong product receptivity in themarket
Cabinetry: Paper laminatetechnology
Fashionable color and textures ataffordable prices
Since the downturn, FBHS has been aggressively winning newbusiness and increasing its marketplace position through productinnovations. As a result, the company has experienced organicgrowth in every quarter since Q1 2010 - even in this difficult housingmarket

Strong Balance Sheet Allows for Flexibility
Total Debt / EBITDA (1):
The Company has significantly less financial leverage than its peersallowing it to acquire smaller building products companies that arecurrently operating at trough levels of profitability
FBHS:
$520mm of total debt
LTM EBITDA - Capex:$194mm
No liquidity concerns
(1) Peer average based on Moody’s. Peers include Armstrong, Lennox, Masco, Mohawk, Owens Corning, Stanley Black &Decker and Whirlpool. FBHS leverage based on 12/31/2010 pro forma metrics.
17

Housing Market Review

Long-term Housing Market Drivers
New HomeConstruction
Repair andRemodel
Positive population / immigration growth
Increased levels of household formation
Favorable housing affordability
Aging housing stock (average of 40years), particularly homes > 12 years
Existing home sales
Note: This page is taken from FBHS investor presentation dated September 6, 2011
Economic factors that enable a recovery:
Consumer confidenceUnemployment—at the local market levelCredit availabilityStability in home prices
19
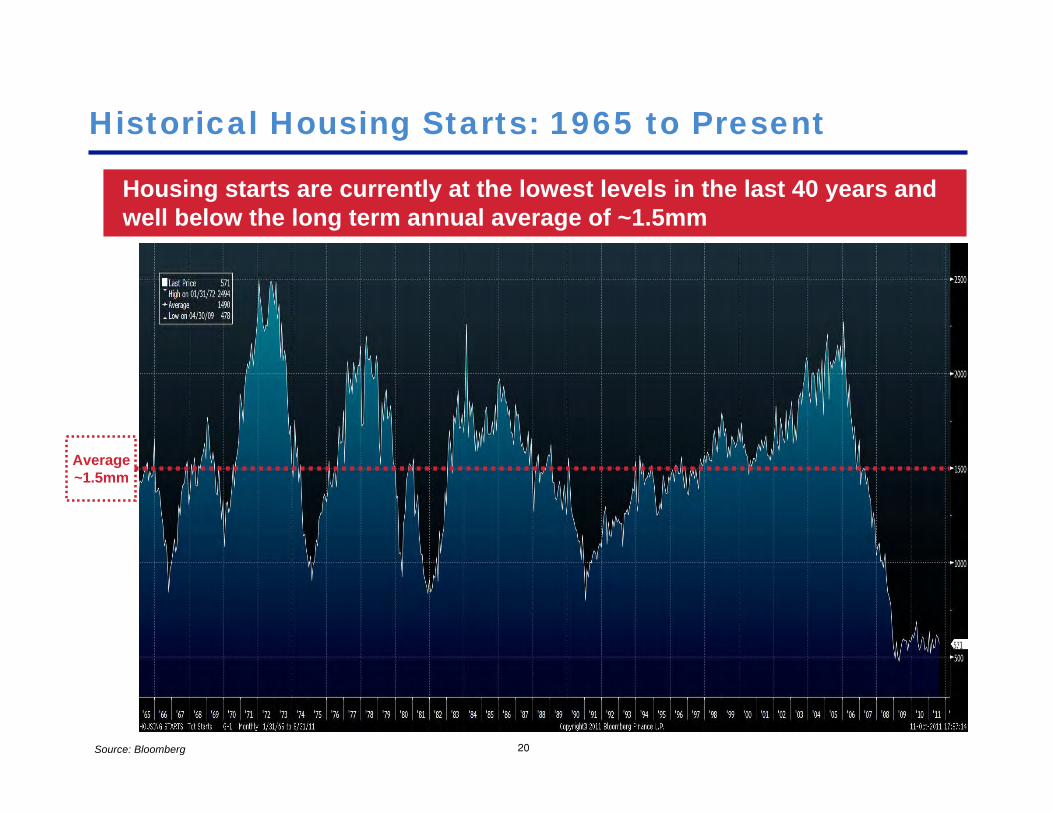
Historical Housing Starts: 1965 to Present
20
Housing starts are currently at the lowest levels in the last 40 years andwell below the long term annual average of ~1.5mm
Average~1.5mm
Source: Bloomberg
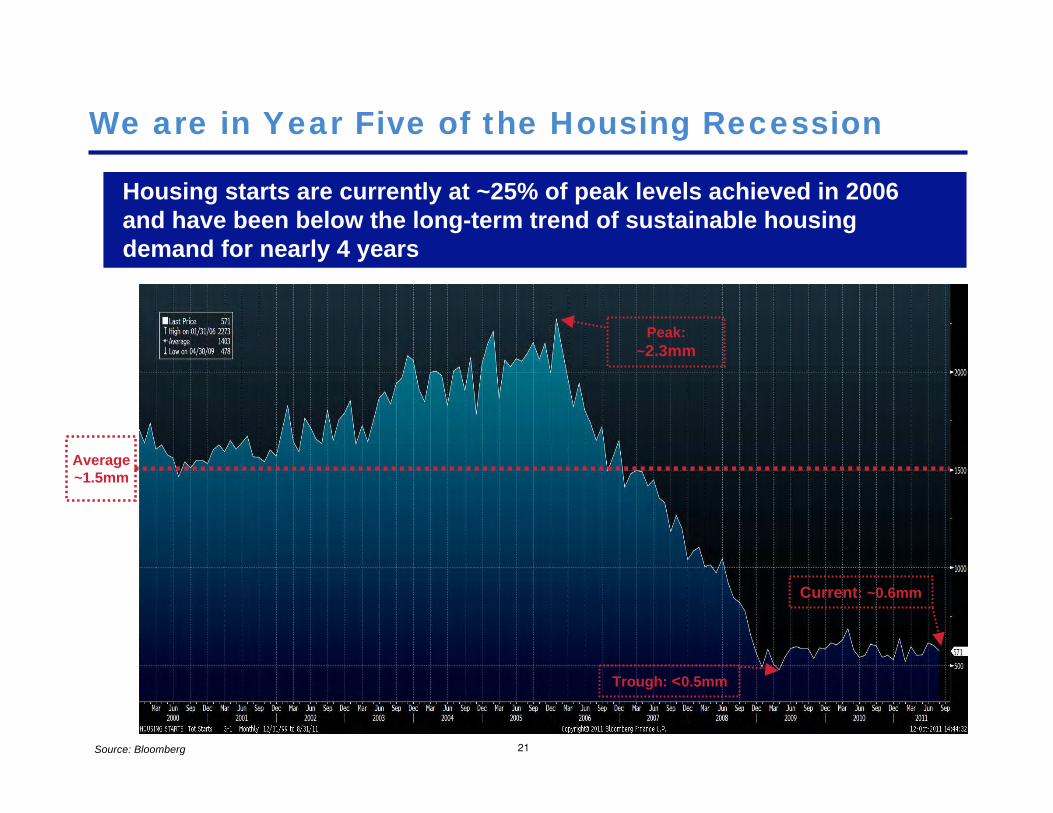
We are in Year Five of the Housing Recession
21
Housing starts are currently at ~25% of peak levels achieved in 2006and have been below the long-term trend of sustainable housingdemand for nearly 4 years
Peak:~2.3mm
Trough: <0.5mm
Current: ~0.6mm
Average~1.5mm
Source: Bloomberg

What a Housing Recovery Might Look Like
22
We believe that the current level of excess supply is ~2mm to 2.5mm housingunits and normalized housing demand is approximately 1.5mm
At a normalized level of housing demand:Excess housing supply could be eliminated in roughly 2.5 years if housing startsremain at ~600k
At the depressed level of housing demand (~1m):
Excess supply could be eliminated in ~ 5.5 years if housing starts remain at~600k
Although the pace of the housing recovery is difficult to predict, webelieve a recovery over the next several years is highly likely
Depressed NormalizedHousing Demand 1,000 1,500Housing Starts 600 600
Annual Reduction of Excess Supply 400 900
Current Excess Supply 2,250 2,250Years to Zero Excess Supply 5.6 2.5
(Units in 000s, except years)
Repair/Remodel Market Overview
23
Repair / Remodeling projects are generally discretionary
Certain replacement projects can wait: Cabinets, tiling (versus more criticalitems such as doors, windows, roofing)
Weak existing home sales are hurting the R&R market - new homeownersspend 2x the average repair/remodel level
Despite the weak market, there is pent-up demand from an aging housingstock
Today the ticket matters a lot
Big ticket remodel items (cabinets, tiling) are weak
Small ticket remodel items (faucets, paint) are showing strength
Longer term, Repair / Remodel growth rates tend to trend in linewith GDP
Housing Market Summary
24
Housing starts are currently at the lowest levels in 40 years
Long-term average of housing starts is ~1.5mm versus today of 600k
Repair and remodel market is likely facing pent-up demand given aginghousing stock
Before housing starts return to their long-term trend, we need to absorbthe current excess supply of homes – a matter of time
The current level of housing starts (~600k) is unsustainable over thelonger term
Historical levels of annual household formation are far in excess of 600k
We think a meaningful recovery in housing starts could happen in thenext several years
However, new homes will likely be smaller and more affordable (cheaperproducts) than in recent years
FBHS’s market position may improve, given the Company’s skew to morevalue-priced products
“The only way a correction takes place is to havehousehold formation exceed new construction by asignificant amount for a significant period of time. We'vehad it for quite a while. And when you see these figuresof 500,000 or 600,000, that means we're sopping uphousing inventory. And I don't know exactly when thathits equilibrium, but it isn't five years from now. I knowthat. And I think it actually could be reasonably soon.”
--Warren Buffett (July 8, 2011 Bloomberg TV interview)
25

Valuation
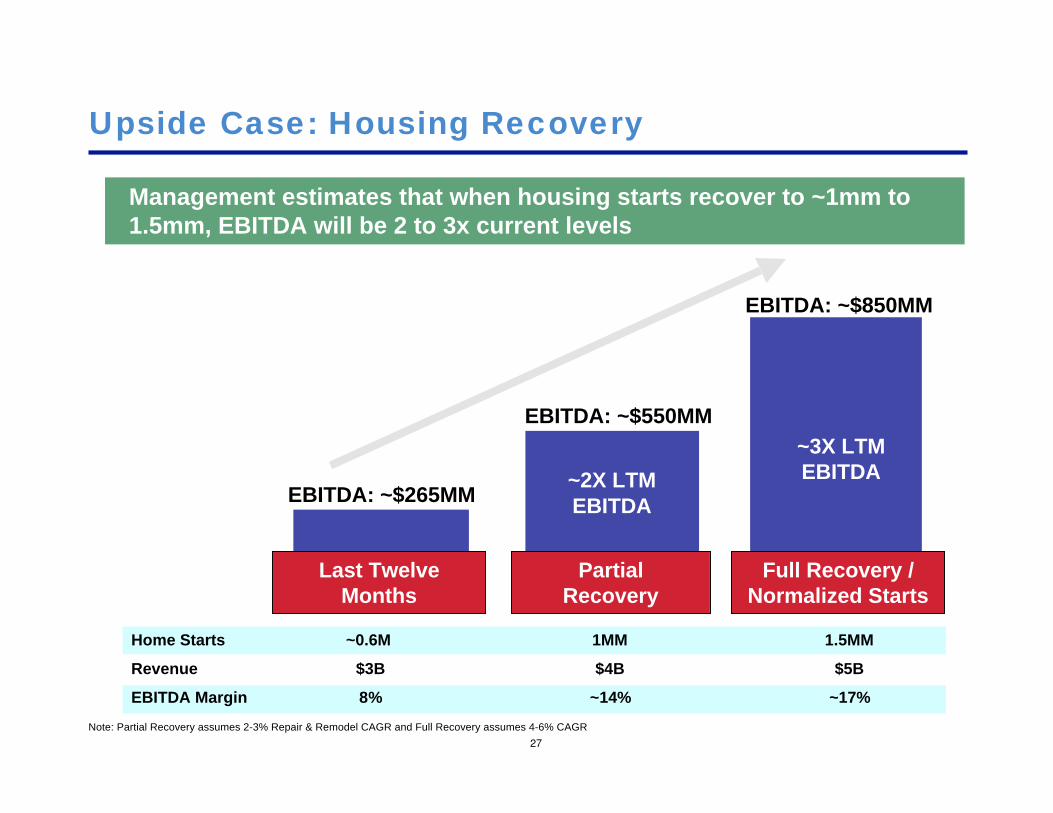
Upside Case: Housing Recovery
27
EBITDA: ~$265MM
EBITDA: ~$550MM
EBITDA: ~$850MM
Home Starts ~0.6M 1MM 1.5MM
Revenue $3B $4B $5B
EBITDA Margin 8% ~14% ~17%
Management estimates that when housing starts recover to ~1mm to1.5mm, EBITDA will be 2 to 3x current levels
~2X LTMEBITDA
~3X LTMEBITDA
Note: Partial Recovery assumes 2-3% Repair & Remodel CAGR and Full Recovery assumes 4-6% CAGR
PartialRecovery
Full Recovery /Normalized Starts
Last TwelveMonths

Downside: What if there is No Housing Recovery?
28
If housing starts were to stay at depressed levels (~600k) for the longerterm, we believe FBHS could right-size the business to achieve a morenormalized level of profitability
We estimate that FBHS can generate at least $400MM in EBITDA ontoday’s sales base by cutting capacity and excess cost
FBHS has maintained excess capacity to position itself for a housingrebound
If it fails to materialize, we believe management can right-size the coststructure and achieve a ~10% EBIT margin
FY 2011E Revenue $3.3bnNormalized EBIT Margin 10%EBIT $330mmPlus: D&A (reduced capacity) 70mmEBITDA $400mm

No Recovery RecoveryLTM (Cut Capacity) Partial Full
Housing Starts (000s) 569 600 1,000 1,500
EBITDA $264 $400 $550 $850EBITDA - Capex $194 $330 $450 $750EPS $0.57 $1.26 $1.76 $3.00FCF per Share $0.79 $1.26 $1.76 $3.00
EV / EBITDA 9.7 x 6.4 x 4.7 x 3.0 xEV / EBITDA-Capex 13.2 x 7.8 x 5.7 x 3.4 xP/E 23.0 x 10.3 x 7.4 x 4.3 xP/FCF 16.5 x 10.3 x 7.4 x 4.3 x
Current Trading Multiples
29
FBHS currently trades ~9.7x LTM EBITDA and ~16.5x LTM cash earnings. Ifno recovery occurs, FBHS is trading at ~10x our estimate of cash earnings.If a recovery occurs, FBHS trades at ~4x to 7x our estimates of cashearnings, depending on the strength of recovery
Note: EPS and FCF per share based on a 35% normalized tax rate.
Memo: Market CapitalizationRecent Stock Price $13.00Diluted Shares (mm) 157
Market Cap $2,045Plus: Net Debt 520
Enterprise Value $2,565

Valuing FBHS in a Recovery
30
Assuming a 7x Forward EBITDA multiple, even if the recovery isprotracted or prolonged, we believe we will earn an attractive IRR atthe current share price
Note: Assumes 7x EBITDA exit multiple and includes the value of annual free cash flow generated until exit. Based on R&M CAGR of2-3%, 3-4%,and 4-6% for housing starts of 1.0m,1.3m, and 1.5m
Total ReturnHousing Starts 1.0M 1.3M 1.5MEBITDA $550 $700 $850
2014 83 % 139 % 196 %Recovery 2015 92 % 151 % 209 %Year 2016 101 % 162 % 223 %
2017 111 % 174 % 237 %
IRRHousing Starts 1.0M 1.3M 1.5MEBITDA $550 $700 $850
2014 35 % 55 % 72 %Recovery 2015 24 % 36 % 46 %Year 2016 19 % 27 % 34 %
2017 16 % 22 % 28 %
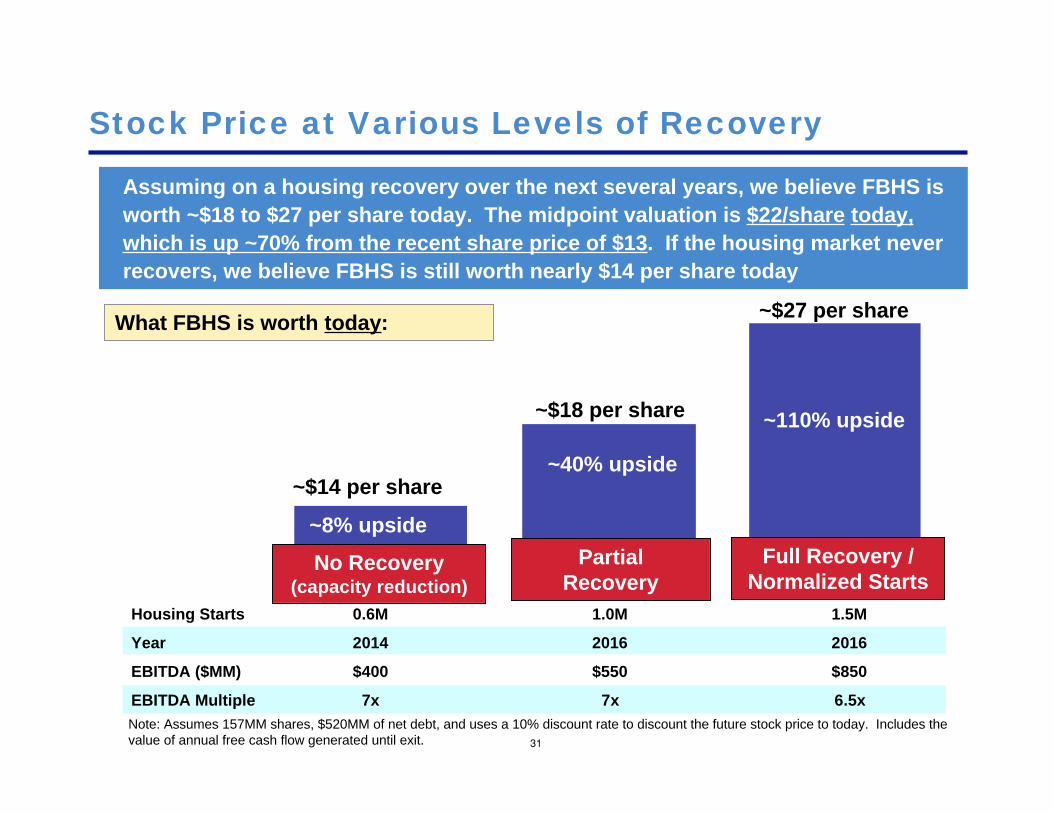
Stock Price at Various Levels of Recovery
31
~$14 per share
~$18 per share
~$27 per share
Housing Starts 0.6M 1.0M 1.5M
Year 2014 2016 2016
EBITDA ($MM) $400 $550 $850
EBITDA Multiple 7x 7x 6.5x
Assuming on a housing recovery over the next several years, we believe FBHS isworth ~$18 to $27 per share today. The midpoint valuation is $22/share today,which is up ~70% from the recent share price of $13. If the housing market neverrecovers, we believe FBHS is still worth nearly $14 per share today
PartialRecovery
Full Recovery /Normalized Starts
No Recovery(capacity reduction)
~40% upside
~110% upside
~8% upside
Note: Assumes 157MM shares, $520MM of net debt, and uses a 10% discount rate to discount the future stock price to today. Includes thevalue of annual free cash flow generated until exit.
What FBHS is worth today:

Conclusion
32
Pace and strength of a housing recovery is difficult to predict
However, at some point, the housing markets will recover
Investing in FBHS is a low-risk way to profit from an eventual housingmarket recovery
Pure-play residential building products company
Best operators in the business
Improving marketplace position, even in tough housing markets
Many of its competitors are on the defensive
No liquidity concerns and currently generating a healthy FCF yield of 6%
Downside is limited, given clean balance sheet and Company’s ability toreduce capacity, if necessary
Upside potential is enormous, as cyclical growth will not require capitalinvestment above normal levels

Waiting for a Bounce from the Lowe’s
November 8, 2011
Pershing Square Capital Management, L.P.

Disclaimer
The analyses and conclusions of Pershing Square Capital Management, L.P. ("Pershing Square") contained in this presentation are based on publicly available information. Pershing Square recognizes that there may be confidential information in the possession of the companies discussed in this presentation that could lead these companies to disagree with Pershing Square’s conclusions. This presentation and the information contained herein is not investment advice or a recommendation or solicitation to buy or sell any securities. All investments involve risk, including the loss of principal.
The analyses provided may include certain statements, estimates and projections prepared with respect to, among other things, the historical and anticipated operating performance of the companies discussed in this presentation, access to capital markets, market conditions and the values of assets and liabilities. Such statements, estimates, and projections reflect various assumptions by Pershing Square concerning anticipated results that are inherently subject to significant economic, competitive, and other uncertainties and contingencies and have been included solely for illustrative purposes. No representations, express or implied, are made as to the accuracy or completeness of such statements, estimates or projections or with respect to any other materials herein and Pershing Square disclaims any liability with respect thereto. Actual results may vary materially from the estimates and projected results contained herein.
Funds managed by Pershing Square and its affiliates are invested in Lowe’s Companies, Inc. (“LOW”) common stock. Pershing Square manages funds that are in the business of trading – buying and selling –securities and financial instruments. It is possible that there will be developments in the future that cause Pershing Square to change its position regarding LOW. Pershing Square may buy, sell, cover or otherwise change the form of its investment in LOW for any reason. Pershing Square hereby disclaims any duty to provide any updates or changes to the analyses contained here including, without limitation, the manner or type of any Pershing Square investment.
1
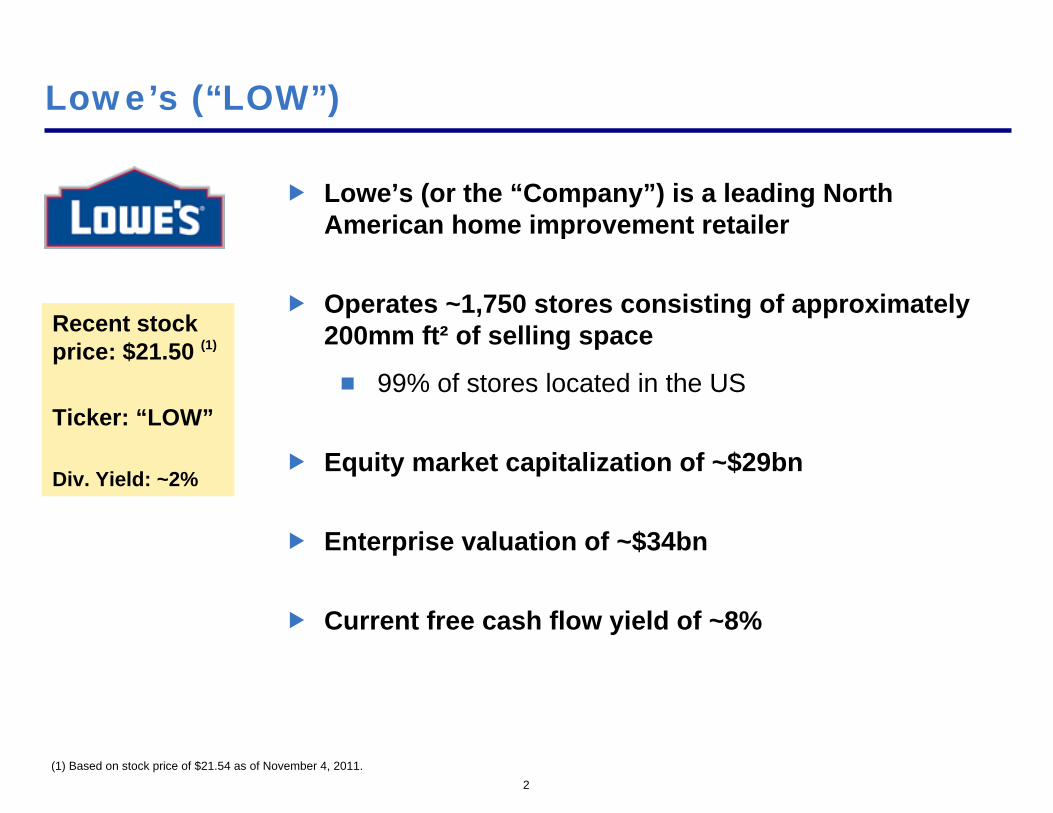
Lowe’s (“LOW”)
2
Lowe’s (or the “Company”) is a leading North American home improvement retailer
Operates ~1,750 stores consisting of approximately 200mm ft² of selling space
99% of stores located in the US
Equity market capitalization of ~$29bn
Enterprise valuation of ~$34bn
Current free cash flow yield of ~8%
Recent stock price: $21.50 (1)
Ticker: “LOW”
Div. Yield: ~2%
(1) Based on stock price of $21.54 as of November 4, 2011.
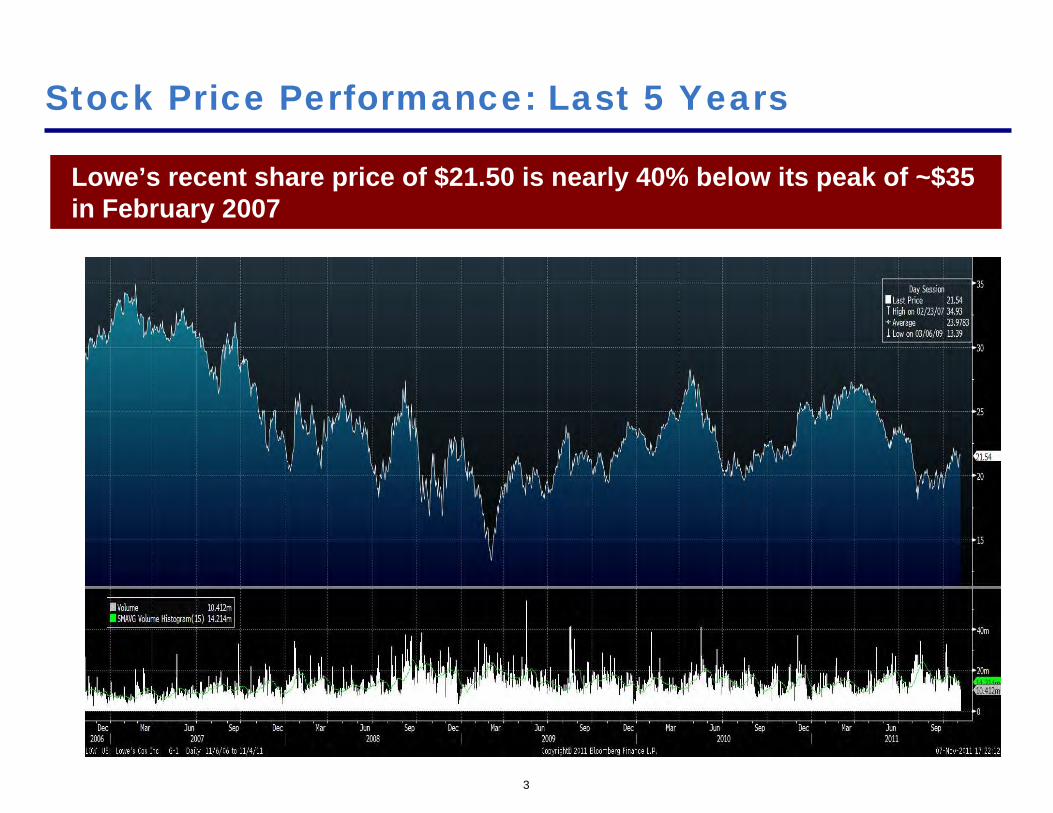
Stock Price Performance: Last 5 Years
3
Lowe’s recent share price of $21.50 is nearly 40% below its peak of ~$35 in February 2007
Investment Highlights
4
Attractive retail categoryLimited internet risk relative to other retailers
High gross margin retail category and diversified commodity risk
Limited fashion risk
Service component = consumer value proposition
Good barriers to entryHome Depot and Lowe’s are the central players in home center retail
Home centers are low-cost providers, given scale and leverage with suppliers
Limited risk of new entrants
Cheap ValuationLowe’s trades at 6.5x depressed EBITDA and less than 13.5x depressed EPS
Lowe’s EBIT margin currently 7.5% only 70bps higher than its trough in 2009 at 6.8%
Company believes normalized EBIT margins are 10%
Company has maintained staffing to provide high service levels and be positioned for a recovery

Investment Highlights (cont’d)
5
Extremely shareholder friendly capital allocation policy
All free cash flow after dividends goes towards share repurchase
Company is increasing leverage levels modestly to further accelerate buyback
We expect the Company to buy back $10bn to $13bn of stock from 2012 to 2015
Equivalent to 35% to 45% of the current market cap of the Company
Strong asset value and low financial leverage – limits downside
Lease-Adjusted Net Debt / LTM EBITDAR = 1.6x
Owns roughly 89% of its ~1,750 buildings
$23bn gross book value of land and buildings, or ~65% of Lowe’s enterprise value

Business Overview

2010
Discretionary
Repair & Maintenance
30%
70%
Lowe’s Business Snapshot
7
2nd largest home improvement retailer
Typical customer shops at Lowe’s three to four times per year and spends ~$62 per transaction
Each store averages ~$28mm in revenue
LTM Sales/ft² is $246
Revenue MixOverview of Lowe’s
2005
DiscretionaryRepair & Maintenance 50%50%
Sales today are significantly more Repair & Maintenance items than Discretionary items
Valuable Customer ServiceHelps customers identify the exact products they need (e.g., replacement parts)
Consults with customers on complex remodeling projects
Provides installation services
One-Stop ShoppingHome improvement purchases are typically project-oriented (e.g., bathroom remodel)
Consumers buy across categories (paint, plumbing, flooring, etc.) making one-stop shopping ideal
Home centers’ big-box layout allows for ~40,000+ SKUs
Product selection can’t be matched by general merchandise retailers
Instant SatisfactionCustomers can purchase products and take them home from the store immediately
ConvenienceLowe’s has ~1,750 stores across 50 U.S. states
Why Do Consumers Shop at Home Centers?
8

Why Do Consumers Shop Online?
9
Online retailing has become a headwind for most brick-and-mortar retailers over the recent years. Online shopping is most appealing to consumers when the following conditions apply:
Product is relatively high-priced (i.e., sales tax savings are more material)
Product is not needed immediately
Shipping cost is low
Shipping is unlikely to damage the product
Professional installation is not needed
Item is not purchased as part of a larger project
End-user of the product is making the purchasing decision
We believe that the home centers face limited risk from online shopping because the majority of products they sell do not meet most of these conditions
Est. Threat ofCategory % of Rev. Product Example Internet Competition Reason
Lawn & Garden 13 % Grills, mowers, garden chemicals Limited Shipping issues
ElectricalLight Bulbs 1 % High New LED bulbs ship well, high ticketTechnical Lighting 1 % Switches, dimmers Limited Low ticketCeiling Fans 2 % Moderate
PlumbingPipes/Fitting 3 % Limited Contractor purchase, project-basedFaucets 2 % Moderate High ticket, ships wellLarge Fixtures 2 % Tubs, sinks Limited
Paint & Accessories 9 % Limited Paint not ship well, project-based
Floor & WallFlooring 4 % Limited Shipping issuesWall Storage 2 % Closets storage Limited Shipping issuesWall Décor 2 % Curtain rods High Higher ticket, ships well
HardwarePower Tools 3 % Electric drills, screwdrivers High Higher ticket, ships well, not project-basedHandtools 3 % Manual hammer, screwdriver Limited Low-ticket, project-basedHardware Accessories 6 % Nails, bolts, nuts Limited Low-ticket, project-basedDoor Lock Sets 1 % Front door knobs, deadbolts High High ticket, ships well
Windows & Doors 11 % Limited Shipping issues
Building Materials 20 % Lumber, insulation, roofing, concreteLimited Contractor purchase, project based, shipping issues
AppliancesInstallable Appliances 8 % Washer/Dryer, A/C, stove, refrig. Limited-Moderate Service componentNon-Installable Appliances 2 % Small appliances High High ticket, no service component, ships well
Kitchen 5 % Cabinets Limited Installation, shipping issues
Limited Risk 82 %Moderate Risk 8 %High Risk 10 %
Home Improvement Retail: Limited Internet Risk
10
We believe that only 10% of Lowe’s revenues face a high risk of competition from online retailers
Note: Limited-Moderate category counts 50% towards limited, 50% towards moderate

2005 2006 2007 2008 2009 2010 LTMRevenue ($ in B) $43.2 $46.9 $48.3 $48.2 $47.2 $48.8 $48.8
Growth 19 % 9 % 3 % (0)% (2)% 3 % (0)%
EBIT Margin 10.8 % 11.0 % 9.7 % 7.9 % 6.8 % 7.4 % 7.5 %
Sales / Ft² $328 $316 $292 $267 $249 $250 $246Growth 5 % (4)% (8)% (8)% (7)% 1 % (1)%% of Peak 100 % 96 % 89 % 82 % 76 % 76 % 75 %
SSS Growth 6.1 % 0.0 % (5.1)% (7.2)% (6.7)% 1.3 % (0.1)%
Units 1,234 1,385 1,534 1,638 1,710 1,749 1,753Growth 14 % 12 % 11 % 7 % 4 % 2 % 0 %
Lowe’s Financials: Margins Down Significantly
11
Lowe’s sales/ft² is 25% less than peak levels achieved nearly six years ago. EBIT margins are ~350bps below peak margins achieved nearly five years ago

LOW Outperformed HD for Most of the Last Decade…
Lowe’s level of same-store sales growth outpaced Home Depot’s each year from 2001 to 2008
12
Same-Store Sales Growth
2000 2001 2002 2003 2004 2005 2006 2007 2008Lowe's 1.2 % 2.4 % 5.8 % 6.7 % 6.6 % 6.1 % 0.0 % (5.1)% (7.2)%Home Depot 4.0 % 0.0 % (0.5)% 3.7 % 5.1 % 3.1 % (2.8)% (6.7)% (8.7)%
Lowe's - Home Depot (2.8)% 2.4 % 6.3 % 3.0 % 1.5 % 3.0 % 2.8 % 1.6 % 1.5 %
Note: Home Depot same-store sales growth figures are for the entire company only, as Home Depot did not consistently disclose U.S.-only same-store sales growth figures during the period from 2000 to 2008.

…But Now LOW is the Underperformer
Lowe’s level of same-store sales growth has underperformed Home Depot’s for eight out of the last ten quarters
Potential Causes of Recent Underperformance:
Strength of HD’s current operational executionStrong regional-level merchandising
Post Bob Nardelli, invigorated management team under CEO Frank Blake
Lowe’s product mix is more discretionary than Home Depot’s
Home Depot currently doing well with the basic repair customer versus Lowe’s more fashion-oriented customer
13
Same-Store Sales GrowthQ1 '09 Q2 '09 Q3 '09 Q4 '09 Q1 '10 Q2 '10 Q3 '10 Q4 '10 Q1 '11 Q2 '11
Lowe's (6.6)% (9.5)% (7.5)% (1.6)% 2.4 % 1.6 % 0.2 % 1.1 % (3.3)% (0.3)%Home Depot - U.S. Only (8.6)% (6.9)% (7.1)% (1.1)% 3.3 % 1.0 % 1.5 % 4.8 % (0.7)% 3.5 %
Lowe's - Home Depot 2.0 % (2.6)% (0.4)% (0.5)% (0.9)% 0.6 % (1.3)% (3.7)% (2.6)% (3.8)%

LTM Consensus 2012EEV/EBITDA P/E EV/EBITDA P/E
Lowe's 6.5 x 13.3 x 6.3 x 12.2 xHome Depot 8.5 x 16.1 x 7.8 x 13.8 x
Trading Multiples Reflect Underperformance
14
Based on its recent underperformance, Lowe’s trades at a discount to Home Depot on both LTM and 2012 multiples
Despite the valuation discount relative to HD, we believe Lowe’s long history of same-store sales outperformance suggests that recent underperformance is more likely temporary rather than structural
Memo: CapitalizationLowe's Home Depot
Stock Price $21.50 $37.00Diluted Shares 1,328 1,577
Market Cap $28,552 $58,349Plus: Debt 6,620 10,775Less: Cash & Investments (1) (1,423) (2,551)
Enterprise Value $33,749 $66,573Dividend Yield 2.0 % 2.7 % (1) For Lowe’s, Cash & Investments are net of restricted cash balances.

Recent Price $21.502015 EPS $3.40Price / 2015 EPS 6.3 x
Lowe’s Management is Bullish…
15
Note: This page is taken from Lowe’s investor presentation dated November 30, 2010. Red highlights added for emphasis.
At last year’s analyst day, management guided to $3.40 of EPS in 2015, driven by a 4% average growth rate in same-store sales, a 10% EBIT margin, and an $18bn share repurchase program (2011 to 2015)

…And is Buying Back Stock Aggressively
16
Management plans to use all free cash flow after dividends to repurchase stock and will increase leverage to 1.8x Lease Adjusted Net Debt / EBITDAR from 1.6x. We estimate share repurchases will be ~$10bn to $13bn from 2012 to 2015
At the current share price, management could repurchase ~35% to 45% of the Company between 2012 and 2015
In the first half of 2011, management repurchased nearly $2.4B of shares at an average price of ~$25
Repurchased ~7% of the current share base
Share repurchases may accelerate annual core earnings growth by 8% to 10% from 2012 to 2015
Current interest rate environment makes debt financing an attractive source of capital for share repurchases

Valuation

Management Pershing Square EstimatesTargets Low Mid High
2012E to 2015E CAGR:Home Improvement Market 3.0 % 0.0 % 1.5 % 3.0 %Impact of Share Gains 1.0 % 0.0 % 1.0 % 1.0 %
Same-Store Sales 4.0 % 0.0 % 2.5 % 4.0 %
2015 EBIT Margin 10.0 % 7.3 % 8.3 % 9.3 %
2015 EPS $3.40 $2.00 $2.60 $3.20
% Increase from LTM EPS ~110% ~25% ~60% ~100%
Drivers of share gains:Growth from internet siteGains from Mom & Pop dealersGains from Sears
⌦ Losses from cannibalization
Valuation Assumptions
18
Pershing Square Mid and High cases reflect our view of the most likely outcomes
Note: Management targets based on November 2010 analyst day and annualized same-store sales growth reflected management estimates for 2011E to 2015E.
Our estimates are more conservative than management’s 2015 targets
~~
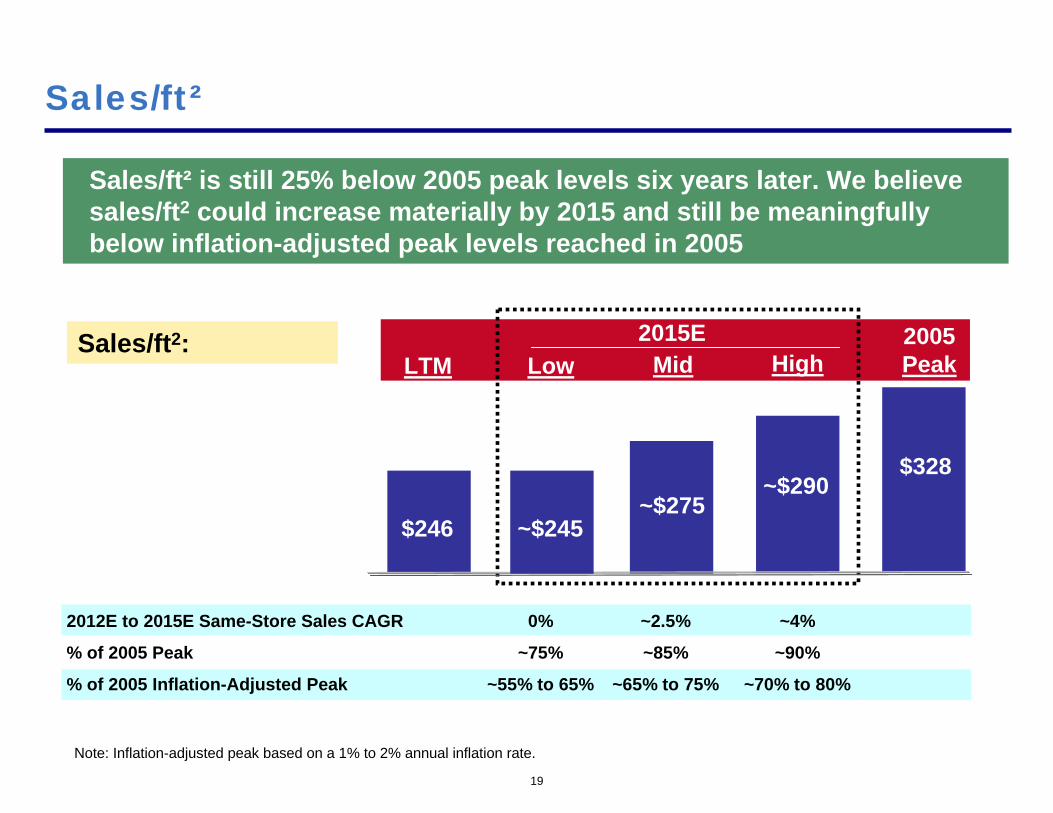
Sales/ft²
19
LTM
Sales/ft² is still 25% below 2005 peak levels six years later. We believesales/ft2 could increase materially by 2015 and still be meaningfully below inflation-adjusted peak levels reached in 2005
Mid High2005 Peak
$246
$328~$275
~$290
2015E
2012E to 2015E Same-Store Sales CAGR 0% ~2.5% ~4%
% of 2005 Peak ~75% ~85% ~90%
% of 2005 Inflation-Adjusted Peak ~55% to 65% ~65% to 75% ~70% to 80%
Note: Inflation-adjusted peak based on a 1% to 2% annual inflation rate.
Sales/ft2:Low
~$245

EBIT Margins
20
In our Mid and High cases, we believe EBIT margins could be ~8.3% to 9.3%. In our Low case, if same-store sales remain flat, we believe Lowe’s can maintain current EBIT margins through cost reductions
Note: Current gross margins are partially elevated by a favorable mix of higher-margin, lower-ticket items. As sales recover, we expect a slight gross margin headwind, offset by positive operating leverage. Management estimates each 1% of same store sales growth above 1% will result in 20bps of operating expense leverage.
Low Mid High2012E to 2015E Same Store Sales CAGR 0.0% 2.5% 4.0%
Est. Annual EBIT Margin Improvement 0bps 25bps 50bps
2011E EBIT Margin 7.3 % 7.3 % 7.3 %Plus: Total Est. EBIT Margin Improvement 0.0 % 1.0 % 2.0 %2015E EBIT Margin 7.3 % 8.3 % 9.3 %

2012E to 2015E SSS CAGR 0% ~2.5% ~4%
2015E EBIT Margin 7.3% 8.3% 9.3%
2015 EPS $2.00 $2.60 $3.20
P/E Multiple (based on current) 13x 13x 13x
Valuing Lowe’s
21
~$36 per share
~$43 per share
We believe 2015 EPS will likely be between $2.60 to $3.20. At a 13x P/E, the total value per share at year end 2014 is $36 to $43. If same-store sales remain flat for the next several years, year end 2014 total value per share is $28, driven largely by share repurchases
Mid High
~65% Return 26% IRR
Note: Based on ~1% annual net unit growth. Includes ~$1.80 of dividends received between 2012 and 2014.
Year End 2014 Total Value Per Share (includes dividends):
~100% Return
18% IRR
~$28 per share
Low
~30% Return9% IRR

Conclusion
22
We think Lowe’s is a good business in an attractive retail categoryHowever, sentiment is poor because of the Company’s more recent underperformance relative to Home Depot
We think this underperformance is more temporary than structural
The current stock price is not factoring in a sales recovery, but we believe one is likely in the next several years
Even if no sales recovery occurs, we believe downside is limitedMinimal financial leverage, limited lease leverage, cheap stock
Aggressive share repurchase program is a catalystLowe’s has ~8% current cash earnings yield
The Company is returning all cash earnings to shareholders in the form of buybacks and dividends
Investors are effectively paid to wait for a recovery


