Download - A Year of Intensity - Burgan
1March 2011
IntensityA Year of
Investor Presentation

2
Disclaimer
The information contained in this document has been provided on the basis of current
knowledge, assumptions and expectations. In the event that any information is incorrect
or any party misrepresented, Burgan Bank and its consultants cannot be held
responsible for this. Various factors could cause future results, performance or events to
differ materially from those given in this document. No obligation is undertaken to
update this document or the statements / information contained in it. The information
contained in this document should by no means be interpreted as an invitation to making
any investment decision based on the same. Our continuous advice is that every investor
must rely on his/her own advisor and resources to ensure the correctness of the
information presented to him/her and then makes his/her investment decision
accordingly.
March 15, 2011 Final

3
2010
Weathered third year of global crisis
Achieved majority stakes in all subsidiaries
Built-up balance sheet
2011
Growing again
Normalising profitability driven by lower credit costs
Continuing diversification: products, businesses, geographies
Summary: Moving beyond the financial crisis
March 15, 2011 Final

4
2010: What we said and what we achieved
March 15, 2011 Final
2010: Shafafiyah Assumptions & Outlook
2010: Actual Performance
Reduction expected in NPLs and
increase in provision coverage
NPLs decreased from 10.0% to 6.1%;
spillover of 2009 affected credit costs
more than expected
Provision coverage increased from 49%
to 73%
Provision coverage with collaterals
increased from 87% to 157%
Group net profit guidance: Expected
substantial increase
Net profit for 2010: KD 4.7mn Vs. 2009
KD 6.2mn
Significant increase in H2 2010
Group operating income expected to
grow further
Operating income increased from
KD155mn to KD165mn
5
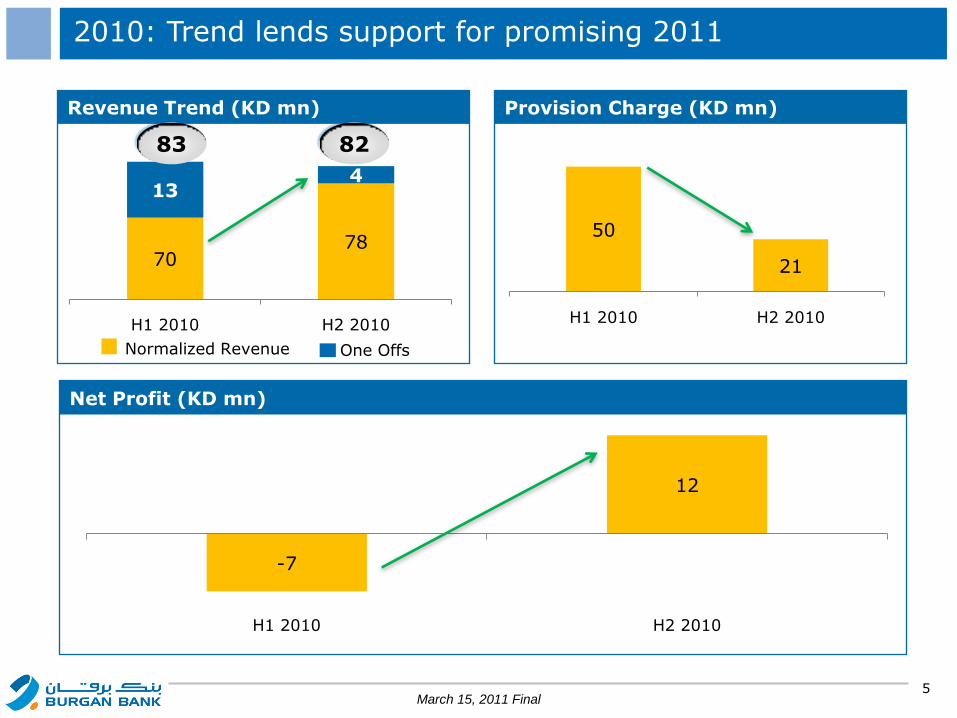
-7
12
H1 2010 H2 2010
50
21
H1 2010 H2 2010
7078
134
H1 2010 H2 2010
Revenue Trend (KD mn) Provision Charge (KD mn)
Net Profit (KD mn)
2010: Trend lends support for promising 2011
Normalized Revenue One Offs
March 15, 2011 Final
8283

6
Growing revenues with adequate provisioning
2010 reflects first year of consolidation of all four subsidiaries
88106
121
155 165
53 51 68 102 107
2006 2007 2008 2009 2010
Total Revenue Net Interest Income
KD mn
CAGR: 17%
CAGR: 19%
March 15, 2011 Final
237
137
117 100 51 45
66
219 173
0
50
100
150
200
250
2006 2007 2008 2009 2010NPLs Provisions Provision + Collateral
157%87%KD mn
Coverage of NPL net of collateral
7
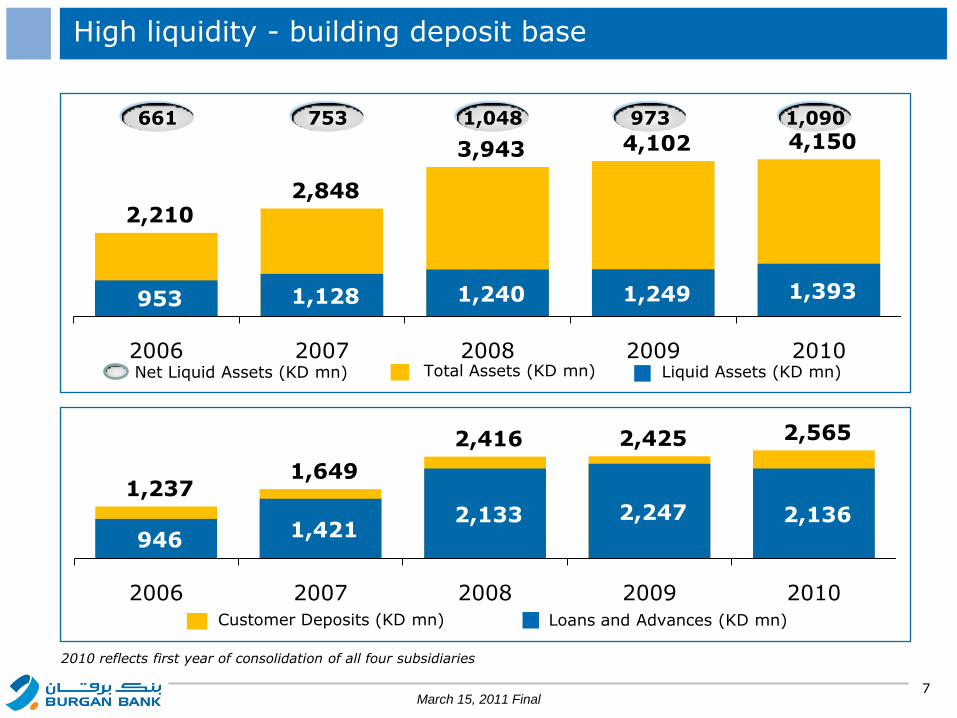
1,237 1,649
2,416 2,425 2,565
946 1,421 2,133 2,247 2,136
2006 2007 2008 2009 2010
2,210 2,848
3,943 4,102 4,150
953 1,128 1,240 1,249 1,393
2006 2007 2008 2009 2010
High liquidity - building deposit base
2010 reflects first year of consolidation of all four subsidiaries
Total Assets (KD mn) Liquid Assets (KD mn)
Customer Deposits (KD mn) Loans and Advances (KD mn)
1,0909731,048753661
Net Liquid Assets (KD mn)
March 15, 2011 Final
8
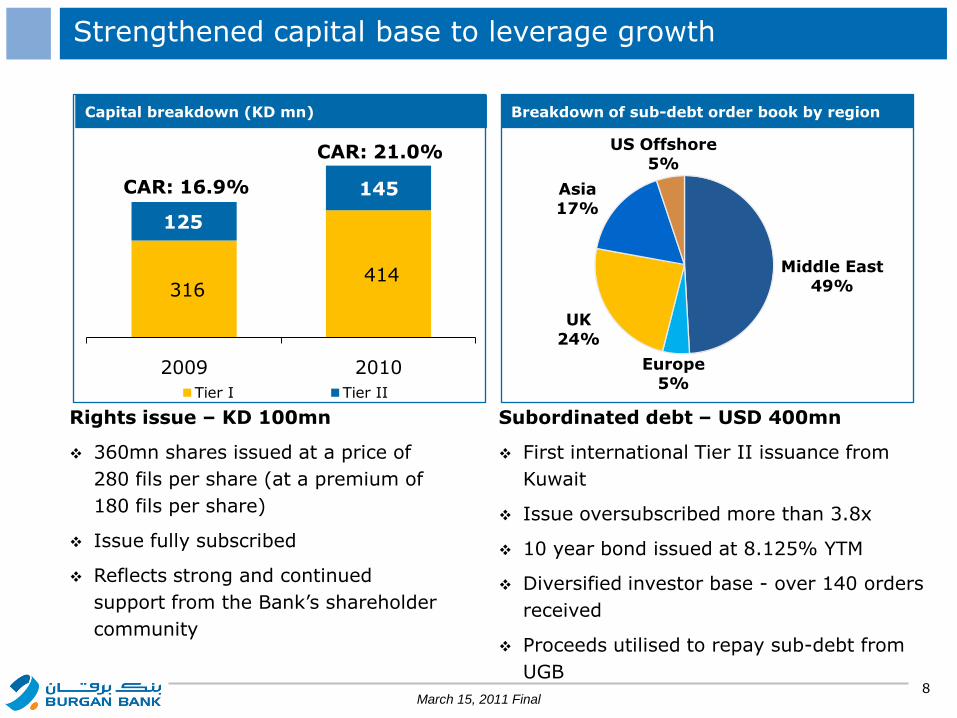
Strengthened capital base to leverage growth
Rights issue – KD 100mn
360mn shares issued at a price of
280 fils per share (at a premium of
180 fils per share)
Issue fully subscribed
Reflects strong and continued
support from the Bank’s shareholder
community
Subordinated debt – USD 400mn
First international Tier II issuance from
Kuwait
Issue oversubscribed more than 3.8x
10 year bond issued at 8.125% YTM
Diversified investor base - over 140 orders
received
Proceeds utilised to repay sub-debt from
UGB
Middle East49%
Europe5%
UK24%
Asia17%
US Offshore5%
Breakdown of sub-debt order book by region
316 414
125
145
2009 2010
Tier I Tier II
CAR: 16.9%
CAR: 21.0%
Capital breakdown (KD mn)
March 15, 2011 Final
9
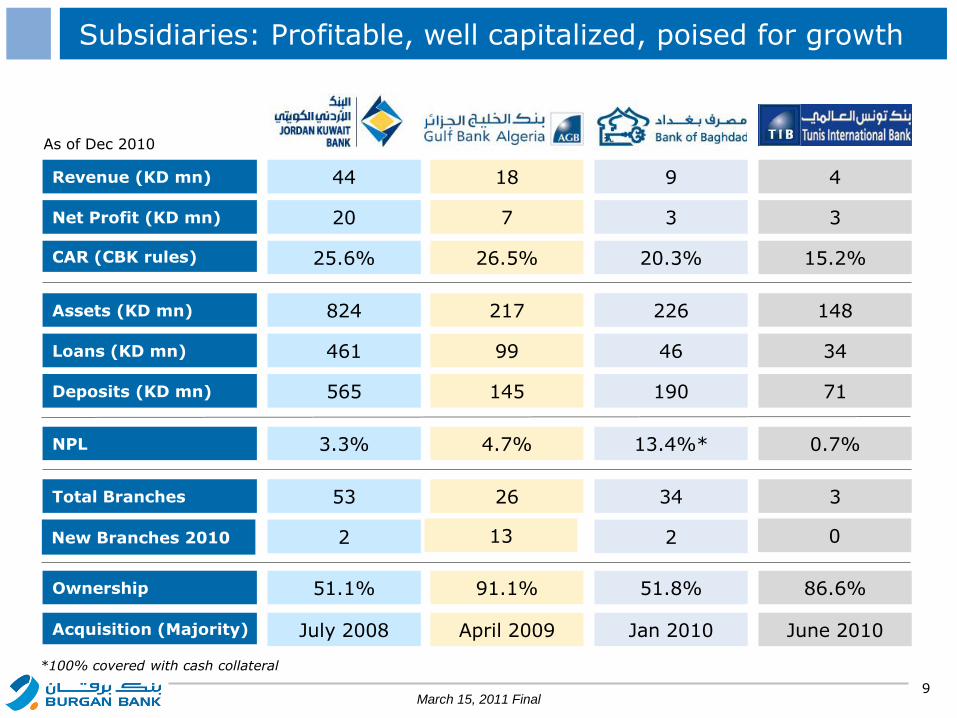
Subsidiaries: Profitable, well capitalized, poised for growth
44 18 9 4
Acquisition (Majority)
Net Profit (KD mn)
CAR (CBK rules)
Assets (KD mn)
Loans (KD mn)
Deposits (KD mn)
NPL
Total Branches
Ownership
Revenue (KD mn)
20 7 3 3
25.6% 26.5% 20.3% 15.2%
824 217 226 148
461 99 46 34
565 145 190 71
3.3% 4.7% 13.4%* 0.7%
53 26 34 3
2 13 2
51.1% 91.1% 51.8% 86.6%
July 2008 April 2009 Jan 2010 June 2010
New Branches 2010 0
As of Dec 2010
March 15, 2011 Final
*100% covered with cash collateral
10
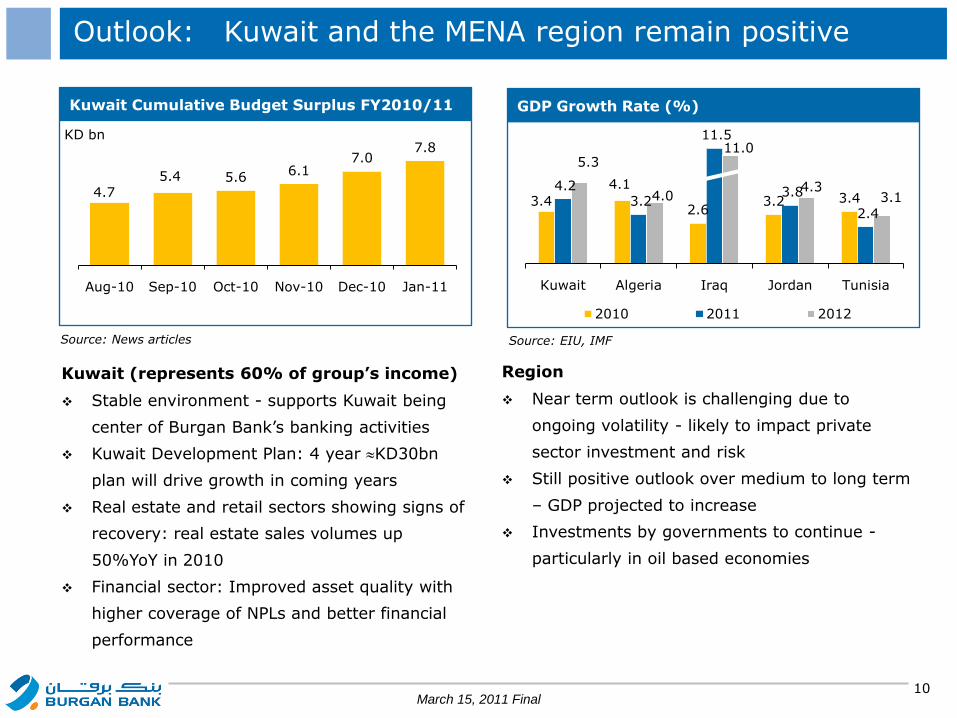
3.4
4.1
2.6 3.2 3.4
4.2 3.2
11.5
3.8
2.4
5.3
4.0
11.0
4.3 3.1
Kuwait Algeria Iraq Jordan Tunisia
2010 2011 2012
4.7 5.4 5.6
6.1 7.0
7.8
Aug-10 Sep-10 Oct-10 Nov-10 Dec-10 Jan-11
KD bn
Outlook: Kuwait and the MENA region remain positive
Kuwait (represents 60% of group’s income)
Stable environment - supports Kuwait being
center of Burgan Bank’s banking activities
Kuwait Development Plan: 4 year KD30bn
plan will drive growth in coming years
Real estate and retail sectors showing signs of
recovery: real estate sales volumes up
50%YoY in 2010
Financial sector: Improved asset quality with
higher coverage of NPLs and better financial
performance
Source: News articles
Kuwait Cumulative Budget Surplus FY2010/11
Region
Near term outlook is challenging due to
ongoing volatility - likely to impact private
sector investment and risk
Still positive outlook over medium to long term
– GDP projected to increase
Investments by governments to continue -
particularly in oil based economies
Source: EIU, IMF
GDP Growth Rate (%)
March 15, 2011 Final
11
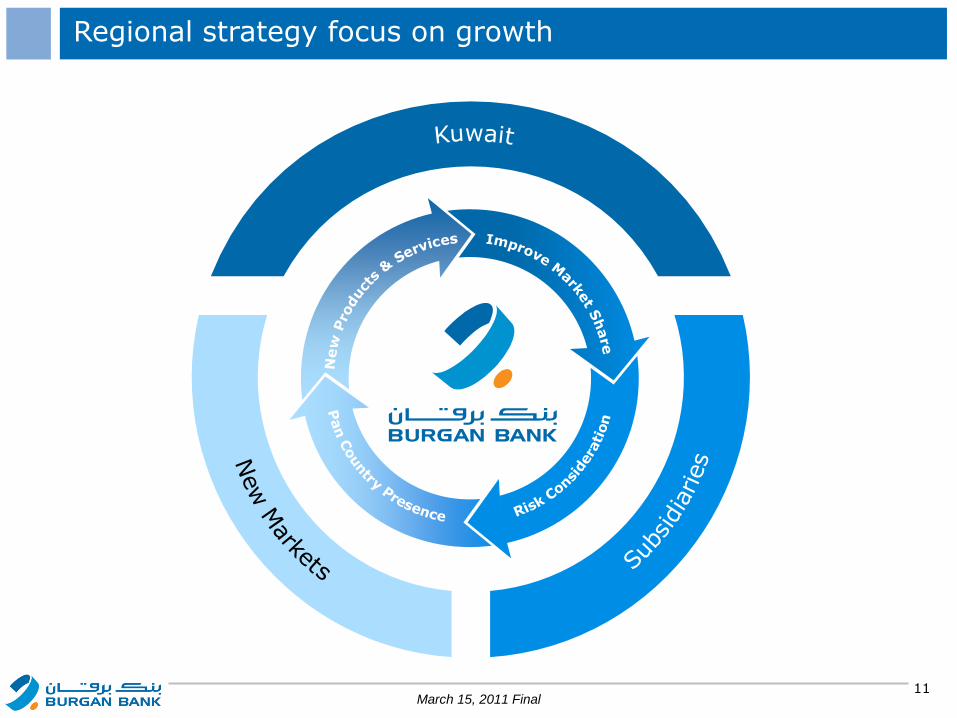
Regional strategy focus on growth
March 15, 2011 Final

12
Support clients on KDP implementation
Enlarge product offering
Improve SalesEffectiveness
Develop human capital
Upgrade technology
Enhance risk architecture
Provide superior customer experience
Grow Kuwait operations – Expand retail network
Accelerate growth in subsidiaries
Explore inorganic opportunities
Maintain strong balance sheet
Develop brand equity
Increase relative ratings
Develop higher
competitive standards
Secure undelyingstrength
Focus on short-term
revenue
Build sustainable
& diversified
growth
Supported by key initiatives
March 15, 2011 Final

13
Burgan Bank Group 2011: Optimistic trajectory
March 15, 2011 Final
Summary
2009/2010 global financial crisis
is behind us
Focus for 2011:
Foster growth in normalised
earnings
Reducing credit losses
Exploring inorganic opportunities
Supported by implementation of
a more competitive profile
1
2
3
Prudence in face of uncertainties; speed of expansion
conditioned by government spending and environmental
changes in the region

14
Attractive trading multiple and share price performance
Share Price Performance
Source: BloombergPrices and Index levels have been rebased to 100 as of 1 Jan 2010P/B as of March 09, 2011
Absolute returns P/B (x)
Burgan Bank 54% 1.5
Banking Sector 39% 2.2
General Index -7% na
March 15, 2011 Final
60
80
100
120
140
160
180
200
Jan-10 Mar-10 May-10 Jul-10 Oct-10 Dec-10 Feb-11
Kuwait General Index Kuwait Banking Sector Burgan Bank
15
Thank You
March 15, 2011 Final


