Download - abd2

NOTE TO USERS
This reproduction is the best copy available.
UMI*


UNIVERSITY OF CALIFORNIA
LOS ANGELES
ZrB2-Based Composites for
Ultra-High-Temperature Applications
A dissertation submitted in partial satisfaction
of the requirements for the degree
Doctor of Philosophy in Materials Science and Engineering
By
Do Hwan Chung
2010

UMI Number: 3463935
All rights reserved
INFORMATION TO ALL USERS The quality of this reproduction is dependent upon the quality of the copy submitted.
In the unlikely event that the author did not send a complete manuscript and there are missing pages, these will be noted. Also, if material had to be removed,
a note will indicate the deletion.
UMT Dissertation Publishing
UMI 3463935 Copyright 2011 by ProQuest LLC.
All rights reserved. This edition of the work is protected against unauthorized copying under Title 17, United States Code.
ProQuest LLC 789 East Eisenhower Parkway
P.O. Box 1346 Ann Arbor, Ml 48106-1346

© copyright by
Do Hwan Chung
2010

The dissertation of Do Hwan Chung is approved.
Suneel Kodambaka
Daniel Yang
^ ^ ^ "V //£ /0#/<o
ta Jdnn/Ming Yafid Committee/Chair
University of California, Los Angeles
2010

Dedicated to my father, my mother, my wife, and my two sons.
in

TABLE OF C O N T E N T S
LIST OF FIGURES vii
LIST OF TABLES xi
ACKNOWLEGEMENTS xii
VITA xiv
PUBLICATIONS xvi
ABSTRACT xvii
Chapter 1 Ultra-high-temperature ceramics 1
1.1 Introduction 1
1.2 Applications of ultra-high-temperature ceramics 2
References 7
Chapter 2 Literature survey of ultra-high-temperature ceramics 8
2.1 Selection of ultra-high-temperature ceramics 8
2.2 Oxidation mechanism of ZrB2-SiC ceramics 9
2.3 Mechanical properties of ZrB2-SiC ceramics 12
2.4 Spark plasma sintering 14
2.5 Liquid phase sintering .........16
References 29
Chapter 3 ZrB2-nano SiC ceramics ............................................................................32
Abstract .....................................32
3.1 Introduction........................................................... 34
3.2 Experimental procedure....................................................................................35
3.2.1 Materials 35
3.2.2 Elastic property measurements 38
IV

3.2.3 Mechanical properties 38
3.2.4 Micropillar compression test 40
3.3 Results and discussion 40
3.3.1 Densities, phases, and microstructures 40
3.3.2 Elastic moduli, hardness and fracture toughness 43
3.3.3 Micropillar compression test of ZrB2-nano SiC composite materials 45
3.4 Conclusion 47
References 72
Chapter 4 Multiphase ZrC-ZrB2-SiC ceramics 74
Abstract 74
4.1. Introduction 76
4.2. Experimental procedures 78
4.2.1 Materials 78
4.2.2 Elastic moduli, hardness, and fracture toughness measurements 79
4.2.3 Thermal and electrical conductivity measurements 80
4.2.4 Micropillar compression test 81
4.3 Results and discussion 82
4.3.1 Densities, phases, and microstructures ....82
4.3.2 Elastic moduli, hardness, and fracture toughness 85
4.3.3 Thermal conductivity 87
4.3.4 Electrical conductivity ............................................................................89
4.3.5 Micropillar compression tests of ZrC-ZrB2-SiC composites ....................91
4.4. Conclusion .......................................93
References ..........................119
V

Chapter 5 SCS 9a fiber-reinforced ZrB2-RB(Reaction-bonded) SiC composite 121
Abstract 121
5.1 Introduction 123
5.2 Experimental procedures 124
5.2.1 Fabrication 124
5.2.2 Phase analysis, density, and porosity measurements 125
5.2.3 Elastic properties, hardness, and fracture toughness measurements 126
5.2.4 Microstructure observations 126
5.3 Results and discussion 128
5.3.1 Density, porosity, and phase 128
5.3.2 Elastic moduli, hardness, and fracture toughness 129
5.3.3 Microstructural analysis 130
5.4 Conclusion 132
References 146
Chapter 6 Conclusions 148
vi

LIST OF FIGURES
Figure 1-1. Re-creation of the Shockwave during re-entry 5
Figure 1-2. Belly-down attitude during re-entry 6
Figure 2-1. Several materials with melting temperatures approaching or above 3000°C
[1] 21
Figure 2-2. ZrB2-SiC phase diagram [12] 22
Figure 2-3. The schematic diagram of a proposed oxidation mechanism for ZrB2-SiC
ceramics, (a) unoxidized ZrB2-SiC (b) the initial response during heating (c)
evolution as the temperature approaches 1500°C (d) steady state at 1500°C
[13] 23
Figure 2-4. The cross-sectional microstructure of ZrB2-SiC ceramics [13] 24
Figure 2-5. Microstructure of ZrB2-SiC ceramics [17] 25
Figure 2-6. Schematic of the SPS process [19] 26
Figure 2-7. Basic mechanism of spark plasma sintering [20] 27
Figure 2-8. Three different steps of liquid phase sintering by Kingery 28
Figure 3-1. Classification of ceramic nanocomposites 54
Figure 3-2. X-ray diffraction patterns of each composite material (a) ZSN-0 (b)
ZSN-5(c)ZSN-10(d)ZSN-20(e)ZSN-30 55
Figure 3-3. Typical FE-SEM images of each sample 56
Figure 3-4. The change of average grain size of each component.............................57
Figure 3-5. Typical TEM microstructures of each sample ...............58
Figure 3-6. Typical SiC grain locations in ZrB2-SiC composite ...............................59
vii

Figure 3-7. Typical interface between ZrB2 grain and SiC grain (ZSN-5: HRTEM
image) 60
Figure 3-8. The TEM image and EDX result of second phase, Zr(0, B)x, in ZrB2
grain, ZSN-20 61
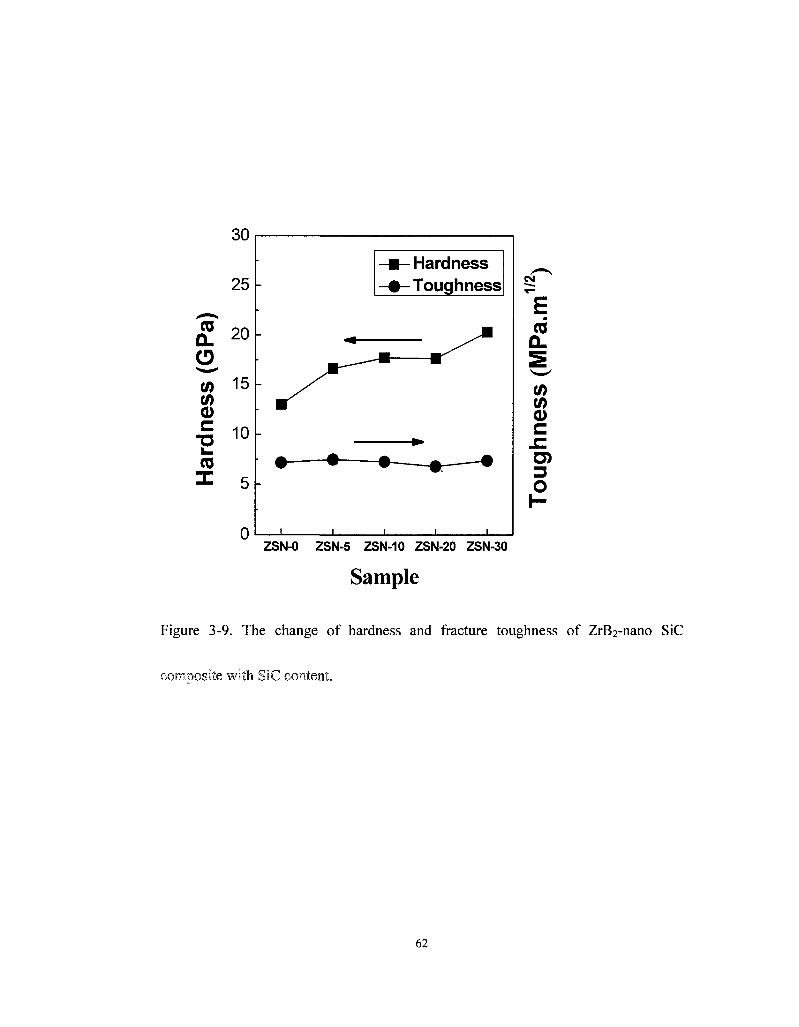
Figure 3-9. The change of hardness and fracture toughness of ZrB2-nano SiC
composite with SiC content 62
Figure 3-10. Typical cracking pattern of ZrB2-SiC composites (ZSN-0, ZSN-10, and
ZSN-20) 63
Figure 3-11. Fabricated micropillar of ZSN-0, ZSN-5, and ZSN-10 64
Figure 3-12. Stress vs. height change relation by micropillar compression test for
ZSN-0 65
Figure 3-13. Stress vs. height change relation by micropillar compression test for
ZSN-5 66
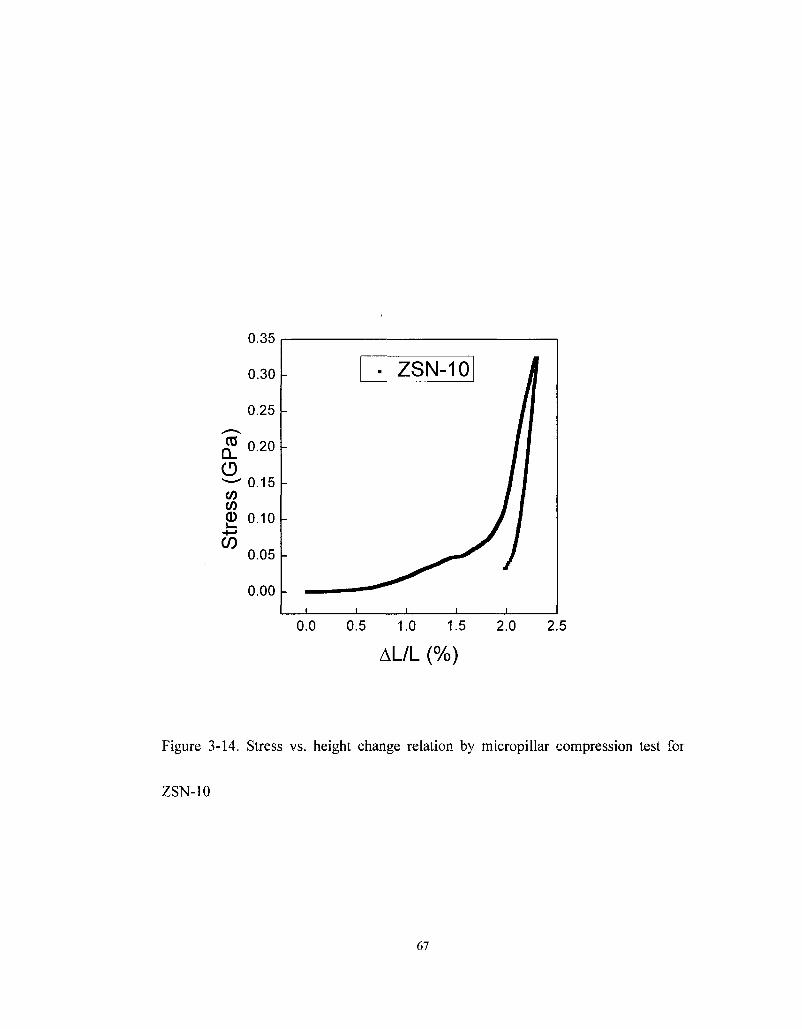
Figure 3-14. Stress vs. height change relation by micropillar compression test for
ZSN-10 67
Figure 3-15. ZSN-10 micropillar (a) before and (b) after compression 68
Figure 3-16. TEM microstructural images of ZSN-0 by the micropillar compression
test (a) Whole TEM laminar (b) Stacking fault (c) dislocation 69
Figure 3-17. TEM microstructural images of ZSN-10 by the micropillar compression
test (a) Whole TEM laminar (b) Dislocations (c) Stacking fault 70
Figure 3-18. Fracture surface images of ZSN-5 by the micropillar compression test (a)
Fracture surface of whole micropillar (b) Intragranular fracture (c)
Intergranular fracture .............................................71
viii

Figure 4-1. Typical examples of recorded shrinkage curves during the SPS cycle for
ZZS-2, ZZS-3, and ZZS-5 101
Figure 4-2. X-ray diffraction patterns for each sample; (a) ZZS-1, (b) ZZS-2, (c)
ZZS-3, (d) ZZS-4, (e) ZZS-5, (f) ZZS-6, (g) ZZS-7, (h) ZZS-8 102
Figure 4-3. Typical FE-SEM images for the ZrEb-ZrC-SiC composites 103
Figure 4-4. Typical TEM images for the ZZS-1 composite 104
Figure 4-5. Typical TEM images for the ZZS-2 composite 105
Figure 4-6. Typical TEM images of interphase interface between (a) SiC and ZrE$2
and (b) ZrB2 and ZrC 106
Figure 4-7. Typical cracking behavior of ZrC-ZrB2-SiC composites 107
Figure 4-8. Current versus voltage measured at room temperature for the
ZrC-ZrB2-SiC composites 108
Figure 4-9. Fabricated micropillar of ZZS-1, ZZS-2, ZZS-6, and ZZS-7 109
Figure 4-10. Stress vs. strain (%) curve of ZZS-1 micropillar 110
Figure 4-11. Stress vs. strain (%) curve of ZZS-2 micropillar I l l
Figure 4-12. Intragranular fracture surface of ZZS-1 micropillar 112
Figure 4-13. Intragranular fracture surface of ZZS-2 micropillar 113
Figure 4-14. Stress vs. strain (%) curve of ZZS-6 micropillar 114
Figure 4-15. Stress vs. strain (%) curve of ZZS-7 micropillar................................ 115
Figure 4-16. Dimensional and shape change of ZZS-6 micropillar 116
Figure 4-17. Typical cracking behavior of ZZS-7 micropillar................................ 117
Figure 4-18. Typical TEM images of ZZS-6 micropillar after compression stress. .118
Figure 5-1. Detailed dimensions of SCS 9a fiber-reinforced composites for fracture
toughness 135
ix

Figure 5-2. FE-SEM images of SCS 9a fiber-reinforced composite; (a) Top surface
view, (b) Cross-sectional view 136
Figure 5-3. Typical X-ray diffraction pattern of SCS 9a fiber-reinforced ZrB2-RB SiC
composite 137
Figure 5-4. Typical indentation mark and cracking pattern of SCS 9a fiber composite.
138
Figure 5-5. FE-SEM images of SCS 9a fiber-reinforced composite fracture 139
Figure 5-6. Whole cross section view of SCS 9a fiber-reinforced composite 140
Figure 5-7. Typical FE-SEM images of cracks inside and outside the composite ... 141
Figure 5-8. FE-SEM images of residual carbon from reaction bonding and EDS result.
142
Figure 5-9. The FE-SEM image of the interface between fiber and matrix 143
Figure 5-10. Typical TEM microstructures and SAED (Selected Area Electron
Diffraction) of the composite 144
Figure 5-11. Typical TEM microstructural images and EDS results of the interface
between the fiber and the matrix; (a) Carbon coating layer of the fiber (b) ZrE$2
grain (c) ZrB2 and SiC agglomerate (d) ZrB2 and SiC grains 145
x

LIST OF TABLES
Table 2-1. Physical and mechanical properties with reducing SiC particle size of
ZrB2-SiC ceramics [17] (10, 1.4, 0.7, 0.45 in sample names are starting SiC
particle size of micron) 19
Table 2-2. Physical and mechanical properties of ZrB2-SiC ceramics with different
hot pressing time and temperature [18] (A, B: ZrB2 starting powder size; A:
6um, B: 2um, 1850, 1950, and 2050: temperature; °C, 45, 90, and 180: time;
min) 20
Table 3-1. Compositions of each sample 49
Table 3-2. Densities of each sample 50
Table 3-3. Average grain sizes of ZrB2-nano SiC composite materials 51
Table 3-4. Elastic properties of ZrB2-nano SiC composite materials 52
Table 3-5. Hardness and fracture toughness of ZrB2-nano SiC composites materials 5 3
Table 4-1. Compositions of ZrC-ZrB2-SiC composites 95
Table 4-2. Densities and elastic properties of ZrC-ZrB2-SiC composites 96
Table 4-3. The measured grain size of each component ZrB2, ZrC, and SiC for
ZrC-ZrB2-SiC composies 97
Table 4-4. Hardness and fracture toughness of ZrB2-ZrC-SiC composites 98
Table 4-5. Thermal properties measured at room temperature for the ZrC-ZrB2-SiC
composites 99
Table 4-6. Electrical properties measured at room temperature for the ZrC-ZrB2-SiC
composites................................................................................................. 100
Table 5-1. Gibbs free energy of formation of ZrB2, C, ZrC, and B4C at 298K, 1000K,
and 2000K [12] 134
xi

ACKNOWLEGEMENTS
This research is supported by the National Aeronautics and Space Administration
(NASA) Glenn Research Center in Cleveland Ohio. Narottam P. Bansal is the
program manager.
I would like to give my thanks to all of the committee members, Professor
Suneel Kodambaka, Professor Daniel Yang, and Professor Jenn-Ming Yang for the
satisfaction of this dissertation.
I wish to express my deepest gratitude to professor Jenn-Ming Yang, advisor,
who introduced me to the field of ultra-high-temperature ceramics and who has
guided my doctoral studies all the way. I would like to thank you for supporting and
encouraging me throughout these years. Your incredible enthusiasm and optimistic
dedication to science has impressed me deeply. I am especially grateful for your great
ability not only to share your academic knowledge, but also to help organize my
research in a comprehensive means. Your door has always been open, and I have
immeasurably treasured your advice and guidance, both in the scientific field and in
daily life. Without your help and support, it would have been impossible for me to
complete this dissertation.
I also want to thank my father and mother for struggling with all the
accompanying difficulties so that I could concentrate on my work and smoothly finish
xii

my studies abroad. Your endless support and understanding are my driving force. Last
but not least, I would like to express my deepest gratitude to my life partner, Min Jung,
who is the light of my life. Thank you so much for our ten-year journey together, for
all the tears and happiness we have had together, and also for your endless support,
encouragement and love. With you, life will never be boring.
All my friends are of great importance to me. All of you enrich my life and make
it more colorful and joyful. All those wonderful times are unforgettable and highly
appreciated. I wish to thank all of you as much as I can. I cherish your friendship and
consideration.
Xll l

V I T A
1992-1995 Completion of two school years in Chemistry
Daejeon University
Daejeon, Korea (R.O.K.)
1993-1994 Military Service, Korea (R.O.K.)
Corporal, Army
1996-1998 Bachelor of Science in Chemistry
Sejong University
Seoul, Korea (R.O.K.)
1999-2000 Bachelor of Science in Ceramic Engineering
Yonsei University
Seoul, Korea (R.O.K.)
2001-2002 Master of Science in Ceramic Engineering
Seoul, Korea (R.O.K.)
>003~2004 Master of Science in Chemical Engineering and
Materials Science
University of Southern California

Los Angeles, CA, USA
2005-2010 Doctor of Philosophy in Materials Science and
Engineering
University of California, Los Angeles
Los Angeles, CA, USA
XV

PUBLICATIONS
[1] Seung Hyun Lee, Do Hwan Chung, and Joon Keun Park, (2010), In-situ surface
stress and magnetic properties of the CoCrX(X=Pt, Ta)/CrTi bilayer thin films during
sputter-deposition, Current applied physics, forthcoming.
[2] Shu-Qi Guo, Yutaka Kagawa, Toshiyuki Nishimura, Dohwan Chung, Jenn-Ming
Yang, (2008), Mechanical and physical behavior spark plasma sintered ZrC-ZrB2-SiC
composites, Journal of the European ceramic society, Volume 28, ppl279-1285.
[3] Kihyun Yoon, Do Hwan Chung, Byungduk Yang, Jaehyuk Jang, Jongheui Kim,
(2003), Preparation and characteristics of PTFE (Polyteterafluoroethylene)
composites for microwave circuit board, Journal of the Korean ceramic society,
Volume 40, pp735-738.
[4] Jo Jung, Ho Sung Lee, Kihyun Yoon, Do Hwan Chung, and Byungduk Yang,
(2002), Manufacturing method of PTFE composite board, Korea Patent, Application
number 1020020078716.
XVI

ABSTRACT OF THE DISSERTATION
ZrB2-Based Composites for
Ultra-High-Temperature Applications
by Do Hwan Chung
Doctor of Philosophy in Materials Science and Engineering
University of California, Los Angeles, 2010
Professor Jenn-Ming Yang, Chair
This dissertation presents an investigation into the processing, microstructure,
and mechanical behavior of ZrB2-based composites for ultra-high-temperature
applications. Various forms of SiC including nano-sized particles, micron-sized
particles, and continuous fibers were used as reinforcement.
Three major investigations were conducted in this dissertation. First, the effect of
incorporating nano-sized SiC particles into ZrB2 was investigated. Spark plasma
xvii

sintering was used to consolidate nano-sized SiC/ZrB2 composite. The detailed
microstructure of the composite was analyzed using transmission electron microscope.
Micropillar compression test was also conducted. It was found that incorporation of
nano-sized SiC effectively hindered the grain growth of ZrB2. The second study
focused on the ternary ZrC-ZrB2-SiC ceramics. The fully densed ceramics were
prepared by spark plasma sintering. Elastic modulus, hardness, fracture toughness,
thermal conductivity, and electrical conductivity of ternary ZrC-ZrB2-SiC ceramics
were measured. It was found that the fracture toughness of ternary ZrC-ZrB2-SiC
ceramics is comparable to that of the ZrB2 ceramics and ZrB2-SiC ceramics. In
addition, micropillar compression tests revealed information about typical
longitudinal cracking behavior and generation of stacking faults. The third part of this
dissertation focused on studying the effect of incorporating continuous SiC fibers on
the microstructure and properties of ZrB2. The composite was consolidated by
conventional hot pressing method. The chemical reaction between fiber and matrix
materials was not observed based on thermodynamic calculation and TEM
microstructural analysis. The fracture toughness of composite was measured to be
four times higher than that of matrix materials. However, extensive matrix cracking
was observed due to mismatch in thermal expansion coefficient between the fiber and
xviii

matrix.
Finally, the challenge and future research needs in developing
ultra-high-temperature ceramics are discussed.
XIX

Chapter 1
Ultra-high-temperature ceramics
1.1 Introduction
Ultra-high-temperature ceramics (UHTCs) are a family of compounds that are
chemically and physically stable at high temperatures (e.g., above 2400 °C) and in
reactive atmospheres (e.g., monatomic oxygen) [1]. UHTCs are famous for
possessing some of the highest melting temperatures of known materials. In addition,
they are very hard, have good wear resistance, mechanical strength, and relatively
high thermal conductivities (compared to other ceramic materials). Because of these
characteristics, UHTCs are ideal for thermal protection systems, especially those that
require chemical and structural stability at extremely high operating temperatures [2].
Some of the earliest work on UHTCs was conducted by the company ManLab in
the early 1960s, under a research program funded by the Air Force Materials Lab
(AFML) [3,4]. Research on UHTCs was started to meet the need for
high-temperature materials that would allow the development of maneuverable
hypersonic flight vehicles. Since then, intermittent research has made some progress,
but several significant challenges remain in the use of UHTCs, and these materials
have not yet to be widely implemented [2]. As the interest in monolithic UHTCs has
l

risen again in the early 1990s, high costs of raw materials have led to many new
investigations into different methods of fabricating UHTCs, such as reactive hot
pressing and pressureless sintering by liquid infiltration and reaction [5,6].
1.2 Applications of ultra-high-temperature ceramics
One application of UHTCs is the hypersonic flight vehicle whose speed begins
at four to five times the speed of sound (Mach 4 or 5). The current desired speed of
this vehicle is Mach 6, which produces a surface temperature of about 1400 °C. In
addition, the materials of this vehicle should be sustainable for several hundreds of
hours in this temperature range and in an oxidizing atmosphere. UHTCs with
improved mechanical and thermal properties are required for hypersonic flight
vehicle parts such as airframe components, engine cowls, windows, propulsion
system components, and control surfaces [1].
A second application of UHTCs is the orbital/re-entry vehicle. The maximum
temperature of the nose cone and the leading edges of the wings is about 1650 °C
during re-entry. To reduce the large amount of heat generated, blunt edged designs
are employed, which produce the re-creation of the blunt-body shock wave that
develops during re-entry. To take a full advantage of this effect, the vehicle re-enters
2

the atmosphere with a belly-down attitude. The re-creation of shockwave and
belly-down attitude is shown in figure 1-1 and 1-2, respectively. However, the blunt
edged design of the vehicle give two major problems. The first problem is limited
maneuverability which is from a narrow 'abort-to-land' window at launch and limited
cross-range on re-entry. The second major problem is communication blackout period
which is due to barrier layer between shockwave and blunt body described in figure
1-1. As result of these drawbacks of blunt body design, the future re-entry vehicles
should be employed with sharp leading edges and trailing edges, which improve
aerodynamic performance by allowing for laminar flow over control surfaces. Thus,
the vehicles with sharp leading edges and trailing edges enable an increased
abort-to-land window on launch. The ability to fly faster at any given altitude also
increases the cross-range for landing. Improved materials are needed for leading and
trailing edges, a thermal protection system, other hot structure components, windows,
and control surfaces.
A final application is the propulsion system. Propulsion systems can include
air-breathing engines such as turbines, ramjets, and scramjets. Rocket motors are
currently the focus because they have a significant opportunity for UHTCs. However,
rocket motors have a very limited life expectancy because of the extreme
3

temperatures (over 3000 °C) and highly reactive environment (dissociating materials).
Therefore, the main interesting point in these applications is not whether a material
will fail, but how long it will last before failure.
4

•I .
-3r *
"SSfe
Sb
Figure 1-1. Re-creation of the Shockwave during re-entry
5

Figure 1-2. Belly-down attitude during re-entry
6
References
[1] William G. Fahrenholtz and Gregory E. Hilmas 2004 Draft of NSF-AFOSR Joint Workshop on Future Ultra-High Temperature Materials.
[2] Sylvia Johnson, Matt Gasch, and Mairead Stackpoole, 2009 Assessment of the
state of the art of ultra high temperature ceramics, NASA technical report
ARC-E-DAA-TN486.
[3] Kaufman, L. and Clougherty, E. V. 1966 Investigation of boride compounds for
very high temperature applications RTD-TRD-N63-4096, Part III, ManLabs Inc.
[4] Clougherty, E. V, Kalish, D. and Peters, E. T. 1968 Research and development of
refractory oxidation resistant diborides AFML-TR-68-190, ManLabs Inc.
[5] Woo, S. K., Kim, C. H. and Kang, E. S. 1994 Fabrication and microstructural
evaluation of ZrB2/ZrC/Zr composites by liquid infiltration J. Mat. Sci. [2]
5309-5315.
[6] Zhang, G, Deng, Z., Kondo, N., Yang J., and Ohji, T. 2002 Reactive hot pressing
of ZrB-2-SiC composites, J. Am. Ceram. Soc. [83] 2330-2332.
7

Chapter 2
Literature survey of ultra-high-temperature ceramics
2.1 Selection of ultra-high-temperature ceramics
The several materials with melting temperatures approaching or above 3000 °C
include several oxides, nitrides, carbides, borides, and refractory metals listed in
figure 2-1 [1]. In the case of real engineering applications, high melting temperature
is not the only criterion for materials selection. Oxidation resistance, strength at room
temperature or elevated temperature, thermal conductivity, thermal expansion, density,
fabricability, and cost are more important properties to determine optimal materials.
Applications I mentioned above will involve exposure to oxidizing fuels or aero
heating so that all non-oxide materials will undergo oxidation to form some
combination of solid, liquid, and gaseous reaction product. The oxides are reasonable
to consider for use in oxidizing environments, but these materials are not suitable for
those application because of poor thermal shock resistance due to high thermal
expansion and low thermal conductivity [2]. Several borides, carbides, and nitrides of
group IV and V elements are most suitable for these applications.
All borides, carbides, and nitrides listed have similar properties, such as high
melting point, moduli, and hardness due to strong covalent bonding. However, the
borides tend to have higher thermal conductivity compared to carbides and nitrides,
8

which give them better thermal shock resistance and make them the most ideal for
many high temperature applications [3,4,5]. Among the borides in figure 2-1, ZrE$2
and HfB2 have received the most attention because their oxidation resistance is
superior to the other borides, due to the stability of ZrC>2 and HfC^ scales that form on
these materials at elevated temperatures in oxidizing environments [1]. In addition,
the combination of other refractory phases such as SiC or MoSi2 improves the
strength and oxidation resistance [6]. In this study, ZrB2-based ceramics and
ZrB2-based ceramic composites will be discussed.
2.2 Oxidation mechanism of ZrB2-SiC ceramics
All the advantages mentioned above of borides (especially ZrB2 and HfB2) are
leading many researchers to investigate various properties. Even though the oxidation
mechanism is beyond the scope of this research, it will be discussed in detail in this
chapter since oxidation resistance of these materials is very important as well as
others and the most widely studied recently.
Pure ZrB2 crystal oxidized to Z1O2 crystal and B2O3 liquid in air between
700-1100 °C. Parabolic (diffusion controlled) kinetics are observed because it is
weight gain stage due to formation of B2O3 and Zr02 and kinetics are controlled by
9

the transport of oxygen through B2O3 [7]. The oxidation rate increases para-linearly
because overall rate of mass change is a combination of weight gain due to formation
of B2O3 and ZrC>2 and weight loss due to volatilization of B2O3 between 1100-1400
°C [8,9]. Above 1400 °C, the rate of evaporation of B2O3 is greater than its rate of
production, leaving a non-protective porous ZKD2 scale, which is unfavorable for the
applications. In these temperature ranges, rapid linear kinetics were observed because
mass gain due to formation of ZrC>2 is much greater than mass loss due to
consumption of ZrB2 [10].
However, the oxidation resistance of ZrB2 was improved by the addition of SiC
due to the formation of silica-rich scales on surfaces above 1100 °C. As the volatility
of SiC>2 scales is lower than that of B2O3 scales, diffusion controlled kinetics was
observed in these temperature ranges [6, 11].
William G. Fahrenholtz, et al. proposed oxidation mechanisms of ZrB2-SiC
ceramics to several steps up to 1500 °C. The first step is the so-called unoxidized
ZrB2-SiC stage. In this stage, SiC particles are uniformly dispersed in a ZrB2 matrix
and solid solution is not expected because the solid solution limit for each component
is low, shown in the ZrB2-SiC phase diagram in figure 2-2 [12, 13]. The second step
is the initial response during heating below -1200 °C and the main oxidation
10

mechanism is the oxidation of ZrB2 with reaction (1) in this stage. The parabolic
kinetics can be observed due to hindering of oxygen diffusion through the scale
composed of B2O3, ZrC>2, and SiC particles, which do not oxidize significantly. The
third step is evolution as the temperature approaches 1500 °C. In this stage, the
composition of the scale changes significantly from B2O3, ZrC>2, and SiC to ZrC>2 and
Si02 because oxidation of SiC is the dominant oxidation with reaction (2) and B2O3
start evaporating in this temperature range. Compared to pure ZrB2 kinetics in this
temperature range, parabolic kinetics can also be achieved by the SiC^-based scale
rather than B203-based scale. The last step is steady state at 1500 °C. The most
important characteristics of this stage are the generation of SiC depleted layer
between unoxidized ZrB2-SiC layers and a Zr02+Si02 layer and SiC<2 rich layer on
the top surface. The thickness of these two layers continuously increases because the
source of Si is the active oxidation of SiC, due to the low oxygen partial pressure in
the SiC depleted layer. Figure 2-3 shows the schematic diagram of a proposed
oxidation mechanism and figure 2-4 shows the oxidized cross sectional
microstructure of ZrB2-SiC ceramics [13].
As the temperature increases, the pressure in the SiC depleted region will
increase until it is high enough to rupture the scale or cause failure at one of the
11

interfaces in the layered structure. This may occur when the total pressure in the SiC
depleted region reaches -1.013 X 10⁵ Pa, which is estimated to occur at -1775 °C
[14].
ZrB2(cr) + 5/202(g) -»• Zr02(cr) + B203(1) Reaction (1)
SiC(cr) + 3/202(g) -> Si02(l) + CO(g) Reaction (2)
2.3 Mechanical properties of ZrB2-SiC ceramics
As ZrB2 have high melting temperature and strong covalent bond characteristics,
the densification of ZrB2 powders requires very high temperature (2100-2300 °C) and
pressure-assisted sintering procedures [15]. However, these processing conditions
normally produce coarsening of the final microstructures, which leads to the
formation of microcracks due to thermal expansion mismatch during cooling. This
leads to degradation in the mechanical properties such as hardness and strength [16].
A lot of research related to high temperature properties such as oxidation
resistance and thermal shock resistance with various processing and combination of
additives have resulted in many achievements, but large amount of work has not been
carried out to improve mechanical properties and to understand fracture mechanism
scientifically in ambient temperature or high temperature.
12

Sumin Zhu, et al. studied the influence of silicon carbide particle size on the
microstructure and mechanical properties of ZrB2-SiC ceramics. The mechanical
properties (including physical properties) are listed in table 2-1 and typical
microstructures of ZrB2-SiC ceramics with four different SiC starting powder size
from lOum through 0.45um are shown in figure 2-5. The reduction of SiC grain size
leads to an increase in relative density, hardness, and flexural strength, but no effect
with reduction of SiC grain size are found on the modulus, Poisson's ratio, and
fracture toughness [17].
Alireza Rezaie, et al. researched the effect of hot pressing time and temperature
on the microstructure and mechanical properties of ZrB2-SiC. The physical and
mechanical properties of ZrB2-SiC ceramics with two different starting powder sizes
of ZrB2 (A: 6um, B: 2um), three different hot pressing temperatures, and time are
listed in table 2-2. As the hot pressing temperature and time increase, ZrB2 and SiC
grain sizes increase, but fracture toughness and flexural strength decrease. Modulus
and hardness are not related to the hot pressing temperature and time [18].
The results from the these two recent works indicate that SiC starting powder
size and sintering temperature and time play an important role in promoting physical
and mechanical properties of ZrB2-SiC ceramics.
13

2.4 Spark plasma sintering
Spark plasma sintering (SPS) is one of the powder consolidation methods with
applied pressure and pulsed DC current simultaneously. Powders are placed in a
graphite die and heating is affected by passing through the die and sample if the
sample is conductive while a pressure is applied on the powder. The schematic SPS
process is shown in figure 2-6 [19].
Sintering is realized by subjecting the green body to arc discharges generated by
pulsed DC current. An electrical discharge process takes place on a microscopic level
and accelerates material diffusion. The basic mechanism of neck formation by spark
plasma is shown in figure 2-7. When a spark discharge appears in a gap or at the
contact point between particles, local high temperature states of several to tens of
thousands of degrees centigrade are generated momentarily. This causes evaporation
and melting on the particle surfaces, and necks are formed around the area of contact
between particles [20]. These necks gradually develop and plastic transformation
progresses during sintering, resulting in a sintered compact of over 99% density.
Since only the surface temperature of the particles rises rapidly by self-heating,
particle growth of the starting powder materials is controlled. Therefore, a precision
sintered compact is manufactured in a shorter time. At the same time, bulk fabrication
14

of particles with amorphous structure and nano-crystallization formation are now
possible without changing their characteristics [21].
Compared to conventional hot pressing methods, the most important difference
is the fast heating rate to as high as 1000 °C. Typically, the sample and the die are
heated by radiation from an enclosing furnace in the hot-pressing method. In contrast,
the die and sample are heated by Joule heating from a current passing through them if
the sample is conducting by the SPS method. However, in addition to providing heat,
the pulsed DC current has been assigned another role: that of creating plasma. The
plasma is proposed to cause a cleansing effect on the surface of the particles, leading
to sintering enhancement [19].
The advantages of the SPS method are: (a) low power consumption
(approximately one-fifth of Hot Pressing), (b) the absence of sintering aids, (c)
control of the thermal gradient (for functional graded materials (FGMs)), (d) selective
control of the density in specified regions, (e) accurate control of the porosity, (f)
single step sintering-bonding, (g) particle surface cleaning, (h) high heating rate and
(i) near-net-shape capability. The short sintering time is particularly suitable for: (a)
preserving initial powder grain size or nanostructure, (b) consolidating amorphous
materials, (c) improving bonding strength between particles and (d) controlling phase
15

reactions or decomposition (in the case of composites) [22].
Many improvements of mechanical and physical properties of materials by SPS
method were reported from the researchers who investigated ultra-high temperature
ceramics. Therefore, SPS is the most promising consolidation method for
ultra-high-temperature ceramics which require high temperature with fast heating rate
and pressure to maintain fine microstructure.
2.5 Liquid phase sintering
Liquid phase sintering (LPS) is a sintering process that involves liquid and solid
particles. The liquid can be present during the entire sintering process or during a
specific stage of the sintering cycle. They are two basic methods to obtain liquid
phase: (i) Using mixed powders of differing characteristics; and (ii) Taking advantage
of the interaction between two or more components or from the formation of a
eutectic liquid [23].
According to Kingery's model, the liquid phase sintering process has three
different steps that may in certain cases be partly overlapped. Figure 2=8 shows the
three steps of liquid phase sintering process by Kingery, et al. [24].
The first step, rearrangement, takes place right after liquid phase forms with
16

rapid partial densiflcation due to the capillary force exerted by the wetting liquid on
the surface of solid particles. The elimination of porosity takes place as the system
minimizes its surface energy. The most favorable features for rearrangement are: (i) a
homogeneous distribution of a congruently melting liquid that wets the particles
present; (ii) the solid particles are soluble in the liquid; (iii) a large solubility ratio.
The rate and extent of shrinkage depend upon the viscosity and quantity of liquid
phase formed and on its wetting properties [25].
The second step, the so-called solution precipitation step, occurs due to a
difference in solubility. This establishes a concentration gradient in liquid phase,
because small grains are more soluble that large grains. The atoms can be transported
from small grains to large grains by diffusion, so that the large grains grow at the
expense of the small grains. This process is coarsening or ripening. The two driving
forces of this step are the reduction of interfacial energy and the capillary force. This
process relies strongly on two critical steps: dissolution of solid into the liquid and
diffusion through the liquid. If the transport is limited by mass transfer from the
source to the sink, this process is diffusion-controlled; if the transport is confined by
interfacial dissolution or precipitation, the process is reaction-controlled [26-28].
The final step is microstructure coarsening and solid-state sintering. A solid
17

skeleton is formed, and grain coalescence occurs. The rigidity of the solid skeleton
hinders further rearrangement, although microstructure coarsening continues by
diffusion. In this case, the residual pores will enlarge if they contain entrapped gas
that results in swelling. The densification rate is greatly decreased during this part of
the sintering cycle [29].
18

Matei isil
ZS10
ZS1.-1
ZSO.-!
ZS0.45
Relativedensit} (%)
9".4
98.9
98.T
99.8
Avei age SiC gi nin size (Jim)
6.3±2 9
2.1±0."
1.6±0.7
1.0±0.4
V
0 16
0.15
0.15
0.16
E (GPvl)
4 "9±5
509±3
515±7
5 2 0 + -
HV0.2 (GPa)
1".5±0.4
19.1±1.0
19.3±0.6
20.7±1.0
KK (MPa m1'2)
4.5±0.1
4.3±0.3
4.2±0.2
4.6±0.1
<r(MPa)
389±45
805±"1
83"±116
909±136
Table 2-1. Physical and mechanical properties with reducing SiC particle size of
ZrB2-SiC ceramics [17] (10, 1.4, 0.7, 0.45 in sample names are starting SiC particle
size of micron).
19

Sample
A-1850-45
A-1950-45
A-2050-45
B-1850-45
B-1950-45
B-2050-45
B-2050-90
B-2050-180
AveZrB :
grain size (um)
2.1 ± 1.3
3.3 ± 1.5
3.7 ± 1.5
2.2 ± 1.2
2.5 ± 1.8
3.5 ± 2.0
3.8 ± 2.0
4.7 ± 3.0
Ave SIC grain size (um)
1.5 ± 0.7
2.5 ± 1.1
3.1 ± 1.3
1.2 ± 0.6
1.7 ± 0.8
2.0 ± 0.8
2.0 ± 0.9
2.7 ± 1.0
E (GPa)
503 ± 6
501 ± 1
503 ± 1
516+3
507 ± 3
505 + 2
508 ± 4
505 ± 1
H (GPa)
22 ± 2
22 ± 2
23 ± 2
20 ± 2
22 ± 2
23 ± 1
22 ± 1
22 ± 1
K IC(MPa.m1:)
3.9 ± 0.1
4.0 ± 0.2
4.3 ± 0.2
5.5 ± 0.3
5.2 ± 0.4
4.3 ± 0.2
4.2 ± 0.1
4.5 ± 0.2
<r(MPa)
888 ± 151
770 ± 133
720 ± 38
1063 ± 91
1060 ± 59
854 ± 88
850 ± 100
804 ± 73
Table 2-2. Physical and mechanical properties of ZrB2-SiC ceramics with different
hot pressing time and temperature [18] (A, B: ZrB2 starting powder size; A: 6um, B:
2(4.m, 1850, 1950, and 2050: temperature; °C, 45, 90, and 180: time; min)
20

Metals Oxides Borldes Carbides Nitrides
Material Family
Figure 2-1. Several materials with melting temperatures approaching or above 3000
°C[1]
21

3200
3000
"I 1 T 1 r
s3050° \
\ \ Liquid
2800 r
.2600
2400
2200
2000
L
2760°/-
I H / I
\ \
\ \ \ ' I
2270° \ / i-
J
J L__J L
(77%) M
I I H
j I i L _ J 1 0
2rB2
20 40 60
Mol % 100 SiC
Figure 2-2. ZrB2-SiC phase diagram [12]
22

> 2rB2 + SIC
ZK>2 + B2O3 + SiC
ZrB rSiC
9EL
'-1* ;v*™ • . ? v - * * v 7"; •7"r*,'~,|~
MrMMOT itei«MMfr Af t 11a
^-ZrO^SlOa
> ZrB rSiC
S i0 2
ZrO2 + S I0 2
ZrB2 (SiC-depIeted)
ZrB2 + SiC
Figure 2-3. The schematic diagram of a proposed oxidation mechanism for ZrB2-SiC
ceramics, (a) unoxidized ZrB2-SiC (b) the initial response during heating (c)
evolution as the temperature approaches 1500 °C (d) steady state at 1500 °C [13].
23

SiO;
Depleted of SiC
• ZrB2 -SiC
Figure 2-4. The cross-sectional microstructure of ZrB2-SiC ceramics [13]
24

Figure 2-5. Microstructure of ZrE$2-SiC ceramics [17]
(a) ZSIO (b) ZS1.4 (c) ZS0.7 (d) ZS0.45
25

Pressure control
Power Supply
Figure 2-6. Schematic of the SPS process [19]
26

Applied Pressure
Particle
Electron Flow Generation of Spark Impact Diffusion Bonding Plastic Deformation
Particle
Applied Pressure
Figure 2-7. Basic mechanism of spark plasma sintering [20].
27

Figure 2-8. Three different steps of liquid phase sintering by Kingery
(I) Rearrangement (II) Solution-precipitation (III) Microstructure coarsening and
solid state sintering.
28

References
[1] William G. Fahrenholtz, Gregory E. Hilmas, Inna G. Talmy, and James A.
Zaykoski (2007) Refractory diborides of zirconium and hafnium J. Am. Ceram. Soc,
Vol.90, Issue 5, pl347-1364
[2] E. Wuchina, E.Opila, M.Opeka, W. Fahrenholtz, and I. Talmy (2007) UHTCs:
Ultra-high temperature ceramic materials for extreme environment applications, The
electrochemical society Interface, p30-36
[3] Courtright, E. L., Graham, H. C., Katz, A. P. and Kerans, R. J. (1992) Ultra high
temperature assessment study- ceramic matrix composites AFWAL-TR-91-4061
Wright Patterson Air Force Base Ohio
[4] Culter, R. A. (1991) Engineering properties of borides ASTM Engineered
materials handbook, Vol 4-Ceramics and glasses, Schneider, S. J., Technical
chairman, p787-803
[5] Guillermet, A. F. and Grimvall, G (1991) Phase stability properties of transition
metal diborides Am. Inst. Phy. Conf. Proa, [231] p423-431
[6] W. C. Tripp, H. H. Davis, and H. C. Graham (1973) Effect of an SiC addition of
the oxidation of ZrB2, Ceramic Bulletin 52(8) p612-616
[7] R. J. Irving and I. G. Worsley (1968) Oxidation of titanium diboride and
zirconium diboride at high temperatures, J. Less-Common Metals, 16 [2] pl03-l 12.
[8] W. C. Tripp and H. C. graham (1971) Thermogravimetric study of the oxidation
of ZrB2 in the temperature range of 800-1500 °C, J. Electrochem. Soc, 118 [7]
pi 195-1199.
[9] F. Monteverde, A. Bellosi (2003) Oxidation of ZrB2-based ceramics in dry air J.
electrochem. Soc, 150 [11] p552-559.
[10] A. L. Chamberlain, W. G. Fahrenholtz, and G. E. Hilmas, Oxidation of ZrB2-SiC
ceramics under atmospheric and reentry conditions Refractory Appl. Trans., 1 [2]
29

pl-8.
[11] H. C. Graham, H. H. Davis, I. A. Kvernes, and W. C. Tripp (1971)
Microstructural features of oxide scales formed on zirconium diboride materials
pp35-48 in Ceramics in severe environments: Materials Science Research.
[12] S. S. Ordanyan, A. I. Dmitriev, and E. S. Moroshkina, (1989) Izv. Akad. Nauk
ASSR, Neorg. Mater.,25 [10] pi752-1755; Inorg. Mater. (Engl Transl.), 25 [10]
pl487-1489.
[13] W. G. Fahrenholtz, (2007) Thermodynamic analysis of ZrB2-SiC oxidation:
Formation of a SiC-depleted region, J. Am. Ceram. Soc, 90 [1] pl43-148
[14] M. M. Opeka, I. G. Talmy, and J. A. Zaykoski, (2004) Oxidation-based materials
selection for 2000 °C+ hypersonic aerosurfaces: Theoretical considerations and
historical experience, J. Mater. Sci. 39 [19] p5887-5904.
[15] K. Upadhya, J. M. Yang, and W. P. Hoffman, (1997) Materials for ultra high
temperature structural applications, Am. Ceram. Soc. Bull., 76 [12] p51-56.
[16] C. Mroz, (1995), Titanium diboride, Am. Ceram. Soc. Bull., 74 [6] pl58-159.
[17] Sumin Zhu, W. G. Fahrenholtz, and G. E. Hilmas, (2007) Influence of silicon
carbide particle size on the microstructure and mechanical properties of zirconium
diboride-silicon carbide ceramics, J. Euro. Ceram. Soc, 27 p2077-2083.
[18] Alireza Rezaie, W. G. Fahrenholtz, and G. E. Hilmas, (2007) Effect of hot
pressing time and temperature on the microstructure and mechanical properties of
ZrB2-SiC, J. Mater. Sci., 42 p2735-2744.
[19] Z. A. Munir, U. Anselmi-Tamburini, and M. Ohyanagi, (2006) The effect of
electric field and pressure on the synthesis and consolidation of materials: A review
of the spark plasma sintering method, J. Mater. Sci., 41, p763-777.
[20] K. Lu, (2008), Sintering of nanoceramics, International Materials Review, 53 [1]
p21-38
30

[21 ] http ://www. scm-sps.com/e_htm/whatsps_e_htm/whatsps4_e.htm
[22] Salvatore Grasso, Yoshio Sakka, and Giovanni Maizza (2009) Electrical current
activated/assisted sintering (ECAS): a review of patents 1906-2008, Sci. Technol.
Adv. Mater. 10, 053001, pi-24
[23] R. M. German, (1985) Liquid phase sintering, Plenum press, New York and
London
[24] W. D. Kingery (1959) Densification during sintering in the presence of a liquid
phase. I. Theory., J. App. Phy 30 p301-306
[25] W. J. Huppmann and H. Riegger (1975) Modeling of rearrangement processes in
liquid phase sintering, Acta Metallurgica, Vol23, p965-971.
[26] I. M. Lifshitz, and V. V. Slyozov (1961) The kinetics of precipitation from
supersaturated solid solutions, J. Phy. Chem. Soli., 19 p35-50
[27] C. Wagner, (1961) Theory of precipitate change by redissolution, J. electrochem.,
65p581-591.
[28] A. J. Ardell (1971) Effect of volume fraction on particle coarsening. Theoretical
consideration. Acta metallurgica 20 p61-71
[29] W. D. Kingery, H. K. Bowen, and D. R. Uhlmann (1976), Introduction to
ceramics, Wiley Interscience, 2nd edition, Chapter 10.
31

Chapter 3
ZrB2-nano SiC ceramics
Abstract
The microstructure and mechanical properties of ZrB2 composites with
nano-sized SiC particles were examined. The composites were consolidated by spark
plasma sintering. The microstructure of the as-consolidated composites was examined
by field emission scanning electron microscopy and transmission electron microscopy.
The elastic constants of the composites were measured using an ultrasonic technique,
whereas the hardness and fracture toughness of the composites were determined using
an indentation measurement. The presence of intergranular and intragranular SiC
improves the sinterability and limits the grain growth of ZrB2 effectively until 10
vol% of nano-sized SiC particles. However, the grain size of SiC increased with an
increase of nano-sized SiC content due to agglomeration by the mixing process. In
addition, each phase of ZrB2 and SiC were confirmed by SAED (Selected Area
Electron Diffraction) and a second phase, Zr(0, B)x, was found due to a large amount
of heat during spark plasma sintering. The hardness of composites was increased with
an increase of nano-sized SiC content, but the fracture toughness was not related to
the content of SiC. The applied stress to micropillars of ZrB2 nano-sized SiC
32

composites produced many dislocations and stacking faults.
33

3.1 Introduction
Zirconium diboride and hafnium diboride have extremely high melting
temperatures (>3000 °C), high chemical stability, high electrical and thermal
conductivities, resistance to erosion/corrosion, and good mechanical properties which
make them suitable for ultra-high-temperature applications such as hypersonic flight
vehicle, atmospheric re-entry vehicle, and rocket propulsion systems [1]. However,
use of those single phase ceramics materials for these applications has limitations
because a passive layer composed of B203 start evaporating above 1000 °C, leaving
behind a non-protective porous Zr02 layer [2].
To overcome the poor oxidation resistance of these diborides, the second phase
such as SiC and MoSi2 were introduced due to the generation of a borosilicate
diffusion barrier layer above 1000 °C. In addition, the introduction of these second
phases improves the mechanical properties due to a liquid phase sintering effect [3,
4].
Among the second phases, SiC is the most widely studied by many researchers.
Sumin Zhu, et al. reported the influence of SiC initial particle size, in the range from
0.45urn to 10um, on the microstructure and mechanical properties of ZrB2-SiC
ceramics. The smaller SiC particle sizes led to improved densification, finer grain
34

sizes, higher hardness, and higher strength [5].
However, the introduction of nano-sized SiC starting powder into ZrE$2 ceramics
was not studied widely yet by researchers until present. Niihara, et al. proposed three
different types of ceramic nanocomposites shown in figure 3-1 [6]. Firstly,
intergranular nanocomposites can improve creep resistance due to grain boundary
pinning effect. Secondly, intragranular nanocomposites can improve transgranular
fracture toughness and strength. Thirdly, inter/intragranular nanocomposites can take
both effects mentioned above. Lastly, nano/nano composites can have superplasticity
due to grain boundary sliding [7].
In this study, nano-sized SiC particles were used to improve the mechanical and
physical properties of ZrB2-SiC ceramics and spark plasma sintering was used to take
an effect of nanocomposites as mentioned above.
3.2 Experimental procedure
3.2.1 Materials
The starting powders used in this study were: ZrB2 powder (Grade F, Japan New
Metals, Tokyo), average particle size -2.1 um and nano p-SiC powder (Sumitomo
Osaka Cement Co. Ltd., Osaka, Japan), average particle size ~30 nm and oxygen
35

content of 0.38 wt.%. In order to examine the effects of nano-particle content as well
as starting particle size, four batches of powder were prepared, containing nano (3-SiC
powder of 5, 10, 20 and 30 vol.%, respectively. In addition, the single-phase ZrB2
powder was prepared to compare the effect of SiC addition on mechanical properties.
Compositions of the ZrE$2-based composites with SiC are listed in Table 3-1. The
powder mixtures were ball-milled using SiC milling media and ethanol under 200
rpm for 24 h, and the resulting slurry was then dried under magnetic stirring to avoid
sedimentation. Before sintering, the dried mixtures were sieved through a metallic
sieve with 60-mesh screen size.
The powder mixture was put into graphite die lines with graphite foil and
densified using spark plasma sintering (SPS-1030, Sumitomo Coal Mining Co. Ltd.,
Tokyo, Japan). The sintering was performed at 1900 °C for 3 min under an external
pressure of 50MPa in an argon atmosphere. The temperature of the sample was
automatically raised to 600"C, and then was monitored by an optical pyrometer
through a hole opened in the die and automatically regulated to the final sintering
temperature with heating rate of ~300°C/min. The pressure was applied at room
temperature and held constant until the end of the sintering cycle. The load was
removed when the die temperature dropped below 1000°C with a cooling rate
36

of~ 600 °C/min. The final sintered specimen size was 10mm in diameter pellets with
a thickness of ~2.0 mm.
The density of the sintered composite compacts was measured by Archimedes
method with distilled water as a medium. The sintered composite pellets were then
polished with a diamond paste up to 0.5um. The morphology of the composites was
characterized by field emission scanning electron microscopy (FE-SEM, ZEISS
VP1550), and the crystalline phases were identified by X-ray diffractometry (XRD,
Panalytical X'Pert Pro). The grain size of each component, ZrB2 and SiC, was
measured directly from the FE-SEM images of sintered composites using image J
software. In order to estimate the average grain size of each component, five FE-SEM
images were used for direct measurement within the range of 200-300 population.
To investigate detailed microstructural information of sintered composites with
30nm SiC powders, randomly selected areas of ZSN-0, ZSN-5, ZSN-10, and ZSN-20
samples were observed by TEM (FEI-Philips CM300, FBI, Hillsboro, OR) with a
EDAX Energy Dispersive X-ray spectrometer (EDS) and a Si/Li detector super
ultrathln window. The TEM samples used in this study were prepared by Focused Ion
Beam (FIB Nova 600, FEI, Hillsboro, OR) with tungsten probe tips and four fingers
copper grid.
37
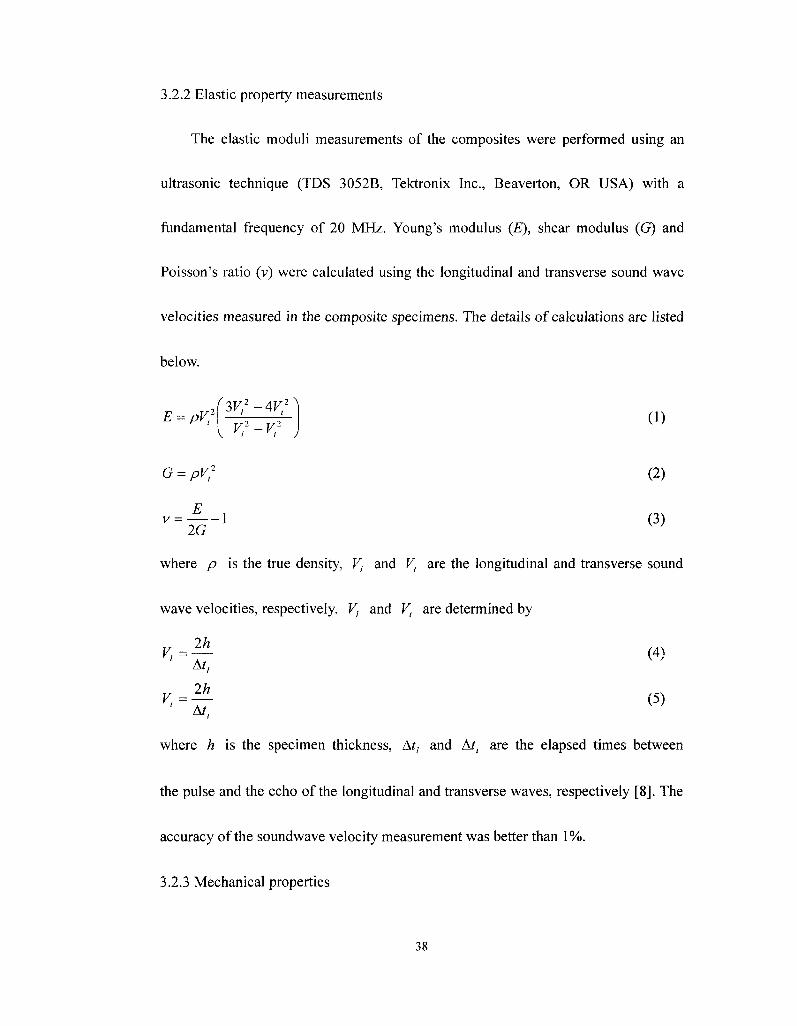
3.2.2 Elastic property measurements
The elastic moduli measurements of the composites were performed using an
ultrasonic technique (TDS 3052B, Tektronix Inc., Beaverton, OR USA) with a
fundamental frequency of 20 MHz. Young's modulus (E), shear modulus (G) and
Poisson's ratio (v) were calculated using the longitudinal and transverse sound wave
velocities measured in the composite specimens. The details of calculations are listed
below.
E = pV2 r3V2-4V2^
, V} - v2 , V v< v' J
(1)
G = pV,2 (2)
v = — - 1 (3) 2G
where p is the true density, V, and V, are the longitudinal and transverse sound
wave velocities, respectively. V, and V, are determined by
r,=£ (4) At,
At,
where h is the specimen thickness, At, and A/, are the elapsed times between
the pulse and the echo of the longitudinal and transverse waves, respectively [8]. The
accuracy of the soundwave velocity measurement was better than 1%.
3.2.3 Mechanical properties
38

The hardness and fracture toughness, K\c, of the composites were determined
using an indentation technique. The indentation tests were performed on the polished
surface of the specimens by loading with a Vickers microhardness indenter (AVK-A,
Akashi Co. Ltd., Yokohama, Japan) for 20 s in ambient air at room temperature. The
corresponding diagonals of the indentation, a, and crack sizes, c, were measured
using an optical microscope attached to an indenter. The indentation load of 49N was
used, and 10 indents were made for each measurement. For fracture toughness
calculations, the Palmqvist equation was used in this study becuase the ratio of l/a
were in the range of 0.25-2.5 from crack length measurement, (where l=c-a). The
Palmqvist equation is listed below:
KIC = r,(E/H)2/5P/(al m) (6)
where E is the Young's modulus (GPa), H is the hardness (GPa), P is the
indentation load (N), /is the crack length (|J.m), a is the half diagonal length (um), and
c is the total length including crack length and half diagonal length (pm). The
hardness, Hv, was calculated from
H = 1854.4-^=-, (7)
In the earlier work from Niihara, et al., the coefficient, r\, is obtained
experimentally. The value of r\ was 0.0089 and 0.0122 for l/a ratio varying in the
39

range of 0.25-2.5 and 1-2.5, respectively [9]. We have chosen r|=0.0122 because all
ratios of l/a were in the range of 1-2.5.
3.2.4 Micropillar compression test
To investigate deformation or fracture mechanism of ZrB2-SiC composites,
micropillars with ~5um diameter and ~20um height were prepared by Focused Ion
Beam (FIB Nova 600, FEI, Hillsboro, OR) on the surface of composites. The
obtained micropillars of each sample (ZSN-0, ZSN-5, and ZSN-10) were compressed
by the depth of 500nm from the sample surface with the flat punch tip of a
nanoindenter (MTS Nanoindenter/XP, MTS system, Eden Prairie MN). Applied stress
and displacement of samples were recorded to identify events such as fracture and
deformation. After compression tests, TEM laminar samples were prepared by the
Focused Ion Beam if the critical dimensional changes of micropillars were not found.
Microstructural information of micropillars from the prepared TEM samples was
investigated.
3.3 Results and discussion
3.3.1 Densities, phases, and microstructures
The measured densities and relative densities for various ZrB2-nano SiC
40

composites are summarized in table 3-2. It is evident that single-phase ZrB2 has the
lowest density (-96.1%), and densities of each sample slightly increase with increase
of SiC content from 96.1% to 98%. The low relative density of pure ZrB2 is due to its
strong covalent bond and low self diffusion [10]. As the SiC content of each
composite material increases, SiC improves sinterbility of composites more
effectively due to the liquid phase sintering effect and hindrance of ZrB2 grain
growth.
X-ray diffraction (XRD) patterns of each composite materials consolidated by
SPS are shown in figure 3-2. Only ZrB2 peaks are detected in ZSN-0. ZrB2 and SiC
peaks were detected in the other four samples (ZSN-5-ZSN-30). The intensity of SiC
peaks are increased with increasing SiC content in the composite material. Any other
second phases were not found and both ZrB2 and SiC phases were confirmed by XRD
in all samples.
Typical microstructural features of the ZrB2-SiC composites observed under
FE-SEM are shown in figure 3-3. The general microstructures of the ZrB2-SiC
composites are similar, consisting of the equiaxed ZrB2 (grey contrast) and SiC (dark
contrast) grains. The average grain sizes of the ZrB2 and SiC are also listed in table
3-3 and the typical tendency of average grain size of each component is shown in
41

figure 3-4. The average grain size of pure ZrB2 is -4.02 urn, which is significantly
higher than the starting powder (2.1 urn). Apparently, the grain growth of ZSN-0
occurred during spark plasma sintering. However, the average grain size of ZrE$2
decreases with increasing SiC content until 10 vol% SiC composite materials,
proving that SiC hinders ZrB2 grain growth. The average grain size of ZrB2 was not
decreased further after 10 vol% SiC content. It is due to the fact that the average grain
sizes of ZrB2 of ZSN-10, ZSN-20, and ZSN-30 are very similar and the average grain
sizes of ZrB2 of those samples which originated from - 2.1 um was measured to be
-1.7 um after ball milling and sintering. In addition, the average grain size of SiC
also increased with increasing SiC content from 1.07 to 1.60 um, which is
substantially higher than that of the starting powder (-30 nm). The mixing process
employed was not effective in breaking apart the agglomeration of nano-sized SiC
particles. As a result, clusters of nano-sized SiC particles were fused together during
spark plasma sintering to form SiC grains with a few microns in diameter. A more
effective mixing/dispersion technique to break apart the agglomeration of nano-sized
SiC particles needs to be developed to uniformly disperse the nano particles.
More detailed microstructural images by TEM and selected area electron
diffraction (SAED) of each sample (ZSN-0-ZSN-30) are shown in figure 3-5. Phases
42

and crystallographic directions of several grains in these images were confirmed by
EDAX and electron diffraction patterns. ZrB2 grains are dark contrast and SiC grains
are grey contrast in all images (opposite to FE-SEM images). At first, a small SiC
grain could be found in pure ZrB2 ceramic composite (ZSN-0); this SiC grain might
come from SiC milling media. The size of SiC grains increase from a few tens of
nanometers to several micrometers. Most SiC grains are of one crystallographic
orientation and a few SiC grains are of several crystallographic orientations in one
grain, which suggests that nano-sized SiC particles were fused together during spark
plasma sintering. Most SiC grains are located in interfaces between ZrB2 grains and
SiC grains or grainboundaries between ZrB2 grains, but a few SiC grains with the size
of several nanometers (30nm ~ 80nm) are found in ZrB2 grains in ZSN-5 and ZSN-30
(shown in figure 3-6). Typical interfaces between ZrB2 grains and SiC grains are
shown in figure 3-7. The thicknesses of interfaces are 1~2 nm, so those inter-phase
interfaces between two components are well bonded to each other. In addition, a
second phase, Zr(0,B)x, was found in ZSN-20 because large amount of heat during
spark plasma sintering might be localized in ZrB2 grain (shown in figure 3-8).
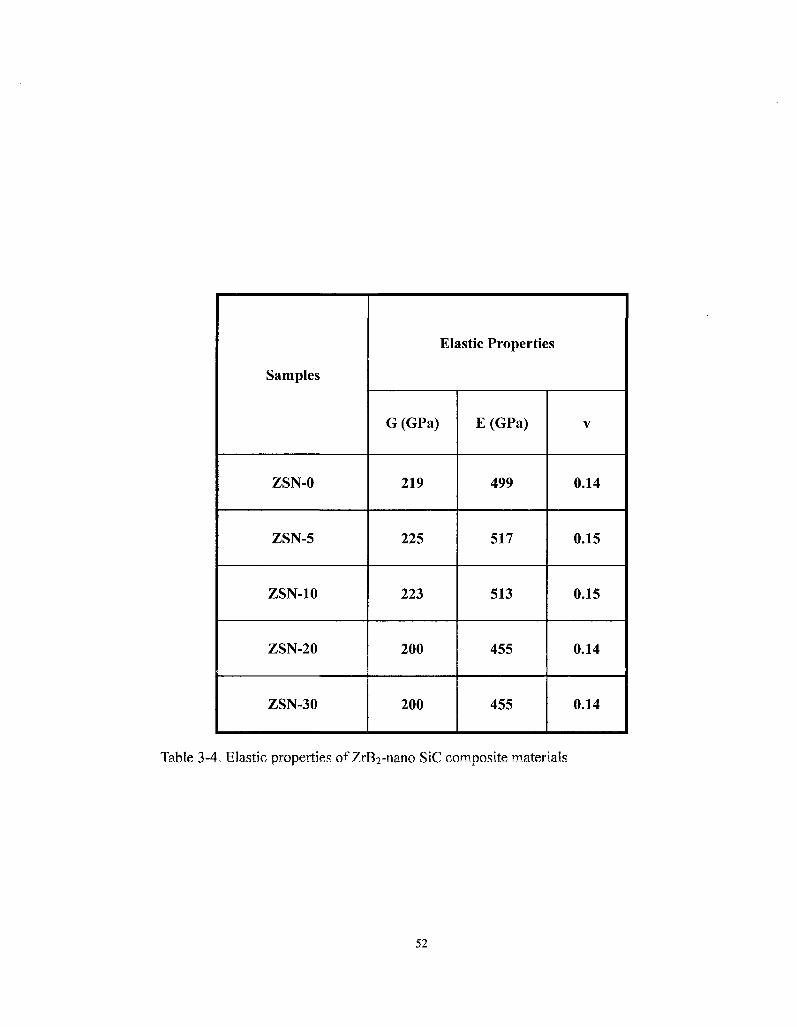
3.3.2 Elastic moduli, hardness and fracture toughness
The elastic constants measured in various ZrB2-SiC composites are listed in
43

table 3-4. The Young's modulus of single-phase ZrB2 was measured to be -499 GPa,
which is slightly higher than that reported in the literature (489 GPa) [11]. The results
indicated that Young's moduli of the ZrB2 composites with nano-sized SiC are not
sensitive to the compositions. Among the five compositions, ZSN-5 and ZSN-10 have
the best elastic properties and ZSN-20 and ZSN-30 have the worst properties because
the Young's modulus of silicon carbide is reported to be 415 GPa [12], which is lower
than that of zirconium diboride and silicon carbide agglomerate may cause
detrimental effect to elastic properties of composites materials.
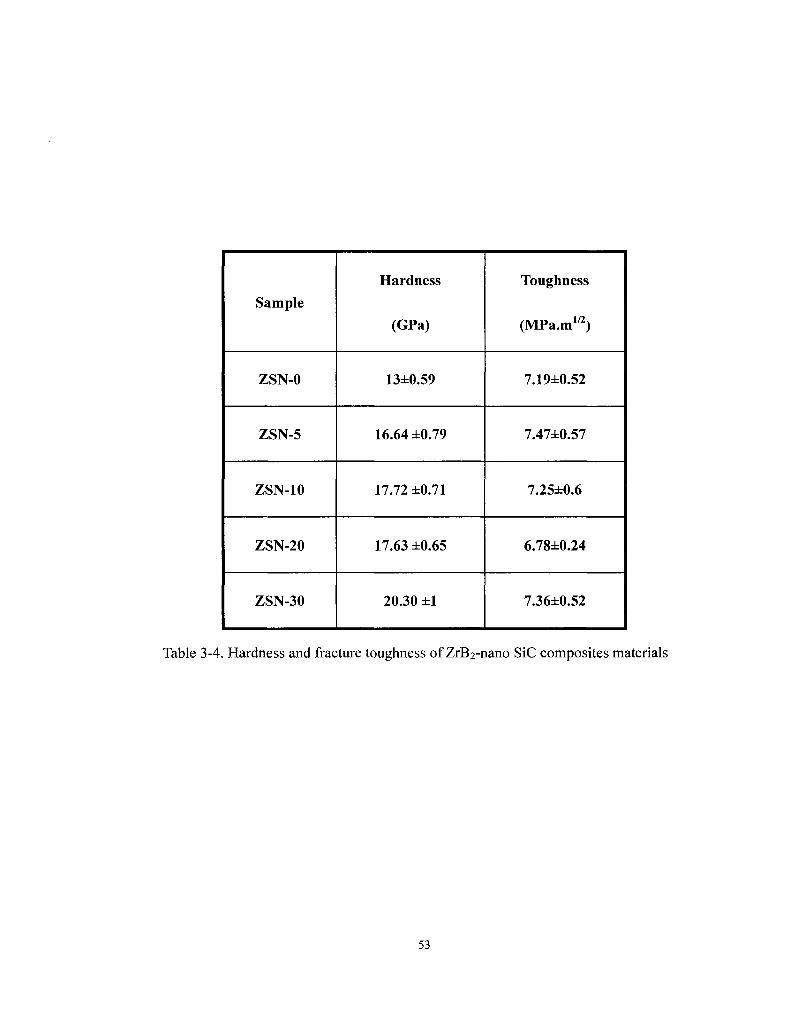
Hardness and fracture toughness of ZrB2-SiC composites obtained from the
indentation technique are also summarized in table 3-4. The hardness of single-phase
ZrB2 was measured to be ~13 GPa, which is lower than the results in the literature (22
GPa)[13]. The porosity of the ZSN-0 might not be a main reason for the low hardness
value because the porosity value is -4%. It is the reason that low bonding strength
between ZrB2 grains to maintain coherent microstructure due to inherent ZrB2
characteristics such as strong covalent bond and low self-diffusion. However, the
hardness in the ZrB2-nano SiC ceramic increased with an increase of SiC content
(shown in figure 3-9). This effect is based on the basic rule of mixtures. The samples
with higher SiC content have the higher value of hardness because the hardness of
44

SiC (32 GPa) [12] is higher than that of ZrB2 (22 GPa) [13]. The fracture toughness of
all ZrB2-nano SiC composite were in the range of 6.8-7.5 MPa.m172 and these values
cannot be compared to others because many studies for fracture toughness of
ultra-high-temperature ceramics were conducted by methods. The results also
indicated that fracture toughness of the ZrB2 composites with nano-sized SiC is not
sensitive to the compositions shown in figure 3-9. A typical cracking pattern is shown
in figure 3-10. For the single-phase ZrB2 ceramic, the crack propagated primarily
along ZrB2 phase boundaries but the crack in the ZrB2 nano-SiC composite
propagated across the ZrB2 and SiC grains without being deflected along the grain
boundaries of the SiC grains. As a result, the incorporation of nano-sized SiC did not
impart additional resistance to crack propagation.
3.3.3 Micropillar compression test of ZrB2-nano SiC composite materials
Fabricated micropillars of ZSN-0, ZSN-5, and ZSN-10 are shown in figure 3-11.
The dimensions of micropillars in this figure vary due to different magnification in
order to show the configuration of micropillars. The stress and strain (%)
characteristics of ZSN-0, ZSN-5, and ZSN-10 are shown in figure 3-12, 3-13, and
3-14, respectively. The study of micropillar or nanopillar compression tests about
single crystal metal such as Au, Cu, Ni, and even Si had similar results to the
45

universal scaling law, which can be explained briefly that smaller micropillars or
nanopillars have higher stresses [14, 15]. However, the maximum stress values of
micropillar compression tests of pure ZrE$2 and ZrB2-SiC ceramics did not follow the
universal scaling law. The maximum stress of pure ZrE$2 micropillar was 15.5 GPa,
which is slightly higher than the normal microhardness test (~13GPa). And, the
micropillar of ZSN-5 was broken after the stress of ZSN-5 reached only -2.74 GPa. It
is interesting to note that the maximum stress of ZSN-10 was fairly low (-0.33 GPa)
because the flat punch tip might be improper contact with the top surface of the
micropillar so that it is slightly tilted in one direction (indicated with arrow in figure
3-15). The TEM images of ZSN-0 and ZSN-10 and the fracture surface of FE-SEM
images of ZSN-5 are shown in figure 3-16, 3-17, and 3-18, respectively. Several
small dislocations and stacking faults which go through whole lamella were found in
the ZSN-0 sample. The dislocations might be produced during the milling process
because they are very small and located inside of one grain, but stacking faults went
through whole lamella so that they were produced in compression stress. Also,
several discrete regions are found in stress-strain curve in figure 3-12. This
stress-strain curve might be explained for production of stacking fault in ZSN-0. In
the ZSN-10 TEM lamella, lots of dislocations and small stacking faults were found
46

compared to ZSN-0 lamella. These two defects might also be produced by
compression stresses because the stress-strain curve shape is an inward curve;
perhaps some part of energy from the applied stress was used for the generation of
dislocations and stacking faults. The fracture mode observed from ZSN-5 micropillar
was mixed inter/intragranular fracture, which is the same result as the fracture surface
reported [16].
3.4 Conclusion
The processing and mechanical behaviors of single-phase ZrE$2 and ZrB2
with nano-sized SiC particles were investigated. The mixing process employed was
not effective in breaking apart the agglomeration of nano-sized SiC particles. As a
result, clusters of nano-sized SiC particles were fused together during sintering to
form SiC particles sub-micron in diameter. These sub-micron-sized particles were
distributed primarily along the grain boundaries. However, some nano SiC particles
were embedded within the grains. The presence of intergranular and intragranular SiC
improves the sinterability and limits the grain growth of ZrB2. Further improvement
in properties may be achievable through a more uniform dispersion of SiC nano
particles. The hardness of ZrB2 with nano-sized SiC was increased with increase of
47

SiC content, but the fracture toughness of composites was not sensitive to
composition. The phase of ZrB2 and SiC in each composite was confirmed SAED and
the second phase, Zr(0, B)x, was found in ZrB2 grain due to localized large amounts
of heat during spark plasma sintering by the TEM investigation. The applied stress to
micropillars of ZrB2 nano-sized SiC composites produced lots of dislocations and
stacking faults.
48

Samples
ZSN-0
ZSN-5
ZSN-10
ZSN-20
ZSN-30
Compositions (vol.%)
ZrB2
100
95
90
80
70
SiC
0
5
10
20
30
Table 3-1. Compositions of each sample
49

Samples
ZSN-0
ZSN-5
ZSN-10
ZSN-20
ZSN-30
Theoretical Density 3
(g/cm )
6.09
5.95
5.80
5.52
5.23
Measured Density 3
(g/cm )
5.85
5.78
5.66
5.37
5.13
Relative Density
(%TD)
96.1
97.1
97.5
97.4
98.0
Table 3-2. Densities of each sample
50

Materials
ZSN-0
ZSN-5
ZSN-10
ZSN-20
ZSN-30
Grain size of ZrB2 (urn)
4.02±1.31
2.86±0.77
1.71±0.56
1.76±0.63
1.64±0.7
Grain size of SiC (u.m)
N/A
1.07±0.84
1.17±0.82
1.39±0.82
1.60±1.07
Table 3-3. Average grain sizes of ZrB2-nano SiC composite materials.
51
Samples
ZSN-0
ZSN-5
ZSN-10
ZSN-20
ZSN-30
Elastic Properties
G (GPa)
219
225
223
200
200
E (GPa)
499
517
513
455
455
V
0.14
0.15
0.15
0.14
0.14
Table 3-4. Elastic properties of ZrB2-nano SiC composite materials
52
Sample
ZSN-0
ZSN-5
ZSN-10
ZSN-20
ZSN-30
Hardness
(GPa)
13±0.59
16.64 ±0.79
17.72 ±0.71
17.63 ±0.65
20.30 ±1
Toughness
(MPa.m1/2)
7.19±0.52
7.47±0.57
7.25±0.6
6.78±0.24
7.36±0.52
Table 3-4. Hardness and fracture toughness of ZrB2-nano SiC composites materials
53

\ / •
« V — / # / • y .
^ \ • / '
^ — < • •
,« / • \ a
(a) Inter type (b) Intra type
(c) Intra/inter type (d) Nano/nano type
Figure 3-1.Classification of ceramic nanocomposites.
54

7000
6000
5000
T H 4000
CO a & 3000
" H 2000
1000
0
'aufcMi MMMMM tabnn (e),
Uw*»
WW
*mm*
• 2B 2
I JL
•I
An * >
MKM
M »
•Mn
, f t t I M M W ,
•At M M
U M
IIJLII
I I A
mmmJjkm
L J L.
10 2 0 3 0 4 0 5 0 6 0 7 0 8 0 9 0 100
29(cfegTee)
igure 3-2. X-ray diffraction patterns of each composite material (a) ZSN-0 (b)
ZSN-5 (c) ZSN-10 (d) ZSN-20 (e) ZSN-30
55

Figure 3-3. Typical FE-SEM images of each sample.
56

5
^—^
E 4
E ^^^ 0 3 N
'55 C 2
2 O 1
n
~
-1
-
-#-ac
•̂
(
i
\ - T
J • •
• •
i i i
0 10 20 30
vu %of ac
Figure 3-4. The change of average grain size of each component.
57

Figure 3-5. Typical TEM microstructures of each sample.
58

Figure 3-6. Typical SiC grain locations in ZrB2-SiC composite
59

TJF" -*" •<
Figure 3-7. Typical interface between ZrB2 grain and SiC grain (ZSN-5: HRTEM
image)
60

Figure 3-8. The TEM image and EDX result of second phase, Zr(0, B)x, in ZrB2
grain, ZSN-2(
61
CO a.
30
25
20
Q)
(0
10
5 -
0
Hardness Toughness
j _ _L J _ -1_
CM
Q_
(I) (/)
3 O
ZSN-0 ZSN-5 ZSN-10 ZSN-20 ZSN-30
Sample
Figure 3-9. The change of hardness and fracture toughness of ZrB2-nano SiC
composite with SiC content.
62

Bt * • .•¥ -, -•:."•-** v- 4-umV
Figure 3-10. Typical cracking pattern of ZrB2-SiC composites (ZSN-0, ZSN-10,
ZSN-20).
63

• 'f ?«• ' * -"
SI •iif^iBJnai.ii7iiiiMiit:fffii
Figure 3-11 Fabricated micropillar of ZSN-0, ZSN-5, and ZSN-10
64

16
14
12
(GP
a)
00
o
V) 6
2
0
.
_
• ZSN-0
/ f
Jr /
^r j
i i i i i
0 1 2 3 4
AL/LO (%)
Figure 3-12. Stress vs. height change relation by micropillar compression test for
ZSN-0
65

3.0
2.5 •*™*>s
CO Q- 2.0 CD N ^ ^
<*> 1 5
CD s_
CO 1 0
0.5
0.0
• ZSN-5
- r
-
i i i i
•
M
/
f • I
10 20 30 40
AL/L(%)
50
Figure 3-13. Stress vs. height change relation by micropillar compression test for
ZSN-5
66
0.35
J 1 I I L
0.0 0.5 1.0 1.5 2.0 2.5
AL/L (%)
Figure 3-14. Stress vs. height change relation by micropillar compression test for
ZSN-10
67
0.30
0.25 s-^.
^ 0.20
CD ^ 0.15 co CO |D 0.10 !_ - t—>
CO 0.05
0.00
-
-
-

Figure 3-15. ZSN-10 micropillar (a) before and (b) after compression
68

Figure 3-16. TEM microstructural images of ZSN-0 by the micropillar compression
test (a) Whole TEM laminar (b) Stacking fault (c) dislocation
69

Figure 3-17. TEM microstructural images of ZSN-10 by the micropillar compression
test (a) Whole TEM laminar (b) Dislocations (c) Stacking fault
70

Figure 3-18. Fracture surface images of ZSN-5 by the micropillar compression test
(a) Fracture surface of whole micropillar (b) Intragranular fracture (c) Intergranular
fracture
71

References
[1] William G. Fahrenholtz, Gregory E. Hilmas, Inna G. Talmy, and James A.
Zaykoski (2007) Refractory diborides of zirconium and hafnium J. Am. Ceram. Soc,
Vol.90, Issue 5, pi347-1364
[2] A. L. Chamberlain, W. G. Fahrenholtz, and G. E. Hilmas, Oxidation of ZrB2-SiC
ceramics under atmospheric and reentry conditions Refractory Appl. Trans., 1 [2]
pl-8.
[3] Jiecai Han, Ping Hu, Xinghong Zhang, and Songhe Meng, (2007) Oxidation
behavior of zirconium diboride-silicon carbide at 1800 °C, Scripta Materialia 57,
p825-828.
[4] Ronald Loehman, Erica Corral, Hans Peter Dumm, Paul Kotula, and Raj an
Tandon, (2006) Ultra high temperature ceramics for hypersonic vehicle applications,
SAND 2006-2925
[5] Sumin Zhu, W. G. Fahrenholtz, and G. E. Hilmas, (2007) Influence of silicon
carbide particle size on the microstructure and mechanical properties of zirconium
diboride-silicon carbide ceramics, J. Euro. Ceram. Soc, 27 p2077-2083.
[6] Koichi Niihara (1991) New design concept of structural ceramics; ceramic
nanocomposites, The ceramic society of Japan, 99, [10], p974-982
[7] A. Mukhopadhyay and B. Basu, (2007), Consolidation-microstructure-property
relations in bulk nanoceramics and ceramic nanocomposites: a review, International
materials reviews, Vol52, No5, p257-288.
[8] O. Yeheskel, and O. Tevet, (1999), Elastic Moduli of Transparent Yttria, J. Am.
Ceram. Soc, 82, pl36-144
[9] K. Niihara, R. Morena, and D. P. H. Hasselman, (1982), Evaluation of KiC of
brittle solids by the indentation method with low crack-to-indent ratios, J. Mater. Sci.
Lett., I , p l 3 4 6 .
72

[10] A. Bellosi, F. Monteverde, D. D. Fabbriche, and C. Melandri, (2000),
Microstructure and Mechanical Properties of ZrB2-based Ceramics, J. Mater. Proc.
Man. Sci., 9 [2], pl56-170.
[11] R. A. Cutler, (1991), Engineering properties of borides in ceramics and glasses:
Engineered materials handbook, vol 4, Edited by S. J. Schneider Jr. ASM
International, Materials Park, OH, pp787-803.
[12] R. G. Munro, (1997), Materials properties of a sintered alpha-SiC, Journal of
physical and chemical reference data, vol 26, ppl 195-1203.
[13] C. Morz, (1994), Zirconium diboride, Am. Ceram. Soc. Bull., 73 [6] p 141-142.
[14] Michael D. Uchic, Dennis M. Dimiduk, Jeffrey N. Florando, William D. Nix,
(2004) Sample dimensions influence strength and crystal plasticity, Science, 305,
p986-989.
[15] R. Dou and B. Derby, (2009), A universal scaling law for the strength of metal
micropillars and nanowires, Scripta materialia, 61, p524-527.
[16] Frederic Monteverde and Alida Bellosi, (2005), Development and
characterization of metal diboride based composites toughened with ultra fine SiC
particulates, Solid state sciences, 7, p622-630.
73

Chapter 4
Multiphase ZrC-ZrB2-SiC ceramics
Abstract
The effects of composition on mechanical, thermal and electrical properties of
ZrC-ZrB2-SiC multiphase composites were examined. The composites were
consolidated by spark plasma sintering. The microstructure of the as-consolidated
composites was examined by field emission scanning electron microscopy and
transmission electron microscopy. The elastic moduli of the composites were
measured using the longitudinal and transverse soundwave velocities measured,
whereas the hardness and fracture toughness of the composites were determined using
an indentation measurement. The results indicated that the shear modulus was in the
range 180 to 225 GPa and the Young's modulus was in the range 434 to 517 GPa. The
ranges of hardness and fracture toughness values were measured to be 18.79 to 21.50
GPa, and 4.69 to 6.08 MPa m1/2, respectively. On the other hand, the thermal and
electrical conductivities of the ZrC-ZrB2-SiC composites were measured at room
temperature by a nanoflash technique and a current-voltage method, respectively. The
thermal conductivities for the composites were in the range 38.25 to 98.25 W (m K)'1.
The electrical conductivities of the multiphase composites were in the range
0.916xl04 to 4.521xl04 (Q cm)"1. The applied stress to micropillar of ZrC-ZrB2-SiC
74

composites produced long cracks from surface to bottom without deflecting along
grain boundaries.

4.1. Introduction
Diborides and carbides of zirconium (ZrB2 and ZrC) have extremely high
melting points (>3000 °C), high thermal and electrical conductivities, chemical
inertness against molten metals, and great thermal shock resistance [1-4]. The unique
combinations of mechanical and physical properties make them attractive candidates
for structural applications at ultra-high temperatures. However, the use of these
single-phase ceramics materials for high-temperature structural applications is limited
by their poor oxidation, thermal shock and ablation resistance as well as poor damage
tolerance. A composite approach has been successfully adopted in order to improve
the oxidation and ablation resistance of single-phase ceramics. For example, the
addition of second phase such as SiC to ZrE$2 results in a composite with
improvement of strength and better oxidation, thermal shock and ablation resistance
[5-8]. The improvement of oxidation and ablation resistance is believed to arise from
the formation of coherent passivating oxide scales on the surface. More recently, the
ZrC-ZrB2-SiC multiphase composite system has been demonstrated to have superior
resistance to ablation or conversion than do the corresponding ZrB2/SiC composites
under an arc-jet environment [8]. The ZrB2-30ZrC-10SiC (vol %) composites have
been successfully consolidated using both hot-pressing and spark plasma sintering [9,
76

10]. Furthermore, this composite exhibited high strength with low scattering of
strength up to 1500°C, these components are also both thermodynamically and
chemically stable at high temperature because the intergranular reaction in the
composite is absent [10]. However, the effects of separate components on
mechanical, thermal and electrical properties of ZrC-ZrB2-SiC composites are not
yet systematically studied. The compositional dependence of these properties is very
important for designing ZrC-ZrB2-SiC composites in sustained thermomechanical
applications.
On the other hand, spark plasma sintering (SPS) is one of the most recent
processing techniques developed for densifying ceramic materials, including poorly
sinterable compounds [11, 12]. One advantage of SPS concerning ceramics is that the
grain growth of starting materials is restricted, as a considerable shorter sintering time
(within several minutes) is required compared to hot-pressing or hot isostatic
pressing, thereby retaining the fine and homogenous grains. Another is to enhance
densification of poorly sinterable ceramics, as a result of the spark discharge
generated between powders as well as the presence of the electrical field under pulsed
direct current. Previous studies in ZrB2-based ceramic materials showed that SPS
enhanced densification and refined microstructure in very short processing cycles [10,
77

13]. This is attributable to the presence of the electrical field during SPS which
caused faster diffusion due to the enhanced migration speed of ions [14].
In the present study, ZrC-ZrE^-SiC composites with different compositions were
consolidated by spark plasma sintering. The effects on physical properties,
mechanical properties with microstructural analysis, thermal properties, and electrical
properties of ZrC-ZrB2-SiC composites are discussed in this chapter. In addition,
fracture mechanisms based on micropillar compression test are presented.
4.2. Experimental procedures
4.2.1 Materials
The starting powders used in this study were: ZrB2 powder (Grade F, Japan New
Metals, Tokyo), average particle size —2.12 |im, ZrC powder (Grade F, Japan New
Metals), average particle size «2.32 um; and a-SiC powder (Grade UF-15, H.C.
Starek, Berlin, Germany), average particle size «0.5 jina. In order to examine the
effect of composition on the mechanical, thermal and electrical properties, eight
series of ZrC-ZrB2-SiC compositions were prepared in this study. These compositions
are shown in table 4-1. The powder mixtures were wet-mixed using SiC milling
media and ethanol for 24 h, and then dried in oven. Before sintering, the dried
78

mixtures were sieved through a metallic sieve with 60-mesh screen size. The powder
mixture was put into a graphite die lines with graphite foil and densified using spark
plasma sintering (SPS-1030, Simitomo Coal Mining Co. Ltd., Tokyo, Japan). The
sintering was performed at 1950°C for 2 min under a pressure of 50 MPa in argon
atmosphere. Changes in temperature and sintering displacement were recorded by a
computer during the entire sintering process. Final sintered specimen size was 10 mm
in diameter pellets with a thickness of -2.0 mm. After removing the surface of the
sintered compact to avoid contamination from the graphite die, the densities of the
sintered composite compacts were measured by the Archimedes method with distilled
water as medium. X-ray diffraction (XRD) was used for crystalline phase
identification of the composites. The grain size of each component, ZrB2, ZrC, and
SiC, was measured directly from the field emission scanning electron microscopy
(FE-SEM) images of sintered composites using image J software. In order to estimate
the average grain size of each component, five FE-SEM images were used for direct
measurement within the range of 200-300 population. Microstructure of the
composites was observed by FE-SEM and transmission electron microscopy (TEM).
4.2.2 Elastic moduli, hardness, and fracture toughness measurements
The elastic moduli measurements of the composites were performed using an
79

ultrasonic technique (TDS 3052B, Tektronix Inc. Beaverton, OR USA) with a
fundamental frequency of 20 MHz. Young's modulus, E, shear modulus, G, and
Poisson's ratio, v, were calculated using the longitudinal and transverse soundwave
velocities measured in the composite specimens. The details of calculations were
listed in chapter 3. The hardness and fracture toughness, KIC, of the composites was
determined using an indentation technique. The indentation tests were performed on
the polished surface of the specimens by loading with a Vickers microhardness
indenter (AVK-A, Akashi, Co., Ltd., Yokohama, Japan) for 20 s in ambient air at
room temperature. The corresponding diagonals of the indentation and crack sizes
were measured using an optical microscope attached to the indenter. The indentation
load of 9.8 N was used, and ten indents were made for each measurement. The
fracture toughness, Klc, of composites were calculated from the Palmqvist equation
[15].
4.2.3 Thermal and electrical conductivity measurements
The thermal diffusivity, a, of the composites was measured on a disk-shaped
specimen with a diameter of 10 mm and thickness of ~2 mm using the nanoflash
technique (LFA447/2-4N, Nanoflash, NETZSCH-Geratebau GmbH, Postfach,
Germany). The flash source is a Xenon flash lamp operating in the wavelength range
80

of 0.15 urn to 2 um. Prior the measurements, the samples were coated with a colloidal
graphite spray in order to enhance the absorption of the Xenon light pulse energy and
the emission of IR radiation to the temperature detector. Also, the heat capacity, C ,
was measured with alumina as the reference material. All of the measurements were
performed in ambient air at room temperature. Subsequently, the thermal
conductivity of the composites, kc, is determined from thermal diffusivity, heat
capacity, and density of the composites according to the following equation, [16]
kt=pCpa (1)
where p is the density of the composites, Cp is the heat capacity of the
composites, and a is the thermal diffusivity of the composites.
Moreover, the electrical conductivity measurements of the composites were
performed using the four-wire probe at room temperature. A power supply (Model:
6220, Keithley, Cleveland, Ohio, USA) and digital multimeter (Model: 2182
Nanovoltmeter, Keithley) were used to measure the IV characteristics of the samples.
4.2.4 Micropillar compression test
ZrC-ZrB2=SiC composites micropillars with ~5 um diameter and -20 um height
were prepared by Focused Ion Beam (FIB Nova 600, FEI, Hillsboro, OR) on the
surface of composites in order to investigate fracture behavior or effect of
81

compression stress on ZrC-ZrB2-SiC composites. The prepared micropillars of each
sample (ZZS-1, ZZS-2, ZZS-6, and ZZS-7) were compressed to the depth of 500 nm
from the sample surface with the 10 \m\ diameter flat punch tip of a nanoindenter
(MTS Nanoindenter/XP, MTS system, Eden Prairie MN). An optical microscope with
high magnification (X 500) in the nanoindenter was used to place the flat punch tip
precisely to avoid tilting the micropillars during compression. Applied stress and
displacement of samples were observed to identify events such as fracture and
deformation. Cracks, fracture surface, or dimensional changes of micropillars were
observed by FE-SEM after compression tests were finished. In addition, detailed
microstructural observation of compressed micropillars was conducted by TEM.
4.3 Results and discussion
4.3.1 Densities, phases, and microstructures
The shrinkage curves obtained during the SPS cycle for the various composite
materials consolidated by SPS are shown in figure 4-1. The shrinking behavior of
ZrC-ZrB2-SiC (ZZS) is almost the same for the studied compositions regardless of
component content. The measurable shrinkage was observed at temperatures ranging
from 1500 to 1600°C, depending upon the compositions. For examples, the onset
82

temperature of densification was determined to be ~1530°C for ZZS-1, ~1580°C for
ZZS-2, ~1550°C for ZZS-3, and ~1540°C for ZZS-5. During subsequent
densification, all of the compositions showed almost the same shrinkage rate with
time. The main part of the densification occurred within a period of ~2 min, whereas
conventional hot-press typically required hours of densification at substantially higher
temperatures to yield fully densified compacts. The measured densities and relative
densities for the various ZrC-ZrB2-SiC composite materials consolidated by SPS are
summarized in table 4-2. The theoretical densities of the composites were calculated
according to the rule of mixtures. It is evident that all the composites were almost
fully densified (relative density > 98%) and their relative density was almost the same
regardless of composition. This is attributed to the fact that the same shrinkage
behavior was observed during SPS for all of the studied compositions.
X-ray diffraction patterns for the various ZrC-ZrB2-SiC composite materials
consolidated by SPS are presented in figure 4-2. Although the peaks of ZrB2, ZrC and
SiC phases showed the different intensity with compositions, only ZrB2, ZrC and SiC
phases were detected in every case. This suggests that an intergranular reaction did
not occur at the grain boundaries during sintering. Typical microstructural features of
the ZrC-ZrB2-SiC composites observed under FE-SEM is shown in figure 4-3. The
83

general microstructures of the ZrC-ZrB2-SiC composites are similar, consisting of the
equiaxed ZrB2 (grey contrast), ZrC (bright contrast), and SiC (dark contrast) grains.
In the case of the ZZS-1 composition, ZrB2, ZrC, and SiC particles are homogenously
and individually present in the isolated locations because the added ZrB2, ZrC, and
SiC amounts are the same for this composition. For other compositions, however, the
primary component in the composite, such as ZrB2 particles for ZZS-2, ZZS-6, and
ZZS-7, ZrC particles for ZZS-3, ZZS-4, and ZZS-8, and SiC particles for ZZS-5,
formed an interconnected skeleton structure with the other two components
homogenously dispersed in it. The average grain size of each component (ZrC, ZrB2,
and SiC) about ZrC-ZrB2-SiC composites was listed in the table 4-3. The average
grain size of ZrB2 was in the range of 1.25 to 1.75 um, that of ZrC was in the range of
0.99 to 1.39 um, and that of SiC was in the range of 0.59 to 1.04 um. It is noted that
the milling process was effective to reduce initial powder size such as ZrB2 (-2.12
pm) and ZrC (-2.32 pm) but not helpful to reduce average grain size from small
initial powders like SiC (-0.5 um).
Typical TEM images for ZZS-1 and ZZS-2 are listed in figure 4-4 and figure
4-5, respectively. The contrast of each component grain is opposite that of each
component grain in FE-SEM images: ZrB2 (grey contrast), ZrC (dark contrast), and
84

SiC (bright contrast). Phases and crystallographic information of all three
components, ZrC, ZrB2, and SiC, were confirmed by SAED, but no second phase was
found inside the grains (compared to ZrE$2-nano sized SiC composites). Typical
interphase interfaces between ZrB2-ZrC and ZrC-SiC are shown in figure 4-6. Any
TEM interface images with high resolution mode could not be obtained due to large
TEM lamellae thickness, but interphase interfaces were very sharp and narrow so that
any second phase cannot be expected in the interfaces.
4.3.2 Elastic moduli, hardness, and fracture toughness
The elastic moduli measured in the various ZrC-ZrB2-SiC compositions
consolidated by SPS are listed in table 4-2. From this table, it is found that the shear
and Young's moduli are related to component content. In the case of the same volume
percent of ZrB2, ZrC, and SiC-containing composition (ZZS-1), the shear and
Young's moduli are 205 GPa and 477 GPa, respectively. Then, both the elastic moduli
increased with increasing ZrB2 as well as SiC addition, but decreased with increasing
ZrC addition. The highest shear and Young's moduli were measured in ZZS-2
composition, and their values are 225 GPa and 517 GPa, respectively. The lowest
shear and Young's moduli were measured in the ZZS-3 composition, and their values
are 180 GPa and 435 GPa, respectively. In contrast, Poisson's ratio remains almost
85

constant for the studied compositions regardless of component content.
The hardness and fracture toughness of the ZrC-ZrB2-SiC composites
obtained from an indentation technique are summarized in table 4-4. Note that for the
ZZS-5 composition the fracture toughness was not listed in this table because it is
difficult to measure the crack length accurately. The ranges of hardness and fracture
toughness values were measured to be 18.8 to 21.51 GPa, and 4.69 to 6.1 MPam1/2,
respectively. The results indicated that both the hardness and fracture toughness of the
composites are dependent on the composition. The compositional dependence of
hardness and fracture toughness may be associated with the complex residual stress
state that develops during cooling from the processing temperature due to the thermal
expansion mismatch among ZrE$2 (CTE: 6.5 ppm/°C), ZrC (CTE: 7.1 ppm/°C) and
SiC (CTE: 4.7 ppm/°C). A typical cracking pattern is shown in figure 4-7. The crack
propagated across the ZrC, ZrB2 and SiC grains without being deflected along the
grain boundaries.
The fracture toughness of hot-pressed ZrE$2 , SiC was reported to be 2.3-3.1
MPa- m1/2,[17] and 3.0-4.3 MPa- m1/2,[18] respectively. The fracture toughness
values of ZrB2-SiC (10-30 % SiC) composites were reported to be between 4.1-5.3
MPa- m1/2 [8]. Therefore, the fracture toughness values of the ZrC-ZrB2-SiC
86

multiphase composites are comparable to that of the single-phase ceramics and
ZrB2-SiC composites.
4.3.3 Thermal conductivity
The measured heat capacities, thermal diffusivities, and the calculated
thermal conductivities of the various ZrC-ZrB2-SiC composites consolidated by SPS
are summarized in table 4-5. From this table, it is obvious that the heat capacity and
the thermal diffusivity decreased with increasing ZrC amount, but increased with
increasing SiC and ZrB2 additions. The heat capacity was in the range of 0.5 to 0.62
Jg'K" , showing a compositional dependence. The thermal diffusivity was in the
range of 12.36 to 30.46 mm2 s"1. It is evident that the compositional dependence is
stronger for the thermal diffusivity than for the heat capacity. This strong dependence
of thermal diffusivity on composition suggests that the thermal conductivity of the
ZrC-ZrB2-SiC composition is dominated by the heat flow in the composites. In the
case of ZZS-1, the same volume percent of ZrB2, ZrC, and SiC containing
composition, the thermal conductivity measured was 72.64 Wirf'K~'. The thermal
conductivity then decreased with increasing amount of ZrC. In particular, the ZZS-3
composition showed the low heat capacity as well as the lowest thermal diffusivity, in
turn resulting in the lowest thermal conductivity in the studied compositions. The
87

thermal conductivity dropped from 72.64 Wirf'KT1 for the ZZS-1 composition to
38.25 Wm_1K~l for the ZZS-3 composition, for approximate loss of 50%. On the
other hand, the thermal conductivity of the ZrC-ZrB2-SiC composites increases with
increasing ZrB2 as well as of SiC amount. The improvement of thermal conductivity
is more substantial for increasing SiC than for increasing ZrB2. The ZZS-5
composition, 50 vol.% SiC containing composite, showed the highest heat capacity as
well as the highest thermal diffusivity, which in turn resulting in the highest thermal
conductivity among all the materials. The thermal conductivity increased from 72.64
Wm^K"1 for the ZZS-1 composite to 92.85 WnT'K"1 for the ZZS-5 composition
material, for approximate increase of 30%.
It is known that the thermal conductivity of the composites is dependent on
the thermal conductivity of the components and the interfacial thermal resistance of
the grain boundaries. The thermal conductivity of SiC is higher than that of the ZrB2
and ZrC materials, [1, 19, 20] and ZrC has the lowest thermal conductivity among the
ZrB2, ZrC, and SiC components [1, 19]. This implies that the increasing SiC and ZrB2
content should improve thermal conductivity of ZrC-ZrB2-SiC ceramics. Conversely,
increasing ZrC content should decrease thermal conductivity. This effect is closely
linked to the amount of SiC, ZrB2 and ZrC additions as well as to the distribution
88

because they influenced the heat flow resistance through the components and the
interfaces. In the case of high ZrC-containing ZrC-ZrB2-SiC (ZZS-3, ZZS-4, and
ZZS-8), the ZrC was the pristine phase and the other two phases (ZrB2 and SiC) were
dispersed in it. This structure characteristic led to increased resistance for the heat
flow through the components and their interfaces, compared to ZZS-1. This thermal
resistance was enhanced with increasing amount of ZrC. In the case of high SiC or
ZrB2-containing ZrC-ZrB2-SiC (ZZS-2, ZZS-5, ZZS-6, and ZZS-7), on the other
hand, the ZrC particles were embedded in a SiC or ZrB2 matrix. This characteristic
structure of SiC or ZrB2 particles formed in ZrC-ZrB2-SiC composites should
enhance its heat transport capability, because it could provide a route of higher heat
flow. In particular, SiC has the highest thermal conductivity among ZrB2, SiC and
ZrC. Thus, in the present study, the addition of SiC or ZrB2 improved heat capacity as
well as heat transport, resulting in high thermal conductivity.
4.3.4 Electrical conductivity
In figure 4-8, the two examples of the current-voltage relations measured at
room temperature for the various ZrC-ZrB2-SiC composites consolidated by SPS are
presented. It is clear that the current increased linearly with voltage for every case, i.e.
a linear relationship between current and voltage. This indicated that good ohmic
89

contacts have been realized between the measured composite samples and the
electrode. Additionally, the slope of the current-voltage curve is related to the
compositions: high ZrB2 content resulted in a lower slope. This indicated that the
resistance is reduced with increasing ZrB2 in the ZrC-ZrB2-SiC compositions. The
measured electrical resistivity and conductivity of the various ZrC-Z'rB2-SiC
composites consolidated by SPS are summarized in table 4-6. The electrical
conductivity of the ZrC-ZrB2-SiC composites was measure to be in the range of
0.916xl04 to 4.521xl04 Q ' W 1 . In the case of ZZS-1, 33.3 vol.% ZrB2-33.3 vol.%
ZrC-33.3 vol.% SiC composite, the measured electrical conductivity was 1.606xl04
fr'cirf'. The electrical conductivity improved with ZrB2 addition. The highest
electrical conductivity was measured in the ZZS-2 composition composite and the
value was 4.521 xlO4 fT'cm"1. On the other hand, the electrical conductivity decreased
with increasing ZrC and/or SiC contents. The lowest electrical conductivity was
measured in the ZZS-4 composition composite. Although bulk ZrB2 and ZrC are
located in the electrical conductivity range of conductors, the electrical conductivity
of ZrC was significantly lower than that of ZrB2 [19]. Thus, the decrease in electrical
conductivity due to ZrC addition is a result of the lower electrical conductivity of
ZrC. In addition, it was found that the addition of SiC further reduced the electrical
90

conductivity of the ZrC-ZrB2-SiC composites because SiC is a semiconductor.
However, the lowest electrical conductivity was not observed in the 50 vol.%
SiC-containing composites, but in the 30 vol.% SiC-containing composite. This is
because of high ZrB2 content for the former (30 vol.% ZrB2) compared with the latter
(15 vol.% ZrB2). This indicated that ZrB2 addition is important for improving the
electrical conductivity of ZrC-ZrB2-SiC composites. Although the high ZrC and/or
SiC-containing ZrC-ZrB2-SiC composites exhibited lower electrical conductivity as
compared with high ZrB2-containing composites, the electrical conductivities of all
the ZrC-ZrB2-SiC composites investigated in this study are still within the range of
conductors. As a result, electrical discharge machining can be used for all the
ZrC-ZrB2-SiC composites.
4.3.5 Micropillar compression tests of ZrC-ZrB2-SiC composites
Typical FE-SEM images of fabricated micropillars about ZZS-1, ZZS-2, ZZS-6,
and ZZS-7 are listed in figure 4-9. Both ZZS-1 and ZZS-2 micropillars did not follow
the universal scaling law mentioned in chapter 3 and these two micropillars were
broken at fairly low maximum stress with 4.38 GPa for ZZS-1 and 1.39 GPa for
ZZS-2 shown in figure 4-10 and figure 4-11, respectively. Typical fracture surfaces of
ZZS-1 and ZZS-2 micropillars were shown in figure 4-12 and figure 4-13,
91

respectively. Most grains of both micropillars exhibited intragranular fracture
behavior rather than intergranular fracture behavior. The stress-strain (%) curve of
ZZS-6 and ZZS-7 are listed in figure 4-14 and figure 4-15, respectively. The
maximum stress of ZZS-6 and ZZS-7 reached 3.3 GPa and 4.42 GPa, respectively.
However, the micropillar of ZZS-6 was not broken, but small dimensional and shape
changes were noticed by FE-SEM images after applied compression stress in figure
4-16. The micropillar was slightly tilted to one direction (indicated by arrow mark in
the image). The images taken after applied compression stress for the ZZS-7
micropillar are shown in figure 4-17. The image was captured right before complete
fracture. It is noted that the crack did not0 start from the bottom edge of the micropillar
but from the top surface of the micropillar in the longitudinal direction. Several TEM
microstructures are listed in figure 4-18. In these images, stacking faults and small
dislocations were found in the number 1 area and the number 2 area in the TEM
lamella, respectively. The dislocations were very small and located in one grain so
that they were produced from the milling process, but stacking faults might be
produced by applied compression stress because stacking faults were connected
through several grains. These results were very similar to the ZSN system discussed
in chapter 3.
92

4.4. Conclusion
(1) The ZrC-ZrB2-SiC composites were consolidated by SPS at 1950°C for 2
min under a pressure of 50 MPa, and the composites were almost fully dense
regardless of composition. The microstructure of the composites consisted of the
equiaxed ZrB2, ZrC and SiC grains. Primary component phase formed a short net-like
structure, and the other secondary phases were homogenously dispersed in it.
(2) The shear modulus of the ZrC-ZrB2-SiC composites was in the range 180
to 225 GPa, and the Young's modulus was in the range 434 to 517 GPa, depending on
composition. Poisson's ratio was almost the same for all the studied compositions.
The ranges of hardness and fracture toughness values were measured to be 18.8 to
21.51 GPa, and 4.69 to 6.1 MPa- m1/2, respectively.
(3) The thermal conductivity of the ZrC-ZrB2-SiC composites decreases with
increasing ZrC content, but it increases with increasing SiC and/or ZrB2 content. The
measured thermal conductivities are in the range 38.25 to 87.59 Wm"'K"', depending
on component content.
(4) The electrical conductivities of the ZrC-ZrB2-SiC composites increased
with increasing ZrB2 content, conversely; the electrical conductivity decreased with
increasing SiC and/or ZrC content. The measured electrical conductivities were in the
93

range 0.916xl04 to 4.521xl04 O ' W 1 .
(5) The applied compression stress to ZZS-1 and ZZS-2 micropiUars led to
complete fracture with maximum stress of 4.38 GPa and 1.39 GPa, respectively. The
longitudinal cracking behavior was observed in the ZZS-7 micropillar. In addition,
stacking faults were generated by applied stress (by TEM investigation).
94

Materials
ZZS-1
ZZS-2
ZZS-3
ZZS-4
ZZS-5
ZZS-6
ZZS-7
ZZS-8
Compositions (Vol.%)
ZrB2
33.3
70
15
15
30
55
55
30
ZrC
33.3
15
70
55
20
15
30
55
SiC
33.3
15
15
30
50
30
15
15
Table 4-1. Compositions of ZrC-ZrB2-SiC composites.
95

Materials
ZZS-1
ZZS-2
ZZS-3
ZZS-4
ZZS-5
ZZS-6
ZZS-1
ZZS-8
Theoretical
Density
(g/cm3)
5.51
5.85
6.14
5.70
5.01
5.51
5.93
6.06
Measured
Density
(g/cm3)
5.44
5.76
6.05
5.65
4.94
5.44
5.86
5.97
Relative
Density
(%TD)
98.7
98.5
98.5
99.1
98.6
98.7
98.8
98.5
Elastic Properties
G (GPa)
205
225
180
192
206
215
211
196
E (GPa)
477
517
435
449
486
500
496
457
V
0.17
0.16
0.18
0.17
0.18
0.16
0.18
0.17
Table 4-2. Densities and elastic properties of ZrC-ZrB2-SiC composites.
96

Sample
ZZS-1
ZZS-2
ZZS-3
ZZS-4
ZZS-5
ZZS-6
ZZS-7
ZZS-8
ZrB2 (um)
1.33±0.61
1.30±0.54
1.75±0.61
1.27±0.49
1.25±0.52
1.53±0.55
1.71±0.77
1.31±0.60
ZrC (um)
1.09±0.48
1.21±0.46
1.39±0.65
1.33±0.60
0.99±0.43
1.20±0.41
1.35±0.62
1.36±0.51
SiC (um)
0.78±0.36
0.82±0.36
0.60±0.25
0.59±0.25
1.04±0.55
0.74±0.31
0.64±0.26
0.58±0.26
Table 4-3.The measured grain size of each component ZrB2, ZrC, and SiC for
ZrC-ZrB2-SiC composies
97

Sample
ZZS-1
ZZS-2
ZZS-3
ZZS-4
ZZS-5
ZZS-6
ZZS-7
ZZS-8
Hardness (GPa)
19.20 ± 0.96
21.51 ± 1.32
19.56 ± 1.00
18.80 ± 0.78
20.40 ± 1.94
19.64 ± 0.74
19.40 ± 1.21
19.61 ± 0.75
Toughness (MPa.m1/2)
6.10 ± 0.75
6.09 ± 0.53
4.69 ± 0.26
5.52 ± 0.33
N/A
5.76 ± 0.42
5.04 ± 0.37
5.63 ± 0.24
Table 4-4. Hardness and fracture toughness of ZrB2-ZrC-SiC composites
98

Samples
ZZS-1
ZZS-2
ZZS-3
ZZS-4
ZZS-5
ZZS-6
ZZS-1
ZZS-8
Heat capacity
Cpdg'K-1)
0.58
0.54
0.51
0.55
0.62
0.58
0.53
0.50
Thermal
diffusivity
a(mm2s_1)
22.98
27.69
12.36
16.82
30.46
28.20
23.64
16.33
Thermal
conductivity
Kc (Wm-'K"1)
72.64
85.63
38.25
51.77
92.85
89.02
73.73
49.07
Table 4-5. Thermal properties measured at room temperature for the ZrC-ZrE$2-SiC
composites
99

Samples
ZZS-1
ZZS-2
ZZS-3
ZZS-4
ZZS-5
ZZS-6
ZZS-7
ZZS-8
Electrical
resistivity
R(10"5Ocm)
6.226
2.212
9.384
10.917
8.282
3.333
3.094
5.682
Electrical conductivity
( lOtoW1)
1.606
4.521
1.066
0.916
1.207
3.002
3.231
1.760
Table 4-6. Electrical properties measured at room temperature for the ZrC-ZrB2-SiC
composites

2.0
0 -
~! 1—I 1 1 1 1 1 1 1 1 — | 1 T - , ,"l 1 1 1 1 1—I 1 1 1 1 1 ] 1 1—1 1 "
(a)
E 1-5 E
• 4 - j
c f? 1.0 <D O 03 CL .«a 0.5 Q
- 1800
-I—I—I 1—I—I—I—1—I—I—1—1—I—I—I—I—I—I—1—I—I—I—I—1—I 1—I—I—I—I—u-
2000
1000 0 50 100 150 200 250 300
Sintering Time (second)
Figure 4-1. Typical examples of recorded shrinkage curves during the SPS cycle for
ZZS-2, ZZS-3, and ZZS-5.
101

o to
N N GO •
y
"2 N N GO
i*. 'o1
N N GO i
<̂» ^ •£> N N GO •
0 \
N N GO
| - J J ^ N N GO
0 0
31 era' c Of
4^ i
X 1
3 a.
5? P3
o o" 3
•a
C/5
O
8 =r « P 3 HT
1? N N GO
^ ^̂ ^ N N GO
ro o Q. CD (Q CD CD
ro o
CO o
o
a i o
CD o
--4 o
cx> o
*? ^ ' /
: |
f L f
-r i~ ' . f ?
.
t f :f i
.
*"
I f • f cz *"- c-c c c cr I L r f—
to
Intensity, (a.u)
S- 5 J S f ( ^

5|ua «mmmM&¥mm«*^&vm
Figure 4-3. Typical FE-SEM images for the ZrB2-ZrC-SiC composites
103

Figure 4-4. Typical TEM images for the ZZS-! composite
104

Figure 4-5. Typical TEM images for the ZZS-2 composite
105

>*~ " W i d C D )
Figure 4-6 Typical TEM images of interphase interface between (a) SiC and ZrB2
and (b) ZrB2 and ZrC
106

Figure 4-7. Typical cracking behavior of ZrC-ZrB2-SiC composites
107

20
. — s .
> O —̂ X <D
O >
15
10
5
U
-5
-10
-15
-20 _ j i—i i _
—I—i—I—i—i—i—r-
•ZZS-4 •ZZS-6
-150 -100 -50 0 50
Current (mA)
100 150
Figure 4-8. Current versus voltage measured at room temperature for the
ZrC-ZrB2-SiC composites
108

Figure 4-9. Fabricated micropillar of ZZS -1, ZZS-2, ZZS-6, and ZZS-7
109

0 10 20 30 40 50 60 70
AL/L(%)
Figure 4-10. Stress vs. strain (%) curve of ZZS-1 micropillar
110

(TJ Q_ O
</5
1.4
1.2
1.0
0.8
0.6
0.4
0.2
0.0 -
• •
• ZZS-2
. , . .
•
/
/
- H r— 0 10 20 30 40
Al_/L(%)
50 60
Figure 4-11. Stress vs. strain (%) curve of ZZS-2 micropillar
111

Figure 4-12. Intragranular fracture surface of ZZS-1 micropillar
112

Figure 4-13. Intragranular fracture surface of ZZS-2 micropillar
113

3.5
3.0
2.5 ^ ^
S. 2.0 O "**-•
w 1.5 w 0 i _
CO 1 0
0.5
0.0 i
• ZZS-6
#
/
/I it /I
H If # /
/ /
yj 0.00 0.05 0.10
AL/L (%)
0.15 0.20
Figure 4-14. Stress vs. strain (%) curve of ZZS-6 micropillar
114
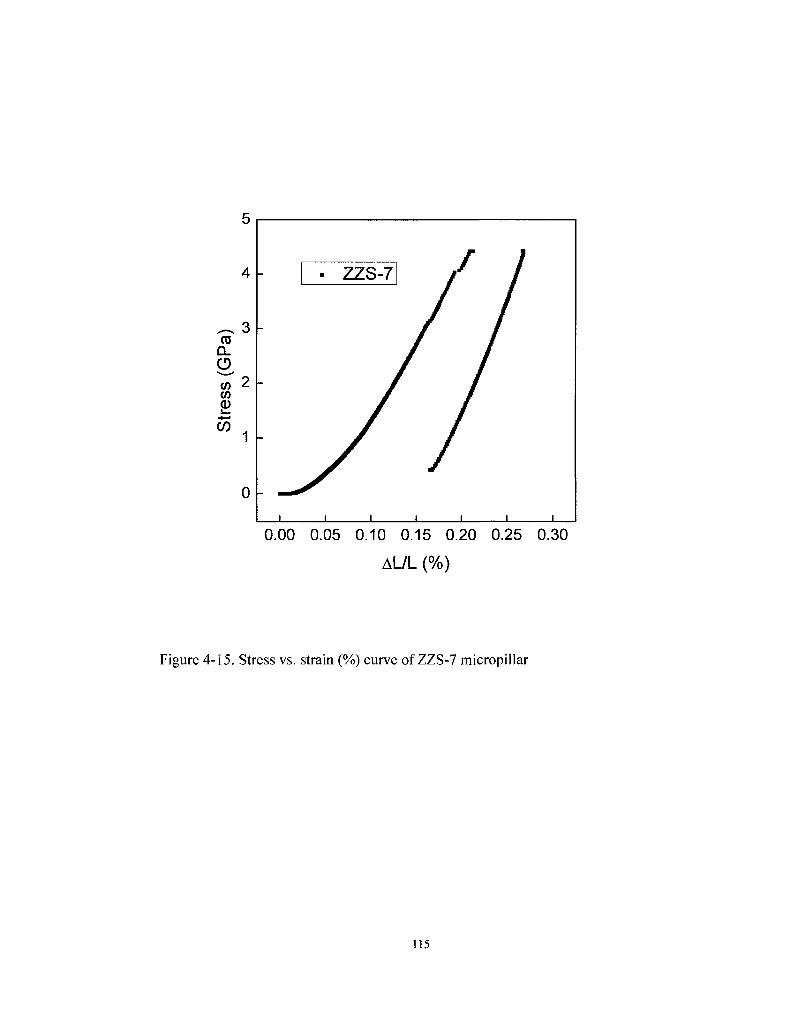
5
1 I I I L
0.00 0.05 0.10 0.15 0.20 0.25 0.30
AL/L (%)
Figure 4-15. Stress vs. strain (%) curve of ZZS-7 micropillar
115
CO Q . CD
</) w <D !_ -*—•
CO
4
3
2
1
0

Figure 4-16. Dimensional and shape change of ZZS-6 micropillar
116

* • _ » 2*
Figure 4-17. Typical cracking behavior of ZZS-7 micropillar
117

Figure 4-18. Typical TEM images of ZZS-6 micropillar after compression stress.
118

References
[I] K. Kuwabara, (2002), Some characteristics and applications of ZrB2 ceramics.
Bull. Ceram. Soc. Jpn., 37(4), p267-271.
[2] K. Upadhya, J. M. Yang, and W. P. Hoffmann, (1997), Materials for ultrahigh
temperature structural applications, Am. Ceram. Soc. Bull., 76(12), p51—56.
[3] S. Q. Guo, T. Nishimura, Y. Kagawa, and H. Tanaka, (2007), Thermal and electric
properties in hot-pressed ZrB2-MoSi2-SiC composites, J. Am. Ceram. Soc, 90(7),
p2255-2258.
[4] O. Kida and Y Segawa, (1987), ZrB2 composite sintered materials, US Patent
4,636,481.
[5] J. Bull, J. White, and L. Kaufman, (1998), Ablation resistant zirconium and
hafnium ceramics, US Patent 5,750,450.
[6] A. S. Brown, (1997), Hypersonic designs with a sharp edge. Aerospace Am.,
35(9), p20-21.
[7] C. Mroz, (1994), Zirconium diboride. Am. Ceram. Soc. Bull., 73(6), pl41-142.
[8] S. Norasetthekul, P. T. Eubank, W. L. Bradley, B. Bozkurt, and B. Stucker, (1999),
Use of zirconium diboride-copper as an electrode in plasma applications., J. Mater.
Sci., 34(6), pl261-1270.
[9] V. Medri, F. Monteverde, A. Balbo, and A. Bellosi, (2005), Comparison of
ZrB2-ZrC-SiC composites fabricated by spark plasma sintering and hot pressing.,
Adv. Eng. Mater., 7(3), pi59-163.
[10] A. Bellosi, F. Monteverde, and D. Sciti, (2006), Fast densification of ultra-high
temperature ceramics by spark plasma sintering. Int. J. Appl. Ceram. Technol., 3(1),
p32-40.
[II] M. Nygren, and Z. Shen, (2003), On the preparation of bio-, nano- and structural
119

ceramics and composites by spark plasma sintering. Solid State Sci., 5, pl25—131.
[12] M. Nygren, and Z. Shen, (2004), Novel assemblies via spark plasma sintering.,
Silic. Ind.,69, p211-218.
[13] V. Medri, F. Monteverde, A. Balbo, and A. Bellosi, (2005), Comparison of
ZrB2-ZrC-SiC composites fabricated by spark plasma sintering and hot pressing.,
Adv. Eng. Sci.,7, pl59-163.
[14] K. A. Khor, K. H. Cheng, L. G. Yu, and F. Boey, (2003), Thermal conductivity
and dielectric constant of spark plasma sintered aluminum nitride., Mater. Sci. Eng.
A, 347, p300-305.
[15] S. Palmqvist, (1962), Occurrence of Crack formation During Vickers Indentation
as a Measure of the Toughness of Hard Materials, Arch Eisenhuettenwes., 33,
P629-633.
[16] W. J. Parker, W. J. Jenkins, C. P. Butler, and G. L. Abbott, (1961), Flash method
of determining thermal diffusivity, heat capacity and thermal conductivity., J. Appl.
Phys., 32(9), pi679-1684.
[17] F. Monteverde, and A. Bellosi, (2003), Beneficial effects of AIN as sintering aid
on microstructure and mechanical properties of hot-pressed ZrB2., Adv. Eng. Mater.,
5(7),p508-512.
[18] H. Tanaka, and Y. Zhou, (1999), Low temperature sintering and elongated grain
growth of 6H-SiC powder with AIB2 and C additives. J. Mater. Res., 14(2),
p518-522.
[19] Manufactures Data. Japan New Metals Corporation Ltd., Tokyo, Japan
(http://www.jnm.co.jp).
[20] Y. Takeda, (1988), Development of high-thermal-conductive SiC ceramics. Am.
Ceram. Soc. Bull, 67(12), pl961-1963.
120

Chapter 5
SCS 9a fiber-reinforced ZrB2-RB(Reaction-bonded) SiC composite
Abstract
SCS 9a fiber-reinforced ZrB2-RB (Reaction-bonded) SiC composite was
examined. SCS 9a fiber-reinforced ZrB2-RB SiC composite was fabricated by hot
pressing with reaction bonding process of SiC after tape casting with slurry and
woven SCS 9a fibers. Density was measured by pycnometer and porosity was
calculated from measured density. Hardness and fracture toughness of matrix
materials were measured by indentation technique, but fracture toughness of the
composite was measured by four point bending method. At last, microstructural
analysis was conducted by FE-SEM with EDS and TEM with EDS and SAED
(Selected Area Electron Diffraction). The porosity was 10.40% due to SiC reaction
bonding process and the large cracks (including micro cracks were observed; these
are due to the thermal expansion mismatch between the fiber and matrix materials.
This high porosity and large cracks with micro cracks affected the hardness and
fracture toughness of the composites. However, the fracture toughness of the
composite was improved compared to the fracture toughness of the matrix itself
because of the effect of fibers. No chemical reaction was found by thermodynamical
calculation, SEM, and TEM analysis in the interface between the fiber and the matrix
121

materials. In addition, complex SiC structures such as twin boundaries and stacking
faults were observed due to the reaction bonding process of SiC.

5.1 Introduction
Zirconium diboride has a high melting temperature (>3000 °C), chemical
stability, high electrical and thermal conductivities, resistance to erosion/corrosion,
and good mechanical properties, making it promising candidate for
ultra-high-temperature applications [1]. Addition of a silicon carbide to zirconium
diboride enhances the oxidation resistance and limits the zirconium diboride grain
growth due to borosilicate diffusion barrier and liquid phase sintering effect,
respectively [2, 3].
However, the use of ultra-high-temperature ceramics without reinforcements has
limitations due to low fracture toughness and poor thermal shock resistance [4]. Thus,
the incorporation of a fiber reinforcement phase into ZrB2-SiC ceramics is
indispensible in order to improve fracture toughness, thermal shock resistance, as
well as to lower the composite density [5]. Among various ceramic fibers for high
temperature applications, SiC fiber with low oxygen content and small diameter has
good thermomechanical reinforcement capability [6].
Reaction bonding of ceramics has various advantages, which include low raw
materials costs, near net-shape tailorability, low-to-zero shrinkage capability, and
glass-phase-free grain boundaries for many technical and high performance
123

applications. Among these advantages, the low-to-zero shrinkage capability makes
most reaction forming techniques suitable for the fabrication of composites [7].
Levine, et al. studied ZrB2-SiC ceramics, ZrB2-SiC-C, and SiC fiber-reinforced
ZrB2-SiC composites. The flexural strengths of SiC fiber-reinforced composites were
130 MPa, 101 MPa, and 84.5 MPa at room temperature, 1127 °C, and 1327 °C,
respectively. The flexural strength of composites were fairly low due to high porosity
(up to 30%) from incomplete densification and large amount of micro cracks from the
difference between coefficient of thermal expansion of matrix and that of fiber.
However, the composites were not separated into two separate pieces due to crack
bridging by the fibers [8].
In this study, SiC fiber-reinforced ZrB2-RB (Reaction Bonding) SiC composites
were consolidated by a hot pressing method. The physical, mechanical, and
microstructural analyses are discussed in this chapter.
5.2 Experimental procedures
5.2.1 Fabrication
The starting powders used in this study were ZrB2, Si, and carbon powders and
the fibers used in this study were SCS 9a fibers (Specialty Materials Inc, Lowell,
124

MA), which is composed of a 33 um carbon core and 46 um SiC outer layer. The first
step to prepare composite billets with size of 10 cm by 7 cm was mixing the three
powders to slurry state with composition of 20 vol% SiC and 80 vol% ZrE$2. The SCS
9a fibers were wound on the four-sided mandrel with eight-layer thickness to achieve
20 vol% SiC fiber content. The wound fibers were coated with the matrix slurry by
tape casting. The prepared green billet was dried in oven at 110 °C, and then the dried
billet was trimmed and loaded into the hot pressing die. The die was placed on a
support fixture and loaded into an inert gas furnace. The furnace was heated from
room temperature to 525 °C at 0.55 °C/min and held for one hour. The die was then
loaded into the hot-press and processed at reaction bonding temperature (1450-1650
°C) and under a vacuum of 4.3X10"3 Torr for 75min. No extrusion of fiber of matrix
was observed upon removal from the die.
5.2.2 Phase analysis, density, and porosity measurements
X-ray diffraction was used in order to confirm the crystalline phases, especially
reaction-bonded SiC. The density of fabricated composite was measured directly by
pycnometer with helium gas as a medium for accurate. The porosity was calculated
from apparent density, and measured density by direct measurement from the
pycnometer. The simple equation is that porosity is (1-measured density/apparent
125

density) X100 [9]. For density and porosity, five samples were cut from the
composite billet.
5.2.3 Elastic properties, hardness, and fracture toughness measurements
Elastic properties could not be measured by ultrasonic technique due to
difficulties in measuring the velocity of sound waves. Young's modulus was
measured by nano-indentation technique (MTS Nanoindenter/XP, MTS system, Eden
Prairie MN). Hardness and fracture toughness of matrix materials were measured by
microhardness tester as described in previous chapters. The load for measurement
was 49N and ten tests were made in the matrix part. The single edge pre-cracked
beam tested in accordance with ASTM C 1421 [10] was used to determine the
fracture toughness (KiPb) of SiC-fiber-reinforced ZrE$2-SiC composites with four test
samples. All samples were polished with wet silicon carbide papers (grits 400, 600,
and 1200, successively) on all surfaces except end planes, and the sharp edges were
chamfered. The equations for calculations of fracture toughness are listed below and
the detailed dimensional information is shown in figure 5-1.
• Iph f P \S - S 110"
max L o / J BWV2
3 [a I W f 2[l-a/W]3 (1)
l3A9-0.6S\a/W] + l35\a/W]2)\a/W](l-\a/W]} / = 1.9887-1.326[a/^]--L L _ J l. Ul i i _ J £ (2)
L J {\ + [a/W] 2
126

5.2.4 Microstructure observations
In order to analyze the structural information of SiC fibers and matrix materials,
a whole cross sectional view of the composites was obtained by optical microscope
with CCD camera (Carl Zeiss Microimaging Inc. Thornwood NY). A total of 18
(6 X 3) pictures were taken of different areas with X 50 magnification so that all fiber
layers structures should be included. The elemental analysis was conducted by
FE-SEM with EDS for finding unknown elements in the composites. The crack
density and grain size of each component were investigated by FE-SEM images with
Image-J software. In order to estimate average crack density and average grain size of
each component, ten FE-SEM images were used. In addition, fracture mechanism of
matrix and composites were analyzed by FE-SEM images.
To investigate detailed microstructural information of hot-pressed composites
with SiC fibers, randomly selected areas of composites matrix and interface between
SiC fibers and matrix were observed by TEM (FBI-Philips CM300, FEI, Hillsboro,
OR) with EDAX Energy Dispersive X-ray spectrometer (EDS) and Si/Li detector
super ultrathin window. The TEM samples used in this study were prepared by
Focused Ion Beam (FIB Nova 600, FEI, Hillsboro, OR) with tungsten probe tips and
four fingers copper grid.
127

5.3 Results and discussion
5.3.1 Density, porosity, and phase.
. The measured density, the apparent density, and the theoretical density of
hot-pressed SCS 9a fiber-reinforced ZrB2-20 vol% SiC composites billet were 3.98
g/cm3, 4.44 g/cm3, and 4.96 g/cm3, respectively. The measured densities of ZrB2-nano
SiC ceramics were in the range of 5.13-5.85 g/cm3 and those of ZrC-ZrB2-SiC
ceramics were in the range of 4.94-6.05 g/cm3. The density of the composite is lower
than that of two matrix ceramics because the density of the fiber (2.8 g/cm3) is
relatively lower than that of the other two components (ZrB2: 6.09 g/cm3, SiC:
3.21 g/cm3). The porosity of the composite from direct calculation of densities was
10.4%, which is higher than that of ZrB2-nano SiC ceramics and that of
ZrC-ZrB2-SiC ceramics. It is possible that the large amount of pores is from
reaction-bonded SiC due to volume contraction after the reaction. The FE-SEM
images of top surface view and cross sectional view are shown in the figure 5-2.
X-ray diffraction patterns for the composite consolidated by HP (Hot Press) are
presented in figure 5-3. Although the peaks of ZrB2 and SiC phases showed the
different intensity, only ZrB2 and SiC phases were detected in the top surface of the
composite and the cross section of the composite. In addition, the difference between
128

intensity of SiC peaks of the top surface of the composite and that of the cross section
of the composite was found because SiC outer layers of the fibers make stronger SiC
peaks. However, we speculate that the small carbon core of the fiber could not be
detected by X-ray diffraction.
5.3.2 Elastic moduli, hardness, and fracture toughness
The measured elastic modulus by nano indentation technique was 266±17 GPa,
which is lower than that of ZrB2-nano SiC ceramics and that of ZrC-ZrB2-SiC
ceramics. It is difficult to compare with the other two ceramics due to the different
fabrication methods and raw materials, but porosity of sintered materials makes their
mechanical and physical properties decrease exponentially [11].
The hardness and the fracture toughness for the matrix part were 7.58±0.89 GPa
and 1.44±0.26 MPa-m1/2, respectively. These values are also lower than that of
ZrB2-nano SiC ceramics and that of ZrC-ZrB2-SiC ceramics due to the large amount
of pores in the matrix part. Typical indentation marks and cracking patterns are shown
in figure 5-4. The cracks initiated from the corner of the diamond indentation pattern
and propagated across the ZrB2 and SiC grains without being deflected along the
grain boundaries of the ZrB2 grains and the SiC grains.
One of the purposes of the fiber-reinforced composite is to improve the fracture
129

toughness of materials. Thus, four point bending test with pre-cracked beam was
conducted for measurement of fracture toughness in order to confirm the effect of the
fiber-reinforced composite. The measured fracture toughness of SiC-fiber-reinforced
composite was 6.01 ±1.86 MPa-m1/2. The fracture toughness was similar to the
ZrC-ZrB2-SiC fracture toughness and lower than the ZrB2-nano SiC fracture
toughness. However, the fracture toughness of the composite was more than four
times improved if compared to that of the matrix only. In addition, it is interesting to
note that the composite beam did not separate into two separate pieces due to a crack
bridging effect by the fibers. The FE-SEM images of composite fracture are shown in
figure 5-5. The crack initiated from the edge of a pre-crack and several fibers were
fractured. Delamination of composite was observed instead of a cut through the
composite.
5.3.3 Microstructural analysis
The whole cross section view of SiC fiber-reinforced composite is shown in
figure 5-6. The composite structure is 8 layers with 0° 90° direction fiber arrays.
However, the array of fibers inside the composite was not straight compared to the
first green billet. It is possible that fiber swimming occurred during fabrication. Many
large cracks and micro cracks were found inside and outside the composite. Typical
130

FE-SEM images of the composite cracks are shown in figure 5-7. The crack density
of the composite was l~3/mm2, but the size of most cracks was very large. These
cracks are due to the matrix thermal expansion coefficient being greater than that of
the fiber and thus leading to cracking upon cooling from the processing temperature
[8]. In addition, small black particles were observed in the matrix part of the
composite shown in figure 5-8. The black particles turned out to be carbon by EDS
result with FE-SEM in figure 5-8. These carbon particles could be from residual
carbon after reaction bonding of silicon and carbon.
The interface between SiC fiber and matrix material is critical for the
fiber-reinforced composite in order to improve fracture toughness. A FE-SEM image
of the interface between fiber and matrix with high magnification (X 20000) is in
figure 5-9. The outer carbon coating layer of fiber and the ZrB2-SiC matrix part were
well bonded to each other. First of all, the reaction between fiber and matrix was
considered. The most possible is between ZrB2 and carbon, which is listed below.
2ZrB2 + 2C -> 2ZrC + B4C Reaction (1)
The standard Gibbs free energy of formation of each component in reaction (1) at
different temperatures (298K, 1000K, and 2000K) are listed in table 5-1. Based on
basic calculations of Gibbs free energy for each component in reaction (1), the
131

reaction (1) has low possibility because the Gibbs free energy of reaction (1) is
42.189 kcal/mol, which is a positive value.
In order to analyze the detailed interface between the fiber and the matrix, TEM
microstructures were investigated. Typical TEM microstructures and SAED (Selected
Area Electron Diffraction) of ZrB2 and SiC grain are shown figure 5-10. In addition,
it is noted that several SiC grains from the reaction bonding process have complex
structures. The complex stacking faults were found in the region of part 2 and two
twin boundaries were observed in the region of part 3 in figure 5-10. As no complex
structures were found in the ZrB2 grains, the complex SiC grain structures could be
from the reaction bonding process. The detailed TEM microstructure images of
interface between the fiber and the matrix are shown in figure 5-11. The desirable
interface of the composite is not well-bonded interface with chemical reaction
between the fiber and the matrix. The several regions in the interface part were
confirmed by the EDS and diffraction, which is not indicated in figure 5-11. It seems
that only carbon coating layer of the fiber, ZrB2 grain, ZrB2 and SiC agglomerate, and
ZrB2 with SiC grain were found in the interface without chemical reaction.
5.4 Conclusion
132

The SCS 9a fiber-reinforced ZrB2-RB SiC composite was investigated. The hot
pressing method with reaction bonding of SiC resulted in 10.40% porosity due to the
SiC reaction bonding process and large cracks due to the thermal expansion mismatch
of the fiber and the matrix materials, and hence the low hardness and fracture
toughness properties of the matrix. However, the fracture toughness of the composite
itself was improved compared to the fracture toughness of matrix materials. In
addition, it is noted that the composite did not separate into two separate pieces by the
four point bending test.
The microstructural analysis of the interface between the fiber and the matrix
materials was conducted. Based on thermodynamical calculations with Gibbs free
energies and TEM investigations with electron diffraction and EDS analysis, no
chemical reaction was observed in the interface between the fiber and the matrix
materials. In addition, complex SiC grain structures were observed, such as twin
boundary and stacking faults.
The SCS 9a fiber-reinforced ZrB2-RB SiC composite is a good approach for a
composite with ultra-high temperature applications, but several processes are needed
to improve the mechanical properties of the composite.
133

ZrB2
C
ZrC
B4C
A G 298
(Kcal/mol)
-76.049
0
-46.194
-9.151
A G IOOO
(Kcal/mol)
-73.225
0
-44.713
-8.782
A G 2000
(Kcal/mol)
-66.708
0
-42.028
-7.171
Table 5-1. Gibbs free energy of formation of ZrB2, C, ZrC, and B4C at 298K, 1000K,
and2000K[12].
134

So = 40mm
W = 4mm : a = 2 m m H
;0 3 - ^ 4mm Si = 20mm
B= 3mm
50mm
Figure 5-1. Detailed dimensions of SCS 9a fiber-reinforced composites for fracture
toughness.
135

Figure 5-2. FE-SEM images of SCS 9a fiber-reinforced composite; (a) Top surface
view, (b) Cross-sectional view.
136

S
10000
8000
6000
4000
2000
0
i
•
•
_
•
l Cross section
• ZrB2
• SiC
• •
1 1A 11 i * L 1 A
• i i i i i i
20 30 40 50 60 70 80 90 100
20
fr
s
=
12000
10000
8000
6000
4000
2000
0
-
-
1
1
•
- i
1
• A ...
i , i
1
• 1 1
i
Top surface
•ZrB2
• SiC
1?, i
•
1" •! 1 I i i i i i i i
20 30 40 90 50 60 70 80
20 Figure 5-3. Typical X-ray diffraction pattern of SCS 9a fiber-reinforced ZrB2-RB SiC
composite
137

I r-v h ing patte- n [*S/VJ ^* i
W^S ' $ & & & $
Figure 5-4. Typical indentation mark and cracking pattern of SCS 9a fiber composite.
138

* ^3L W;J*£=£Z3»'V%3BB£.
fes- "<SS. . ?S:
Figure 5-5. FE-SEM images of SCS 9a fiber-reinforced composite fracture.
139

-Pf» * * " * * * «
- ^ s ^ i f i S
Figure 5-6. Whole cross-section view of SCS 9a fiber-reinforced composite.
140

Figure 5-7. Typical FE-SEM images of cracks inside and outside the composite
141

Figure 5-8. FE-SEM Images of residual carbon from reaction bonding and EDS
result.
142

Aa • " ' *-5
Figure 5-9. The FE-SEM image of the interface between fiber and matrix.
143

Figure 5=10 Typical TEM microstructures and SAED (Selected Area Electron
Diffraction) of the composite
144

Figure 5-11. Typical TEM microstructural images and EDS results of the interface
between the fiber and the matrix; (a) Carbon coating layer of the fiber, (b) ZrB2 grain,
(c) ZrB2 and SiC agglomerate (d) ZrB2 and SiC grains.
145

References
[1] William G. Fahrenholtz, Gregory E. Hilmas, Inna G. Talmy, and James A.
Zaykoski (2007) Refractory diborides of zirconium and hafnium J. Am. Ceram. Soc,
Vol.90, Issue 5, pl347-1364
[2] Jiecai Han, Ping Hu, Xinghong Zhang, and Songhe Meng, (2007) Oxidation
behavior of zirconium diboride-silicon carbide at 1800 °C, Scripta Materialia 57,
p825-828.
[3] Ronald Loehman, Erica Corral, Hans Peter Dumm, Paul Kotula, and Raj an
Tandon, (2006) Ultra high temperature ceramics for hypersonic vehicle applications,
SAND 2006-2925
[4] M. M. Opeka, I. G. Talmy, and J. A. Zaykoski, (2004), Oxidation-based materials
selection for 2000 °C + hypersonic aerosurfaces: Theoretical considerations and
historical experience, J. Mater. Sci., 39, p5887-5904.
[5] Sufang Tang, Jingyi Deng, Shijun Wang, and Wenchuan Liu, (2007), Fabrication
and characterization of an ultra high temperature carbon fiber-reinforced ZrB2-SiC
matrix composite, J. Am. Ceram. Soc, 90, [10], p3320-3322.
[6] J. A. Dicarlo, H. M. Yun, and J. B. Hurst, (2004), Fracture mechanisms for SiC
fibers and SiC/SiC composites under stress rupture conditions at high temperatures,
Applied mathematics and computation, 152, p473-481.
[7] Nils Calussen, Suxing Wu, and Dietmar Holtz, (1994) Reaction bonding of
aluminum oxide (RBAO) composites: Processing, reaction mechanisms and
properties, J. of Euro. Ceram. Soc, 14, p97-109.
[8] Stanley R. Levine, Elizabeth J. Opila, Michael C. Halbig, James D. Kiser,
Mrityunjay Singh, and Jonathan A. Salem, (2002), Evaluation of ultra high
temperature ceramics for aeropropulsion use, J of Euro. Ceram. Soc, 22,
p2757-2767.
[9] R. Griffiths and C. Radford, (1965), Calculations in ceramics, Maclaren and sons
146

LTD, London, England, Chapter 4, Porous solids.
[10] ASTM C 1421-0lb, (1999), Standard test method for the determination of
fracture toughness of advanced ceramics at ambient temperatures, Annual book of
ASTM standards, V. 15. 01, American Society for Testing and Materials, West
Conshohocken, PA.
[11] J. Kovacik, (1999), Correlation between Young's modulus and porosity in porous
materials, J. Master. Sci., 18, pi007-1010.
[12] M. W. Chase, (1974), JANAF thermochemical tables
147

Chapter 6
Conclusions
In this dissertation, the investigation into ZrB2-based composites for
ultra-high-temperature applications is summarized in this chapter with the
conclusions of each previous research. It can be concluded that ZrE$2-based
composites are the most promising candidate materials for ultra-high-temperature
applications.
Chapter 1
The ultra-high-temperature ceramics was defined and brief development history
was explained. In addition, the applications for ultra-high-temperature ceramics were
introduced and then, the requirements for each application were discussed.
Chapter 2
An extensive and thorough literature survey of ultra-high-temperature ceramics
were made in chapter two. At first, how ZrB2-SiC ceramics were selected for
ultra-high-temperature ceramics was explained. Two important properties of
ZrB2-SiC ceramics, oxidation property and mechanical property, were explained with
the limitation of current research from other studies. The spark plasma sintering was
introduced with several advantages for nano and high temperature ceramics. Lastly,
liquid phase sintering mechanism was explained.
148

Chapter 3
ZrE$2 nano-sized SiC ceramics were investigated in chapter three. Spark plasma
sintering and liquid phase sintering effect enabled ZrB2 nano-sized SiC ceramics to
be fully dense. Incorporation of nano-sized SiC effectively hindered the grain growth
of ZrB2, but better dispersion process was needed to avoid the SiC agglomerates in
the ceramics. The hardness of the ceramics was dependent on composition, but the
fracture toughness was not related to the compositions. Each phase ZrB2 and SiC
grain was confirmed and the second phase, Zr(0, B)x, was observed by the TEM
microstructural analysis. In addition, the produced dislocations and stacking faults
were observed by the micropillar compression tests.
Chapter 4
ZrC-ZrB2-SiC ceramics were investigated in chapter four. The fully densed
ceramics were prepared by the spark plasma sintering and liquid phase sintering
effect. Elastic modulus, hardness, fracture toughness, thermal conductivity, and
electrical conductivity of ZrC-ZrB2-SiC ceramics decreased with increase of ZrC
content in the studied composition range. The fracture toughness of ZrC-ZrB2-SiC
ceramics was comparable with that of ZrB2 ceramics and that of ZrB2-SiC ceramics.
In addition, micropillar compression tests gave information about typical longitudinal
149

cracking behavior and generation of stacking faults.
Chapter 5
SCS 9a fiber-reinforced ZrB2-RB SiC composite was investigated in chapter five.
The composite was consolidated with conventional hot pressing with reaction
bonding of SiC. The prepared composite had high porosity and large amount of
cracks and these results affected to the mechanical properties of composite. However,
the fracture toughness of composite itself was four times higher than that of matrix
materials. The chemical reaction between fibers and matrix materials was not
observed based on thermochemical and TEM microstructural analysis. In addition,
reaction-bonded SiC was observed to complex structures.
150


