
ABSTRACT
4387 Rider Trail N. | Earth City, MO 63045 | 1.800.325.4875 | +1.314.344.3330www.foamsupplies.com | www.ecomatesystems.com
TITLE:Shelf Life Evaluation of Polyurethane Rigid Foams Blown with Ecomate®
AuThoR(S):David Modray
ABSTRACT:Reactivity drift (typically a slow down with time) of spray polyurethane foam systems has been experienced since the use of CFC-11 systems. A slower reactivity can cause problems like running or sagging during the foaming process. Reactivity drift can be attributed to a number of reasons considering the litany of raw materials present in the polyol blend (polyol, surfactant, catalyst, blowing agents, flame retardants, etc.). The industry’s need for optimization of all aspects of polyurethane foam systems, including shelf life, is paramount.
In this paper, different catalysts will be evaluated in ecomate® spray foam formulations to determine which choice of catalysts promotes longer shelf life. The liquid polyol blends will undergo an accelerated shelf life aging at 50oC (122oF) for four weeks. Many different catalyst types will be evaluated including metal, amine, blowing, and gelling families. The intent is to meet or exceed a six month shelf life without compromising other physical properties of the finished product.

Shelf Life Evaluation of Polyurethane Rigid Foams Blown with Ecomate®
DAVID MODRAY Foam Supplies, Inc. 4387 North Rider Trail Earth City, MO 63045
ABSTRACT
Reactivity drift (typically a slow down with time) of spray polyurethane foam systems has been experienced since the use of CFC-11 systems. A slower reactivity can cause problems like running or sagging during the foaming process. Reactivity drift can be attributed to a number of reasons considering the litany of raw materials present in the polyol blend (polyol, surfactant, catalyst, blowing agents, flame retardants, etc.). The industry’s need for optimization of all aspects of polyurethane foam systems, including shelf life, is paramount.
In this paper, different catalysts will be evaluated in ecomate® spray foam formulations to determine which choice of catalysts promotes longer shelf life. The liquid polyol blends will undergo an accelerated shelf life aging at 50 oC (122oF) for four weeks. Many different catalyst types will be evaluated including metal, amine, blowing, and gelling families. The intent is to meet or exceed a six month shelf life without compromising other physical properties of the finished product.
INTRODUCTION
Spray polyurethane foams form a significant part of the ever growing polyurethane industry. Spray foams have the advantage of easy application and fast cure, thus allowing them to be sprayed directly on the surface to be foamed. Spray polyurethane foam can be used at a construction site and applied even after most of the construction has been completed. Because of the application of the product, polyurethane spray foams must have a very rapid reactivity profile, rising and gelling within a few seconds of being applied. This is accomplished by adding high amounts of catalysts, typically an amine catalyst and a metal catalyst. The two catalysts work in synergy to create a polyurethane foam that rises and gels quickly.
However, spray foams have always had one major problem, a limited shelf life. This is usually the result of chemicals in the polyol blend that can decompose and/or react with other ingredients in the blend. Most commonly, polyester polyols, flame retardants, blowing agents, and other additives generate a small degree of acids. These acids then attach themselves to the catalysts and prevent the catalysts from doing their intended function during the foaming process. This is evident when the spray foam takes longer to react and cure. From an application standpoint, slower reacting spray foam can cause sagging or drooping, which diminishes foam performance and will generate solid foam waste.
In order to understand how acid formation occurs in the polyol blend, the acid generating reactions will now be studied one at a time in greater detail. First, the hydrolysis of the polyester polyol will be examined. Polyester polyols terminate in hydroxyl groups, but have ester groups built within their chemical chain. The ester groups can combine with any water present and generate an alcohol and a carboxylic acid. This is shown in Figure 1.

Figure 1. Polyester Polyol Hydrolysis
The acid produced can then block the amine catalysts present in the polyol blend and thus delay the reaction.One of the most common chemicals used in polyurethane foams is the flame retardant Tris(1-Chloro 2-propyl) Phosphate
or TCPP, a halogenated organic phosphate. Like the polyester polyol, it can hydrolyze in the presence of water and form an acid and a halohydrin, which in this case is, 1-chloro 2-propanol. This is shown in figure 2.
Figure 2. TCPP Hydrolysis
The acid produced can then block the amine catalysts.In a similar manner, other ingredients in the polyol blend can combine with water and generate an acid. This includes
other flame retardants, certain thinning agents, certain blowing agents, and even some surfactants.Another less understood phenomenon is the interaction of metal polyurethane catalysts with these same acids. Since all
metal catalysts are metal carboxylates, it is possible that the carboxylate on the metal can be substituted with a carboxylate from the acid of a hydrolyzed ester. This is shown in Figure 3.
Figure 3. Metal Catalyst Carboxylate Substitution
The new metal carboxylate would have a different catalytic activity or even worse, it could precipitate out of the polyol blend causing an even greater slowdown of the spray foam.
While spray polyurethane foams are initially made with a very rapid reactivity, often the reactivity slows down with time leading to application problems. A polyurethane foam formulator must keep in mind the possibility of hydrolysis when adding ingredients to the polyol blend, as hydrolysis can lead to a change in reactivity profile over time. In the following experiments, a method will be developed for optimizing spray polyurethane foam shelf life using several different catalyst combinations.
EXPERIMENTAL:
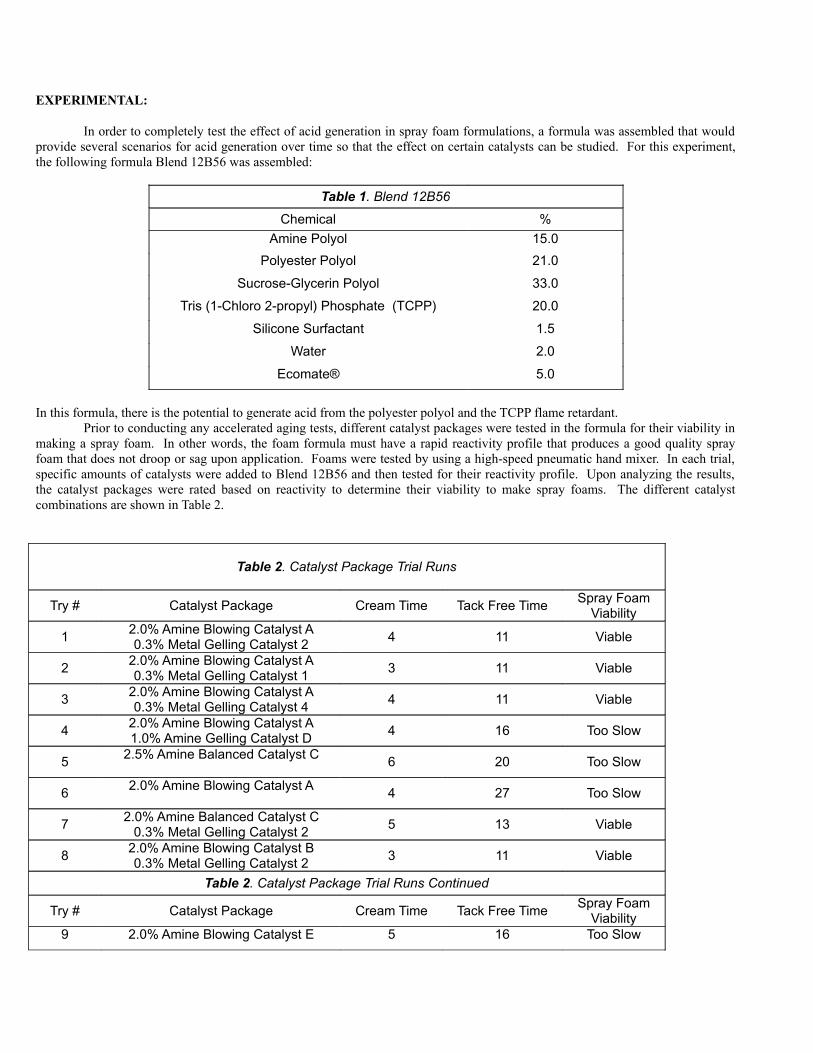
In order to completely test the effect of acid generation in spray foam formulations, a formula was assembled that would provide several scenarios for acid generation over time so that the effect on certain catalysts can be studied. For this experiment, the following formula Blend 12B56 was assembled:
Table 1. Blend 12B56
Chemical %
Amine Polyol 15.0
Polyester Polyol 21.0
Sucrose-Glycerin Polyol 33.0
Tris (1-Chloro 2-propyl) Phosphate (TCPP) 20.0
Silicone Surfactant 1.5
Water 2.0
Ecomate® 5.0
In this formula, there is the potential to generate acid from the polyester polyol and the TCPP flame retardant.Prior to conducting any accelerated aging tests, different catalyst packages were tested in the formula for their viability in
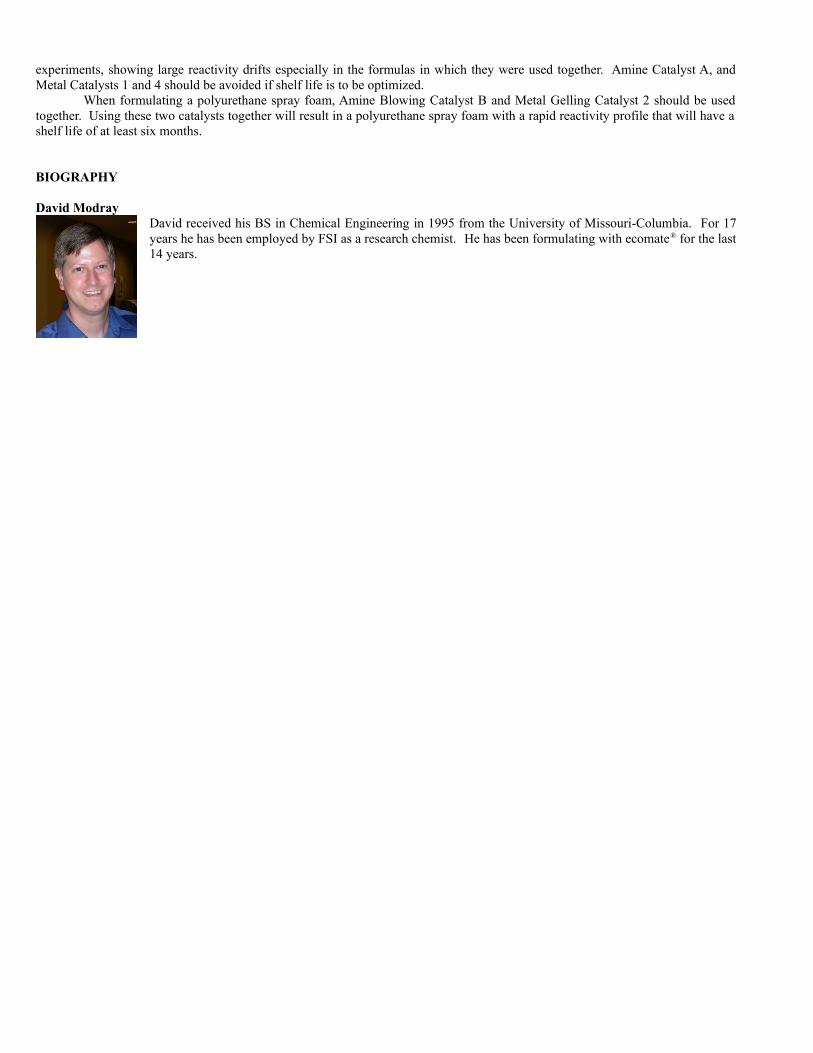
making a spray foam. In other words, the foam formula must have a rapid reactivity profile that produces a good quality spray foam that does not droop or sag upon application. Foams were tested by using a high-speed pneumatic hand mixer. In each trial, specific amounts of catalysts were added to Blend 12B56 and then tested for their reactivity profile. Upon analyzing the results, the catalyst packages were rated based on reactivity to determine their viability to make spray foams. The different catalyst combinations are shown in Table 2.
Table 2. Catalyst Package Trial Runs
Try # Catalyst Package Cream Time Tack Free TimeSpray Foam
Viability
12.0% Amine Blowing Catalyst A0.3% Metal Gelling Catalyst 2
4 11 Viable
22.0% Amine Blowing Catalyst A0.3% Metal Gelling Catalyst 1
3 11 Viable
32.0% Amine Blowing Catalyst A0.3% Metal Gelling Catalyst 4
4 11 Viable
42.0% Amine Blowing Catalyst A1.0% Amine Gelling Catalyst D
4 16 Too Slow
52.5% Amine Balanced Catalyst C
6 20 Too Slow
62.0% Amine Blowing Catalyst A
4 27 Too Slow
72.0% Amine Balanced Catalyst C
0.3% Metal Gelling Catalyst 25 13 Viable
82.0% Amine Blowing Catalyst B0.3% Metal Gelling Catalyst 2
3 11 Viable
Table 2. Catalyst Package Trial Runs Continued
Try # Catalyst Package Cream Time Tack Free TimeSpray Foam
Viability9 2.0% Amine Blowing Catalyst E 5 16 Too Slow

0.3% Metal Gelling Catalyst 2
100.5% Amine Blowing Catalyst A
1.5% Amine Balanced Catalyst C0.2% Metal Gelling Catalyst 2
5 14 Viable
110.5% Amine Blowing Catalyst A
1.5% Amine Balanced Catalyst F0.2% Metal Gelling Catalyst 2
5 16 Too Slow
122.0% Amine Blowing Catalyst A0.3% Metal Gelling Catalyst 3
4 12 Viable
132.0% Amine Blowing Catalyst A0.4% Metal Gelling Catalyst 5
4 12 Viable
142.0% Amine Blowing Catalyst A1.0% Amine Gelling Catalyst G
4 17 Too Slow
152.0% Amine Blowing Catalyst B
1.0% Amine Balanced Catalyst C3 17 Too Slow
162.0% Amine Blowing Catalyst H0.4% Metal Gelling Catalyst 2
5 18 Too Slow
172.0% Amine Blowing Catalyst I0.4% Metal Gelling Catalyst 2
7 20 Too Slow
182.0% Amine Blowing Catalyst J0.4% Metal Gelling Catalyst 2
5 16 Too Slow
From the many different trial runs from Table 2, the most active catalyst packages are those that contain an amine blowing catalyst and a metal gelling catalyst in the same formula. From these experiments, 15 different catalyst combinations were set up using 3 amine catalysts and 5 metal catalysts. The amine catalysts used were Amine Blowing Catalyst A, Amine Blowing Catalyst B, and Amine Balanced Catalyst C. The Metal Catalysts used were Metal Gelling Catalyst 1, Metal Gelling Catalyst 2, Metal Gelling Catalyst 3, Metal Gelling Catalyst 4, and Metal Gelling Catalyst 5. Each catalyst combination will have one amine catalyst and one metal catalyst. Each catalyst combination was added to Blend 12B56 using 2.0% of the amine catalyst, and 0.4% of the metal catalyst. Each formula (Blend 12B56 plus catalysts) was named according to the catalysts used. Table 3 shows the name of each formula.
Table 3. Chart of Formula Names
Metal Catalyst 1
Metal Catalyst 2
Metal Catalyst 3
Metal Catalyst 4
Metal Catalyst 5
Amine Catalyst A A1 A2 A3 A4 A5
Amine Catalyst B B1 B2 B3 B4 B5
Amine Catalyst C C1 C2 C3 C4 C5
For example, Formula B4 has 2.0% Amine Catalyst B and 0.4% Metal Catalyst 4.All formulas were tested using a high-speed pneumatic hand mixer. All chemicals were at 25oC (77oF) when reacted. The
foams were tested for cream time and tack free time. The results are given in the Table 4:
Table 4. Initial Test Results
Formula A1 A2 A3 A4 A5 B1 B2 B3 B4 B5 C1 C2 C3 C4 C5
Cream Time (sec.)
2 3 3 3 4 2 3 3 3 3 2 5 5 4 5
Tack Free Time (sec.)
14 11 12 11 12 9 10 11 10 9 5 12 13 9 12
An accelerated aging test was started on all 15 of these formulas. They were placed in metal cans in an oven at 50 oC (122oF). This is a standard aging temperature used in the industry for shelf life stability testing. Our own test data shows that one

week in 50oC stability is about 6-8 weeks at ambient temperature. After one week, the 15 samples were removed from the oven, brought back to 25oC and tested once again. The results are given in Table 5.
Table 5. 1 Week Aged Test Results
Formula A1 A2 A3 A4 A5 B1 B2 B3 B4 B5 C1 C2 C3 C4 C5
Cream Time (sec.)
3 3 3 3 4 3 3 4 3 3 2 5 5 4 4
Tack Free Time (sec.)
17 14 17 16 15 14 14 15 13 14 12 14 17 15 13
All formulas were again placed back in the oven at 50oC (122oF). After another week of aging, the formulas were removed from the oven, brought back to 25oC, and tested again. These results are in Table 6.
Table 6. 2 Weeks Aged Test Results
Formula A1 A2 A3 A4 A5 B1 B2 B3 B4 B5 C1 C2 C3 C4 C5
Cream Time (sec.)
3 3 3 3 3 3 3 3 3 3 3 4 4 4 4
Tack Free Time (sec.)
21 14 18 20 14 15 13 16 16 14 12 12 16 15 14
This process of aging for a week and testing was continued for three more weeks for a total of 5 weeks. These results are in Table 7, Table 8, and Table 9.
Table 7: 3 Weeks Aged Test Results
Formula A1 A2 A3 A4 A5 B1 B2 B3 B4 B5 C1 C2 C3 C4 C5
Cream Time (sec.)
3 3 3 3 3 3 3 3 3 3 3 3 3 4 4
Tack Free Time (sec.)
25 15 19 24 17 16 15 17 19 15 16 15 20 17 17
Table 8. 4 Weeks Aged Test Results
Formula A1 A2 A3 A4 A5 B1 B2 B3 B4 B5 C1 C2 C3 C4 C5
Cream Time (sec.)
3 3 3 3 3 3 3 4 3 3 4 4 5 4 4
Tack Free Time (sec.)
25 19 23 27 17 18 16 17 20 15 17 17 20 20 17
Table 9. 5 Weeks Aged Test Results
Formula A1 A2 A3 A4 A5 B1 B2 B3 B4 B5 C1 C2 C3 C4 C5
Cream Time (sec.)
3 3 3 3 3 3 3 3 3 3 4 4 5 5 4
Tack Free Time (sec.)
27 20 23 28 18 17 15 17 18 15 17 15 20 19 18
Analyzing the data, it is evident that the cream time did not shift on any formula more than one or two seconds. Although some of the catalysts are acid blocked, there is still sufficient catalytic activity remaining to initiate foam rise at 5 seconds or less. On the other hand, the tack free times varied greatly in each of the formulas. This was not only due to the different catalyst combinations, but also due to the loss in reactivity from the acid formation. As each formula aged, the acid that was generated affected each formula differently producing a distinct reactivity aging curve. Each aging curve was compared to others in the same group to determine which catalyst worked best.
First, the formulas with Amine Catalyst A will be analyzed. The tack free time data is organized by each metal catalyst and by weeks in stability.

Table 10: Tack free times of Amine Catalyst A formulas
Weeks A1 A2 A3 A4 A5
0 14 11 12 11 12
1 17 14 17 16 15
2 21 14 18 20 14
3 25 15 19 24 17
4 25 19 23 27 17
5 27 20 23 28 18
By plotting the data from Table 10 on a graph, a trend for each formula can be seen. The data from Table 10 has been plotted in Figure 4.
Figure 4. Graph of Each Formula with Amine Catalyst A
While each formula showed some slow down, some metal catalysts performed better than others. By looking at the amount of reactivity change with time in Figure 4, each of the metal catalysts can be ranked according to performance. In this case, Metal Catalyst 5 was the best followed by 2, 3, 1, and 4.
This same analysis was done for Amine Catalyst B:
Table 11: Tack Free Times of Amine Catalyst B Formulas
Weeks B1 B2 B3 B4 B5
0 9 10 11 10 9
1 14 14 15 13 14
2 15 13 16 16 14
3 16 15 17 19 15
4 18 16 17 20 15
5 17 15 17 18 15
Again, graphing the tack free times of each formula from Table 11, we can see a trend for each formula:
Figure 5. Graph of Each Formula with Amine Catalyst B
In this case, the resulting series curves are closer together. According to the plots in Figure 5, Metal Catalyst 2 was the best followed by 5, 3, 1, and 4.
The analysis was done again on Amine Catalyst C.
Table 12. Tack Free Times of Amine Catalyst C
Weeks C1 C2 C3 C4 C5
0 5 12 13 9 12
1 12 14 17 15 13
2 12 12 16 15 14
3 16 15 20 17 17

4 17 17 20 20 17
5 17 15 20 19 18
A trend again is shown for the tack free times of each formula.
Figure 6. Graph of Each Formula with Amine Catalyst C
This data is a little more difficult to interpret. Metal Catalysts 1 and 4 actually perform poorly since they started off much faster than the others. Looking at the graphs in Figure 6, Metal Catalyst 2 was the best followed by 5, 3, 4, and 1.
If the rank of each Metal Catalyst’s performance is organized in a chart, there is a clear consistent trend:
Table 13. Ranking of Each Metal Catalyst in Spray Foam
Metal Catalyst Rank Amine series A Amine Series B Amine Series C
First 5 2 2
Second 2 5 5
Third 3 3 3
Fourth 1 1 4
Fifth 4 4 1
Looking at Table 13, when choosing a metal catalyst for spray foam, Metal Catalyst 2 or 5 seem to perform very well while Metal Catalyst 4 or 1 should probably be avoided if shelf life stability is to be optimized.
Next, the formulas with the same metal catalysts (but different amine catalysts) will be analyzed.First, the Tack free times of the formulas with Metal Catalyst 1 were organized by each amine catalyst and by weeks in stability. This data is in Table 14.
Table 14. Tack Free Times of Metal Catalyst 1
Weeks A1 B1 C1
0 14 9 5
1 17 14 12
2 21 15 12
3 25 16 16
4 25 18 17
5 27 17 17
Just like the amine series, when plotted, a clear trend for each formula is shown:
Figure 7. Graph of Each Formula with Metal Catalyst 1
In the graphs in Figure 7, Amine Catalyst B was the best followed by C, then A. This analysis was repeated for the other four metal catalysts:
Table 15. Tack Free Times of Metal Catalyst 2
Weeks A2 B2 C2
0 11 10 12
1 14 14 14
2 14 13 12

3 15 15 15
4 19 16 17
5 20 15 15
Figure 8. Graph of Each Formula with Metal Catalyst 2
In the graphs in Figure 8 of Metal Series 2, the results are much closer together, reflecting the improved stability of Metal Catalyst 2. In this series, Amine Catalyst C was slightly better than B, followed by A.
Table 16. Tack Free Times of Metal Catalyst 3
Weeks A3 B3 C3
0 12 11 13
1 17 15 17
2 18 16 16
3 19 17 20
4 23 17 20
5 23 17 20
Figure 9. Graph of Each Formula with Metal Catalyst 3
In the graph in Figure 9, Amine Catalyst B was the best followed by C then A.
Table 17. Tack Free Times of Metal Catalyst 4
Weeks A4 B4 C4
0 11 10 9
1 16 13 15
2 20 16 15
3 24 19 17
4 27 20 20
5 28 18 19
Figure 10. Graph of Each Formula with Metal Catalyst 4

The poor performance of Metal Catalyst 4 can be clearly seen in Figure 10 with each formula in this series undergoing a large reactivity drift with time. In this series, Amine Catalyst B was the best, followed by C, then A.
Table 18. Tack Free Times of Metal Catalyst 5
Weeks A5 B5 C5
0 12 9 12
1 15 14 13
2 14 14 14
3 17 15 17
4 17 15 17
5 18 15 18
Figure 11. Graph of Each Formula with Metal Catalyst 5
Figure 11 shows the superior performance of Metal Catalyst 5 with all three amines series showing only a little bit of drift, even after 5 weeks in the stability oven. In this series, Amine Catalyst B was the best, followed by C, then A.
If the rank of each Amine Catalyst’s performance is organized in a chart, there is a clear consistent trend:
Table 19. Ranking of Amine Catalyst Performance in Spray Foam
Amine Catalyst Rank
Metal Series 1 Metal Series 2 Metal Series 3 Metal Series 4 Metal Series 5
First B C B B B
Second C B C C C
Third A A A A A
According to these rankings in Table 19, the best amine catalyst to use for polyurethane spray foam stability is Amine Catalyst B, while Amine Catalyst A should probably be avoided if shelf life stability is to be optimized.
CONCLUSIONSOptimization of any polyurethane formulation is important. All aspects of the foam including foam strength, burn
characteristics, nominal density, etc. have to be considered. In the case of polyurethane spray foam, optimizing the catalyst package for shelf life is of utmost importance.
When assembling a polyurethane spray foam formula, it is important to choose a catalyst package that will yield a viable spray foam. Through experimentation, it was found that using an amine blowing catalyst and a metal gelling catalyst together provided the best synergy for a rapid reactivity profile required for polyurethane spray foams. It was this combination of catalysts that was used as the model for the formulas made for the accelerated aging tests.
Proper catalyst selection was demonstrated to be highly significant to the performance of each formula in the shelf life testing. In the above experiments, it was shown that one of the amine catalysts, Amine Blowing Catalyst B, showed the best shelf life in spray foams of the amine catalysts tested and Metal Catalyst 2 showed the best shelf life in spray foams of the metal catalysts tested. On the other hand, Amine Blowing Catalyst A, and Metal Gelling Catalysts 1 and 4 performed poorly in the
experiments, showing large reactivity drifts especially in the formulas in which they were used together. Amine Catalyst A, and Metal Catalysts 1 and 4 should be avoided if shelf life is to be optimized. When formulating a polyurethane spray foam, Amine Blowing Catalyst B and Metal Gelling Catalyst 2 should be used together. Using these two catalysts together will result in a polyurethane spray foam with a rapid reactivity profile that will have a shelf life of at least six months.
BIOGRAPHY
David ModrayDavid received his BS in Chemical Engineering in 1995 from the University of Missouri-Columbia. For 17 years he has been employed by FSI as a research chemist. He has been formulating with ecomate® for the last 14 years.
SHELF LIFE
EVALUATION
OF
RIGID
POLYURETHA
NE
SPRAY FOAM
S
2013 Polyure
thane Techn
ical Conferen
ce
September 25
, 2013
David Modray
foam supplies, inc.
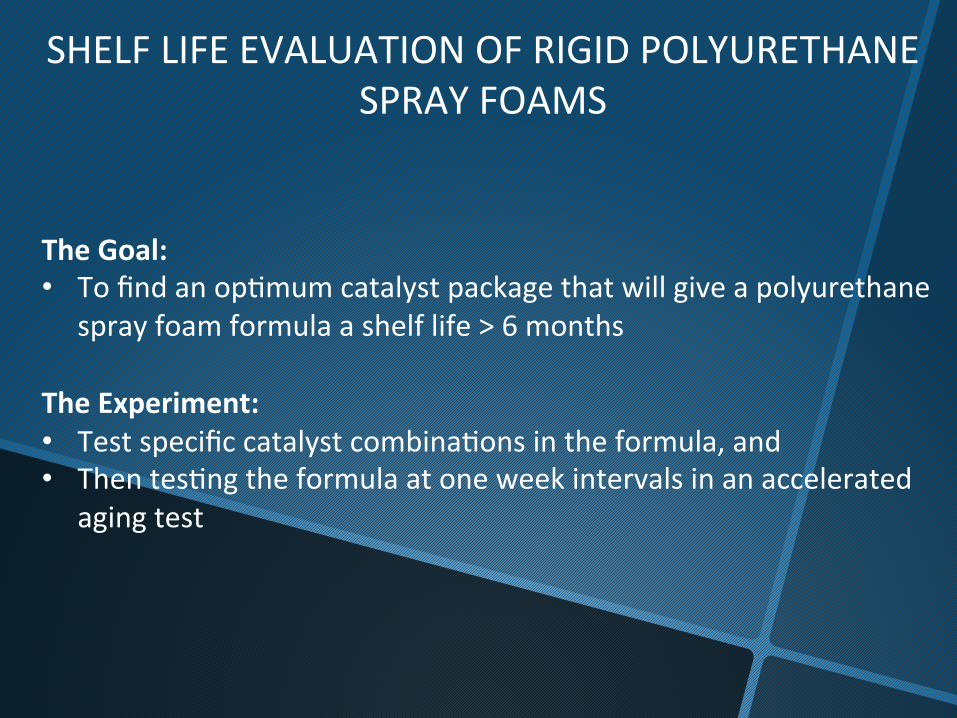
SHELF LIFE EVALUATION OF RIGID POLYURETHANE SPRAY FOAMS
The Goal: • To find an opMmum catalyst package that will give a polyurethane
spray foam formula a shelf life > 6 months The Experiment: • Test specific catalyst combinaMons in the formula, and • Then tesMng the formula at one week intervals in an accelerated
aging test

Advantages of using polyurethane spray foam: • Rapid reacMvity profile • Can be sprayed directly on the surface to be foamed • The foam will stay where it is sprayed, it will not droop or sag
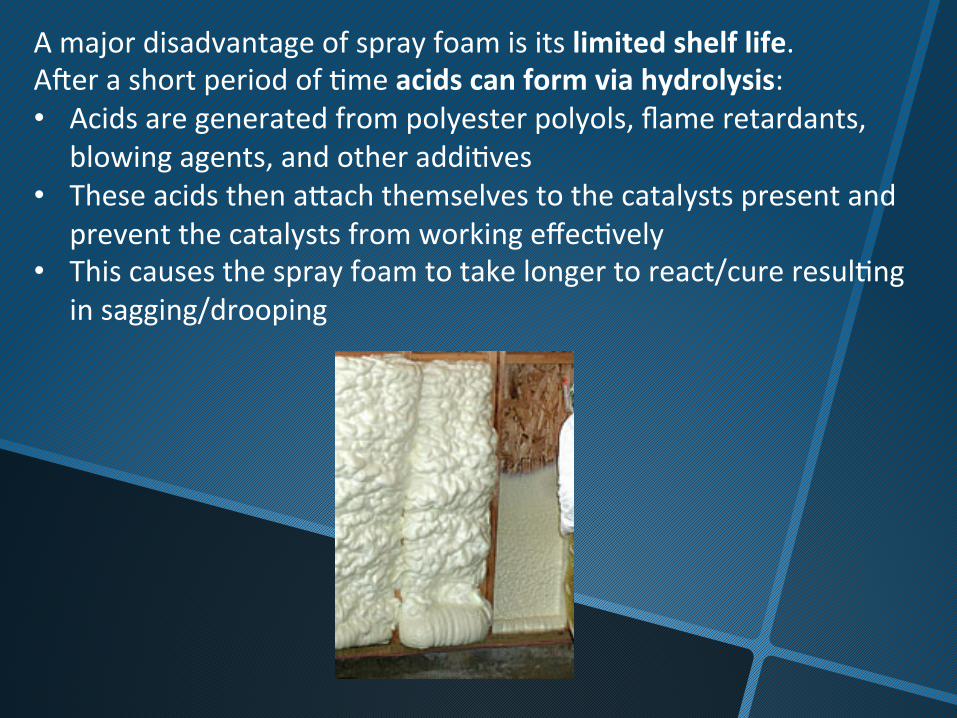
A major disadvantage of spray foam is its limited shelf life. AXer a short period of Mme acids can form via hydrolysis: • Acids are generated from polyester polyols, flame retardants,
blowing agents, and other addiMves • These acids then aZach themselves to the catalysts present and
prevent the catalysts from working effecMvely • This causes the spray foam to take longer to react/cure resulMng
in sagging/drooping

Hydrolysis ReacGons • How does acid formaMon occur in the polyol blend? • Let’s look at some of the acid generaMng reacMons one at a Mme
and in greater detail: • First, the polyester polyol hydrolysis will be examined. A polyester
polyol can combine with any water present in the polyol blend and generate an alcohol and a carboxylic acid:
• The acid produced can then block any amine catalysts present in the polyol blend.

Hydrolysis ReacGons • A common flame retardant used in polyurethane foams is Tris(1-‐
Chloro 2-‐propyl) Phosphate or TCPP, a halogenated organic phosphate.
• Like the polyester polyol, it can hydrolyze in the presence of water and form an acid and a halohydrin:
Hydrolysis ReacGons
• In a similar manner, other ingredients in the polyol blend can combine with water and generate an acid.
• This includes other flame retardants, certain thinning agents, certain blowing agents, and even some surfactants.

Metal Carboxylate SubsGtuGon • Most spray foams use a metal catalyst in their formula for rapid gel
Mme. • They are metal carboxylate salts that have the following chemical
structure:
M O C
O
R1
• Where M is a metal, typically Tin, Lead, Bismuth or Potassium. • R1 represents a miscellaneous organic group. • In the case of metal catalysts, the R1 group is typically a simple
alkane.

Metal Carboxylate SubsGtuGon • When there is another carboxylic acid present such as an acid from
an ester hydrolysis, it can react with the metal carboxylate salt. • The carboxylates from the acid and the salt switch places in a
subsMtuMon reacMon:
M O C
O
R1 H O C
O
R2 +
Metal Carboxylate Acid from ester hydrolysis
M O C
O
R2 H O C
O
R1 +
• The new metal carboxylate formed in this reacMon has less catalyMc acMvity or could precipitate out of the polyol blend.

EXPERIMENTAL • A base formula was assembled that would provide several
scenarios for acid generaMon over Mme so that the effect on certain catalysts can be studied.
• For this experiment, the following formula Blend 12B56 was assembled:
Chemical % Amine Polyol 15.0
Polyester Polyol 21.0 Sucrose-‐Glycerin Polyol 33.0 Tris (1-‐Chloro 2-‐propyl) Phosphate (TCPP) 20.0
Silicone Surfactant 1.5 Water 2.0
Ecomate® 5.0
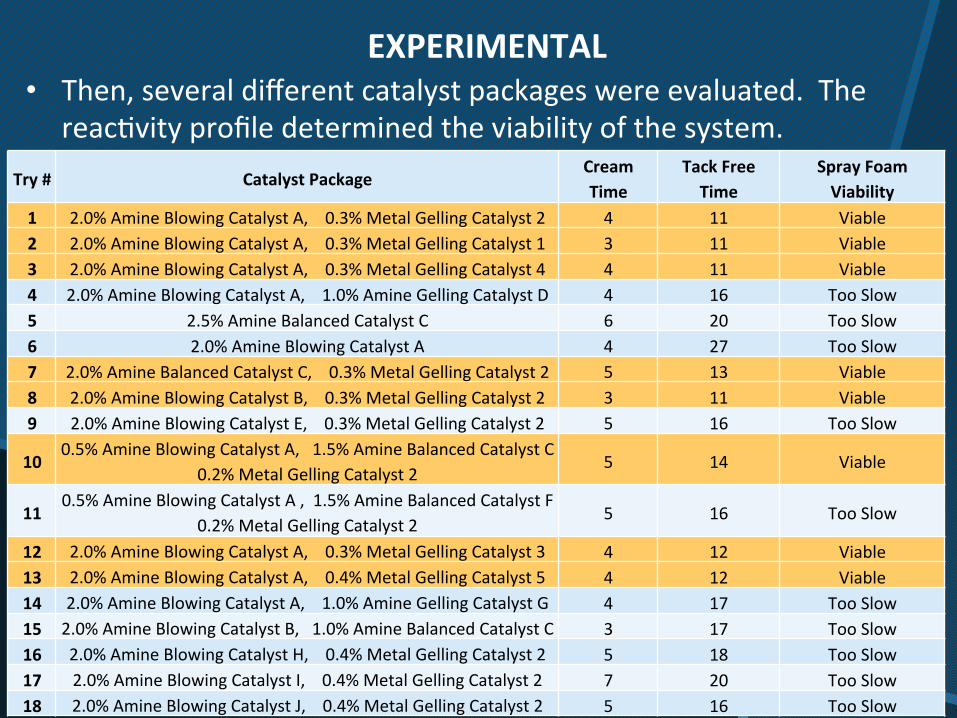
Try # Catalyst Package Cream Time
Tack Free Time
Spray Foam Viability
1 2.0% Amine Blowing Catalyst A, 0.3% Metal Gelling Catalyst 2 4 11 Viable 2 2.0% Amine Blowing Catalyst A, 0.3% Metal Gelling Catalyst 1 3 11 Viable 3 2.0% Amine Blowing Catalyst A, 0.3% Metal Gelling Catalyst 4 4 11 Viable 4 2.0% Amine Blowing Catalyst A, 1.0% Amine Gelling Catalyst D 4 16 Too Slow 5 2.5% Amine Balanced Catalyst C 6 20 Too Slow 6 2.0% Amine Blowing Catalyst A 4 27 Too Slow 7 2.0% Amine Balanced Catalyst C, 0.3% Metal Gelling Catalyst 2 5 13 Viable 8 2.0% Amine Blowing Catalyst B, 0.3% Metal Gelling Catalyst 2 3 11 Viable 9 2.0% Amine Blowing Catalyst E, 0.3% Metal Gelling Catalyst 2 5 16 Too Slow
10 0.5% Amine Blowing Catalyst A, 1.5% Amine Balanced Catalyst C
0.2% Metal Gelling Catalyst 2 5 14 Viable
11 0.5% Amine Blowing Catalyst A , 1.5% Amine Balanced Catalyst F
0.2% Metal Gelling Catalyst 2 5 16 Too Slow
12 2.0% Amine Blowing Catalyst A, 0.3% Metal Gelling Catalyst 3 4 12 Viable 13 2.0% Amine Blowing Catalyst A, 0.4% Metal Gelling Catalyst 5 4 12 Viable 14 2.0% Amine Blowing Catalyst A, 1.0% Amine Gelling Catalyst G 4 17 Too Slow 15 2.0% Amine Blowing Catalyst B, 1.0% Amine Balanced Catalyst C 3 17 Too Slow 16 2.0% Amine Blowing Catalyst H, 0.4% Metal Gelling Catalyst 2 5 18 Too Slow 17 2.0% Amine Blowing Catalyst I, 0.4% Metal Gelling Catalyst 2 7 20 Too Slow 18 2.0% Amine Blowing Catalyst J, 0.4% Metal Gelling Catalyst 2 5 16 Too Slow
• Then, several different catalyst packages were evaluated. The reacMvity profile determined the viability of the system.
EXPERIMENTAL

EXPERIMENTAL • The most effecMve catalyst packages are those that contain an amine
blowing catalyst and a metal gelling catalyst in the same formula. • From these experiments, 15 different catalyst combinaMons were set
up using 3 amine catalysts and 5 metal catalysts.
• Each formula contained 2.0% amine catalyst and 0.4% metal catalyst.
Metal
Catalyst 1 Metal
Catalyst 2 Metal
Catalyst 3 Metal
Catalyst 4 Metal
Catalyst 5 Amine
Catalyst A A1 A2 A3 A4 A5
Amine Catalyst B
B1 B2 B3 B4 B5
Amine Catalyst C
C1 C2 C3 C4 C5
• Each formula (Blend 12B56 plus catalysts) was named according to the catalysts used.
• For example, Formula B4 has 2.0% Amine Catalyst B and 0.4% Metal Catalyst 4.

EXPERIMENTAL • All formulas were tested using the high-‐speed pneumaMc hand
mixer. • All chemical temperatures were 25oC (77oF) when reacted. • The foams were tested for cream Mme and tack free Mme. • An accelerated aging test was started on all 15 of these formulas. • They were placed in metal cans in an oven at 50oC (122oF). • AXer one week, the 15 samples were removed from the oven,
brought back to 25oC and tested once again.
IniMal Test 1 Week Test In Oven 1 Week

EXPERIMENTAL • All formulas were again placed back in the oven at 50oC (122oF). • AXer another week of aging, the formulas were removed from the
oven, brought back to 25oC, and tested again. • This process of aging for a week and tesMng was conMnued for
three more weeks for a total of 5 weeks.
Weekly Test In Oven 1 Week
X 5 weeks

EXPERIMENTAL • 50oC (122oF) is a standard aging temperature used in the
industry for shelf life stability tesGng. • Our own test data shows that: • one week in 50oC stability correlates to 6-‐8 weeks at ambient.

RESULTS • The cream Mme did not shiX on any formula more than one or
two seconds. • Even with some of the catalysts blocked, there is sMll sufficient
catalyMc acMvity to iniMate foam rise at 5 seconds or less • The tack free Mmes varied greatly in each of the formulas • This was not only due to the different catalyst combinaMons, but
also due to the loss in reacMvity from the acid formaMon.

RESULTS A1 A2 A3 A4 A5 B1 B2 B3 B4 B5 C1 C2 C3 C4 C5
14 11 12 11 12 9 10 11 10 9 5 12 13 9 12
17 14 17 16 15 14 14 15 13 14 12 14 17 15 13
21 14 18 20 14 15 13 16 16 14 12 12 16 15 14
25 15 19 24 17 16 15 17 19 15 16 15 20 17 17
25 19 23 27 17 18 16 17 20 15 17 17 20 20 17
27 20 23 28 18 17 15 17 18 15 17 15 20 19 18
Formula Name
IniMal Tack Free Time (sec)
1 Week Tack Free Time (sec)
2 Week Tack Free Time (sec)
3 Week Tack Free Time (sec)
4 Week Tack Free Time (sec)
5 Week Tack Free Time (sec)
• As each formula aged, the acid produced affected each formula differently producing a disMnct reacMvity aging curve.
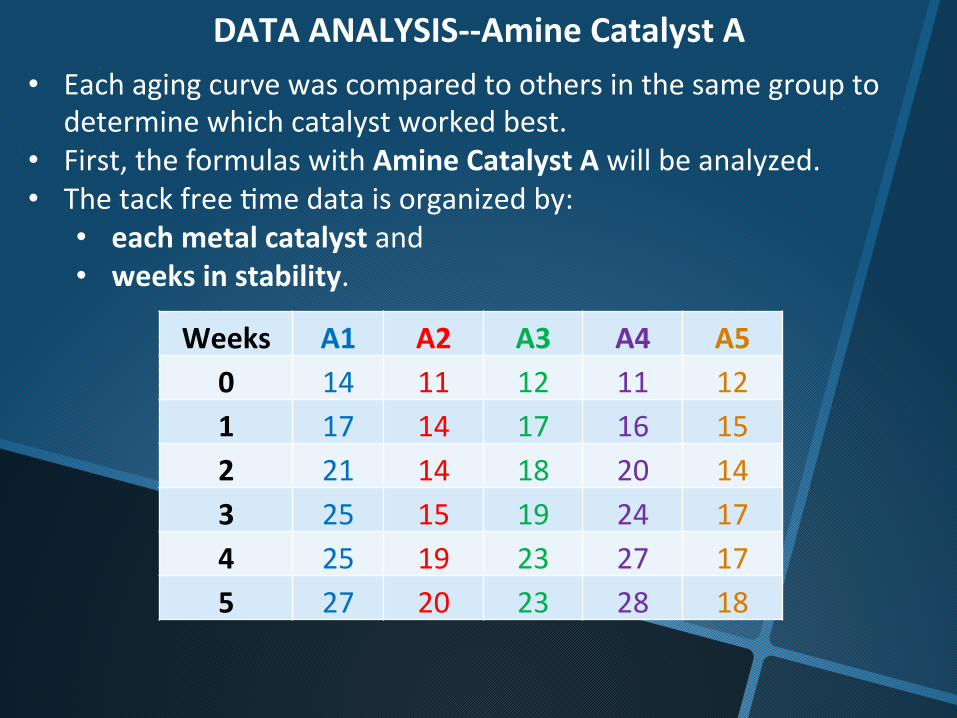
DATA ANALYSIS-‐-‐Amine Catalyst A • Each aging curve was compared to others in the same group to
determine which catalyst worked best. • First, the formulas with Amine Catalyst A will be analyzed. • The tack free Mme data is organized by: • each metal catalyst and • weeks in stability.
Weeks A1 A2 A3 A4 A5 0 14 11 12 11 12 1 17 14 17 16 15 2 21 14 18 20 14 3 25 15 19 24 17 4 25 19 23 27 17 5 27 20 23 28 18

0
5
10
15
20
25
30
0 1 2 3 4 5
Tack Free Time (secon
ds)
Weeks in 50oC Oven
50oC ReacGvity Stability Amine Series A
A1
A2
A3
A4
A5
• While each formula showed some slow down, some metal catalysts performed beZer than others.
• By looking at the amount of reacMvity change over Mme in the graph, each of the metal catalysts can be ranked according to performance.
• In this case, Metal Catalyst 5 was the best followed by 2, 3, 1, and 4.
DATA ANALYSIS-‐-‐Amine Catalyst A

DATA ANALYSIS-‐-‐Amine Catalyst B
Weeks B1 B2 B3 B4 B5 0 9 10 11 10 9 1 14 14 15 13 14 2 15 13 16 16 14 3 16 15 17 19 15 4 18 16 17 20 15 5 17 15 17 18 15
• Next, the formulas with Amine Catalyst B will be analyzed. • The tack free Gme data is organized by each metal catalyst and by
weeks in stability.

0
5
10
15
20
25
0 1 2 3 4 5
Tack Free Time (secon
ds)
Weeks in 50oC Oven
50oC ReacGvity Stability Amine Series B
B1
B2
B3
B4
B5
According to the plots in Amine Series B, Metal Catalyst 2 was the best followed by 5, 3, 1, and 4.
DATA ANALYSIS-‐-‐Amine Catalyst B
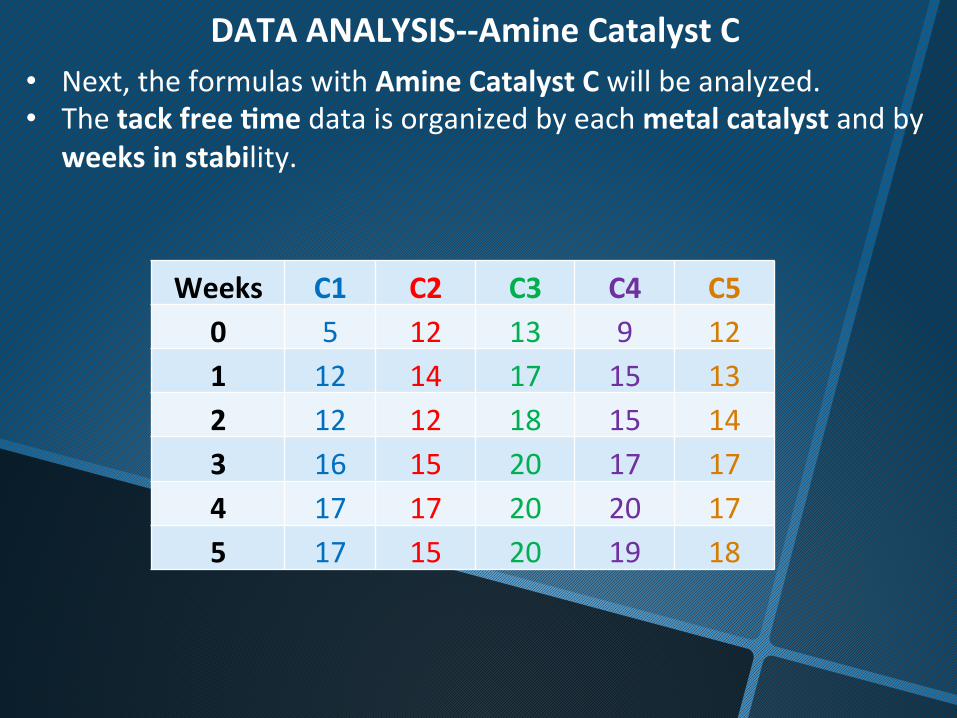
DATA ANALYSIS-‐-‐Amine Catalyst C
Weeks C1 C2 C3 C4 C5 0 5 12 13 9 12 1 12 14 17 15 13 2 12 12 18 15 14 3 16 15 20 17 17 4 17 17 20 20 17 5 17 15 20 19 18
• Next, the formulas with Amine Catalyst C will be analyzed. • The tack free Gme data is organized by each metal catalyst and by
weeks in stability.

0
5
10
15
20
25
0 1 2 3 4 5
Tack Free Time (Secon
ds)
Weeks in 50oC Oven
50oC ReacGvity Stability Amine Series C
C1
C2
C3
C4
C5
• Metal Catalysts 1 and 4 actually perform poorly since they started off much faster than the others.
• Looking at the graphs in Figure 6, Metal Catalyst 2 was the best followed by 5, 3, 4, and 1.
DATA ANALYSIS-‐-‐Amine Catalyst C
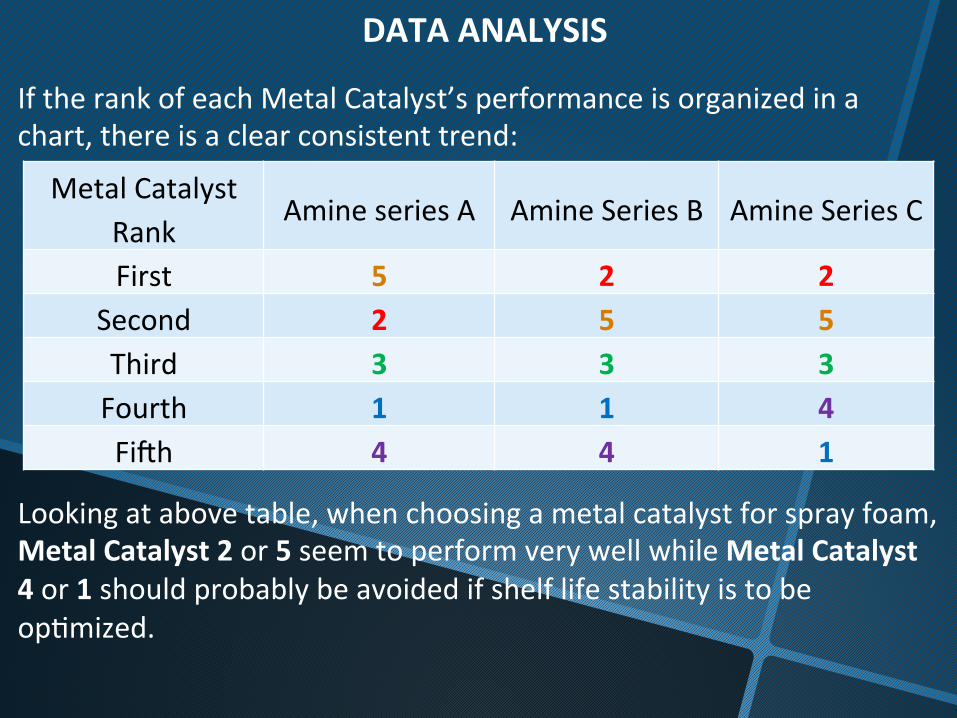
If the rank of each Metal Catalyst’s performance is organized in a chart, there is a clear consistent trend:
Metal Catalyst Rank
Amine series A Amine Series B Amine Series C
First 5 2 2 Second 2 5 5 Third 3 3 3 Fourth 1 1 4 FiXh 4 4 1
DATA ANALYSIS
Looking at above table, when choosing a metal catalyst for spray foam, Metal Catalyst 2 or 5 seem to perform very well while Metal Catalyst 4 or 1 should probably be avoided if shelf life stability is to be opMmized.

DATA ANALYSIS-‐-‐Metal Catalyst 1 • Next, the formulas with the same metal catalysts (but different
amine catalysts) will be analyzed. • First, the tack free Mmes of the formulas with Metal Catalyst 1
were organized by each amine catalyst and by weeks in stability.
Weeks A1 B1 C1 0 14 9 5 1 17 14 12 2 21 15 12 3 25 16 16 4 25 18 17 5 27 17 17
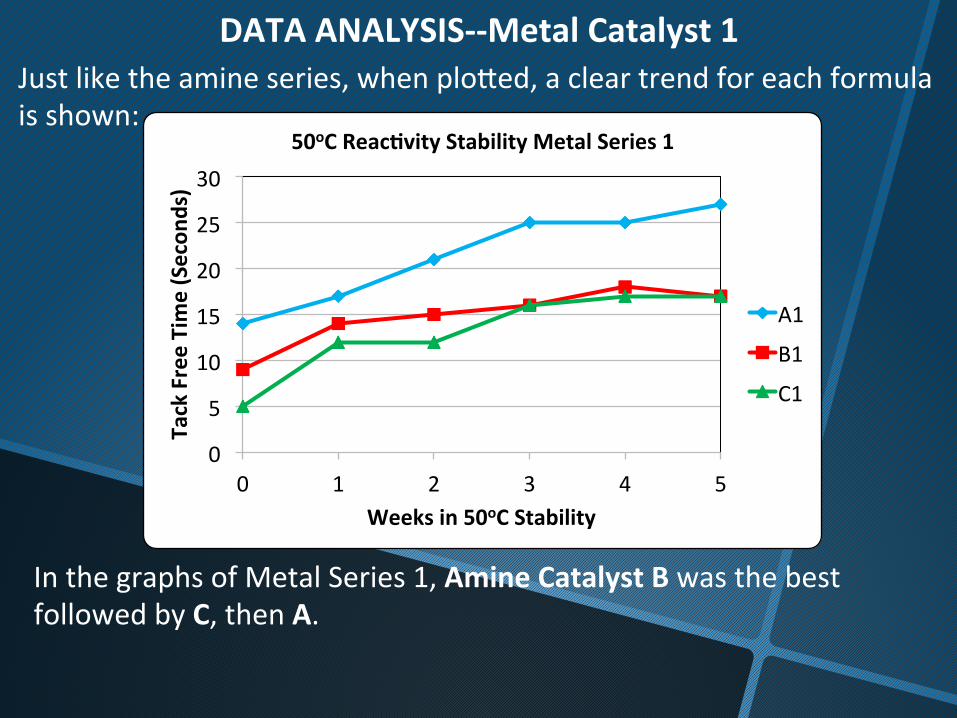
Just like the amine series, when ploZed, a clear trend for each formula is shown:
0
5
10
15
20
25
30
0 1 2 3 4 5
Tack Free Time (Secon
ds)
Weeks in 50oC Stability
50oC ReacGvity Stability Metal Series 1
A1
B1
C1
In the graphs of Metal Series 1, Amine Catalyst B was the best followed by C, then A.
DATA ANALYSIS-‐-‐Metal Catalyst 1

DATA ANALYSIS-‐-‐Metal Catalyst 2
The same analysis was repeated for the formulas with Metal Catalyst 2:
Weeks A2 B2 C2 0 11 10 12 1 14 14 14 2 14 13 12 3 15 15 15 4 19 16 17 5 20 15 15

0
5
10
15
20
25
30
0 1 2 3 4 5
Tack Free Time (Secon
ds)
Weeks in 50oC Stability
50oC ReacGvity Stability Metal Series 2
A2
B2
C2
• In the graphs of Metal Series 2, the results are much closer together, reflecMng the improved stability of Metal Catalyst 2.
• In this series, Amine Catalyst C was slightly beZer than B, followed by A.
DATA ANALYSIS-‐-‐Metal Catalyst 2

DATA ANALYSIS-‐-‐Metal Catalyst 3
Weeks A3 B3 C3 0 12 11 13 1 17 15 17 2 18 16 16 3 19 17 20 4 23 17 20 5 23 17 20
Next, the analysis was repeated for the formulas with Metal Catalyst 3:

0
5
10
15
20
25
30
0 1 2 3 4 5
Tack Free Time (Secon
ds)
Weeks in 50oC Stability
50oC ReacGvity Stability Metal Series 3
A3
B3
C3
In the graph of Metal Series 3, Amine Catalyst B was the best followed by C then A
DATA ANALYSIS-‐-‐Metal Catalyst 3

DATA ANALYSIS-‐-‐Metal Catalyst 4
Weeks A4 B4 C4 0 11 10 9 1 16 13 15 2 20 16 15 3 24 19 17 4 27 20 20 5 28 18 19
Next in the analysis is the formulas that contain Metal Catalyst 4:

0
5
10
15
20
25
30
0 1 2 3 4 5
Tack Free Time (Secon
ds)
Weeks in 50oC Stability
50oC ReacGvity Stability Metal Series 4
A4
B4
C4
• The poor performance of Metal Catalyst 4 can be clearly seen in the graph with each formula in this series undergoing a large reacMvity driX with Mme.
• In this series, Amine Catalyst B was the best, followed by C, then A.
DATA ANALYSIS-‐-‐Metal Catalyst 4

DATA ANALYSIS-‐-‐Metal Catalyst 5
Weeks A5 B5 C5 0 12 9 12 1 15 14 13 2 14 14 14 3 17 15 17 4 17 15 17 5 18 15 18
Finally, the analysis of the formulas that contain Metal Catalyst 5:

0
5
10
15
20
25
30
0 1 2 3 4 5
Tack Free Time (Secon
ds)
Weeks in 50oC Stability
50oC ReacGvity Stability Metal Series 5
A5
B5
C5
• This graph shows the superior performance of Metal Catalyst 5 with all three amines series showing only a liZle bit of driX, even aXer 5 weeks in the stability oven.
• In this series, Amine Catalyst B was the best, followed by C, then A.
DATA ANALYSIS-‐-‐Metal Catalyst 5

DATA ANALYSIS
Amine Catalyst Rank
Metal Series 1
Metal Series 2
Metal Series 3
Metal Series 4
Metal Series 5
First B C B B B Second C B C C C Third A A A A A
• If the rank of each Amine Catalyst’s performance is organized in a chart, there is a clear consistent trend:
• According to these rankings in above table, the best amine catalyst to use for polyurethane spray foam stability is Amine Catalyst B, while Amine Catalyst A should probably be avoided if shelf life stability is to be opMmized.

Amine Catalyst Rank
Metal 1 Metal 2 Metal 3 Metal 4 Metal 5
First B C B B B
Second C B C C C
Third A A A A A
Metal Catalyst Rank
Amine A Amine B Amine C
First 5 2 2 Second 2 5 5 Third 3 3 3 Fourth 1 1 4 Fibh 4 4 1
RECAP

CONCLUSIONS
• OpMmizing the catalyst package of a polyurethane spray foam for shelf life is of utmost importance
• Amine Blowing Catalyst B showed the best shelf life in spray foams of the amine catalysts tested
• Metal Catalyst 2 showed the best shelf life in spray foams of the metal catalysts tested
• Using these two catalysts together should result in opMmum shelf life

www.foamsupplies.com
Thank you for your ,me.
www.ecomatesystems.com


