
East Tennessee State UniversityDigital Commons @ East
Tennessee State University
Electronic Theses and Dissertations Student Works
8-2017
Academic Dishonesty in Higher Education:Perceptions and Opinions of UndergraduatesStanley K. HodgesEast Tennessee State University
Follow this and additional works at: https://dc.etsu.edu/etd
Part of the Educational Leadership Commons
This Dissertation - Open Access is brought to you for free and open access by the Student Works at Digital Commons @ East Tennessee StateUniversity. It has been accepted for inclusion in Electronic Theses and Dissertations by an authorized administrator of Digital Commons @ EastTennessee State University. For more information, please contact [email protected].
Recommended CitationHodges, Stanley K., "Academic Dishonesty in Higher Education: Perceptions and Opinions of Undergraduates" (2017). ElectronicTheses and Dissertations. Paper 3292. https://dc.etsu.edu/etd/3292
Academic Dishonesty in Higher Education: Perceptions and Opinions of Undergraduates
_____________________
A dissertation
presented to
the faculty of the Department of Educational Leadership and Policy Analysis
East Tennessee State University
In partial fulfillment
of the requirements for the degree
Doctor of Education in Educational Leadership
_____________________
by
Stanley Keith Hodges
August 2017
_____________________
Dr. James Lampley, Chair
Dr. Hal Knight
Dr. Larry Miller
Dr. Pamela Scott
Keywords: Academic Dishonesty, Academic Misconduct

2
ABSTRACT
Academic Dishonesty in Higher Education: Perceptions and Opinions of Undergraduates
by
Stanley Keith Hodges
The purpose of this study was to determine if statistically significant differences existed between
identified student demographic characteristics (gender and age), academic variables
(classification, GPA, and major), and students’ perceptions of academic dishonesty, as measured
by the Attitudes and Perceptions of Academic Dishonesty survey.
A pen-and-paper survey was used to gather the data at the 3 participating universities and college
(a 4-year public university, a 4-year private university, and a 2-year public community college).
There were 22 items on the survey. There were 328 surveys distributed by the investigator to
participating classes at the 3 institutions of higher education. All 328 surveys were returned.
There were 116 student responses gathered from the 4-year private university, 103 student
responses gathered from the 2-year public college, and 109 student responses gathered from a 4-
year public university. All of the responses were valid and fit the perquisites for inclusion in the
survey. These perquisites were that each student was at least 18 years of age and each student
was registered as an undergraduate.
There were 5 dimensions included in the survey (Dimension 1- Use of Technology, Dimension
2- Perceptions of Policy, Dimension 3- Instructor Consequences, Dimension 4- Student
Consequences, and Dimension 5- Student Conduct).

3
For Research Questions 2, 4, and 6 there were no significant differences found among any of the
groups for any of the 5 dimensions. In Research Question 1 the 5 dimensions of the survey were
compared among the 3 participating institutions (public 4-year university, private 4-year
university, and public 2-year college). Dimension 4 (student consequences) was significantly
different between the public 4-year university and the private 4-year university, with students at
the private 4-year university scoring higher. In Research Question 4 a comparison of traditional
aged and nontraditional aged students was made on the 5 dimensions. A significant difference
was found between the 2 age groups on Dimension 3 (instructor consequences) and Dimension 5
(student conduct), with nontraditional students scoring higher in both cases. For Research
Question 6 a comparison of criminal justice majors was made to other majors. Only Dimension 4
(student consequences) was statistically significant with other majors expressing a desire for
more student consequences as a result of participating in academic misconduct.

4
Copyright© 2017 by Stanley Keith Hodges, All Rights Reserved.

5
DEDICATION
This dissertation is dedicated to my parents for raising me to believe that anything is
possible. This dissertation is further dedicated to my loving wife and beautiful daughter for
making everything possible.

6
ACKNOWLEDGMENTS
I would like to acknowledge my loving wife and my amazing daughter. Without their
never-ending support and understanding, I would not have been able to complete this course of
instruction.
I would like to acknowledge my mother who is an amazing listener and throughout this
process would listen to my progression stories and give all the moral support to keep me going
so that I could reach the conclusion of this program.
I would further like to acknowledge my father who was very positive, supportive, and
encouraging during the process of this educational endeavor.
I also need to acknowledge my grandmother who started me down my collegiate path to
this dissertation by one simple conversation over a glass of iced tea in 1982.
I further would like to acknowledge Dr. Larry Miller. His guidance and mentoring
through my educational programs has helped make this dissertation a reality.
I also need to acknowledge Dr. James Lampley and Dr. Don Good who granted me the
opportunity to take part in this doctoral program. I appreciate you for allowing me to take part in
this course of instruction.
I would like to acknowledge Dr. Jasmine Renner whose positive instruction style and
positive recommendations assisted me in advancing in this educational program.

7
TABLE OF CONTENTS
Page
ABSTRACT ........................................................................................................................... 2
DEDICATION ....................................................................................................................... 5
ACKNOWLEDGEMENTS ................................................................................................... 6
LIST OF TABLES ................................................................................................................. 11
Chapter
1. INTRODUCTION ......................................................................................................... 12
Statement of Problem ................................................................................................. 17
Significance of the Study ........................................................................................... 18
Research Questions .................................................................................................... 19
Definition of Terms.................................................................................................... 21
Limitations, Delimitations, and Assumptions ............................................................ 22
Overview of the Study ............................................................................................... 23
2. REVIEW OF LITERATURE ........................................................................................ 24
Academic Dishonesty ................................................................................................ 24
Treatment of Academic Dishonesty..................................................................... 27
Cheating in Higher Education .............................................................................. 34
Deterrence .................................................................................................................. 38
Are Students Reticent about Cheating? ............................................................... 40
Crime and Punishment ............................................................................................... 41
Levels of Threat and Punishment ........................................................................ 43
Classical Perspective ............................................................................................ 44
Zero Tolerance ........................................................................................................... 44
Zero Tolerance and Student Choice ..................................................................... 47
8
Strategies for Reducing Academic Dishonesty .......................................................... 48
Creating Environments that Foster Academic Integrity ...................................... 49
Controlling Cheating in the Classroom................................................................ 50
Classroom Practice: Are Teachers Creating Classroom Cheaters? ..................... 57
The Educator’s Role in Promoting Academic Integrity ...................................... 58
The Theory of Planned Behavior ......................................................................... 59
The Role of the Code of Conduct .............................................................................. 59
Honor Codes and Other Contextual Influences ................................................... 60
Implications for Practice ............................................................................................ 61
Summary .................................................................................................................... 63
3. RESEARCH METHOD................................................................................................. 64
Study Design .............................................................................................................. 64
Research Questions and Corresponding Null Hypotheses ......................................... 65
Instrument .................................................................................................................. 71
Survey Development ............................................................................................ 72
Validity ................................................................................................................ 73
Reliability ............................................................................................................. 73
Sample........................................................................................................................ 74
Data Collection .......................................................................................................... 75
Data Analysis ............................................................................................................. 76
Chapter Summary ...................................................................................................... 77
4. FINDINGS ..................................................................................................................... 78
Research Question 1 .................................................................................................. 79
Research Question 2 .................................................................................................. 83
Research Question 3 .................................................................................................. 86
Research Question 4 .................................................................................................. 88
Research Question 5 .................................................................................................. 93
9
Research Question 6 .................................................................................................. 96
5. SUMMARY, CONCLUSION, AND RECOMMENDATIONS ................................... 100
Summary .................................................................................................................... 100
Conclusion ................................................................................................................. 101
Key Findings .............................................................................................................. 102
Research Question 1 ............................................................................................ 103
Dimension 1- Use of Technology .................................................................. 103
Dimension 2- Perceptions of Policy .............................................................. 103
Dimension 3- Instructor Consequences ......................................................... 103
Dimension 4- Student Consequences............................................................. 103
Dimension 5- Student Conduct ...................................................................... 104
Research Question 2 ............................................................................................ 104
Dimension 1- Use of Technology .................................................................. 104
Dimension 2- Perceptions of Policy .............................................................. 104
Dimension 3- Instructor Consequences ......................................................... 105
Dimension 4- Student Consequences............................................................. 105
Dimension 5- Student Conduct ...................................................................... 105
Research Question 3 ............................................................................................ 105
Dimension 1- Use of Technology .................................................................. 106
Dimension 2- Perceptions of Policy .............................................................. 106
Dimension 3- Instructor Consequences ......................................................... 106
Dimension 4- Student Consequences............................................................. 106
Dimension 5- Student Conduct ...................................................................... 107
Research Question 4 ............................................................................................ 107
Dimension 1- Use of Technology .................................................................. 107
Dimension 2- Perceptions of Policy .............................................................. 107
Dimension 3- Instructor Consequences ......................................................... 107
10
Dimension 4- Student Consequences............................................................. 108
Dimension 5- Student Conduct ...................................................................... 108
Research Question 5 ............................................................................................ 108
Dimension 1- Use of Technology .................................................................. 108
Dimension 2- Perceptions of Policy .............................................................. 108
Dimension 3- Instructor Consequences ......................................................... 109
Dimension 4- Student Consequences............................................................. 109
Dimension 5- Student Conduct ...................................................................... 109
Research Question 6 ............................................................................................ 109
Dimension 1- Use of Technology .................................................................. 110
Dimension 2- Perceptions of Policy .............................................................. 110
Dimension 3- Instructor Consequences ......................................................... 110
Dimension 4- Student Consequences............................................................. 110
Dimension 5- Student Conduct ...................................................................... 110
Recommendations for Practice ......................................................................……… 111
Recommendations for Future Research ..................................................................... 111
REFERENCES ...................................................................................................................... 112
APPENDICES ....................................................................................................................... 121
Appendix A: Survey Instrument ................................................................................ 121
Appendix B: Dimension and Survey Information ..................................................... 126
Appendix C: Academic Dishonesty in Higher Education Questionnaire –
Request for Permission ........................................................................................ 127
Appendix D: Letter to Prospective Participants......................................................... 128
VITA ...................................................................................................................................... 130
11
LIST OF TABLES
Table Page
1. Means and Standard Deviations for Type of Institutions for Dimension 1 ....................... 80
2. Means and Standard Deviations for Type of Institutions for Dimension 2 ....................... 80
3. Means and Standard Deviations for Type of Institutions for Dimension 3 ....................... 81
4. Means, Standard Deviations, and 95% Confidence Intervals for the Types of
Institutions for Dimension 4 ...................................................................................... 82
5. Means and Standard Deviations for Type of Institutions for Dimension 5 ....................... 83
6. Means and Standard Deviations for Class Standing of Dimension 1 ................................ 89
7. Means and Standard Deviations for Class Standing of Dimension 2 ................................ 90
8. Means and Standard Deviations for Class Standing of Dimension 3 ................................ 91
9. Means and Standard Deviations for Class Standing of Dimension 4 ................................ 92
10. Means and Standard Deviations for Class Standing of Dimension 5 .............................. 93
12
CHAPTER 1
INRODUCTION
Student academic misconduct means different things at different colleges and institutions
of higher learning. A possible reason for this is that an exact definition of academic misconduct
has not been established. A student may take part in academic dishonesty for a variety of
reasons; an emphasis on success, pressure from peers, unrealistic expectations, or lack of
preparedness can all lead to student cheating. Another area that can lead to academic dishonesty
is a strong emphasis on a high grade point average (GPA) that will lead to glowing transcripts
and scholastic scholarships that could result in assistantships at the graduate level (Owunwanne,
Rustagi, & Dada, 2010).
Academic misconduct has been defined many ways, “In short, academic dishonesty can
be viewed as a range of deliberate, unacceptable behaviors that students use to gain an unfair
advantage on tests and assignments” (Bricault, 2007, p. 15). A common definition of academic
dishonesty involves students claiming that another student’s work is their own (Educational
Testing Service (ETS), 1999). The dishonesty can be in the form of paying another individual to
do the assignment, buying a class assigned term paper, obtaining exam questions prior to the date
of an examination, or copying the completed work of another student.
There is evidence that a larger number of students regularly engage in academic
dishonesty than students who never engage in academic dishonesty. However, there is no known
evidence to prove the extent students cheat. Because of differences among teachers, students
may cheat more with some teachers than with others, depending on the demands teachers have in
their classrooms (Kerkvliet & Sigmund, 1999). According to research findings there are a
number of reasons that students cheat including little probability of detection, consequences are
13
not severe, no stated rules on academic cheating, or if prohibitions are in place they are not
clearly stated or articulated (ETS, 1999; Novotney, 2011). Individuals who take part in academic
cheating must conclude that it is necessary to cheat. These individuals observe other students
taking part in forms of academic cheating and determine that their standing will be impacted
because their scores may be lower than those who are cheating. In Bower's landmark 1964 study
on student academic misconduct in higher education, he reported that 75% of the 5,000 students
surveyed had taken part in one or more acts of cheating. In a 2002-2005 study conducted by The
Center for Academic Integrity at Duke University, “70 percent of the 50,000 undergraduate
students surveyed during 2002 to 2005, on some 60 campuses nationwide, reported cheating”
(Owunwanne et al. 2010, p. 59). According to data from the 1940s, approximately 20% of
college students, by their own admission, had cheated while in high school (ETS, 1999; Open
Education Database, 2010). In 2010 between 75% and 98% included students participating in
types of activities leading up to their entry into college (Open Education Database, 2010).
Staffers at the Educational Testing Service (ETS) (1999) opined that academic cheating
does not have the same stigma as in the past. ETS found that a greater desire to be accepted into
colleges and graduate-level programs, along with a decreased societal condemnation, has led
students at all levels to be more disposed to take whatever action is necessary to gain a higher
grade. According to the ETS the grade that a student earns in a course has become more
important than the actual knowledge the student would have gained by working diligently and
studying during the course of instruction. Previously it has often been the below-average student
who took part in acts of academic dishonesty, but in present day standards, it is more likely to be
above-average college students who are cheating on scholastic classroom activities (ETS, 1999).
14
The ETS (1999) reported that in most incidences of academic cheating the offending
student is rarely discovered during the act. If the student is apprehended, the penalty is rarely of
significance, if there is a penalty given at all (ETS, 1999; Open Education Database, 2010). The
ETS (1999) found that with the advancement of computers, student academic cheating had
significantly increased. A popular paper-mill website averages approximately 8,000 inquiries on
a given day. The percentage of college students who disclose that they have engaged in academic
cheating has been reported to be as high as 68%, with undergraduate freshman students being the
most likely to engage in cheating (Open Education Database, 2010). Those who took part in
academic cheating reported that they did not feel guilty for violating the ethical standards of the
university. Most college students (85%) are of the opinion that academic cheating is a necessary
aspect in a college-level educational program (ETS, 1999; Open Education Database, 2010).
This thought process appears to be held by those who do not take part in academic cheating.
According to research findings the general thought is that academic cheating is an asset in
obtaining university scholarships, internships, better grades, and scholastic awards (ETS, 1999;
Open Education Database, 2010). Almost all university students (95%) are of the opinion that if
they engage in dishonest academic practices they will not get caught by their instructors (Open
Education Database, 2010). This opinion may add to the problem of academic cheating and give
students more motivation to take part in academic misconduct.
To add to the seriousness of the academic cheating issue, updated opinions from a
significant number of undergraduate students show that as many as 66% engaged in academic
cheating on homework, class exams, and course assignments (Novotney, 2011). Novotney
(2011) reported that students who took part in academic cheating such as plagiarism at the
college level admitted they were more likely to participate in illegal acts, commit adultery, and

15
violate their company rules and regulations. Academic cheating further appears to be what could
be described as a gateway behavior that can lead to serious misconduct later in life. Untruthful
activities like academic cheating have the effect of changing an individual’s understanding of
what actions are correct or not correct; a student may discount the belief that academic cheating
is a dishonest activity. Students often turn to their peers for indications as to whether or not
approaches and actions are permissible. Novotney (2011) found that if students observed another
students engaging in academic dishonesty they were more likely to take part in that type of
activity. A student with knowledge of another student cheating could very well be foreseeing his
or her own cheating. The conduct is likely communicated by the knowledge that another student
is taking part in academic dishonesty (Novotney, 2011).
A zero tolerance policy mandates application of a predetermined penalty as the
prescribed manner of punishment for violations of policy on academic misconduct. The intensity,
the circumstance, and the context of the situation are not taken into account when the penalty is
administered. The idea of zero tolerance has its origins in the punishments handed down to
individuals who traffic in the sale and distribution of illegal or controlled substances. In the early
1990s, the idea of zero tolerance in school policies and procedures became common-place
(American Psychological Association Zero Tolerance Task Force, 2008).
These policies are put into place and are founded on the principle that harsh reactions
leveled against problem students, or even the removal of these students from scholastic
programs, will be enforced by student peers in the school program. Subsequently, student-led
punishment will have a positive effect and cause the remaining students to refrain from other
illegal or improper acts (American Psychological Association Zero Tolerance Task Force, 2008).
16
When university administrators look at the legal aspects of academic dishonesty, clear
avenues of approach can become undefined. The situation is complex in that there is not a
universally agreed upon definition of exactly what constitutes academic dishonesty. According to
Bricault (2007) university policies on the topic are often not communicated properly to the
student body. Furthermore, policies are not always written in a clear manner. Instructors are
responsible for deciding whether to address issues of cheating internally or to handle the
situation as it has been articulated in university policies and procedures that send the student
before a disciplinary committee. The student’s right to due process must be considered by the
faculty and administrators of the university. The Due Process clause of the 14th Amendment is a
key element to consider when studying academic dishonesty from a legal viewpoint. This allows
an accused the right to have knowledge of and respond to allegations made against him or her.
Due process in education was established in the 1961 case of Dixon v. Alabama State Board of
Education that set the precedence for the requirement of an accused being notified and having
the right to a hearing as a standard for the minimum set of safeguards for accusations of
academic misconduct (Bricault, 2007).
Another point of consideration is whether the academic infraction should be addressed as
social or academic misconduct. The courts have generally not intervened in these types of
situations, allowing a university to make that determination. If the issue moves into a disciplinary
environment, the courts have been more inclined to be involved. In 1975, the Supreme Court
decided in Gross v. Lopez that a student has the right to due process when there is the possibility
of the loss of liberty or property rights. Students who have been accused of academic dishonesty
but have been denied their right to due process could have a decision made in their favor in a
court (Bricault, 2007).
17
The process by which an instructor presents class material and the classroom structure
may have an effect on academic dishonesty (Owunwanne et al., 2010). If the interest level of the
students is low as to the content of the class material, they may be more inclined to take part in
academic dishonesty. A student with little respect for an instructor will probably also have little
respect for the course of instruction and be more inclined to take part in acts of cheating in the
classroom. The student who sees that other students are getting a substantial benefit from
academic dishonesty may also be inclined to cheat in the classroom. With evidence that
academic dishonesty takes place at many levels of the academic process, thereby making an
equal and fair opportunity impossible for all students, some students may commit acts of
cheating to gain an equal opportunity for advancement (Owunwanne et al., 2010).
Vandehey, Diekhoff, and LaBeff (2007) revealed that concern for being caught and
punished for cheating was a far more effective deterrent to academic misconduct than a student’s
internal feelings toward the act. In the study there were six deterrents evaluated as a means of
deterring student academic dishonesty. Students were found to be deterred from academic
misconduct by external factors. The top four deterrents were embarrassment of being caught in
the act of academic dishonesty, being dropped from the course of instruction, the response of the
university, and receiving a failing grade for the course. A feeling of guilt ranked fifth, and sixth
was what the student’s peers thought about the student being caught in the act of academic
dishonesty (Vandehey et al., 2007).
Statement of Problem
By deepening an understanding that student perceptions have on academic dishonesty’s
effect on the student body, instructors, and university administrators, one could better understand
the impact dishonesty has on the long-term decision making processes of future students

18
attending institutions of higher learning in Tennessee. The purpose of this study was to
determine if statistically significant correlations exist between identified student demographic
characteristics (independent variables) and the student’s attitude toward academic dishonesty, as
measured on the Attitudes and Perceptions of Academic Dishonesty survey instrument, and a set
of demographic (gender and age) and academic variables (classification, GPA, and major). The
purpose of this study was also to determine the perceptions and opinions of undergraduate
students about academic dishonesty. Further, the purpose of this study was to review and analyze
the literature regarding academic dishonesty and to propose a study that would examine the
perceptions and frequency of academic dishonesty among undergraduate college students.
Significance of the Study
Instances of academic dishonesty have been documented in every culture and at all
academic levels from elementary to graduate school; there was evidence of academic dishonesty
2,000 years ago during Chinese civil service examinations. Studies of academic dishonesty have
revealed that 20% of students begin cheating in early elementary school (Bushway & Nash,
1977). Petress (2003) reported that students who are caught in the act of academic plagiarism
made excuses that “everyone is doing it [and] it’s not a big deal” (p. 624).
The issue of academic dishonesty has a detrimental effect on a college or university
because it can damage the reputation of the institution. Academic dishonesty will cause students
who may not engage in academic dishonesty to become discouraged when they witness cheating
and the individuals who cheat are not caught or punished. There is evidence to support the idea
that academic dishonesty is consequential. An act of cheating in a college setting that students
see has had a positive outcome may be acted out in other aspects of life. This is because the
19
unethical action was successful and rewarded. Academic dishonesty has had such prevalence that
it has expanded in its complexity and rate of occurrence (Open Education Database, 2010).
Research findings show that not only do students cheat in US colleges, but at least 10%
of international campus populations also cheat (Williams & Hosek, 2003). These students made
up 46.7% of the student population who cheated in the colleges. According to Aiken (1991)
academic dishonesty is among the top threats to a student’s attainment of growth, emotional and
social personalities, and moral standards. Academic dishonesty stunts engagement in the learning
process and the positive development of morals for students. Research indicates that even though
most students consider it is wrong to cheat, many students engage in academic dishonesty
(Davis, Grover, Becker, & McGregor, 1992). In addition, research has shown that students see
academically dishonest behaviors to be ordinary behavior for students (Greene & Saxe, 1992).
Research Questions
This study is guided by six research questions.
RQ1: Is there a significant difference in the mean scores for each of the dimensions on the
Attitudes and Perceptions of Academic Dishonesty survey (Dimension 1- Use of
Technology, Dimension 2- Perceptions of Policy, Dimension 3- Instructor Consequences,
Dimension 4- Student Consequences, and Dimension 5- Student Conduct) among
participating institutions of higher education?
RQ2: Is there a significant difference in the mean scores for each of the dimensions on the
Attitudes and Perceptions of Academic Dishonesty survey (Dimension 1- Use of
Technology, Dimension 2- Perceptions of Policy, Dimension 3- Instructor Consequences,
20
Dimension 4- Student Consequences, and Dimension 5- Student Conduct) between male
and female undergraduate students?
RQ3: Is there a significant difference in the mean scores for each of the dimensions on the
Attitudes and Perceptions of Academic Dishonesty survey (Dimension 1- Use of
Technology, Dimension 2- Perceptions of Policy, Dimension 3- Instructor Consequences,
Dimension 4- Student Consequences, and Dimension 5- Student Conduct) among
traditional age students (18-24) and nontraditional age students (25-52)?
RQ4: Is there a significant difference in the mean scores for each of the dimensions on the
Attitudes and Perceptions of Academic Dishonesty survey (Dimension 1- Use of
Technology, Dimension 2- Perceptions of Policy, Dimension 3- Instructor Consequences,
Dimension 4- Student Consequences, and Dimension 5- Student Conduct) among
academic classification (Freshman, Sophomore, Junior, or Senior)?
RQ5: Is there a significant difference in the mean scores for each of the dimensions on the
Attitudes and Perceptions of Academic Dishonesty survey (Dimension 1- Use of
Technology, Dimension 2- Perceptions of Policy, Dimension 3- Instructor Consequences,
Dimension 4- Student Consequences, and Dimension 5- Student Conduct) among
students grouped by declared major (Criminal Justice or other)?
RQ6: Is there a significant difference in the mean scores for each of the dimensions on the
Attitudes and Perceptions of Academic Dishonesty survey (Dimension 1- Use of
Technology, Dimension 2- Perceptions of Policy, Dimension 3- Instructor Consequences,
Dimension 4- Student Consequences, and Dimension 5- Student Conduct) between
students grouped by self-reported grade point average (GPA: 2.00-3.00, 3.01-4.00)?
21
Definition of Terms
Academic Cheating: “Academic cheating is defined as representing someone else’s work as you
own. It can take many forms, including sharing another’s work, purchasing a term paper
or test questions in advance, paying another to do the work for you” (ETS, 1999, para. 1).
Academic Dishonesty: Academic misconduct is any action or attempted action that may result in
creating an unfair academic advantage for oneself or an unfair academic advantage or
disadvantage for any other member or members of the academic community (ETS, 1999).
Academic dishonesty, academic cheating, cheating, and academic misconduct may be
used interchangeably throughout this study.
22
Limitations, Delimitations, and Assumptions
This study was limited by the appropriateness of the theoretical framework and was
assumed to be an accurate reflection of the educational philosophy of the participants and the
primary construct (opinions concerning academic dishonesty) being studied. Therefore, the
results of this study are limited by the accuracy of the theoretical framework to reflect the
phenomena under study. This study is limited by the definition of academic dishonesty and how
well the instrument measures the construct. It is also assumed that the methodology is
appropriate to the problem being addressed.
The results of this study are limited by the ability of the statistical procedures selected to
find statistical significance. Further, it is assumed that the participants in this study are
representative of the population of interest. A possible limitation of this study is the sample size
and the number of undergraduate students who took part in the survey. To assure the highest
level of response, the time required to complete the survey was limited to 10 minutes. A possible
limitation could be that over- or under-reporting may be an issue of concern and could distort the
results of the study. However, the anonymity of the individuals who take part in the survey
should address that concern. Another limitation is that an institution of higher education’s culture
and climate plays a key role in how students feel about academic dishonesty. Conducting the
same study at other types of institutions of higher learning would allow researchers to learn how
results for different types of educational institutions may or may not correlate.
The theoretical framework was chosen after considering previous research in similar
studies. Only those questions that were approved by an expert panel were included in the survey.
The results of this study may not be generalizable to other populations. This study was further
delimited by the theoretical framework that was selected for the research. This study is delimited
23
to participating undergraduates attending the three schools in Tennessee that were selected for
inclusion in the study; the results may not be generalizable to other schools or those in other
states. This study was further delimited by the theoretical framework that was selected for the
research. An opinion on academic dishonesty was measured by a Likert-type scale with an
instrument especially designed for this study.
Overview of the Study
This study is organized into five chapters. Chapter 1 contains an introduction to the study,
statement of the problem, research questions, significance of the study, definition of terms, and
delimitations and limitations. Chapter 2 provides a review of literature pertinent to the issues
addressed in this study. The research methodology and design are discussed in Chapter 3 along
with the study’s population, procedures, instrumentation, research questions and corresponding
null hypotheses, and data collection and analysis. Chapter 4 presents the results of the study.
Chapter 5 contains the summary of findings, conclusions, and recommendations for further
study.
24
CHAPTER 2
REVIEW OF LITERATURE
Academic Dishonesty
To better understand the area of concentration for this literature review, a usable
definition of the term academic dishonesty must be included. Academic dishonesty can be
defined as any deceit in academic work, which can include cheating, plagiarism, falsification of
documents, and giving (or receiving) aid on assignments, tests, or exams. Academic dishonesty
has been practiced in almost every educational setting from elementary school to higher
educational and graduate school settings. As a point of reference, there was evidence of
academic dishonesty 2,000 years ago during Chinese civil service examinations (Bushway &
Nash, 1977). The findings from Bushway and Nash’s (1977) study on academic dishonesty
revealed that 20% of students begin cheating early in elementary school.
Stephens (2004) studied college students and found that two-thirds of college students
have committed an act of academic dishonesty in their college careers. Additionally, there was a
study that demonstrated that 56% of students in middle-school and 70% of students in high-
school have taken part in some form of academic dishonesty (Decoo & Colpaert, 2002). When
university administrators investigate the legal aspects of academic dishonesty, clear-cut
approaches can be undefined. This situation is complicated by a universally agreed upon
definition of what constitutes academic dishonesty. University policies on the topic are often not
properly communicated to the student body. Policies are further not always written in a clear
manner. Instructors are responsible for making the decision whether to handle individual issues
of cheating internally or to address the situation as it has been articulated in university policies
and procedures, which send the offender before a disciplinary committee. Paramount in this

25
situation is to ensure that a student’s legal due process rights are not violated by university
faculty or administrators. Academic dishonesty has been defined in terms of a range of
unacceptable, deliberate, dishonest activity that a student uses to gain an advantage on classroom
assignments or testing activities.
When looking at academic dishonesty from a legal viewpoint, a key federal law addresses
dishonesty; the due process clause of the Fourteenth Amendment, which allows an accused the
right to have knowledge of and respond to allegations made against him or her. Due process in
education began with the 1961 case of Dixon v. Alabama State Board of Education. This case set
the precedence for requiring that the accused receive proper notification of a hearing as a
standard for the minimal set of safeguards for accusations of academic misconduct. Another
legal point of consideration is whether or not the academic infraction should be addressed as
social misconduct or as academic in nature. Scholastic dishonesty has been defined by the courts
as an offense that cannot be defined as either academic or disciplinary. The courts have generally
not intervened in these types of situations allowing the university to make judgment. If an issue
moves into a disciplinary environment, the courts have been more inclined to become involved.
In the case of Goss v. Lopez (1975), the courts decided that a student has the right to due process
when there is the possibility of the loss of liberty, rights, or property. A student who has been
accused of academic dishonesty, but denied due process rights, could have a court decision made
in his or her favor (Bricault, 2007).
McCabe, Treviño, and Butterfield (2001) studied honor codes, cheating, and academic
dishonesty in academia. They collected data over a decade of documentation and investigative
follow-up. The outcome revealed that academic dishonesty is widespread and that variations in
academic dishonesty have shown a marked increase over a period of 30 years. McCabe et al.
26
(2001) found that student opinion of a peer’s conduct has a very strong influence when it comes
to academic dishonesty. Institutional honesty policies such as integrity programs can have a
positive effect on an individual’s actions. The foundation of the research by McCabe et al.
(2001) was based on a moral and ethical choice encountered by college students. Their decision
was whether or not to take part in academic dishonesty during their college years (McCabe et al.,
2001).
Corruption in education has been a problem in every country. It is particularly present at
the university and college level; all educational institutions have issues of corruption. According
to Johnson (2012), corrupt acts are unethical; however not all unethical acts are corrupt. Corrupt
acts in an educational setting are conduct by an individual that goes against the values that form
a basis for educational processes. Another example is serious conduct that is considered criminal,
actions of fraud, or the intentional breach of an individual’s prescribed duty. As indicated in the
research, dishonesty has occurred since the beginning of established colleges, especially in the
US. Student cheating on essays has been found for at least 60 years (Michaels & Miethe, 1989;
Whitley, 1998). Scholars warn that the level of cheating has become epidemic, citing several
factors as to the reasons for cheating in colleges reported in the research (Robinson, Amburgey,
Swank, & Faulkner, 2004).
According to Robinson et al. (2004), cheating is the intent to use unauthorized means or
an attempt to use materials, information, or some type of study aid in order to receive academic
credit. Robinson et al. (2004) found a concentration on the factors associated with cheating on
tests. When surveys were done anonymously Robinson et al. (2004) found evidence that a large
number of college students who cheated also committed many sorts of academically dishonest
deeds ranging from cheating on exams, writing assignments, and collaboration with others when
27
completing assignments. Once professors made their views on cheating clear, the students had
fewer dishonest episodes, yet many students continued cheating regardless of the professors’
views or actions.
Robinson et al. (2004) suggested another component of cheating includes the perception
of good grades. It is possible that college students become better cheaters because of pressure to
do well in school. However, it is usually the students with the greatest academic difficulties who
are more apt to cheat. With these cheating behaviors, research has shown that seeing someone
cheating brings more association with the group because the students’ peers witness little or no
obstacle to the dishonesty (Robinson et al., 2004).
Treatment of Academic Dishonesty
Carter and Punyanunt-Carter (2006) primarily investigated different treatments that
addressed academic dishonesty by college students. Results showed that as much as 40% to 60%
of college students have cheated on at least one examination. Furthermore, according to Carter
and Punyanunt-Carter (2006), students were more likely to cheat on classroom examinations
when they felt that faculty did not show an interest in curbing the cheating activity. Carter and
Punyanunt-Carter (2006) found that it was easier to understand the college students’ concept of
acceptable treatment when an instructor reacted to a fictional student’s cheating scenario during
a classroom examination. The study evaluated the reaction between male and female students to
the same stimuli.
Carter and Punyanunt-Carter (2006) found that college students reported that certain
responses by instructors were more desirable than other responses. The response gathering the
greatest acceptance by students was that of the instructor merely speaking to the student after
class ended. The next choice by students was that the student received a failing grade on the
28
exam but was allowed to retake an alternate exam at a later date. According to Carter and
Punyanunt-Carter (2006), the final acceptable response was for the instructor to do nothing. All
of these responses were found to be more acceptable than having the instructor take the exam
from the offending student and assign the student a failing grade (Carter & Punyanunt-Carter,
2006).
Vandehey et al. (2007) examined university students’ attitudes, beliefs, and behaviors as
they related to academic dishonesty. This was an extended student study from data collected in
1984, 1994, and 2004. This research used the same instrument to evaluate academic dishonesty
at one university over an extended period. In the Vandehey et al. (2007) study, students were
classified as participating in academic dishonesty if they admitted to cheating at any point during
their college carrier. All other students were identified in the study as not participating in
academic dishonesty. In the 1984 study, 54% of students reported being involved in cheating.
The study further revealed an increase in academic dishonesty in 1994 to 61% (Vandehey et al.,
2007). One concern of Vandehey et al. (2007) was that it was apparent that academic dishonesty
had taken place so much that the action had not been viewed as a negative act by the students.
The most recent data gathered in 2004 revealed similar high academic dishonesty reporting rates
of 52% to 90%. The results of this study clearly indicated that students take part in cheating
activities at some point in their college carrier. Vandehey et al. (2007) revealed that a student’s
concern for being caught and punished for cheating was far more effective as a deterrent to
academic misconduct than the student’s internal feelings toward the act. In the 1994 study,
students were deterred from academic misconduct by external factors from the top four of six
deterrent emphasis areas. The top ranking deterrent was embarrassment of being caught in the
act of academic dishonesty; the second ranking factor was being dropped from the course of

29
instruction, third was the response of the university, and fourth was receiving a failing grade for
the course. Student guilt ranked fifth and sixth was what the student’s friends thought of the
offender being caught in the act of academic dishonesty. Vandehey et al. (2007) further
discussed the issue that most faculty are reluctant to abide by university standards when
addressing student academic misconduct; 71% of faculty members reported that confronting a
student about academic misconduct is a negative aspect of being an instructor at the college
level. The study consistently found that student punishment factors continued to be the best
deterrents to student academic misconduct (Vandehey et al., 2007).
In a study conducted by Hamlin, Barczyk, Powell, and Frost (2013) on a comparison of
university efforts to contain academic dishonesty, they discovered that cheating affected
institutions of higher learning and colleges throughout the nation. The study further discussed six
areas that highlight the importance of academic dishonesty. The first is that cheating takes place
in every discipline. The second is that there is not a standard method for addressing the issue in
the same departments. The third area discussed was that non-tenured faculty had a lesser
inducement to address the issue primarily because possible end of semester evaluations had the
potential to affect the instructor’s tenure tract. The forth area addressed in the study was that
discrepancies in policy or implementation could cause legal ramifications. The fifth area was that
the honest student is disadvantaged when students who take part in academic dishonesty are not
admonished or punished. The sixth area is the way dishonesty is addressed is of significant
importance in obtaining an affirmative outcome from the negative act of academic dishonesty.
A study by Newton (2016) used a questionnaire-based procedure to review the attitudes,
ability, and confidence of undergraduates newly enrolled at a university in the United Kingdom.
The study’s focus was on impressions relating to written assignments. Students were generally of
30
the opinion that academic misconduct should be modestly punished as compared to the standard
penalties imposed by the United Kingdom higher education sector. Correlations were supported
by conclusions that new postgraduates were more assured than new undergraduate students. The
researchers recommended more severe penalties and performed better in the simple tests of
referencing. The conclusions were discussed in the framework of educational needs recognized
for students, educators, and institutions.
In a study conducted by Bowers (1964) on student academic misconduct in higher
education, he discovered that 75% of the 5,000 students surveyed had taken part in one or more
acts of cheating. In a more updated study conducted by Duke University’s Center for Academic
Integrity, 70% of 50,000 university undergraduate students surveyed during 2002-2005 at 60
university campuses nationwide indicated that they had been involved in academic dishonesty
(Graves, 2008).
According to Bowers (1964), student academic misconduct does not include a clear
definition of cheating. Cheating is associated with an individual’s perception of ethics and
individuals values. A student may take part in academic dishonesty for a variety of reasons; an
emphasis on success, pressure from peers, unrealistic expectations, or lack of preparedness all
have led to student cheating. Another area that has led to academic dishonesty is a strong
emphasis on achieving a high grade point average that will lead to glowing transcripts and
probable college scholarships that could result in assistantships at the graduate level.
In addition, the process an instructor uses to present class material and the classroom
structure can influence academic dishonesty (Owunwanne et al., 2010). If the interest level of the
student is low as to the content of the class material, he or she may be more inclined to take part
in academic dishonesty. According to Owunwanne et al. (2010), a student who has little respect
31
for the course instructor will probably have little respect for the course and be more inclined to
take part in acts of cheating in the classroom. When students see other students getting a
substantial benefit from academic dishonesty, many are more inclined to cheat in the classroom.
With proven data collected that show academic dishonesty takes place at various levels in the
academic process, which makes an equal and fair opportunity impossible for most students,
many eventually commit acts of cheating to gain an equal opportunity for advancement.
Technology has made the process of combating academic dishonesty more of a challenge for
instructors; Owunwanne et al. (2010) found that 17% of students polled in recent studies
reported that they used the Internet to take part in academic misconduct.
In a study conducted by McCabe (2005) at 23 public and private universities and
colleges, 38% of undergraduate students admitted they had participated in Internet academic
dishonesty by using the Internet to copy submitted classroom materials. Studies by Brown,
Weible, and Olmosk (2010) revealed that 49% of students enrolled in undergraduate classes in
the year 1988 were involved in academic misconduct. In the same course, 100% of the students
polled in 2008 admitted to cheating on classroom assignments. Brown et al. (2010) reported that
the Center for Academic Integrity discovered that nearly 80% of college students polled admitted
to academic dishonesty on at least one occasion.
Jones (2011) discussed that 92% of the participants from his study revealed that they had
or knew another student who had taken part in academic dishonesty. Forty-one percent of the
participants indicated that their moral and ethical standing would prevent them from cheating in
the classroom. This further revealed that 59% of the polled student body would participate in
academic dishonesty. Student performance was the most documented reason that study
participants gave for taking part in academic dishonesty. According to Jones (2011), the data
32
compiled and evaluated in the study indicates a greater number of students felt that it was
acceptable to take part in academic dishonesty.
Olafson, Schraw, and Kehrwald (2014) discussed that in their study of 421 alleged
academic misconduct forms from collegiate level students that plagiarism accounted for 49% of
reported violations; 35% of the reports addressed students receiving outside help. There was also
the finding that 91.5% of the reporting was by undergraduate level university students. The study
found that academic dishonesty is widespread among college students, very few are caught, and
fewer than that were ever sanctioned.
Gallant and Drinan (2006) identified a theoretical approach to offer leadership
possibilities that go further than best practices regarding academic dishonesty. Many of the
measures taken to curtail academic dishonesty are by nature organizational. Examples include
honor pledges, honor codes, and alterations to university policies and procedures. Gallant and
Drinan (2006) addressed the approach of student cheating by applying an organizational theory.
They heightened awareness of the problem of student academic dishonesty by outlining a
multifaceted organization that could be altered by social forces, time, and individuals;
educational institutions are significantly complex because of the many subgroups involved. The
organization’s primary goal is to keep the group alive. To accomplish this and get along,
organizations are in a constant state of action and reaction to the subgroups and other forces in
their group. Problems are often complicated by confusing the characterization of the issue, which
requires a series of problem solving actions. If the issue of academic dishonesty is the concept,
the response has been a series of practices that were intended to prevent or control patterns of
behavior. This method may control cheating on a temporary basis, but the primary factors that
make up the act are not addressed.

33
When academic dishonesty is addressed by using psychological research, researchers
accept that a student’s character determines if he or she will engage in academic dishonesty.
Examples found through research were that students who engaged in cheating gave excuses for it
(Gallant & Drinan, 2006). Furthermore, students had issues with reporting fellow students who
participated in academic dishonesty. According to Gallant and Drinan (2006), the student cannot
balance the loyalty and friendship of the offender with the integrity needed to report their fellow
student. Additionally, Gallant and Drinan (2006) found that most undergraduate students did not
want to be involved in the situation because their maturity level did not allow them the capacity
to distinguish among their informed decisions, ideas, and responsibility for their actions (Gallant
& Drinan, 2006).
Academic dishonesty has been compared to the crime of theft in other studies conducted
in economic literature (Bunn, Caudill, & Gropper, 1992; Clotfelter, 1977) (as cited in Mixon,
1996). Mixon (1996) reported that cheating is governed by university honor codes that mirror
laws and both university instructors and law enforcement officers have the ability to dissuade
cheating. Academic dishonesty, just like other types of criminal conduct, is calculated by the
perpetrators on the cost verses the benefits (Mixon, 1996). An instructor who has made a
determination of student academic dishonesty and has further decided to punish the offender
will, at a minimum, be obligated to be involved in multiple administratively controlled
procedures and the possible addition of litigation (Mixon, 1996). Research has shown that there
are instructors who believe academic dishonesty can be restricted with ease or at a minimal cost.
Mixon (1996) stated that academic dishonesty is multi-dimensional. One of these aspects
is that of the public-good. This dimension, as described in his study, articulates the proposal that
academic dishonesty is a crime where there are no victims. The perpetrator of academic

34
dishonesty receives advancement without any effort on his or her part. This is accomplished by
obtaining scholastic advancement through acts of academic dishonesty. This being the case,
comprehension is under-produced in the presence of academic dishonesty (Mixon, 1996).
Mixon (1996) found that the determining factors of consistent academic dishonesty
actions are very similar to other individuals who admitted to taking part in academic dishonesty
on at least one occasion. The alternative is never committing academic dishonesty on any
scholastic activity. Mixon (1996) reported that behavior consistent with academic dishonesty is
inversely associated with grade point average. However, cheating is related to the individual
becoming acquainted with and observing other students who have taken part in academic
dishonesty. He also found that student expectation of punishment handed down by a university
also deterred student cheating. According to Mixon (1996), belief that cheaters would receive
swift and severe punishment lead to a decline in incidences of academic dishonesty.
Cheating in Higher Education
The issue of academic dishonesty is a significant problem and has been referred to as “the
bane of higher education” (Josien & Broderick, 2013, p. 93). Some of the latest studies have
revealed that the trend is ever present (Brown & McInerney, 2008; Jones, 2011). Jones (2011)
conducted a study revealing that 92% of students who were surveyed had knowledge of other
students who had taken part in cheating. The study further showed that 52.1% of students
reported that academic dishonesty is merely a small issue at their university.
Results of the Jones (2011) study indicated that younger, more immature, students engage
in academic dishonesty on a more continuous basis. Higher level courses tend to have fewer
incidence of cheating. Jones (2011) also found that single students have a greater propensity to
commit academic dishonesty than those who are married. When the risk of punishment was

35
lower, female students were more inclined to cheat than male students; higher risk of punishment
lowered the possibility of cheating by females. Students with lower grade point averages were at
a greater risk to take part in academic dishonesty than those with a higher grade point average
(Josien & Broderick, 2013).
Josien and Broderick (2013) found that there were fewer incidents of cheating when
students concluded that peers would disapprove of the conduct. Academic misconduct was
higher among students involved in sororities and fraternities and was elevated when students had
knowledge that other students were cheating. Institutions of higher learning with an environment
of professional conduct, ethical behavior, and an honor code have a lower incidence of academic
dishonesty. Penalties for acts of academic dishonesty also deter such actions from occurring.
Josien and Broderick (2013) found that 40% of students who took part in academic dishonesty
took part in multiple methods of cheating.
Petress (2003) reported that students who are caught in the act of academic plagiarism
made excuses that “everyone is doing it [and] it’s not a big deal” (p. 624). Academic misconduct
and plagiarism can take many forms such as taking exams for other students, not citing the work
of others, or making up sources in written materials. According to Petress (2003), when the idea
of academic misconduct is discussed with students, most do not pay much attention to the issue.
When polled, most students stated that they would not identify another student who they knew
was engaging in academic dishonesty. When students are successful at cheating, other students
know about it and are more inclined to cheat in their scholastic activities. If students are caught
cheating, accused, and have a severe admonishment, it seems that the behavior can be curtailed
(Petress 2003).
36
Instructors who were polled had various responses when discussing academic misconduct
(Petress, 2003). One response was that it is rather risky from a legal standpoint to allege cheating
by a student. Another response by instructors is that there is too much red tape involved in the
process and it would take them away from their regular work. Finally, instructors reported that
students will merely find another way to take part in academic dishonesty. According to Petress
(2003), instructors fear that they will not have the support of administrators, parents, and other
instructors if they report academic dishonesty.
There is much debate on the rationale of students regarding academic cheating, but there
are multiple factors involved in this dishonesty. Hamlin and Powell (2008) found results similar
to other studies discussed here. Many students at the graduate and undergraduate level cheat,
while others find it difficult to report what they witness. Both cheaters and honest students get
hurt because one commits the misbehavior while the others know they should speak up about the
behavior but do not want to get involved. According to Hamlin and Powell (2008), it is
imperative that a solution to the problem of academic cheating is found. There is urgency in
addressing the dishonest act but the frequency of the dishonesty must first be acknowledged in
every discipline. Second, there is not yet a resolution as to the best procedure to use when
dealing with dishonesty within a department. According to Hamlin and Powell (2008), professors
do not want to deal with cheating in their classroom because of the extra work required by them,
which supports the research by Petress (2003). Third, teachers who are on the tenure track do not
want to upset students, especially when the professors will be evaluated at the end of the course.
Fourth, if there is a discrepancy between the teacher’s observation of the student and the student
involved, it could result in legal action that would require a great deal of time and effort and
could result in much anguish. Even if the issue of cheating is addressed, the fact stated by the
37
authors remains the same and more cheating will continue in colleges and institutions of higher
learning. According to Hamlin and Powell (2008), professors felt a responsibility to make an
effort to lessen the problem.
McCabe et al. (2001) further revealed that academic dishonesty is frequently responded
to casually or oftentimes completely disregarded by staff members who do not wish to be
involved in an organizational practice whose design is to judge cheating at the university. When
students witnessed other students in the act of academic dishonesty and the response was
minimal or not punished at all, McCabe et al. (2001) found that students did not receive a benefit
for working to earn their grades honestly, which caused them to begin cheating, too.
In a discussion on the implementation of honor codes at a university, McCabe et al.
(2001) indicated that the sheer presence of such polices was not sufficient to curtail academic
dishonesty. The policy must have a strong presence in the culture of the university. University
uprightness can be established in a school without a published code of honor. For this to occur,
faculty, staff, and the student body must communicate how important academic honesty is to the
university and to everyone associated with the university (McCabe et al., 2001).
McCabe et al. (2001) found that staff members at institutions of higher learning with
honor codes and those without honor codes were disinclined to report academic dishonesty and
would rather address such incidences themselves. Another strong revelation of the study revealed
that students held the opinion that a significant number of instructors did not react harshly to
cheating in the classroom. Over half of the faculty at institutions of higher learning without
honor codes would simply give the student a failing grade on that particular exam, 9% reacted by
giving the student a warning, 7% issued various penalties that amounted to less than the student
receiving a failing grade for the exam, and 1% would not impost any form of punishment on the
38
offending student. Student reaction indicates that students tend to prefer the lesser punishment
courses (McCabe et al., 2001).
McCabe et al. (2001) further found that high school students entering a university
participated in some aspects of academic dishonesty or witnessed cheating by other students. The
results of a survey indicated that when these students observed upperclassmen involved in
academic dishonesty and then saw staff members not responding to the cheating, their opinion of
the college classroom deteriorated rapidly (McCabe et al., 2001).
McCabe et al. (2001) reported that every campus must commit to strong unfailing
communication to the student body that integrity in academia is expected and additionally that
academic dishonesty will end in negative consequences. The student must understand that
disciplinary actions will not be lenient. Institutions of higher learning must support members of
the staff who make allegations of academic misconduct and uphold the prohibition of violations
that discourage scholastic values (McCabe et al., 2001). According to McCabe et al., a university
must assure the student body that academic dishonesty will be met by a resounding
condemnation and further that academic honesty is a rule at the university rather than an
exception. For this to become a reality, institutions of higher learning must have the wherewithal
to address student cheating and hold the student accountable for all acts of academic dishonesty
for which they are involved (McCabe et al., 2001).
Deterrence
According to Onwudiwe et al. (2004), a sub-section of deterrence theory is the social
contract. The general concept is that mankind is not evil or virtuous; individuals agree to abide
by certain standards of living and will continue to abide by the standards as long as all parties in
the group adhere to the same set of standards. In order for society to function well, the

39
punishment for one who violates the rules set up by the group must be greater than the reward
that the person receives from the violation of the group rule (Onwudiwe et al., 2004).
Tittle and Rowe (1973) studied the effectiveness of the threat of deterrence on cheating at
academic institutions. They found that a college student is considerably dissuaded from
academic dishonesty when there is a real threat of being caught and penalized. According to
Michaels and Miethe (1989), if an individual were to understand the likelihood of penalty and
the severity of punishment at a university with an honor code in place, then they were less likely
to be associated with academic dishonesty.
Nagin and Pogarsky (2003) used an experimental study of students regarding the
variation of the severity and certainty of the threat of punishment for academic misconduct. They
found students who were allowed to take part in academic dishonesty with the promise of
financial gain. The research also considered the influence of situational dynamics and singular
individualities in a controlled sterile environment (Nagin & Pogarsky, 2003). The study
participants were randomly placed into four certainty-severity arrangements.
• In the high certainty situation, the students were advised that the instructor would
at all times be present in the room during the testing procedure. These students
were also advised that anyone caught in the act of academic dishonesty would
immediately forfeit the compensation fee for taking part in the study.
• The students in the low certainty situation were advised that the instructor would
not be present in the room during the entire exam but would check in periodically.
These students were not advised of any penalty if caught cheating. (p.190)

40
At the conclusion of the study, there was a determination that the certainty of a student
caught for cheating was more significant and stronger as related to the effect of severity. The
results also showed that the probability of academic misconduct was 16 points more significant
in the student section marked as a low certainty situation (Nagin & Pogarsky 2003).
Are Students Reticent about Cheating?
Malgwi and Rakovski (2009) described what they identified as an academic fraud
triangle. Perceived pressure, perceived opportunity, and rationalization are the three aspects of
their idea with perceived pressure as the most important of the three emphasis areas that describe
why fraud occurs. This three pronged idea includes that dishonesty occurs when people in a
position of authority experience pressure. The way to relieve this pressure is to violate trust and
become involved in academic dishonesty.
Malgwi and Rakovski (2009) identified a concept with no academic fraud. To accomplish
this, university students, staff, and faculty must share in the responsibility. Deterrence is
reactionary and usually implemented after an incident while punishment is different; if an
individual is punished and the reason for the punishment is well published, there should be a
deterrent effect. Punishment should send a message to others contemplating a similar act.
Academic dishonesty has had such prevalence that it has become more complex and is a regular
occurrence for students. This issue has also been found at institutions of higher learning with
honor systems. The effect of social differences, situations, and cultural ideas are all reasons why
a student cheats. Employing various measures aimed at combating academic dishonesty does not
ease the problem but has the opposite effect. Malgwi and Rakovski (2009) found four actions
that were the most relevant in deterring academic dishonesty, “stronger penalties, parental
notification, an anonymous tip line, and administering a uniform penalty” (p. 207).

41
Huang & Chen (2015) conducted a correlation analysis with 431 university students and
discovered that, compared to other students, the study participants who possessed a mastery
methodology and willingness to report academic dishonesty among other students, were less
likely to disclose ineffectual feelings as a reason for taking part in academic dishonesty. These
same students further stated that they would engage in academic dishonesty for self-interest or
self-promotion purposes. Students in the study reported that those with a less mastery approach
and an enhanced acceptance of cheating were more likely to take part in differing types of
academic dishonesty.
Crime and Punishment
The abundance of available electronics to students, reporting by instructors, reporting by
the student body, and the profound consequences for acts of misconduct all add to the issue of
academic misconduct (Robinson-Zañartu, Peña, Cook-Morales, Peña, Afshani, & Nguyen,
2005). Academic misconduct such as plagiarism has long been considered academic deception
and the punishment for such actions vary from reprimands to expulsion. According to Robinson-
Zañartu et al. (2005) cultural and academic pressures are important factors in the decision to take
part in academic dishonesty. Student social pressures, achievement rewards, and demands on
time and organization all cause an individual to become involved in academic misconduct.
When academic misconduct is identified, the instructor must evaluate several concerns
including what punishment is appropriate and to whom the instructor reports the incident.
Mathur and Offenbach (2002) (as cited by Robinson-Zañartu et al., 2005) wrote that 10% of
instructors reported that they could not turn in a student for academic misconduct because of
fearing retaliation. The percentage increased to 27% when the instructor was asked if they would
turn in a colleague for misconduct (Robinson-Zañartu et al., 2005).

42
The purpose of Burrus, Graham, and Walker’s (2011) study was to evaluate faculty ideas
regarding the frequency of academic misconduct, what is generally considered academic
misconduct, and what procedures could reduce cheating. Most institutions of higher learning
make public their policy that covers issues of academic dishonesty; honor codes are relevant in
the molding of students toward a positive culture. McCabe et al. (2001) found that institutions of
higher learning with formal honor codes were integral to the university culture. Academic
dishonesty will not be part of the student’s academic make-up as long as it is not introduced
during the early stages of an academic career. Kidwell, Wozniak, and Laurel (2003) conducted a
study of college students and found that 70% reported plagiarism and academic dishonesty. In
addition, there were those who reported multiple acts of cheating.
Kerkvliet (1994) and Whitley (1998) (as cited by Burrus et al., 2011) revealed that a
greater focus on grades, grade point averages, working more hours outside of class, and student
alcohol consumption all had a determinative effect on academic dishonesty. Research revealed
that students do not get involved in academic misconduct because they lack an understanding of
what cheating is. Instead, they cheat because of the low possibility of being detected or the
insignificant consequences of being caught (Burrus et al., 2011).
In a military school setting, expulsion is common practice for academic dishonesty.
Certainty and severity of punishment for academic dishonesty are important factors for curtailing
academic dishonesty. Mixon (1996) and Burrus et al. (2007) (as cited by Burrus et al., 2011)
found that the severity of the punishment is an important determinant in the likelihood of
academic dishonesty.

43
Levels of Threat and Punishment
Heisler (1974) conducted a study focused on whether an instructor imposed a harsh,
moderate, or meek punishment against a cheating student, and if that punishment prevented
college students from cheating. The results of the study indicated whether or not a student who
received a penalty for taking part in a dishonest activity could influence other students not to
participate in cheating (Heisler, 1974). In Heisler’s (1974) study, participants were divided into
eight groups, given an exam, provided with different directions, and treated in different ways.
1. The first group was given the exam. During the last section of the exam, the
students were told that they were to grade their own exam to expedite the process.
2. The second group was treated exactly the same as group one with the exception
that the students witnessed a student being confronted by the instructor and
accused of changing answers. This confrontation was carried out early in the
grading process. After being told not to cheat any more during the grading
process, the student was allowed to continue with the exam.
3. The third group of students was given the same course of action that group one
received with the exception that the participants were advised prior to grading the
exams that being caught cheating would result in the student being expelled from
the university.
4. The students in group four received the same guidelines as the students in group
three with the exception that the students were allowed to see the instructor catch
a student cheating at the beginning of the grading process.
5. Group five participants went through the same procedure as group four but prior
to grading the exams, the instructor told the students that if they were caught

44
cheating they would be required to repeat the Cooperative School and College
Ability Test.
6. The procedure concerning group six was identical to group five except that these
students were allowed to witness a student caught cheating.
7. Group seven students were subjected to the same procedure as group six but prior
to the grading process the students were advised that if they were caught cheating
there would be a mandatory deduction of 12 points from the students’ final grade.
8. The students in group eight were subjected to the same procedure as the students
in group seven but also witnessed a student caught cheating. (Heisler, 1974, p. 580)
Students who were given a stern threat but were not subjected to the student caught in the
act of cheating, tended to cheat much more than other students. The students who were given a
stern threat and also witnessed the student caught cheating had the fewest cheating incidences.
The students who observed the student caught cheating scenario and the instructor giving a
lenient punishment to the offending student tended to take part in cheating activities at a
drastically higher percentage than the students who had observed a student caught cheating after
the students were strongly or mildly admonished (Heisler, 1974).
Classical Perspective
Any discussion about the classical prospective on criminal theory should include the sub-
section area identified as scenario research, which can be identified as an individual’s perception
of certainty and severity in terms of punishment that depends on the situation. Furthermore, that
perception is altered as time passes. The Tibbetts (2012) study focused on participants given the
opportunity to engage in illegal or improper activity. Tibbetts (2012) found that an increased
45
number of participants carried out the acts, even though they were certain of the punishment they
would receive; there was also little concern for the severity of the punishment.
A sub-section of deterrence theory is the rational choice theory that emphasizes the
significant amount of decision making power that an individual considers when deciding whether
or not to carry out an act. Rational choice is guided by an expectation of rewards. One example is
the euphoria experienced when one is able to perpetrate an illegal or improper act without
discovery. Rational choice has its origins in the concept that knowing an act is illegal, immoral,
or (more specifically) bad should be the foundation of deterrence (Tibbetts, 2012).
According to Reynolds (1998) the Wolfgang Group studied two groups of males and
concluded that males who committed illegal or improper acts and received a lesser punishment
were more likely to re-offend or commit further illegal or improper acts; the males in the two
groups who were given a more severe punishment were less likely to commit further illegal acts.
Reynolds (1998) also cited a 1979 study by Murray and Cox involving 317 participants who had
carried out acts that were known to be illegal or improper. The researchers found that those who
received severe punishments were less likely to commit the acts again than the participants who
received a lesser punishment (Reynolds, 1998).
Bentham (1780), who was an 18th century crime intellect, wrote An Introduction to the
Principles of Morals and Legislation. The body of his paper discussed deterrence theory and
included information that the power of the theory was in the clarity of a prescribed punishment,
the certainty of a prescribed punishment, and the severity of a prescribed punishment.
Additionally, Bentham stated that the sooner punishment was enforced after an offense occurred,
the better the possibility that the perpetrator would understanding that he or she should not have
carried out the offensive act (Onwudiwe et al., 2004).
46
Zero Tolerance
The American Psychological Association established a task force to determine and
recommend zero tolerance policies (American Psychological Association Zero Tolerance Task
Force, 2008); according to the APA, a zero tolerance policy mandates application of a
predetermined, severe penalty as the prescribed manner of punishment for severe violations of
policy. The intensity, the circumstances, and the context of the situation are not taken into
account when the penalty is administered. The idea of zero tolerance has its origins in the
punishments handed down to individuals who traffic in the sale and distribution of illegal or
controlled substances. In the early 1990s, the idea of adding zero tolerance to school policies and
procedures became common-place (American Psychological Association Zero Tolerance Task
Force, 2008).
These policies were founded and enacted on the idea that harsh reactions leveled against
problem students or the removal of these students from scholastic programs would be enforced
by student peers. Subsequently, this student-led punishment would have a positive effect and
discourage remaining students from participating in illegal or improper acts (American
Psychological Association Zero Tolerance Task Force, 2008).
There is little data that examine the idea of zero tolerance policies when evaluating
school discipline. The American Psychological Association Zero Tolerance Task Force (2008)
report detailed ideas in two areas. The first is the reformation of zero tolerance policies that deal
with use of alternative practices, and second is an alternative procedure to take the place of zero
tolerance where a more suitable approach is appropriate.
In the early 1990s, school discipline was dominated by the idea of zero tolerance. The
concept became an appropriate policy that articulated the carrying out of prior agreed upon

47
punishments. The punishments were punitive and severe in their design and were carried out
against the individual with no regard to the situation. Without a good singular definition of zero
tolerance, it is somewhat difficult to determine the helpfulness of the idea. The study made the
determination that, for some offenses, a mandated punishment increases the consistency of
discipline in the school and communicates a very clear discipline message to the student. The
study further found that the certain and swift aspect of punishments contained in the zero
tolerance idea had a definite deterrent effect on students (American Psychological Association
Zero Tolerance Task Force, 2008).
Zero Tolerance and Student Choice
Levy and Rakovski (2006) performed research to determine student reaction to an
instructor using a zero tolerance academic dishonesty policy. Each participant was asked about
their reaction to classroom penalties for various types of academic dishonesty, which acts of
cheating were considered more severe than others, and how many times they cheat. Findings
reveled that acts of academic dishonesty were less common at institutions of higher learning with
a strong academic code of honor (Levy & Rakovski, 2006). Some students who participated in
academic dishonesty placed the blame for their cheating on instructors who do not act against
prior acts of academic dishonesty. The findings revealed that students participated in academic
dishonesty less when they knew the cheating would be discovered.
Studies indicated that the primary issue is punishment for dishonest behavior (Levy &
Rakovski, 2006; Nuss, 1984). In 1984, Nuss found that 39% of the instructors surveyed reported
academic misconduct to the appropriate educational authority, 34% lowered the offender’s
grade, and 26% gave a simple warning to the student. The response by the instructor depended
on the type of misconduct committed by the student.

48
In the survey distributed by Levy and Rakovski (2006), the questions gauged student’s
reactions based on two scenarios. The first scenario (the “other professor”) involved an instructor
who employed a strict interpretation of the school academic dishonesty policy, reported students
to the administration, and handed out discipline for cheating. The second scenario (the “zero
tolerance” instructor) involved an instructor who employed a zero tolerance policy for academic
dishonesty and failed all offenders in the class. The survey choices included that the student
would avoid the course, register for the course, try to avoid the course, or be indifferent about
whether or not to register for the course. Most participants reported that honest students would
have an indifferent opinion when selecting the instructor. The survey further revealed that
individuals who took part in dishonesty would avoid both types of instructor and 13% of the
students indicated that they would avoid zero tolerance instructors (Levy & Rakovski, 2006).
Strategies for Reducing Academic Dishonesty
According to research, academic cheating has increased over the years (Williams &
Hosek, 2003). In 1941, there was less cheating in colleges than today with percentages ranked
from 21% to more than 50% (Williams & Hosek, 2003). According to Williams and Hosek
(2003), academic dishonesty increased from cheating in colleges to cheating on income taxes,
politics, and athletics. They also found that cheating occurred among pre-med and medical
students and the dishonesty continued into their “subsequent careers.”
Research findings show that not only do students cheat in US colleges but there are at
least 10% of international campus populations who also cheat (Williams & Hosek, 2003). These
students made up 46.7 % of the student population who cheated in the colleges. Aside from a
moral and ethical imperative, the assumption is that students were rational when they chose to
cheat because they expected to benefit from the behavior (Williams & Hosek, 2003).

49
Creating Environments that Foster Academic Integrity
Higher education has become a high stakes environment due to the student’s desire to be
successful. Some rewards include but are not limited to scholarships, student loans, parental
approval, and other significant factors. These pressures influence students to cheat, plagiarize,
misreport research data, test security breeching, and other such similar instances. As stated by
Tippitt, Ard, Kline, Tilghman, Chamberlain, and Meagher (2009), there should be an
environmental change that brings about academic integrity. This environmental change will also
have to become a significant culture change and the goal of a higher level of academic integrity
would have to be pursued.
Cole, Swartz, and Shelley (2014) discussed the results of a 4-year study probing 553
collegiate level business students’ views of academic dishonesty and the aspect of technology in
e-learning. More than a third of the participants indicated that they did not believe academic
integrity applied equally online and in the classroom. The researchers used Independent-samples
t-tests to reveal statistically significant differences based on gender, but not by age group or level
of study. Of the replies submitted, 200 discussed what made the two learning environments
different. Participants indicated that nowadays where retrieving information from multiple
available resources to solve a problem is the standard, instructors should be familiar with that
and determine what is and what is not suitable behavior in their courses.
According to Tippitt et al. (2009), a commitment is the responsibility that one must
morally abide by a code of ethics and professional standards. This is to have resolute
involvement by faculty when dealing with issues of academic integrity. One way for faculty to
assist with students refraining from cheating is to have more than one proctor in the room and
prohibiting the use of personal items (Tippitt et al., 2009).
50
Controlling Cheating in the Classroom
Unethical behavior is difficult to control and occurs not only inside the traditional
classroom but has also grown in magnitude in the on-line educational classroom. A study by
Ercegovac and Richardson (2004) showed that males younger than 24 years old were the
demographic most likely to participate in academic misconduct. Ercegovac and Richardson
(2004) also found that students who were further along in their education process were more
likely to be involved in academic cheating.
In the fall of 2009, Troy University deployed something not used before with online
classes (Kitahara, Westfall, & Mankelwicz, 2011). The Proctor U service was launched to
proctor online students; each student was required to pay a $25 fee included in their tuition to
pay for using the service. Proctor U staff members are available to provide real time assistance
for student testing but a webcam is required for monitoring the student during the testing.
Although the service was designed to deter cheating, Ercegovac and Richardson (2004) foresaw
no effective way to stop cheating no matter the student, school, or place because students will
always find ways to cheat.
As research indicated, academic dishonesty in college is a widespread issue and academic
integrity has been an issue that is mostly overlooked in the field of criminology, which could be
due to the perception of harm. There is evidence to support the idea that academic dishonesty is
consequential (Smith, Langenbacher, Kudlac, & Fera, 2013). An act of cheating in college that
results in a positive reinforcement will be revealed in other aspects of life because the unethical
action was rewarded and successful in the past. It is important that investigators look at ideas of
controlling academic dishonesty from a wide array of disciplines.
51
One emphasis area from the field of criminal justice is Agnew’s (1997) general strain
theory. This theory explains that misconduct is started by the inability of the individual to cope
in moral and ethical ways. The individual’s reaction is in response to events that provoke
negative results. An example could be one who expects a good grade on an important exam but
does not receive the expected grade, which results in academic dishonesty on future exams.
Strain can result from the absence of stimuli an individual deems as a positive value; the
presence of negative stimuli can also produce strain. Students in the process of experiencing
strain are more inclined to be involved in academic dishonesty because of college pressures.
Smith et al. (2013) revealed some support for strain theory. The aspect of academic shortcomings
was shown to be in direct relation to academic dishonesty (Smith et al., 2013).
Research findings show that cheating happens more often than not (Kerkvliet &
Sigmund, 1999). Evidence has been found that more students cheat regularly than students who
never cheat, however there is no known evidence to determine the extent to which students
cheat. Because of the rigorous techniques used by classroom teachers, some students cheat more
with certain teachers than they do with others; it depends on the demands of each teacher.
According to Kerkvliet and Sigmund (1999), Becker theorized that criminals are rational
decision-makers who determined the expected benefits and expected price of committing a
crime. Kerkvliet and Sigmund (1999) determined that others have adapted Becker’s model on
academic dishonesty. First, an increase in cheating occurred when it was undetected. Second,
imposing a more severe punishment tended to deter cheating. Finally, measures taken to detect
cheating also assisted in discouraging cheating. With controlled measures in place to prevent
cheating, attempts at academic dishonesty were less likely to occur during classroom exams
(Kerkvliet & Sigmund, 1999).

52
Pulvers and Diekhoff (1999) reported that between 40% and 90% of college students
have committed academic dishonesty. His 10-year study on academic dishonesty at one
educational facility revealed an increase from 54% in 1984 to 61.2% in 1994. He examined two
broad categories on the issue of academic misconduct in college classrooms. The first was
internal personal variables and the second was external situational variables. Internal variables
were identified as differentiating between individuals who participated in cheating activities and
those who did not. These variables included cheaters who are less mature than non-cheaters and
cheaters with a lower moral development than those who do not cheat. Individuals who
participated in academic misconduct were more likely to have pre-conventional levels of moral
development; those who did not participate in academic misconduct were more likely to function
from post-conventional levels of moral development.
In pre-conventional moral development, choices were made by avoiding punishment and
looking for personal gain; post-conventional choices were moral decisions made by the student.
These choices where internal ethical principles and outweighed regard for personal benefits that
might have been gained by the individual student. Students who reported a higher level of work
ethic were less likely to engage in unethical educational behavior.
Pulvers and Diekhoff (1999) found that a student’s attitude regarding justifying or
neutralizing cheating played a significant role in their decision whether or not to cheat.
According to Pulvers and Diekhoff (1999), external variables greatly affect the student’s
decision to participate in academic misconduct. Faction association and pressure placed on the
student to achieve a high grade point average were shown to contribute to academic dishonesty
by students (Pulvers & Diekhoff, 1999).
53
Academic integrity has a fundamentally high educational value but does not prevent the
occurrence of student cheating on exams and assignments. Schmelkin, Gilbert, Spencer, Pincus,
and Silva (2008) found that estimations of student cheating exceed 50% at the college and high
school level. Schmelkin et al. (2008) stated that even when instructors said academic dishonesty
would not be tolerated in their classes, their actual response was little or no consequences for
students caught cheating. Schmelkin et al. (2008) evaluated data taken from a poll of students
showing that they were given no clear definition of academic dishonesty.
Roberts and Rabinowitz (1992) held the opinion that the way to change an environment
that is conducive to academic dishonesty is by clarifying the understanding of faculty and
students’ perception of academic dishonesty and the seriousness of the act. The rate of academic
dishonesty remains high. Numerous causes and correlations have been studied but most
researchers have looked at definitional issues of cheating by using self-report or direct measures.
An indirect method of evaluation may reveal a reasonable answer to the concerns of academic
dishonesty. The process does not confine the responder; instead, it gives several translations of
ideas on the topic. Multidimensional scaling gives a better comprehensive evaluation of
underlying ideas by college students related to cheating (Schmelkin et al., 2008).
Payne and Nantz (1994) identified best practices and initiatives that contribute to higher
education academic honesty. Immoral and unethical behavior by students occurs at many higher
education facilities. Students who participate in academic dishonesty cause the educational
process to be unsettled. These actions are tolerated by the faculty of institutions of higher
learning whose moral and ethical standing have been compromised. Faculty at these institutions
of higher learning soon become stressed and disconnected from the educational process and
eventually become discouraged and lose interest in education altogether.

54
Payne and Nantz (1994) found that 67% to 86% of undergraduate students had
participated in academic dishonesty while in college. A study by McCabe and Treviño in 1996
revealed that one out of three students participated in academic dishonesty. The World Wide
Web has given students a handy tool for use in college level plagiarism.
In a study conducted in 2002 by Hughes, Christian, Dayman, Kaufman, and Schmidt (as
cited in Boehm, Justice, & Weeks, 2009, p. 47), the results indicated that “80% of college and
university-bound high school students have cheated at least once.” Most of these students
reported that they viewed cheating as a regular occurrence and further did not see academic
dishonesty as a serious offense.
Institutions of higher learning, according to Boehm et al. (2009), are often lacking fixes
and giving insignificant penalties for academic dishonesty. Higher education has been negatively
impacted by the rise in academic dishonesty by the loss of production time, money, and the
reputation of the affected university. Boehm et al. (2009) found that university administrators
need to give their faculty training, provide the most current research on academic dishonesty, and
develop a university honor code that defines and provides examples of academic misconduct.
Institutions of higher learning should also develop specific penalties for students who are found
guilty of taking part in academic dishonesty; students must consider a zero-tolerance response
when it comes to academic dishonesty (Boehm et al., 2009).
Moberg, Sojka, and Gupta’s (2008) research identified the cheating strategies college
students are most likely to use and who is most likely to use them, (men versus women, business
majors versus other majors, and students with higher GPAs versus students with lower GPAs). In
a survey of 372 undergraduate students at a large midwestern university, students self-reported
on 18 cheating behaviors ranging from minor infractions such as “copied a homework

55
assignment” to more serious activities such as “taken a test for someone else.” The results
suggested that business majors and students with lower GPAs were more likely to engage in
dishonest academic behavior (Moberg et al., 2008).
Studies have found that in a typical situation, undergraduate students, male students,
students with a lower grade point average, students associated with fraternities and sororities,
students who take part in intercollegiate sports activities, and students who see cheating that is
not properly punished are more inclined to take part in academic dishonesty (eg: Bowers, 1964;
McCabe & Treviño, 1993, 1997; Storch & Storch, 2002; Whitley, 1998).
Gallant (2008) discussed a teaching and learning strategy to address academic
misconduct as another way to view the current rule-compliance and integrity strategies. This
strategy suggests that the quality of students’ academic work is impacted via their learning
environment. Gallant (2008) addressed misconduct by suggesting the need to also understand the
impact of societal forces on the learning environment.
Clement (2001) conducted research on a 10-year follow-up investigation at one
university, which revealed that, in 1984, 54% of polled students admitted to academic
dishonesty; in 1994 the percentage had increased to 61.2%. A study by Eskridge and Ames
(1993) found that when criminal justice students were polled and the results compared to other
students, there was no statistical difference related to academic dishonesty. The study results
showed that criminal justice students were more strongly influenced by their peer’s actions and
non-majors were more motivated by the possible consequences (Clement, 2001). In a study by
McCabe, Butterfield, and Treviño (2003), there were findings that academic dishonesty was
lower at institutions of higher learning with an honor code. An honor code, in and of itself, is not
sufficient to bring academic dishonesty under control (Clement, 2001).

56
The problem of academic dishonesty is pervasive nationwide in virtually every college
and university at both the undergraduate and graduate levels. Hamlin, Barczyk, Powell, and Frost
(2013) found that between 50% and 75% of college students have participated in some form of
academic dishonesty. Undergraduate students in colleges and institutions of higher learning have
reported that they committed acts of academic dishonesty and did not report other students who
they witnessed cheating in the classroom (Hamlin et al., 2013). These students also reported that
they thought it was permissible to cheat if the result was positive enough to justify the action,
which helped generate more cheating behaviors. Cheating has a negative impact on the
individual as well as the non-cheating student who witnesses the improper behavior.
There is no known universal idea or method for addressing the problem of academic
cheating within a particular department. Faculty instructors are usually the ones who address
academic dishonesty. According to Hamlin et al. (2013), some instructors do not wish to address
the issue because of the added responsibility of prosecuting a suspected case of academic
misconduct. A non-tenured instructor has even less of an interest in getting involved in the
pursuing of sanctions against students, as student end of semester evaluations have a direct
impact on the tenure track of an instructor. Students who do not participate in academic
dishonesty are at a disadvantage when students who cheat are not punished for their actions.
How the action is addressed is important because of a positive result from a negative incident
(Hamlin et al., 2013). A clearer understanding of this is that when a student is disciplined for acts
of academic dishonesty the offense has a negative impact. The punishment itself has a positive
effect because the student learns a valuable lesson from the incident and other students see that
the university and the instructor are not going to sit idly by with no response to dishonest acts.
57
McKibban and Burdsal (2013) found that academic dishonesty in the classroom is
increasing and troublesome for instructors. The cheating process has developed into something
like a business for individuals who are particularly talented at deception, just as the need for
higher test scores has led administrators and instructors to report false test data. This, along with
the rise in academic dishonesty, may give a false impression that society is more interested in
outcomes than learning.
Academic dishonesty is a motivational behavior of students. According to McKibban and
Burdsal (2013), a student must make a decision whether or not to take part in academic
dishonesty. A student’s decision to become involved in cheating is based more on the situation
than on ethics. Typically, a student will go through a series of decision-making concerns before
taking part in academic dishonesty: What are the odds of being caught? Can the student actually
carry out the dishonesty? What is the purpose of the unethical act? According to McKibban and
Burdsal (2013), academic dishonesty has increased over the past 30 years and it is estimated that
80% to 95% of students have participated in at least one incidence of academic dishonesty.
Classroom Practice: Are Teachers Creating Classroom Cheaters?
Lang (2013) stated that strategies put in place to stop academic dishonesty are centered
on a combination of fear, technology, and subterfuge. Institutions of higher learning employ anti-
plagiarism technology and a threat of severe ramifications for those caught cheating. According
to Lang (2013), another tactic used by instructors is to assure that class examinations are secured
until the time of the exam. Lang (2013) found evidence to suggest that the instructor should
evaluate the classroom environment. Gathering data on cheating is somewhat difficult because a
clear definition of academic dishonesty is nonexistent; an instructor’s discretionary response to
incidences can further have an effect on data collection (Lang, 2013).

58
Economist Ariely (as cited in Lang, 2013) has written what has been identified as “the
structure of their daily environment.” In his writings Ariely makes the point that the most
relevant factor in the determination of whether academic dishonesty will be carried out by a
student is directly controlled by the instructor by way of the design and structure of the learning
environment (Lang, 2013). The instructor’s daily practices can also affect a student’s decision to
cheat. There are additional factors that occur in a learning environment that influence academic
dishonesty such as instructors giving multiple low-stakes examinations, instructors implementing
multiple ways to share learning with the students, and instructors offering multiple opportunities
for the students to have knowledge of their academic standing in the class (Lang, 2013).
The Educator’s Role in Promoting Academic Integrity
Research on academic dishonesty has been conducted for years; the earliest research was
conducted in schools of education and educational psychology. According to Hulsart and
McCarthy (2009), a study conducted in 1941 revealed that the intense competition for higher
grades is a significant motivator for academic misconduct. Honor codes were created as a
response to the existing issue of academic dishonesty. The probability of cheating was greatly
affected by a student’s self-evaluation and ideas on his or her ability to succeed academically.
Students with high confidence levels were less likely to engage in academic dishonesty.
The most creative means of addressing academic dishonesty occurs when an instructor
maintains a learning environment that gives students minimal opportunities to cheat. Open book
exams, collaborative assessments, and in-class writing and research assignments are used in a
setting where students are less inclined to take part in academic dishonesty (Hulsart &
McCarthy, 2009).

59
The Theory of Planned Behavior
Coren (2012) conducted a study focused on educators who responded to academic
integrity violations and made use of the theory of planned behavior model that predicts the
decision of whether or not educators had a face-to-face meeting with a student accused of
cheating. The study showed that dishonesty at colleges and institutions of higher learning is a
major problem across the US. Inappropriate conduct and the nature of the problem have been
detailed by newspapers such as in the Kansas City Star article “High-Tech Tools Assist Today’s
Student Cheaters” (Fussell, 2005). Fussell (2005) identified plagiarism at an Ohio university and
in other colleges. He stated that earlier theory indicated the intent to cheat was the best predictor
of behavior and the intent could be predicted by examining attitudes and the subjective norms.
According to Coren (2012), the theory of planned behavior predicted that 43% of faculty
members had the intent to speak face-to-face with a student suspected of cheating.
The Role of the Code of Conduct
Results of a survey by Rezaee, Elmore and Szendi (2001) revealed that college codes of
conduct tended to gravitate toward a “low road” approach. Rezaee et al. (2001) found that there
were plausible changes that could be made to university codes of conduct including a greater
emphasis on stopping academic fraud, scientific fraud, and financial fraud; faculty involvement
in the processes; and the establishment of procedures for employing a code of conduct. Codes of
conduct are mostly generated with a “high road” or a “low road” design. A high road design is
proactive in ethics and focuses on the idea of doing the right thing; the emphasis is centered on
organizational and personal behaviors that are made up of self-respect. The low road design
addresses ethical issues that adhere to faculty rules; low road codes are reactive, legal, and
administrative ways to avoid improper activities. Direct approaches to improper activities

60
involve acts that focus on the improper acts, make clear what improper acts are, and make
attempts to curtail it. The act is then punished by the imposing of sanctions. Indirect sanctions
aim for an ethical response and an eventual outcome in an indirect manner by trying for
proximate and attainable goals (Rezaee et al., 2001).
Honor Codes and Other Contextual Influences
McCabe and Treviño (1993) conducted a study regarding honor codes and academic
dishonesty. They addressed the effectiveness of a university’s honor code at deterring academic
dishonesty. The study compared institutions of higher learning with honor codes in place to
institutions of higher learning that do not have honor codes in place (McCabe & Treviño, 1993).
With other variables taken into account, there have been numerous studies that documented 13%
to 95% of college students engaged in academic dishonesty at some level. The difference in each
of the studies was the stage of the analysis conducted by the researchers. One approach
addressed differences on an individual basis that appeared to predict academic dishonesty
behaviors. These areas included self-esteem, a competitive striving for achievement, work types
concerning ethics, grade point average, and sexual category (McCabe & Treviño, 1993). Other
studies into academic dishonesty emphasized institutional levels of an analysis. These studies
evaluated context facts such as sanction threats, responses of staff to academic dishonesty, and
honor codes (McCabe & Treviño, 1993).
The use of an honor code at a university could have an impact on dishonest activities
because the addition of an honor code system allows administrators and staff a way to mold
student behaviors throughout the student population. Other studies have shown that an honor
code has had an impact on student academic integrity (eg: Bowers, 1964; McCabe & Treviño,
1993; McCabe, Treviño, & Butterfield, 1999). There is little research on the individual’s feelings
61
and ideas about an honor code and how the application of such a code could help the student
decide on academic honesty.
The application of an honor code in an educational environment helps mold and enhance
the student’s values and ethics (McCabe et al., 1999). McCabe et al. (1999) revealed that the
character, general attitude, and overall behavior of students are positive and remain with them
throughout their college career. Students at institutions of higher learning with an honor code in
place, have less chance of using outside pressures to justify reasons for academic dishonesty;
students are more inclined to refer to the honor code at their institutions of higher learning as a
very important aspect of their integrity (McCabe et al., 1999).
Gallant (2008) addressed the issue of academic dishonesty and suggested new ways to
approach it. Gallant also included an overview of how responses to misconduct have evolved
over time. She outlined the rise of honor codes and the ways rules have been implemented to
confront the issues of academic dishonesty. Gallant (2008) included ways academic misconduct
has been handled and suggested a duty to intervene that uses a strategy involving honor codes.
These codes have a great emphasis on the consequences of committing academic dishonesty and
the principles of academic integrity as an important mission for the institution.
Implications for Practice
According to Aiken (1991), academic dishonesty is among the top threats to a student’s
attainment of growth, emotional and social personalities, and moral standards. Academic
dishonesty stunts engagement in the learning process and the positive development of morals.
Genereux and McLeod (1995) found a connection involving student desire for high grades,
carrier opportunities, and academic dishonesty. Students placed academic dishonesty on a cost
reward platform and decided to cheat based on the cost of getting caught as weighed against the
62
benefits of enhanced performance. Academic misconduct policies that are strict, well publicized,
and enforced on a consistent basis may be an effective deterrent for students not to cheat.
In qualitative interviews, the most common excuses given for cheating were uninteresting
assignments and the student’s belief that the teacher did not care about the subject being taught.
If the student perceived that the teacher was not helpful or if the student had trouble
understanding the teacher, the student was more likely to become involved in academic
dishonesty (Hensley, 2013).
As an individual goes through life he or she has multiple opportunities to be involved
with communally unaccepted rules of conduct (Hollinger & Lanza-Kaduce, 1996). Hollinger and
Lanza-Kaduce (1996) defined dishonesty as a violation of an ethical and moral expectation.
Educational settings provide a societal body that tests a person’s predisposition for academic
dishonesty (Hollinger & Lanza-Kaduce, 1996). Studies in academic dishonesty have been
conducted as far back as the year 1928. Hollinger and Lanza-Kaduce (1996) conducted an
investigative study that determined that dishonesty does not rely on the power of the participant’s
moral nature in and of itself; social context was also found to have an effect on dishonesty
(Hollinger & Lanza-Kaduce, 1996).
Hollinger and Lanza-Kaduce (1996) chose to study self-reported occurrence and
frequency of cheating in an academic setting. The participants were attendees at a public
university in the southeast and the study was over a single semester. Another aspect of this
investigational study was to assess the professed efficiency of numerous countermeasures
regularly used to curtail cheating. Results were determined by comparing the judgment of the
participants who reported being involved in academic dishonesty and the other participants who
failed to report such actions (Hollinger & Lanza-Kaduce, 1996). At the conclusion of the study,

63
the researchers found that 68.1% of the participants had taken part in academic dishonesty on at
least one occasion during the semester (Hollinger & Lanza-Kaduce, 1996). A total of 21.7% of
the participants disclosed that they took part in numerous forms of academic dishonesty on six or
more occasions during the semester (Hollinger & Lanza-Kaduce, 1996).
Psychologically oriented writings on academic dishonesty focus on the student who is
involved in academic dishonesty and their individual traits (Hollinger & Lanza-Kaduce, 1996).
Studies that are defined as sociological or educational have their reliance on institutional or
situational factors. Teachers who trusted their students to not participate in academic dishonesty
saw a higher rate of cheating in their classroom. A moral plea had absolutely no positive
deterrent effect on students participating in academic dishonesty. The study further revealed that
academic dishonesty decreased when the instructor gave a credible threat of punishment and
exposure for cheating (Hollinger & Lanza-Kaduce, 1996).
Summary
Academic dishonesty has been an issue in society for several thousand years. The earliest
documented instances were in China with individuals taking employment exams (Bushway &
Nash, 1977). Over the years, studies have shown that students in educational settings ranging
from elementary to graduate school frequently participate in academic dishonesty. Research
studies further indicate that students do not have the opinion that such actions are inappropriate.
Studies that were carried out in the middle part of the 20th century showed that if certain
parameters were present, an individual would be less inclined to take part in illegal or
inappropriate activities. Studies on academic dishonesty have revealed a wide variety of reasons
that students cheat. The percentage of college students who engage in academic dishonesty
ranged from 9% to 90% in cited studies.
64
CHAPTER 3
RESEARCH METHOD
The purpose of this study was to determine if there is a relationship between
undergraduate students’ attitudes toward academic dishonesty as measured by responses on the
Attitudes and Perceptions of Academic Dishonesty survey, a set of demographic (gender and
age), and academic variables (classification, GPA, and major). This chapter provides the research
method selected for the study and provides an overview of procedures and data collection
methods. The quality of the research design, data management, data collection, and data analysis.
Study Design
This quantitative study used a survey design. Quantitative research is a formal, objective,
systematic procedure for obtaining quantifiable information about the situation that is being
investigated; the information is presented in numerical form and analyzed using statistics.
Students from three institutions of higher education participated in this study; a 4-year public
university, a 4-year private university, and a 2-year public college. The two participating
universities and the college were located in the Southeastern United States.
To attain a more considerable perspective of the possible connection involving college
student demographics, it is important to measure their perception of punishment on academic
dishonesty. As such, a quantitative non-experimental research design was selected for this study.
The information produced through quantitative research emphasizes labeling and calculating an
occurrence, while “maximizing objectivity by using numbers, statistics, structure, and control”
(McMillan & Schumacher, 2010, p. 21). This research design is typically known as non-
experimental research. Non-experimental research designs “examine [the] relationship between
different phenomena without any direct manipulation of conditions that are experienced”
65
(McMillan & Schumacher, 2010, p. 22). For this study, a non-experimental research design was
used with a pen and paper handout survey instrument having Likert-type responses.
Research Questions and Corresponding Null Hypotheses
Six research questions defined this study. The six research questions and five
corresponding null hypotheses were:
1. Is there a significant difference in the mean scores for each of the dimensions on the
Attitudes and Perceptions of Academic Dishonesty survey (Dimension 1- Use of
Technology, Dimension 2- Perceptions of Policy, Dimension 3- Instructor Consequences,
Dimension 4- Student Consequences, and Dimension 5- Student Conduct) among
participating institutions of higher education?
Ho11: There is no significant difference in the mean scores for Dimension 1- Use of
Technology on the Attitudes and Perceptions of Academic Dishonesty survey
among participating institutions of higher education.
Ho12: There is no significant difference in the mean scores for Dimension 2- Perceptions
of Policy on the Attitudes and Perceptions of Academic Dishonesty survey among
participating institutions of higher education.
Ho13: There is no significant difference in the mean scores for Dimension 3- Instructor
Consequences on the Attitudes and Perceptions of Academic Dishonesty survey
among participating institutions of higher education.
Ho14: There is no significant difference in the mean scores for Dimension 4- Student
Consequences on the Attitudes and Perceptions of Academic Dishonesty survey
among participating institutions of higher education.

66
Ho15: There is no significant difference in the mean scores for Dimension 5- Student
Conduct on the Attitudes and Perceptions of Academic Dishonesty survey among
participating institutions of higher education.
2. Is there a significant difference in the mean scores for each of the dimensions on the
Attitudes and Perceptions of Academic Dishonesty survey (Dimension 1- Use of
Technology, Dimension 2- Perceptions of Policy, Dimension 3- Instructor Consequences,
Dimension 4- Student Consequences, and Dimension 5- Student Conduct) between male
and female undergraduate students?
Ho21: There is no significant difference in the mean scores for Dimension 1- Use of
Technology on the Attitudes and Perceptions of Academic Dishonesty survey
between male and female undergraduate students.
Ho22: There is no significant difference in the mean scores for Dimension 2- Perceptions
of Policy on the Attitudes and Perceptions of Academic Dishonesty survey
between male and female undergraduate students.
Ho23: There is no significant difference in the mean scores for Dimension 3- Instructor
Consequences on the Attitudes and Perceptions of Academic Dishonesty survey
between male and female undergraduate students.
Ho24: There is no significant difference in the mean scores for Dimension 4- Student
Consequences on the Attitudes and Perceptions of Academic Dishonesty survey
between male and female undergraduate students.
Ho25: There is no significant difference in the mean scores for Dimension 5- Student
Conduct on the Attitudes and Perceptions of Academic Dishonesty survey
between male and female undergraduate students.

67
3. Is there a significant difference in the mean scores for each of the dimensions on the
Attitudes and Perceptions of Academic Dishonesty survey (Dimension 1- Use of
Technology, Dimension 2- Perceptions of Policy, Dimension 3- Instructor Consequences,
Dimension 4- Student Consequences, and Dimension 5- Student Conduct) among
traditional age students (18-24) and nontraditional age students (25-52)?
Ho31: There is no significant difference in the mean scores for Dimension 1- Use of
Technology on the Attitudes and Perceptions of Academic Dishonesty survey
among traditional age students (18-24) and nontraditional age students (25-52).
Ho32: There is no significant difference in the mean scores for Dimension 2- Perceptions
of Policy on the Attitudes and Perceptions of Academic Dishonesty survey among
traditional age students (18-24) and nontraditional age students (25-52).
Ho33: There is no significant difference in the mean scores for Dimension 3- Instructor
Consequences on the Attitudes and Perceptions of Academic Dishonesty survey
among traditional age students (18-24) and nontraditional age students (25-52).
Ho34: There is no significant difference in the mean scores for Dimension 4- Student
Consequences on the Attitudes and Perceptions of Academic Dishonesty survey
among traditional age students (18-24) and nontraditional age students (25-52).
Ho35: There is no significant difference in the mean scores for Dimension 5- Student
Conduct on the Attitudes and Perceptions of Academic Dishonesty survey among
traditional age students (18-24) and nontraditional age students (25-52).
4. Is there a significant difference in the mean scores for each of the dimensions on the
Attitudes and Perceptions of Academic Dishonesty survey (Dimension 1- Use of
Technology, Dimension 2- Perceptions of Policy, Dimension 3- Instructor Consequences,

68
Dimension 4- Student Consequences, and Dimension 5- Student Conduct) among
academic classification (Freshman, Sophomore, Junior, or Senior)?
Ho41: There is no significant difference in the mean scores for Dimension 1- Use of
Technology on the Attitudes and Perceptions of Academic Dishonesty survey
among academic classification (Freshman, Sophomore, Junior, or Senior).
Ho42: There is no significant difference in the mean scores for Dimension 2- Perceptions
of Policy on the Attitudes and Perceptions of Academic Dishonesty survey among
academic classification (Freshman, Sophomore, Junior, or Senior).
Ho43: There is no significant difference in the mean scores for Dimension 3- Instructor
Consequences on the Attitudes and Perceptions of Academic Dishonesty survey
among academic classification (Freshman, Sophomore, Junior, or Senior).
Ho44: There is no significant difference in the mean scores for Dimension 4- Student
Consequences on the Attitudes and Perceptions of Academic Dishonesty survey
among academic classification (Freshman, Sophomore, Junior, or Senior).
Ho45: There is no significant difference in the mean scores for Dimension 5- Student
Conduct on the Attitudes and Perceptions of Academic Dishonesty survey among
academic classification (Freshman, Sophomore, Junior, or Senior).
5. Is there a significant difference in the mean scores for each of the dimensions on the
Attitudes and Perceptions of Academic Dishonesty survey (Dimension 1- Use of
Technology, Dimension 2- Perceptions of Policy, Dimension 3- Instructor Consequences,
Dimension 4- Student Consequences, and Dimension 5- Student Conduct) among
students grouped by declared major (Criminal Justice or other)?
69
Ho51: There is no significant difference in the mean scores for Dimension 1- Use of
Technology on the Attitudes and Perceptions of Academic Dishonesty survey
among students grouped by declared major (Criminal Justice or other).
Ho52: There is no significant difference in the mean scores for Dimension 2- Perceptions
of Policy on the Attitudes and Perceptions of Academic Dishonesty survey among
students grouped by declared major (Criminal Justice or other).
Ho53: There is no significant difference in the mean scores for Dimension 3- Instructor
Consequences on the Attitudes and Perceptions of Academic Dishonesty survey
among students grouped by declared major (Criminal Justice or other).
Ho54: There is no significant difference in the mean scores for Dimension 4- Student
Consequences on the Attitudes and Perceptions of Academic Dishonesty survey
among students grouped by declared major (Criminal Justice or other).
Ho55: There is no significant difference in the mean scores for Dimension 5- Student
Conduct on the Attitudes and Perceptions of Academic Dishonesty survey among
students grouped by declared major (Criminal Justice or other).
6. Is there a significant difference in the mean scores for each of the dimensions on the
Attitudes and Perceptions of Academic Dishonesty survey (Dimension 1- Use of
Technology, Dimension 2- Perceptions of Policy, Dimension 3- Instructor Consequences,
Dimension 4- Student Consequences, and Dimension 5- Student Conduct) between
students grouped by self-reported grade point average (GPA: 2.00-3.00, 3.01-4.00)?
Ho61: There is no significant difference in the mean scores for Dimension 1- Use of
Technology on the Attitudes and Perceptions of Academic Dishonesty survey

70
between students grouped by self-reported grade point average (GPA: 2.00-3.00,
3.01-4.00).
Ho62: There is no significant difference in the mean scores for Dimension 2- Perceptions
of Policy on the Attitudes and Perceptions of Academic Dishonesty survey
between students grouped by self-reported grade point average (GPA: 2.00-3.00,
3.01-4.00).
Ho63: There is no significant difference in the mean scores for Dimension 3- Instructor
Consequences on the Attitudes and Perceptions of Academic Dishonesty survey
between students grouped by self-reported grade point average (GPA: 2.00-3.00,
3.01-4.00).
Ho64: There is no significant difference in the mean scores for Dimension 4- Student
Consequences on the Attitudes and Perceptions of Academic Dishonesty survey
between students grouped by self-reported grade point average (GPA: 2.00-3.00,
3.01-4.0).
Ho65: There is no significant difference in the mean scores for Dimension 5- Student
Conduct on the Attitudes and Perceptions of Academic Dishonesty survey
between students grouped by self-reported grade point average (GPA: 2.00-3.00,
3.01-4.0).

71
Instrument
The data collection tool was a survey developed by the researcher that was distributed to
undergraduate college students over 3 weeks (see Appendix A for the survey instrument). There
are five (5) noted dimensions listed on the survey instrument: (Dimension 1- Use of Technology,
Dimension 2- Perceptions of Policy, Dimension 3- Instructor Consequences, Dimension 4-
Student Consequences, and Dimension 5- Student Conduct) among traditional age students (18-
24) and nontraditional age students (25-52) (see Appendix B for dimension and survey
information). The survey instrument further has a set of demographic (gender and age) and
academic variables (academic classification, declared major, and GPA).
Approval for the study was received from the three institutions where data collection
occurred. Permission to conduct the research was obtained from the 4-year public university's
Institutional Review Board (IRB). The private 4-year university and the 2-year public college
granted written permission to conduct the research on their respective campuses.
Questions on the survey were created from consultation with dissertation committee
members and a review of sample questions from related survey instruments. The questions were
formulated and structured to fit the investigated topic. A 6-point Likert-type scale was used to
measure agreement with each statement; the scale ranged from 1 to 6: (1) strongly agree, (2)
somewhat agree, (3) agree, (4) disagree, (5) somewhat disagree, (6) strongly disagree.
There were 22 items on the survey instrument (see Appendix A). Individuals responding
to the survey instrument indicated one of the listed responses under each item. The survey had
five dimensions.

72
Dimension 1- Use of Technology (addresses advancements in technology and
opinions as to whether such advancements have made student involvement in
academic dishonesty more prevalent in institutions of higher learning)
Dimension 2- Perceptions of Policy (addresses students’ ideas and understandings of
their institution of higher learning’s policy on academic dishonesty)
Dimension 3- Instructor Consequences (addresses instructors’ response to incidences
of academic dishonesty that occurred at institutions of higher learning)
Dimension 4- Student Consequences (addresses what will befall the student should he
or she be caught in the act of academic dishonesty and which consequences will best
curtail academic dishonesty in institutions of higher learning)
Dimension 5- Student Conduct (addresses how the conduct of one student can have an
effect on other students in a classroom setting whereby one student taking part in
academic dishonesty and another student having knowledge of this action could cause
the second student to become involved in academic dishonesty).
Survey Development
The survey was developed by the researcher. However, the literature played a prominent
role in the selection of items. Activities that contributed to the development of the survey
included having a group of experienced researchers review the items and using a group of
undergraduate students to review the survey for grammar, spelling, and overall understandability
of the items. As the data collection instrument was created by the researcher, there was a form of
survey development conducted on the document. An assessment of the survey instrument was
accomplished by allowing several individuals who are considered experts in the field to evaluate
the items and provide constructive criticism prior to distribution of the instrument. The survey

73
was also pre-tested with a group of students to evaluate it for grammar, spelling, and overall
understandability of each question. These steps were done in lieu of a pilot testing process.
Validity
Face and content validity were established by using a panel of experts in survey
development to review the questionnaire for appropriate items. Content validity was also
evaluated by reviewing the literature on academic dishonesty. This review of relevant literature
guided development of the items that were included. After data collection, a factor analysis
helped establish construct validity of the instrument.
Internal validity is defined as a means of how well conclusions match reality and how
well they portray the issue at hand (Blake, Heslin, & Curtis, 1996; Cohen, Manion, & Morrison,
2000; Creswell, 2003; Denscombe, 1998; Merriam, 2001). Internal validity can be strengthened
by several actions including peer examination and management of biases in the beginning stages
of the study (Cohen et al., 2000; Creswell, 2003; Denscombe, 1998; Merriam, 2001).
Reliability
Reliability can be defined as dependable, consistent, replicable, and also accurate over
time (Cohen et al., 2000; Merriam, 2001). “Reliability includes reliability to real life, simulation
and content specificity, comprehensiveness, authenticity, detail, depth of response, and
meaningfulness to the respondents” (Cohen et al., 2000, p. 120).
Internal consistency reliability is a measure of reliability used to evaluate the degree to which
different items that probe the same construct produce similar results. Split-half reliability
methodology was used to measure internal consistency reliability. The process of obtaining split-
half reliability was begun by splitting in half all items of the survey that were intended to probe
the same area of knowledge and form two sets of items. The entire survey was administered to
74
all participants, the total score for each set was computed, and the split-half reliability was
obtained by determining the correlation between the two total set scores. Two internal
consistency estimates of reliability were computed for the Attitudes and Perceptions of
Academic Dishonesty scale: a split-half coefficient expressed as a Spearman-Brown corrected
correlations and the coefficient alpha. For the split-half coefficient, the scale was split into two
halves so that the two halves was equivalent as possible. Values for the coefficient alpha and the
split-half coefficient were .68.
The format for study participants to respond during the data collection process was
accomplished by the individuals completing the document on the day that it was distributed. This
distribution and collection model ensured that a significant number of the surveys were
completed and remitted for evaluation.
Sample
The sample for this study was derived from the students enrolled in classes in the
participating departments (Criminal Justice, and others including education, political science,
biology, accounting, business, computer science, nursing, social work, psychology, and
undecided) at the chosen institutions of higher learning. The population was not known or
identified prior to the distribution of the survey. Each student who agreed to participate in the
survey was part of the population based solely on the fact that he or she registered for a particular
course. The size of the population surveyed was based on six sub-sections of the target
population and the major characteristics of the identified target population:
1. Each student was at least 18 years of age;
2. The students indicated either male or female;
75
3. Students were classified as an undergraduate, meaning that they were classified
by university standards as being a freshman, sophomore, junior, or senior;
4. The survey sample was defined by the student’s major department inside the
university;
Data Collection
The survey contained questions selected by the investigator. These questions were
developed during multiple face-to-face meetings with the investigator’s dissertation chair and
approved by the dissertation committee. Survey questions were also reviewed by a professional
thesis and dissertation reader employed by East Tennessee State University. After some
modifications, the survey was reviewed by an instructor at the private 4-year university and a
class of students who evaluated the survey and made notations on each question as to
understandability, clarity, proper grammatical presence, and punctuation. Upon receiving the
evaluations, the investigator altered the survey document and met with several college instructors
to evaluate the survey questions. The educational professionals were all asked to evaluate the
document for understandability, clarity, grammar, and punctuation. By design, none of the
questions could identify the participants in any way. Use of a pen and paper handout-style survey
augmented the privacy and confidentiality of the participants because the researcher had no way
to identify individuals or their responses.
Survey packets were hand delivered to each of the classes by the investigator. This
method was effective in reaching the targeted population. A letter describing the intent of the
study, a description of the survey, and the rights and privileges of the participating students was
either attached to the front of the survey or read aloud to each student chosen for the survey (see

76
Appendix D). Surveys were distributed to participants in each class and collected by the
investigator after the surveys had been completed.
Data Analysis
The independent variables were gender, age, academic classification, academic major,
self-reported GPA. The dependent variables (five dimensions measured on the
survey(Perceptions of Policy, Student Consequences, Instructor Consequences, Student Conduct,
and Use of Technology) used Likert-type scales measured on an approximate interval level to
provide scores for each dimension.
One of the six research questions and the related null hypotheses were analyzed using
one-way analysis of variance (ANOVA). ANOVA is most appropriate to use when the
independent variable is measured on a nominal level and the dependent variable is measured on
an interval or ratio level. ANOVA is a two-tailed test and any significant differences found using
the ANOVA statistic were analyzed with the Tukey Honestly Significant Differences (HSD)
post-hoc test to determine exactly where significant differences occurred within the independent
variable attributes. The remaining five research questions were analyzed using an independent
samples t-test. An independent samples t-test evaluates the difference between the means of two
independent groups. Each case must have scores on two variables – the grouping variable and the
test variable. The grouping variable divides the cases into two mutually exclusive categories.
A statistical package (IBM-SPSS) was used to analyze the data. Answers on the survey
instrument were coded and entered into SPSS and subjected to univariate frequency distribution
analysis and ANOVA. Depending on the return rate of the sample of respondents and range of
variability of responses, some variable attributes were re-coded and collapsed into smaller
variable attribute categories. All data were examined at the .05 level of significance.
77
Chapter Summary
The purpose of this chapter is to describe the research method and further discuss the
design of this study. This chapter includes an explanation of the sample selection, the procedure
used to design the instrument and collect data, and the statistical procedures used to analyze data.
The chapter began with a statement of the six research questions that guided this study. It
continued with a detailed description of the selected data set and a general description of the
research design and methodologies used throughout the study. Chapter 4 of the study presents an
analysis of collected data as well as a description of the methods used to evaluate data. Chapter 5
contains the summary, conclusion, and recommendations for practice and further research.
78
CHAPTER 4
FINDINGS
In this chapter, data are presented and analyzed to answer the six research questions and
their five corresponding null hypotheses. A pen-and-paper survey was used to gather the
information that was later transformed into numerical code and entered as data. There are 22
items on the survey instrument (Appendix A). The response format for most questions consisted
of listed items having six possible responses ranging from strongly agree to strongly disagree.
Individuals responding to the instrument indicated one of the listed responses under each item.
Data were retrieved following the execution of an in-person survey. The sample for this study
was derived from the students enrolled in a class in the departments that chose to participate
(Criminal Justice and others) at three participating institutions of higher learning. Each student
who agreed to participate in the survey was part of the population based solely on the fact that he
or she registered for a particular course. There were 328 surveys distributed and collected by the
investigator to chosen courses of instruction. There were 116 student responses gathered from a
4-year private university, 103 student responses gathered from a 2-year public college, and 109
student responses gathered from a 4-year public university. All of the responses were valid and
fit the perquisites for inclusion in the survey. These perquisites were that each student was at
least 18 years of age and each student was registered as an undergraduate.
79
Research Question 1
Is there a significant difference in the mean scores for each of the dimensions on the
Attitudes and Perceptions of Academic Dishonesty survey (Dimension 1- Use of Technology,
Dimension 2- Perceptions of Policy, Dimension 3- Instructor Consequences, Dimension 4-
Student Consequences, and Dimension 5- Student Conduct) among participating institutions of
higher education?
Ho11: There is no significant difference in the mean scores for the Dimension 1- Use of
Technology on the Attitudes and Perceptions of Academic Dishonesty survey
among participating institutions of higher education.
A one-way analysis of variance (ANOVA) was conducted to determine if there was a
significant difference in the mean scores for Dimension 1 among the three types of institutions.
The factor variable – type of institution – included three levels (4-year private, 2-year public, and
4-year public). The dependent variable was the mean score on Dimension 1 of the survey. The
ANOVA was not significant, F(2, 325) = .46, p = .632. Therefore, Ho11 was retained. The scores
on Dimension 1 for the three types of institutions were similar. Effect size was assessed by
was <.01. The means and standard deviations for the groups are reported in Table 1.

80
Table 1
Means and Standard Deviations for Type of Institutions for Dimension 1
Type of Institution N M SD
Private 4-Year 116 19.10 3.38
Public 2-Year 103 18.83 3.31
Public 4-Year 109 18.68 3.40
Ho12: There is no significant difference in the mean scores for the Dimension 2-
Perceptions of Policy on the Attitudes and Perceptions of Academic Dishonesty
survey among participating institutions of higher education.
A one-way analysis of variance (ANOVA) was conducted to determine if there was a
significant difference in the mean scores for Dimension 2 among the three types of institutions.
The factor variable – type of institution – included three levels (4-year private, 2-year public, and
4-year public). The dependent variable was the mean score on dimension 2 of the survey. The
ANOVA was not significant, F(2, 325) = .58, p = .560. Therefore, Ho12 was retained. The mean
scores on Dimension 2 for the three types of institutions were similar. Effect size assessed by
was <.01. The means and standard deviations for the groups are reported in Table 2.
Table 2
Means and Standard Deviations for Type of Institutions for Dimension 2
Type of Institution N M SD
Private 4-Year 116 11.6 2.13
Public 2-Year 103 10.92 2.25
Public 4-Year 109 10.86 2.31
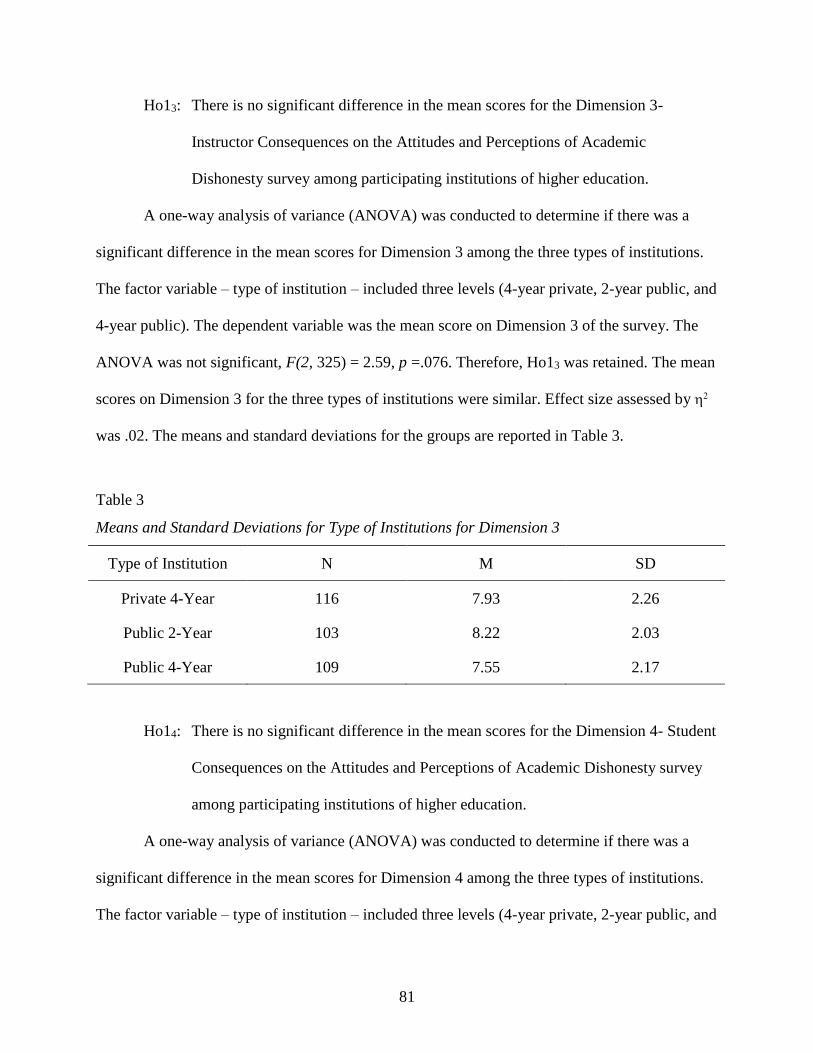
81
Ho13: There is no significant difference in the mean scores for the Dimension 3-
Instructor Consequences on the Attitudes and Perceptions of Academic
Dishonesty survey among participating institutions of higher education.
A one-way analysis of variance (ANOVA) was conducted to determine if there was a
significant difference in the mean scores for Dimension 3 among the three types of institutions.
The factor variable – type of institution – included three levels (4-year private, 2-year public, and
4-year public). The dependent variable was the mean score on Dimension 3 of the survey. The
ANOVA was not significant, F(2, 325) = 2.59, p =.076. Therefore, Ho13 was retained. The mean
scores on Dimension 3 for the three types of institutions were similar. Effect size assessed by
was .02. The means and standard deviations for the groups are reported in Table 3.
Table 3
Means and Standard Deviations for Type of Institutions for Dimension 3
Type of Institution N M SD
Private 4-Year 116 7.93 2.26
Public 2-Year 103 8.22 2.03
Public 4-Year 109 7.55 2.17
Ho14: There is no significant difference in the mean scores for the Dimension 4- Student
Consequences on the Attitudes and Perceptions of Academic Dishonesty survey
among participating institutions of higher education.
A one-way analysis of variance (ANOVA) was conducted to determine if there was a
significant difference in the mean scores for Dimension 4 among the three types of institutions.
The factor variable – type of institution – included three levels (4-year private, 2-year public, and
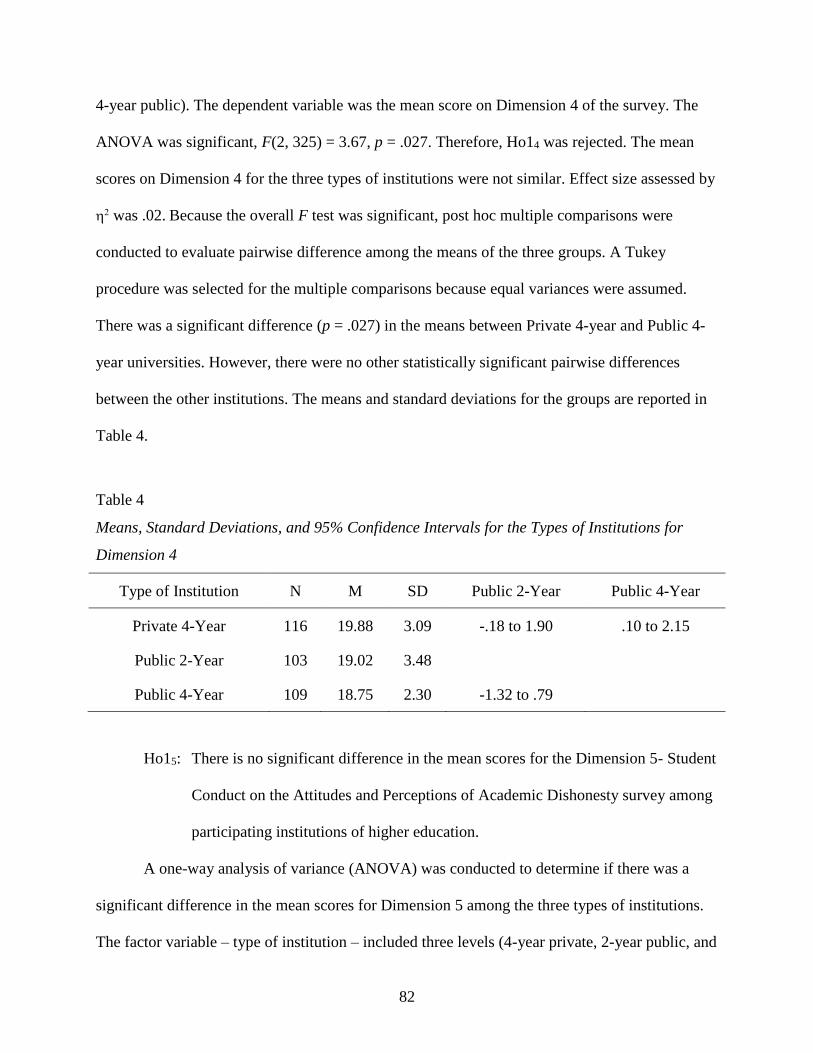
82
4-year public). The dependent variable was the mean score on Dimension 4 of the survey. The
ANOVA was significant, F(2, 325) = 3.67, p = .027. Therefore, Ho14 was rejected. The mean
scores on Dimension 4 for the three types of institutions were not similar. Effect size assessed by
was .02. Because the overall F test was significant, post hoc multiple comparisons were
conducted to evaluate pairwise difference among the means of the three groups. A Tukey
procedure was selected for the multiple comparisons because equal variances were assumed.
There was a significant difference (p = .027) in the means between Private 4-year and Public 4-
year universities. However, there were no other statistically significant pairwise differences
between the other institutions. The means and standard deviations for the groups are reported in
Table 4.
Table 4
Means, Standard Deviations, and 95% Confidence Intervals for the Types of Institutions for
Dimension 4
Type of Institution N M SD Public 2-Year Public 4-Year
Private 4-Year 116 19.88 3.09 -.18 to 1.90 .10 to 2.15
Public 2-Year 103 19.02 3.48
Public 4-Year 109 18.75 2.30 -1.32 to .79
Ho15: There is no significant difference in the mean scores for the Dimension 5- Student
Conduct on the Attitudes and Perceptions of Academic Dishonesty survey among
participating institutions of higher education.
A one-way analysis of variance (ANOVA) was conducted to determine if there was a
significant difference in the mean scores for Dimension 5 among the three types of institutions.
The factor variable – type of institution – included three levels (4-year private, 2-year public, and

83
4-year public). The dependent variable was the mean score on Dimension 5 of the survey. The
ANOVA was not significant, F(2, 325) =.05, p =.949. Therefore, Ho15 was retained. The mean
scores on Dimension 5 for the three types of institutions were similar. Effect size assessed by
was <.01. The means and standard deviations for the groups are reported in Table 5.
Table 5
Means and Standard Deviations for Type of Institutions for Dimension 5
Type of Institution N M SD
Private 4-Year 116 13.96 2.92
Public 2-Year 103 13.88 2.63
Public 4-Year 109 13.83 2.97
Research Question 2
Is there a significant difference in the mean scores for each of the dimensions on the
Attitudes and Perceptions of Academic Dishonesty survey (Dimension 1- Use of Technology,
Dimension 2- Perceptions of Policy, Dimension 3- Instructor Consequences, Dimension 4-
Student Consequences, and Dimension 5- Student Conduct) between male and female
undergraduate students?
Ho21: There is no significant difference in the mean scores for Dimension 1- Use of
Technology on the Attitudes and Perceptions of Academic Dishonesty survey
between male and female undergraduate students.
An independent-samples t-test was conducted to evaluate whether the mean scores on
Dimension 1 (Use of Technology) of the survey were significantly different between male and
female undergraduate students. Dimension 1 was the test variable and the grouping variable was
84
male or female. The test was not significant, t(326) = 1.52, p = .129. Therefore, Ho21 was
retained. The index was .01, which indicated a small effect size. Males (M = 18.59, SD = .51)
and Females (M = 19.16, SD = 3.19) tended to score about the same on the use of technology
dimension of the survey. The 95% confidence interval for the difference in means was -1.29 to .17.
Ho22: There is no significant difference in the mean scores for Dimension 2- Perceptions
of Policy on the Attitudes and Perceptions of Academic Dishonesty survey
between male and female undergraduate students.
An independent-samples t test was conducted to evaluate whether the mean scores on
Dimension 2 (Perceptions of Policy) of the survey were significantly different between male and
female undergraduate students. Dimension 2 was the test variable and the grouping variable was
male or female. The test was not significant, t(326) = 1.24, p= .215. Therefore, Ho22 was
retained. The index was .01, which indicated a small effect size. Males (M = 11.14, SD =
2.39) and Females (M = 10.84, SD = 2.04) tended to score about the same on the perceptions of
policy dimension of the survey. The 95% confidence interval for the difference in means was -.18
to .79.
Ho23: There is no significant difference in the mean scores for Dimension 3- Instructor
Consequences on the Attitudes and Perceptions of Academic Dishonesty survey
between male and female undergraduate students.
An independent-samples t test was conducted to evaluate whether the mean scores on
Dimension 3 (Instructor Consequences) of the survey were significantly different between male
and female undergraduate students. Dimension 3 was the test variable and the grouping variable
was male or female. The test was not significant, t(326) = 82, p = .410. Therefore Ho23 was
retained. The index was .01, which indicated a small effect size. Males (M = 7.80, SD = 2.28)
85
and Females (M = 7.99, SD = 2.06) tended to score about the same on the instructor
consequences dimension of the survey. The 95% confidence interval for the difference in means
was -.70 to .27.
Ho24: There is no significant difference in the mean scores for Dimension 4- Student
Consequences on the Attitudes and Perceptions of Academic Dishonesty survey
between male and female undergraduate students.
An independent-samples t test was conducted to evaluate whether the mean scores on
Dimension 4 (Student Consequences) of the survey were significantly different between male
and female undergraduate students. Dimension 4 was the test variable and the grouping variable
was male or female. The test was not significant, t(326) = 1.28, p = .203.Therefore, Ho24 was
retained. The index was .01, which indicated a small effect size. Males (M = 19.00, SD =
3.34) and Females (M = 19.46, SD = 3.25) tended to score about the same on the student
consequences dimension of the survey. The 95% confidence interval for the difference in means
was -1.78 to .25.
Ho25: There is no significant difference in the mean scores for Dimension 5- Student
Conduct on the Attitudes and Perceptions of Academic Dishonesty survey
between male and female undergraduate students.
An independent-samples t test was conducted to evaluate whether the mean scores on
Dimension 5 (Student Conduct) of the survey were significantly different between male and
female undergraduate students. Dimension 5 was the test variable and the grouping variable was
male or female. The test was not significant, t(326) = 1.63, p = .105. Therefore, Ho25 was
retained. The index was .01, which indicated a small effect size. Males (M = 13.64, SD =
86
3.02) and Females (M = 14.14, SD = 2.64) tended to score about the same on the student conduct
dimension of the survey. The 95% confidence interval for the difference in means was -1.12 to .10.
Research Question 3
Is there a significant difference in the mean scores for each of the dimensions on the
Attitudes and Perceptions of Academic Dishonesty survey (Dimension 1- Use of Technology,
Dimension 2- Perceptions of Policy, Dimension 3- Instructor Consequences, Dimension 4-
Student Consequences, and Dimension 5- Student Conduct) among traditional age students (18-
24) and nontraditional age students (25-52)?
Ho31: There is no significant difference in the mean scores for Dimension 1- Use of
Technology on the Attitudes and Perceptions of Academic Dishonesty survey
among traditional age students (18-24) and nontraditional age students (25-52).
An independent-samples t test was conducted to evaluate whether the mean scores on
Dimension 1 (Use of Technology) of the survey were significantly different among traditional
age students (18-24) and nontraditional age students (25-52). Dimension 1 was the test variable
and the grouping variable was traditional age students (18-24) or nontraditional age students (25-
52). The test was not significant, t(326) = 1.65, p =.100. Therefore, Ho31 was retained. The
index was .01, which indicated a small effect size. Traditional (M = 18.76, SD = 3.41) and
Nontraditional (M = 19.64, SD = 2.96) tended to score about the same on the student conduct
dimension of the survey. The 95% confidence interval for the difference in means was -1.95 to .17.
Ho32: There is no significant difference in the mean scores for Dimension 2- Perceptions
of Policy on the Attitudes and Perceptions of Academic Dishonesty survey among
traditional age students (18-24) and nontraditional age students (25-52).

87
An independent-samples t test was conducted to evaluate whether the mean scores on
Dimension 2 (Perceptions of Policy) of the survey were significantly different among traditional
age students (18-24) and nontraditional age students (25-52). Dimension 2 was the test variable
and the grouping variable was traditional age students (18-24) or nontraditional age students (25-
52). The test was not significant, t(326) = 1.12, p = .262. Therefore, Ho32 was retained. The
index was .01, which indicated a small effect size. Traditional (M = 10.93, SD = 2.19) and
Nontraditional age students (M = 11.33, SD = 2.44) tended to score about the same on the
student conduct dimension of the survey. The 95% confidence interval for the difference in
means was -1.10 to .30.
Ho33: There is no significant difference in the mean scores for Dimension 3- Instructor
Consequences on the Attitudes and Perceptions of Academic Dishonesty survey
among traditional age students (18-24) and nontraditional age students (25-52).
An independent-samples t test was conducted to evaluate whether the mean scores on
Dimension 3 (Instructor Consequences) of the survey were significantly different among
traditional age students (18-24) and nontraditional age students (25-52). Dimension 3 was the
test variable and the grouping variable was traditional age students (18-24) or nontraditional age
students (25-52). The test was significant, t(326) = 2.81, p = .005. Therefore, Ho33 was rejected.
The index was .01, which indicated a small effect size. Traditional Students (M = 7.76, SD =
2.12) tended to score lower than Nontraditional age students (M = 8.73, SD = 2.30). The 95%
confidence interval for the difference in means was -1.65 to -.29.
Ho34: There is no significant difference in the mean scores for Dimension 4- Student
Consequences on the Attitudes and Perceptions of Academic Dishonesty survey
among traditional age students (18-24) and nontraditional age students (25-52).

88
An independent-samples t test was conducted to evaluate whether the mean scores on
Dimension 4 (Student Consequences) of the survey were significantly different among
traditional age students (18-24) and nontraditional age students (25-52). Dimension 4 was the
test variable and the grouping variable was traditional age students (18-24) or nontraditional age
students (25-52). The test was not significant, t(326) = 1.83, p = .068. Therefore, Ho34 was
retained. The index was .01, which indicated a small effect size. Traditional (M = 19.10, SD =
3.30) and Nontraditional age students (M = 20.07, SD = 3.17) tended to score about the same on
the student conduct dimension of the survey. The 95% confidence interval for the difference in
means was -2.00 to -.07.
Ho35: There is no significant difference in the mean scores for Dimension 5- Student
Conduct on the Attitudes and Perceptions of Academic Dishonesty survey among
traditional age students (18-24) and nontraditional age students (25-52).
An independent-samples t test was conducted to evaluate whether the mean scores on
Dimension 5 (Student Conduct) of the survey were significantly different among traditional age
students (18-24) and nontraditional age students (25-52). Dimension 5 was the test variable and
the grouping variable was traditional age students (18-24) or nontraditional age students (25-52).
The test was significant, t(326) = 3.68, p <.001. Therefore, Ho35 was rejected. The index was
.01, which indicated a small effect size. Traditional Students (M = 13.67, SD = 2.83) tended to
score lower than and Nontraditional age students (M = 15.31, SD = 2.47). The 95% confidence
interval for the difference in means was -2.52 to -.76.
Research Question 4
Is there a significant difference in the mean scores for each of the dimensions on the
Attitudes and Perceptions of Academic Dishonesty survey (Dimension 1- Use of Technology,
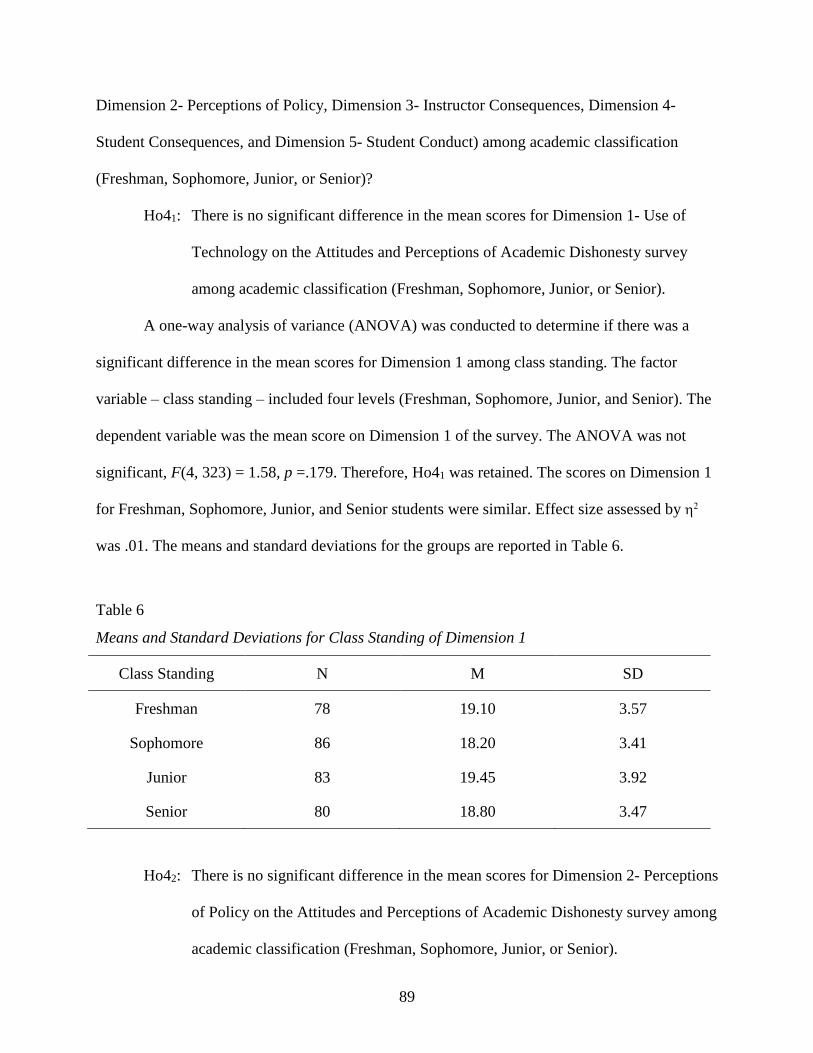
89
Dimension 2- Perceptions of Policy, Dimension 3- Instructor Consequences, Dimension 4-
Student Consequences, and Dimension 5- Student Conduct) among academic classification
(Freshman, Sophomore, Junior, or Senior)?
Ho41: There is no significant difference in the mean scores for Dimension 1- Use of
Technology on the Attitudes and Perceptions of Academic Dishonesty survey
among academic classification (Freshman, Sophomore, Junior, or Senior).
A one-way analysis of variance (ANOVA) was conducted to determine if there was a
significant difference in the mean scores for Dimension 1 among class standing. The factor
variable – class standing – included four levels (Freshman, Sophomore, Junior, and Senior). The
dependent variable was the mean score on Dimension 1 of the survey. The ANOVA was not
significant, F(4, 323) = 1.58, p =.179. Therefore, Ho41 was retained. The scores on Dimension 1
for Freshman, Sophomore, Junior, and Senior students were similar. Effect size assessed by
was .01. The means and standard deviations for the groups are reported in Table 6.
Table 6
Means and Standard Deviations for Class Standing of Dimension 1
Class Standing N M SD
Freshman 78 19.10 3.57
Sophomore 86 18.20 3.41
Junior 83 19.45 3.92
Senior 80 18.80 3.47
Ho42: There is no significant difference in the mean scores for Dimension 2- Perceptions
of Policy on the Attitudes and Perceptions of Academic Dishonesty survey among
academic classification (Freshman, Sophomore, Junior, or Senior).
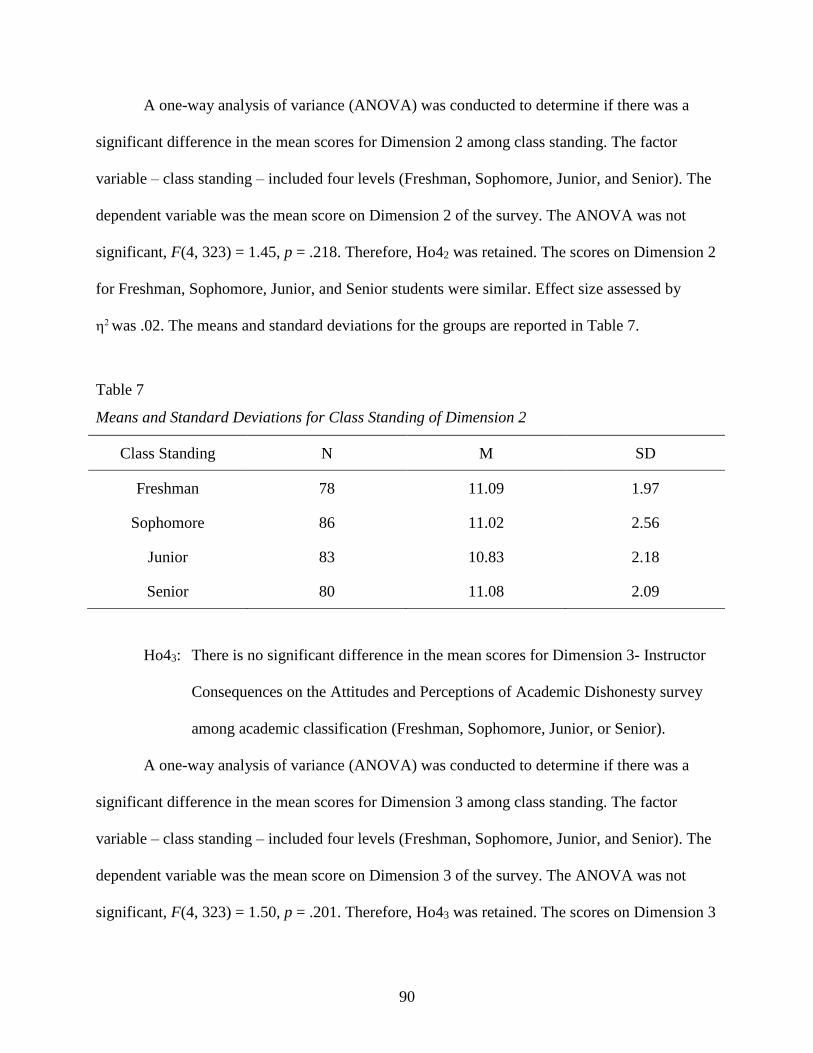
90
A one-way analysis of variance (ANOVA) was conducted to determine if there was a
significant difference in the mean scores for Dimension 2 among class standing. The factor
variable – class standing – included four levels (Freshman, Sophomore, Junior, and Senior). The
dependent variable was the mean score on Dimension 2 of the survey. The ANOVA was not
significant, F(4, 323) = 1.45, p = .218. Therefore, Ho42 was retained. The scores on Dimension 2
for Freshman, Sophomore, Junior, and Senior students were similar. Effect size assessed by
was .02. The means and standard deviations for the groups are reported in Table 7.
Table 7
Means and Standard Deviations for Class Standing of Dimension 2
Class Standing N M SD
Freshman 78 11.09 1.97
Sophomore 86 11.02 2.56
Junior 83 10.83 2.18
Senior 80 11.08 2.09
Ho43: There is no significant difference in the mean scores for Dimension 3- Instructor
Consequences on the Attitudes and Perceptions of Academic Dishonesty survey
among academic classification (Freshman, Sophomore, Junior, or Senior).
A one-way analysis of variance (ANOVA) was conducted to determine if there was a
significant difference in the mean scores for Dimension 3 among class standing. The factor
variable – class standing – included four levels (Freshman, Sophomore, Junior, and Senior). The
dependent variable was the mean score on Dimension 3 of the survey. The ANOVA was not
significant, F(4, 323) = 1.50, p = .201. Therefore, Ho43 was retained. The scores on Dimension 3
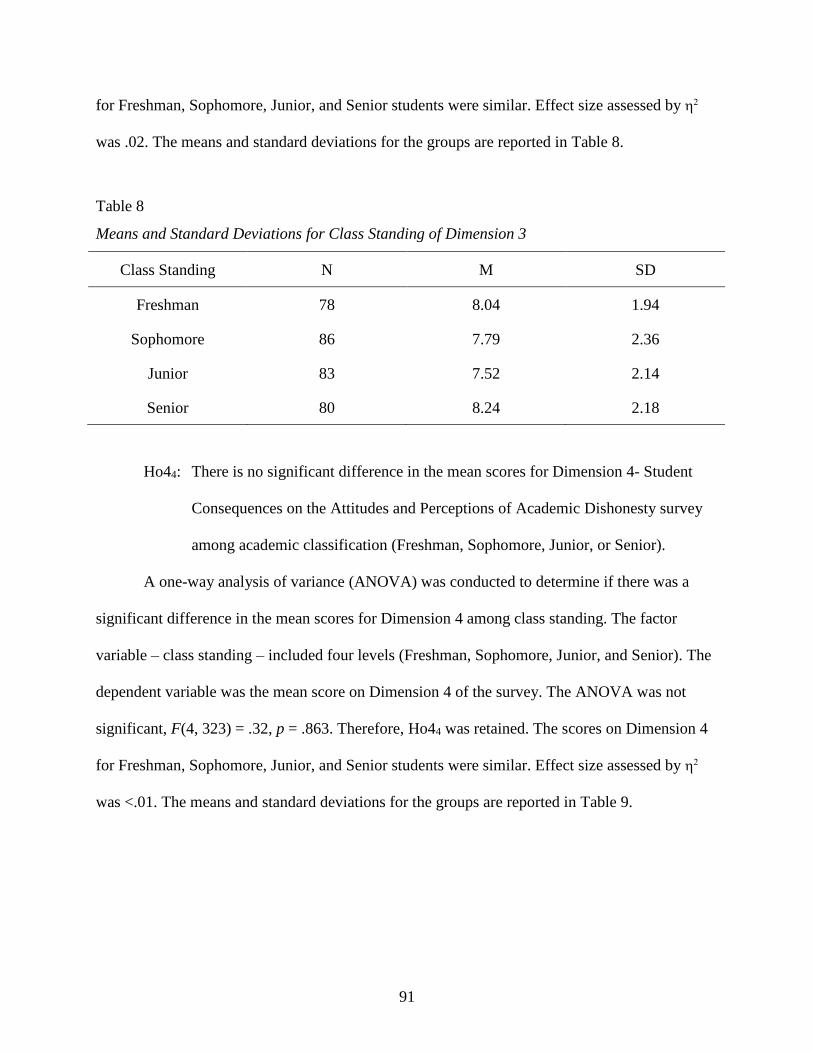
91
for Freshman, Sophomore, Junior, and Senior students were similar. Effect size assessed by
was .02. The means and standard deviations for the groups are reported in Table 8.
Table 8
Means and Standard Deviations for Class Standing of Dimension 3
Class Standing N M SD
Freshman 78 8.04 1.94
Sophomore 86 7.79 2.36
Junior 83 7.52 2.14
Senior 80 8.24 2.18
Ho44: There is no significant difference in the mean scores for Dimension 4- Student
Consequences on the Attitudes and Perceptions of Academic Dishonesty survey
among academic classification (Freshman, Sophomore, Junior, or Senior).
A one-way analysis of variance (ANOVA) was conducted to determine if there was a
significant difference in the mean scores for Dimension 4 among class standing. The factor
variable – class standing – included four levels (Freshman, Sophomore, Junior, and Senior). The
dependent variable was the mean score on Dimension 4 of the survey. The ANOVA was not
significant, F(4, 323) = .32, p = .863. Therefore, Ho44 was retained. The scores on Dimension 4
for Freshman, Sophomore, Junior, and Senior students were similar. Effect size assessed by
was <.01. The means and standard deviations for the groups are reported in Table 9.
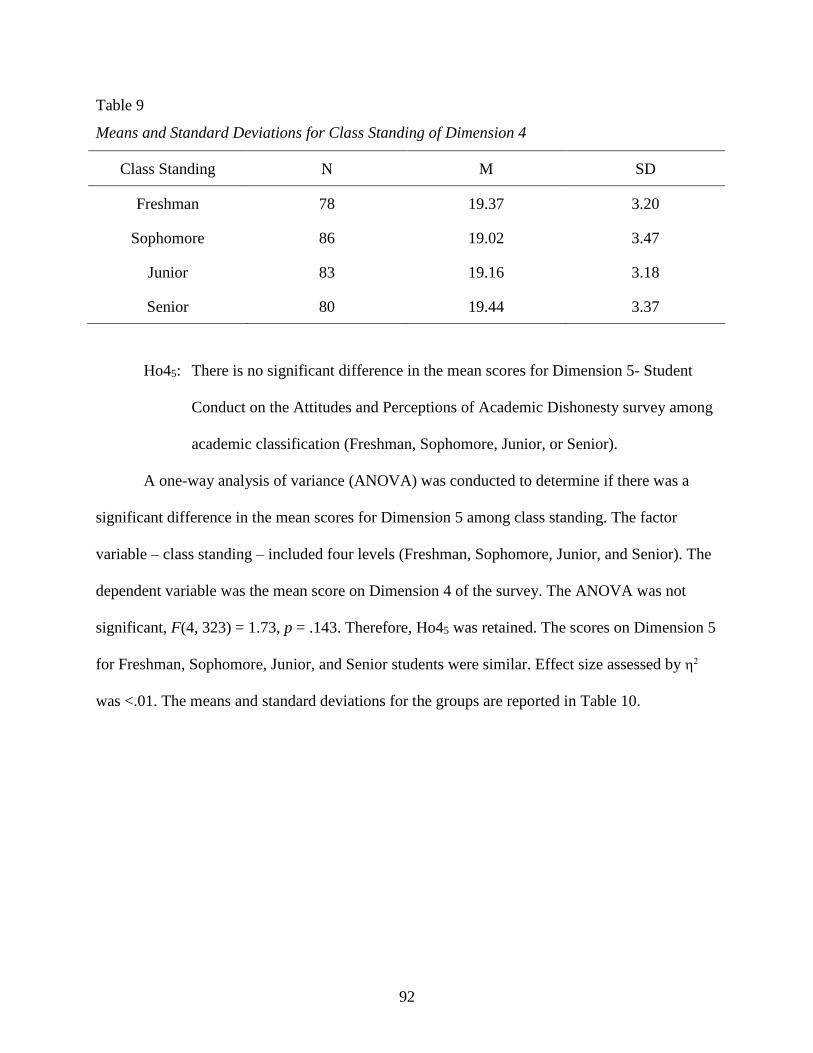
92
Table 9
Means and Standard Deviations for Class Standing of Dimension 4
Class Standing N M SD
Freshman 78 19.37 3.20
Sophomore 86 19.02 3.47
Junior 83 19.16 3.18
Senior 80 19.44 3.37
Ho45: There is no significant difference in the mean scores for Dimension 5- Student
Conduct on the Attitudes and Perceptions of Academic Dishonesty survey among
academic classification (Freshman, Sophomore, Junior, or Senior).
A one-way analysis of variance (ANOVA) was conducted to determine if there was a
significant difference in the mean scores for Dimension 5 among class standing. The factor
variable – class standing – included four levels (Freshman, Sophomore, Junior, and Senior). The
dependent variable was the mean score on Dimension 4 of the survey. The ANOVA was not
significant, F(4, 323) = 1.73, p = .143. Therefore, Ho45 was retained. The scores on Dimension 5
for Freshman, Sophomore, Junior, and Senior students were similar. Effect size assessed by
was <.01. The means and standard deviations for the groups are reported in Table 10.

93
Table 10
Means and Standard Deviations for Class Standing of Dimension 5
Class Standing N M SD
Freshman 78 19.37 3.20
Sophomore 86 19.02 3.47
Junior 83 19.16 3.18
Senior 80 19.44 3.37
Research Question 5
Is there a significant difference in the mean scores for each of the dimensions on the
Attitudes and Perceptions of Academic Dishonesty survey (Dimension 1- Use of Technology,
Dimension 2- Perceptions of Policy, Dimension 3- Instructor Consequences, Dimension 4-
Student Consequences, and Dimension 5- Student Conduct) among students grouped by declared
major (Criminal Justice or other)?
Ho51: There is no significant difference in the mean scores for Dimension 1- Use of
Technology on the Attitudes and Perceptions of Academic Dishonesty survey
among students grouped by declared major (Criminal Justice or other).
An independent-samples t test was conducted to evaluate whether the mean scores on
dimension 1 (Use of Technology) of the survey were significantly different among students by
major. Dimension 1 was the test variable and the grouping variable was the declared major
(Criminal Justice or other). The test was not significant, t(326) = .04, p = .971. Therefore, Ho51
was retained. The index was .01, which indicated a small effect size. Criminal Justice (M =
18.87, SD = 3.49) and Other Majors (M = 18.88, SD = 3.24) tended to score about the same on

94
the student conduct Dimension of the survey. The 95% confidence interval for the difference in
means was -.72 to .75.
Ho52: There is no significant difference in the mean scores for Dimension 2- Perceptions
of Policy on the Attitudes and Perceptions of Academic Dishonesty survey among
students grouped by declared major (Criminal Justice or other).
An independent-samples t test was conducted to evaluate whether the mean scores on
Dimension 2 (Perceptions of Policy) of the survey were significantly different among students by
major. Dimension 2 was the test variable and the grouping variable was the declared major
(Criminal Justice or other). The test was not significant, t(326) = .10, p = .921 .Therefore, Ho52
was retained. The index was .01, which indicated a small effect size. Criminal Justice (M =
10.98, SD = 2.33) and Other Majors (M = 11.00, SD = 2.05) tended to score about the same on
the student conduct Dimension of the survey. The 95% confidence interval for the difference in
means was -.46 to .51.
Ho53: There is no significant difference in the mean scores for Dimension 3- Instructor
Consequences on the Attitudes and Perceptions of Academic Dishonesty survey
among students grouped by declared major (Criminal Justice or other).
An independent-samples t test was conducted to evaluate whether the mean scores on
Dimension 3 (Instructor Consequences) of the survey were significantly different among
students by major. Dimension 3 was the test variable and the grouping variable was the major
(Criminal Justice or other). The test was not significant, t(326) = .16, p = .875 .Therefore, Ho53
was retained. The index was .01, which indicated a small effect size. Criminal Justice (M =
7.88, SD = 2.26) and Other Majors (M = 7.92, SD = 2.09) tended to score about the same on the
95
student conduct Dimension of the survey. The 95% confidence interval for the difference in
means was -.43 to .51.
Ho54: There is no significant difference in the mean scores for Dimension 4- Student
Consequences on the Attitudes and Perceptions of Academic Dishonesty survey
among students grouped by declared major (Criminal Justice or other).
An independent-samples t test was conducted to evaluate whether the mean scores on
Dimension 4 (Student Consequences) of the survey were significantly different among students
by major. Dimension 4 was the test variable and the grouping variable was the declared major
(Criminal Justice or other). The test was significant, t(326) = 2.17, p = .031. Therefore, Ho54 was
rejected. The index was .01, which indicated a small effect size. Criminal Justice Majors (M =
18.84, SD = 3.28) tended to score lower than Other Majors (M = 19.62, SD = 3.27) on the
student conduct dimension of the survey. The 95% confidence interval for the difference in
means was .07 to 1.50.
Ho55: There is no significant difference in the mean scores for Dimension 5- Student
Conduct on the Attitudes and Perceptions of Academic Dishonesty survey among
students grouped by declared major (Criminal Justice or other).
An independent-samples t test was conducted to evaluate whether the mean scores on
Dimension 5 (Student Conduct) of the survey were significantly different among students by
major. Dimension 5 was the test variable and the grouping variable was the declared major
(Criminal Justice or other). The test was not significant, t(326) = .40,p = .687. Therefore, Ho55
was retained. The index was .01, which indicated a small effect size. Criminal Justice (M
=13.96, SD = 2.83) and Other Majors (M =13.83, SD = 2.86) tended to score about the same on
96
the student conduct dimension of the survey. The 95% confidence interval for the difference in
means was -.74 to .49.
Research Question 6
Is there a significant difference in the mean scores for each of the dimensions on the
Attitudes and Perceptions of Academic Dishonesty survey (Dimension 1- Use of Technology,
Dimension 2- Perceptions of Policy, Dimension 3- Instructor Consequences, Dimension 4-
Student Consequences, and Dimension 5- Student Conduct) between students grouped by self-
reported grade point average (GPA: 2.00-3.00, 3.01-4.00)?
Ho61: There is no significant difference in the mean scores for Dimension 1- Use of
Technology on the Attitudes and Perceptions of Academic Dishonesty survey
among students grouped by self-reported grade point average (GPA: 2.00-3.00,
3.01-4.00).
An independent-samples t-test was conducted to evaluate whether the mean scores on
Dimension 1 (Use of Technology) of the survey were significantly different between the two
GPA groups (2.0 to 3.0 or 3.1 to 4.0) of undergraduate students. Dimension 1 was the test
variable and the grouping variable was GPA. The test was not significant, t(219) = .34, p = .735.
Therefore, Ho51 was retained. The index was .01, which indicated a small effect size. Students
in group 1 (M = 18.80, SD = 3.52) and group 2 (M = 18.95, SD = 3.13) tended to score about the
same on the use of technology dimension of the survey. The 95% confidence interval for the
difference in means was -1.04 to .74.

97
Ho62: There is no significant difference in the mean scores for Dimension 2- Perceptions
of Policy on the Attitudes and Perceptions of Academic Dishonesty survey among
students grouped by self-reported grade point average (GPA: 2.00-3.00, 3.01-
4.00).
An independent-samples t-test was conducted to evaluate whether the mean scores on
Dimension 2 (Perceptions of Policy) of the survey were significantly different between the two
GPA groups (2.0 to 3.0 or 3.1 to 4.0) of undergraduate students. Dimension 2 was the test
variable and the grouping variable was GPA. The test was not significant, t(219) = .29, p = .774.
Therefore, Ho52 was retained. The index was .01, which indicated a small effect size. Students
in group 1 (M = 11.06, SD = 2.26) and group 2 (M = 10.97, SD = 2.29) tended to score about the
same on the perceptions of policy dimension of the survey. The 95% confidence interval for the
difference in means was -.52 to .69.
Ho63: There is no significant difference in the mean scores for Dimension 3- Instructor
Consequences on the Attitudes and Perceptions of Academic Dishonesty survey
among students grouped by self-reported grade point average (GPA: 2.00-3.00,
3.01-4.00).
An independent-samples t-test was conducted to evaluate whether the mean scores on
Dimension 3 (Instructor Consequences) of the survey were significantly different between the
two GPA groups (2.0 to 3.0 or 3.1 to 4.0) of undergraduate students. Dimension 3 was the test
variable and the grouping variable was GPA. The test was not significant, t(219) = 1.64, p =
.103. Therefore, Ho53 was retained. The index was .01, which indicated a small effect size.
Students in group 1 (M = 7.55, SD = 2.15) and group 2 (M = 8.02, SD = 2.13) tended to score

98
about the same on the instructor consequences dimension of the survey. The 95% confidence
interval for the difference in means was -1.04 to 1.0.
Ho64: There is no significant difference in the mean scores for Dimension 4- Student
Consequences on the Attitudes and Perceptions of Academic Dishonesty survey
among students grouped by self-reported grade point average (GPA: 2.00-3.00,
3.01-4.00).
An independent-samples t-test was conducted to evaluate whether the mean scores on
Dimension 4 (Student Consequences) of the survey were significantly different between the two
GPA groups (2.0 to 3.0 or 3.1 to 4.0) of undergraduate students. Dimension 4 was the test
variable and the grouping variable was GPA. The test was not significant, t(219) = .44, p = .662.
Therefore, Ho54 was retained. The index was .01, which indicated a small effect size. Students
in group 1 (M = 1.18, SD = 3.33) and group 2 (M = 19.37, SD = 3.31) tended to score about the
same on the student consequences dimension of the survey. The 95% confidence interval for the
difference in means was -1.08 to .69.
Ho65: There is no significant difference in the mean scores for Dimension 5- Student
Conduct on the Attitudes and Perceptions of Academic Dishonesty survey among
students grouped by self-reported grade point average (GPA: 2.00-3.00, 3.01-
4.00).

99
An independent-samples t-test was conducted to evaluate whether the mean scores on
Dimension 5 (Student Conduct) of the survey were significantly different between the two GPA
groups (2.0 to 3.0 or 3.1 to 4.0) of undergraduate students. Dimension 5 was the test variable and
the grouping variable was GPA. The test was significant, t(219) = 2.19, p = .030. Therefore,
Ho52 was rejected. The index was .02, which indicated a small effect size. Students in group 1
(M = 13.50, SD = 2.92) and group 2 (M = 14.33, SD = 2.67) tended to score lower on the student
conduct dimension of the survey. The 95% confidence interval for the difference in means was -
1.58 to -.08.

100
CHAPTER 5
SUMMARY, CONCLUSION, AND RECOMMNEDATIONS
This chapter contains a summary of the findings, the conclusion, and recommendations
for other individuals who may use the outcome of this research project as a source when
reviewing or revising undergraduate student philosophies on academic dishonesty in higher
education. The intent of this research was to explore the opinions and attitudes of undergraduate
students about academic dishonesty. This research included data gathered through survey packets
that were hand delivered to each of the participating classes. Surveys were distributed to the
undergraduate student participants, completed, and collected during the visit. Surveys were
distributed at a 4-year private university, a 2-year public college, and a 4-year public university.
Summary
The statistical analyses conveyed in the research project were based on six research
questions. Each research question was supplemented with five corresponding null hypotheses.
Research questions 1, 4, and 6 were examined using a one-way analysis of variance (ANOVA);
research questions 2, 3, and 5 were examined using an independent samples t-test. There were
328 written responses. There were 116 student responses gathered from the private 4-year
university, 103 student responses gathered from the public 2-year college, and 109 student
responses gathered from the 4-year public university. All of the responses were valid and fit the
perquisites for inclusion in the survey. These perquisites were identified as each student was at
least 18 years of age and each was registered as an undergraduate student. The level of
significance used in the statistical analysis was .05.
101
Conclusion
As stated in Bushway and Nash (1977), instances of academic dishonesty have been
documented in every culture and at all academic levels from elementary to graduate school, with
evidence of academic dishonesty 2,000 years ago during Chinese civil service examinations.
Studies of academic dishonesty have revealed that 20% of students begin cheating in early
elementary school.
By deepening the understanding of the effect that student perceptions on academic
dishonesty have on students, instructors, and university administrators, one can better understand
the impact their decisions have on the long-term decision making processes of students who may
attend institutions of higher learning in Tennessee. By examining this study’s findings,
administrators at higher education institutions can gain insight into how undergraduate students
feel about academic dishonesty and how often they may take part in it. Using this information,
administrators may be able to develop a protocol to address prevention or intervention strategies
to help decrease acts of academic dishonesty among undergraduate students. This research has
the potential to give substance to the idea under investigation; it will add facts and data to the
ideas presented in the research. The investigational process may provide the reader with
anecdotes and examples that can be used to evaluate the information.
As stated in the Open Education Database (2010), academic dishonesty has a detrimental
effect on institutions of higher learning because it can damage their reputation. Academic
dishonesty causes students who may not engage in it to become discouraged when they witness
cheating and the individuals who cheat are not caught or punished. There is evidence to support
the idea that academic dishonesty is consequential. An act of cheating in a college setting that
students see has had a positive outcome may be acted out in other aspects of life.
102
Newton (2016) found that students articulated the fact that cheating on scholastic
examinations should be handled less severely than that of the one set down by the governing
body. This research study did not show any differences in opinions. This study did not show that
a significant number of the students surveyed had the opinion that cheating in a scholastic
environment was an unacceptable activity. This finding is comparable to Jones (2011) who found
a significant number of students evaluated in the study articulated the idea that it was alright to
participate in cheating activities in university settings.
Tibbetts (2012) revealed that a significant number of surveyed students would take part
in academic dishonesty even though each student knew that they would receive punishment from
the faculty. The study further showed that students had little concern for the severity of the
punishment. The results of this study supported this finding showing that a significant number of
the surveyed individuals replied the same way when surveyed.
Key Findings
The purpose of this study was to determine the perceptions and opinions of
undergraduate students about academic dishonesty gathered from a private 4-year university, a
public 2-year college, and a 4-year public university. Further, the purpose of this study was to
determine if statistically significant correlations existed between identified student demographic
characteristics and students’ attitudes toward academic dishonesty. Specifically, this research
project was used to evaluate the views and opinions of 328 undergraduate students from three
institutions of higher education. The inferences for each research question were based on the
outcomes from data collected during the research project.

103
Research Question 1
Is there a significant difference in the mean scores for each of the dimensions on the
Attitudes and Perceptions of Academic Dishonesty survey (Dimension 1- Use of Technology,
Dimension 2- Perceptions of Policy, Dimension 3- Instructor Consequences, Dimension 4-
Student Consequences, and Dimension 5- Student Conduct) among participating institutions of
higher education?
Dimension 1- Use of Technology. The ANOVA was not significant, F(2, 325) = .46, p =
.632. Therefore, Ho11 was retained. The scores on Dimension 1 for the three types of institutions
were similar. Effect size was assessed by was <.01.
Dimension 2- Perceptions of Policy. The ANOVA was not significant, F(2, 325) = .58, p =
.560. Therefore, Ho12 was retained. The mean scores on Dimension 2 for the three types of
institutions were similar. Effect size assessed by was <.01.
Dimension 3- Instructor Consequences. The ANOVA was not significant, F(2, 325) =
2.59, p = .076. Therefore, Ho13 was retained. The mean scores on Dimension 3 for the three
types of institutions were similar. Effect size assessed by was .02.
Dimension 4- Student Consequences. The ANOVA was significant, F(2, 325) = 3.67, p =
.027. Therefore, Ho14 was rejected. The mean scores on Dimension 4 for the three types of
institutions were not similar. Effect size assessed by was .02. Because the overall F test was
significant, post hoc multiple comparisons were conducted to evaluate pairwise differences
among the means of the three groups. A Tukey procedure was selected for the multiple
comparisons because equal variances were assumed. There was a significant difference (p=.027)
in the means between Private 4-year and Public 4-year universities. However, there were no
104
other statistically significant pairwise differences between the other institutions. The private 4-
year university had higher mean scores on the student consequences dimension than the public 4-
year university.
Dimension 5- Student Conduct. The ANOVA was not significant, F(2, 325) =.05, p =
.949. Therefore, Ho15 was retained. The mean scores on Dimension 5 for the three types of
institutions were similar. Effect size assessed by was <.01.
Research Question 2
Is there a significant difference in the mean scores for each of the dimensions on the
Attitudes and Perceptions of Academic Dishonesty survey (Dimension 1- Use of Technology,
Dimension 2- Perceptions of Policy, Dimension 3- Instructor Consequences, Dimension 4-
Student Consequences, and Dimension 5- Student Conduct) between male and female
undergraduate students?
Dimension 1- Use of Technology. The independent samples t-test was not significant,
t(326) = 1.52, p = .129. Therefore, Ho21 was retained. The index was .01, which indicated a
small effect size. Males (M =18.59, SD = 3.51) and Females (M = 19.16, SD = 3.19) tended to
score about the same on the use of technology dimension of the survey. The 95% confidence
interval for the difference in means was -1.29 to .17.
Dimension 2- Perceptions of Policy. The independent samples t-test was not significant,
t(326) = 1.24, p = .215. Therefore, Ho22 was retained. The index was .01, which indicated a
small effect size. Males (M =11.14, SD =2.39) and Females (M =10.84, SD =2.04) tended to
score about the same on the perceptions of policy dimension of the survey. The 95% confidence
interval for the difference in means was -.18 to .79.

105
Dimension 3- Instructor Consequences. The independent samples t-test was not
significant, t(326) = .82, p = .410. Therefore, Ho23 was retained. The index was .01, which
indicated a small effect size. Males (M = 7.80, SD = 2.28) and Females (M = 7.99, SD = 2.06)
tended to score about the same on the instructor consequences dimension of the survey. The 95%
confidence interval for the difference in means was -.70 to .27.
Dimension 4- Student Consequences. The independent samples t-test was not significant,
t(326) = 1.28, p = .203. Therefore, Ho24 was retained. The index was .01, which indicated a
small effect size. Males (M = 19.00, SD = 3.34) and Females (M =19.46, SD =3.25) tended to
score about the same on the student consequences dimension of the survey. The 95% confidence
interval for the difference in means was -1.78 to .25.
Dimension 5- Student Conduct. The independent samples t-test was not significant,
t(326) = 1.63, p = .105. Therefore, Ho25 was retained. The index was .01, which indicated a
small effect size. Males (M = 13.64, SD = 3.02) and Females (M =14.14, SD =2.64) tended to
score about the same on the student conduct dimension of the survey. The 95% confidence
interval for the difference in means was -1.12 to .10.
Research Question 3
Is there a significant difference in the mean scores for each of the dimensions on the
Attitudes and Perceptions of Academic Dishonesty survey (Dimension 1- Use of Technology,
Dimension 2- Perceptions of Policy, Dimension 3- Instructor Consequences, Dimension 4-
Student Consequences, and Dimension 5- Student Conduct) among traditional age students (18-
24) and nontraditional age students (25-52)?
106
Dimension 1- Use of Technology. The independent samples t-test was not significant,
t(326) = 1.65, p =.100. Therefore, Ho31 was retained. The index was .01, which indicated a
small effect size. Traditional (M = 18.76, SD = 3.41) and Nontraditional age students (M =
19.64, SD = 2.96) tended to score about the same on the student conduct dimension of the
survey. The 95% confidence interval for the difference in means was -1.95 to .17.
Dimension 2- Perceptions of Policy. The independent samples t-test was not significant,
t(326) = 1.12, p = .262. Therefore, Ho32 was retained. The index was .01, which indicated a
small effect size. Traditional (M = 10.93, SD = 2.19) and Nontraditional age students (M =
11.33, SD = 2.44) tended to score about the same on the student conduct dimension of the
survey. The 95% confidence interval for the difference in means was -1.10 to .30.
Dimension 3- Instructor Consequences. The independent samples t-test was significant,
t(326) = 2.81, p = .005. Therefore, Ho33 was rejected. The index was .01, which indicated a
small effect size. Traditional (M = 7.76, SD = 2.12) and Nontraditional age students (M = 8.73,
SD = 2.30). Nontraditional aged students tended to score higher than traditional aged students on
the instructor consequences dimension. The 95% confidence interval for the difference in means
was -1.65 to -.29.
Dimension 4- Student Consequences. The independent samples t-test was not significant,
t(326) = 1.83, p = .068. Therefore, Ho34 was retained. The index was .01, which indicated a
small effect size. Traditional Students (M = 7.76, SD = 2.12) tended to score lower than
nontraditional age students (M = 8.73, SD = 2.30). The 95% confidence interval for the
difference in means was -2.00 to -.07.
107
Dimension 5- Student Conduct. The independent samples t-test was significant, t(326) =
3.68, p <.001. Therefore, Ho35 was rejected. The index was .01, which indicated a small effect
size. Traditional Students (M = 13.67, SD = 2.83) tended to score lower than and Nontraditional
age students (M = 15.31, SD = 2.47). The 95% confidence interval for the difference in means
was -2.52 to -.76.
Research Question 4
Is there a significant difference in the mean scores for each of the dimensions on the
Attitudes and Perceptions of Academic Dishonesty survey (Dimension 1- Use of Technology,
Dimension 2- Perceptions of Policy, Dimension 3- Instructor Consequences, Dimension 4-
Student Consequences, and Dimension 5- Student Conduct) among academic classification
(Freshman, Sophomore, Junior, or Senior)?
Dimension 1- Use of Technology. The ANOVA was not significant, F(4, 323) = 1.58, p
= .179. Therefore, Ho41 was retained. The scores on dimension 1 for Freshman, Sophomore,
Junior, and Senior students were similar. Effect size assessed by was .01.
Dimension 2- Perceptions of Policy. The ANOVA was not significant, F(4, 323) = 1.45,
p = .218. Therefore, Ho42 was retained. The scores on dimension 2 for Freshman, Sophomore,
Junior, and Senior students were similar. Effect size assessed by was .02.
Dimension 3- Instructor Consequences. The ANOVA was not significant, F(4, 323) =
1.50, p = .201. Therefore, Ho43 was retained. The scores on dimension 3 for Freshman,
Sophomore, Junior, and Senior students were similar. Effect size assessed by was .02.
108
Dimension 4- Student Consequences. The ANOVA was not significant, F(4, 323) = .32,
p = .863. Therefore, Ho44 was retained. The scores on dimension 4 for Freshman, Sophomore,
Junior, and Senior students were similar. Effect size assessed by was <.01.
Dimension 5- Student Conduct. The ANOVA was not significant, F(4, 323) = 1.73, p =
.143. Therefore, Ho45 was retained. The scores on dimension 5 for Freshman, Sophomore,
Junior, and Senior students were similar. Effect size assessed by was < .01.
Research Question 5
Is there a significant difference in the mean scores for each of the dimensions on the
Attitudes and Perceptions of Academic Dishonesty survey (Dimension 1- Use of Technology,
Dimension 2- Perceptions of Policy, Dimension 3- Instructor Consequences, Dimension 4-
Student Consequences, and Dimension 5- Student Conduct) among students grouped by declared
major (Criminal Justice or other)?
Dimension 1- Use of Technology. The independent-samples t test was not significant,
t(326) = .04, p = .971. Therefore, Ho51 was retained. The index was .01, which indicated a
small effect size. Criminal Justice (M = 18.87, SD = 3.49) and Other Majors (M = 18.88, SD =
3.24) tended to score about the same on the student conduct dimension of the survey. The 95%
confidence interval for the difference in means was -.72 to .75.
Dimension 2- Perceptions of Policy. The independent-samples t test was not significant,
t(326) = .10, p = .921. Therefore, Ho52 was retained. The index was .01, which indicated a
small effect size. Criminal Justice (M = 10.98, SD = 2.33) and Other Majors (M = 11.00, SD =
2.05) tended to score about the same on the student conduct dimension of the survey. The 95%
confidence interval for the difference in means was -.46 to .51.

109
Dimension 3- Instructor Consequences. The independent samples t-test was not
significant, t(326) = .16, p = .875. Therefore, Ho53 was retained. The index was .01, which
indicated a small effect size. Criminal Justice (M = 7.88, SD = 2.26) and Other Majors (M =
7.92, SD = 2.09) tended to score about the same on the student conduct dimension of the survey.
The 95% confidence interval for the difference in means was -.434 to .510.
Dimension 4- Student Consequences. The independent samples t-test was significant,
t(326) = 2.17, p = .031. Therefore, Ho54 was rejected. The index was .01, which indicated a
small effect size. Criminal Justice Majors (M = 18.84, SD = 3.28) tended to score lower than
Other Majors (M = 19.62, SD = 3.27) on the student conduct dimension of the survey. The 95%
confidence interval for the difference in means was .07 to 1.50.
Dimension 5- Student Conduct. The independent samples t-test was not significant,
t(326) = .40,p = .687. Therefore, Ho55 was retained. The index was .01, which indicated a
small effect size. Criminal Justice (M = 13.96, SD = 2.83) and Other Majors (M = 13.83, SD =
2.86) tended to score about the same on the student conduct dimension of the survey. The 95%
confidence interval for the difference in means was -.74 to .49.
Research Question 6
Is there a significant difference in the mean scores for each of the dimensions on the
Attitudes and Perceptions of Academic Dishonesty survey (Dimension 1- Use of Technology,
Dimension 2- Perceptions of Policy, Dimension 3- Instructor Consequences, Dimension 4-
Student Consequences, and Dimension 5- Student Conduct) among students grouped by self-
reported grade point average (GPA: 2.00-3.00, 3.01,4.00)?

110
Dimension 1- Use of Technology. The independent samples t-test was not significant, t
(219) =.34,p=.735. Therefore Ho61 was retained. The scores on dimension 1 were similar across
GPAs. Effect size assessed by was <.01.
Dimension 2- Perceptions of Policy. The independent samples t-test was not significant, t
t(219) = .29, p = .774. Therefore, Ho62 was retained. The scores on dimension 2 were similar
across GPAs. Effect size assessed by was <.01.
Dimension 3- Instructor Consequences. The independent samples t-test was not
significant, t(219) = 1.64, p = .103. Therefore, Ho63 was retained. The scores on dimension 3
were similar across GPAs. Effect size assessed by was .03.
Dimension 4- Student Consequences. The independent samples t-test was not significant,
t(219) = .44, p = .662. Therefore, Ho64 was retained. The scores on dimension 4 were similar
across GPAs. Effect size assessed by was <.01.
Dimension 5- Student Conduct. The independent samples t-test was significant, t(219) =
2.19, p = .030. Therefore, Ho65 was rejected. Group 2 tended to score higher than group 1 on the
student conduct dimension.

111
Recommendations for Practice
A common definition of academic dishonesty involves students claiming that another
student’s work is their own (ETS, 1999). According to research findings, there are a number of
reasons why students cheat including little probability of detection, consequences are not severe,
no stated rules on academic cheating, or if there are such prohibitions in place they are not
clearly stated or articulated (ETS, 1999; Novotney, 2011).
It is recommended that colleges and universities concentrate on educating students about
the “costs” of participating in academic dishonesty. Based on the mean scores for different
groups on the survey, students do not have a high concern for academic dishonesty at the
participating institutions. Institutions of higher education can suffer a decrease in reputation as a
result of widespread academic dishonesty, especially if it occurs in student research.
Recommendations for Further Research
Based on the findings from this research study, there are four recommendations for future
research presented here.
1. A longitudinal study of academic dishonesty could help identify changes in
students’ perceptions of academic dishonesty over time.
2. A study of institutions of higher education located in regions other than the
Southeast U.S. would add to the knowledge base of academic dishonesty.
3. A qualitative study with in-depth interviews could shed more light on students’
perceptions of academic dishonesty.
4. A study that included a more diverse student population in academic majors and
in ethnicity would yield more generalizable findings.
112
REFERENCES
Agnew, R. (1997). Stability and change in crime over the life course: A strain theory explanation
(pp. 101-132). In T.P. Thornberry (Ed.) Developmental Theories of Crime and
Delinquency, vol. 7, Advances in Criminological Theory. New Brunswick, NJ:
Transaction.
Aiken, L.R. (1991). Detecting, understanding, and controlling for cheating on tests. Research in
Higher Education, 32(6), 725-736. doi:10.1007/BF00974740. (EJ437936).
American Psychological Association Zero Tolerance Task Force. (2008). Are zero tolerance
policies effective in the schools? An evidentiary review and recommendations. The
American Psychologist, 63(9), 852-862.
Bentham, J. (1780). An introduction to the principles of morals and legislation. London, UK: T.
Payne, and Son. Retrieved October 28, 2015, from http://www.utilitarianism.com/jeremy-
bentham/index.html
Blake, B.F., Heslin, R., & Curtis, S.C. (1996). Measuring impacts of cross-cultural training. In
D. Landis & R.S. Bhagat (Eds.), Handbook of Intercultural Training (2nd ed) (pp.165-
182). Thousand Oaks, CA: Sage.
Boehm, P.J., Justice, M., & Weeks, S. (2009). Promoting academic integrity in higher education.
The Community College Enterprise, 15(1), 45-61. Retrieved July 29, 2015, from
http://schoolcraft.edu/pdfs/cce/15.1.45-61.pdf
Bowers, W.J. (1964). Student dishonesty and its control in college. New York, NY: Bureau of
Applied Social Research. (ED003834). Retrieved July 29, 2015, from
http://eric.ed.gov/?id=ED003834
Bricault, D. (2007). Legal bases for dealing with academic dishonesty. College and University,
82(4), 15-21. Retrieved May 30, 2017, from https://aacrao-
web.s3.amazonaws.com/files/NZzJKcCMSk2xPwlVJzpt_CUJ8204.pdf
Brown, B.S., & McInerney, M. (2008). Changes in academic dishonesty among business
students in the United States, 1999-2006. International Journal of Management, 25(4),
621-632. Retrieved October 28, 2015, from https://www.questia.com/library/journal/1P3-
1623336541/changes-in-academic-dishonesty-among-business-students
Brown, B.S., Weible, R.J., & Olmosk, K.E. (2010). Business school deans on student academic
dishonesty: A survey. College Student Journal, 44(2), 299-308. Retrieved October 28,
2015, from http://www.freepatentsonline.com/article/College-Student-
Journal/228428417.html
113
Burrus, R.T., Graham, J.E., & Walker, M. (2011). Are my colleagues soft on (academic) crime?
Journal of Economics and Economic Education Research, 12(3), 55-64. Retrieved July
29, 2015, from https://www.questia.com/library/journal/1G1-274409744/are-my-
colleagues-soft-on-academic-crime
Bushway, A., & Nash, W.R., (1977). School cheating behavior. Review of Educational Research.
47(4), 623-632. (EJ174733).
Carter, S.L., & Punyanunt-Carter, N.M. (2006). Acceptability of treatments for cheating in the
college classroom. Journal of Instructional Psychology, 33(3), 212-216. Retrieved July
29, 2015, from https://www.questia.com/library/journal/1G1-157946278/acceptability-of-
treatments-for-cheating-in-the-college
Clement, M.J. (2001). Academic dishonesty: To be or not to be? Journal of Criminal Justice
Education, 12(2), 253-270. Retrieved July 29, 2015, from
http://www.tandfonline.com/doi/abs/10.1080/10511250100086101
Cohen, L., Manion, L., & Morrison, K. (2000). Research Methods in Education (5th ed.).
London, England: Routledge Falmer.
Cole, M.T., Swartz, L.B., & Shelley, D.J. (2014). Students’ use of technology in learning course
material: Is it cheating? International Journal of Information and Communication
Technology Education (IJICTE), 10(1), 35-48. doi:10.4018/ijicte.2014010104
Coren, A. (2012). The theory of planned behaviour: Will faculty confront students who cheat?
Journal of Academic Ethics, 10(3), 171-184. Retrieved October 28, 2015, from
http://dx.doi.org/10.1007/s10805-012-9162-7
Creswell, J.W. (2003) Research design: Qualitative, quantitative, and mixed methods
approaches. Thousand Oaks, CA: Sage.
Davis, S.F., Grover, C.A., Becker, A.H., & McGregor, L.N. (1992). Academic dishonesty:
Prevalence, determinants, techniques, and punishments. Teaching of Psychology, 19(1),
16-20. doi:10.1207/s15328023top1901_3. (EJ452195).
Decoo, W., & Colpaert, J. (2002). Crisis on campus: Confronting academic misconduct.
Cambridge, MA: MIT Press.
Denscombe, M. (1998). The good research guide: For small-scale social research projects.
Buckingham, UK: Open University Press.
Dixon v. Alabama State Board of Education. (1961).186 F. Supp. 945 (M.D. Ala., 1960); 1960
U.S. Dist. LEXIS 3482. 294 F.2d 150 (5th Cir., 1961); 1961, U.S. App. LEXIS 3767.
Retrieved October 28, 2015, from
http://www.stetson.edu/law/faculty/bickel/civilrights/media/document/case-digest-dixon-
v-alabama.pdf
114
Educational Testing Service (ETS). (1999). Academic cheating fact sheet. Princeton, NJ: Author.
Retrieved July 29, 2015, from http://www.glass-castle.com/clients/www-nocheating-
org/adcouncil/research/cheatingfactsheet.html
Ercegovac, Z., & Richardson, J.V. (2004). Academic dishonesty, plagiarism included, in the
digital age: A literature review. College & Research Libraries, 65(4), 301-318. Retrieved
October 28, 2015, from
http://www.baruch.cuny.edu/facultyhandbook/documents/PlagiarismLiteratureReview.pd
f
Eskridge, C., & Ames, G.A. (1993). Attitudes about cheating and self-reported cheating
behaviors of criminal justice majors and noncriminal justice majors: A research note.
Journal of Criminal Justice Education, 4(1), 65-78. Retrieved October 28, 2015, from
http://www.tandfonline.com/doi/abs/10.1080/10511259300082771
Fussell, J.A. (2005). High-tech tools assist today’s student cheaters. Kansas City Star (June 7).
[Online]. Retrieved October 28, 2015, from http://www.pkidd.com/cheaters.htm
Gallant, T.B. (2008). Academic integrity in the twenty-first century: A teaching and learning
imperative. ASHE Higher Education Report, 33(5), 1-143. (EJ91635). Retrieved October
28, 2015, from http://eric.ed.gov/?id=EJ791635
Gallant, T.B., & Drinan, P. (2006). Organizational theory and student cheating: Explanation,
responses, and strategies. The Journal of Higher Education, 77(5), 839-860. Retrieved
July 29, 2015, from http://www.eacfaculty.org/pchidester/Eng
102f/Plagiarism/Organizational theory and student cheating.pdf
Genereux, R.L., & McLeod, B.A. (1995). Circumstances surrounding cheating: A questionnaire
study of college students. Research in Higher Education, 36(6), 687-704. Retrieved
October 28, 2015, from http://link.springer.com/ /10.1007%2FBF02208251
Goss v. Lopez. 419 U.S. 565, 95 S. Ct. 729, 42 L. Ed. 2d 725 article, (1975) U.S. [Argued
October 16, 1974, decided January 22, 1975]. Retrieved November 17, 2015, from
http://www.casebriefs.com/blog/law/constitutional-law/constitutional-law-keyed-to-
chemerinsky/fundamental-fights-under-due-process-and-equal-protection/goss-v-lopez/
Graves, S.M. (2008). Student cheating habits: A predictor of workplace deviance. Journal of
Diversity Management, 3(1), 15-22. Retrieved November 9, 2015, from
http://www.cluteinstitute.com/ojs/index.php/JDM/article/viewFile/4977/5069
Greene, A.S., & Saxe, L. (1992). Everybody (else) does it: Academic cheating. Paper presented
at the Annual Meeting of the Eastern Psychological Association (Boston, MA, April 3-5).
(ED347931). Retrieved May 30, 2017, from
http://files.eric.ed.gov/fulltext/ED347931.pdf
Hamlin, A., & Powell, G. (2008). Academic dishonesty at Southern Utah University: Policies,
procedures and experiences in the school of business. Journal of the Academy of Business
Administration (Spring).
115
Hamlin, A., Barczyk, C., Powell, G., & Frost, J. (2013). A comparison of university efforts to
contain academic dishonesty. Journal of Legal, Ethical and Regulatory Issues, 16(1), 35-
46. Retrieved July 29, 2015, from
http://www.readperiodicals.com/201301/3001950141.html
Heisler, G. (1974). Ways to deter law violators: Effects of levels of threat and vicarious
punishment on cheating. Journal of Consulting and Clinical Psychology, 42(4), 577-582.
Retrieved October 28, 2015, from http://dx.doi.org/10.1037/h0036709
Hensley, L. (2013). To cheat or not to cheat: A review with implications for practice. The
Community College Enterprise, 19(2), 22-34. Retrieved July 29, 2015, from
https://www.questia.com/library/journal/1G1-355938758/to-cheat-or-not-to-cheat-a-
review-with-implications
Hollinger, R.C., & Lanza-Kaduce, L. (1996). Academic dishonesty and the perceived
effectiveness of countermeasures: An empirical survey of cheating at a major public
university. NASPA Journal, 33(4), 292-306.
Huang, C-.L., Yang, S.C., & Chen, A-.S. (2015). The relationships among students’ achievement
goals, willingness to report academic dishonesty, and engaging in academic dishonesty.
Social Behavior and Personality: An International Journal, 43(1), 27-37.
doi:10.2224/sbp.2015.43.1.27. Retrieved May 30, 2017, from https://www.sbp-
journal.com/index.php/sbp/article/view/3634
Hulsart, R., & McCarthy, V. (2009). Educators’ role in promoting academic integrity. Academy
of Educational Leadership Journal, 13(4), 49-60. Retrieved July 29, 2015, from
https://www.questia.com/library/journal/1P3-1869987031/educators-role-in-promoting-
academic-integrity
Johnson, V.R. (2012). Higher education, corruption, and reform. Contemporary Readings in Law
and Social Justice, 4(1), 478-495. Retrieved July 29, 2015, from
https://www.questia.com/library/journal/1P3-2772533591/higher-education-corruption-
and-reform
Jones, D.L.R. (2011). Academic dishonesty: Are more students cheating? Business
Communication Quarterly, Volume 74, Number 2, June 2011. 141-150. Retrieved on July
13, 2017 from https:debdavis.pbworks.com
Josien, L., & Broderick, B. (2013). Cheating in higher education: The case of multi-methods
cheaters. Academy of Educational Leadership Journal, 17(2), 93-105. Retrieved July 29,
2015, from https://www.questia.com/library/journal/1P3-2999118601/cheating-in-higher-
education-the-case-of-multi-methods

116
Kerkvliet, J., & Sigmund, C.L. (1999). Can we control cheating in the classroom? The Journal of
Economic Education, 30(4), 331-343. Retrieved July 29, 2015, from
http://www.researchgate.net/publication/46568472_Can_We_Control_Cheating_in_the_
Classroom
Kidwell, L.A., Wozniak, K., & Laurel, J.P. (2003). Student reports and faculty perceptions of
academic dishonesty. Teaching Business Ethics, 7(3), 205-214. Retrieved September 5,
2015, from
http://www.researchgate.net/publication/226650517_Student_Reports_and_Faculty_Perc
eptions_of_Academic_Dishonesty
Kitahara, R., Westfall, F., & Mankelwicz, J. (2011). New, multi-faceted hybrid approaches to
ensuring academic integrity. Journal of Academic and Business Ethics, 3, 1-12. Retrieved
July 29, 2015, from http://www.aabri.com/manuscripts/10480.pdf
Lang, J.M. (2013). Classroom practice – Are teachers creating classroom cheats? Times
Educational Supplement, 30(5059). 23-32. Retrieved July 29, 2015, from
https://www.tes.com/article.aspx?storyCode=6352762
Levy, E.S., & Rakovski, C.C. (2006). Academic dishonesty: A zero tolerance professor and
student registration choices. Research in Higher Education, 47(6), 735-754. Retrieved
July 29, 2015, from
http://www.jstor.org/stable/40197574?seq=1#page_scan_tab_contents
Malgwi, C.A., & Rakovski, C.C. (2009). Combating academic fraud: Are students reticent about
uncovering the covert? Journal of Academic Ethics, 7(3), 207-221. Retrieved October 28,
2015, from http://xa.yimg.com/kq/groups/21666630/529994379/name/Malgwi-%26-
Rakovski-2009-Combating-Academic-Fraud-Are-Students-Reticent-about-uncovering-
the-covert.pdf
McCabe, D.L. (2005). Cheating among college and university students: A North American
perspective. International Journal for Educational Integrity, 1(1), Article 2. Retrieved
November 23, 2015, from
http://www.ojs.unisa.edu.au/index.php/IJEI/article/download/14/9
McCabe, D., & Trevino, L. (1993). Academic Dishonesty: Honor Codes and Other Contextual
Influences. The Journal of Higher Education, 64(5), 522-538. doi:10.2307/2959991
McCabe, D.L., & Treviño, L.K. (1996). What we know about cheating in college: Longitudinal
trends and recent developments. Change: The Magazine of Higher Learning, 28(1), 28-
33. Retrieved October 28, 2015, from
http://www.tandfonline.com/doi/abs/10.1080/00091383.1996.10544253
McCabe, D.L., Butterfield, K.D., & Treviño, L.K. (2003). Faculty and academic integrity: The
influence of current honor codes and past honor code experiences. Research in Higher
Education, 44(3), 367-385. Retrieved October 28, 2015, from
http://link.springer.com/article/10.1023%2FA%3A1023033916853

117
McCabe, D.L., Treviño, L.K., & Butterfield, K.D. (1999). Academic integrity in honor code and
non-honor code environments: A qualitative investigation. The Journal of Higher
Education, 70(2), 211-234. Retrieved July 29, 2015, from
http://www.jstor.org/stable/2649128?seq=1#page_scan_tab_contents
McCabe, D.L., Treviño, L.K., & Butterfield, K.D. (2001). Cheating in academic institutions: A
decade of research. Ethics & Behavior, 11(3), 219-232.
McKibban, A.R., & Burdsal, C.A. (2013). Academic dishonesty: An in-depth investigation of
assessing measurable constructs and a call for consistency in scholarship. Journal of
Academic Ethics, 11(3), 185-197. Retrieved October 28, 2015, from
http://dx.doi.org/10.1007/s10805-013-9187-6
McMillan, J.H., & Schumacher, S. (2010). Research in education: Evidence-based inquiry (7th
ed.). Boston: Pearson Education.
Merriam, S.B. (2001). Qualitative research and case study applications in education (2nd
edition), San Francisco, CA: Jossey-Bass.
Michaels, J.W., & Miethe, T.D. (1989). Applying theories of deviance to academic cheating.
Social Science Quarterly, 70(4), 870-885.
Mixon, F.G. (1996). Crime in the classroom: an extension. Journal of Economic Education,
27(3), 195-200.
Moberg, C., Sojka, J.Z., & Gupta, A. (2008). An update on academic dishonesty in the college
classroom. Journal on Excellence in College Teaching, 19(1), 149-176. Retrieved July
29, 2015, from http://celt.muohio.edu/ject/issue.php?v=19&n=1
Murray, C.A., & Cox, L.A. (1979).Beyond Probation: Juvenile Corrections and the Chronic
Delinquent. Beverly Hills, CA: Sage Publications
Nagin, D.S., & Pogarsky, G. (2003). An experimental investigation of deterrence: Cheating, self-
serving bias, and impulsivity. Criminology, 41(1), 167-194. Retrieved July 29, 2015,
from http://onlinelibrary.wiley.com/doi/10.1111/j.1745-9125.2003.tb00985.x/abstractnew
Newton, P.M. (2016). Academic integrity: A quantitative study of confidence and understanding
in students at the start of their higher education. Assessment & Evaluation in Higher
Education, 41(3), 482-497. doi:10.1080/02602938.2015.1024199. Retrieved May 30,
2017, from https://cronfa.swan.ac.uk/Record/cronfa20205/Download/0020205-
17042015081413.pdf
Novotney, A. (2011). Beat the cheat. Monitor on Psychology, 42(6), 54. Retrieved July 29, 2015,
from http://www.apa.org/monitor/2011/06/cheat.aspx
Nuss, E.M. (1984). Academic integrity: Comparing faculty and student attitudes. Improving
College and University Teaching, 32(3), 140-144. Retrieved October 28, 2015, from
http://www.jstor.org/stable/27565630

118
Olafson, L., Schraw, G., & Kehrwald, N. (2014). Academic dishonesty: Behaviors, sanctions,
and retention of adjudicated college students. Journal of College Student Development,
55(7), 661-674. doi:10.1353/csd.2014.0066
Onwudiwe, I.D., Odo ,J., & Onyeozili, E.C. (2004). Deterrence theory. In M. Bosworth (Ed.),
Encyclopedia of Prisons and Correctional Facilities. (Volume 1, pp. 233-237). Thousand
Oaks, CA: Sage. Retrieved October 28, 2015, from
http://marisluste.files.wordpress.com/2010/11/deterrence-theory.pdf
Open Education Database, (2010). 8 Astonishing stats on academic cheating. Houston, TX:
OEDb.org. Retrieved July 29, 2015, from http://oedb.org/ilibrarian/8-astonishing-stats-
on-academic-cheating/
Owunwanne, D., Rustagi, N., & Dada, R. (2010). Students’ perceptions of cheating and
plagiarism in higher institutions. Journal of College Teaching & Learning, 7(11), 59-68.
doi:10.19030/tlc.v7i11.253. Retrieved May 30, 2017, from
https://www.cluteinstitute.com/ojs/index.php/TLC/article/download/253/243
Pacho, T.O. (2015). Exploring participants’ experiences using case study. International Journal
of Humanities and Social Science, 5(4), 44-53. Retrieved December 9, 2015, from
http://www.ijhssnet.com/journals/Vol_5_No_4_April_2015/5.pdf
Payne, S.L., & Nantz, K.S. (1994). Social accounts and metaphors about cheating. College
Teaching, 42(3), 90-96. Retrieved October 28, 2015, from
http://www.jstor.org/stable/27558657
Petress, K.C. (2003). Academic dishonesty: A plague on our profession. Education, 123(3), 624-
627. Retrieved July 29, 2015, from https://www.questia.com/library/journal/1G1-
100806954/academic-dishonesty-a-plague-on-our-profession
Pulvers, K., & Diekhoff, G.M. (1999). The relationship between academic dishonesty and
college classroom environment. Research in Higher Education, 40(4), 487-498.
Retrieved October 28, 2015, from http://dx.doi.org/10.1023/A:1018792210076
Reynolds, M.O. (1998). Does punishment deter? Dallas, TX: National Center for Policy
Analysis.
Rezaee, Z., Elmore, R.C., & Szendi, J.Z. (2001). Ethical behavior in higher educational
institutions: The role of the code of conduct. Journal of Business Ethics, 30(2), 171-183.
Retrieved July 29, 2015, from
http://link.springer.com/article/10.1023%2FA%3A1006423220775
Roberts, D., & Rabinowitz, W. (1992). An investigation of student perceptions of cheating in
academic situations. Review of Higher Education, 15(2), 179-190. (EJ444627). Retrieved
October 28, 2015, from http://eric.ed.gov/?id=EJ444627
119
Robinson, E., Amburgey, R., Swank, E., & Faulkner, C. (2004). Test cheating in a rural college:
Studying the importance of individual and situational factors. College Student Journal,
38(3), 380-395. Retrieved July 29, 2015, from
http://www.freepatentsonline.com/article/College-Student-Journal/123321896.html
Robinson-Zañartu, C., Peña, E.D., Cook-Morales, V., Peña, A.M., Afshani, R., & Nguyen, L.
(2005). Academic crime and punishment: Faculty members’ perceptions of and responses
to plagiarism. School Psychology Quarterly, 20(3), 318-337. (EJ744403). Retrieved July
29, 2015, from http://eric.ed.gov/?id=EJ744403
Schmelkin, L.P., Gilbert, K., Spencer, K.J., Pincus, H.S., & Silva, R. (2008). A multidimensional
scaling of college students’ perceptions of academic dishonesty. Journal of Higher
Education, 79(5), 587-607. Retrieved July 29, 2015, from
http://www.researchgate.net/publication/236701706_A_Multidimensional_Scaling_of_C
ollege_Students’_Perceptions_of_Academic_Dishonesty
Smith, T.R., Langenbacher, M., Kudlac, C., & Fera, A.G. (2013). Deviant reactions to the
college pressure cooker: A test of general strain theory on undergraduate students in the
United States. International Journal of Criminal Justice Sciences, 8(2), 88-104. Retrieved
July 29, 2015, from http://www.sascv.org/ijcjs/pdfs/smithetalijcjs2013vol8issue2.pdf
Stephens, J.M. (2004). Psychology through ecology: Academic motivation, moral aptitudes, and
cheating behavior in middle and high school settings. (Doctoral dissertation, Stanford
University). Retrieved July 29, 2015, from
http://www.academicintegrity.org/icai/assets/stephens.pdf
Storch, E., & Storch, J. (2002). Fraternities, sororities, and academic dishonesty. College Student
Journal, 36(2), 247-252. Retrieved October 28, 2015, from
http://www.freepatentsonline.com/article/College-Student-Journal/89809975.html
Tibbetts, S.G., (2012). Criminological Theory: The Essentials. Chapter 3: Modern applications
of the classical perspective: Deterrence, rational choice, and routine activities or lifestyle
theories of crime (pp. 51-64). Thousand Oaks, CA: Sage. Retrieved October 28, 2015,
from http://www.sagepub.com/sites/default/files/upm-binaries/64579_Chapter_3.pdf
Tippitt, M.P., Ard, N., Kline, J.R., Tilghman, J., Chamberlain, B., & Meagher, P.G. (2009).
Creating environments that foster academic integrity. Nursing Education Perspectives,
30(4), 239-244. Retrieved July 29, 2015, from
http://www.thefreelibrary.com/Creating+environments+that+foster+academic+integrity.-
a0206851963
Tittle, C.R., & Rowe, A.R. (1973). Moral appeal, sanction threat, and deviance: An experimental
test. Social Problems, 20(4), 488-498. Retrieved October 28, 2015, from
http://www.jstor.org/stable/799710

120
Vandehey, M.A., Diekhoff, G., & LaBeff, E.E. (2007). College cheating: A twenty-year follow-
up and the addition of an honor code. Journal of College Student Development, 48(4),
468-480. Retrieved July 29, 2015, from
http://www.researchgate.net/publication/234655108_College_Cheating_A_Twenty-
Year_Follow-Up_and_the_Addition_of_an_Honor_Code
Whitley, B.E. (1998). Factors associated with cheating among college students: A review.
Research in Higher Education: Journal of the Association for Institutional Research,
39(3), 235-274. (EJ567552). Retrieved October 28, 2015, from
http://link.springer.com/article/10.1023%2FA%3A1018724900565
Williams, M.S., & Hosek, W.R. (2003). Strategies for reducing academic dishonesty. Journal of
Legal Studies Education, 21(1), 87-107. Retrieved July 29, 2015, from
http://onlinelibrary.wiley.com/doi/10.1111/j.1744-1722.2003.tb00326.x/citedby

121
APPENDICES
APPENDIX A
Survey Instrument
1. What is your gender?
Male
Female
2. What is your age?
18-21
22-25
26-35
36-45
over 45
3. According to credit hours earned, what is your current academic class standing?
Freshman
Sophomore
Junior
Senior
Other
4. In which field is your declared major?
_______________________________________________________
Undecided
5. What is your current overall (cumulative) GPA?
0.0-1.50
1.51-2.00
2.01-2.50
2.51-2.75
2.76-3.00
3.01-3.50
3.51-4.0
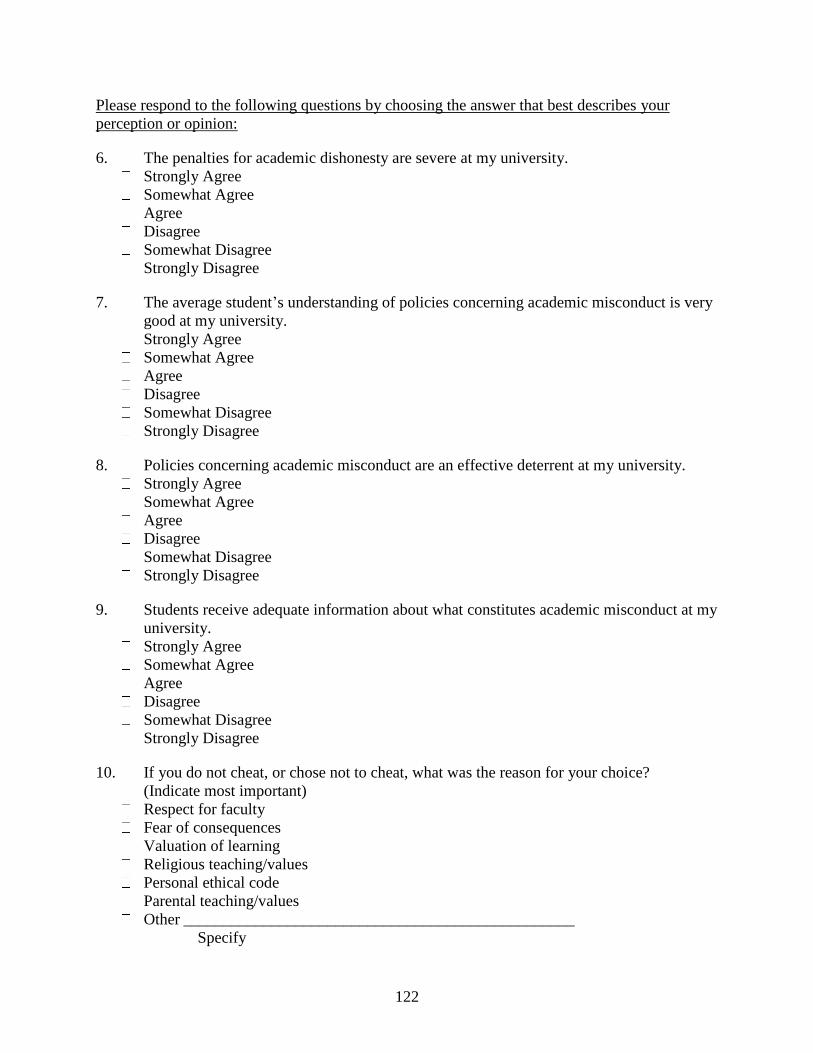
122
Please respond to the following questions by choosing the answer that best describes your
perception or opinion:
6. The penalties for academic dishonesty are severe at my university.
Strongly Agree
Somewhat Agree
Agree
Disagree
Somewhat Disagree
Strongly Disagree
7. The average student’s understanding of policies concerning academic misconduct is very
good at my university.
Strongly Agree
Somewhat Agree
Agree
Disagree
Somewhat Disagree
Strongly Disagree
8. Policies concerning academic misconduct are an effective deterrent at my university.
Strongly Agree
Somewhat Agree
Agree
Disagree
Somewhat Disagree
Strongly Disagree
9. Students receive adequate information about what constitutes academic misconduct at my
university.
Strongly Agree
Somewhat Agree
Agree
Disagree
Somewhat Disagree
Strongly Disagree
10. If you do not cheat, or chose not to cheat, what was the reason for your choice?
(Indicate most important)
Respect for faculty
Fear of consequences
Valuation of learning
Religious teaching/values
Personal ethical code
Parental teaching/values
Other _________________________________________________
Specify
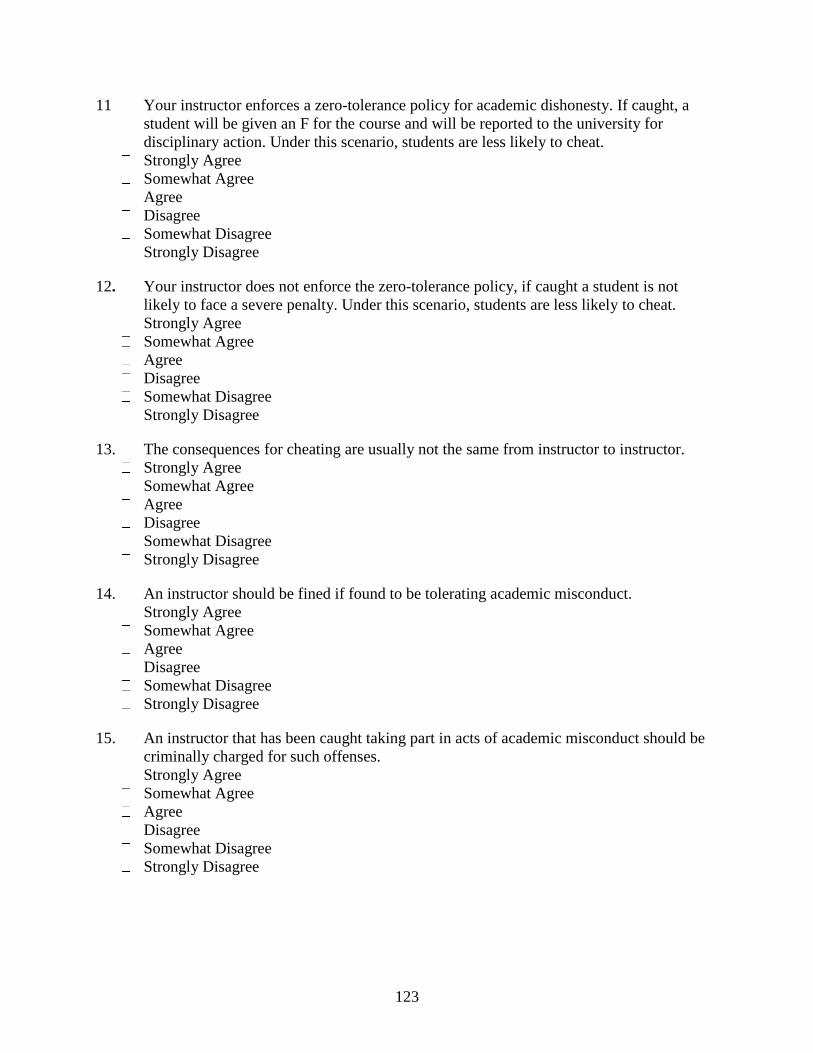
123
11 Your instructor enforces a zero-tolerance policy for academic dishonesty. If caught, a
student will be given an F for the course and will be reported to the university for
disciplinary action. Under this scenario, students are less likely to cheat.
Strongly Agree
Somewhat Agree
Agree
Disagree
Somewhat Disagree
Strongly Disagree
12. Your instructor does not enforce the zero-tolerance policy, if caught a student is not
likely to face a severe penalty. Under this scenario, students are less likely to cheat.
Strongly Agree
Somewhat Agree
Agree
Disagree
Somewhat Disagree
Strongly Disagree
13. The consequences for cheating are usually not the same from instructor to instructor.
Strongly Agree
Somewhat Agree
Agree
Disagree
Somewhat Disagree
Strongly Disagree
14. An instructor should be fined if found to be tolerating academic misconduct.
Strongly Agree
Somewhat Agree
Agree
Disagree
Somewhat Disagree
Strongly Disagree
15. An instructor that has been caught taking part in acts of academic misconduct should be
criminally charged for such offenses.
Strongly Agree
Somewhat Agree
Agree
Disagree
Somewhat Disagree
Strongly Disagree
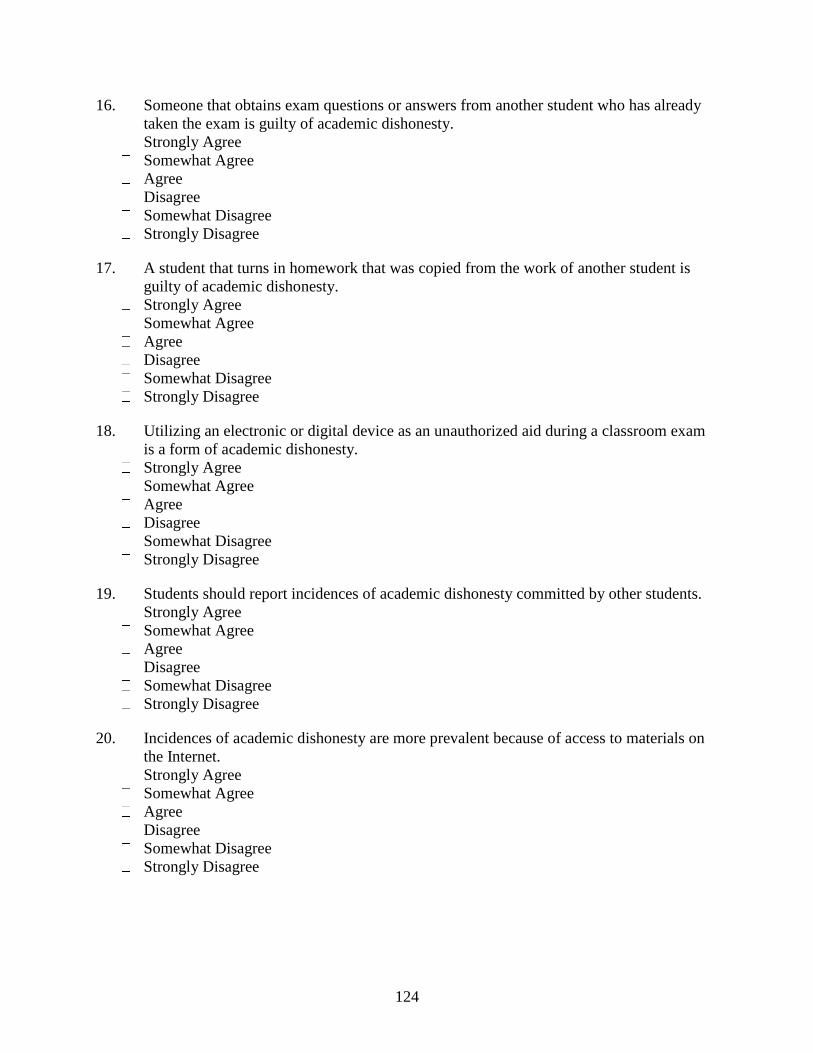
124
16. Someone that obtains exam questions or answers from another student who has already
taken the exam is guilty of academic dishonesty.
Strongly Agree
Somewhat Agree
Agree
Disagree
Somewhat Disagree
Strongly Disagree
17. A student that turns in homework that was copied from the work of another student is
guilty of academic dishonesty.
Strongly Agree
Somewhat Agree
Agree
Disagree
Somewhat Disagree
Strongly Disagree
18. Utilizing an electronic or digital device as an unauthorized aid during a classroom exam
is a form of academic dishonesty.
Strongly Agree
Somewhat Agree
Agree
Disagree
Somewhat Disagree
Strongly Disagree
19. Students should report incidences of academic dishonesty committed by other students.
Strongly Agree
Somewhat Agree
Agree
Disagree
Somewhat Disagree
Strongly Disagree
20. Incidences of academic dishonesty are more prevalent because of access to materials on
the Internet.
Strongly Agree
Somewhat Agree
Agree
Disagree
Somewhat Disagree
Strongly Disagree
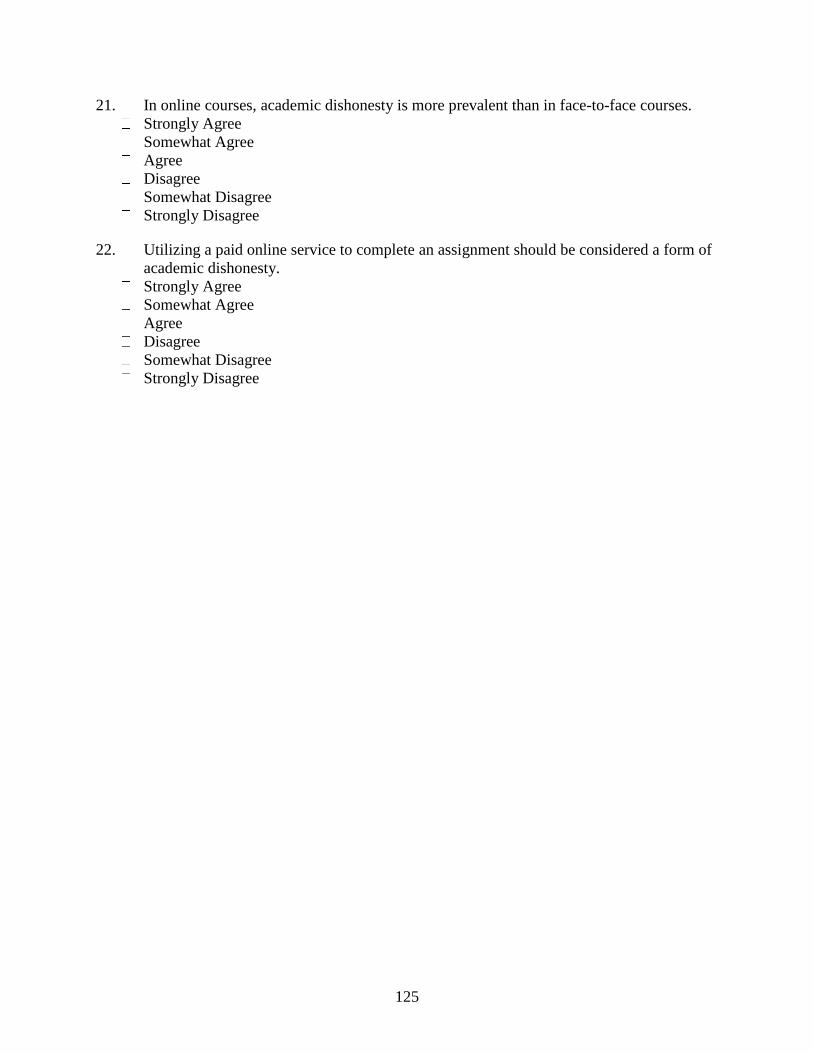
125
21. In online courses, academic dishonesty is more prevalent than in face-to-face courses.
Strongly Agree
Somewhat Agree
Agree
Disagree
Somewhat Disagree
Strongly Disagree
22. Utilizing a paid online service to complete an assignment should be considered a form of
academic dishonesty.
Strongly Agree
Somewhat Agree
Agree
Disagree
Somewhat Disagree
Strongly Disagree

126
APPENDIX B
Dimension and Survey Information
The survey has twenty-two (22) questions providing demographic information and five
(5) dimensions. The following shows the questions that provided data for demographics and each
dimension:
• Demographics: Questions 1, 2, 3, 4, 5
• Dimension 1- Use of Technology: Questions 18, 20, 21, 22
• Dimension 2- Perceptions of Policy: Questions 11, 12, 13
• Dimension 3- Instructor Consequences: Questions 14, 15
• Dimension 4- Student Consequences: Questions 6, 7, 8, 9
• Dimension 5- Student Conduct: Questions 10, 16, 17, 19

127
APPENDIX C
Academic Dishonesty in Higher Education Questionnaire – Request for Permission
Dear Sir or Ma’am,
I am a doctoral student at East Tennessee State University in Johnson City, TN, and I am
currently working on my doctoral dissertation entitled Academic Dishonesty in Higher
Education: Perceptions and Opinions of Undergraduates.
I am writing to request permission to use students at your university for participation in a survey
that is estimated to take no longer than 5-10 minutes.
Their participation is completely voluntary and their submission will remain anonymous. Please
let me know what additional information is needed. You may contact us with any questions
regarding the survey. I can be reached at [email protected]. You may also contact my faculty
advisor for this research study, Dr. James Lampley at [email protected].
Please note, this research project has been reviewed and approved by the ETSU College of
Education, the Educational Leadership and Policy Analysis department, as well as the ETSU
Institutional Review Board.
If you have any questions or concerns about the research and want to talk to someone
independent of the research team, you may call an ETSU IRB Coordinator at 423-439-6002 or at
ETSU IRB Coordinator at [email protected].
I greatly appreciate your assistance with furthering my research study.
Thank you for your time and consideration.
Sincerely,
Stanley Hodges

128
APPENDIX D
Letter to Prospective Participants
Dear Participant,
My name is Stanley Hodges, and I am a graduate student at East Tennessee State University. I
am working on my doctoral degree in Educational Leadership Policy Analysis. In order to finish
my studies; I need to complete a research project. The name of my research project is Academic
Dishonesty in Higher Education: Perceptions and Opinions of Undergraduates.
With the permission of the College of Education, the Educational Leadership and Policy
Analysis Department, I am conducting an in-person survey. The purpose of this study is to
possibly inform students, faculty, staff, and other stakeholders how best to meet the needs of
undergraduate students.
Please note, this research project has been reviewed and approved by the ETSU Institutional
Review Board. You may contact the ETSU IRB with any questions regarding your rights as a
research subject.
I would like to give a brief in-person method type such as a survey.
To participate in this study, you must be currently enrolled as an undergraduate student and at
least 18 years of age, or older. Participation in this study is entirely voluntary and your
submission will remain anonymous. No individual identifiable information will be collected.
Only the researchers involved will have access to the aggregated information provided by
participants. Your confidentiality will be maintained to the degree permitted by the technology
used. Specifically, no guarantees can be made regarding the interception of data sent via the
Internet by any third parties, as the case with emails. In other words, we will make every effort to
ensure that your name is not connected with your responses. Although your rights and privacy
will be maintained, the ETSU IRB (for non-medical research) and personnel particular to this
research department have access to the study records.
129
You are not obligated to participate, and there is no penalty for not participating. You may end
your participation at any point. It will take approximately 10 minutes to complete. You will be
asked questions concerning your opinions of academic dishonesty and further your opinion and
or knowledge of your universities academic dishonesty policy. Since this study deals with
academic dishonesty, it might cause some minor stress. However, you may feel better after you
have had the opportunity to express yourself about academic dishonesty.
Your participation will add valuable data to this study. Your completion of the survey will be
considered your consent for participation.
If you have any research-related questions or problems, you may contact me, Stanley Hodges, at
[email protected] or my research coordinator, Dr. James Lampley at [email protected],
telephone number 423-439-7619. Also, the chairperson of the Institutional Review Board at East
Tennessee State University is available at 423-439-6054 if you have questions about your rights
as a research subject. If you have any questions or concerns about the research and want to talk
to someone independent of the research team or you can’t reach the study staff, you may call an
IRB Coordinator at 423-439-6055 or 423-439-6002.
I greatly appreciate your assistance with furthering my research study.
Stanley Hodges

130
VITA
STANLEY KEITH HODGES
Education: East Tennessee State University, Johnson City, TN, Ed.D.,
Educational Leadership, August 2017.
East Tennessee State University, Johnson City, TN, Graduate
Certificate: Forensic Document Examination, 2010.
East Tennessee State University, Johnson City, TN, M.A.,
Criminal Justice and Criminology, 2008.
East Tennessee State University, Johnson City, TN, B.S., Criminal
Justice, 1990.
East Tennessee State University, Johnson City, TN, A.S., Criminal
Justice, 1985.
Professional Experience Special Agent Criminal Investigator, Tennessee Bureau of
Investigation, 2002 – Present.
Deputy Sheriff, Sullivan County Tennessee Sheriff’s Office, 1985
– 2002.
Reserve Law Enforcement Officer, Sullivan County Tennessee
Sheriff’s Office, 1981 – 1985.


