
Department of Biology and Biological Engineering CHALMERS UNIVERSITY OF TECHNOLOGY Gothenburg, Sweden 2018
Accelerated shelf life tests of wheat tortillas
A study of microbial and textural deterioration
in wheat tortilla Master’s thesis within the Master Degree Program in Biotechnology
FREDRIK NILSSON

Accelerated shelf life tests of wheat tortillas
A study of microbial and textural deterioration
in wheat tortilla
FREDRIK NILSSON
Department of Biology and Biological Engineering
Division of Food and Nutrition Science
CHALMERS UNIVERSITY OF TECHNOLOGY
Gothenburg, Sweden 2018

Accelerated shelf life tests of wheat tortillas
A study of microbial and textural deterioration in wheat tortilla
Fredrik Nilsson
© Fredrik Nilsson, 2018.
Supervisors: Caroline Jonsson, Louise Lagerstedt and Peter Blomgren, Santa Maria AB,
Mölndal
Examiner: Marie Alminger, Department of Biology and Biological Engineering,
Chalmers University of Technology, Gothenburg
Department of Biology and Biological Engineering
Food and Nutritional Science
Chalmers University of Technology
SE-412 96
Sweden
Telephone +46(0)31-772 1000

Acknowledgements
First, I would like to thank my supervisors Caroline Jonsson, Louise Lagerstedt and Peter
Blomgren as well as my examiner Marie Alminger for helping me plan the project and
answering the large number of questions from me during the project.
My sensory test panel also deserves huge thanks for their willingness to test tortillas
repeatedly even when they tasted really bad. The panel consisted of Andrea Lembke,
Ann-Sofie Olausson, Caroline Jonsson, Joel Waje, Julia Jonsson, Jonas Wranger, Kristel
Kütt, Patrik Ericsson and Peter Blomgren. I would also like to thank Julia Jonsson for
helping me with the software used for the sensory tests.
A big thanks to Katja Wolff and Yvonne Nyström for helping me with the water activity
labs and sending samples to Eurofins for validation and microbial analysis. I also want to
thank Per Korneliusson at Perten Instruments AB for teaching me how to use the texture
analyser.
Lastly, I want to express my thankfulness to all Santa Maria employees for being really
kind to me and making me feel very welcome at your office in Mölndal and production
site in Landskrona.
Fredrik Nilsson, Gothenburg, May 2018
Accelerated shelf life tests of wheat tortillas
A study of microbial and textural deterioration in wheat tortilla
Fredrik Nilsson
Department of Biology and Biological Engineering
Chalmers University of Technology
Abstract
This study tried to shorten the time required for shelf life studies in product development
of wheat tortillas, by developing accelerated shelf life test (ASLT) models for microbial
and textural shelf life. ASLTs speed up product degradation by exposure to extreme
environmental conditions and in this case were temperature and relative humidity (RH)
used. The samples were divided into four storage groups: 3°C and 70% RH, 20°C and
30% RH, 27°C and 80% RH as well as 40°C and 80% RH. Texture was determined with
a fold/roll-method, an instrument and by a sensory panel. Microbial concentrations were
determined by a laboratory company. Gas composition inside the bags, tortilla pH, water
content and water activity were measured to determine possible links to the shelf life.
It was not possible to calculate an ASLT model for the microbial growth because of
unknown starting number of microbes. The microbial tests however showed that a high
temperature and humidity caused the number of bacteria to rapidly increase above what
is considered acceptable. Microbial ASLTs thus seem possible, but more tests with a
lower detection limit are needed to create a model. To avoid bad taste from non-
pathogenic bacterial growth, consumers are recommended to avoid storing the tortillas in
high temperature and/or humidity.
Textural ASLTs also seem possible in regards of rollability and foldability, but more tests
are needed to precisely determine the accelerating factor. Stickiness and translucency
seems to deteriorate much slower than rollability and foldability under normal storage
conditions. It is therefore suggested to be enough to check that freshly baked tortillas meet
the quality requirements of stickiness and translucency. Tortillas seemed to lose textural
quality at the same rate, or slower, in refrigerator compared to room conditions. Longer
shelf life studies are therefore suggested, to verify if this is the case. If so, storage in a
refrigerator could possibly prolong shelf life of wheat tortillas. Changes in the modified
atmosphere inside the bags seems to correlate with textural degradation. A study with
atmospheric air instead would therefore be interesting as an attempt to determine if it
retards textural degradation in wheat tortillas.
Keywords: Accelerated shelf life tests, Wheat tortillas, Microbial growth, Staling, Starch
retrogradation, Water migration, Rollability, Foldability, Sensory evaluation, Texture
analyser

Table of Contents
1. INTRODUCTION .................................................................................................................................. 1
1.1. BACKGROUND ....................................................................................................................................... 1 1.2. AIMS ................................................................................................................................................... 1 1.3. LIMITATIONS ......................................................................................................................................... 1
2. THEORY .............................................................................................................................................. 3
2.1. WHEAT TORTILLA: A SHORT HISTORY .......................................................................................................... 3 2.2. WHEAT TORTILLA PRODUCTION ................................................................................................................. 3 2.3. THE INGREDIENTS OF WHEAT TORTILLA AND THEIR ROLES................................................................................ 4
2.3.1. Wheat flour and wheat gluten ................................................................................................... 4 2.3.2. Water ......................................................................................................................................... 5 2.3.3. Rapeseed oil ............................................................................................................................... 5 2.3.4. Glycerol ...................................................................................................................................... 5 2.3.5. Salt ............................................................................................................................................. 5 2.3.6. Mono- and diglycerides of fatty acids ........................................................................................ 5 2.3.7. Sodium bicarbonate ................................................................................................................... 5 2.3.8. Citric acid ................................................................................................................................... 6 2.3.9. Xanthan gum ............................................................................................................................. 6
2.4. DETERIORATION OF WHEAT TORTILLA ......................................................................................................... 6 2.4.1. Microbial spoilage...................................................................................................................... 6 2.4.2. Staling ........................................................................................................................................ 9 2.4.3. Changes in moisture content ................................................................................................... 11 2.4.4. Stickiness .................................................................................................................................. 11
2.5. ACCELERATED SHELF LIFE TESTS ............................................................................................................... 11 2.5.1. Environmental conditions ........................................................................................................ 12 2.5.2. Kinetic models .......................................................................................................................... 12
2.6. MICROBIAL ANALYSIS ............................................................................................................................ 13 2.7. TEXTURAL SENSORY EVALUATION ............................................................................................................. 13
3. MATERIALS AND METHODS ............................................................................................................. 15
3.1. STORAGE CONDITIONS AND SAMPLING ...................................................................................................... 15 3.2. TEXTURE ANALYSIS ................................................................................................................................ 15
3.2.1. Fold/roll-method ...................................................................................................................... 15 3.2.2. Puncture test by a texture analyser ......................................................................................... 16 3.2.3. Sensory analysis ....................................................................................................................... 17
3.3. MICROBIAL ANALYSIS ............................................................................................................................ 17 3.4. ANALYSIS OF INTERNAL AND EXTERNAL FACTORS ......................................................................................... 18
3.4.1. Oxygen and carbon dioxide concentrations ............................................................................. 18 3.4.2. pH-value ................................................................................................................................... 18 3.4.3. Moisture content ..................................................................................................................... 18 3.4.4. Water activity .......................................................................................................................... 18
3.5. STATISTICAL ANALYSIS ........................................................................................................................... 19
4. RESULTS ........................................................................................................................................... 20
4.1. INTERNAL AND EXTERNAL FACTORS .......................................................................................................... 20 4.2. MICROBIAL ANALYSES ........................................................................................................................... 23 4.3. TEXTURAL ANALYSES ............................................................................................................................. 24
4.3.1. Fold/roll.................................................................................................................................... 24 4.3.2. Texture analyser ...................................................................................................................... 27 4.3.3. Sensory analyses ...................................................................................................................... 27
5. DISCUSSION ..................................................................................................................................... 31

6. CONCLUSIONS AND FURTHER RESEARCH ......................................................................................... 34
REFERENCES ......................................................................................................................................... 36
APPENDICES ............................................................................................................................................ I
A. POPULAR SCIENCE SUMMARY ....................................................................................................................... I B. SENSORY QUESTIONNAIRE ........................................................................................................................... II C. STANDARD DEVIATIONS OF THE MEANS ......................................................................................................... III D. VERIFICATION RESULTS ............................................................................................................................. VII E. EXAMPLE CALCULATIONS .......................................................................................................................... VIII

1
1. Introduction
Consumers have increased their concerns for their food to be safe, healthy and of excellent
quality over the entire shelf life (1). Even a single batch that does not meet the consumers’
high expectations might be catastrophic for the brand. It has also been shown that a
delayed release of a new product can have a hugely negative impact on the lifetime profits
of the product (2). To stay competitive, many food companies are therefore trying to
decrease the developing times of new recipes while still guaranteeing a high quality of
the products.
Numerous products have a shelf life of several months or even years, which makes the
storage part of shelf life studies take up a large portion of the developing time.
Accelerated shelf life tests (ASLTs) can often be developed to speed up the shelf life
studies, by vastly reducing the needed storage time while still generating reliable
predictions of the shelf life of a new recipe (3).
1.1. Background Santa Maria produces wheat tortillas as soft flatbreads in their own factory as one of their
biggest products in regards of sales volume. These tortillas have a shelf life of up to 6
months without the addition of preservatives (4). The long shelf life is instead reached
with a clean room technology in the production as well as a modified atmosphere in the
package and ingredients that lower the product water activity and pH-value. The longer
shelf life lowers the waster since less needs to be thrown away due to spoilage or
unsatisfactory texture. A long shelf life also gives a higher profitability for the company
since the transports do not need to be as frequent as for a product with short shelf life and
they can be sent longer distances away from the bakery (5). The long shelf life has
however the drawback that it acts as a brake in the development of any change in
ingredients supplier, recipe, packaging or process, since new shelf life tests are needed to
evaluate possible shelf life changes in these cases (6). The access to getting verification
samples is also very limited due to a highly automated and up-scaled production.
Consequently, it would be beneficial for the company with an ASLT for wheat tortillas
to get fast quality indications and shorten the developing times.
1.2. Aims The main aim of this project was to develop an ASLT model with temperature and
humidity as environmental test conditions for textural degradation and microbial spoilage
of wheat tortilla. The project also studied oxygen and carbon dioxide in the package,
moisture content, water activity and pH of the tortillas to see if they were affected by the
environmental conditions. Lastly the aim was also to measure the texture differences with
three different methods. Firstly, with the fold/roll-method that already is implemented by
the company, secondly with a sensory panel and thirdly with an objective instrument. The
idea was to see if a sensory panel or instrument could complement or be replace the
fold/roll-method.
1.3. Limitations This project was limited to just one tortilla product despite the company having a
multitude of different tortilla variants. The number of samples of that product was also
limited due to space and budget restrictions. Consequently, the number of replicates in
some tests are very low. Many of the results are therefore only indicative.

2
Humidity and temperature were the environmental conditions chosen for the accelerated
storage, despite there being more possible environmental conditions for ASLTs. Other
environmental conditions, such as light, were not deemed to be of high relevance for
tortilla deterioration as it is mainly microbial spoilage and textural degradation that limits
the shelf life (7).
The microbial analysis was not performed on samples stored under refrigerated
conditions because negligible numbers of microbes were thought to grow on those
tortillas.
The effect of different storage conditions on the shelf life was the focus of the project and
is therefore what mainly is discussed in this report. Factors like ingredients, process and
packaging that also affects the shelf life are only described briefly in the theory.

3
2. Theory
This chapter briefly covers the history of soft tortillas, how they are produced, the
ingredients, how wheat tortillas degrades and how the degradation can be studied.
2.1. Wheat tortilla: a short history Tortillas based on corn were invented several thousand years ago by the Mesoamerican
tribes (8). To bake tortillas with wheat flour was not introduced until the first Europeans
discovered America, but wheat tortillas have now become a traditional food in the
northern part of Mexico and are very popular in both Europe and the United States (9).
The recipe of wheat tortillas in Europe and the United States is similar to the Mexican
variant, except for that the Mexican variant lacks baking powder (9).
Homemade tortillas stale very quickly and are therefore usually consumed in the same
day as they are baked (10). Tortillas is a staple food in North America and the short shelf
life is therefore not much of a problem there. Anyhow, in Europe tortillas are not
consumed often enough to be considered a staple food and the demand for a long shelf
life is therefore generally higher in Europe. The European tortilla industry has therefore
increased the shelf life of commercially baked tortillas to several months by optimizing
the recipe, package and production process (4).
2.2. Wheat tortilla production The production of wheat tortilla is today highly automated and contains several steps to
reach a tortilla ready to sell to the market from having just a mix of ingredients. A rough
sketch over the most important steps in the production of the studied tortillas can be seen
in figure 1. This process is of the hot-press variant, but other variants such as a die-cut
and hand-stretch process are also common approaches (11). They have slightly different
setups and yield firmer tortillas that are more suitable for fried foods (11).
Figure 1. A general setup of the bakery line used to bake the studied tortillas (edited with permission from Santa Maria
AB).
As can be seen in figure 1, the ingredients are first added into a continuous mixer where
they are mixed into a dough which is divided into dough balls in the divider and rounder.
It is very important that the tortilla dough is mixed well for the rest of the downstream
processing to work optimally (11). It is also important to monitor parameters such as
water absorption of the wheat flour and temperature of the added water to get an optimal
dough (11). The dough balls are let to rest a short time in the proofer before they are
pressed into flat disks in the hot-press. The tortilla disks are then baked in an oven with
three tiers where the tortillas are flipped two times in the oven. This results in that the

4
tortillas are baked one time at one side and two times at the other side, giving the wanted
appearance and texture. The reactions that causes texture and flavour changes in the oven
are the Maillard reaction, gluten denaturation and starch gelatinization (11). The elevated
temperature also kills of most of the microbes present in ingredients such as the wheat
flour. After the newly baked tortillas leaves the oven they are cooled down to just above
normal room temperature. The cooled tortillas are packed as stacks in bags and a modified
atmosphere is added. The tortillas are quality controlled at several steps during the
packaging. For example, shape, weight, gas leakage and metal contamination are checked
before the tortillas leaves the packaging room. To decrease the risk of microbial
contamination through air, both the packaging and baking rooms have an increased air
pressure with only filtered air entering the rooms.
2.3. The ingredients of wheat tortilla and their roles The ingredients of the studied tortillas are the following, in decreasing order, according
to the Santa Maria web (4): wheat flour, water, rapeseed oil, E422 (glycerol), salt, E471
(mono- and diglycerides of fatty acids), wheat gluten, sodium bicarbonate, citric acid and
E415 (xanthan gum). This subchapter will discuss the purpose of each one of these
ingredients to be included in the recipe.
2.3.1. Wheat flour and wheat gluten
The main ingredient of the studied tortillas is wheat flour, constituting the vast majority
of the tortilla weight (4). The proteins are the most important components in wheat flour
for bread baking (12). The reason is that the two wheat proteins glutenin and gliadin form
a gluten network which entraps carbon dioxide during baking and thus gives volume to
the bread and makes tortillas elastic with a fluffy crumb (12). This yields a flexible tortilla
with good foldability and longer shelf life (13). Wheat flour that generally is suitable for
baking bread has a high protein content with a strong gluten network and extra gluten is
often added to further strengthen the gluten network (14). However, too much protein
causes problems due to the dough being too tough, losing extensibility, and the tortillas
might become smaller, thicker and less opaque than ideal (15). Other factors largely
influenced by wheat flour are the textural shelf life, tortilla shape, baking properties and
characteristic flavour as well as translucency (13,15–17).
The main component in wheat flour is starch (18). It is important for flexibility of tortillas,
which can be seen when studying stored tortillas with different baking times. Tortillas
with longer baking times have a greater more starch as dispersed and retrograded (see
2.4.2.1. Starch retrogradation) after storage, making them less flexible and more prone
to breakage than tortillas with shorter baking times (15). The amylose-amylose gel
structure, formed by amylose that leaks from the starch granules in wheat starch, also
helps the gluten network with trapping gas formed during baking and giving structure to
the tortilla (12,15). The starch is also a very important factor in the water absorption
capacity of the dough since it can absorb 40% of its own weight of water (12). Starch that
is damaged in the milling process can even absorb as much water as twice its own weight
(12). A higher water absorption capacity means that more water can be added, resulting
in a softer tortilla (12). Damaged starch can thus be beneficial, but too much damaged
starch can reduce the textural quality.
Flour characteristics such as protein content and the ratio between amylose and
amylopectin in the starch can be very different between different batches, resulting in a
large variability in texture and shelf life of tortillas if the miller and/or bakery does not

5
adapt accordingly (12,13,16,17). Otherwise there might for example be a detrimental
change in water absorption of the dough as well as kneading requirements, leading to
insufficient quality of the product (15).
2.3.2. Water
Water is mainly used for hydration and the more water that is added to the tortilla dough,
the more soft it becomes (12,15). More water might however also result in a stickier
tortilla dough that is difficult to process (12,15).
2.3.3. Rapeseed oil
Some of the added rapeseed oil migrates to the outer tortilla surfaces during the hot-
pressing stage of baking (15). There it acts as a lubricant making the tortilla adhere less
to other surfaces (15). Another major effect of added oil is that the dough becomes much
softer and the tortilla less firm, without having to add additional water, thanks to the oil
weakening the gluten network (15). Rapeseed oil also makes the tortilla better at retaining
fillings and gives it a prolonged shelf life, better reheating capacity and improves the
extensibility (15,19,20). However, an addition of too much oil can yield sticky tortillas
and tortillas that feel satiny, fatty or lubricated (15).
2.3.4. Glycerol
Glycerol is used to reduce the water activity and thus helps prolong shelf life by inhibiting
microbial growth and reducing textural deteriorations such as stickiness (15,20).
2.3.5. Salt
Salt enhances the flavour of other ingredients in the tortilla as well as making the tortilla
taste saltier (12). Another major reason to add salt to the product is to prolong shelf life
by reducing the water activity (12,20). It also helps develop the gluten network and
decreases stickiness (12). Too much salt might however result in a tough dough, with an
undesirable flavour profile, that requires adaptations in the processing to reach wanted
textural quality in the end product. There is also an attempt to reduce the salt consumption
in western countries since the currently high salt consumption gives an increased risk of
high blood pressure, stroke and cardiovascular disease (21).
2.3.6. Mono- and diglycerides of fatty acids
Mono- and diglycerides of fatty acids creates complexes with amylose and decreases
starch dispersion during gelatinization, resulting in less dispersed amylose during baking
and a weaker amylose gel (15). These changes, in turn, retards the rate of both starch
retrogradation and moisture migration; thus giving a crumb that does not decrease in
softness as rapid as otherwise during storage, less stickiness and an overall retarded
quality loss in the tortilla texture (15,20).
2.3.7. Sodium bicarbonate
Sodium bicarbonate, also commonly called baking powder when combined with an acid,
produces carbon dioxide at elevated temperatures in a reaction together with an acid (15).
The carbon dioxide production increases the volume of the product by creating gas
bubbles that gets entrapped in the dough structure. Sodium bicarbonate thus affects the
texture of the tortilla by making it fluffier and increasing its diameter.
Acting as a base, sodium bicarbonate also affects the pH of the tortilla to be higher, which
might let microbes grow easier on the product and that the dough becomes hard and more
difficult to process with more translucency in the final product (22). It might also affect

6
the taste negatively if not mixed evenly in the tortilla. Due to these drawbacks it is
important to balance the sodium bicarbonate to acid relation to have little or no sodium
bicarbonate left in the finished product.
2.3.8. Citric acid
Citric acid reacts with baking powder as described in 2.3.7. Sodium bicarbonate. Citric
acid also contributes to lowering the pH and thus increasing the shelf life (5). It is also
commonly used to prevent flavour changes, discoloration and rancidity of the product
(23), but too much citric acid added might result in an acidic taste.
2.3.9. Xanthan gum
The tortilla texture is improved by the addition of xanthan gum since it stabilizes the oil
in water emulsion. Xanthan gum also allows a larger addition of water and prolongs shelf
life through a reduction of staling and stickiness by reducing water activity and water
migration (15,24). However, too much xanthan gum might lead to more translucent areas
on the tortillas and a stickier tortilla dough that is more difficult to mix and requires a
longer mixing time (15,24). This leads to a weakened gluten network formation since
bakeries seldom have time to increase the mixing time (15).
2.4. Deterioration of wheat tortilla Food items degrade in a multitude of ways. These degradation processes leads to
unsatisfactory quality in the sense of undesirable taste, smell, appearance or texture; the
food could even be dangerous to consume in some cases (25). The rate of the degradation
is dependent on both intrinsic and extrinsic factors. Extrinsic factors are describing the
environment along the food chain. Examples of extrinsic factors are: temperature, relative
humidity, light exposure and gas composition inside the package (23). Intrinsic factors
are instead factors describing the food product itself, such as the water content, water
activity, pH, and the addition of preservatives and other food additives (23). Despite a lot
of different degradation processes taking place at the same time in food items, there is
usually just one or a few which limits the shelf life. The reason is that they have higher
kinetic rates than the others under the given intrinsic and extrinsic factors. For example,
in bakery products it is mainly microbial spoilage and textural changes such as staling,
changes in moisture content and stickiness that limits the shelf life (5,15,26). Of these,
microbial spoilage in the form of moulds is usually the most important due to its huge
potential for bad brand publicity and health concerns regarding the consumer (5). Other
deterioration processes, such as rancidity, are in general not relevant for bakery products
before either the microbial spoilage or textural changes already is unacceptable (7). The
rest of this chapter will therefore focus on microbial spoilage, staling, changes in moisture
content and stickiness.
2.4.1. Microbial spoilage
Microbial spoilage is unwanted because it might be dangerous to the consumer, lead to
unwanted gas formation, discoloration, changed flavour and odour as well as visible
colonies on the product (27). It was estimated that a third of the world’s food production
was lost back in year 2000 due to microbial spoilage, making it a highly significant
problem for all parts involved from producer to consumer (27). In bread it is mainly
moulds and spore forming bacteria that spoils the product (5,28,29). Moulds being extra
problematic since many have optimal growth temperatures of 25°C or a bit higher (30),
which for example can occur during transport in a truck on a hot day.

7
It is very important to not underbake the tortillas, because less microbes are inactivated
the less the tortilla is baked and underbaked tortillas are also more prone to contamination
due to a higher water activity than optimally baked tortillas (15). The tortilla’s surfaces
are normally mould free when it leaves the oven, thanks to the high oven temperature, but
they can get contaminated from cooling, packaging and cutting steps later in the process
(7). Hot-press tortillas are divided before the oven, eliminating that potential for
contamination from cutting. The focus should thus be on ensuring that there is no
contamination during cooling or packaging of the tortillas and that any spores that
survived inside does not propagate to large amounts.
In the air of bakeries there is a large number of mould spores present no matter how good
the cleaning practices and hygiene standards are (5). It would not be enough to guarantee
that there will not be any microbial spoilage over an infinite time even if the cleaning
reduced the number to a single spore, since only a single spore has potential to spoil the
food item (5). However, good cleaning practices and hygiene standards reduce the
number of microbes and thus increases the shelf-life since a lower initial amount of
microbes in the food item means that it takes longer time for them to reach dangerous
amounts (5).
The cereals used to produce flour are also usually contaminated with a lot of bacteria,
yeasts and filamentous fungi (7,28). Whether these microbes will be able to grow in the
final food product is determined by a multitude of factors. These factors can be divided
into intrinsic factors, including water activity, pH, redox potential, availability of
nutrients and inhibitory substances, and extrinsic factors, including the relative humidity,
gas composition in the package and the process as well as storage temperature (5,6,31,32).
It should be noted that many of these factors have synergistic effects, meaning that
although for example the water activity and temperature present are not extreme enough
to inhibit growth by themselves they might inhibit growth when combined (6). Out of the
large number of factors affecting microbial growth, it is generally the water activity,
temperature, pH and availability of oxygen as well as other nutrients that mainly affects
the growth rate in preservative free bread (5,31). The following subchapters will therefore
focus on water activity, temperature, pH and modified atmospheres. Bread products, such
as the studied tortilla bread, where all of these factors are taken into consideration have a
potential microbial shelf life of several months (20).
2.4.1.1. Modified atmosphere
One common approach to slow down the rates of unwanted reactions as well as growth
of microbes is to package the product in a modified atmosphere (23). There are three
approaches to modified atmosphere packaging. Oxygen scavengers that over time
decreases the present oxygen in the package, could be used in the package (5,33). Ethanol
vapour could also be added to the atmosphere inside the package since it inhibits
microbial growth and has been shown to reduce the rate of staling of some bakery
products (5,28). Lastly, the oxygen in normal atmospheric air could be exchanged in
favour of other gases such as nitrogen, argon and/or carbon dioxide (5,23,31). It is the
last approach that is used in the studied tortillas and the mechanisms behind it are
therefore described in more detail in the rest of this subchapter.
Both argon and nitrogen are inert and thus have no other antimicrobial effect than that
they reduce the amount of oxygen present (5). A reduction in present oxygen can inhibit
moulds and other aerobic microbes, but to have an antimicrobial effect there must not be

8
more than 2% oxygen in the headspace atmosphere during storage (5). It is however
difficult to maintain a low enough oxygen concentration during storage since some
oxygen enters the package even if an impermeable wrapping material is used (5). The
food item itself might also have some atmospheric air pockets inside it that are not entirely
eliminated in gas flushing systems, resulting in a diffusion of oxygen from the food item
into the headspace atmosphere (5). The main purpose of argon and nitrogen gas in
modified atmospheres is instead generally as filler gases to ensure that the package does
not collapse when the carbon dioxide decreases over time due to absorption into the food
or leakage from the package (31).
Carbon dioxide has been shown to have an antimicrobial effect even at lower levels used
(5,23,31), especially at lower temperatures since more carbon dioxide then is absorbed
into the food product (34). Some suggest that carbon dioxide in the headspace of the
package also might have an antistaling effect, but it is still being discussed (5). A potential
disadvantage of an elevated carbon dioxide level in the headspace is that it could result
in a more acidic taste of the product due to carbon dioxide being absorbed and reacting
with the water into carbonic acid (31).
There is a risk with modified atmosphere packaging to inhibit growth of aerobic microbes
that are used as markers for spoilage, while some pathogens still can grow, sometimes
even at a higher rate than in normal air (34). Clostridium botulinum is one example of a
spore forming anaerobic pathogen which thrives in modified atmospheres and produces
toxins at dangerous levels without leaving any visible trace on the product (34). It is thus
important to adapt the microbial controls to the expected pathogens in a modified
atmosphere packaged product. To be certain that growth of all unwanted microbes is
inhibited it is also of importance to use other factors such as a low pH-value and water
activity as well as avoiding storage of the tortillas at temperatures warmer than normal
room temperature (20).
2.4.1.2. pH
A lowered pH-value inhibits the growth of some bacteria, but yeasts and moulds are
mostly unaffected within the range of pH-values found in bakery products (5). The pH in
tortillas is therefore kept low to decrease bacterial growth (11). There is however a limit
to how low the pH can be, since a pH-value below about 5.2 gives an acidic taste to the
product (35,36). Because yeasts and moulds are not as sensitive to low pH-values, it is
required to also keep the packaging room as clean as possible and use other preventative
measures (see 2.4.1.1. Modified atmosphere and 2.4.1.4. Temperature) to limit spoilage
of them.
2.4.1.3. Moisture content and water activity
The moisture content of a food product is the share which is water. It is about 30% in
fresh wheat tortillas (9). It decreases during storage, with a larger decrease the first 7 days
after baking (37). The rate of moisture loss has been shown to be affected by the relative
humidity of the storage atmosphere (5).
However, moisture content by itself does not give much information of how well
microbes can grow in a food item. Instead the water activity, which generally correlates
with moisture content, gives a good indication of whether there is enough water in the
product for microbes to grow in the food item. The relationship between moisture content
and water activity is however unique for each bakery product and depends on factors such

9
as processing and composition of ingredients (7). It is the product with weakest water
interactions of the ingredients which has the highest water activity in the case of two
products with similar moisture contents (23).
Wheat tortillas typically have a water activity just above 0.9, which is low enough to
inhibit growth of most pathogenic bacteria, but many moulds are still able to grow and
bacterial toxins produced by bacteria might still be present (7,36). The bakery thus needs
to avoid buying ingredients with bacterial toxins present and take other measures to avoid
spoilage of moulds (see 2.4.1.1. Modified atmosphere and 2.3.1.4. Temperature). The so
called ‘rope forming bacteria’ Bacillus subtilis requires about the same water activity as
there is in products with relatively high water activities, such as tortilla bread (12). It is
thus very important for bakeries to monitor the water activity since a spoilage of a rope
producing strain of B. subtilis causes unacceptable tortilla texture within just a few days
and can form heat resistance spores that are very difficult to get rid of from the bakery
site.
A lower water activity also has the positive effect that the rate of water release from the
product to the atmosphere is decreased (7). This results in that the product is perceived
fresh for a longer time, thanks to keeping a high water content for a longer time (7).
2.4.1.4. Temperature
Bakery products are mainly spoiled by mesophilic microbes (5). They have a temperature
optimum of about 30°C and generally grow in temperatures between 10 and 40°C (5).
Keeping the storage temperature outside of this range is thus an easy way to yield a longer
unspoiled shelf life. In frozen foods there is no issue with microbial growth, the shelf life
is instead limited by other deterioration processes such as rancidity (6). It is important to
apply a correct heat treatment or monitor the pH-value and water activity for refrigerated
foods. This is because although the growth rate generally is negligible in refrigerated food
items compared to room temperature storage, there are some pathogens such as Listeria
monocytogenes that readily grows in chilled temperatures (6). Food items that are stored
in room temperature generally have been heat treated or have a low enough pH-value or
water activity to inhibit microbial growth (6). In the case of the studied tortillas there is a
combination of several preventative measures ensuring that they can be stored for several
months in room temperature. The oven kills most non-spore microbes and the recipe is
designed to reduce the pH and water activity, see 2.3. The ingredients of wheat tortilla
and their roles. Spore forming organisms such as moulds are instead prevented by that
the baked tortillas are packed in a modified atmosphere (see 2.4.1.1. Modified
atmosphere) and that a clean room technique is used in the production to minimise
spoilage.
2.4.2. Staling
Staling is the name given to a group of mechanisms which all have in common that they
makes the product texture and flavour unacceptable over time (38). The most notable
result in breads is that they become firmer as they age, other notable effects are for
example less elasticity and a development of an off-flavour (38). Staling thus reduces the
functionality of the tortilla since a staled tortilla might break when folded or filled with
fillings. The degree of staling can be measured subjectively through sensory tests or by
manually folding and rolling tortillas. It can also be measured subjectively by measuring
the force required by an instrument stretching or puncturing the tortillas.

10
It is very complex to study the mechanism behind staling because there are many different
mechanisms in play simultaneously that all contributes to staling (37). Starch
retrogradation and moisture migration are however two of the most important
mechanisms in play in bakery products (7,23,26) and will therefore be the focus of the
following two subchapters.
2.4.2.1. Starch retrogradation
Cauvain and Young (7) explains how starch retrogradation starts in a bakery product.
They describe that the heating of starch rich products, such as bread, causes starch
granules to absorb water and swell. This reduces the starch crystallinity and causes a gel-
like matrix with a higher viscosity due to hydrogen bonds between the starch and water.
This starts to change as soon as the product leaves the oven as recrystallization of the
starch into a differently ordered structure starts immediately when the product begins to
cool. This recrystallization is what is referred to as starch retrogradation.
Staling has been found to occur most rapidly the first hours after baking (39). One
explanation is that the unbranched amylose chains recrystallizes rapidly and thus gives
rise to a large retrogradation rate at the beginning of storage (7). The staling that takes
place during the majority of storage is instead due to the slower recrystallizing, branched,
amylopectin chains (7).
Several factors affect the rate of starch retrogradation. Time is one of the most important
factors since it directly correlates to the degree of retrogradation of a given product under
given conditions (26). The composition of the product is another factor affecting the rate
of starch retrogradation. Especially the type and amount of sugars, lipids, peptides, salts,
antistaling enzymes and the water content are important components in regards of starch
retrogradation rate (23,26). As an example it is mainly in food parts with a moisture
content of at least 20% where starch retrogradation occurs (7). It is therefore thought that
water migration might have a major impact in the rate of starch retrogradation in different
parts of some heterogeneous bakery products since for example the bread crust can have
moisture levels below 20% in fresh products (7).
Temperature is another very important factor for the rate of starch retrogradation. The
temperature optimum for starch retrogradation in bread is generally around 4°C (7,23,26),
meaning that the retrogradation rate is the highest around this temperature and that it
decreases as the temperature either increases or decreases. Starch retrogradation is
entirely stopped in freezing temperatures below the glass transition temperature (5,7,40).
The glass transition temperature can be explained as the temperature where the soft and
rubbery water inside a frozen food product changes into a hard and glassy state when
cooled even further (41). It is however important to keep in mind that a rule of thumb is
that the very act of freezing a bakery product corresponds to about 1 day of staling at
room temperature (7). The reason is that it passes through the temperature optimum of
4°C for starch retrogradation both when frozen and thawed (7).
Starch retrogradation can also have some positive effects. The nutritional value is
increased since starch retrogradation slows the digestion of starch by enzymes and thus
also the release of glucose into the blood stream when digested (26). There are also
products such as breakfast cereals where the change in flavour from starch retrogradation
is wanted (26).

11
2.4.2.2. Moisture migration
Moisture migration means that water migrates from one part of the product to another,
without any net loss or gain for the entire product. It has been reported to cause changes
in sensory properties which might be wanted or unwanted depending on type of product
(5). There are three mechanisms involved in moisture migration within bakery products
(7). Firstly, moisture migrates towards the components with lower water content.
Secondly water migrates towards the components with lower water activity and thirdly
water migrates to the surface through a mechanism called syneresis which is the result of
crystallization or aggregation of polymers. One example of staling as the result of
syneresis is the staling of bread crumb (7). On the macroscopic level these mechanisms
can for example lead to water migration from crumb to crust (7). On the microscopic level
they lead to the migration between gluten and starch, but to which direction is still being
discussed (7).
2.4.3. Changes in moisture content
Seiler (5) states that the lowered eating quality of old bakery products is due to the loss
or gain of moisture during storage. The author further states that both the loss, gain and
migration of water within the product is increased with a higher temperature. Changes in
moisture content are also affected by position of the package in the stack on the shelf
according to Seiler.
Foods packaged in modified atmosphere to prevent microbial growth also have the
advantage that their packages retains moisture which makes moisture loss or gain less
prevalent in modified atmosphere packaged bakeries (5).
2.4.4. Stickiness
An unstable tortilla structure or an inclusion of too much water or oil in the product can
sometimes result in that tortillas adhere to each other (15). The degree of stickiness
resulting from eventual adhesion can be evaluated by simply separating the tortillas from
each other. If the adhesion causes damage to the tortillas when separating them from each
other it is called sticking (15). It is called zippering if the tortillas adhere to each other but
are undamaged during separation (15).
It is thought that stickiness primarily is caused by migration of moisture and oil from the
tortilla crumb to its crust (15). The excess liquid at the surface changes it into a rubbery
state which easily adheres to other tortillas (15). Stickiness is a problem both during
storage and processing according to Waniska (15), but he also stated that the problems
mostly occur due to improper packaging or baking in the oven and that some flours cause
more stickiness than others.
Stickiness can also be a problem in doughs, causing the dough to be more difficult to mix,
divide and press, yielding tortillas with a smaller volume and nonoptimal texture (15).
2.5. Accelerated shelf life tests Several approaches to accelerated shelf life tests (ASLTs) have been developed to rapidly
estimate the shelf life of a product by altering one or more environmental conditions (3).
ASLTs can nowadays be used to model the rate of processes that are either chemical,
biochemical, physical or microbial of nature (3). Microbial processes are however more
complex due to that growth characteristics, such as the lag phase, drastically can differ
between different conditions and depending on what has happened earlier to the sample
(27). Especially spoilage microbes are complex to model since different spoilage

12
microbes dominates under different environmental conditions and sometimes also when
the recipe of the product is altered (27). No matter what type of process is modelled it is
important to take samples several times during the expected shelf life and continue to do
so for some time after the quality is not acceptable anymore to get a reliable prediction
(42). To avoid using an outdated model it is also important to have a procedure of
maintaining a developed model and checking whether it still is viable for the product (27).
2.5.1. Environmental conditions
Temperature is the most commonly used environmental factor in ASLTs due to the ease
both of altering it and to analyse the results (3). Care should however be taken when
choosing the temperatures analysed since extreme temperatures might accelerate the
storage well but not be representative to normal storage due to other reactions taking place
(42). Environmental factors such as humidity and light are sometimes also used, either by
themselves or in a combination. Waterman et al (43) for example accelerated the storage
of small molecule solid state drugs by altering both temperature and humidity. It worked
since both a higher temperature and a higher humidity increased the degradation rate. A
higher temperature increases the rate of most reactions and a higher moisture generally
increases the rate of food degradation. The air humidity is commonly measured as the
relative humidity, defined as the ratio of vapour pressure of air to its saturation vapour
pressure (23). A food item exposed to a constant humidity will reach an equilibrium with
the atmosphere. The relative humidity of the air surrounding a food item that has reached
equilibrium with its surroundings is called the equilibrium relative humidity (ERH) (23).
The ERH can be converted into water activity, commonly used for example to give a hint
of the susceptibility of microbial spoilage, by dividing ERH by a factor of 100.
Another example of a combination of environmental factors is that Manzocco et al (44)
found temperature and light to synergistically accelerate the oxidation of sunflower and
soybean oil. Light is however not thought to affect the degradation rate of wheat tortillas
since they are stored as stacks in bags that only lets little light through. Instead of light
induced rancidity it is typically mould and textural changes that limits the shelf life (7).
Both temperature and humidity are thought to affect the microbial growth and textural
changes in stored tortillas (See 2.4. Deterioration of wheat tortilla) and were therefore
chosen as the environmental factors in this study.
2.5.2. Kinetic models
The most commonly used temperature model is that of the Arrhenius equation which is
presented in equation 1, where k is the reaction rate, A is a model specific constant, Ea is
the activation energy, R is the gas constant and T is the temperature.
𝑘 = 𝐴 ∙ 𝑒−(𝐸𝑎𝑅∙𝑇
) (1)
Several conditions need to be fulfilled to get reliable predictions from the Arrhenius
equation. These conditions include that, for all studied environmental conditions, the
kinetic reaction order must not be higher than first order and there must not be any phase
transitions or competitive reactions taking place (3,42). It can however sometimes be fine
to assume that a reaction is of zero- or first order despite it actually being of a higher
order, especially for products degrading slowly (42).
A humidity corrected Arrhenius equation has been developed for products which need
both temperature and humidity as environmental factors to reach the wanted accelerating

13
factor, see equation 2 (45). In equation 2, RH is the relative humidity and B is a model
specific constant.
ln(𝑘) = ln(𝐴) −𝐸𝑎
𝑅∙𝑇+ 𝐵 ∙ 𝑅𝐻 (2)
However, equation 2 has in some cases been found to not correctly describe the shelf life
changes from an increased humidity and temperature due to non-linearity (45). Equation
3 can instead be used in at least some of these cases (45). In equation 3, P is the vapour
pressure of water and s is a model specific constant.
𝑘 = 𝐴 ∙ 𝑒−𝐸𝑎𝑅∙𝑇 ∙ 𝑃𝑠 (3)
2.6. Microbial analysis Aerobic plate count (APC) is commonly used to determine whether a food product is
spoiled or not. This analysis is useful for getting a general picture of the microbial status,
but sometimes it is not the most abundant microorganism which causes the most harm
and APC might give false indications of product safety in such cases (27).
Challenge tests have been developed to determine how resistant the food product is to
spoilage of microbes that are likely to be encountered in the product (6). The basic
principle of challenge tests is to inoculate the food item with microbes of known species
and study their growth or death rate under set conditions (6). This yields very useful
information of how easily spoiled the product is, but it only gives an estimate of the range
of possible growth rates due to that the growth rate of a microorganism varies even under
set conditions (6). It is therefore important to replicate the tests to give a better picture of
the variation in the results (6). Pathogens such as Salmonella are not as applicable for
challenge tests as less harmful microbes, since any size of Salmonella spoilage has the
potential to cause great harm should therefore be entirely prevented (6). Challenge tests
could however still be useful for very harmful pathogens to see if the food matrix would
be harsh enough to those pathogens that their numbers decreases to acceptable levels in
the case of a contamination.
In this project it was chosen to not use a challenge test. Instead a shelf-life evaluation was
chosen since it answers whether the product is safe and stable, under the production
conditions at the time of sampling and during storage, accounting for the natural flora of
the food product (6).
2.7. Textural sensory evaluation Sensory evaluation has been defined as “… a scientific discipline used to evoke, measure,
analyze and interpret reactions to those characteristics of foods and materials as they are
perceived by the senses of sight, smell, taste, touch and hearing.” (46). This definition
includes senses that does not have an obvious link to texture, such as the senses hearing
and smell. However, Lawless and Heymann (47) describes hearing being important for
example when chewing potato chips. Conversely it can be said that it is important that
tortillas do not sound crunchy when chewing on them. The ideal sensory characteristics
is thus different for different types of products. The most important senses for textural
sensory evaluation are sight, touch and hearing. Lawless and Heymann (47) called the
textures corresponding to sight for visual texture, touch for tactile texture and hearing for
auditory texture. Further they divided the tactile texture into the texture felt by the mouth
and the texture felt by hand or through utensils. In the example of the potato chip they

14
state that both the auditory and tactile textures are important when chewing chips. Such
combinations of different textures to evaluate product quality are common, but it can be
enough to evaluate one type of texture in some products.
There are three main types of sensory testing: difference testing, descriptive analyses and
affective analyses (47). Affective analyses are of a hedonic nature, usually used for
screenings of several products and answers what product is the most or least liked by the
consumers (47). Difference testing aims to determine whether there is a difference
between two or more products (47). It is used by food companies when they have done
minor changes to recipes to see if it causes any noticeable differences from the original.
Difference testing is generally a bit more analytical than affective analyses and might
involve a trained panel (47). Descriptive analyses aims to determine the intensity of
characteristic attributes of a food item of interest and can be used to find differences or
similarities between different food items (47,48). It is of analytical nature, involving a
trained or well-trained panel of about ten persons (47). The most suitable for shelf life
tests are descriptive tests as they give more information of the attributes rather than
whether there is a difference between the samples. Several different types of descriptive
analyse tests have been developed. A variant of Quantitative Descriptive Analysis was
used in this study since the food company in question already had implemented it. Some
examples of other descriptive tests are Flavor Profile, Sensory Spectrum and Free Choice
Profiling (47,48).
There are a lot of factors that might give a large variance to the results in textural sensory
evaluations. For example the sample size can affect how hard a sample is perceived, the
panel members might have different earlier experience, chewing behaviours and/or
salivary production (47). Furthermore, there is often a large variation between samples
and it can be difficult to corroborate the results for a specific sample since the samples
usually are destroyed (47). It is thus necessary to reduce the variance as much as possible.
Examples of possible actions to reduce the variance are to train the panel before testing,
have a room with few distractions during the testing, prepare the samples as similar as
possible and use replicated samples. The samples should also be coded to avoid personal
bias against a product. The panel training can either be through consensus or ballot
approaches (47).
The scale used for descriptive analyses can either have discrete values or be continuous
(49). Scales with discrete values might result in that panel members might become
trapped between two values or reporting the same value for two samples which they felt
were a bit different (49). Information might thus be lost. Adding the potential to comment
on the sample is one possible solution, but it causes problems for statistical analysis to
weigh these comments. Continuous scales on the other hand generally requires more
statistical analysis but gives more precise results.

15
3. Materials and Methods
This chapter presents the different methods used to get the results in this study, as well as
the materials and instruments used. A bag of tortillas was considered as one sample.
3.1. Storage conditions and sampling The Santa Maria Super Soft Medium Tortilla Original 8-pack used in this project were
collected during a single day of production at their production site in Landskrona. Five-
day old samples were put as stacks of about five bags in height into four different storage
facilities with different temperature and relative humidity (RH). The zero point of storage
was defined as when tortillas were separated into different storage conditions after the
five days. The storage conditions included: refrigerator (R), reference (REF), climate
cabinet (CC) and climate room (CR), see table 1 for the temperature and relative humidity
of each storage condition. CC and CR had a considerably lower standard deviation for
the relative humidity than R and REF since the relative humidity could be controlled in
the storage facilities of CC and CR, but not the R and REF samples. Data loggers for
humidity and temperature (HL-1D, Rotronic AG, Bassersdorf, Switzerland) were used to
control that the settings were correct in all storage conditions.
Table 1. Temperature and relative humidity for each storage condition in the study ± the standard deviations.
Refrigerator Reference Climate cabinet Climate room
Temperature (°C) 3 ± 1.6 20 ± 0.34 27 ± 0.18 40 ± 0.14
Relative humidity (%) 70 ± 13 30 ± 5.1 80 ± 1.9 80 ± 1.3
Samples were randomly taken from the storage facilities after 0, 1, 2, 4, 7 and 10 weeks
of storage and analysed with all the methods described in the following subchapters. Only
REF tortillas were analysed at week 0 and the obtained values were assumed to be the
starting values for all storage conditions. This was based on that they originated from the
same batch and had not been subjected to different storage as of week 0. Reference
samples, from different batches, that were 17, 20 and 24 weeks old were also analysed,
but only with the fold/roll-method, the oxygen and carbon dioxide measuring instrument
and microbial analysis. The samples were let to acclimatise to REF conditions for at least
two hours before any analysis was performed. Most of the analyses were carried out with
triplicated samples, but some were performed with duplicates or without replication due
to the limitations (see 1.3. Limitations). The replicate number is stated under each method.
3.2. Texture analysis The texture was measured with three different methods, the fold/roll-method already
established by the company, with a texture analyser and by a sensory panel.
3.2.1. Fold/roll-method
The fold/roll-method consisted of five different parts, tested in the following order:
stickiness, rollability, foldability, translucency and taste. All of these are described in the
following subchapters. The R, REF and CR samples were tested in triplicate and CC
samples were tested in duplicate. A discrete scale ranging from 1 to 5, where a higher
score means better texture, was used for all but taste. Taste was instead described
singlehandedly by comments. A score of three was defined in this study as the
acceptability limit for an aged tortilla. This means that a tortilla was considered to have
unacceptable textural quality if any score dropped to three or below.

16
3.2.1.1. Stickiness
Stickiness was measured by taking out the stack of tortillas from the bag and then noting
if there was any sound and/or damage when carefully separating the tortillas from each
other, one by one. Any stickiness sounds noted resulted in a lowered score and damage
in an even lower score. The company asked to not publish more details about the scoring
procedure.
3.2.1.2. Rollability
Cold tortillas were rolled tightly into the form of a cylinder and the degree of damage to
the edges was studied. The more damage there was to the edges, the lower the score. The
company asked to not publish more details about the scoring procedure. At least two
tortillas were tested in each sample, with more being tested if the tortillas got different
scores or were difficult to determine, and a discrete value was set for the sample
depending on the score of the majority of the tortillas.
3.2.1.3. Foldability
The tortillas were put back into the bag and heated in a microwave oven. At least two
tortillas were than tested by folding over the middle several times, with more tortillas
being tested if the obtained scores did not match or were difficult to determine. A lower
score was given the earlier that damage appeared where the tortilla had been folded. The
company asked to not publish more details about the scoring procedure or the microwave
heating.
3.2.1.4. Translucency
Translucency was simply measured by estimating the percentage of translucency with the
naked eye. The more translucency found on a tortilla, the lower score was given to it. The
score given to the majority of the tortillas was then taken as the sample score. The
company asked to not publish more details about the scoring procedure.
3.2.1.5. Taste
Parts of the heated tortillas were tasted and the degree of saltiness, off flavour, dry
mouthfeel, hardness of the first bite as well as the chewiness were commented. CC and
CR samples were excluded at week 4 due to growth of an unknown microbe in high
numbers at week 1 and 2. It was later concluded to be safe to taste those samples (see 4.2
Microbial analyses) and they were therefore tasted again at week 7 and onwards.
3.2.2. Puncture test by a texture analyser
Tortilla strips (15 times 5 cm) from all eight tortillas in each sample were cut out in the
machine direction at the middle of the tortillas. One tortilla strip at a time was attached to
a TVT – 300 XP (Perten instruments AB, Stockholm) by clamping each end with self-
tightening roller grips. One cylindrical probe, with a diameter of 30 mm, pressed the
tortilla strip with the settings presented in table 2 resulting in that the tortilla strip broke
at a certain force. The sample value was then received by taking the mean of the maximal
forces required to break each tortilla strip from the sample. Only tortillas from storage
week 4, 7 and 10 were analysed with the puncture test due to initial problems with the
texture analyser. Samples stored in R, REF and CR conditions were tested in duplicate
and samples stored in CC conditions were tested without replication.

17
Table 2. Settings of used in the texture analyser for the puncture test.
Setting Value
Starting distance above sample 10 mm
Testing distance 40 mm
Initial speed 6.0 mm/s
Test speed 1.7 mm/s
Retract speed 10 mm/s
Trigger force 10 g
3.2.3. Sensory analysis
The panel consisted of 9 panellists, but the number of present panellists varied from four
to nine in the different tasting sessions. The panellists were trained on one occasion before
the study and one time on each sampling week before tasting the tortillas. The training
was a sort of consensus training where three samples of different age were presented in
the first training session and one sample, different from the study samples, was given at
the rest of the training sessions. A suggested list of attributes was presented to the panel
at the first training session and they were asked to agree on scores on a continuous scale
ranging from 0 to 100, for each attribute and sample. The suggested attributes were:
sweetness, saltiness, pure wheat, dry mouthfeel, soft/hard texture and chewy. Sweetness
was however excluded after the first training session since no difference was detected in
sweetness of the presented tortillas and the panel did not think that it was as important as
the other attributes. The questionnaire used had brief descriptions of the chosen attributes
and what a high or low score meant, see figure B1 in appendix B.
Tortillas were prepared by giving the samples random numbers and cutting the tortillas
into quarters. The tortilla quarters were put on bricks together with water and biscuits, to
clean the palate between tasting different samples, at week 0, 1 and 2. At week 4, 7 and
10 were the cut tortilla quarters instead put back into anonymised packages and the panel
members had to fetch the tortilla quarters by themselves from the bags. This change was
due to a problem of the tortillas drying after taking them out of the packages and that was
found to be retarded when the tortillas were put back into the bags after cutting them. R,
REF and CR samples were tasted in duplicate and CC samples without replication.
The panel reported their scores through the EyeQuestion version 4.10-4.11 (EyeQuestion,
Elst) software.
CC was excluded at week 4 and CR at week 2 and 4 due to that a high number of unknown
microbes had been found in samples stored under CC and CR conditions week 1 and 2.
At week 7 it was concluded that the samples were safe to taste (see 4.2. Microbial
analyses) and they were therefore reintroduced to the sensory tastings. The tastings at
week 1, 7 and 10 were divided into two different sessions due to that the panel felt that it
was too many samples these weeks to taste accurately at one occasion.
3.3. Microbial analysis Three REF and CR samples as well as two CC samples were sent to Eurofins to measure
APC 30°C, Escherichia coli, Bacillus cereus, Salmonella, Moulds 25°C and Yeast 25°C.
The methods used, and their detection limits are displayed in table 3.
18
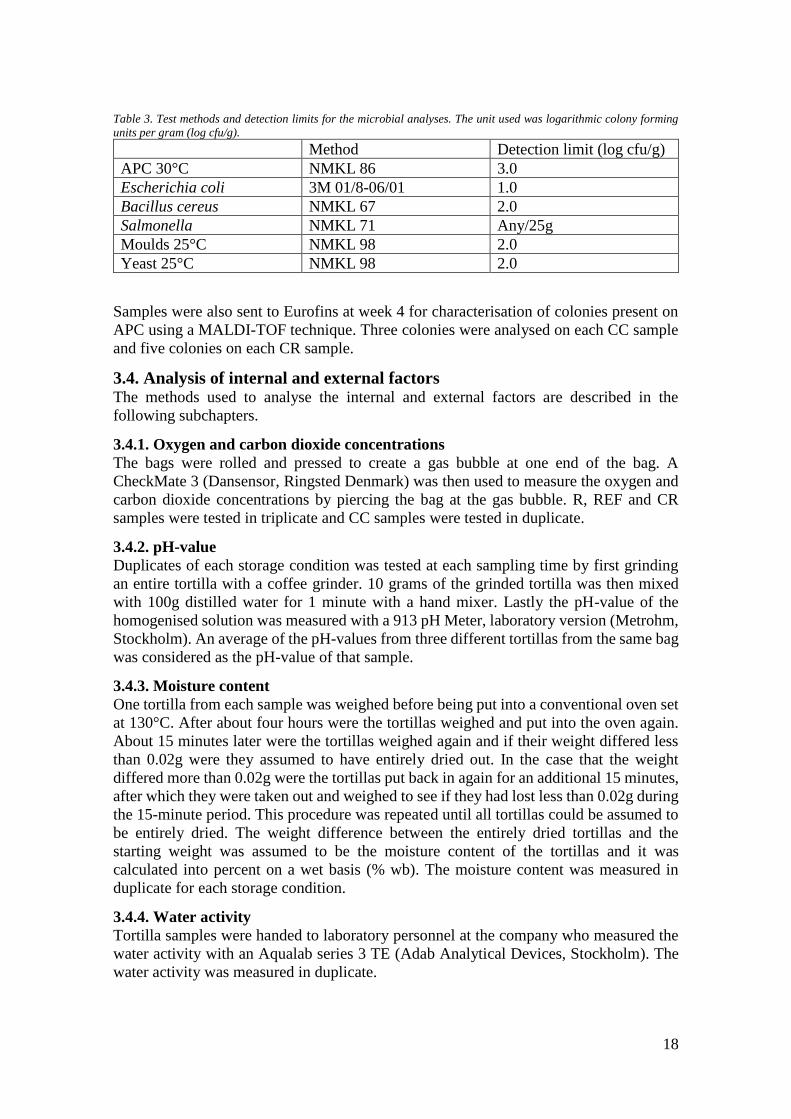
Table 3. Test methods and detection limits for the microbial analyses. The unit used was logarithmic colony forming
units per gram (log cfu/g).
Method Detection limit (log cfu/g)
APC 30°C NMKL 86 3.0
Escherichia coli 3M 01/8-06/01 1.0
Bacillus cereus NMKL 67 2.0
Salmonella NMKL 71 Any/25g
Moulds 25°C NMKL 98 2.0
Yeast 25°C NMKL 98 2.0
Samples were also sent to Eurofins at week 4 for characterisation of colonies present on
APC using a MALDI-TOF technique. Three colonies were analysed on each CC sample
and five colonies on each CR sample.
3.4. Analysis of internal and external factors The methods used to analyse the internal and external factors are described in the
following subchapters.
3.4.1. Oxygen and carbon dioxide concentrations
The bags were rolled and pressed to create a gas bubble at one end of the bag. A
CheckMate 3 (Dansensor, Ringsted Denmark) was then used to measure the oxygen and
carbon dioxide concentrations by piercing the bag at the gas bubble. R, REF and CR
samples were tested in triplicate and CC samples were tested in duplicate.
3.4.2. pH-value
Duplicates of each storage condition was tested at each sampling time by first grinding
an entire tortilla with a coffee grinder. 10 grams of the grinded tortilla was then mixed
with 100g distilled water for 1 minute with a hand mixer. Lastly the pH-value of the
homogenised solution was measured with a 913 pH Meter, laboratory version (Metrohm,
Stockholm). An average of the pH-values from three different tortillas from the same bag
was considered as the pH-value of that sample.
3.4.3. Moisture content
One tortilla from each sample was weighed before being put into a conventional oven set
at 130°C. After about four hours were the tortillas weighed and put into the oven again.
About 15 minutes later were the tortillas weighed again and if their weight differed less
than 0.02g were they assumed to have entirely dried out. In the case that the weight
differed more than 0.02g were the tortillas put back in again for an additional 15 minutes,
after which they were taken out and weighed to see if they had lost less than 0.02g during
the 15-minute period. This procedure was repeated until all tortillas could be assumed to
be entirely dried. The weight difference between the entirely dried tortillas and the
starting weight was assumed to be the moisture content of the tortillas and it was
calculated into percent on a wet basis (% wb). The moisture content was measured in
duplicate for each storage condition.
3.4.4. Water activity
Tortilla samples were handed to laboratory personnel at the company who measured the
water activity with an Aqualab series 3 TE (Adab Analytical Devices, Stockholm). The
water activity was measured in duplicate.

19
3.5. Statistical analysis Regression models were calculated in Excel version 2013 (Microsoft Corporation,
Washington) and an ANOVA was calculated in EyeQuestion version 4.10-4.11
(EyeQuestion, Elst) for the sensory data immediately after each sampling time’s tastings.
Standard deviations were calculated in Excel for all data except the sensory data which
was calculated both in Excel and EyeQuestion.

20
4. Results
This chapter presents the results gathered from all the different tests in the project together
with brief explanations.
The refrigerator was turned off one time after a little more than a week of storage and
once near the end of the project. The resulting brief increases in temperature were not
thought to seriously affect the results since they only lasted a very minor part of the
storage period.
All the standard deviations of the means are presented in appendix C.
4.1. Internal and external factors Figure 2 shows that there was an early peak in oxygen concentration in the bags stored
in CR conditions and that the oxygen concentration then dropped close to zero in them
for the rest of the studied time. This indicates that these conditions caused the bags to leak
relatively much oxygen and that microbes or something else reached high enough
numbers after one week of storage to use up the oxygen. The bags stored in CC conditions
showed a similar pattern, but slower and less drastic. R stored bags had a slow but steady
decrease in oxygen content which might be due to a reaction taking place that slowly used
up the oxygen or microbes that grew slowly in the cold conditions. The REF stored
samples first showed a similar pattern as R, but the oxygen concentration then increased
at a very steady rate for the rest of the ten weeks. Indicating that the microbial growth
was not large enough during the first ten weeks to use up all the oxygen that leaks into
the bags. Looking at the older REF samples from other batches there seems to have been
a continued increase in oxygen due to leakage, but the data points from week 17 and 20
have much larger residuals than what was observed the first ten weeks. This suggests that
there could be a large variance between different batches.
Although not measured, it was noted at week 7 and 10 that there was a large difference
in total gas volume between the warmer stored tortillas and the others. There was almost
no gas left at all in CR, a clearly reduced gas bubble in CC and not any notably visible
difference for R and REF over time.
Figure 2. Oxygen concentrations measured inside bags, stored in the four different storage facilities, at different
storage times.

21
A steady decrease in carbon dioxide concentration over time was observed in all storage
conditions, but with different rates, with the rate being larger the warmer the samples had
been stored, see figure 3. The bags stored in CR lost much more carbon dioxide than the
ones stored in CC or colder conditions, indicating that there might have been a reaction
that could occur in CR but was limited in the colder conditions.
Figure 3. Carbon dioxide concentrations measured inside bags, stored in the four different storage facilities, at
different storage times.
There was a problem with tortillas drying out before the pH-value was measured. The
problem was caused by that there were many samples analysed at each occasion after
week 0 and tortillas were taken from the same bag for water content, water activity and
pH analyses, so all bags had to be opened at the beginning of the analysis day. This
problem did not occur week 0 as the number of samples was not as many that week since
they had not been divided into different storage facilities by that time. At week 4 the
problem got solved by repackaging the tortillas in new bags that were sealed without
entirely draining them from air. Tortilla samples sent to Eurofins for verification verified
that the obtained values from week 2 were questionable and week 10 were more reliable,
see table D1 in appendix D. Only the results from week 0, 4, 7 and 10 are therefore
presented in figure 4. Figure 4 shows that the pH-values of tortillas stored in CR
conditions decreased steadily while tortillas stored in colder conditions were about the
same over the storage period or slightly increased over time.
The measured moisture values after 2 and 10 weeks of storage were well within the
reported error range of the verification samples sent to Eurofins, see figure 5 and table
D2 in appendix D. This suggests that the method used to determine the water content was
appropriate. As can be seen in figure 5 there was a decrease in moisture content of all
tortillas over time. There also seemed to be an effect of temperature since the R samples
generally had the highest moisture content while CR samples had the lowest. However,
there was only a minor difference observed between the REF and CC samples and it even
seemed like the CC samples had a bit higher moisture content than REF. This might be
due to the elevated relative humidity in CC and that there was only a smaller difference
in temperature between REF and CC.

22
Figure 4. Measured pH-values on homogenized tortillas from the four different storage conditions at different storage
times. The pH-values from week 1 and 2 are excluded because there re was a problem with some tortillas drying before
being homogenised that was solved later in later labs.
Figure 5. Measured moisture in percent on a wet base (% wb) of tortillas from the four different storage conditions
during the ten-week period.
The trend observed in moisture content was not as readily observed in the water activity,
but there still were indications in the later weeks’ results that there was a lower water
activity in tortillas stored in CR than the other storage conditions, see figure 6. These
differences in results between moisture content and water activity indicates that it mainly
is the bound water that decreases over time in the tortilla.

23
Figure 6. Measured water activities of tortillas stored in the four different conditions in the ten-week period.
4.2. Microbial analyses Only APC 30°C showed any growth at all. The APC results are presented in figure 7.
Some points in the graph are missing from figure 7 because the number of colony forming
units was below the detection limit of 3 log cfu/g at week 0 for all storage conditions and
at the first two weeks for the REF samples. The microbial activity in CR samples went
over the acceptability limit, set in this study, already after one week of accelerated storage.
The peak under CR conditions was however very brief and the cells entered a death phase
already after two weeks of accelerated storage, decreasing to about the acceptability limit
which it seemed to stabilise around. The microbial growth in CC conditions also
surpassed the acceptability limit, but it took a bit longer time than under CR conditions
thanks to a longer lag phase. The microbial activity also seemed to stabilise at a higher
concentration than under CR conditions. Microbes growing in tortillas stored under REF
conditions had a much longer lag phase and the average microbial activity never reached
the acceptability limit under the studied period. The microbial activity under REF
conditions seemed to stabilise just under the acceptability limit. There were however one
sample at week 10 and one sample at week 24 that had a microbial concentration of 5.2
log cfu/g and 5.8 log cfu/g respectively.
Samples were sent to Eurofins for typing with a MALDI-TOF since high numbers of
microbes occurred faster than expected in the warmer stored tortillas and the question
arose whether it was pathogens or spoilage microbes. As can be seen in tables 4-5 most
of the colonies were characterised to be of Bacillus or Bacillus subtilis specifically. There
were however one colony reported as Bacillus pumilus and several colonies unable to be
characterised, especially from the CC stored tortillas. It was thought that the colonies
unable to be characterised also were of the Bacillus genus since they can form spores that
can be difficult to analyse with the MALDI-TOF. It was also thought that the vast
majority of the bacteria were B. subtilis since almost all colonies characterised to the
species level were B. subtilis. No colonies were characterised as the two only bacillus
pathogens B. anthrax or B. cereus despite that the analysis should be able to characterise
them. The conclusion was thus taken that it probably was not dangerous to taste the
tortillas.

24
Figure 7. APC results presented in log cfu/g for the three different storage conditions that were microbially analysed.
The line at 5.0 log cfu/g illustrates the acceptability limit set in this study.
Table 4. Characterisation results of randomly picked colonies from APC plates from CC stored tortillas
Colony Climate cabinet
1 Unknown Bacillus
2 Unknown Bacillus
3 Unknown Unknown
Table 5. Characterisation results of randomly picked colonies from APC plates from CR stored tortillas.
Climate room
1 Bacillus Bacillus Bacillus
2 Bacillus subtilis Bacillus Bacillus subtilis
3 Bacillus subtilis Bacillus pumilus Bacillus subtilis
4 Bacillus subtilis Bacillus subtilis Unknown
5 Unknown Bacillus subtilis Unknown
4.3. Textural analyses The results from the three different methods used to evaluate tortilla texture are presented
in the following subchapters.
4.3.1. Fold/roll
Textural degradation described by the fold/roll-method were assumed to be of zero order
since first and second order kinetics yielded about the same p-values and values of R2. It
mostly seemed to be temperature that affected the textural degradations detected by the
fold/roll-method. The accelerated models were therefore simplified to be based on the
Arrhenius equation (equation 1) without a humidity term, see appendix E for example
calculations and Arrhenius plots.
The stickiness rather seemed to vary with batch than over time for REF conditions, see
figure 8. The oldest REF samples even felt the least sticky during testing, but the
difference was too small to give a different score in the somewhat rough scale used. CR
and CC conditions seemed to cause a lower stickiness score over time, indicating that the
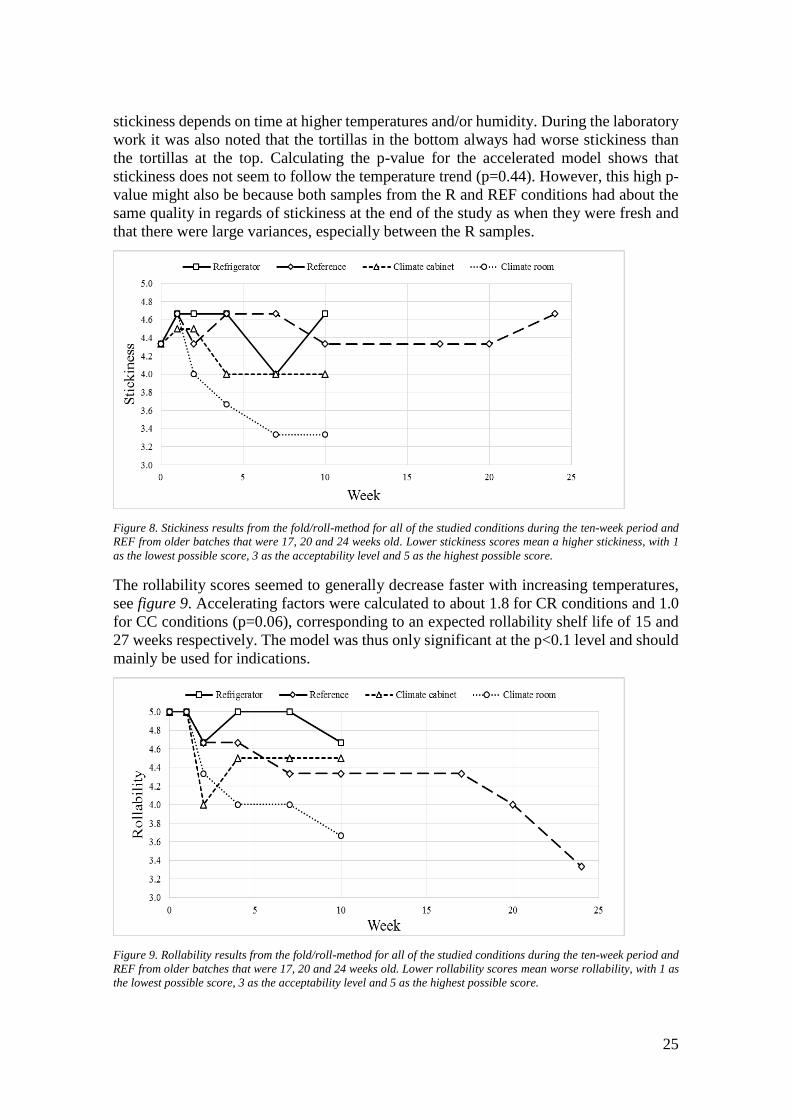
25
stickiness depends on time at higher temperatures and/or humidity. During the laboratory
work it was also noted that the tortillas in the bottom always had worse stickiness than
the tortillas at the top. Calculating the p-value for the accelerated model shows that
stickiness does not seem to follow the temperature trend (p=0.44). However, this high p-
value might also be because both samples from the R and REF conditions had about the
same quality in regards of stickiness at the end of the study as when they were fresh and
that there were large variances, especially between the R samples.
Figure 8. Stickiness results from the fold/roll-method for all of the studied conditions during the ten-week period and
REF from older batches that were 17, 20 and 24 weeks old. Lower stickiness scores mean a higher stickiness, with 1
as the lowest possible score, 3 as the acceptability level and 5 as the highest possible score.
The rollability scores seemed to generally decrease faster with increasing temperatures,
see figure 9. Accelerating factors were calculated to about 1.8 for CR conditions and 1.0
for CC conditions (p=0.06), corresponding to an expected rollability shelf life of 15 and
27 weeks respectively. The model was thus only significant at the p<0.1 level and should
mainly be used for indications.
Figure 9. Rollability results from the fold/roll-method for all of the studied conditions during the ten-week period and
REF from older batches that were 17, 20 and 24 weeks old. Lower rollability scores mean worse rollability, with 1 as
the lowest possible score, 3 as the acceptability level and 5 as the highest possible score.

26
The foldability scores seemed to generally decrease faster with increasing temperatures,
see figure 10. Accelerating factors were calculated to about 3.6 for CR conditions and 1.5
for CC conditions (p=0.04), corresponding to an expected foldability shelf life of 7.2 and
17 weeks respectively. This model might be a bit erroneous despite being significant on
the p<0.05 level since it suggests a shelf life of 7.2 weeks under CR conditions despite
the CR samples not reaching the acceptability limit after 10 weeks.
Figure 10. Foldability results from the fold/roll-method for all of the studied conditions during the ten-week period and
REF from older batches that were 17, 20 and 24 weeks old. Lower foldability scores mean worse foldability, with 1 as
the lowest possible score, 3 as the acceptability level and 5 as the highest possible score.
The translucency scores between the different sampling days for CC, CR and R stored
samples does not seem to follow any trend over time, see figure 11. The REF stored
samples had a somewhat steady increase in translucency, but whether this is a real trend
is questionable due to the high variance in the data and that the 17 weeks or older REF
samples were from different batches. CR had a different sign on the slope than the others
and was therefore excluded when calculating the accelerating factors. The p-value in the
ASLT model for R, REF and CC was 0.51 and a temperature trend could hence be ruled
out.
In the tasting part of the fold/roll-method most attributes gave too random values to show
any pattern. However, older tortillas had in general a drier mouthfeel. An off flavour was
also detected in the CR stored tortillas already after 1 week and after 2 weeks they smelled
really bad and tasted even worse than at week 1. The CR tortillas were excluded from
tasting in the roll/fold-method at week 4 due to safety reasons since it still was unknown
that the bacterial growth was non-pathogenic. CC stored tortillas tasted a bit bad at week
7, but not close to as bad as the CR tortillas did from week 2 and onwards.

27
Figure 11. Translucency results from the fold/roll-method for all of the studied conditions during the ten-week period
and REF from older batches that were 17, 20 and 24 weeks old. Lower translucency scores mean more translucency,
with 1 as the lowest possible score, 3 as the acceptability level and 5 as the highest possible score.
4.3.2. Texture analyser
The texture analyser could not be used until 4 weeks of storage already had passed due to
problems with the instrument. Week 4 was therefore the first time that the texture analyser
could be used, see figure 12. There were large variances between different tortilla strips
from the same bag of tortillas and between different bags, but the mean values still show
a difference between CR stored tortillas and tortillas stored in the other conditions. The
mean values of R, REF and CC stored tortillas were too close to determine any differences
between them.
Figure 12. Average maximal forces, in g, required by the texture analyser to puncture tortilla strips.
4.3.3. Sensory analyses
Most of the sensory results are just indicative because the preparation of samples was
changed at week 4 compared to earlier and that there even after training was a relatively
high variance between the panellists. Several panellists reported that they felt it to be
difficult to detect differences in the hardness of the first bite and the chewiness. There
were however still some significant differences and clear trends found.

28
CR stored tortillas were excluded at week 2 and 4 and CC at week 4 due to safety reasons
for the panel to taste tortillas with unknown bacteria growing in them at concentrations
above the acceptability limit. Both CC and CR stored tortillas were reintroduced at week
7 since they had been evaluated to be harmless for the panel (see 4.2. Microbial analyses).
The perceived saltiness seemed to increase for all storage conditions, with a slightly larger
increase for colder stored samples, see figure 13. The difference is however very small
between the samples and since there was a strong off flavour in the warmer stored samples
it might have camouflaged an increase in saltiness in those samples.
Figure 13. Average saltiness reported by the panel for the four different storage conditions.
The degree of off flavour was somewhat unchanged over time in R and REF stored
tortillas with REF having a small, but insignificant, higher pure wheat flavour, see figure
14. Significant differences were however detected at week 7 and 10 when the CC and CR
samples were reintroduced. CR had a lower pure wheat flavour score compared to all
other conditions at week 7 (p<0.01). At week 10 there still was a lower pure wheat flavour
score for CR with a p-value of less than 0.01 compared to R and REF but compared to
CC only one of the two CR samples showed a significant difference and it was only at
the p<0.05 level. One panel member exclaimed that the off flavour was exactly how natto
tastes after hearing that B. subtilis present in the warmer stored tortillas is used in Japan
to ferment soy beans into natto. The off flavour in the tortillas is thus thought originate
from the bacterial spoilage.
As can be seen in figures 15-16 the sensation of a dry mouthfeel from eating tortillas and
how hard the first bite feels does not seem to change noteworthy over time. However, at
week 10 one of the CR tortilla samples had a significantly softer first bite than one of the
R samples (p<0.01), one of the REF samples (p<0.05) and the CC stored sample (p<0.05).
There seems to be an increase in dry mouthfeel at week 2, but the scores got back to about
the same as week 1 after changing the preparation at week 4. Thus, it probably rather had
to do with that the tortillas tested had dried from being outside the bags for a longer time
before tasting at week 2 than at the tasting week 1.

29
Figure 14. Average pure wheat reported by the panel for the four different storage conditions.
Figure 15. Average dry mouthfeel reported by the panel for the four different storage conditions.
Figure 16. Average hardness of the first bite reported by the panel for the four different storage conditions.

30
The chewiness seems to have been immensely affected by the change in preparation
method at week 4, see figure 17. Possible trends over time are therefore hard to certainly
state. However, at week 7 and 10 there were some significant differences between
samples stored in different storage conditions. The R samples were significantly chewier
than one of the CR samples on the p<0.1 level and the other one on the p<0.01 level at
week 7. At week 10 one of the CR samples was significantly less chewy than one of the
R samples (p<0.05).
Figure 17. Average chewiness of the first bite reported by the panel for the four different storage conditions.

31
5. Discussion
Comparing figure 2 and figure 3 with figure 7, both the oxygen and carbon dioxide
concentrations seems to correlate with the microbial growth. For example, a faster
reduction in carbon dioxide seems to hasten the lag phase. This shows the importance of
the modified atmosphere and the gas barrier properties of the package to protect against
microbial spoilage. The carbon dioxide does however seem to be reacting with water, on
the tortilla surface, into carbonic acid. Such a reaction could be a possible explanation to
why both the pH-value and water content decreased over time for tortillas stored under
CR conditions. Tortillas stored in the other conditions did not have a decreasing pH-value,
but they also did not have such a pronounced reduction in carbon dioxide gas. The
difference in reduction of carbon dioxide between CR and CC conditions is very large,
which indicates that there might have been a temperature threshold between 27°C and
40°C for a reaction to take place. A reaction into carbonic acid can also explain why the
total gas volume was noted, at the later weeks, to be very different between the CR and
REF stored tortillas, despite that the barrier in the packages is thought to be close to
impermeable for carbon dioxide. An increasing temperature might increase the leakage,
but it is still not thought to be as pronounced as seen in this study. It should also be noted
that the reduction in water content singlehandedly might cause the tortillas to become
more acidic since the water is more alkaline than the rest of the tortilla. The packaging
barrier should however be able to keep the water inside the bag. Consequently, the
question follows of where the water disappears to if it does not react with carbon dioxide.
One possibility could be that it evaporates into the atmosphere inside the bag.
Tortillas stored in CC conditions reached microbial numbers above the acceptability limit
within just a few weeks and tortillas stored in CR conditions surpassed the acceptability
limit within one week. It is thus clear that the tortillas are very sensitive to a combination
of elevated temperature and relative humidity. Consequently, it is probably possible to
develop an accelerated shelf life model for the microbes. Such a model was however not
possible to be developed in this study due to unknown starting numbers of microbes and
too few data points during the lag and growth phases in the CC and CR conditions.
The microbial growth in the REF samples appeared to be in the exponential growth phase
at week 10, but the cfu/g seemed to stay at about the same levels at week 17 and
afterwards. It is possible that there was an undetected peak above the acceptability level
somewhere between week 10 and 17. It would therefore be interesting with a new study
that includes some sampling times between week 10 and 17 to conclude whether the REF
samples briefly reach over the acceptability limit. It has however been stated by Betts (6)
that somewhat elevated APC does not necessarily correlate with a worse product quality,
but that it rather is dependent on the type of microbes present. A brief increase over the
acceptability limit might therefore not be harmful or interesting enough to motivate a
study by itself.
The microbial numbers seemed to stabilise at a higher value in CC conditions than in CR
conditions, despite the microbes reaching a higher maximal cfu/g in CR than in CC. One
explanation could be that the water activity seemed to be slightly higher in CC tortillas
than in CR tortillas. The difference in observed water activity is however too small to
draw any conclusions. It has also been stated by Waniska (15) that tortillas are extra
susceptible to moulds, due to an increased water activity, if there is condensation of water
vapour on the inside of the bags. Such condensation was observed already after one week

32
of storage on the CR bags, but not the CC bags. The measured water activity only was on
the tortillas and hence the water activity might have been different if measured on the
entire package instead.
It seems like there either was no mould spores present when the tortillas were produced
or that the moulds were outcompeted by Bacillus bacteria, especially of the B. subtilis
species. B. subtilis is feared by bakers for its ability to cause ropiness, but since no such
defects were observed in the studied tortillas it was concluded that the present B. subtilis
was of a strain not causing ropiness.
Significant accelerated shelf life models were calculated for rollability and foldability,
with p<0.01 and p<0.05 respectively. From the calculated accelerating factors, it seems
possible to use CR conditions to accelerate textural shelf life studies, especially for
foldability. The CC conditions however seems to not be harsh enough to give any
acceleration of rollability and only a minor acceleration in foldability. The accelerating
factors calculated in this study should only be used indicatively, despite being significant,
because of the large variances and that no sample had a textural quality below the
acceptability level. The foldability shelf life in CR conditions was also predicted to be
much lower than the CR results showed it to be. Further showing that it should be used
with care. The large variances might be reduced in a future study by taking the mean of
some tortillas from each bag instead of giving each bag a discrete value between one and
five based on the majority score of individual tortillas from that bag.
Significant accelerated shelf life models could not be calculated for stickiness and
translucency because, in R and REF conditions, they did not become notably worse over
time. It should still be noted that stickiness seemed to be affected over time at CC and CR
conditions and translucency might have started to get worse scores at week 7 and 10 in
CR conditions. Accelerated models might therefore be possible to calculate for stickiness
and translucency if the tortillas are stored long enough for the quality to drop. However,
much of the differences in R and REF tortillas appeared to vary with different bags and
batches. Furthermore, the stickiness of individual tortillas depended on where they were
in the tortilla stack with worse scores the lower they were located. It therefore seems like
the tortilla stickiness increases if a high pressure is applied to them during storage. The
worse stickiness scores over time in CC and CR also supports this since they notably lost
gas volume over time, especially CR, which led to a more densely packed stack of tortilla
bags on the storage shelf. The quality in regards of stickiness and translucency under REF
conditions therefore appears to be more affected by production parameters and placement
inside the bag than storage time. The need of an accelerated model for stickiness and
translucency can also be questioned. Assuming the tortillas had satisfactory stickiness as
well as translucency scores when recently produced and are stored as recommended, the
tortillas probably have microbial spoilage, insufficient rollability or foldability before
they suffer from stickiness or unsatisfactory translucency.
It seems possible to use the texture analyser in the future for fast texture measurements
since it could separate tortillas stored in CR conditions from the rest. It would have the
benefit compared to the fold/roll-method and a sensory panel of being an objective
method, meaning that two different individuals get the same or at least nearly the same
results. However, the texture analyser had problems with differentiating the R, REF and
CC samples despite the CC samples generally showing worse quality in the fold/roll-
method. The variances between tortillas in the same bag and between bags stored under

33
the same conditions also needs to be reduced. Upgrades in the instruments equipment that
enables whole tortillas to be tested instead of just strips might help reduce some variance
produced by cutting out the strips and attaching them to the texture analyser.
The results from the sensory panel seems promising since some significant differences
were found despite that the panel probably required more training. A benefit from having
a well-trained panel to test tortilla texture by tasting would be that it is easier for humans
than instruments to grasp the whole picture. There is however the drawback with a well-
trained panel that it costs a lot of money to train the panel and to keep it well-trained over
time. The initial training would probably need to be very thorough since several panel
members expressed difficulties in detecting differences of for example chewiness.
All the textural methods used had in common that the R samples could not be
differentiated from the REF samples or that the R samples even seemed to have a higher
quality despite being close to the optimal temperature for starch retrogradation in bread.
The optimal temperature for starch retrogradation can however be different from 4°C in
some products (26). Furthermore, some earlier studies on wheat tortillas have found room
temperatures to accelerate the deterioration more than refrigerated temperatures
(9,40,50). Yet, Waniska wrote in 2017 that refrigerated temperature causes a more rapid
staling than room temperatures (15). The scientific field thus seems to not agree of what
temperature causes the fastest textural deterioration of wheat tortilla. Torres et al and
Ramírez-Wong et al explained their findings by hypothesizing that the staling of wheat
tortillas might be more affected by water migration between the starch and gluten than by
starch retrogradation (9,50). Torres et al further suggested that the greater importance of
water migration compared to most other bread products might be due to that tortillas have
less water and more fat than the general bread loaf (50). Water migration also increases
with higher temperatures, which fits in well with the observed results in this study of
textural quality loss. Seeing how the carbon dioxide level decreased rapidly in the CR
samples, which also were the ones with the worst texture, another explanation could be
that the carbon dioxide inhibits textural degradation. The R samples were the ones with
most carbon dioxide left and stored at the lowest temperature so both the water migration
and a retarding effect on staling by the modified atmosphere seems like plausible
explanations to the observed high quality in refrigerated tortillas.

34
6. Conclusions and further research
At storage in 40°C and 80% relative humidity it seems like carbon dioxide readily reacts
with water on the tortilla surface, causing a much larger decrease in water content, carbon
dioxide concentration and pH than in lower temperatures. It would be interesting to
measure the water vapour inside the bags to see how much of the water loss is due to
vaporisation of surface water and how much is due to this reaction. It would also be of
interest to measure the concentration of carbonic acid in CR stored tortillas as that could
verify of falsify that the reaction of water and carbon dioxide into carbonic acid takes
place. Lastly, it would also be interesting, if feasible, to measure the water activity of the
entire bag since condensation was observed on the bags stored in CR conditions. Such
water activity measurements would probably be more representative as the difficulty for
microbes to grow inside the bags.
It seems possible to greatly accelerate microbial shelf life studies by increasing the
temperature and humidity. It is however vital to have a low enough detection limit at the
start of the study to detect the low starting concentration. The sampling times of the
samples stored in 27°C as well as 40°C should also be better tailored to the short shelf
life in these conditions as it is mainly the lag and growth phases that are interesting when
developing an ASLT model. Regarding room temperature stored samples, there might be
a brief period between 10 and 17 weeks of storage where APC is above the acceptability
limit. This possible brief peak is probably not of any harm since the characterised spoilage
consisted of non-harmful Bacillus species and the textural scores of the REF samples
were well above the acceptability limit. More microbial shelf life studies would be great
to verify that the spoilage mostly is due to Bacillus and not mould since this study only
was based on one batch for the growth during the first 10 weeks and three additional
batches for growth week 17 to 24. Other batches might have a larger initial concentration
of mould spoilage and different growth characteristics. It should also be added that the
microbial spoilage seems to have been the cause of off flavour in CR tortillas since at
least one panel member thought the tortillas tasted like natto, which also is rich in B.
subtilis.
ASLT models seems possible for rollability and foldability. However, the time gained in
CC conditions seems minimal and the tortillas consequently probably are required to be
stored in the harsher CR conditions for the gain in time to be relevant. It should also be
noted that the accelerating factors calculated in this study were significant but should
probably still just be used indicatively due to large variances, contradictory estimates and
that neither the rollability nor foldability crossed the acceptability limit in any storage
condition. It is therefore recommended to perform a new shelf life study that is long
enough for the rollability and foldability to reach unacceptable scores, preferably at
several time points. To get more precise results, the new study also probably should use
an average value of the scores obtained from individual tortillas in the bags rather than
giving the bags the score that most of the tested tortillas got.
Both stickiness and translucency rather seem to be affected by production parameters than
storage time if the tortillas are stored in R or REF conditions. It is therefore probably
sufficient to check that their quality is good enough when the tortillas recently are baked.
Consequently, shelf life studies might not be needed for stickiness and translucency. It
should however be noted that the tortillas tended to have worse stickiness the further

35
down in the package they were. Smaller packages might therefore be an idea to decrease
stickiness if it becomes a problem.
Both the texture analyser and a sensory panel seems possible to use for determination of
textural quality. However, both needs further work before being implemented. The
texture analyser had large variances for the data and was unable to differentiate CC
samples from R and REF samples. New equipment for the texture analyser will probably
help reduce the variance, but if it is enough for it to be as trustworthy as the fold/roll-
method is uncertain. It might however be acceptable for the texture analyser to not be as
precise as the fold/roll-method since the texture analyser is objective while the fold/roll-
method is subjective. The panel also suffered from large variances and would require
excessive training. To train the panel to have very small variances would however cost a
lot of money, but it might be worth it since the human senses can detect the overall picture
better than an instrument. A well-trained panel could also be considered as somewhat
objective.
R conditions seems to be as good as, or even better than REF conditions for tortilla
texture. This might be explained by that the water migration seems to be worse for tortilla
quality than starch retrogradation and/or that carbon dioxide has a retarding effect on
texture degradation. It would therefore be interesting to do longer shelf life studies with
samples in R and REF conditions to more certainly determine which is best in regards of
keeping a high textural quality. It would also be interesting with a study where the packs
are opened to let out the modified atmosphere and resealed with atmospheric air instead.
Such a study could probably corroborate or falsify that the modified atmosphere has a
protective action against textural degradation.

36
References
1. Giménez A, Ares F, Ares G. Sensory shelf-life estimation: A review of current
methodological approaches. Food Res Int [Internet]. 2012;49(1):311–25.
Available from: http://dx.doi.org/10.1016/j.foodres.2012.07.008
2. Kotler P, Armstrong G, Saunders J, Wong V. Principles of Marketing. Second
Eurupean Edition. Helms Icy J, editor. Upper Saddle River: Prentice Hall Inc.;
1999.
3. Mizrahi S. Accelerated shelf life testing of foods. In: Food and Beverage
Stability and Shelf Life [Internet]. Elsevier; 2011 [cited 2018 May 27]. p. 482–
506. Available from:
http://linkinghub.elsevier.com/retrieve/pii/B9781845697013500153
4. Santa Maria AB. Soft Tortilla Original [Internet]. [cited 2018 Feb 19]. Available
from: https://www.santamariaworld.com/se/produkter/tortilla-original-medium/
5. Seiler DAL. Bakery products. Princ Appl Modif Atmos Packag Foods [Internet].
1999;135–57. Available from: http://link.springer.com/10.1007/978-1-4615-
6097-5_7
6. G.Betts. Determining the stability and shelf life of foods. In: Food Spoilage
Microorganisms. 2006. p. 119–43.
7. Cauvain SP, Young LS. The stability and shelf life of bread and other bakery
products. In: Kilcast D, Subramaniam P, editors. Food and Beverage Stability
and Shelf Life [Internet]. Woodhead Publishing; 2011. p. 657–82. Available
from: https://app.knovel.com/hotlink/pdf/id:kt009DRAB3/food-beverage-
stability/stability-shelf-introduction
8. Tortilla Industry Association. Tortilla Talk [Internet]. [cited 2018 Apr 12].
Available from: http://www.tortilla-info.com/default.asp?contentID=6
9. Ramírez-Wong B, Walker CE, Ledesma-Osuna AI, Torres PI, Medina-Rodríguez
CL, López-Ahumada GA, et al. Effect of flour extraction rate on white and red
winter wheat flour compositions and tortilla texture. Cereal Chem.
2007;84(3):207–13.
10. The Editors of Encyclopaedia Britannica. Tortilla [Internet]. [cited 2018 Apr 12].
Available from: https://www.britannica.com/topic/tortilla
11. Waniska RD. Processing of Flour Tortillas. In: Tortillas [Internet]. Elsevier; 2015
[cited 2018 May 27]. p. 125–45. Available from:
http://linkinghub.elsevier.com/retrieve/pii/B9781891127885500050
12. Cauvain SP. Raw Materials. In: Baking Problems Solved. Elsevier; 2017. p.
9815813.
13. Alviola JN, Waniska RD, Rooney LW. Role of gluten in flour tortilla staling.
Cereal Chem. 2008;85(3):295–300.
14. Tippels KH, Kilborn RH, Preston KR. Bread-wheat quality defined. In: Wheat.
Boston, MA: Springer US; 1994. p. 25–36.

37
15. Waniska RD. Flour Tortilla Problems. In: Tortillas. Elsevier; 2015. p. 215–26.
16. Whitney K, Simsek S, Berzonsky W, Ohm JB, Sorenson B. The effect of spring
wheat starch properties on flour tortilla quality. J Food Process Eng.
2011;34(3):697–715.
17. Waniska RD, Cepeda M, King BS, Adams JL, Rooney LW, Torres PI, et al.
Effects of flour properties on tortilla qualities. Cereal Foods World.
2004;49(4):237–44.
18. D’Appolonia BL, Rayas-Duarte P. Wheat carbohydrates: structure and
functionality. In: Wheat [Internet]. Boston, MA: Springer US; 1994. p. 107–27.
Available from: http://link.springer.com/10.1007/978-1-4615-2672-8_8
19. Junge RC, Hoseney RC. A mechanism by which shortenings and certain
surfactants improve loaf volume in bread. Cereal Chem. 1981;58(5):408–12.
20. Young NWG, O’Sullivan GR. The influence of ingredients on product stability
and shelf life. In: Food and Beverage Stability and Shelf Life. Elsevier; 2011. p.
132–83.
21. WHO. Guideline: Sodium intake for adults and children [Internet]. Geneva:
World Health Organization (WHO); 2012. p. 1–46. Available from:
http://www.who.int/nutrition/publications/guidelines/sodium_intake/en/
22. Cepeda M, Waniska RD, Rooney LW, Bejosano FP. Effects of leavening acids
and dough temperature in wheat flour tortillas. Cereal Chem. 2000;77(4):489–94.
23. Kong F, Singh RP. Chemical Deterioration and Physical Instability of Foods and
Beverages. In: The Stability and Shelf Life of Food [Internet]. Elsevier; 2016. p.
43–76. Available from:
//www.sciencedirect.com/science/article/pii/B9780081004357000022
24. Friend CP, Waniska RD, Rooney LW. Effects of Hydrocolloid on Processing and
Qualities of Wheat Tortillas. Cereal Chem. 1993;70(3):252–6.
25. Blackburn CDW. Managing microbial food spoilage : an overview. In: Food
spoilage microoganisms. 2006. p. 147–70.
26. Wang S, Li C, Copeland L, Niu Q, Wang S. Starch Retrogradation: A
Comprehensive Review. Compr Rev Food Sci Food Saf. 2015;14(5):568–85.
27. Braun PG, Sutherland JP. Modelling microbial food spoilage. In: Food Spoilage
Microorganisms. Cambridge: Woodhead Publishing; 2006. p. 86–118.
28. Magan N, Aldred D. Managing microbial spoilage in cereal and baking products.
In: Food spoilage microorganisms. Elsevier; 2006. p. 194–212.
29. Kaur P. Survival and growth of Bacillus cereus in bread. J Appl Bacteriol.
1986;60(6):513–6.
30. Sautour M, Mansur CS, Divies C, Bensoussan M, Dantigny P. Comparison of the
effects of temperature and water activity on growth rate of food spoilage moulds.
J Ind Microbiol Biotechnol. 2002;28(6):311–5.

38
31. Abellana M, Ramos AJ, Sanchis V, Nielsen P V. Effect of modified atmosphere
packaging and water activity on growth of Eurotium amstelodami, E. chevalieri
and E. herbariorum on a sponge cake analogue. J Appl Microbiol.
2000;88(4):606–16.
32. Mossel DAA. Physiological and Metabolic Attributes of Microbial Groups
Associated with Foods. J Appl Bacteriol. 1971;34(1):95–118.
33. Antunez PD, Botero Omary M, Rosentrater KA, Pascall M, Winstone L. Effect
of an oxygen scavenger on the stability of preservative-free flour tortillas. J Food
Sci. 2012;71(1).
34. Farber JM. Microbiological aspects of modified-atmophere packaging
technology - a review. J Food Prot. 1991;54(1):58–70.
35. Brooker D. Tortilla Tips: What is a good pH for Tortillas? [Internet]. 2012 [cited
2018 Feb 12]. Available from: https://www.tortillanews.com/2012/07/tortilla-
tips-what-is-a-good-ph-for-tortillas/
36. Institute of Food Technologies. Evaluation and Definition of Potentially
Hazardous Foods [Internet]. 2001. p. 1–109. Available from: http://www.fda.gov/
37. Carini E, Curti E, Vittadini E. Effect of Long-Term Storage on Water Status and
Physicochemical Properties of Nutritionally Enhanced Tortillas. Food Biophys.
2010;5(4):300–8.
38. Kulp K. Staling of Bread. Am Inst Bak Res Dep Tech Bull. 1979;1(8):1–7.
39. Seetharaman K, Chinnapha N, Waniska D, White P. Changes in textural, pasting
and thermal properties of wheat buns and tortillas during storage. J Cereal Sci.
2002;35(2):215–23.
40. Kelekci NN, Pascut S, Waniska RD. The effects of storage temperature on the
staling of wheat flour tortillas. J Cereal Sci. 2003;37(3):377–80.
41. Balasubramanian S, Devi A, Singh KK, Bosco SJD, Mohite AM. Application of
Glass Transition in Food Processing. Crit Rev Food Sci Nutr. 2016;56(6):919–
36.
42. Magari RT. Assessing Shelf Life Using Real-Time and Accelerated Stability
Tests [Internet]. 2003 [cited 2018 Mar 14]. p. 1–4. Available from:
http://www.biopharminternational.com/assessing-shelf-life-using-real-time-and-
accelerated-stability-tests?id=&pageID=1&sk=&date=
43. Waterman KC, Carella AJ, Gumkowski MJ, Lukulay P, MacDonald BC, Roy
MC, et al. Improved protocol and data analysis for accelerated shelf-life
estimation of solid dosage forms. Pharm Res. 2007;24(4):780–90.
44. Manzocco L, Panozzo A, Calligaris S. Accelerated shelf life testing (ASLT) of
oils by light and temperature exploitation. JAOCS, J Am Oil Chem Soc.
2012;89(4):577–83.
45. Yoshioka S, Valentino SJ. Chemical Stability of Drug Substances. In: Stability of
Drugs and Dosage Forms. Springer Science & Business Media; 2000. p. 3–138.

39
46. Stone H. Introduction to Sensory Evaluation. In: Sensory evaluation practices.
Academic Press; 2004.
47. Lawless H, Heymann H. Sensory Evaluation of Food. New York: Springer
Science & Business Media; 2010. 227-257 p.
48. Society of Sensory Professionals. Overview of Descriptive Analysis [Internet].
[cited 2018 Mar 19]. Available from:
https://www.sensorysociety.org/knowledge/sspwiki/Pages/Descriptive
Analysis.aspx
49. Lundgren B. Handbok i sensorisk analys. SIK; 1981.
50. Torres PI, Ramírez-Wong B, Serna-Saldivar SO, Rooney LW. Effect of sorghum
flour addition on the characteristics of wheat flour tortillas. Cereal Chem.
1993;70(1):8–13.
I
Appendices
This section includes a popular science summary, the questionnaire used for the sensory
tests, standard deviations of the results, verification results from Eurofins of pH-values
and moisture content as well as a part with example calculations of the ASLT model and
the accompanying Arrhenius plots.
A. Popular science summary This study tried to shorten the time required for shelf life studies in product development
of wheat tortillas, by developing accelerated shelf life test (ASLT) models for microbial
and textural shelf life. ASLTs speed up product degradation by exposure to an extreme
climate. This study used a refrigerator as well as two storage facilities with elevated
temperature and humidity. Normal room condition was used as reference. Texture was
determined with a fold/roll-method, an instrument and by a sensory panel. Microbial
concentrations were determined by a laboratory company. Gas composition inside the
bags, tortilla pH, water content and water activity were measured to determine possible
links to the shelf life.
It was not possible to calculate an ASLT model for the microbial growth because of
unknown starting number of microbes. The microbial tests however showed that a high
temperature and humidity caused the number of bacteria to rapidly increase above what
is considered acceptable. Microbial ASLTs thus seem possible, but more tests with a
lower detection limit are needed to create a model. To avoid bad taste from non-
pathogenic bacterial growth, consumers are recommended to avoid storing the tortillas in
high temperature and/or humidity.
Textural ASLTs also seem possible in regards of rollability and foldability, but more tests
are needed to precisely determine the accelerating factor. Stickiness and translucency
seems to deteriorate much slower than rollability and foldability under normal storage
conditions. Tortillas thus suffer from bad rollability and foldability before they become a
problem. It is therefore suggested to be enough to check that stickiness and translucency
quality meets the requirements when the tortilla is freshly baked. Tortillas seemed to lose
textural quality at the same rate, or slower, in refrigerator than room conditions. Longer
shelf life studies are therefore suggested, to verify if this is the case. Storage in a
refrigerator could possibly prolong both textural and microbial shelf life of tortillas.
Changes in the modified atmosphere in the bags seems to correlate with textural
degradation. A study with atmospheric air instead would therefore be interesting as an
attempt to determine if it retards textural degradation in wheat tortillas.

II
B. Sensory questionnaire Figure B1 shows how the sensory questionnaire looked. Although the scores do not
display numbers, they are continuous scales ranging from 0 to 100. Note also that the only
thing altered in the questionnaire for different samples was the sample number at the top
of the questionnaire. This number system was used to be able to anonymise the samples
so that the panel members did not know what samples they were tasting while still
allowing the panel leader to keep track of the samples.
Figure B1. A copy of the questionnaire that was handed to the panel members in the sensory tests.

III
C. Standard deviations of the means Tables C1-2 presents the standard deviations from the gas measurements.
Table C1. Standard deviations of the oxygen measurements measured in percent oxygen gas.
Week Refrigerator Reference Climate cabinet Climate room
0 0.042 0.042 0.042 0.042
1 0.00 0.0087 0.0042 0.055
2 0.069 0.060 0.0170 0.025
4 0.00058 0.039 0.0092 0.0026
7 0.0015 0.018 0.0028 0.0021
10 0.0032 0.059 0.00071 0.0015
Table C2. Standard deviations of the carbon dioxide measurements measured in percent carbon dioxide gas.
Week Refrigerator Reference Climate cabinet Climate room
0 1.1 1.1 1.1 1.1
1 0.00 0.15 0.00 3.1
2 0.51 0.058 0.14 5.4
4 1.0 0.10 0.071 2.2
7 0.29 0.40 0.21 4.7
10 0.17 0.51 0.64 2.1
Table C3 presents the mean standard deviations of APC. No values are reported for week
0 for all storage conditions and week 1 and 2 for reference since APC was below the
detection limit at those weeks. No standard deviations are reported for climate cabinet
and climate room at week 17, 20 and 24 because only reference samples were measured
after week 10.
Table C3. Standard deviations of the mean reported APC in log cfu/g.
Week Reference Climate cabinet Climate room
1 - 0.0 0.15
2 - 0.14 0.15
4 0.30 0.0 0.29
7 0.46 0.92 0.21
10 0.70 0.071 0.21
17 0.17 - -
20 0.26 - -
24 1.0 - -
Tables C4-7 presents the standard deviations of the mean scores given in the fold/roll-
method to the different storage conditions at each week. Note that the scores given were
discrete values and that the mean standard deviations therefore look more similar than
they probably truly were.

IV
Table C4. Standard deviations of the mean stickiness scores.
Week Refrigerator Reference Climate cabinet Climate room
0 0.58 0.58 0.58 0.58
1 0.58 0.58 0.71 0.58
2 0.58 0.58 0.71 0.00
4 0.58 0.58 0.00 0.58
7 0.00 0.58 0.00 0.58
10 0.58 0.58 0.00 0.58
Table C5. Standard deviations of the mean rollability scores.
Week Refrigerator Reference Climate cabinet Climate room
0 0.00 0.00 0.00 0.00
1 0.00 0.00 0.00 0.00
2 0.58 0.58 0.00 0.58
4 0.00 0.58 0.71 0.00
7 0.00 0.58 0.71 0.00
10 0.58 0.58 0.71 0.58
Table C6. Standard deviations of the mean foldability scores.
Week Refrigerator Reference Climate cabinet Climate room
0 0.00 0.00 0.00 0.00
1 0.00 0.00 0.00 0.00
2 0.58 0.58 0.00 0.58
4 0.00 0.58 0.71 0.00
7 0.00 0.58 0.71 0.00
10 0.58 0.58 0.00 0.58
Table C7. Standard deviations of the mean translucency scores.
Week Refrigerator Reference Climate cabinet Climate room
0 0.58 0.58 0.58 0.58
1 0.00 0.58 0.71 0.58
2 0.00 0.00 0.71 0.58
4 0.58 0.58 0.71 0.58
7 0.58 0.58 0.71 0.58
10 0.00 0.58 0.71 0.00
Table C8 presents mean standard deviations of the maximal force values reported by the
texture analyser from the puncture tests for each storage conditions and week. The
standard deviations of the technical replicates for each sample are not presented here, but
all of them were around a value of 100.
V
Table C8. Standard deviations of the mean texture measurements by the texture analyser measured in g. Note that the
climate cabinet was not replicated, and that its standard deviation is therefore unknown.
Week Refrigerator Reference Climate cabinet Climate room
4 27.1 12.0 - 24.7
7 3.82 80.5 - 11.2
10 22.7 8.84 - 37.4
Table C9, C10 and C11 presents the standard deviations of the mean pH, moisture content
and water activity respectively.
Table C9. Standard deviations of the mean pH measurements.
Week Refrigerator Reference Climate cabinet Climate room
0 0.031 0.031 0.031 0.031
4 0.0047 0.031 0.0024 1.3E-15
7 0.014 0.031 0.024 0.0024
10 0.021 0.014 0.0024 0.0047
Table C10. Standard deviation of the mean moisture measurements measured in percent moisture on a wet basis.
Week Refrigerator Reference Climate cabinet Climate room
0 0.15 0.15 0.15 0.15
1 0.60 0.11 0.038 0.62
2 0.20 0.15 0.12 0.46
4 0.14 0.31 0.095 0.18
7 0.12 0.037 0.35 0.28
10 0.17 0.075 0.26 0.26
Table C11. Standard deviation of the mean water activity measurements.
Week Refrigerator Reference Climate cabinet Climate room
0 0.0071 0.0071 0.0071 0.0071
1 0.0071 0.00 0.00 0.014
2 0.0071 0.0071 0.0071 0.0071
4 0.014 0.00 0.0071 0.00
7 0.00 0.0071 0.0071 0.00
10 0.0071 0.00 0.00 0.0071
The standard deviations between panellists for the same samples mostly ranged between
10 and 20. Tables C12-16 presents the mean standard deviations of the sensory attributes
used in the sensory tests. Standard deviations of the mean could not be calculated for the
climate cabinet stored tortillas since they were not replicated after week 0. No climate
room stored tortillas were tasted at week 2 and 4 due to health concerns.

VI
Table C12. Standard deviation of the mean scores for the sensory attribute “Salty”.
Week Refrigerator Reference Climate cabinet Climate room
0 0.54 0.54 0.54 0.54
1 0.77 3.0 - 2.0
2 3.3 1.8 - -
4 1.7 2.4 - -
7 4.3 2.9 - 3.4
10 0.88 5.4 - 0.48
Table C13. Standard deviation of the mean scores for the sensory attribute “Pure wheat”.
Week Refrigerator Reference Climate cabinet Climate room
0 1.3 1.3 1.3 1.3
1 1.5 2.7 - 1.2
2 2.3 3.5 - -
4 0.81 0.12 - -
7 3.5 4.7 - 3.2
10 0.23 4.7 - 4.9
Table C14. Standard deviation of the mean scores for the sensory attribute “Dry mouthfeel”.
Week Refrigerator Reference Climate cabinet Climate room
0 2.4 2.4 2.4 2.4
1 2.6 7.2 - 4.8
2 2.1 6.0 - -
4 0.14 1.6 - -
7 4.2 6.5 - 6.2
10 0.042 3.0 - 1.8
Table C15. Standard deviation of the mean scores for the sensory attribute “Soft/hard texture”.
Week Refrigerator Reference Climate cabinet Climate room
0 6.1 6.1 6.1 6.1
1 7.8 8.64 - 7.4
2 3.4 6.4 - -
4 0.049 2.5 - -
7 0.87 2.3 - -
10 4.7 2.0 - 8.8
Table C16. Standard deviation of the mean scores for the sensory attribute “Chewy”.
Week Refrigerator Reference Climate cabinet Climate room
0 1.6 1.6 1.6 1.6
1 1.6 5.8 - 11
2 3.7 1.2 - -
4 0.16 1.6 - -
7 0.33 6.3 - 0.042
10 2.5 0.48 - 4.0

VII
D. Verification results The obtained verification results of pH and moisture content are presented in table D1
and table D2 respectively. No samples were sent from the climate cabinet and climate
room conditions at week 2 and 10 respectively. The refrigerator samples at week 10 were
duplicates, while all the others were without replication. Therefore, it is only the
refrigerator values at week 10 that are presented with the standard deviation.
Table D1. Reported pH-values from Eurofins on tortilla samples with an error margin of ±0.2. Tortilla samples from
refrigerator, reference and climate room conditions were sent to Eurofins at week 2 and from refrigerator, reference
and climate cabinet conditions at week 10 of storage. Refrigerator at week 10 is presented with the standard deviation.
Week Refrigerator Reference Climate cabinet Climate room
2 6.3 6.3 - 6.2
10 6.4 ± 0.0 6.4 6.4 -
Table D2. Reported moisture contents (% wet base) from Eurofins on tortilla samples with an error margin of ±10%.
Tortilla samples from R, REF and CR conditions were sent to Eurofins at week 2 and from R, REF and CC conditions
at week 10. Refrigerator at week 10 is presented with the standard deviation.
Week Refrigerator Reference Climate cabinet Climate room
2 29.8 30.0 - 29.7
10 29.8 ± 0.071 29.3 29.7 -

VIII
E. Example calculations Example calculations for rollability are presented in this appendix together with the
Arrhenius plots for stickiness, rollability, foldability and translucency.
The first step in the calculations was to calculate regression models for each of the storage
conditions against time for reaction of zero, first and second order. All the different orders
had about the same fit and it was therefore assumed to be a zero- or pseudo-zero order
reaction. The obtained slopes from the zero-order regression model were assumed to be
the reaction rate constants and are presented in table E1.
Table E1. Reaction rate constants (1/week) for each storage condition in regards of rollability.
Refrigerator Reference Climate cabinet Climate room
-0.0180 -0.0542 -0.0402 -0.131
The logarithm was taken of the rate constants and plotted against the inverse temperature
in Kelvin to obtain the Arrhenius plot, see figure E1. The significance of the accelerating
model was also taken as the p-value of the Arrhenius regression model since all further
calculations are based on the established Arrhenius equation.
Figure E1. Arrhenius plot for rollability calculations.
The activation energy (Ea) was then calculated from the slope of the Arrhenius plot and
equation 1 as follows:
𝐸𝑎 = −(𝑠𝑙𝑜𝑝𝑒 ∙ 𝑅) ≈ −(−4221.32 ∙ 8.31446) ≈ 35098 𝐽/𝑚𝑜𝑙𝑒
The expected shelf life under the different storage conditions were then calculated from
the activation energy, the acceptability limit (AL), rollability score at week 0 (RSV) and
equation 1. Here is the calculation for the expected shelf life at storage in the climate
room (SL40) as an example:
𝑆𝐿40 =𝐴𝐿 − 𝑅𝑆𝑉
𝑘𝑅𝐸𝐹 ∙ 𝑒𝐸𝑎𝑅
∙(1
𝑇𝑅𝐸𝐹−
1𝑇40
)≈
3 − 5
−0.0542 ∙ 𝑒35098
8.31446∙(
1293.55
−1
313.45)
≈ 14.8 𝑊𝑒𝑒𝑘𝑠
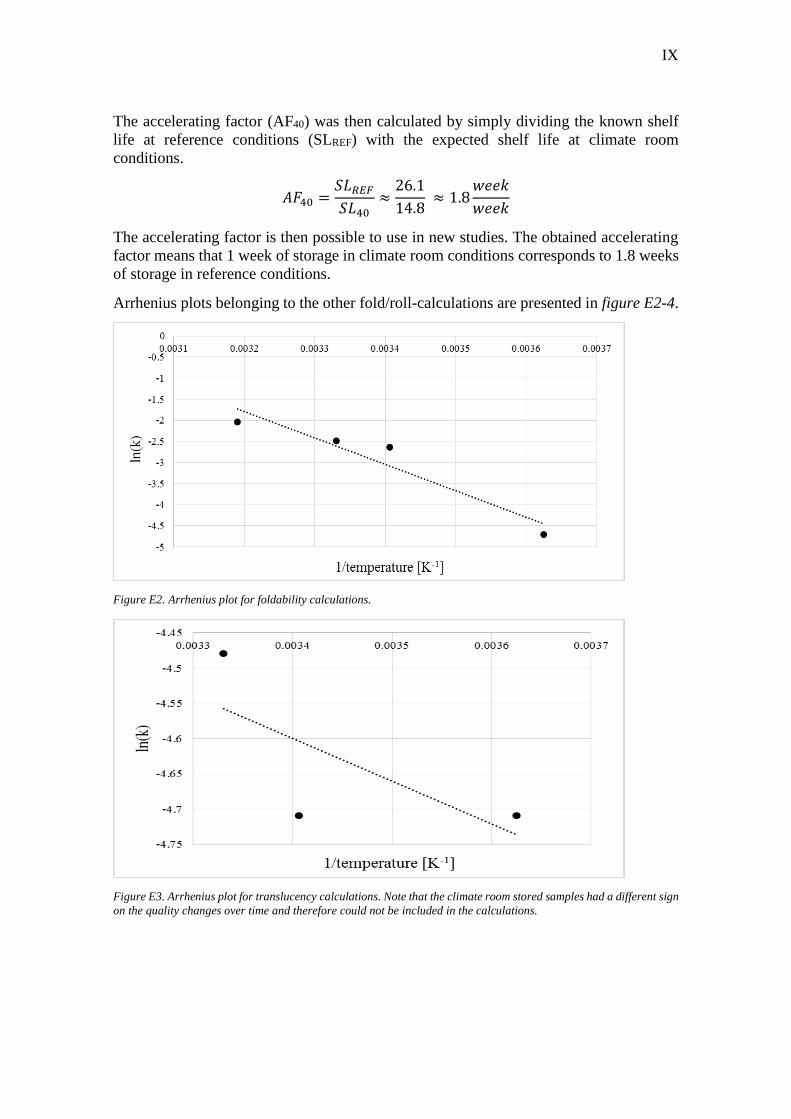
IX
The accelerating factor (AF40) was then calculated by simply dividing the known shelf
life at reference conditions (SLREF) with the expected shelf life at climate room
conditions.
𝐴𝐹40 =𝑆𝐿𝑅𝐸𝐹
𝑆𝐿40≈
26.1
14.8 ≈ 1.8
𝑤𝑒𝑒𝑘
𝑤𝑒𝑒𝑘
The accelerating factor is then possible to use in new studies. The obtained accelerating
factor means that 1 week of storage in climate room conditions corresponds to 1.8 weeks
of storage in reference conditions.
Arrhenius plots belonging to the other fold/roll-calculations are presented in figure E2-4.
Figure E2. Arrhenius plot for foldability calculations.
Figure E3. Arrhenius plot for translucency calculations. Note that the climate room stored samples had a different sign
on the quality changes over time and therefore could not be included in the calculations.

X
Figure E4. Arrhenius plot for stickiness calculations.


