Accounting for Remittance and Migration Effects on Children’s Schooling
Catalina Amuedo-Dorantes
Department of Economics
San Diego State University
5550 Campanile Drive
San Diego, CA 92182
(619) 594-1663
Susan Pozo
Department of Economics
Western Michigan University
1903 West Michigan Ave.
Kalamazoo, MI 49008
(269) 387-5553
May 2010
Abstract: We examine the impact of remittances on children’s school attendance in the
Dominican Republic. To isolate the effect of remittances from the effect of sometimes
concurrent household out-migration, we focus on children in households without members
currently residing in the U.S. While girls’ school attendance rises with the receipt of
remittances, secondary school-age children and younger siblings are the ones who most
decidedly gain from remittances. Additionally, we find that migration negatively impacts the
school attendance of children as it eliminates the positive effect of remittances when we expand
the sample to include children in households with members residing abroad.
Keywords: Latin America, Dominican Republic, school attendance, remittances, migration.
1
1. INTRODUCTION
Because of the development potential of financial inflows, a growing literature has
looked for positive impacts of international remittances on poor economies. Remittances have
been studied to ascertain to what degree these flows serve to raise or even-out consumption
levels, provide for housing, promote business investments, and increase the availability of health
services for individuals with monetary constraints. Yet, some studies have suggested that
remittances primarily raise consumption levels and do not necessarily promote investments in
either physical or human capital.1 We suspect that these competing conclusions about the
benefits of remittances may partially be due to the confounded impacts of remittances and family
migration. While remittances can benefit households by lifting liquidity constraints, migration of
a family member may have a deleterious impact on the household’s well-being. The absence of
a family member may deprive the household of the migrant’s market and non-market production,
possibly making the household worse off. Therefore, it is of interest to ask to what extent the
gains from remittances make up for the losses sustained from family migration.
In this paper, we provide illustrative evidence of the importance of distinguishing
between the presumably negative migration effect and the positive effect of remittances when
examining the impact of remittance inflows on children’s schooling using data from the
Dominican Republic. The Dominican Republic is an interesting case study for various reasons.
First, it is a country that has experienced extensive emigration. According to the World Bank
(2009), twelve percent of the Dominican population has emigrated. Second, remittance receipts
in the Dominican Republic account for about 10 percent of the country’s GDP (World Bank,
2009). Third, children’s school attendance rates are relatively low. The primary school net
enrollment rate was 82 percent in 2007, with secondary enrollment rates falling to 61 percent
2
according to UNESCO (2009), leaving significant room for improvements in educational
attainment. And most importantly, the Dominican Republic is a particularly interesting case
study for the purpose of our analysis due to the substantial variation in emigration and
remittance-receiving patterns across households, which enables us to separate the migration
effect from the remittance effect and to confirm their competing impacts.
We proceed by first distinguishing households with a family member currently in the
U.S. (migrant households) from households without migrants in the U.S. (non-migrant
households).2 Focusing our attention on non-migrant households – to which most of the children
in the sample belong and in which more than half of children in remittance-receiving households
reside, we examine the impact that the receipt of remittance income has on children’s school
attendance. To focus on non-migrant households allows us to isolate the impact of the receipt of
remittances from the effect of family migration on the schooling of children. In order to
empirically sign the effect of family migration on the schooling of children and to gauge whether
the presumably negative migration effect offsets the positive impact of remittance receipt, we
repeat the analysis expanding our sample to include children residing in migrant households. We
then compare our estimates of the impact of remittance receipt in the two instances, i.e. when we
exclude and when we include children residing in migrant households, to gain a better
understanding of how family migration and remittance-receipt affect children’s schooling. To
conclude, we explore variations in the impact of remittance receipt on children’s school
attendance depending on their age, gender and order of birth –characteristics suggested as being
crucial in previous studies of human capital investments on children (e.g. Calero et al., 2009;
Emerson and Portela Souza, 2008).
3
We find that remittances promote children’s school attendance in the Dominican
Republic, particularly among secondary school-age children and higher order of birth siblings.
Additionally, we are able to conclude that migration has a negative impact on the school
attendance of children since the positive effect of remittance receipt effectively disappears when
we expand our sample to include children in migrant households. Overall, the analysis provides
further evidence of the positive impact that remittances can have on remittance-receiving
countries, while also noting that migration of family members may temper and even cancel-out
the positive remittance effect. As is the case with the Dominican Republic, the findings should
prove of interest to developing countries with extensive emigration, striving to promote
educational attainment.
2. BACKGROUND ON MIGRATION, REMITTANCES AND SCHOOLING IN THE
DOMINICAN REPUBLIC
During the reign of Rafael Trujillo (1930-1961), foreign travel of Dominicans was
strictly controlled in order to repress the formation and growth of political opposition (Derby,
2009). Emigration to the U.S. from the Dominican Republic involved only 17,000 Dominican
over the dictatorship years (Sagás and Molina, 2004). The assassination of Trujillo in 1961
however, released social and political tensions and contributed toward demand for emigrating.
The subsequent lifting of controls prompted a large exodus of the population – a trend that
persists to this date. By the conclusion of the 20th
century, it was commonly quoted that over
one-tenth of the Dominican population had emigrated, and according to the OECD (2010), 88
percent were residing in the U.S. The next most popular destination, Spain, accounted for only 5
percent of Dominican emigrants.
4
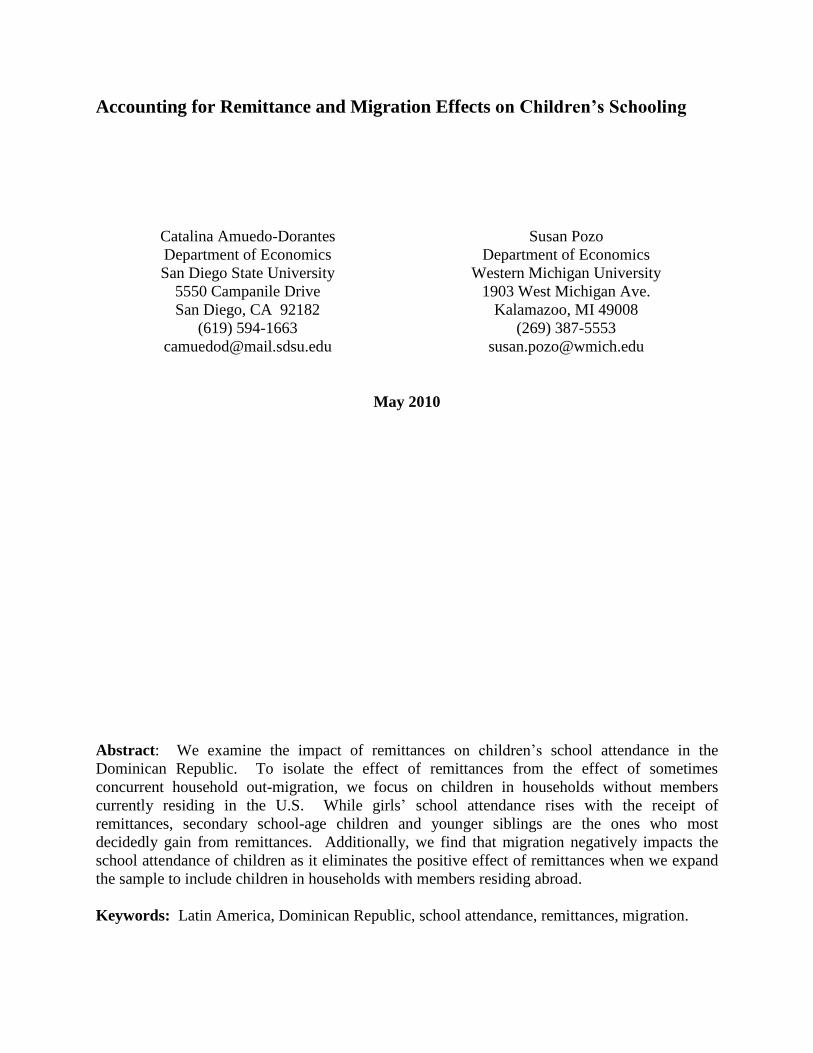
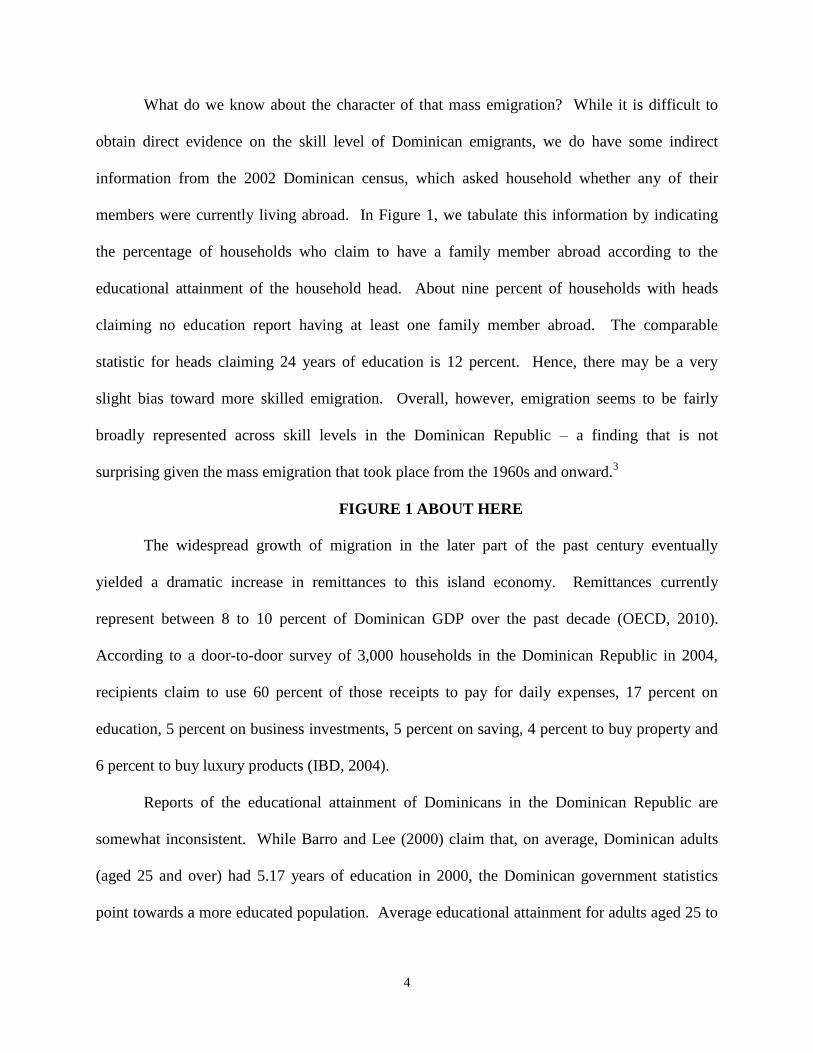
What do we know about the character of that mass emigration? While it is difficult to
obtain direct evidence on the skill level of Dominican emigrants, we do have some indirect
information from the 2002 Dominican census, which asked household whether any of their
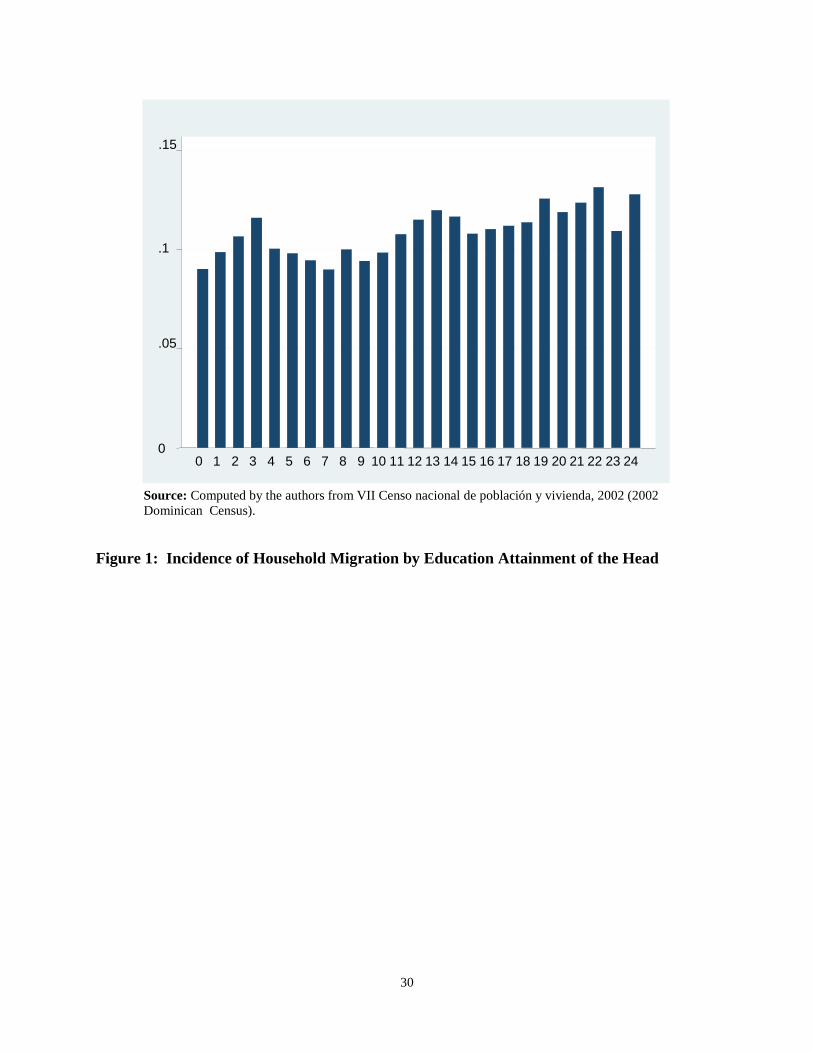
members were currently living abroad. In Figure 1, we tabulate this information by indicating
the percentage of households who claim to have a family member abroad according to the
educational attainment of the household head. About nine percent of households with heads
claiming no education report having at least one family member abroad. The comparable
statistic for heads claiming 24 years of education is 12 percent. Hence, there may be a very
slight bias toward more skilled emigration. Overall, however, emigration seems to be fairly
broadly represented across skill levels in the Dominican Republic – a finding that is not
surprising given the mass emigration that took place from the 1960s and onward.3
FIGURE 1 ABOUT HERE
The widespread growth of migration in the later part of the past century eventually
yielded a dramatic increase in remittances to this island economy. Remittances currently
represent between 8 to 10 percent of Dominican GDP over the past decade (OECD, 2010).
According to a door-to-door survey of 3,000 households in the Dominican Republic in 2004,
recipients claim to use 60 percent of those receipts to pay for daily expenses, 17 percent on
education, 5 percent on business investments, 5 percent on saving, 4 percent to buy property and
6 percent to buy luxury products (IBD, 2004).
Reports of the educational attainment of Dominicans in the Dominican Republic are
somewhat inconsistent. While Barro and Lee (2000) claim that, on average, Dominican adults
(aged 25 and over) had 5.17 years of education in 2000, the Dominican government statistics
point towards a more educated population. Average educational attainment for adults aged 25 to
5
54 is in the order of 7 years, whereas for adults aged 55 and older it is about 7.5 years (Secretaría
de Estado de Educación, 2008). The educational attainment of women exceeds that of men (8.3
years versus 7.9 years in 2007), with rising gender disparities (in favor of women) at higher
grade levels. About three quarters of Dominican students attend public schools and the other
quarter attend private schools (Secretaría de Estado de Educación, 2008). Grade repetition in the
Dominican Republic is common. In primary school, the repetition rate is about 8 percent, while
in secondary school it is about 4 percent (UNESCO, 2009). While education attainment is not
out of line with that of many Latin American nations, improvements need to be made to promote
the economic diversification that the Dominican government has pursued in the past half century.
In terms of assessing the likelihood of raising educational levels, we are interested in the
growing number of studies that have linked migration and education by estimating the impact of
remittances on children’s schooling. Focusing on Latin America, the hypothesis that remittances
raise educational attainment or investments in schooling has received support in a growing
number of studies, including those by Ilahi (2001) for Peru; Cox Edwards and Ureta (2003) for
El Salvador; Borraz (2005) for Mexico; Acosta et al. (2007) for a sampling of Latin American
countries; and Calero et al. (2009) for Ecuador. Standard economic theory suggests that, by
lifting liquidity constraints, remittances should raise investments in human capital of household
members, particularly in developing countries. While schools may often be state-supported,
students in developing nations are often expected to pay for their books, uniforms, supplies and
sometimes even teacher salaries. Furthermore, attending school imposes additional costs on the
family through accompanying reductions in monetary income or household production by the
attendee. Given the competition between school and work, remittances, often amounting to a
sizable fraction of the household budget, have the potential to loosen household liquidity
6
constraints and increase investments in human capital. Yet, perhaps contrary to what one would
expect from the income effect due to increases in non-labor income, Acosta et al. (2007)
conclude that remittances do not raise educational attainment in the Dominican Republic4.
In this paper, we revisit the role of remittances on school attendance in the Dominican
Republic. In addition to carefully addressing the endogeneity of remittance receipt, we take into
account the fact that migration of a family member often accompanies the receipt of remittances
by the household. This migration, in and of itself, may induce changes in the schooling of the
remaining children, independently of remittances, by several avenues. First, children may engage
in market activities to replace the household’s lost income, leaving less time to devote to their
studies. Second, children may skip or quit school in order to attend to necessary household
chores or to care for younger children or elderly family members –activities perhaps formerly
undertaken by the now absent household member. Third, children may devote less time to
studies if they are expecting to migrate too. Consequently, in our view, if we do not adequately
control for family emigration, we may not uncover the true impact of remittances on children’s
schooling. A recent study by Bansak and Chezum (2009) concerning the educational attainment
of Nepalese children, acknowledges the two competing impacts of remittances and family
emigration, which they describe as net remittance and absenteeism effects. However, some
doubts remain as to the ability of the strategy employed in their analysis to separate and properly
estimate the remittance and migration effects.5
3. DATA AND DESCRIPTIVE STATISTICS
To ascertain the impact of remittances on children’s schooling, we use Dominican data
from the Latin American Migration Project survey (known as the LAMP-DR7).6 The LAMP-
DR7 consists of 907 households with 1123 children between the ages of 7 and 18 interviewed in
7
seven Dominican communities in 1999 and 2000. Two of the communities are located within
the capital city, Santo Domingo, while the remaining communities are located in a diversity of
areas including farming communities, impoverished rural towns, and middle-sized cities.
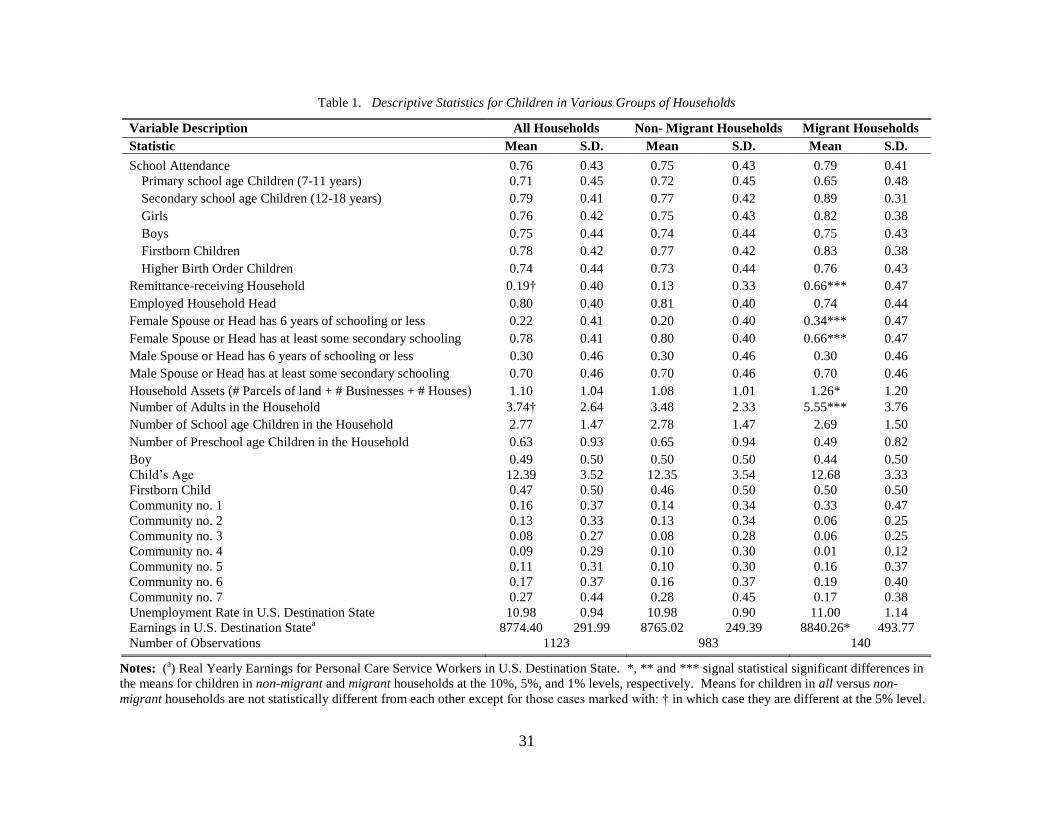
Table 1 displays some descriptive statistics for all children, as well as for children
residing in what we refer to as migrant and non-migrant households. Out of the 1123 children,
140 live in migrant households –households that claim having some members currently living in
the U.S.7 The other 983 children live in non-migrant households –households that do not have
any members currently living in the U.S. A first look at the statistics for all children (first two
columns of Table 1) reveals that the average school attendance rate is 76 percent. Nineteen
percent of all children in the seven communities being surveyed by the LAMP reside in
remittance-receiving households.8 Eighty percent of the children residing with household heads
who are employed and approximately 40 percent of household members are children between 7
and 18 years of age. Twenty-two percent of the children reside in households where the female
spouse claims to have 6 or fewer years of education. The remaining 78 percent have more than 6
years of education. In the aggregate, men are less educated than women, with only 70 percent of
them claiming more than 6 years of schooling.
TABLE 1 ABOUT HERE
When we distinguish according to whether the children reside in a non-migrant as
opposed to a migrant household (consult the middle versus the two far right columns in Table 1),
we find some statistically significant differences in the variables describing the two sub-samples.
For instance, the probability of living in a remittance-receiving household is greater for children
8
in migrant households relative to children in non-migrant households. Sixty-six percent of the
children residing in migrant households receive remittances as opposed to 13 percent in non-
migrant households.9 Migrant households also appear to have fewer preschoolers, more adults,
more assets and less educated female spouses relative to non-migrant households.10
The purpose of our analysis is to learn about the impact that the receipt of remittances by
the household may have on children’s schooling. Since we do not have information on the
household’s history of remittance receipts, we focus on the impact of the current receipt of
remittances by the household on the contemporaneous school attendance of children. One might
argue that it would be preferable to measure educational attainment (perhaps the number of years
of schooling completed by the child in relation to his or her age) and analyze the impact that
remittance receipt has on years of schooling completed. However, educational attainment is
likely dependent on the household’s history of remittance receipts, which is not reported in the
survey. Therefore, we focus on school attendance.
TABLE 2 ABOUT HERE
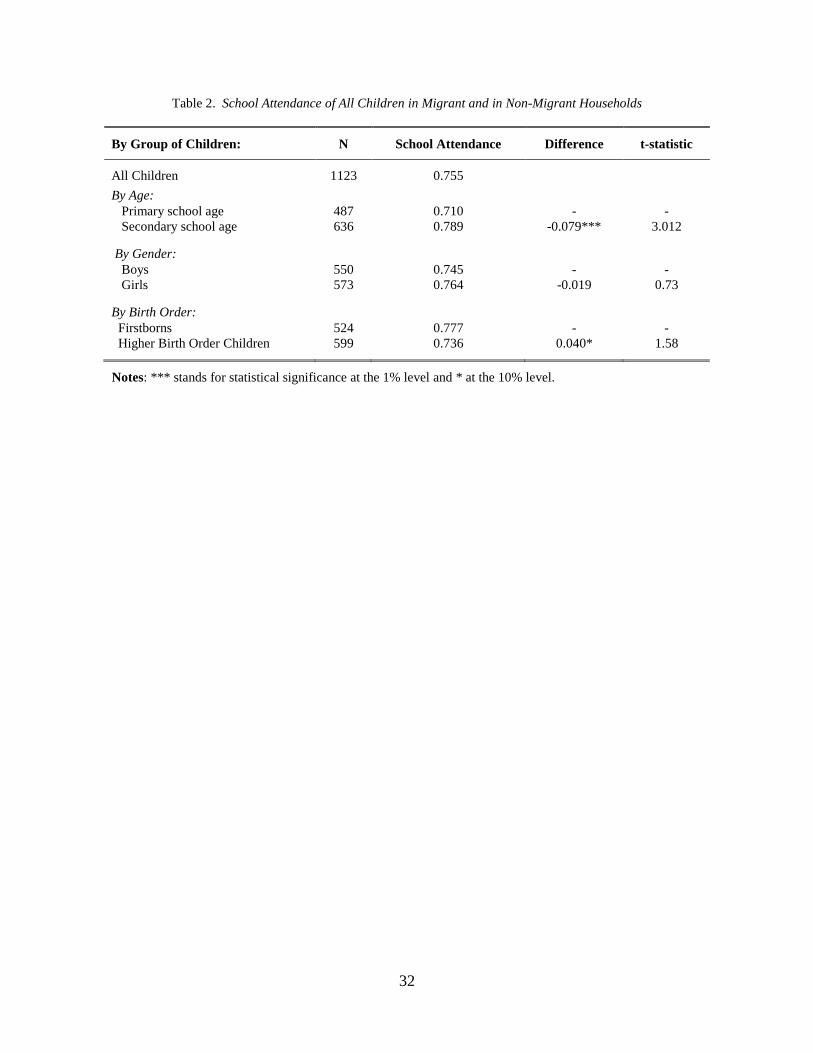
Simple descriptive statistics for school attendance by basic child characteristics are
displayed in Table 2. School attendance rates are significantly higher for secondary school-age
children (79 percent attend school) than for primary school-age children (71 percent attend
school). Yet, the 2002 Dominican census reports attendance rates for primary school-age
children as being slightly higher than for children in secondary school. The difference between
the LAMP survey and the Dominican census is probably explained by the fact that the LAMP
focuses primarily, on migrant communities. Since the schooling rates of primary school-age
children appear particularly lower in migrant households (see Table 1), it is possible that the
difference being observed between this survey and the national census is due to the population
9
sample being surveyed by the LAMP. However, because migrant communities are the most
impacted by remittance inflows, our sample is still of interest for the study at hand. The figures
in Table 2 also show that girls have a slight edge over boys in school attendance, as is
customarily found in the Dominican Republic. However, the gender difference is not
statistically significant. With respect to birth order, there is some evidence that firstborn children
are provided with more opportunities to attend school. While 78 percent of firstborn children
attend school, only 74 percent of younger siblings are in school. This difference is statistically
significant at the 10 percent level.
What information do we have regarding remittances? We know whether the household
currently receives money from people in the U.S.11
Unfortunately, the survey does not contain
information on the dollar amount received by families, nor on the frequency with which they
receive such transfers nor on how they use the money received. However, if households report
receiving money from people in the U.S., they are asked about the relative size of the remittance
inflow with respect to household income.12
Table 3 tabulates this qualitative information. About
half of remittance-receivers indicate receiving a modest amount when compared to household
income. The other half of recipients is about equally split into those who indicate remittances to
be a medium or a large inflow relative to their household incomes. When we distinguish
households by migrant and non-migrant status, we observe some further differences. In one third
of migrant households, remittances represent a large share of household income. In contrast,
only a fifth of remittance-receiving non-migrant households fall in that category. Yet, as we
shall discuss in what follows, the incidence of remittance receipt among non-migrant households
is still large, suggesting that quite a few Dominican households receive remittances from
10
individuals other than their own household members, such as distant family members and
friends.
TABLE 3 ABOUT HERE
4. EMPIRICAL METHODOLOGY
To analyze the effect of remittance receipt on children’s school attendance, we could
estimate the following benchmark model:
(1) )0(, ***
ififififfifif yyXRyAttendanceSchool
where *ify is the unobserved or latent likelihood of attending school by child i in family f. The
function is the indicator function taking on the value one if *ify > 0 and zero
otherwise. fR is a dummy variable denoting whether the household currently receives
international remittances. The vector ifX includes information on a variety of covariates thought
to be important determinants of children’s schooling according to earlier studies, such as those
by Cox Edwards and Ureta (2003) and Hanson and Woodruff (2003). Some of these
determinants include information on the children’s gender and order of birth to allow for
differential returns to educational investment for boys and girls, as well as for firstborns and
higher order of birth siblings. We account for additional child descriptors potentially affecting
children’s educational attainment, such as age. We also include information on the employment
of the household head, household assets, and household composition (as captured by the number
of adults, number of school-age children and number of preschool-age children) as factors
possibly influencing the household’s financial ability to send children to school.13
Additionally,
we account for the educational attainment of the male as well as the female spouse, factors found
to be correlated with children’s educational outcomes in other studies (Haveman and Wolfe,
11
1995; Schultz, 2002; Breierova and Duflo, 2004).14
Finally, we include a set of community
dummy variables to take into account regional differences across the various Dominican
Republic communities in which the children reside. Communities may differ in per capita
income levels or school infrastructure possibly impacting school attendance rates.
(a) Distinguishing Remittance from Household Migration Effects
There are several econometric problems that could arise in the estimation of equation (1).
Perhaps, the most pressing problem is the fact that household migration has taken place for 48
percent of the children residing in remittance receiving households. Remittances, a source of
non-labor income, may lift budget constraints and, through an income effect, improve the
likelihood that children in remittance-receiving households go to school. However, the presence
of family members abroad may induce changes in school attendance of children in non-migrant
households for a variety of reasons. Children may have less time to devote to schooling because
they engage in market activities to earn income to defray migration-related expenses of
household members or to replace the migrant’s former contributions to the household’s income.
Alternatively, children may leave school to attend to necessary household chores that the absent
migrant no longer attends to. Finally, if children expect to follow their family members and
migrate in the future, they may drop out of school if Dominican education is not generally
rewarded in the destination.15
Therefore, attributing choices in schooling to remittances alone
may not be appropriate if there is a concurrent migration effect.
Distinguishing the disruptive effect of household emigration from the income effect of
remittance inflows on children’s schooling is problematic as it requires the identification of two
separate events that are often driven by similar factors. In the Dominican Republic, however,
there is significant diversity in household emigration and remittance-receipt patterns that we can
12
take advantage of to distinguish the two impacts. In effect, we separate the migration from the
remittance effect by focusing our attention on children residing in non-migrant households.
While the existence of a close family member abroad significantly raises the odds of remittance
receipt, more than half of remittance-receiving households report receiving remittance flows
from individuals other than household members. These may be distant relatives or perhaps
friends.16
Among children, more than half of those residing in remittance-receiving households
(124 out of 217 in the LAMP-DR7) reside in non-migrant households (see Table 4). Therefore,
by examining how these children’s schooling responds to the receipt of remittances by the
household, we can ascertain the impact of remittance receipt independently of household
emigration.17
TABLE 4 ABOUT HERE
(b) Endogeneity of Remittance Receipt
The estimation of equation (1) presents one additional challenge. Specifically, the receipt
of remittances and the error term may be correlated, in which case the coefficient estimate for
remittance receipt is biased. There are two potential sources for this noted correlation. The first
source originates in the presence of unobserved heterogeneity and omitted variable bias. The
receipt of remittances may be inversely related, for example, to household income which, in turn,
may be positively correlated to school attendance.18
In that regard, our estimate of the impact of
the receipt of remittances is likely to be downward biased. The second source of correlation
between the receipt of remittances and the error term in equation (1) results from the potential
joint determination of remittance transfers and children’s schooling. In particular, while it seems
reasonable to expect that remittance receipts facilitate investments in schooling, it may also be
the case that children’s schooling induce remittance inflows, e.g. an aunt may be remitting to a
13
favorite nephew to reward him for his school attendance. In that case, the nephew’s schooling is
determining the aunt’s remittances instead of the reverse.
We first test whether remittance receipt is endogenous to the child’s school attendance
using the augmented Durbin-Wu-Hausman (DWH) test for endogeneity suggested by Davidson
and MacKinnon (1993). After concluding that OLS is inconsistent,19
we estimate equation (1) as
a two-stage linear probability model. We instrument remittance receipt with the 1999-2000
unemployment rate and average real earnings in personal care and service occupations in those
U.S. states where households likely developed networks.20
Migration network information is
obtained from the LAMP survey, which inquires about the past and current location of household
and extended family members in the U.S. When there is no history of migration to the U.S. for
neither household nor extended family members, these instrumental variables take on the
unemployment and wage values for Puerto Rico. In those instances, Puerto Rico –accessible by
boat from the Dominican Republic and, as such, a common destinations of Dominicans going to
the U.S.– is more likely to be the origin of the remittance flows. Table 5 reports the most
common destinations for Dominican migrant locating in the U.S according to the survey. Owing
to the importance of networks in facilitating migration, there is a large concentration of
Dominicans in New York. Nevertheless, we also find a significant fraction of Dominicans in
other states, such as New Jersey and Puerto Rico. Other, less frequent destinations, present in
the dataset include Massachusetts, Florida, Rhode Island and Pennsylvania, as well as
Connecticut, California, Illinois, Kansas, North Carolina and South Carolina. These destinations
are in accord with the major destinations of Dominican emigrants reported by the Inter-American
Development Bank (IDB, 2004).
TABLE 5 ABOUT HERE
14
What is the logic behind our choice of instruments? Current labor market conditions in
U.S. destination areas are likely to be correlated with the sending of remittances by relatives and
friends as those conditions will impact the ability and desirability to remit. Our identifying
assumption is that current U.S. labor market conditions do not affect the school attendance of
children in the Dominican Republic other than through remittances. As is often the case with
instruments, ours could be subject to potential shortcomings. For instance, one potential threat is
that the instruments could be related to household characteristics that affect children’s schooling,
such as household income. Higher income households may have historically placed migrants in
economically more attractive states in the U.S. To address this possibility, we control for as
many household characteristics correlated with household income as we possibly can, including
a measure of the educational attainment of the female spouse and male spouse, the employment
of the household head, and household assets.
A second possible threat to the validity of our instruments could come from the fact that
Dominican migrants from different regions may traditionally send migrants to specific U.S.
states. In that case, the instruments could be simply capturing regional differences across
Dominican communities, such as differences in per capita income levels, school infrastructure or
overall economic development. To account for this possibility, the analysis includes community
dummies.
A final threat to the validity of our instruments (although also related to regional
differences and economic development captured by the community dummies) is if migration
networks alter children’s school attendance rates by directly or indirectly impacting household
wealth or by changing the incentives to acquire an education. Introducing community fixed
effects indirectly accounts for differences in migration networks across communities. In any
15
event, as noted by others in this literature (McKenzie and Rapoport, 2006), the effect of a
community network is likely to be second-order (to the effect of other household characteristics)
in the education decision.
In addition to discussing the theoretical basis and overall rationale for our choice of
instruments, we inspect our instrumental variables to ascertain their validity as instruments from
an econometric standpoint. Specifically, we first check their correlation with the receipt of
remittances by the household –the endogenous regressor to be instrumented. The problem of
“weak instruments” arises when either the instruments are weakly correlated with the
endogenous regressor (i.e. remittance receipt), or the number of instruments is too large (Angrist
and Krueger, 2001). Therefore, we check for the strength of our instruments with the F-test at
the bottom of Table 6 and Table 7. In both instances, the tests indicate that our instruments are
strongly correlated to remittance receipt.21
Additionally, the results from the first-stage
estimation in the bottom panels of Table 6 and Table 7 (to be discussed in the next section) are
reasonable and indicate that the instruments help predict household remittance-receipt.
Because remittance income is being instrumented by two variables, we also use over-
identification tests to examine the exogeneity of the instruments. Due to existing concerns
regarding the low power of these tests in case of general misspecifications (e.g. Newey, 1985),
we use Sargan’s (1958) test as well as a recommended variation of the Basmann (1960) test –the
Basmann-LIML form of the test (see Staiger and Stock, 1997). Both tests examine the
exogeneity of each one of our instruments conditional on the other one being valid. That is, in
both tests, the null hypothesis is that the excluded instruments are uncorrelated with the error
term and correctly excluded from the estimated equation. As such, a rejection of the null
hypothesis casts doubt on the validity of the instruments (Baum et al., 2002; Wooldridge, 2002).
16
As shown by both tests at the bottom of Table 6 and Table 7, we are unable to reject the null
hypothesis regardless of the sample of children considered in the analysis. As such, the
instruments appear to be correctly excluded from the main equation modeling children’s school
attendance.
In what follows, we examine the impact of remittance receipt on school attendance by
estimating equation (1) as a two-stage linear probability model. Relative to a probit or logit
model, the linear probability model allows us to handle instrumental variable estimates with
standard two-stage least squares procedures, facilitating the estimation of standard errors and
model convergence when sample sizes are not large. Subsequently, we assess how remittance
receipt may be affecting children’s school attendance by age, gender and order of birth. All the
analyses compute robust standard errors that take into account data clustering at the household
level.
5. RESULTS
The main objective of our analysis is to assess the impact of remittance receipt on
children’s school attendance by separating the income effect of remittance receipt from the
disruptive impact of contemporaneous household emigration. In addition, we also address the
endogeneity of remittance-receipt. In order to purge the coefficient estimate of remittance-
receipt from any potential disruptive impact of contemporaneous family emigration, we first
estimate our model focusing on children residing in non-migrant households. Additionally, we
address the endogeneity of remittance-receipt through the use of an instrumental variable
approach in the estimation of equation (1). The results from such an exercise are displayed in
Table 6.
TABLE 6 ABOUT HERE
17
Before discussing our findings, note that the test results at the bottom of Table 6 confirm
that each instrumental variable (state unemployment rates and real wages in personal care and
service occupations) appears sufficiently correlated to remittance receipt and, conditional on the
other one being valid, uncorrelated to the error term in equation (1). As shown by the regression
output in the bottom panel of Table 6, higher unemployment rates in the destination states of
migrants are positively correlated with a higher likelihood of remittance receipt, which supports
the view that migrants may be remitting money back to their communities for self-insurance
purposes. Immigrants likely bear higher employment risk during times of rising unemployment,
making it prudent for them to insure against these risks by remitting funds back to their
communities. In this way, migrants maintain “good standing” within the community permitting
them to return (with honor) in the event of an unsuccessful migration experience (Lucas and
Stark; 1985; Amuedo-Dorantes and Pozo, 2006). Yet, migrants may have multiple motives
when remitting money home, including altruism (Becker, 1974; Stark, 1991). If migrants also
remit altruistically, remittances should be directly related to their remitting capacity as reflected
by the positive sign on the average real earnings in personal care and service occupations in
those U.S. states where migrants tend to locate. Likewise, if migrants remit money home to
make a specific purchase (e.g., a plot of land or a house) or for investment purposes (e.g., setting
up a small business), remittances should increase with their real earnings as we observe in the
first-stage results.
Finally, it is also interesting to note that the receipt of remittances is positively related to
the number of preschoolers. By contrast, remittances are negatively related to the number of
school-age children in the household as well as to the number of adults. The presence of
preschoolers limits working options for adults, suggesting that remittances in these cases are
18
compensating for market work. On the other hand, the presence of school-age children and of
more adults provides the household with more flexibility with respect to garnering the necessary
resources for the household, making remittances less crucial in these instances. Similarly, as we
would expect, households with employed heads are also less likely to receive remittances.
(a) Remittance Receipt and Children’s School Attendance
Do remittances promote children’s school attendance? According to the figures in the
top panel of Table 6, an increase in the probability of remittance receipt of 10 percentage-points
raises the likelihood of school attendance by almost 3 percentage-points (i.e. 0.1*0.286=0.029)
from an average of 0.76 to approximately 0.79 (see Table 1 for group averages).22
As such,
remittances help close the non-attendance gap. This is the finding we would anticipate given that
remittances in these households have the potential to lessen liquidity constraints.
Other results are the expected ones. For instance, the positive coefficient on the dummy
variable for female secondary education is consistent with the idea that in households in which
the female head (or female spouse) is more highly educated, the educational attainment of
children in the household is higher. It is interesting that the male spouse’s educational
attainment is not statistically different from zero and suggests that males might not play as
important a role in directing the education of children in the household. This is in line with the
weak family structure, characteristic of the Dominican Republic, where consensual unions
predominate and, as a result, male partners end up having much less influence on family matters
than female spouses (Sana and Massey, 2005). Other determinants of children’s school
attendance include the number of school-age children in the household, which is positively
related to school attendance, thus suggesting that the educational attainment of all children in the
household is positively correlated. In contrast, the presence of younger children, such as
19
preschool-age children, lowers the likelihood of school attendance.23
Finally, the likelihood of
school attendance appears to significantly differ by birth order, with firstborns being 9
percentage-points more likely to attend school than their younger siblings.
In sum, these findings help us gauge the effect of remittance receipt on children’s school
attendance. However, can we say anything about the effect of migration and the need to
distinguish between the two effects? To illustrate the importance of separating the remittance
effect from the disruptive effect of contemporaneous family migration when assessing the impact
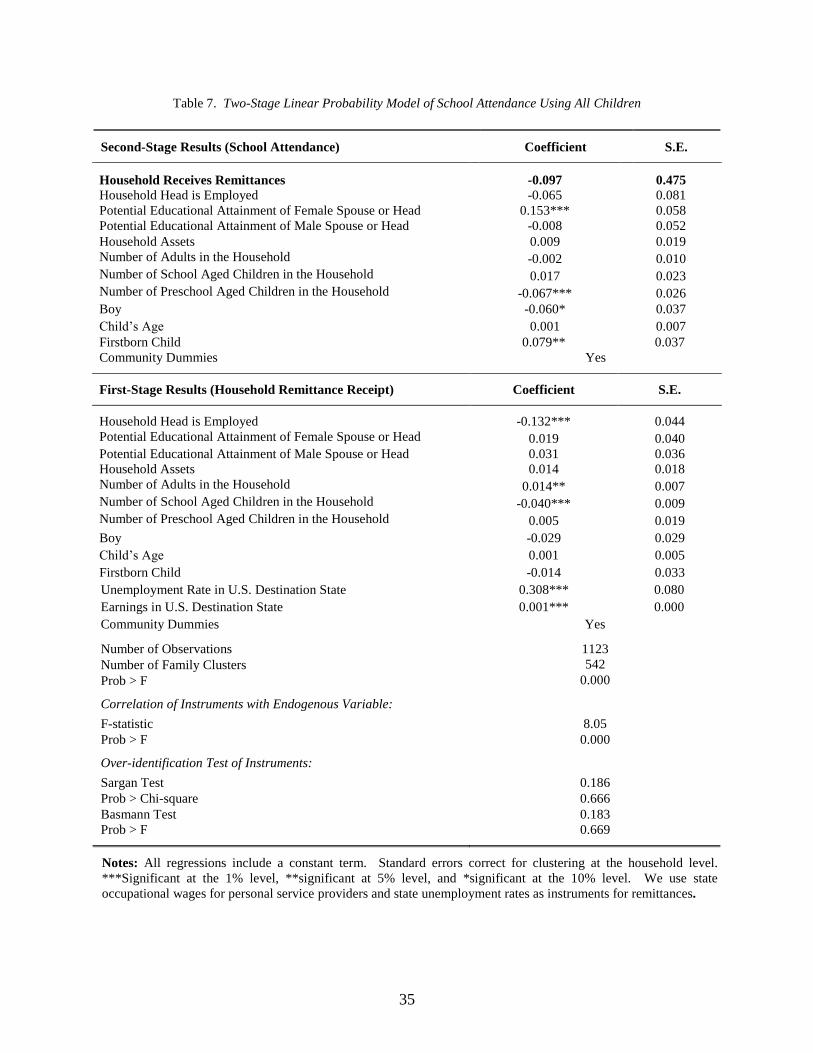
of remittance-receipt, we re-estimate our model adding children in migrant households. Table 7
displays the results from this exercise.
TABLE 7 ABOUT HERE
Once we add children in households with migrants currently in the U.S., remittances no
longer have a positive impact on children’s school attendance.24
Hence, the result in Table 7
suggests that the coefficient for remittance-receipt confounds the impact of family migration
with the remittance effect. It should be noted that our analysis only focuses on remittance receipt
and, as such, assumes that the remittance amounts received by migrant remittance-receiving
households and by non-migrant remittance-receiving households are the same. This, however,
only helps strengthen our findings. As shown in Table 3, non-migrant remittance-receiving
households in the LAMP report receiving smaller amounts of remittances (as a fraction of
household income) than migrant remittance-receiving households. Therefore, the migration
effect might actually be stronger than at first glance when using the receipt of remittances as our
key independent variable. In other words, migrant households are blessed with greater levels of
remittances and, yet, their children are less likely to be in school. It is also worth noting that the
result from Table 7 parallels the finding of Acosta et al. (2007), who examine the impact of
20
remittances on the educational attainment of children in the Dominican Republic without
distinguishing between children in migrant as opposed to non-migrant households.
Consequently, they conclude that remittances have no significant impact on the educational
attainment of children. In contrast, we find that, once we include children from migrant families
experiencing a contemporaneous family emigration effect, remittances no longer have the
positive impact on children’s schooling. Therefore, failure to properly separate the family
emigration effect from the remittance effect may underestimate the positive effect of remittances
on children’s schooling.
(b) Remittances and School Attendance According to Various Child Characteristics
To gain a better understanding of the impact of remittance inflows on children’s
schooling, we repeat the analysis for children in non-migrant households distinguishing
according to the child’s age, gender and order of birth children -- characteristics suggested as
being crucial in previous studies of human capital investments on children (e.g. Calero et al.
2009; Emerson and Portela Souza 2008).
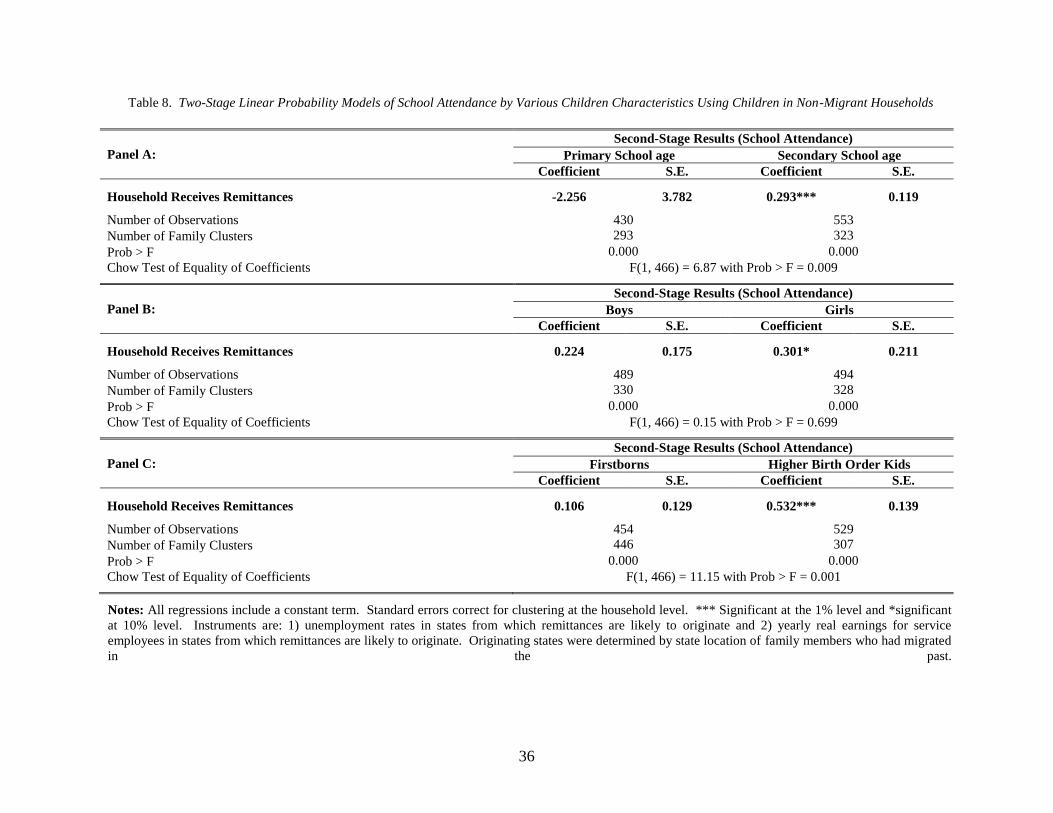
Panel A in Table 8 shows the estimated impact of remittances on children’s schooling
according to whether the children are of primary school-age as opposed to of secondary school
age. It is not at all surprising to find that remittances exclusively promote the school attendance
of secondary school-age children. After all, school attendance entails higher explicit and implicit
costs for older children. They often have to travel further to get to school, raising the cost of
schooling. They also usually spend more money on books and related materials than their
younger counterparts. Furthermore, the opportunity cost of attending school is significantly
higher for older children than for the very young. As such, remittances, which help lift
households’ liquidity constraints, can have a significant impact on the school attendance of

21
secondary school- age children. Specifically, a 10 percentage-point increase in the likelihood of
receiving remittances raises the likelihood of school attendance by 3 percentage points, from an
average of 0.79 to approximately 0.82, among secondary school-age children in the household.
The positive finding for secondary school-age children coupled with no impact on primary
school-age children suggests that, when children of primary school-age are not enrolled in
school, it may be due to non-monetary factors. A Chow test of the equality of the estimated
effect of remittance receipt for primary and secondary school-age children reveals that those
coefficients are statistically different.
TABLE 8 ABOUT HERE
We also examine the differential impact of remittances on children’s school attendance
according to gender. According to the figures in Panel B, Table 8, the receipt of remittance
inflows appears to increase school attendance among girls, although the effect is only marginally
significant at the 10 percent level. It is, therefore, not surprising that the Chow test of the
equality of the estimated effect of remittance receipt for girls and for boys finds no evidence of a
statistically significant difference in the effect of remittance receipt on the school attendance by
gender.
Finally, we look at the differential impact that remittances may have on children’s school
attendance according to the order of birth. It is common for firstborns to be placed in a more
privileged position than higher order of birth children in many cultures. In that case, remittances
may be particularly helpful in improving the school attendance of the less privileged children.
Indeed, this is what we find in Panel C, Table 8. The receipt of remittances benefits higher order
of birth children, but not firstborns. Specifically, a 10 percentage-point increase in the likelihood
of receiving remittances raises the likelihood of school attendance by 5 percentage points, from
22
an average of 0.74 to approximately 0.79, among higher order of birth children in the household.
However, it does not appear to have a statistically different from zero impact on the school
attendance of firstborns. As such, the Chow test of the equality of the estimated effect of
remittance receipt for firstborns and for younger siblings indicates that the effect on remittance
receipt on the school attendance of both groups of children is statistically different.
In sum, girls appear to slightly benefit from the receipt of remittances. But it is primarily
secondary school-age children and higher order of birth siblings that gain the most from the
receipt of remittances.
6. Concluding remarks
The present study examines the impact of remittance receipt on the school attendance of
children in the Dominican Republic. We focus our analysis on children residing in households
with heads claiming no close family members in the U.S. –the destination of the vast majority of
Dominican emigrants. This focus is intended to help isolate the impact of remittance receipt
from that of contemporaneous household migration. While non-migrant households constitute a
selected group, children from non-migrant households account for 88 percent of our sample of
Dominican children and drive the average rate of remittance receipt in the sample. After all, 52
percent of children in remittance receiving households in the Dominican LAMP are living in
non-migrant households –defined as households with no members currently in the U.S.
We find that remittances do positively impact children’s school attendance. A 10
percentage point increase in the likelihood of receiving remittances raises the likelihood of
school attendance by approximately 3 percentage-points from an average of 76 to about 79
percent. Secondly, while statistically speaking, girls’ school atttendance appears to rise from the
receipt of remittances, secondary school-age children and younger siblings are the ones who gain
23
the most from the receipt of remittances by the household. A 10 percentage point increase in the
likelihood of remittance-receipt by the household raises their probability of school attendance by
3 and 5 percentage-points, respectively. Finally, we find empirical evidence of a confounding
negative impact of family migration on children’s schooling. The positive impact of remittance
receipt on children’s school attendance effectively disappears when we expand our sample to
include children in migrant households. This result confirms the existence of a disruptive effect
of family migration on children’s schooling. After all, the emigration of a family member often
imposes hardships on the family members left behind, including children, who may need to skip
school and work to make up for the monetary and non-monetary contributions that the migrant
family member made to the household before migrating. Alternatively, if Dominican education
is poorly rewarded in the destination countries of emigrants, expectations of future emigration
may reduce school attendance among children residing in migrant households. Overall, family
migration may temper the positive impact of remittance-receipt, which helps us understand
previous findings. In those cases, measurement of a zero impact of remittance income on
children’s educational attainment may result from confounding the remittance with the migration
effect.
In sum, our findings emphasize the need to account for migration effects when evaluating
the impact of remittances on children’s schooling and on other household activities. This is
especially important when the incidence of remittance-receipt and migration differ across the
population, as we observe in the Dominican Republic. While remittances tend to follow the out-
migration of a household member, it is not always so. The contemporaneous foreign residency
of a household member is not a precondition for the receipt of remittances, as half of the children
in the sample who receive remittances live in a non-migrant household. Therefore, remittances
24
are often forthcoming from individuals who are not considered household members, such as
distant relatives and friends. By the same token, migrant households do not necessarily receive
remittances. Only two-thirds of migrant households in the Dominican LAMP database enjoy
remittances.
From a policy perspective, our results underscore the importance of distinguishing
between the impacts of remittances and migration in policy-making. Specifically, if the
objective is to raise investments in children’s human capital, policies that favor migration when
remittances are more likely to follow and policies aimed at increasing remittance flows (e.g. by
lowering remitting costs or by offering matching funds) can prove particularly helpful for
developing countries impacted with extensive out-migration.
We would like to conclude with some suggestions for future research. This study has
revealed that, while remittances raise school attendance among children in the Dominican
Republic, emigration of family members appears to do the opposite. Yet, the fact that migration
does not help children’s school attendance does not mean migration is necessarily undesirable.
Perhaps migration serves to smooth out household income, as predicted by the New Economics
of Labor Migration. Alternatively, migration may help households maximize income or provide
the financial capital to begin or expand a family business. Working abroad may also facilitate
the accumulation of entrepreneurial capital to succeed in business. If those are the main motives
behind migration, migration may still be a desirable outcome for many households. Therefore, it
would be interesting for future work to examine the impact that migration, separately from
remittance-receipt, has on other household outcomes aside from children’s schooling. Likewise,
it would be useful to get a fuller understanding of the possibly divergent motives for sending
remittances according to whether they are sent to migrant versus non-migrant households. This

25
may help us better track the different impacts of remittances on the various household types.
Finally, better information on the frequency, levels and history of remittance receipt could also
help sharpen our estimates of migration and remittances on household outcomes and on the
overall well-being of households in developing economies.
26
References
Acosta, P., Fajnzylber, P., & Humberto Lopez, J. (2007). The impact of remittances on poverty
and human capital: Evidence from Latin American household surveys. World Bank Policy
Research Working Paper 4247, June 2007.
Amuedo-Dorantes, C., & Pozo, S. (2006). Remittances and Insurance: Evidence from Mexican
migrants. Journal of Population Economics, 19(2), 227-254.
Angrist, J. D., & Krueger, A. (2001). Instrumental variables and the search for identification:
From supply and demand to natural experiments. Journal of Economic Perspectives, 15(4),
69-85.
Barro, R., & Lee, J. W. (2000). Education attainment: Updates and implications. Center for
International Development, Working Paper # 42, April 2000, Available:
<http://www.cid.harvard.edu/ciddata/ciddata.html>.
Bansak, C., & Chezum, B. (2009). How do remittances affect human capital formation of school
age boys and girls? American Economic Association Papers & Proceedings, 99(2), 145-
48.
Basmann, R. L. (1960). On finite sample distributions of generalized classical linear
identifiability test statistics. Journal of the American Statistical Association, 55(292), 650-
659.
Baum, C. F., Schaffer, M. E., & Stillman, S. (2002). Instrumental variables and GMM:
Estimation and testing. Department of Economics, Boston College, Working paper no. 545,
Available: <http://fmwww.bc.edu/ec-p/WP545.pdf>.
Becker, G. (1974). A theory of social interactions. Journal of Political Economy, 82(6), 1063-
93.
27
Borraz, F. (2005). Assessing the impact of remittances on schooling: The Mexican experience.
Global Economy Journal [on-line serial], 5(1) available: bepress.com/gej/.
Breierova, L., & Duflo, E. (2004) The impact of education on fertility and child mortality: Do
fathers really matter less than mothers? NBER Working Paper No. 10513, National
Bureau of Economic Research.
Caceras, L. R. (2008). El Destino de las remesas en El Salvador. Comercio Exterior, 58(1), 27-
40.
Calero, C., Bedi, A. J., & Sparrow, R. (2009). Remittances, liquidity constraints and human
capital investments in Ecuador. World Development, 37(6), 1143-54.
Cox Edwards, A., & Ureta, M. (2003). International migration, remittances, and schooling:
evidence from El Salvador. Journal of Development Economics, 72(2), 429-61.
Davidson, R., & MacKinnon, J. G. (1993). Estimation and inference in econometrics. New
York: Oxford University Press.
Derby, L. (2009). The dictator’s seduction: Politics and the popular imagination in the era of
Trujillo. Durham: Duke University Press.
Durand, J., & Massey, D. S. (1992). Mexican migration to the United States: A critical review.
Latin American Research Review, 27(2), 3-42.
Emerson, P. M., & Portela Souza, A. (2008). Birth order, child labor and school attendance in
Brazil. World Development, 36(9), 1647-64.
Hanson, G. H., & Woodruff, C. (2003). Emigration and educational attainment in Mexico.
Working paper, University of California, San Diego.
Haveman, R. & Wolfe, B. (1995). The determinants of children’s attainments: A review of
methods and findings. Journal of Economic Literature, 33(4), 1829-1879.
28
Illahi, N. (2001). Children’s work and schooling: Does gender matter? Evidence from the Peru
LSMS panel data. The World Bank, Policy Research Working Paper Series, No. 2744.
IDB. (2004). Sending money home: Remittance recipient in the Dominican Republic and
remittance senders in the US. November 23, 2004, Mutilateral Investment Fund/Inter-
American Bank. Available:
<http://idbdocs.iadb.org/wsdocs/getdocument.aspx?docnum=546769>.
Kandel, W. & Kao, G. (2001). The impact of temporary labor migration on Mexican children’s
educational aspirations and performance. International Migration Review, 35(4), 1205-
1231.
Lucas, R. E. B., & Stark, O. (1985). Motivations to remit: Evidence from Botswana. Journal of
Political Economy, 93(5), 901-18.
McKenzie, D & Rapoport, H. (2006). Can migration reduce educational attainments?
Depressing evidence from Mexico. CReAM Discussion Paper Series, no. 01.
Newey, W. (1985). Generalized method of moments specification testing. Journal of
Econometrics, 29(3), 229-256.
OECD (2010). Latin American economic outlook 2010. Available:
<http://www.oecd.org/dataoecd/20/1/44535785.pdf>.
Sagás, E. & Molina, S. E. (2004). Dominican transnational migration. In E. Sagás & S. E.
Molina (Eds.), Dominican migration: Transnational perspectives, Gainsville: University
Press of Florida.
Sana, M. & Massey, D, (2005). Household composition, family migration and community
context: Migrant remittances in four countries. Social Science Quarterly, 86(2), 509-528.
29
Sargan, J.D. (1958). The estimation of economic relationships using instrumental variables.
Econometrica, 26(3), 393-415.
Schultz, T. P. (2002). Why governments should invest more to educate girls World
Development, 30(2), 207-225.
Secretaría de Estado de Educación. (2008). Indicadores Estadísticos 2007-2008. Santo
Domingo, Dominican Republic, Available at:
<http://www.see.gov.do/portalsee/planificacion/documentos/Boletindeindicadores2007-
08.pdf>.
Staiger, D. & Stock, J. H. (1997). Instrumental variables regressions when instruments are weak.
Econometrica, 65(3), 557-586.
Stark, O. (1991). The migration of labour. Oxford: Basil Blackwell.
UNESCO. (2009). Global education digest 2009: Comparing education statistics across the
world. Montreal: UNESCO Institute for Statistics.
Wooldridge, J. M. (2002). Econometric analysis of cross section and panel data. (2nd
ed.)
Cambridge, MA: The MIT Press.
World Bank, Migration and remittances factbook. compiled by Dilip Ratha and Zhimei Xu,
Available: <www.worldbank.org/prospects/migrationandremittances>.
30
Source: Computed by the authors from VII Censo nacional de población y vivienda, 2002 (2002
Dominican Census).
Figure 1: Incidence of Household Migration by Education Attainment of the Head
0
.05
.1
.15
0 1 2 3 4 5 6 7 8 9 10 11 12 13 14 15 16 17 18 19 20 21 22 23 24
31
Table 1. Descriptive Statistics for Children in Various Groups of Households
Variable Description All Households Non- Migrant Households Migrant Households
Statistic Mean S.D. Mean S.D. Mean S.D.
School Attendance 0.76 0.43 0.75 0.43 0.79 0.41
Primary school age Children (7-11 years) 0.71 0.45 0.72 0.45 0.65 0.48
Secondary school age Children (12-18 years) 0.79 0.41 0.77 0.42 0.89 0.31
Girls 0.76 0.42 0.75 0.43 0.82 0.38
Boys 0.75 0.44 0.74 0.44 0.75 0.43
Firstborn Children 0.78 0.42 0.77 0.42 0.83 0.38
Higher Birth Order Children 0.74 0.44 0.73 0.44 0.76 0.43
Remittance-receiving Household 0.19† 0.40 0.13 0.33 0.66*** 0.47
Employed Household Head 0.80 0.40 0.81 0.40 0.74 0.44
Female Spouse or Head has 6 years of schooling or less 0.22 0.41 0.20 0.40 0.34*** 0.47
Female Spouse or Head has at least some secondary schooling 0.78 0.41 0.80 0.40 0.66*** 0.47
Male Spouse or Head has 6 years of schooling or less 0.30 0.46 0.30 0.46 0.30 0.46
Male Spouse or Head has at least some secondary schooling 0.70 0.46 0.70 0.46 0.70 0.46
Household Assets (# Parcels of land + # Businesses + # Houses) 1.10 1.04 1.08 1.01 1.26* 1.20
Number of Adults in the Household 3.74† 2.64 3.48 2.33 5.55*** 3.76
Number of School age Children in the Household 2.77 1.47 2.78 1.47 2.69 1.50
Number of Preschool age Children in the Household 0.63 0.93 0.65 0.94 0.49 0.82
Boy 0.49 0.50 0.50 0.50 0.44 0.50
Child’s Age 12.39 3.52 12.35 3.54 12.68 3.33
Firstborn Child 0.47 0.50 0.46 0.50 0.50 0.50
Community no. 1 0.16 0.37 0.14 0.34 0.33 0.47
Community no. 2 0.13 0.33 0.13 0.34 0.06 0.25
Community no. 3 0.08 0.27 0.08 0.28 0.06 0.25
Community no. 4 0.09 0.29 0.10 0.30 0.01 0.12
Community no. 5 0.11 0.31 0.10 0.30 0.16 0.37
Community no. 6 0.17 0.37 0.16 0.37 0.19 0.40
Community no. 7 0.27 0.44 0.28 0.45 0.17 0.38
Unemployment Rate in U.S. Destination State 10.98 0.94 10.98 0.90 11.00 1.14
Earnings in U.S. Destination Statea 8774.40 291.99 8765.02 249.39 8840.26* 493.77
Number of Observations 1123 983 140
Notes: (a) Real Yearly Earnings for Personal Care Service Workers in U.S. Destination State. *, ** and *** signal statistical significant differences in
the means for children in non-migrant and migrant households at the 10%, 5%, and 1% levels, respectively. Means for children in all versus non-
migrant households are not statistically different from each other except for those cases marked with: † in which case they are different at the 5% level.
32
Table 2. School Attendance of All Children in Migrant and in Non-Migrant Households
By Group of Children: N School Attendance Difference t-statistic
All Children 1123 0.755
By Age:
Primary school age 487 0.710 - -
Secondary school age 636 0.789 -0.079*** 3.012
By Gender:
Boys 550 0.745 - -
Girls 573 0.764 -0.019 0.73
By Birth Order:
Firstborns 524 0.777 - -
Higher Birth Order Children 599 0.736 0.040* 1.58
Notes: *** stands for statistical significance at the 1% level and * at the 10% level.
33
Table 3. Size of Remittance Receipt
Size of Remittance Inflow All Recipients Remittance-receiving
Migrant HHs
Remittance-receiving
Non-migrant HHs
Small portion of HH income 0.48 0.43 0.58
Medium portion of HH income 0.24 0.26 0.22
Substantial portion of HH income 0.27 0.31 0.20
Table 4. All School-age Children (Ages 7-18)
Count of:
Living in
Migrant
Households
Living in
Non-Migrant
Households
All Children
All Children 140 983 1123
Children in Remittance-Receiving Households 93 124 217
Table 5. Household Migration Networks
U.S. State Incidence of Networks in U.S. State
New York 0.68
New Jersey 0.12
Puerto Rico 0.08
Massachusetts 0.03
Florida 0.02
Rhode Island, Pennsylvania Between 0.01 and 0.02
Connecticut, California, Illinois, Kansas, North Carolina, South Carolina Less than 0.01

34
Table 6. Two-Stage Linear Probability Model of School Attendance Using Children in Non-Migrant Households
Second-Stage Results (School Attendance) Coefficient S.E.
Household Receives Remittances 0.286** 0.139
Household Head is Employed 0.004 0.069
Potential Educational Attainment of Female Spouse or Head 0.160*** 0.064
Potential Educational Attainment of Male Spouse or Head 0.005 0.060
Household Assets -0.001 0.025
Number of Adults in the Household 0.003 0.011
Number of School Aged Children in the Household 0.037** 0.016
Number of Preschool Aged Children in the Household -0.084** 0.034
Boy -0.036 0.039
Child’s Age -0.002 0.007
Firstborn Child 0.090** 0.037
Community Dummies Yes
First-Stage Results (Household Remittance Receipt) Coefficient S.E.
Household Head is Employed -0.137*** 0.046
Potential Educational Attainment of Female Spouse or Head 0.012 0.042
Potential Educational Attainment of Male Spouse or Head 0.017 0.035
Household Assets 0.001 0.015
Number of Adults in the Household -0.013** 0.006
Number of School Aged Children in the Household -0.035*** 0.009
Number of Preschool Aged Children in the Household 0.035* 0.019
Boy 0.013 0.027
Child’s Age 0.005 0.004
Firstborn Child -0.024 0.031
Unemployment Rate in U.S. Destination State 0.340*** 0.023
Earnings in U.S. Destination State 0.001*** 0.000
Community Dummies Yes
Number of Observations 983
Number of Family Clusters 467
Prob > F 0.000
Correlation of Instruments with Endogenous Variable:
F-statistic 15.03
Prob > F 0.000
Over-identification Test of Instruments:
Sargan Test 0.668
Prob > Chi-square 0.412
Basmann Test 0.655
Prob > F 0.418
Notes: All regressions include a constant term. Standard errors correct for clustering at the household level.
***Significant at the 1% level, **significant at 5% level, and *significant at the 10% level. We use state
occupational wages for personal service providers and state unemployment rates as instruments for remittances.
35
Table 7. Two-Stage Linear Probability Model of School Attendance Using All Children
Second-Stage Results (School Attendance) Coefficient S.E.
Household Receives Remittances -0.097 0.475
Household Head is Employed -0.065 0.081
Potential Educational Attainment of Female Spouse or Head 0.153*** 0.058
Potential Educational Attainment of Male Spouse or Head -0.008 0.052
Household Assets 0.009 0.019
Number of Adults in the Household -0.002 0.010
Number of School Aged Children in the Household 0.017 0.023
Number of Preschool Aged Children in the Household -0.067*** 0.026
Boy -0.060* 0.037
Child’s Age 0.001 0.007
Firstborn Child 0.079** 0.037
Community Dummies Yes
First-Stage Results (Household Remittance Receipt) Coefficient S.E.
Household Head is Employed -0.132*** 0.044
Potential Educational Attainment of Female Spouse or Head 0.019 0.040
Potential Educational Attainment of Male Spouse or Head 0.031 0.036
Household Assets 0.014 0.018
Number of Adults in the Household 0.014** 0.007
Number of School Aged Children in the Household -0.040*** 0.009
Number of Preschool Aged Children in the Household 0.005 0.019
Boy -0.029 0.029
Child’s Age 0.001 0.005
Firstborn Child -0.014 0.033
Unemployment Rate in U.S. Destination State 0.308*** 0.080
Earnings in U.S. Destination State 0.001*** 0.000
Community Dummies Yes
Number of Observations 1123
Number of Family Clusters 542
Prob > F 0.000
Correlation of Instruments with Endogenous Variable:
F-statistic 8.05
Prob > F 0.000
Over-identification Test of Instruments:
Sargan Test 0.186
Prob > Chi-square 0.666
Basmann Test 0.183
Prob > F 0.669
Notes: All regressions include a constant term. Standard errors correct for clustering at the household level.
***Significant at the 1% level, **significant at 5% level, and *significant at the 10% level. We use state
occupational wages for personal service providers and state unemployment rates as instruments for remittances.
36
Table 8. Two-Stage Linear Probability Models of School Attendance by Various Children Characteristics Using Children in Non-Migrant Households
Panel A:
Second-Stage Results (School Attendance)
Primary School age Secondary School age
Coefficient S.E. Coefficient S.E.
Household Receives Remittances -2.256 3.782 0.293*** 0.119
Number of Observations 430 553
Number of Family Clusters 293 323
Prob > F 0.000 0.000
Chow Test of Equality of Coefficients F(1, 466) = 6.87 with Prob > F = 0.009
Panel B:
Second-Stage Results (School Attendance)
Boys Girls
Coefficient S.E. Coefficient S.E.
Household Receives Remittances 0.224 0.175 0.301* 0.211
Number of Observations 489 494
Number of Family Clusters 330 328
Prob > F 0.000 0.000
Chow Test of Equality of Coefficients F(1, 466) = 0.15 with Prob > F = 0.699
Panel C:
Second-Stage Results (School Attendance)
Firstborns Higher Birth Order Kids
Coefficient S.E. Coefficient S.E.
Household Receives Remittances 0.106 0.129 0.532*** 0.139
Number of Observations 454 529
Number of Family Clusters 446 307
Prob > F 0.000 0.000
Chow Test of Equality of Coefficients F(1, 466) = 11.15 with Prob > F = 0.001
Notes: All regressions include a constant term. Standard errors correct for clustering at the household level. *** Significant at the 1% level and *significant
at 10% level. Instruments are: 1) unemployment rates in states from which remittances are likely to originate and 2) yearly real earnings for service
employees in states from which remittances are likely to originate. Originating states were determined by state location of family members who had migrated
in the past.
37
1 See Durand and Massey (1992) for a review of studies suggesting that remittances are used in
“non-productive” ways and Caceras (2008) for a more recent study arguing likewise for El
Salvador.
2 As we shall note in what follows, the U.S. is, by far, the main destination of Dominican
emigrants.
3 This conclusion is consistent with the claim by the OECD (2010) that about 50 percent of the
Dominican-origin population in the U.S. has completed secondary school and with the
observation that educational attainment of Dominicans in the U.S. exceeds, on average, that of
Mexican-origin immigrants in the U.S.
4 They find, however, that remittances do increase educational attainment in the case of the other
Latin American nations in their study.
5 Their study uses past literacy rates and political unrest indicators as instruments for remittances
and absenteeism. While the two instruments are likely to be related to the variables being
instrumented, they are also correlated to children’s educational attainment. Furthermore, to the
extent that both instruments contribute to absenteeism and family remittances, it is not feasible to
separate the two competing impacts.
6 The Latin American Migration Project (LAMP) is a collaborative research project based at
Princeton University and the University of Guadalajara, supported by the National Institute of
Child Health and Human Development (NICHD). The LAMP website is:
http://lamp.opr.princeton.edu/.
38
7 Information on whether any of the household members (listed in Table A of the LAMP-DR7
questionnaire) currently resides in the U.S. is gathered from Table D of the LAMP-DR7
questionnaire and is available for each household member in the PERS file.
8 We only have information on the receipt of remittances by the household, but not on the
amount received.
9 We do not know who in the household receives the remittances. We only know that
remittances are received by the household.
10 We also examine how the descriptive statistics for the entire sample of children differ from
those of children in non-migrant households. For the most part, the two are quite similar, which
is not surprising given that the vast majority of children in the LAMP-DR7 reside in non-migrant
households, that is 983 children out of 1123. However we do find that there is a statistical
significant difference in the proportion of households that receive remittances (0.19 for all
children and 0.13 for children in non-migrant households) and in the number of adult family
members (3.74 for all children and 3.48 for children residing in non-migrant households).
11 Specifically, Table J3 in the LAMP-DR7 questionnaire asks households: “Does this household
currently receive any money from people in the U.S.?”
12 Specifically, respondents are asked the following question in Table J3 in the LAMP-DR7
questionnaire: “Compared to the average household income of your household, would you say
that these remittances constitute a small portion of your household income, a medium portion, or
a substantial portion?”
13 The case can be made that some of these variables are endogenous. Therefore, we have also
estimated more parsimonious specifications that exclude some of these potentially endogenous
variables. The results, available from the authors, prove to be robust to these exclusions.
39
14
Unfortunately, the survey does not allow us to decipher whether the female and male spouse
are, respectively, the mother and father of the child.
15 Kandel and Kao (2001) suggest this to be the case in Mexico. They find that children in
families with high U.S. emigration probabilities are less likely to go to school. Such a response
is logical since Mexican education (particularly at the primary and secondary level) is not likely
to be recognized and rewarded in the U.S. labor market.
16 Credit should be given to the LAMP designers for making it possible to identify both
remittance-receiving and migrant households. Many other surveys that report on both migration
and remittances ask about remittances only in households that claim migrant members. In other
words, they conclude that the migration of a family member is a pre-condition for the receipt of
remittances and design the survey questionnaire in such a way that they never obtain remittance
information from households that do not indicate having a household member currently living
abroad. The LAMP survey results demonstrate that, in many instances, households without
migrant members still receive remittances. It is reasonable to assume that these then are from
more distant family relatives or friends. In short, household migration is not a precondition for
the receipt of remittances.
17 While it may seem logical to also compare children’s school attendance in migrant households
according to their receipt of remittances, the small number of children in migrant households
impedes this exercise. As indicated in Table 1, there are only 140 children in migrant
households and, of these, ninety-three live in households that receive remittances and only 47
residing in households that do not receive remittances. These sample sizes are too small to yield
statistically meaningful results.
18 The survey does not provide us with information on household income.
40
19
The F-statistic is 10.78 and the Prob > F = 0.000. The small p-value indicates that OLS is not
consistent.
20 The assumption is that the current or past U.S. location of family and household members is
likely to be the geographical source of any remittances received by the household today.
Unemployment rates and earnings data corresponding to those locations were obtained from the
Bureau of Labor Statistics at: http://www.bls.gov/.
21 The F-statistic is larger than 10 in both instances.
22 Note that the likelihood of receiving remittances is instrumented using continuous variables,
thus changing the interpretation of its coefficient from the interpretation of a dichotomous
variable to that of a continuous one.
23 School attendance is positively correlated to the number of school-age children in our sample.
The correlation coefficient is equal to 0.2505. In contrast, school attendance is inversely related
to the number of preschool-age children in the household, for which the correlation coefficient
equals -0.0207.
24 A Chow test of the equality of the estimated coefficients for remittance-receipt using all
children and using children in non-migrant households reveals that the two are statistically
different from each other. Specifically, the F-statistic equals 5.92 and is statistically significant
at the 5 percent level.
![Untitled Document [homepages.wmich.edu]homepages.wmich.edu/~grantner/ece6050/ARM710_DDI0086B.pdf · 2003. 11. 19. · Document Status The document’s ... 10.2 Fastbus Extension 10-3](https://cdn.vdocuments.net/doc/165x107/60a7eb41bc538e1ab4479a66/untitled-document-grantnerece6050arm710ddi0086bpdf-2003-11-19-document.jpg)


