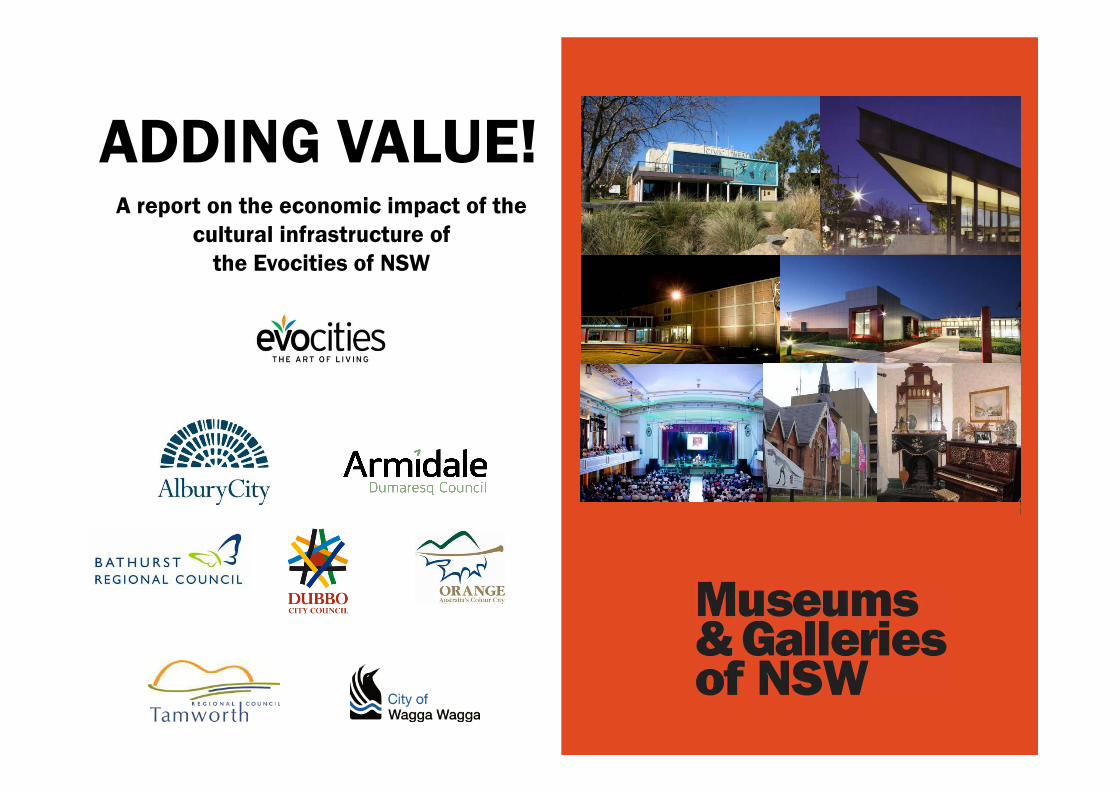
A report on the economic impact of the
cultural infrastructure of
the Evocities of NSW
ADDING VALUE!

ADDING VALUE!
Museums and Galleries of NSW (M&G NSW) would
like to acknowledge and thank the following people
and organisations for their contribution to this
project.
• The General Managers of the Evocity Councils
• The staff and managers of Evocity cultural
facilities for their generosity in sharing their
data for this project
• Danielle Ranshaw, Dr Ivan Trofimov, Rebecca
Hood and Dale Curran of Western Research
Institute
2
For M&G NSW
CEO Michael Rolfe
GM/Project Manager: Michael Huxley
Intern: Robin Fabrin-Petersen*
Report written by Michael Huxley - June 2014
*Internship Social Research Program – Macquarie University
Front cover L-R Wagga Wagga Civic Theatre, Albury LibraryMuseusm, Orange
Regional Gallery, Western Plains Cultural Centre, Tamworth Town Hall, Australian
Fossil and Mineral Museum & Armidale Folk Museum
Dubbo Images: Mark James Photography
All images used by permission
ACKNOWLEDGEMENTS

ADDING VALUE!
Introduction and Background……………………………………………………………....... 4Introduction 4
Research partners 5
Background 6
Establishing the Evocities 8
Demographics of the Evocities 9
Glossary and Definitions 11
Executive summary………………………………………………………………………………... 16
Methodology…………………………………………………………………………………………. 19
Results and Charts………………………………………………………………………………... 28Limitations 29
Charts Demographics of the Evocities 34
Charts Results 43
Charts Regional Indexes 53
Conclusions and recommendations………………………………………………………… 64
Appendix ………………………………………………………………………………………………. 68Appendix I List of Cultural Facilities 69
Appendix II Input-Output analysis methodology 78
Appendix III ANZSIC Sector list 82
Appendix IV Comparisons to the creative industries 83
Appendix V Non-economic benefits 85
Appendix VI School visitation 89
3
CONTENTS
ADDING VALUE!
• This study examines the economic impact of cultural facilities operated by the Evocities of NSW. The
Evocities are a partnership between Albury City Council, Armidale Dumaresq Council, Bathurst
Regional Council, Dubbo City Council, Orange City Council, Tamworth Regional Council and Wagga
Wagga City Council.
• The facilities under examination in this study include museums, galleries, theatres, multi-purpose
facilities and entertainment centres. The study draws on financial information for the year ending June
2013 only. The impact of libraries is excluded from this report. Information on the impact of local
libraries can be found in Enriching Communities: The Value of Public Libraries in New South Wales.
• Specifically this report examines the economic impact of the operations of the facilities, capital
expenditure related to the facilities, induced expenditure of non-local (tourist) visitation and the return
on investment for the facilities. It also examines the impact of employment and volunteering at the
facilities, on the local and regional economies.
• This report presents the economic impact generated by all Evocity cultural facilities as a combined
total. It also includes socio-demographic information on each of the Local Government Areas (LGAs) as
well as regional indexes of the Evocities. Data has been sourced from the Australian Bureau of
Statistic, Tourism Research Australia and information provided by the 26 cultural faculties
• It uses modelling prepared by Western Research Institute (WRI) that was commissioned by Museums
& Galleries of NSW (M&G NSW) in consultation with, and on behalf of, the Evocities.
• This report uses economic terms to explain the effect and impact of expenditure and income for the
26 cultural facilities located in the Evocities. A glossary of terms can be found on pages 11-15.
Introduction
4
INTRODUCTION & BACKGROUND

ADDING VALUE!
• Established in 1998, Museums & Galleries of NSW (M&G NSW) is the lead support organisation for
the small to medium museum and gallery sector in NSW. M&G NSW receives core funding from the
NSW government through Arts NSW and the Federal government though the Australia Council for the
Arts. It partners with Local government for the delivery of a number of funded programs to support the
museum and gallery sector and it has five areas of operation. They are: coordination of exhibition
touring, the management of devolving monies on behalf of the NSW government, professional and
skills development for those who are employed or volunteer in the sector, organisational development
and research. Recent research projects include: Census and Survey of the Museum and Gallery Sector
of NSW (2013); Guess Who’s Going to the Gallery? - A strategic audience evaluation benchmark study
– Queensland State Report (2013); Guess Who’s Going to the Gallery? - A strategic audience
evaluation benchmark study – NSW State Report (2011); Audience Evaluation for the Biennale of
Sydney (2008, 20010 , 2012) and Value Added! – Economic and social impact of the cultural
facilities in Bathurst, Dubbo and Orange (2009).
• Western Research Institute (WRI) is a regional development research organisation located in Bathurst,
New South Wales. WRI holds a wealth of knowledge on employment, business development and
investment issues affecting regional Australia. It has worked with Commonwealth, State and Local
governments and industry groups on numerous investment and development programs in regional
areas. WRI has strong credentials in business and commercial market consulting and applied
economic modelling, including input-output analysis, shift-share, agribusiness and regional socio-
economic surveys and analysis.
The research partners
5
INTRODUCTION & BACKGROUND
ADDING VALUE!
• In 2008, Bathurst Regional Council, Dubbo City Council and Orange City Council commissioned M&G
NSW to investigate the economic and social impact of their museums, galleries and theatres. After a
tender process, M&G NSW partnered with Western Research Institute to create various models and
research instruments to measure this impact.
• The resulting report was titled Value Added! – The economic and social impact of cultural
infrastructure in Central Western NSW and was launched in 2009. This study showed the positive
impact of the cultural facilities (and their related activities) in economic, employment and social terms
for the Local Government Area and across the Central West Region. Its key findings included: the
creation of an additional 8.5 positions across the Central West region for every 10 full-time (FTE)
positions within the facilities; a strong engagement with the local community through volunteering; the
contribution of $14 million to the local regional economy; a “willingness to pay” of over $1.1 million to
maintain current facilities and services as well as a positive contribution to the social capital of the
region by helping residents develop connections to community, “sense of place” and the ability to
think differently about their communities.
• In 2010 Bathurst Regional Council, Dubbo City Council and Orange City Council partnered with Albury
City Council, Armidale Dumaresq Council, Tamworth Regional Council and Wagga Wagga City Council
to form the Evocities to “encourage people to live, work and invest” 1 outside the Sydney Metropolitan
area.
Background
6
1 Evocities website - http://evocities.com.au/about-evocities/
INTRODUCTION & BACKGROUND
ADDING VALUE!
• In 2013, the Evocities commissioned Museums & Galleries of NSW (M&G NSW) to undertake a new
study to examine the economic impact of their cultural facilities and related activities to build on the
results and methodology of the 2009 Value Added! study.
• Partnering again with Western Research Institute, M&G NSW consulted on methodology and modelling
to measure the economic impact of the operations of the facilities, the economic impact of capital
expenditure related to the facilities, the economic impact of non-local (tourist) visitation and the return
on investment for the facilities.
• The scope of this study was limited to economic impacts and does not take into account any of the
social or artistic benefit that is derived from facility operations and their extensive public programs.
7
INTRODUCTION & BACKGROUND Background (continued)

ADDING VALUE!
• Established with Local, State and Federal government & the private sector funding, the Evocity label
was applied to seven major regional cities that were identified as having “Energy, Vision and
Opportunity”2 . Each regional centre was selected for the quality of its infrastructure (including health
services and internet), business growth, educational facilities, positive population growth, accessible
housing and lifestyle amenities, including cultural and sporting facilities.
• Designed to encourage Sydney metropolitan residents to relocate to major regional centres, Albury
City Council, Armidale Dumaresq Council, Bathurst Regional Council, Dubbo City Council, Orange City
Council, Tamworth Regional Council and Wagga Wagga City Council launched the program in 2010.
• It was promoted not as a “sea-change” or “tree-change” but as a move to a vibrant regional city that
offered many benefits and facilities found in the metropolitan area without the “hassle and stress of
metropolitan” living. These regional centres offer a strong work/life balance and benefits such as a
lower cost of housing and living, strong career and business opportunities and enhanced lifestyle. As
an incentive, a $7,000 relocation grant3 was offered by the NSW Government.
• Since its launch nearly 1,300 households have relocated from Sydney to one of the Evocities. Benefits
were not only received by those who moved, but also by the cities themselves with a direct boost to the
local economy estimated at almost $95,000 per household.4
• In 2013 the NSW Government launched an additional grant program, the Skilled Regional Relocation
Incentive5 to further encourage relocation of skilled workers to Regional NSW.
Establishing the Evocities
2) Evocities website - http://evocities.com.au/about-evocities/
3) Office of State Revenue website http://www.osr.nsw.gov.au/grants/rrg/hrb
4) Evocities Media Release October 2013 http://www.evocities.com.au/footer/evocities-media-releases/
5) Office of State Revenue website http://www.osr.nsw.gov.au/grants/rrg/srri
8
INTRODUCTION & BACKGROUND
ADDING VALUE!
• The Evocities have similar profiles across a number of key demographics. Further details of these are
shown graphically in the charts section of this report (pages 34-42).
• According to Australian Bureau of Statistics (ABS) Community Profiles, using data from the 2011
Census from each Local Government Area (LGA), there were 239,654 people aged 15+ years living in
the Evocities. The population ranged from a low of 19, 508 in the Armidale Dumaresq LGA, to 46,885
in the Wagga Wagga LGA. The average population for the Evocities was 34,236, with the median
population of people aged 15+ years being 33,319.
• The percentage of males aged 15+ years ranges from 47% in the Armidale LGA and the Dubbo LGA to
50% in the Bathurst LGA. The male population aged 15+ in the other centres is 48%, the same rate as
for Regional NSW.
• The reported annual median household income (inflated to 2013 values) ranges from $51,609 in the
Tamworth LGA to $62,545 in the Orange LGA. The average median household income for the Evocities
is $57,889 per annum. This compares to $51,771 for Regional NSW.
• There are similar levels of post high school education across the Evocities. Certificate level training,
ranging from 37% in the Armidale Dumaresq LGA to 63% in the Bathurst LGA, is the most commonly
cited post high school qualification. This compares with a Regional NSW rate of 53%. Post-graduate
degrees range from 14% in the Armidale Dumaresq LGA to 3% in the Dubbo and Tamworth LGAs with
the Regional NSW rate being 5%.
Demographics of the Evocities
9Source: ABS 2011 Census Data (All valid responses)
INTRODUCTION & BACKGROUND
ADDING VALUE!
• There were similar levels of volunteering in sport, health, arts and culture reported across the
Evocities ranging from 19% in the Orange LGA to 27% in the Armidale Dumaresq LGA. This compares
with a participation rate of 20% for Regional NSW.
• The Evocities have similar areas of employment with Health (14%), Retail (12%), Education (11%),
Manufacturing (9%) and Public Administration (8%) accounting for over half of the reported
employment sectors. Employment within Arts and Recreation is approximately 1% of the workforce. Nb this is all arts and recreational workers not just those who are employed in the council operated facilities.
• In the 2011 Census, NSW Regional levels of Language Other than English spoken at home (LOTE) was
5.3%. Identification as an Aboriginal and Torres Strait Islander was 4.6%. Both of these indicators are
used as indicators of diversity within the population. Within the Evocities, LOTE ranges from 2% in the
Tamworth LGA to 6.5% in the Armidale LGA. Those who identify as part of the Aboriginal and Torres
Strait Islander communities in the Evocities range from 1.7% in the Albury LGA to 10.1% in the Dubbo
LGA.
Demographics of Evocities (continued)
10Source: ABS 2011 Census Data (All valid responses)
INTRODUCTION & BACKGROUND
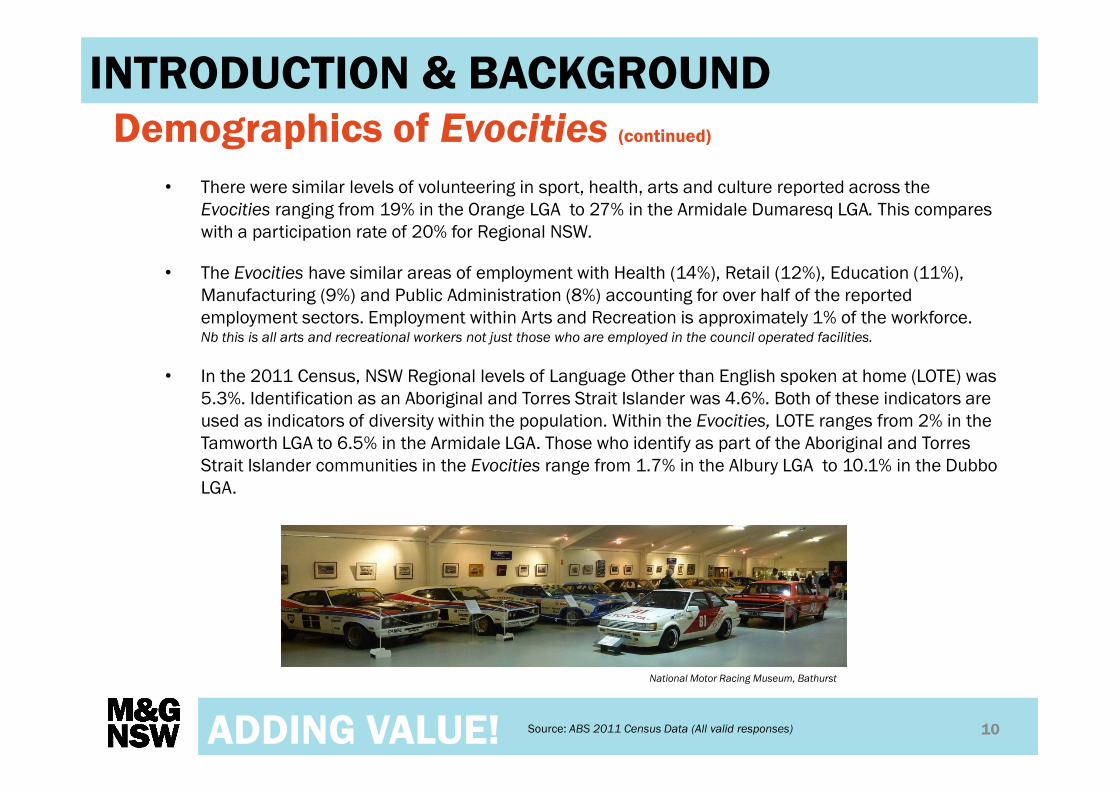
National Motor Racing Museum, Bathurst

ADDING VALUE!
• Capital Expenditure is the purchases of durable investment goods such as dwellings, plant and
equipment.
• Compensation of Employees (COE) is equal to the wages and salaries of employees plus on-costs
(e.g. superannuation and payroll tax). Compensation of Employees is the basis of the Household
Income multiplier.
• Employment is measured as full-time equivalent (FTE) jobs. FTE employment = Number of full time
employees + Number of part time employees x (Hours worked by each part time employee per annum
/ Hours worked by a typical full time employee per annum) + Number of casual employees x (Hours
worked by each casual employee per annum / Hours worked by a typical full time employee per
annum). It was assumed that a typical full time employee works 1,680 hours per annum, based on 35
hour working week and 48 working weeks per annum (taking into account mandatory annual leave of
4 weeks).
• Economic Impact is the effect of economic activity in a specified region, caused by a specific
business, organisation, policy, program, project, activity, or other economic event.
• Final consumption expenditure includes the current expenditure of households, industry and
government. It includes purchases of durable and non-durable commodities, except the purchase of
dwellings and equipment that are capital in nature. There are two types of final consumption: private
final consumption expenditure (PFCE) and government final consumption expenditure (GFCE).
• Final demand is the demand for goods and services not used up during the production process. Final
demand is the sum of household and government consumption expenditure, capital investment,
exports and increases in inventories.
Glossary and definitions
11
INTRODUCTION & BACKGROUND

ADDING VALUE!
• Flow-on FTE represents employment generated in other sectors (i.e. sectors excluding ‘Evocities
cultural facilities sector’) as a result of the functioning of the Evocity’s cultural facilities. In economies,
where sectors are linked, if cultural facilities purchase goods, provide services and employ people, this
will impact on other sectors, spur economic activity therein generating additional employment in these
other sectors (flow-on employment).
• Flow-on impacts is the value of changes in the regional economy in the course of an additional round
of spending after the initial impact occurred.
• Full-time equivalent employment (FTE) is a measure of the workload of an employed person in a
given location that makes workloads comparable across different types of employment (part-time, full-
time and casual).
• Gross Operating Surplus (GOS) is the excess of gross output over the costs of production, before
deducting depreciation, interest and company taxes.
• Imports are goods and services purchased from non-local suppliers and may include: competing
imports, where there is a domestically produced substitute; and complementary imports, where there
is no domestically produced substitute. Note that non-local suppliers are defined as consumers, firms
and governments from outside a given area. To illustrate the difference, the purchase of goods from
Sydney by a Bathurst business is an import with respect to the Bathurst LGA input-output table, but is
not classified as an import in the New South Wales input-output table.
• Input-output models rely on inter-industry data to determine how activities in one industry will impact
other sectors. In addition, I/O models can be used to estimate the share of each industry's purchases
that are supplied by local firms
Glossary and definitions (continued)
12
INTRODUCTION & BACKGROUND
ADDING VALUE!
• Initial impacts are the value of the immediate changes in the respective regional economies as a
result of the operations and capital expenditure of cultural facilities in each Evocity region.
• Initial impacts – FTE employment correspond to the number of full, part-time and casual workers
employed by cultural facilities in Evocities and any additional employment arising from the first round
of expenditure in the economy through capital expenditures and visitor expenditures.
• Initial impacts - Household Income include wages and salaries, loadings, long service leave and
workers compensation paid by facilities in a given Evocity to their employees. The figure excludes
superannuation as it is not immediately available to the employee.
• Initial impacts – Output correspond to the total income of the combined facilities in a given Evocity.
Income is the value of goods sold and services provided by the cultural facilities.
• Initial impacts – Value Added is equal to the total income minus the value of purchases made by
cultural facilities (both locally and outside the Evocity).
• Household Income measures the benefit received by regional households from economic activity. It
typically refers to compensation of employees, but can also include income in return for productive
activity such as: the gross mixed income of unincorporated enterprises; gross operating surplus on
dwellings owned by persons; and property income and transfers receivable such as, social assistance
benefits and non-life insurance claims.
13
INTRODUCTION & BACKGROUND Glossary and definitions (continued)

ADDING VALUE!
• Intermediate Inputs are goods or services that are used in the production process.
• Median is the point on a scale where by half of the responses are above, and half are below, this
point.
• Median household income is derived from occupied private dwellings and is drawn from the ABS
Community Profiles of the LGAs created from 2011 Census data. It excludes households where at
least one member aged 15+ did not state an income as well as households where at least one
member aged 15+ was temporarily absent on Census Night. It also excludes ‘visitors only' and ‘other
non-classifiable' households.
• Multiplier indicates the relative magnitude of the flow-on effects of events compared to the direct
effect of the events. It is a summary measure used for estimating the economic impact on an
economy caused by a change in the demand for the output of a particular industry or group of
industries The multipliers in this report are for Output, Value Added, Household Income and
Employment.
• Output is the value of goods /services at the final stage of production, i.e. when they are ready for
sale. It may also be seen as being equal to total sales (i.e. quantity sold multiplied by price per unit).
• Primary Inputs are inputs into the production process that are not goods or services. Examples of
primary inputs include compensation of employees, gross operating surplus, imports and indirect
taxes on products and production.
14
INTRODUCTION & BACKGROUND Glossary and definitions (continued)
ADDING VALUE!
• Regional NSW is the area outside the Greater Sydney metropolitan area and includes the Newcastle
and Illawarra Regions. The Greater Sydney metropolitan area includes Metropolitan Sydney,
Parramatta, Central Coast, the Blue Mountains and Campbelltown areas.
• Value Added is the amount by which the value of an article is increased at each step of the production
exclusive of its initial costs. By initial costs we mean costs of intermediate inputs, i.e. inputs used in
the production process. That is, labour costs (wages, salaries etc) are not included in initial costs. It
may also be defined simply as the value of output minus intermediate costs. If we conceptualise a
cultural facility as a production unit, the Value Added by the cultural facility will be the value of
services provided by the facility (output) minus the costs of purchases used to deliver these services
(intermediate inputs), but not labour costs. In a national accounts context, Gross Domestic Product
(GDP) consists of the sum of Value Added by all industries. Value Added also pertains to differences
between the value of production at various stages of the supply chain.
Value Added Example: Baked Goods
• For example, if the initial cost of the ingredients of a loaf of bread is $2 and the sale price of the
baked bread is $4, the Value Added by the bread maker is $2.
• If packaging is the next stage of the production chain, and the sale price of the packed bread is $5,
the Value Added by packaging is $1 (i.e. $5 minus $4).
• Further on, if the price of the bread in a grocery store is $6, the Value Added at a retail level is $1
(i.e. $6 minus $5).
• The total Value Added across three stages of the production chain for the one loaf of bread is
therefore $4 (i.e. $2 plus $1 plus $1).
15
INTRODUCTION & BACKGROUND Glossary and definitions (continued)
ADDING VALUE!
EXECUTIVE
SUMMARY
A report on the economic impact of the
cultural infrastructure of
the Evocities of NSW
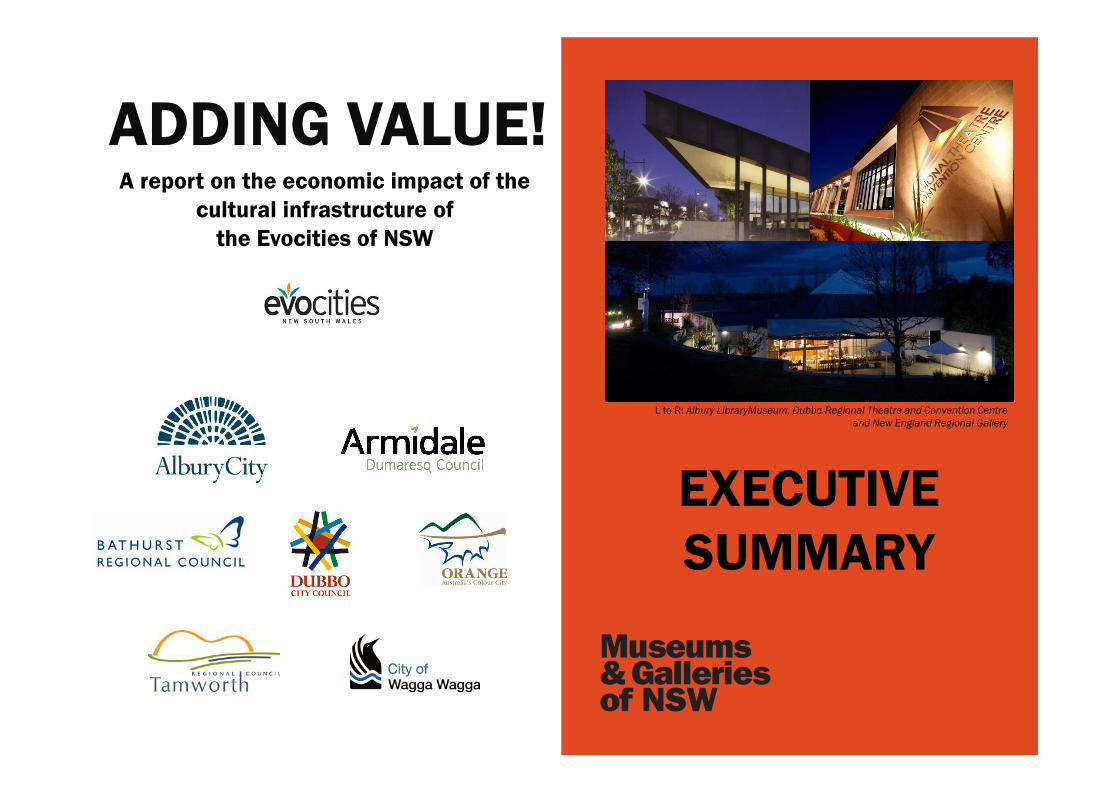
L to R: Albury LibraryMuseum, Dubbo Regional Theatre and Convention Centre
and New England Regional Gallery
ADDING VALUE!
• The Evocity concept is a coalition of Albury City Council, Armidale Dumaresq Council, Bathurst
Regional Council, Dubbo City Council, Orange City Council, Tamworth Regional Council and Wagga
Wagga City Council.
• The 26 facilities under examination include museums, galleries, theatres, multi-purpose facilities and
entertainment centres. This study draws on financial information provided by the facitlities for the year
ending June 2013 and does not include the data or impact of libraries.
• It is acknowledged that the facilities and their related activities generate a number of social benefits
such as community cohesion, sense of identity, health and improved educational outcomes.
Quantifying these benefits was beyond the scope of this study. However, data and findings from
external sources is presented as part of the Appendix of this report.
• This report provides the combined results of the seven Evocities as well as indicative indexes derived
from grouping of Evocities into three regions.
• The study found that:
• once the flow effects are taken into consideration the facilities provide a positive return on
investment from Local, State and Federal government funding.
• There is a positive economic impact on the local and regional economies from the operations of
the facilities, capital expenditure related to the facilities, and non-local (tourist) visitation in the
financial year ending June 2013.
• There is a positive impact on employment and volunteering at the facilities on the local and
regional economies
17
EXECUTIVE SUMMARY

ADDING VALUE!
• When flow on effects are taken into account, the 26 cultural facilities of the Evocities generate:
• An additional $23.84 million from an initial impact of $37.96 million dollars to create a total of
$61.81 million in goods and services at the last stage of production where they are ready for
consumption. This total derived from operations ($41.44 million), capital expenditure ($2.43
million) and the impact of tourist visitation ($17.93 million).
• An additional $10.76 million from an initial impact of $21.59 million to create a $32.35 million in
net value that is added to the regional gross economies. This is derived from operations ($24.37
million), capital expenditure ($820,000) and the impact of tourist visitation ($7.16 million). This
represents 0.24% of the combined Evocities’ gross regional product.
• An additional $4.86 million dollars from an initial impact of $10.54 million to create $15.40
million in income to households across the Evocities regions. This is derived from operations
($11.35 million) capital expenditure($420,000) and the impact of tourist visitation ($3.62 million).
This represents 0.24% of regional household income of the combined Evocities
• An additional 8.5 full time equivalent positions for every 10 fulltime equivalent positions. This
results in a total of 293 full time equivalent jobs which represents 0.27% of the total full time
equivalent employment for the seven Evocities. This is derived from economic impact of operations
(210 FTE), capital expenditure (7 FTE) and the impact of tourist visitation (76 FTE).
• An average return on investment by Local, State and Federal government of 69%.
• Over 500 volunteers were engaged across the 26 facilities providing a combined contribution of
almost 25,000 working hours conservatively valued at over $500,000.
18
EXECUTIVE SUMMARY
METHODOLOGY
ADDING VALUE!A report on the economic impact of the
cultural infrastructure of
the Evocities of NSW
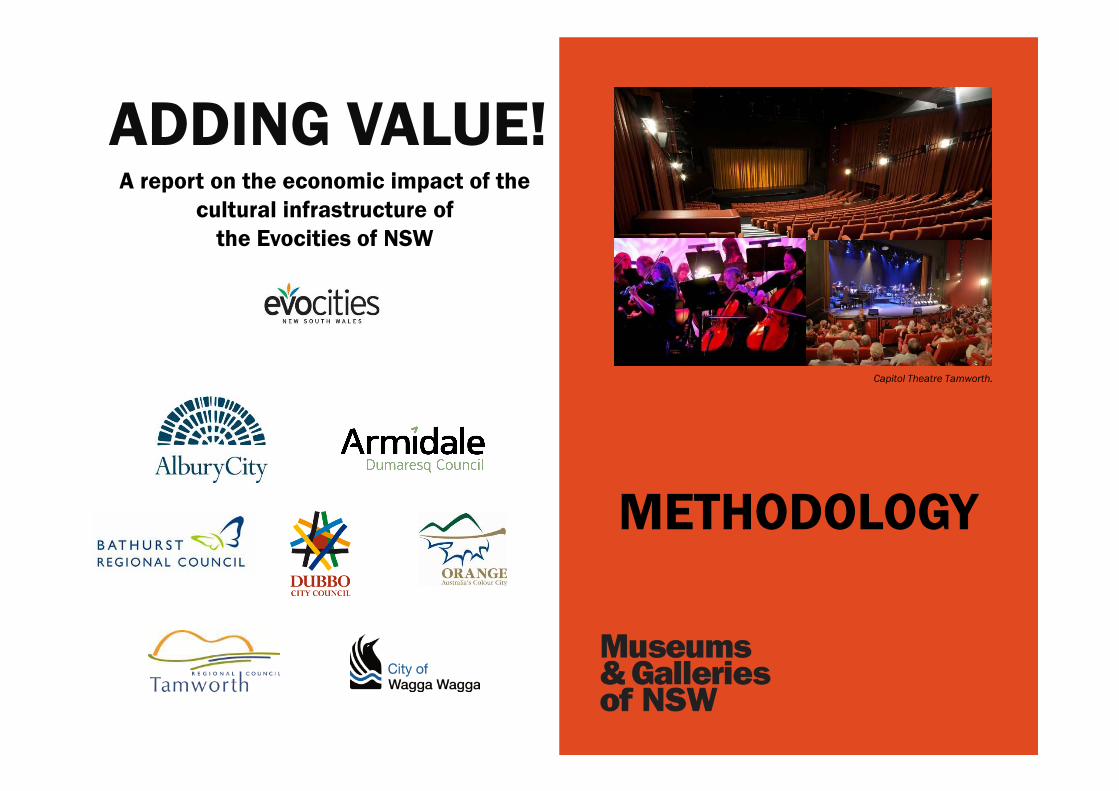
Capitol Theatre Tamworth.

ADDING VALUE!
• M&G NSW commissioned Western Research Institute to undertake an input-output analysis to
determine the economic impact of operational, capital and induced tourist expenditure of the cultural
facilities in the seven Evocities.
• Input-output analysis provides a detailed picture of the structure of a regional economy at a point in
time and can be used to estimate the contribution or impact of a particular sector of the economy
including flow-on effects.
• A survey instrument was created to capture income, expenditure, visitation and employment data
from each of the facilities. The facilities were asked to identify whether income, service providers and
visitors were from within the local government areas (LGA) or non-local i.e. outside the LGA.
• As far as possible the information collected was analysed and cross checked to minimise the
possibility of double counting. This information was used to construct a new sector row and column in
the input-output table representing the aggregate operations of the cultural facilities in each LGA.
Gathering the data
20
METHODOLOGY

ADDING VALUE!
• Several cultural facilities provided information related to the acquisition of artworks and artefacts
(paintings, books and other artefacts). These acquisitions, valued at over $900,000 across the 26
facilities, were not considered as capital expenditure as:
• The value of the artwork / artefact is not typically realised as the cultural facilities acquire them
for their collections rather than for resale (i.e. they are not treated as investment or stock
assets).
• Whilst collections are important in attracting visitors to the facilities and their value (material,
aesthetic or other) may appreciate over time, these assets themselves do not directly generate
any direct income for the facility in the way capital equipment, machine tools etc may
Hence artworks and artefacts are considered as “other assets” rather than capital expenditure and
were therefore not modelled as capital expenditure.
21
Gathering the data (continued)
METHODOLOGY
L to R: Interior Orange Regional Theatre, exhibition view Orange Regional Gallery and exterior Orange Regional Gallery.

ADDING VALUE!
Generation of Regional Input-output Tables (GRIT)
• Input-output tables were extracted from the Australian Bureau of Statistics (ABS) 2011-12 national
input-output table using the Generation of Regional Input-Output Tables (GRIT) technique. Further
detail can be found in Appendix II of this report on GRIT. The GRIT technique derives regional input-
output tables from the national input-output table using location quotients and superior data (in this
case, information regarding the operations of each of the cultural facilities in the respective Evocities
as well as regional employment and income data) at various stages in the construction of the tables.
The national table was adjusted to represent New South Wales and subsequently the respective
Evocity LGAs using detailed data from:
• 2011 Census;
• 2011-12 National State Accounts for New South Wales (ABS Cat No 5220.0);
• Australian Demographic Statistics (ABS Cat No 3101.0);
• Quarterly data on employment by industry sector (ABS cat. no. 6291.0.55.003); and
• Australian Industry data (ABS Cat No 8155.0).
• These tables were then inflated to 2012/13 values.
• Further information on input–output analysis can be found in Appendix II on page 78-81 of this report
22
Input-Output tables
METHODOLOGY
ADDING VALUE!
• The facilities categorised the number of visitors during the 2012/13 financial year by origin, be it
local, from neighbouring LGAs, from elsewhere in Australia or overseas. Information relating to induced
tourist expenditure (total tourist expenditure and average trip expenditure) in the respective Evocity
regions was derived from Tourism Research Australia regional profiles for Central NSW, New
England/North West and Riverina. Whilst newer data has since been published by Tourism Research
Australia for Local Government Areas, this study uses data for broader tourism regions for analysing
impact.
• Visitor numbers were also weighted to obtain an estimate of unique visitation using data held by M&G
NSW on cultural visitor behaviour 6 as well as examining the geographic location and closeness of
facilities in each LGA . Theatre visitation was generally considered to be more unique than gallery and
museum visitation. Where facilities were located within close walking distance their visitation was
reduced to avoid double counting.
• It should be noted that this weighting is a different method of calculation of unique visitation to that
undertaken in the 2009 study as less specific audience data was available at that time.The tourism
regions were also redefined by Tourism Research Australia (TRA) in 2010 and this change affected
international visitor survey data . As such, direct comparisons are not possible between the two
studies on visitor expenditure.
23
Visitor expenditure
6) Guess Whose Going to the Gallery ? – NSW State Report 2011
METHODOLOGY
ADDING VALUE!
• The following assumptions were also applied when calculating visitor expenditure.
• Types of visitors. It was assumed that visitors from neighbouring LGAs are to be classified as
day-trip visitors in line with the classification adopted by Tourism Research Australia. It was also
assumed that visitors from elsewhere in Australia and overseas are overnight visitors.
• Local visitors. Local visitors to the cultural facilities have been excluded from the estimation of
the economic impact. It has been conservatively assumed that any expenditure made by these
locals is expenditure switching, whereby money spent associated with attending the facility
would have been otherwise spent on another good or service in the region.7
• Induced expenditure by visitors. Only visitor expenditure which was a direct result of attendance
at one or more of the cultural facilities was included. If the visit to the LGA was primarily for
another purpose (visiting friends, family, etc), it was assumed expenditure would occur
regardless of the existence of the cultural facilities in the Evocity region and as such should not
be counted.
24
7) As argued by Getz, the local expenditure is considered as an internal transfer and is not an incremental benefit to the local economy. Getz, D. Event Tourism: Evaluating the
Impacts. In Brent Ritchie, J. R., Goeldner, C. R. Travel, Tourism and Hospitality Research: A Handbook for Managers and Researchers, 1994
Visitor expenditure (continued)
METHODOLOGY

ADDING VALUE!
Impact Analysis - Data allocation
• The expenditure data of each of the cultural facilities in the Evocities was allocated to the appropriate
sector for modelling purposes. The detailed ABS Australian and New Zealand Standard Industrial
Classification (ANZSIC) was used to find the closest approximation to the expenditure item. The
Australian National Accounts Input-Output Product Details was used to allocate the ANZSIC class to
the 2008-2009 Input-Output Industry Classification at the 111 sector level. This data was then
allocated to WRI’s 32 sector classification (refer to Appendix III on page 81).
• Updates to the supplied data were made after consultation with the respective facilities’
representatives. Changes to the data included, but were not limited to:
• changes to the sectors in which purchases were made
• changes to the location of purchases
• changes to the location of where income was received and
• changes to the type of income received.
Marginal coefficients model
• Having investigated the structure of the various regional economies, its economic integration pattern
with the rest of NSW and the data provided by managers of each cultural facility, WRI considered the
marginal coefficients model as the most appropriate method to use for estimating economic impacts.
25
Impact analysis
METHODOLOGY

ADDING VALUE!
Industry Significance
• Input-output tables are frequently used to provide estimates of the significance of a particular industry
or organisation in terms of its contribution to the economy. This is done by examining the effects of an
organisation shutting down and ceasing all economic activities. This method provides an estimate of
the level of economic activity that can be attributed to a particular organisation.
• The industry significance approach was used to model the economic impact of operational
expenditure by cultural facilities in each Evocity.
• Many of the cultural facilities reported operational expenditure (the value of purchases and
compensation of employees) which exceeded income in the 2012/13 financial year. To cover this
shortfall most of the facilities receive local government subsidies. The value of this subsidy was then
included in the modelling of economic impacts.
26
METHODOLOGYImpact analysis (continued)
ADDING VALUE!
Final Demand Impacts
• The final demand impact analysis calculates the impacts (measured by Value Added, household
income and employment) across all sectors in response to changes in industry final demands. The
final demand approach was used to model the economic impacts of capital expenditure made by
cultural facilities, as well as the economic impacts of induced expenditure by visitors to Evocity
regions.
Reporting Economic Impacts
• Modelling was undertaken for each Evocity region and then a combined economic impact of cultural
facilities in all Evocities was produced by aggregating the individual impacts.
• The economic impact of the cultural facilities in each Evocity region has been reported as a sum of:
• Initial impacts: defined as the value of the immediate changes in the respective regional
economies as a result of the operations and capital expenditure of cultural facilities in each
Evocity region. For each Evocity region the initial impacts generated by the model will differ
slightly from the financial data supplied as capital expenditure has been incorporated
• Flow-on impacts: defined as the value of changes in the regional economy in the course of an
additional round of spending after the initial impact occurred.
27
METHODOLOGYImpact analysis (continued)
RESULTS
AND CHARTS
ADDING VALUE!A report on the economic impact of the
cultural infrastructure of
the Evocities of NSW
L to R: Albury Entertainment Centre, Australian Fossil and Mineral Museum (Bathurst)
National Glass Gallery (Wagga Wagga) and Armidale Folk Museum
ADDING VALUE!
• It should be noted that this assessment of the economic impact of the cultural facilities in Evocities
has relied solely on data supplied by each facility. Secondary data sources were not considered.
• No allowance has been made for the contribution of the cultural facilities to the social and cultural
base of the regional community. Social and other intangible benefits associated with the operation of
the cultural facilities were not modelled or examined in this report.
• The economic significance of the collections of artworks held by the cultural facilities in Evocities and
their impact on the local economies has also not been examined in this study.
• Taking into account the fact that unpaid volunteers comprise a sizeable proportion of labour input to
cultural facilities in Evocities, the volunteer data has only been examined in relationship to its
contribution in unpaid (saved) wages. The economic impacts that could result from volunteer work,
however, were not modelled.
• The variations in the size of impacts reported across Evocities are a direct consequence of the
variation in the level and composition of income, expenditure and employment data supplied by the
respective cultural facilities. The variations in the size of flow-on impacts are a result of varying levels
of Gross Operating Surplus (GOS) and the size of multipliers.
Limitations
29
RESULTS & CHARTS

ADDING VALUE!
• Multipliers provide a measure of the size of flow-on impacts relative to the size of initial impacts. Some
Evocities reported a large gross operating surplus (GOS) which has resulted in lower multiplier effects
(flow-ons) within the local and NSW economies.
• With regard to the overall size of impacts across Evocities, these were affected by the expenditure
patterns of the facilities. For example, where a larger proportion of operational expenditure was in the
construction sector, a higher multiplier effect (flow on) was typically generated for a given level of
expenditure. The construction sector typically produces larger multiplier effects (flow-ons) in the
economy. The opposite holds, when a large proportion of operational expenditure was made in the
arts and recreation sector. Consequently, the impacts generated by individual Evocities were
substantially larger than for others.
Limitations (continued)
30
L to R: Western Plains Cultural Centre, Bathurst Regional Gallery and Tamworth Powerstation Museum .
RESULTS & CHARTS

ADDING VALUE!
Economic impacts of programs and operations
• When flow-on effects are taken into account, the economic impacts due to the operations of the 26
facility in the Evocities, is modelled to generate:
• $41.44 million in output
• $24.37 million in Value Added (gross regional product)
• $11.35 million in household income
• 210 full-time equivalent (FTE) jobs.
Capital Expenditure
• When flow-on effects are taken into account the combined capital expenditure made by 26 cultural
facilities in the Evocities is modelled to generate:
• $2.43 million in output
• $0.82 million in Value Added (gross regional product)
• $0.42 million in household income
• 7 full-time equivalent (FTE) jobs.
Results
31
RESULTS & CHARTS
ADDING VALUE!
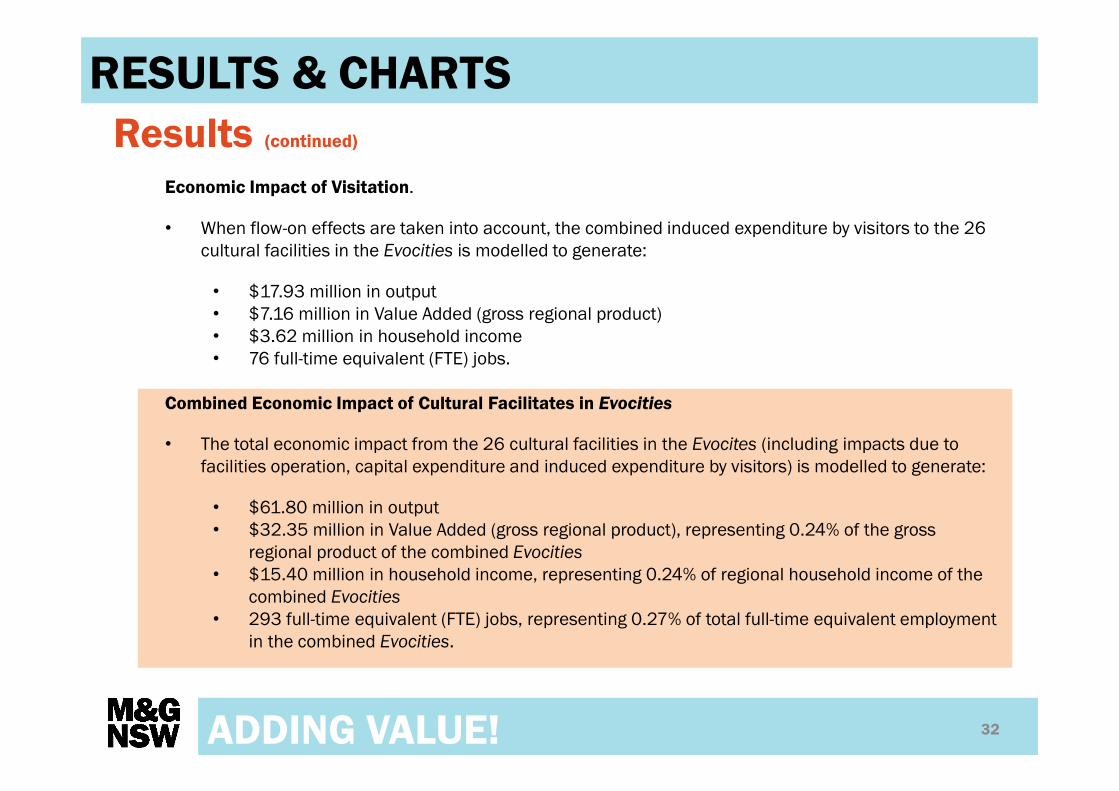
Economic Impact of Visitation.
• When flow-on effects are taken into account, the combined induced expenditure by visitors to the 26
cultural facilities in the Evocities is modelled to generate:
• $17.93 million in output
• $7.16 million in Value Added (gross regional product)
• $3.62 million in household income
• 76 full-time equivalent (FTE) jobs.
Combined Economic Impact of Cultural Facilitates in Evocities
• The total economic impact from the 26 cultural facilities in the Evocites (including impacts due to
facilities operation, capital expenditure and induced expenditure by visitors) is modelled to generate:
• $61.80 million in output
• $32.35 million in Value Added (gross regional product), representing 0.24% of the gross
regional product of the combined Evocities
• $15.40 million in household income, representing 0.24% of regional household income of the
combined Evocities
• 293 full-time equivalent (FTE) jobs, representing 0.27% of total full-time equivalent employment
in the combined Evocities.
Results (continued)
32
RESULTS & CHARTS
ADDING VALUE!
• Figures are shown as a number, percentage (%) or dollar amount ($).
• Where a percentage label is small, i.e. less than 5%, it may be omitted from the chart for ease of
reading.
• Whole number rounding error may account for when charts do not add to exactly 100% (e.g.: 101% or
99%).
• ABS data is sourced from the Community Profile for each of the Local Government Areas and is drawn
from the 2011 Census.
• All population data has been rebased to 15+ unless otherwise noted.
• Where data has been combined it is referred to as an index and as such may only be regarded as
indicative.
A note on reading charts
33
RESULTS & CHARTS

ADDING VALUE!
Total Population (15+)
34
38,511
19,508
30,519 30,096 29,635
44,50046,885
Albury Armidale Bathurst Dubbo Orange Tamworth Wagga Wagga
• Wagga Wagga LGA is the most populous Evocity with more than 46,000 people aged 15+
• Armidale Dumaresq LGA is the least populous Evocity with just under 20,000 aged 15 +
• The Evocities have a similar gender distribution ranging from 47% males in Dubbo LGA to 50% males in
Bathurst LGA which compares with the Regional NSW distribution (48%) (not shown)
DEMOGRAPHICS
Source: ABS Community Profiles from 2011 census (All valid responses)
ADDING VALUE!
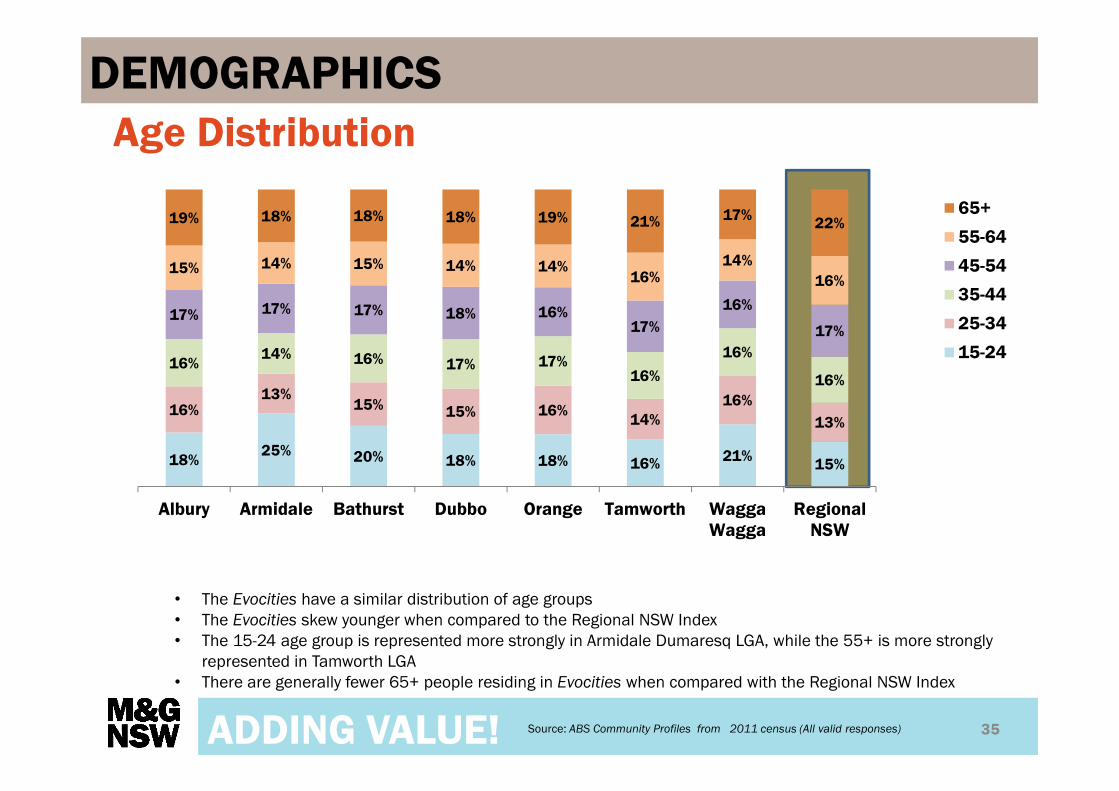
• The Evocities have a similar distribution of age groups
• The Evocities skew younger when compared to the Regional NSW Index
• The 15-24 age group is represented more strongly in Armidale Dumaresq LGA, while the 55+ is more strongly
represented in Tamworth LGA
• There are generally fewer 65+ people residing in Evocities when compared with the Regional NSW Index
Age Distribution
35
18%25% 20% 18% 18% 16%
21%15%
16%13%
15% 15% 16%14%
16%
13%
16%14% 16% 17% 17%
16%
16%
16%
17% 17% 17% 18% 16%17%
16%
17%
15% 14% 15% 14% 14%16%
14%
16%
19% 18% 18% 18% 19% 21% 17%22%
Albury Armidale Bathurst Dubbo Orange Tamworth WaggaWagga
RegionalNSW
65+
55-64
45-54
35-44
25-34
15-24
Source: ABS Community Profiles from 2011 census (All valid responses)
DEMOGRAPHICS

ADDING VALUE!
Median Household Income
36
• Evocity median household income ranges between $51,000 and $63,000
• All of the Evocities, apart from Tamworth LGA, have a higher median household income than the Regional
NSW Index
Source: ABS Community Profiles from 2011 census (All valid responses
rebased to 2013 values))
DEMOGRAPHICS
$55,219 $53,387
$61,522 $59,044
$62,545
$51,609
$61,899
$51,771
Albury Armidale Bathurst Dubbo Orange Tamworth WaggaWagga
RegionalNSW

ADDING VALUE!
• Certificate level training is the most common post high school qualification in both the Evocities and Regional
NSW
• A Batchelor degree is the second most common post high school qualification in both the Evocities and Regional
NSW
• Armidale Dumaresq LGA reports the highest level of post graduate qualifications with Bathurst LGA reporting the
highest rate of certificate level qualifications
Post High School Education
37
51%
37%
63%57%
50%57%
52% 53%
17%
15%
12%14%
17%
17%
15% 17%
24%
29%
18% 23%25%
20%25% 22%
5%14%
5% 3% 5% 3% 5% 5%
Albury Armidale Bathurst Dubbo Orange Tamworth WaggaWagga
RegionalNSW
PostgraduateDegree Level
Graduate Diplomaand GraduateCertificate Level
Bachelor DegreeLevel
Advanced Diplomaand Diploma Level
Certificate Level:
Source: ABS Community Profiles from 2011 census (All valid responses)
DEMOGRAPHICS

ADDING VALUE!
Community Diversity
38
5.3%
6.5%
3.3%3.0%
4.9%
2.0%
4.6%
5.3%
Language other than English (LOTE)
1.7%
4.9%
3.4%
10.1%
4.1%
6.4%
3.5%
4.6%
Aboriginal and Torres Strait Islander
• Language other than English Spoken at Home (LOTE) and Aboriginal Torres Strait Islanders(ATSI) are indicators
of a culturally diverse community
• The NSW State LOTE rate (including Sydney) for the whole population is 27.5% where as the Regional NSW
index for the whole popultion is 5.5%
• The percentage of the population (+15 yrs) who identify as ATSI is 2.5% where as the Regional NSW (15+)
index rate is 4.6%
Source: ABS Community Profiles from 2011 census (All valid responses)
DEMOGRAPHICS

ADDING VALUE!
• The Evocities have a similar percentage of the total population who volunteer in the community. This includes
volunteering for sport, health services, arts and culture
• Armidale Dumaresq LGA has the highest rate of volunteering at 27%, while Orange LGA has the lowest (19%.)
• This compares to the NSW Regional index average for volunteering of 20%
• The most common volunteering age group is 45-64
• The Evocities have a similar distribution of volunteering in each age group
Volunteering
39
17% 22% 19%12% 15% 13% 19%
29% 24% 26%31% 28%
26%
30%
36% 35% 37% 37% 35%38%
34%
17% 19% 18% 20% 21% 23% 17%
15-24 25-44 45-64 65+
21%
27%
20% 20% 19%
21% 21%20%
% of total population
who volunteer
Age of volunteers in
each Evocity
Source: ABS Community Profiles from 2011 census (All valid responses)
DEMOGRAPHICS
ADDING VALUE!
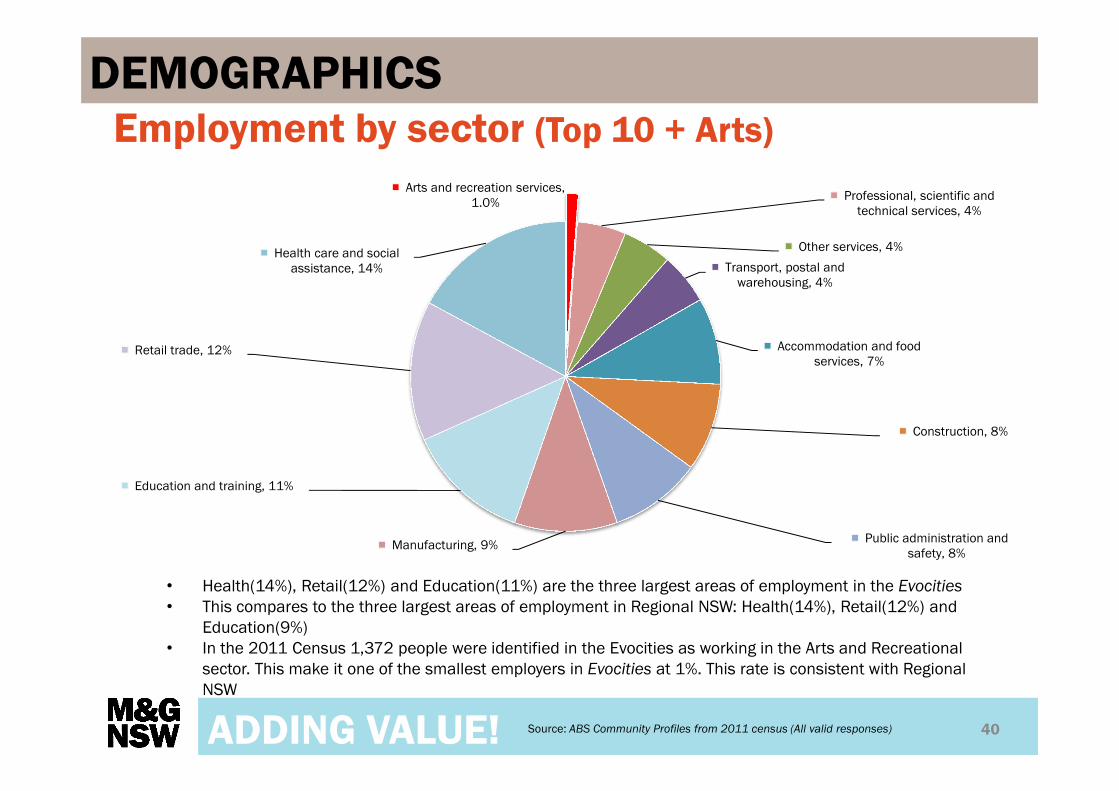
Employment by sector (Top 10 + Arts)
40
Arts and recreation services, 1.0%
Professional, scientific and technical services, 4%
Other services, 4%
Transport, postal and warehousing, 4%
Accommodation and food services, 7%
Construction, 8%
Public administration and safety, 8%
Manufacturing, 9%
Education and training, 11%
Retail trade, 12%
Health care and social assistance, 14%
• Health(14%), Retail(12%) and Education(11%) are the three largest areas of employment in the Evocities
• This compares to the three largest areas of employment in Regional NSW: Health(14%), Retail(12%) and
Education(9%)
• In the 2011 Census 1,372 people were identified in the Evocities as working in the Arts and Recreational
sector. This make it one of the smallest employers in Evocities at 1%. This rate is consistent with Regional
NSW
Source: ABS Community Profiles from 2011 census (All valid responses)
DEMOGRAPHICS

ADDING VALUE!
Domestic Tourist Visitation
41Source: National Visitor Survey, YE September 2010 to YE September 2013,
Tourism Research Australia
DEMOGRAPHICS
39%49%
32%
50%
35% 41%34%
61%51%
68%
50%
65% 59%66%
Albury Armidale Bathurst Dubbo Orange Tamworth Wagga Wagga
Overnight Daytripper
Total
Domestic
Tourist
Visitation
1,035,000 437,000 878,000 813,000 715,000 1,115,000 1,224,000
• Domestic tourist visitation is categorised as non-resident day-trippers and overnight visitors from within
Australia
• Domestic tourist visitation ranges from a per annum average of 437,000 in Armidale LGA to 1,224,000
domestic visitors in Wagga Wagga LGA
• Bathurst LGA has the lowest percentage of overnight visitors ( 32%) with Dubbo LGA having the highest
percentage of overnight visitors at 50%• Nb these visitation figures are derived from a four year average and filtered by LGA not tourism region

ADDING VALUE!
Average Domestic Visitor Spend
42
$266
$214 $229 $224
$277
$223
$266
Albury Armidale Bathurst Dubbo Orange Tamworth WaggaWagga
• All the Evocities have a spend of over $200 per domestic visitor across their stay
• Armidale LGA has the lowest spend of $214 per domestic visitor with Orange LGA having the highest spend of
$277 per domestic visitor• Nb these visitation figures are drawn from Tourism Research Australia (TRA) breakdowns per LGA and are a four year average.
This data was not available at the time the calculations undertaken by WRI on visitor impact who used the regional visitor spend
in their calculations.
Source: National Visitor Survey, YE September 2010 to YE September 2013,
Tourism Research Australia (TRA)
DEMOGRAPHICS

ADDING VALUE!
Total economic impact of facilities
43
• Combined, the cultural facilities from the seven Evocities generate a total of $61.80 million in output or goods
and services available for sale
• They also generate $32.35 million in Gross Regional Product (GRP), representing 0.24% of the GRP for the
combined Evocities
• A further $15.40 million is generated in household income. This represents 0.24% Regional Household
Income for the combined Evocities
$37.96
$21.59
$10.54
$23.84
$10.76
$4.86
Output Value Added Household income
Flow on
Intial Impact
$ million
Source: M&G NSW/WRI Evocities Economic impact report
Nb totals may vary due to rounding
RESULTS
$61.80 mill
$32.35 mill
$15.40 mill
ADDING VALUE!
Employment
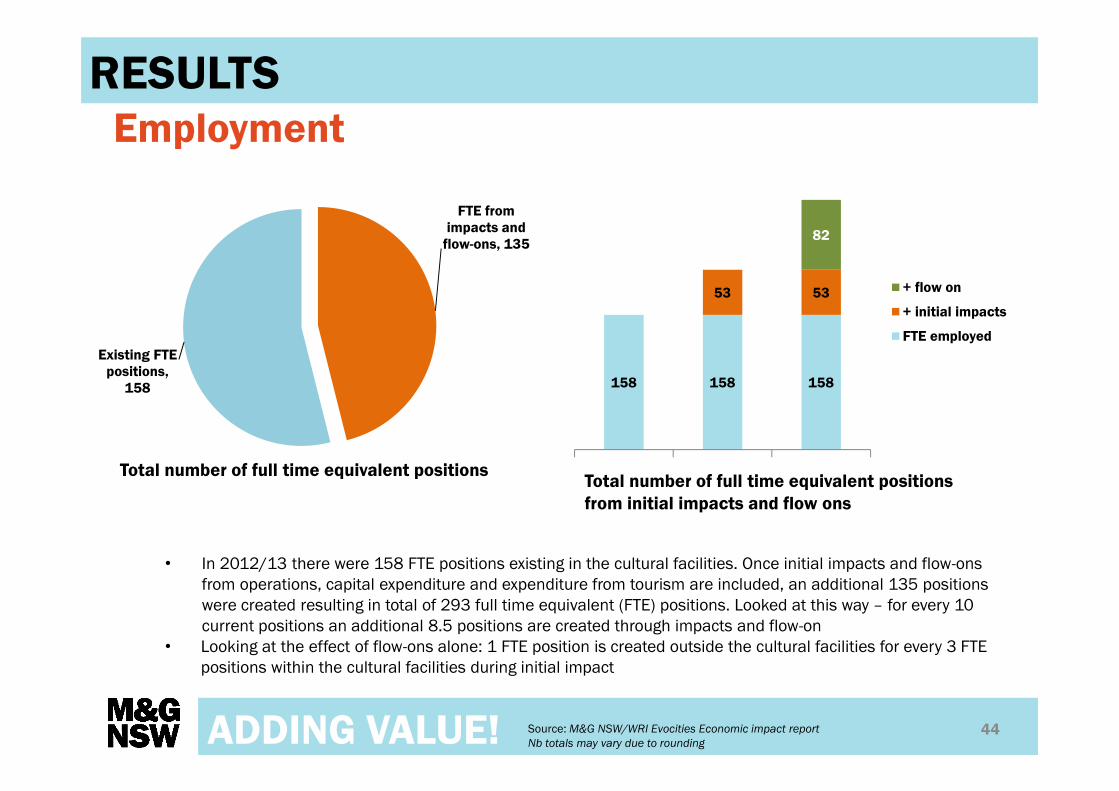
44
• In 2012/13 there were 158 FTE positions existing in the cultural facilities. Once initial impacts and flow-ons
from operations, capital expenditure and expenditure from tourism are included, an additional 135 positions
were created resulting in total of 293 full time equivalent (FTE) positions. Looked at this way – for every 10
current positions an additional 8.5 positions are created through impacts and flow-on
• Looking at the effect of flow-ons alone: 1 FTE position is created outside the cultural facilities for every 3 FTE
positions within the cultural facilities during initial impact
FTE from impacts and flow-ons, 135
Existing FTE positions, 158
Source: M&G NSW/WRI Evocities Economic impact report
Nb totals may vary due to rounding
RESULTS
Total number of full time equivalent positions
158 158 158
53 53
82
+ flow on
+ initial impacts
FTE employed
Total number of full time equivalent positions
from initial impacts and flow ons

ADDING VALUE!
Economic significance of facility operations
45
• Programs and operations of the combined facilities of the seven Evocities have an initial impact of $26.93
million dollars. From this an additional $14.50 million is generated in the combined economies totalling an
impact of $41.44 million from Output alone
• The Value Added from programs and operations of the combined facilities of the seven Evocities has an initial
impact of $17.61 million dollars. From this, an additional $6.77 million is generated in the combined
economies totalling $24.37 million.
• Household income from programs and operations of the combined facilities of the seven Evocities has an
initial impact of $8.3 million dollars. From this an additional $3.06 million is generated in the combined
economies totalling $11.35 million.
$26.93
$17.61
$8.30
$14.50
$6.77
$3.06
Output Value Added Household income
Flow on
Intial Impact
$ million
Source: M&G NSW/WRI Evocities Economic impact report
Nb totals may vary due to rounding
RESULTS
$41.44 mill
$24.37 mill
$11.35 mill

ADDING VALUE!
Impacts of capital expenditure
46
$1.17
$0.33 $0.19
$1.26
$0.49
$0.23
Output Value Added Household income
Flow on
Intial Impact
$ million
Source: M&G NSW/WRI Evocities Economic impact report
Nb totals may vary due to rounding
RESULTS
• Combined capital expenditure of Evocity cultural facilities had an initial impact of $1.17 million. From this an
additional $1.26 million was generated in the combined economies, totalling an impact of $2.43 million from
capital expenditure alone
• The Value Add from the combined capital expenditure of the facilities of the seven Evocities had an initial
impact of $330,000. This generated an additional $490,000 in the combined economies totalling $820,000
• The household income from the combined capital of Evocity cultural facilities had an initial impact of
$190,000. This generated an additional $230,000 in the combined economies totalling an impact of
$420,000 from capital expenditure
$2.43 mill
$0.82 mill
$0.42 mill

ADDING VALUE!
Impacts of tourist visitation to facilities
47
$9.86
$3.66 $2.06
$8.07
$3.50
$1.56
Output Value Added Household income
Flow on
Intial Impact
$ million
Source: M&G NSW/WRI Evocities Economic Impact Report
Nb totals may vary due to rounding
RESULTS
• Induced expenditure of tourist visitation to Evocity cultural facilities had an initial impact of $9.86 million. This
generated an additional $8.07 million in the combined economies, totalling $17.93 million from induced
tourist expenditure
• The Value Add from tourist visitation to Evocity cultural facilities had an initial impact of $3.66 million. This
generated an additional $3.5 million in the combined economies, totalling $7.16 million
• The household income from tourist visitation to Evocity cultural facilities had an initial impact of $2.06
million. This generated an additional $1.56 million dollars in the combined economies totalling $3.62 million
in household income
• Expenditure by residents within the LGAs is excluded from these calculations as it is deemed to be an internal
transfer within the same local economy (see page 24)
$17.93 mill
$7.16 mill
$3.62 mill
ADDING VALUE!
Full time employment impacts (FTE)
48
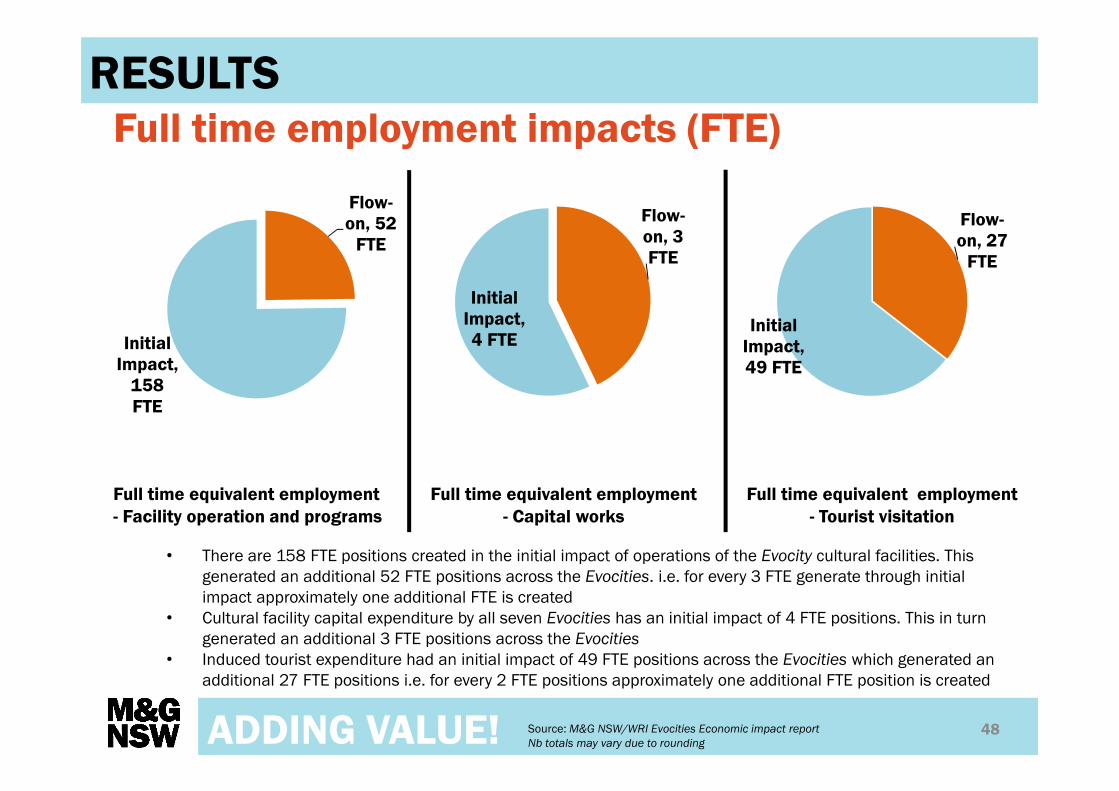
• There are 158 FTE positions created in the initial impact of operations of the Evocity cultural facilities. This
generated an additional 52 FTE positions across the Evocities. i.e. for every 3 FTE generate through initial
impact approximately one additional FTE is created
• Cultural facility capital expenditure by all seven Evocities has an initial impact of 4 FTE positions. This in turn
generated an additional 3 FTE positions across the Evocities
• Induced tourist expenditure had an initial impact of 49 FTE positions across the Evocities which generated an
additional 27 FTE positions i.e. for every 2 FTE positions approximately one additional FTE position is created
Flow-on, 52 FTE
Initial Impact, 158 FTE
Source: M&G NSW/WRI Evocities Economic impact report
Nb totals may vary due to rounding
RESULTS
Full time equivalent employment
- Facility operation and programs
Flow-on, 3 FTE
Initial Impact, 4 FTE
Full time equivalent employment
- Capital works
Flow-on, 27 FTE
Initial Impact, 49 FTE
Full time equivalent employment
- Tourist visitation

ADDING VALUE!
Volunteering
49Source: M&G NSW/WRI Evocities Economic impact report
Nb totals may vary due to rounding
RESULTS
• The combined cultural facilities reported an
involvement of 504 volunteers.
• These volunteers contributed a total of
24,901 working hours to the facilities in the
2012/2013 financial year.
• Using a “replacement cost” valuation of
$20.76/hr*, this contribution can be valued
at a contribution of over half a million
dollars ($516,945).
• The average age of volunteers varied from
35 to 70 years old across all the Evocities.
• The number of volunteers for each
individual Evocity varied from 36 to 112.
• The volunteer hours given for each
individual Evocity varied from a total of
1,072 to 6,083 hours during the 2012/13
financial year.
• This report does not take into account any
other recognised benefits from volunteering
to the community or individuals.
*) This rate is the average hourly wage of a person working in the arts and
recreation sector for the Evocities
L to R: Volunteer operating steam engine at Tamworth Powerstation Museum,
volunteer ushers at Dubbo Regional Theatre and Convention Centre (x 2)
and a volunteer guide at Tamworth Regional Gallery.
ADDING VALUE!
Return on Investment
50Source: M&G NSW/WRI Evocities Economic impact report
Nb totals may vary due to rounding
RESULTS
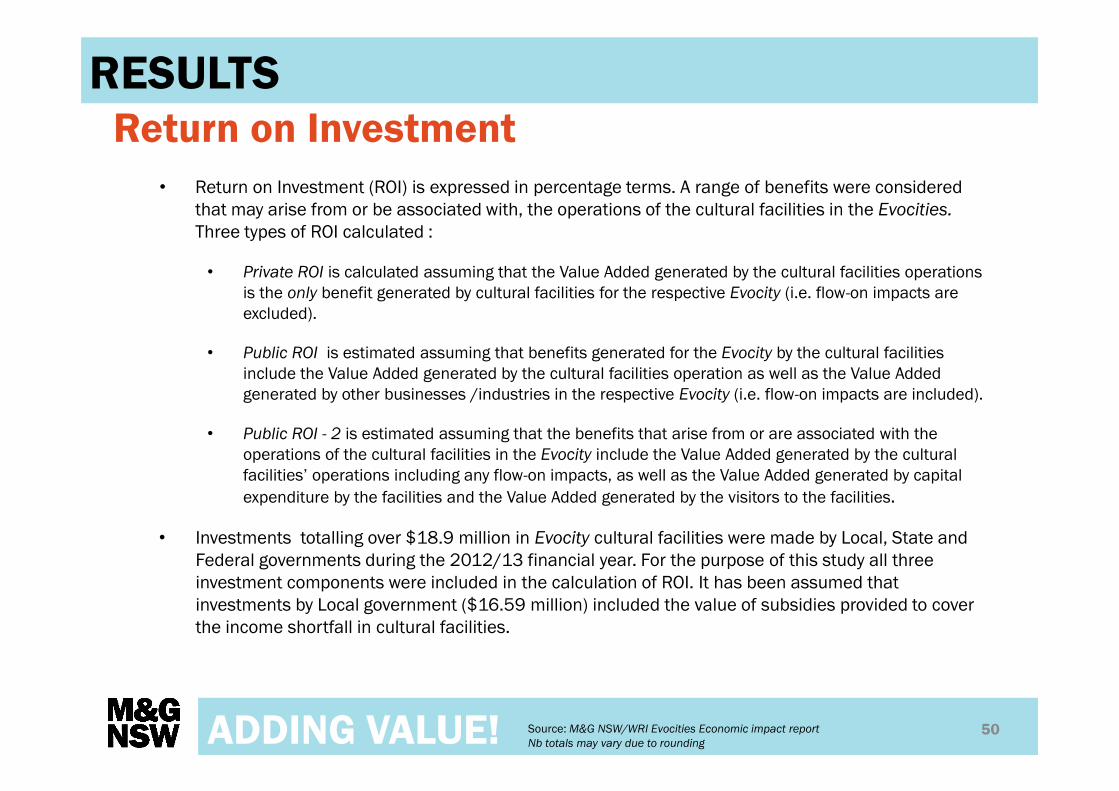
• Return on Investment (ROI) is expressed in percentage terms. A range of benefits were considered
that may arise from or be associated with, the operations of the cultural facilities in the Evocities.
Three types of ROI calculated :
• Private ROI is calculated assuming that the Value Added generated by the cultural facilities operations
is the only benefit generated by cultural facilities for the respective Evocity (i.e. flow-on impacts are
excluded).
• Public ROI is estimated assuming that benefits generated for the Evocity by the cultural facilities
include the Value Added generated by the cultural facilities operation as well as the Value Added
generated by other businesses /industries in the respective Evocity (i.e. flow-on impacts are included).
• Public ROI - 2 is estimated assuming that the benefits that arise from or are associated with the
operations of the cultural facilities in the Evocity include the Value Added generated by the cultural
facilities’ operations including any flow-on impacts, as well as the Value Added generated by capital
expenditure by the facilities and the Value Added generated by the visitors to the facilities.
• Investments totalling over $18.9 million in Evocity cultural facilities were made by Local, State and
Federal governments during the 2012/13 financial year. For the purpose of this study all three
investment components were included in the calculation of ROI. It has been assumed that
investments by Local government ($16.59 million) included the value of subsidies provided to cover
the income shortfall in cultural facilities.

ADDING VALUE!
Return on Investment
51Source: M&G NSW/WRI Evocities Economic impact report
Nb totals may vary due to rounding
RESULTS
• By considering the Value Added (GDP) generated by the cultural facilities, as well as by other influences
in the regional economy, these figures estimate both private and public returns on investment.
• The method of calculating ROI adopted in this report differs from the standard method of calculation in
three respects:
• The standard method examines the benefits (tangible and intangible) generated by investment into
cultural facilities on an individual basis, based on a facility’s financial accounts and secondary sources.
The scope of the analysis in this report precludes this approach and instead the Value Added obtained
from the input-output model is used as a proxy for benefits. The standard method considers the benefits
accruing from the initial investment over a number of years
• In contrast, the input-output framework used in this report calculates Value Added (the proxy for benefits)
only for one year, rather than for a number of years. In other words, the temporal dimension is removed
from the analysis
• The standard method adopts an appropriate
discount factor and converts future benefits
to the present value to take into account the
time value of money. As this study’s ROI is
based on one year only, the conversion to
present value is not performed.
ROI
Net Profit of
facilities divided
by local state
and federal
government
investment
%
Public ROI
Including the
Value Added
generated by
operations and
other business
Public ROI - 2
From operations
and flow on
impacts, capital
expenditure and
the Value Added
generated by
tourists
-7.7% 27% 69%
ADDING VALUE!
• The indexes were created by combining the results from the facilities of the Evocities in each
geographic area. These combined totals were then divided by the number of Evocities in each region
thus obtaining an average.
• These indexes will allow each individual Evocity to compare its performance against a typical Evocity
and those in its geographic region.
• Though there is a commonality in the types of facilities in each LGA, the number varies. As such these
results, when compared to an individual Evocity’s results, may vary and should be treated as an
indicative index only.
• The Evocities were grouped as shown in the table below and the map overleaf.
A note about the indexes
52
EVOCITIESEVOCITIESEVOCITIESEVOCITIES NORTHERNNORTHERNNORTHERNNORTHERN CENTRALCENTRALCENTRALCENTRAL WESTWESTWESTWEST SOUTHERNSOUTHERNSOUTHERNSOUTHERN
Armidale Dumaresq X
Albury X
Bathurst X
Dubbo X
Orange X
Tamworth X
Wagga Wagga X
Regional Indexes
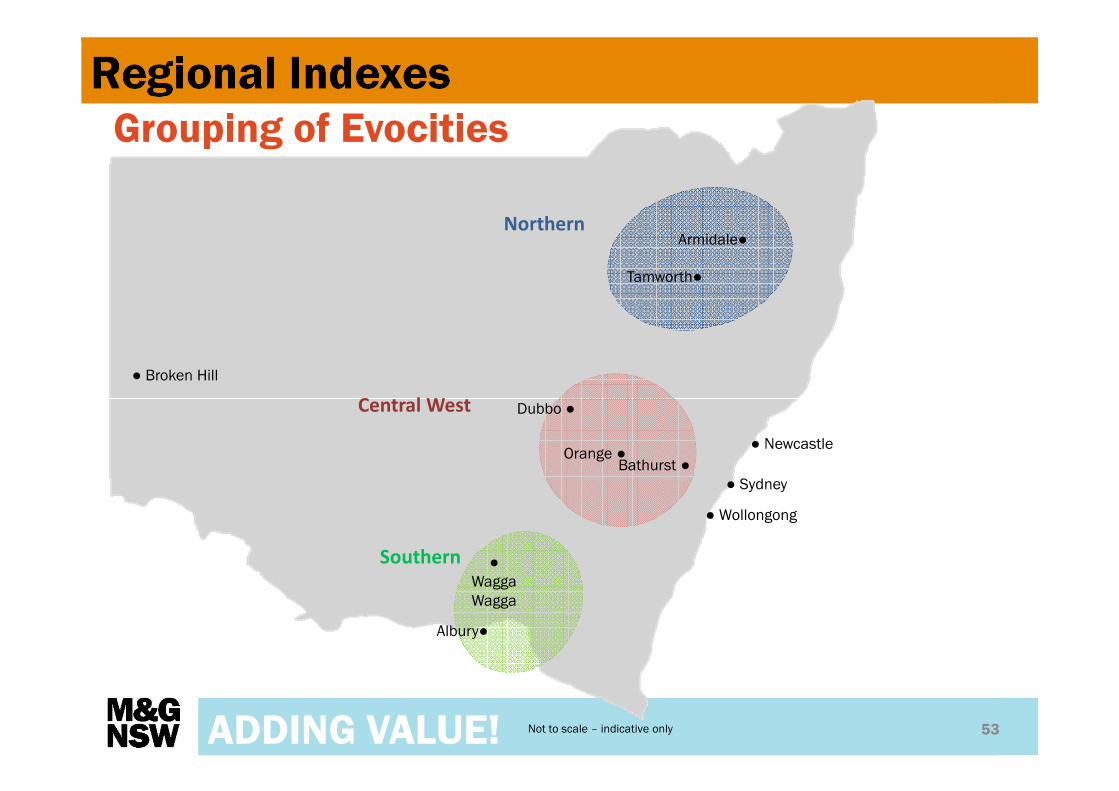
Regional Indexes
ADDING VALUE!
Grouping of Evocities
53
● Broken Hill
Tamworth●
Armidale●
● Newcastle
● Wollongong
Bathurst ●Orange ●
Albury●
●
Wagga
Wagga
Central West
Southern
Dubbo ●
● Sydney
Northern
Not to scale – indicative only
ADDING VALUE!
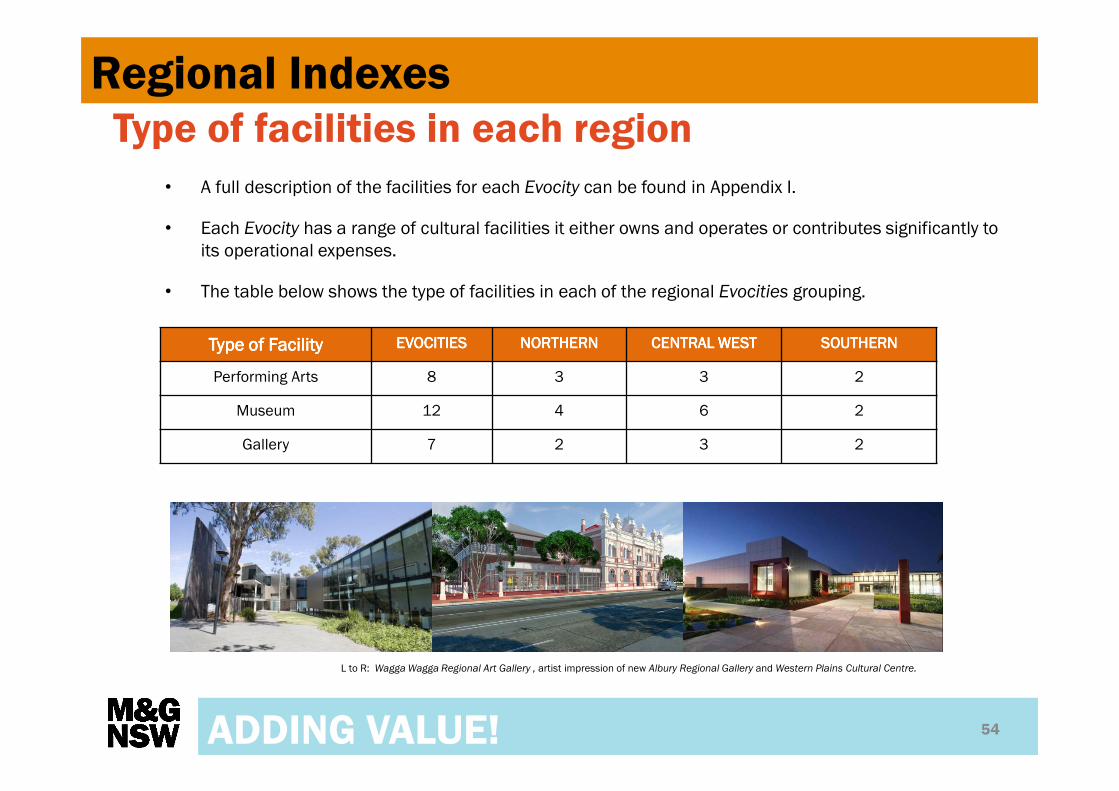
• A full description of the facilities for each Evocity can be found in Appendix I.
• Each Evocity has a range of cultural facilities it either owns and operates or contributes significantly to
its operational expenses.
• The table below shows the type of facilities in each of the regional Evocities grouping.
Type of facilities in each region
54
Type ofType ofType ofType of FacilityFacilityFacilityFacility EVOCITIESEVOCITIESEVOCITIESEVOCITIES NORTHERNNORTHERNNORTHERNNORTHERN CENTRALCENTRALCENTRALCENTRAL WESTWESTWESTWEST SOUTHERNSOUTHERNSOUTHERNSOUTHERN
Performing Arts 8 3 3 2
Museum 12 4 6 2
Gallery 7 2 3 2
Regional Indexes
L to R: Wagga Wagga Regional Art Gallery , artist impression of new Albury Regional Gallery and Western Plains Cultural Centre.
ADDING VALUE!
Total economic impact from outputs
55Source: M&G NSW/WRI Evocities Economic impact report
Nb totals may vary due to rounding
$6,020,000
$5,713,333
$4,395,000
$5,422,857
$3,885,000
$3,713,333
$2,470,000
$3,405,714
Southern Index
Central West Index
Northern Index
Evocity Index
Initial impact - Output Flow-on from Output
Total economic impact
from outputs Multiplier
$8,828,571 1.63
$6,860,000 1.56
$9,426,667 1.65
$9,905,000 1.65
Regional Indexes
• Combined cultural facilities of the average Evocity creates an economic impact of $8.8 million from Outputs
alone. This takes into account impacts from operations, capital expenditure and tourism
• The cultural facilities in the Central West and Southern Evocities have a higher impact than the average
Evocity
• The cultural facilities of the Northern Evocities have a lower impact than the average Evocity, but still have a
positive impact

ADDING VALUE!
Total economic impact from Value Added
56
$3,490,000
$3,283,333
$2,380,000
$3,084,286
$1,700,000
$1,703,333
$1,125,000
$1,537,143
Southern Index
Central West Index
Northern Index
Evocity Index
Initial impact - Value Add Flow-on from Value Add
Total economic impact from
Value Added Multiplier
$ 4,621,429 1.50
$3,505,000 1.47
$4,983,333 1.52
$5,195,000 1.49
Source: M&G NSW/WRI Evocities Economic impact report
Nb totals may vary due to rounding
Regional Indexes
• The combined cultural facilities in the average Evocity contribute $4.6 million to the Gross Regional Product
• This takes into account impacts from operations, capital expenditure and tourism
• The cultural facilities in the Northern Evocities have a lower impact than the average Evocity, but still have a
positive impact
• The cultural facilities in the Central West and Southern Evocities have a higher impact than in the average
Evocity

ADDING VALUE!
Total economic impact from household income
57
• For the average Evocity, the economic impact of the combined cultural facilities from household income is
$2.2 million
• The cultural facilities of the Northern Evocities have a lower impact from household income in dollars than the
average Evocity but have a higher than average multiplier
• The cultural facilities of the Central West and Southern Evocities have a higher impact from household income
than the average Evocity
$1,870,000
$1,566,667
$1,050,000
$1,505,714
$775,000
$773,333
$495,000
$694,286
Southern Index
Central West Index
Northern Index
Evocity Index
Initial impact of household income Flow-on from household income
Total economic impact from
household income Multiplier
$2,200,000 1.46
$1,545,000 1.47
$2,343,333 1.50
$2,635,000 1.41
Source: M&G NSW/WRI Evocities Economic impact report
Nb totals may vary due to rounding
Regional Indexes
ADDING VALUE!
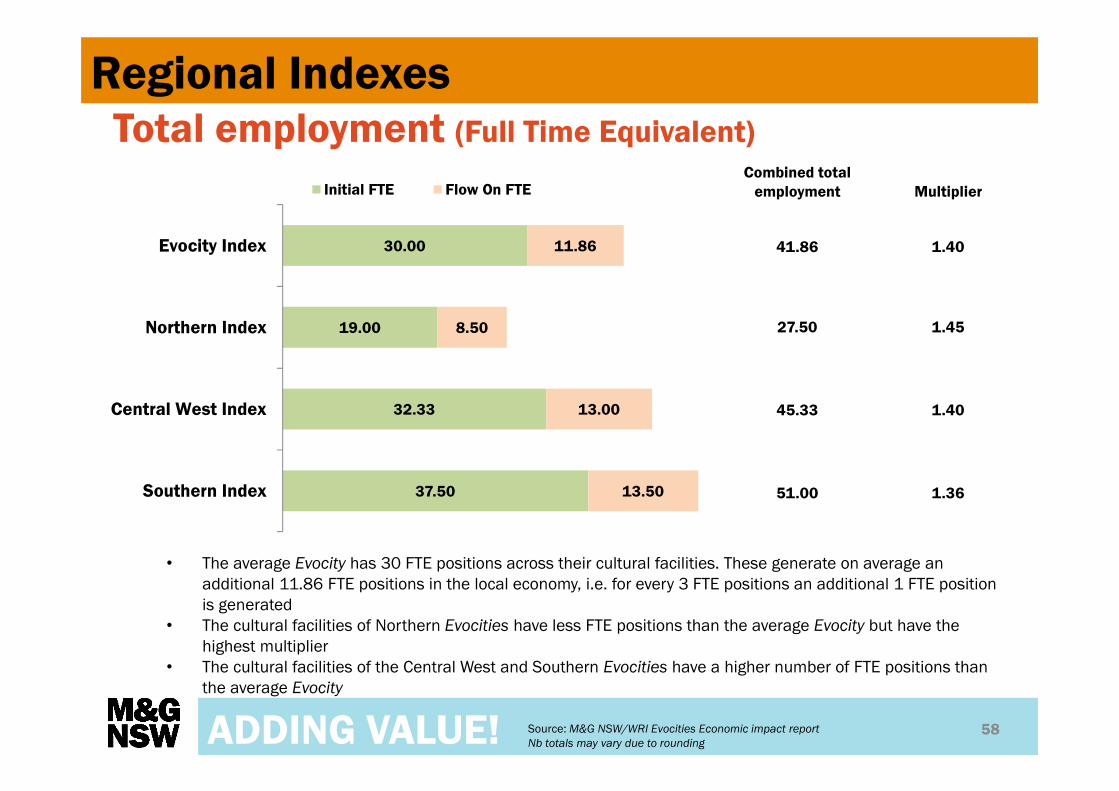
Total employment (Full Time Equivalent)
58
Combined total
employment Multiplier
41.86 1.40
27.50 1.45
45.33 1.40
51.00 1.36
Source: M&G NSW/WRI Evocities Economic impact report
Nb totals may vary due to rounding
37.50
32.33
19.00
30.00
13.50
13.00
8.50
11.86
Southern Index
Central West Index
Northern Index
Evocity Index
Initial FTE Flow On FTE
Regional Indexes
• The average Evocity has 30 FTE positions across their cultural facilities. These generate on average an
additional 11.86 FTE positions in the local economy, i.e. for every 3 FTE positions an additional 1 FTE position
is generated
• The cultural facilities of Northern Evocities have less FTE positions than the average Evocity but have the
highest multiplier
• The cultural facilities of the Central West and Southern Evocities have a higher number of FTE positions than
the average Evocity
Total economic impact
from outputs Multiplier
$ 5,921,429 1.54
$ 4,290,000 1.46
$ 6,630,000 1.56
$ 6,490,000 1.56
ADDING VALUE!
Economic impact of facility operation and
programs only
59Source: M&G NSW/WRI Evocities Economic impact report
Nb totals may vary due to rounding
$4,155,000
$4,250,000
$2,935,000
$3,847,143
$2,335,000
$2,380,000
$1,355,000
$2,074,286
Southern Index
Central West Index
Northern Index
Evocity Index
Initial impact - Output Flow-on from Output
Regional Indexes
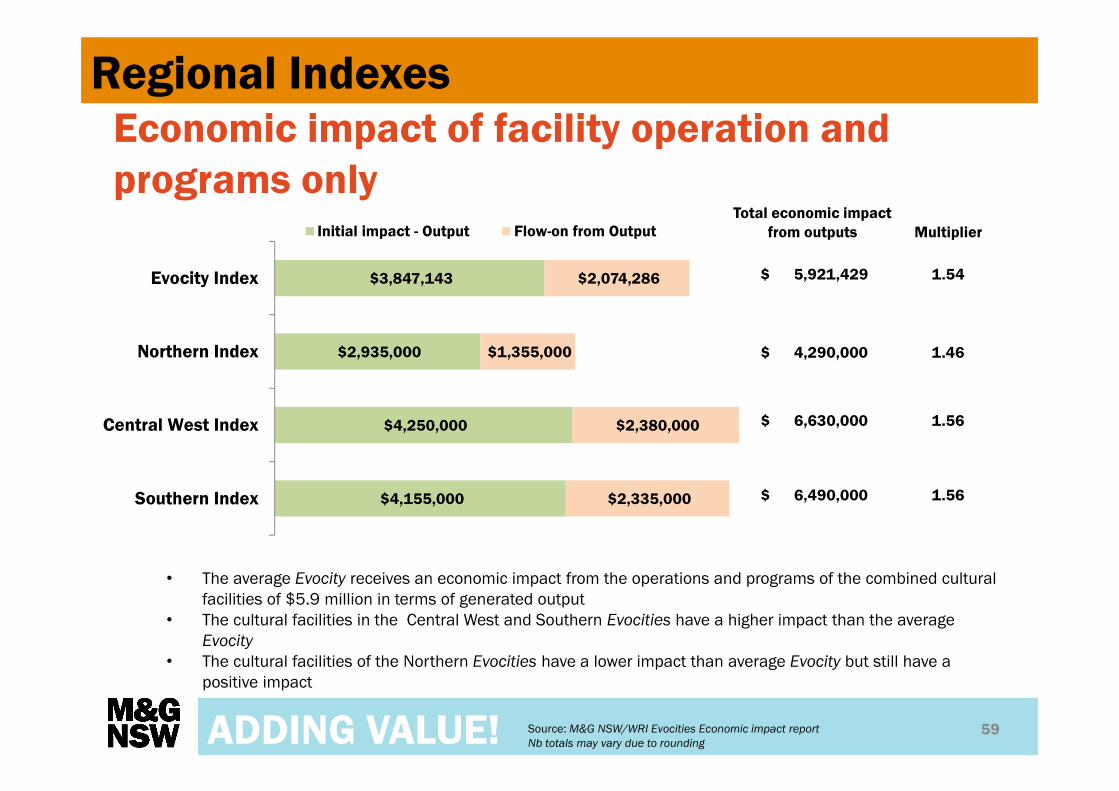
• The average Evocity receives an economic impact from the operations and programs of the combined cultural
facilities of $5.9 million in terms of generated output
• The cultural facilities in the Central West and Southern Evocities have a higher impact than the average
Evocity
• The cultural facilities of the Northern Evocities have a lower impact than average Evocity but still have a
positive impact

ADDING VALUE!
Economic impact of facility operations from
tourist visitation
60
• The average Evocity receives an economic impact from tourists to its combined cultural facilities of $2.5
million
• The cultural facilities of the Southern Evocities have on average, the highest economic impact by the
operations and programs of the cultural facilities from tourist visitation
• The cultural facilities of the Central West Evocities have an above average multiplier
Source: M&G NSW/WRI Evocities Economic impact report
Nb totals may vary due to rounding
$1,715,000
$1,183,333
$1,445,000
$1,410,000
$1,405,000
$1,016,667
$1,105,000
$1,152,857
Southern Index
Central West Index
Northern Index
Evocity Index
Initial impact - Output Flow-on from Output
Total economic impact
from outputs Multiplier
$ 2,562,857 1.82
$ 2,550,000 1.76
$ 2,200,000 1.86
$ 3,120,000 1.82
Regional Indexes

ADDING VALUE!
Tourism impact on employment
61
• The average Evocity has 7 FTE positions generated from impacts due to tourist visitation. These in-turn
generate an additional 4 FTE positions in the local economy
• The cultural facilities of the Central West Evocities have a lower than average number of FTE positions but the
highest multiplier
• The cultural facilities of the Southern Evocities have a higher than the average number of FTE positions but
the lowest multiplier
Combined Total
Employment (FTE) Multiplier
11.0 1.57
11.0 1.57
9.7 1.61
13.0 1.53
Source: M&G NSW/WRI Evocities Economic impact report
Nb totals may vary due to rounding
8.5
6.0
7.0
7.0
4.5
3.7
4.0
4.0
Southern Index
Central West Index
Northern Index
Evocity Index
Initial FTE Flow On FTE
Regional Indexes

ADDING VALUE!
Contribution of volunteers
62
72
67
81
64
Average number of volunteers
68
7773
53
Number of average weekly hours
Evocity Index
Northern Index
Central West Index
South Index
Source: M&G NSW/WRI Evocities Economic impact report
Nb totals may vary due to rounding
• On average each Evocity has 72 volunteers engaged across their cultural facilities. Each week they contribute
on average 68 hours per week across the facilities
• The cultural facilities of the Central West Evocities have a higher than average number of volunteers.
• Northern Evocities cultural facilities volunteers contribute the highest average number of hours per week
Regional Indexes
ADDING VALUE!
Return on investment
63
ROI
Net Profit of facilities divided by
local, state and federal government
investment
%
Public ROI
Including the Value Added
generated by operations and
other business
Public ROI - 2
From operations and flow
on impacts, capital
expenditure and the Value
Added generated by
tourists
Evocity Index -7.70 27.39 69.14
Northern Index -14.79 14.59 60.70
Central West Index -2.08 36.87 75.54
Southern index -10.40 23.45 66.32
Source: M&G NSW/WRI Evocities Economic impact report
Nb totals may vary due to rounding
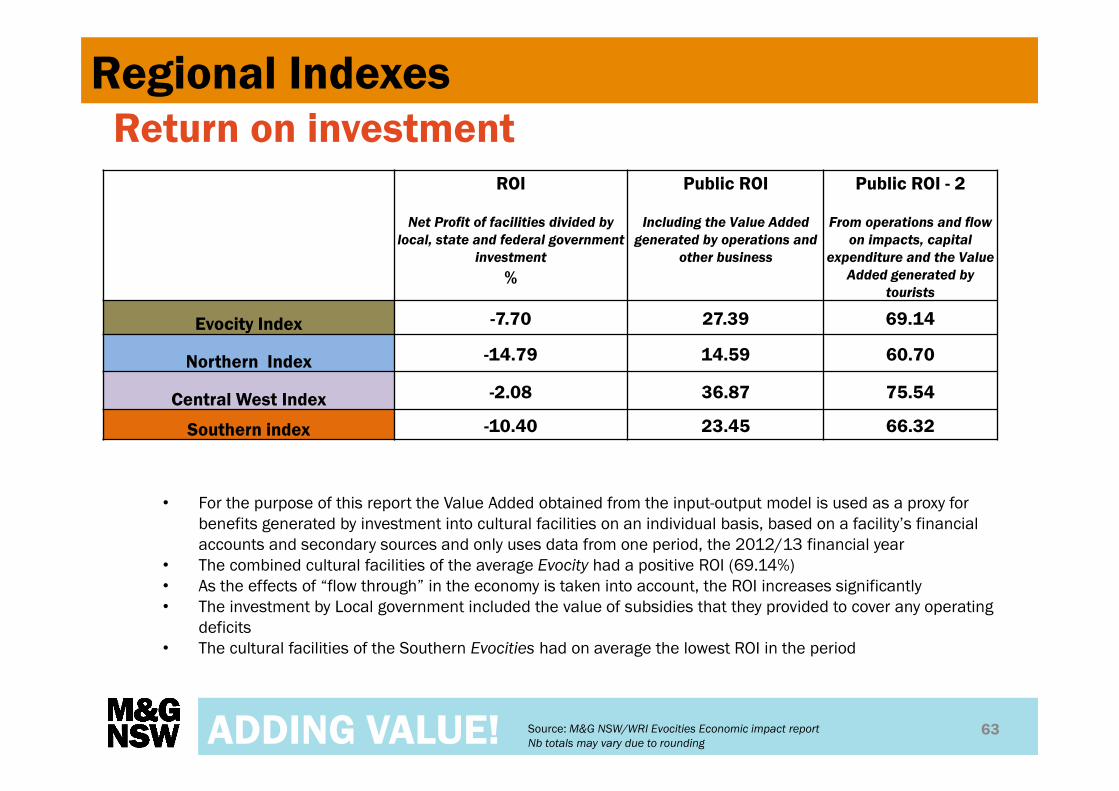
• For the purpose of this report the Value Added obtained from the input-output model is used as a proxy for
benefits generated by investment into cultural facilities on an individual basis, based on a facility’s financial
accounts and secondary sources and only uses data from one period, the 2012/13 financial year
• The combined cultural facilities of the average Evocity had a positive ROI (69.14%)
• As the effects of “flow through” in the economy is taken into account, the ROI increases significantly
• The investment by Local government included the value of subsidies that they provided to cover any operating
deficits
• The cultural facilities of the Southern Evocities had on average the lowest ROI in the period
Regional Indexes
CONCLUSIONS
AND
RECOMMENDATIONS
ADDING VALUE!A report on the economic impact of the
cultural infrastructure of
the Evocities of NSW
L to R: Armidale Folk Museum, Western Plains Cultural Centre and Wagga Wagga Regional Gallery
ADDING VALUE!
• The 26 cultural facilities of the Evocities have a positive impact on their local and regional economies.
From the initial investment made by Local, State and Federal government, in 2012/13 they generated
an additional $23.84 million in the combined economies of the seven Evocities. They also generated a
total of $32.35 million in gross regional product and $15.4 million in household income.
• The facilities create additional jobs across the Evocities. On average 8.5 full time equivalent position
are created in the local economies for every 10 full time positions within the cultural facilities.
• The induced expenditure from tourist visitation generates an additional $8 million in the combined
Evocity economies, with the total value estimated at almost $18 million. It is also estimated that an
additional 27 full time equivalent positions are created outside the facilities across the seven Evocities
from the flow on effects of tourist visitation.
• Volunteers play a significant role in the operations of cultural facilities providing almost 25,000
working hours valued at over $500,000 in the 2012/13 year. Volunteers range from 35 to 70 years of
age and vary in number for each individual Evocity.
• Using their contribution to the gross regional economies, the 26 cultural facilities had a positive return
on investment for the year 2012/13. When taking into account the direct impact, capital expenditure
and the contribution of tourist visitation, the return on investment for the combined facilities is 69%.
• Given the similarity of the individual Evocities to other regional cities in NSW, it would be reasonable to
conclude that other cultural facilities also have a positive effect on their local and regional economies
in terms of employment, visitation and contribution to gross regional product.
Conclusions
65
CONCLUSIONS & RECOMMENDATIONS
ADDING VALUE!
• This study, though slightly different in methodology to the 2009 Value Added! study, demonstrates the
value in repeating an analysis of the economic contribution of the cultural facilitates to their local and
regional economies. It is recommended that a similar study be undertaken in 2016 to build
longitudinal data and continue to monitor the economic contribution of these important community
facilities.
• Furthermore, there would be great value in gathering this kind of empirical data for all regional centres
across NSW that provide cultural facilities, so a state-wide understanding of their contribution to their
local and regional economies could be developed. It is recommended that such studies adopt the
methodology used in this report to allow for direct comparisons.
• The value of arts and culture is understood to be manifold. This report only captures one element of
their contribution to society. Though the wider public are often not aware of this contribution (see
Appendix V) more work needs to be undertaken to disseminate the real and positive economic
impacts of these valuable community assets and the services they deliver to their communities (for an
example of the take up of these services see Appendix VI).
• It is recommended that further research be undertaken into the contribution that volunteers make
within these facilities and the resulting benefits. This should not just examine the economic benefits
and cost savings generated, but also the benefits that the volunteers themselves reap and how that
assists them in contributing to their local communities, self image and wellbeing.
Recommendations
66
CONCLUSIONS & RECOMMENDATIONS

ADDING VALUE!
• It would be valuable to further collect and examine both qualitative and quantitative data on the
responses of the current users and non-users to the cultural facilities. This would assist in developing
a stronger understanding of how these facilities impact on the decisions of particular segments of the
community both in terms of retention and immigration. The methodology used in the 2009 Adding
Value! study is recommended as a starting point for such research.
• As the facilities are generally showing a very strong connection to school aged audiences (see
Appendix VI) this could be an area of further ongoing research. Recent data released by the Australian
Council for the Arts shows a strong correlation between childhood exposure to the arts and culture,
and consumption as an adult.
• A number of programs provided by the facilities are available at a low or no cost to local residents and
visitors. An examination of these, and undertaking additional research such as a contingent valuation
study, may help the facilities better argue the value of the delivery of these programs to their local
communities.
67
Recommendations (continued)
CONCLUSIONS & RECOMMENDATIONS
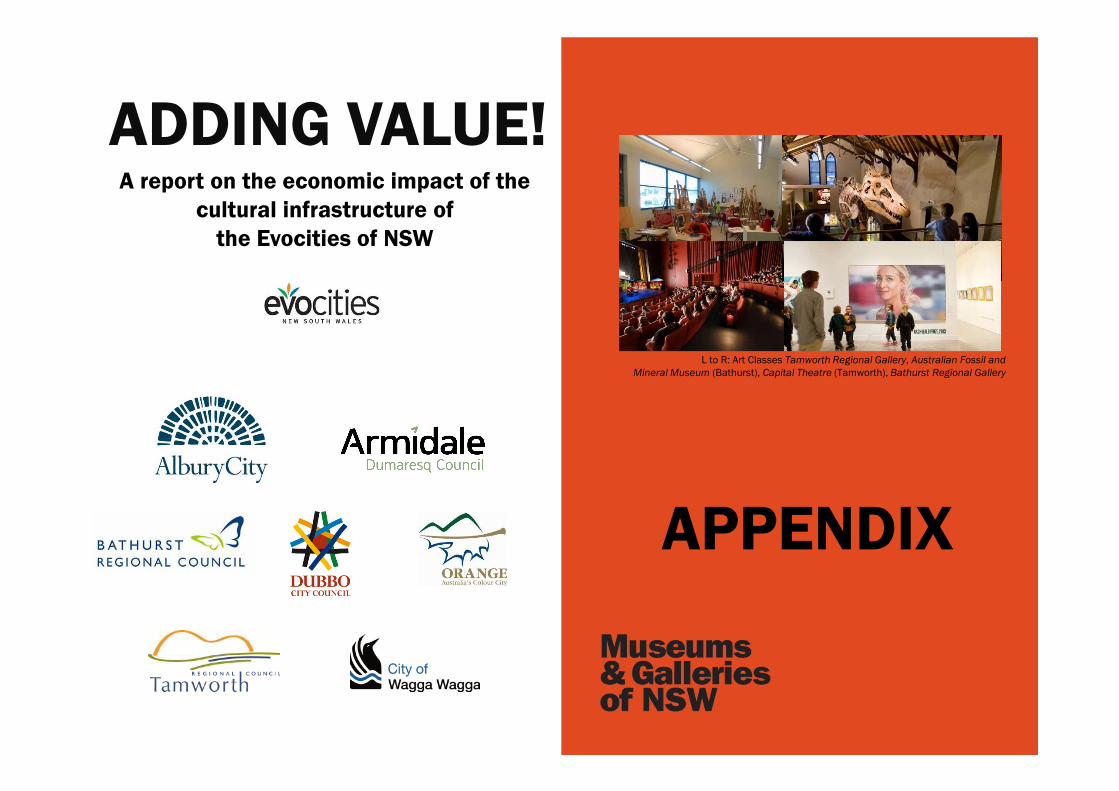
APPENDIX
ADDING VALUE!A report on the economic impact of the
cultural infrastructure of
the Evocities of NSW
L to R: Art Classes Tamworth Regional Gallery, Australian Fossil and
Mineral Museum (Bathurst), Capital Theatre (Tamworth), Bathurst Regional Gallery
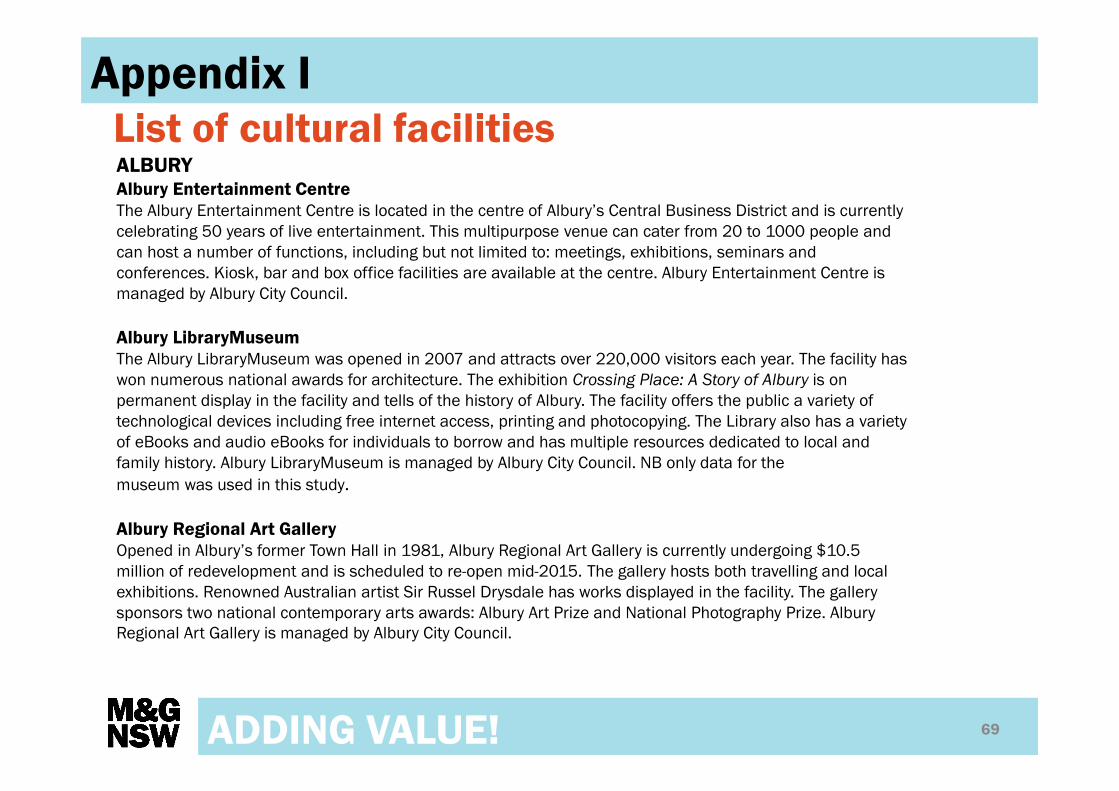
ADDING VALUE!
List of cultural facilities
69
Appendix I
ALBURYAlbury Entertainment CentreThe Albury Entertainment Centre is located in the centre of Albury’s Central Business District and is currently
celebrating 50 years of live entertainment. This multipurpose venue can cater from 20 to 1000 people and
can host a number of functions, including but not limited to: meetings, exhibitions, seminars and
conferences. Kiosk, bar and box office facilities are available at the centre. Albury Entertainment Centre is
managed by Albury City Council.
Albury LibraryMuseumThe Albury LibraryMuseum was opened in 2007 and attracts over 220,000 visitors each year. The facility has
won numerous national awards for architecture. The exhibition Crossing Place: A Story of Albury is on
permanent display in the facility and tells of the history of Albury. The facility offers the public a variety of
technological devices including free internet access, printing and photocopying. The Library also has a variety
of eBooks and audio eBooks for individuals to borrow and has multiple resources dedicated to local and
family history. Albury LibraryMuseum is managed by Albury City Council. NB only data for the
museum was used in this study.
Albury Regional Art GalleryOpened in Albury’s former Town Hall in 1981, Albury Regional Art Gallery is currently undergoing $10.5
million of redevelopment and is scheduled to re-open mid-2015. The gallery hosts both travelling and local
exhibitions. Renowned Australian artist Sir Russel Drysdale has works displayed in the facility. The gallery
sponsors two national contemporary arts awards: Albury Art Prize and National Photography Prize. Albury
Regional Art Gallery is managed by Albury City Council.

ADDING VALUE!
List of cultural facilities (continued)
70
Appendix I
ARMIDALE DUMARESQArmidale Folk MuseumThe Armidale Folk Museum was established in 1933 and is located in the 1863 Armidale Literacy Institute. Open seven
days a week, the museum offers a diverse range of educational and historical resources. These resources include archives
and relics from Armidale’s past. The Folk Museum is managed by Armidale Dumaresq Council.
Hillgrove Rural Life and Industry MuseumThe Hillgrove Museum was established in 1976 to portray the history of the once operational gold mining town. The
museum is located 35 kilometres east of Armidale and operates from the 1896 Hillgrove School Building. The museum is
managed by Armidale Dumaresq Council.
Armidale Bicentennial Railway MuseumThe Armidale Bicentennial Railway Museum displays the history of the Brisbane to Sydney Railway line, which played an
important role in the growth of Armidale. The museum provides an insight into the days when the railway was the most
common form of transportation. A range of hands-on experiences are offered by the museum and provides an
understanding of what life was like working on the railway. The Railway Museum is managed by Armidale Dumaresq
Council.
New England Regional Art MuseumThe New England Regional Art Museum (NERAM) was established in 1983 in order to house the Howard Hinton Collection
which consists of more than 1,400 artworks. The gallery now consists of three significant collections: Howard Hinton
Collection, The Chandler Coventry Collection and the NERAM Collection. The facility is also includes theMuseum of
Printing, an artist studio and residence, 8 gallery spaces and a café. Since July 2008, NERAM has been managed and
operated by a not-for-profit company Limited by Guarantee. As Armidale Dumaresq Council provides a subsidy to NERAM
towards operating cost this facility has been included in this study.
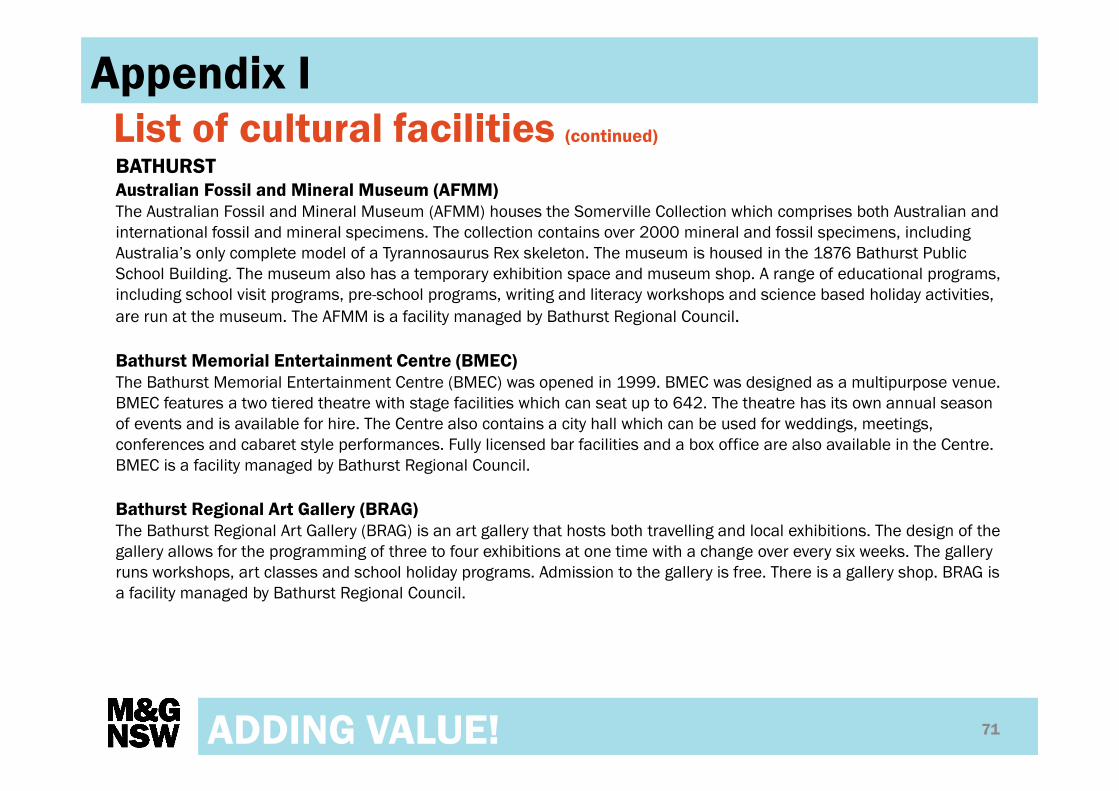
ADDING VALUE!
List of cultural facilities (continued)
71
Appendix I
BATHURSTAustralian Fossil and Mineral Museum (AFMM)The Australian Fossil and Mineral Museum (AFMM) houses the Somerville Collection which comprises both Australian and
international fossil and mineral specimens. The collection contains over 2000 mineral and fossil specimens, including
Australia’s only complete model of a Tyrannosaurus Rex skeleton. The museum is housed in the 1876 Bathurst Public
School Building. The museum also has a temporary exhibition space and museum shop. A range of educational programs,
including school visit programs, pre-school programs, writing and literacy workshops and science based holiday activities,
are run at the museum. The AFMM is a facility managed by Bathurst Regional Council.
Bathurst Memorial Entertainment Centre (BMEC)The Bathurst Memorial Entertainment Centre (BMEC) was opened in 1999. BMEC was designed as a multipurpose venue.
BMEC features a two tiered theatre with stage facilities which can seat up to 642. The theatre has its own annual season
of events and is available for hire. The Centre also contains a city hall which can be used for weddings, meetings,
conferences and cabaret style performances. Fully licensed bar facilities and a box office are also available in the Centre.
BMEC is a facility managed by Bathurst Regional Council.
Bathurst Regional Art Gallery (BRAG)The Bathurst Regional Art Gallery (BRAG) is an art gallery that hosts both travelling and local exhibitions. The design of the
gallery allows for the programming of three to four exhibitions at one time with a change over every six weeks. The gallery
runs workshops, art classes and school holiday programs. Admission to the gallery is free. There is a gallery shop. BRAG is
a facility managed by Bathurst Regional Council.
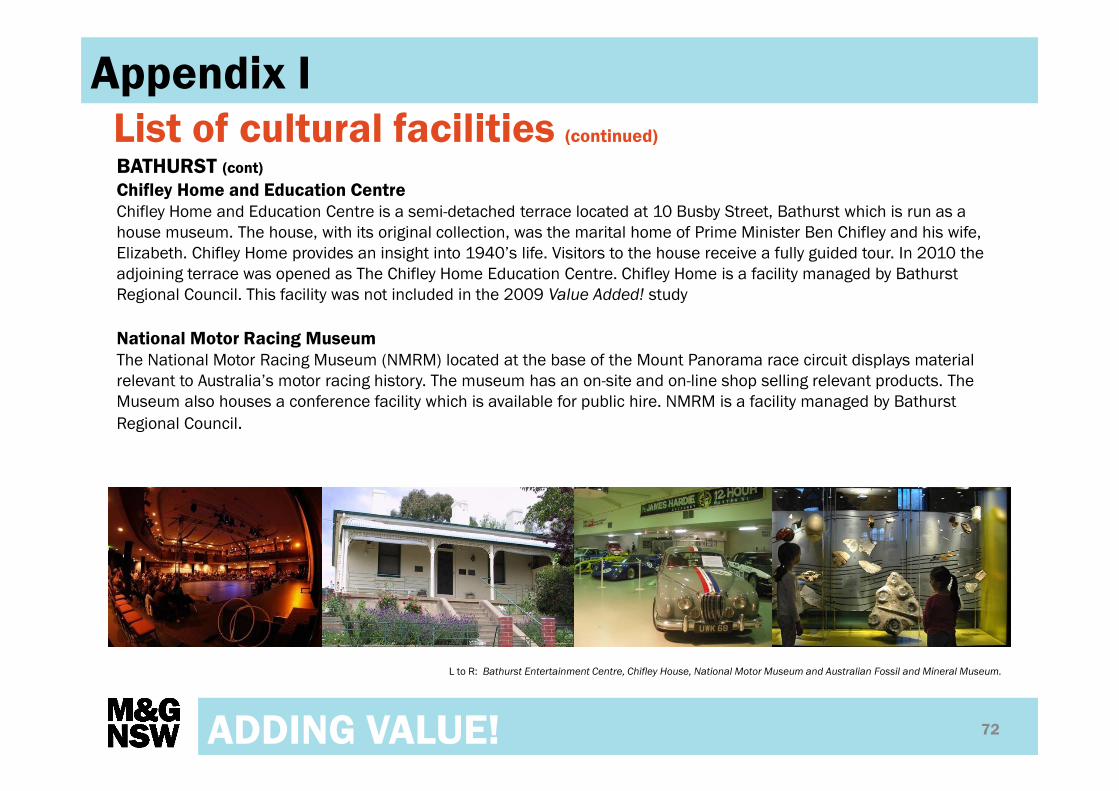
ADDING VALUE!
List of cultural facilities (continued)
72
Appendix I
BATHURST (cont)Chifley Home and Education CentreChifley Home and Education Centre is a semi-detached terrace located at 10 Busby Street, Bathurst which is run as a
house museum. The house, with its original collection, was the marital home of Prime Minister Ben Chifley and his wife,
Elizabeth. Chifley Home provides an insight into 1940’s life. Visitors to the house receive a fully guided tour. In 2010 the
adjoining terrace was opened as The Chifley Home Education Centre. Chifley Home is a facility managed by Bathurst
Regional Council. This facility was not included in the 2009 Value Added! study
National Motor Racing MuseumThe National Motor Racing Museum (NMRM) located at the base of the Mount Panorama race circuit displays material
relevant to Australia’s motor racing history. The museum has an on-site and on-line shop selling relevant products. The
Museum also houses a conference facility which is available for public hire. NMRM is a facility managed by Bathurst
Regional Council.
L to R: Bathurst Entertainment Centre, Chifley House, National Motor Museum and Australian Fossil and Mineral Museum.
ADDING VALUE!
List of cultural facilities (continued)
73
Appendix I
DUBBODubbo Regional Theatre and Convention CentreThe Dubbo Regional Theatre and Convention Centre (DRTCC) was opened in 2010 and consists of the Joyce Schneider
Auditorium and Convention Centre. The auditorium contains a tiered-theatre which can seat 500 people and hosts a
variety of local and touring shows. The auditorium offers box office and bar facilities. The Convention Centre is a flat-floor
auditorium which can be used for balls, weddings, expos, conventions, seminars and children’s concerts. The centre is
available for public functions with the ability to seat 750 theatre-style. Full bar facilities are available. The Dubbo Regional
Theatre and Convention Centre is managed by Dubbo City Council. Dubbo Regional Theatre was not included in the 2009
Value Added! study.
Old Dubbo GaolThe 1800s penal institution located in the centre of Dubbo’s CBD features animatronic inmates, authentic displays and
artefacts. Opened to the public in 1974, day and night visiting options are offered by the Gaol. Visitors can take a self-
guided tour of the gaol where they hear the inmates’ stories and learn of prison life. Comical wardens or prisoners also put
on theoretical displays throughout the Gaol. A shop also supplies souvenirs and other material. Old Dubbo Gaol is a facility
managed by Dubbo City Council.
Western Plains Cultural CentreThe Western Plains Cultural Centre (WPCC) is located on the site of the old Dubbo High School and comprises of the
Dubbo Regional Gallery, Dubbo Regional Museum and Community Arts Centre. The gallery operates from a purpose-built
facility and has changing exhibitions featuring local artists and major travelling exhibitions. The museum features a
permanent exhibition, People, Places, Possessions: Dubbo Stories which tells Dubbo’s history and a temporary exhibition
space for changing exhibitions. The museum is located in the original Dubbo High School building. Admission to the centre
is free. WPCC is a facility managed by Dubbo City Council.
ADDING VALUE!
List of cultural facilities (continued)
74
Appendix I
ORANGEOrange Civic TheatreThe Orange Civic Theatre is a multipurpose venue located in the centre of the city of Orange. The 502 seat auditorium has
tiered seating and the stage is equipped to suit most technical requirements. The theatre offers a diverse annual program
including many local, national and international touring productions. Bar and box office facilities are available at the
theatre. Orange Civic Theatre is a facility managed by Orange City Council.
Orange Regional MuseumThe Orange Regional Museum is to be built in the centre of Orange and is being funded under the Federal Government’s
Community Development Grants program. The facility will be built alongside Orange’s Regional Art Gallery and City Library.
The museum will feature exhibition space, a tourist information centre, a café, retail facilities and administration offices. A
sloping grass roof will be the key design feature. The museum will be managed by Orange City Council. As this facility is not
yet opened, no data from this facility has been used in this study.
Orange Regional Gallery (ORG).The Orange Regional Gallery (ORG) was built in 1986 as a purpose built gallery. The gallery hosts both travelling, such as
the Archibald Prize, and local exhibitions. There is a regular changeover of exhibitions. The gallery also runs workshops, art
classes and school holiday programs. Admission to the gallery is free. There is a gallery shop selling a range of books,
resources and gifts. ORG is a facility managed by Orange City Council.

ADDING VALUE!
List of cultural facilities (continued)
75
Appendix I
TAMWORTHCapitol Theatre TamworthThe Capitol Theatre Tamworth is a 402 seat, purpose built proscenium arch theatre which is located in the Centrepoint
Shopping Complex. The Theatre shares its foyer and bar facilities with Forum Cinemas. Boasting a hydraulic orchestra pit
lift, automated winch flying system and well equipped sound and lighting rigs. The Capitol Theatre Tamworth is a regular
stop on the national touring circuit and a well occupied theatre for local and regional events and productions. Capitol
Theatre Tamworth is managed and operated by Entertainment Venues, a division of Tamworth Regional Council.
Tamworth Powerstation MuseumThe Tamworth Powerstation Museum was opened in 1988, the centenary of the installation of electric lighting in
Tamworth. The Museum is housed in Tamworth’s restored Municipal Electric Showroom building (built as the Tamworth
Municipal Electricity Works in 1907) and a modern reconstruction of the original engine house for the Tamworth power
station on its original site. It features displays recording the history of electricity and items reflecting the impact of the
development of electricity on modern society. It is managed by Tamworth Regional Council.
Tamworth Regional GalleryTamworth Regional Gallery was established in 1919 and is one of the oldest regional galleries in New South Wales. It is a
state-of-the-art multi purpose venue with two large exhibition spaces, a shop, arts studio for workshops and educational
activities and a modern meeting room and training facility. Its’ collections include one of the finest public collections of
colonial silver in Australia and the Tamworth Textile Triennial which showcases the best of textile art from across the
country. It aims to promote understanding, appreciation and enjoyment of the visual arts and contemporary arts and
crafts practices across a range of visual art forms and media. The Gallery provides a diverse and informed program of
outstanding visual art and craft exhibitions and activities including public lectures by leading artists and curator’s,
exhibition openings with floor talks, children’s workshops, floor talks for school groups and community outreach activities.
It is operated by Tamworth Regional Council.

ADDING VALUE!
List of cultural facilities (continued)
76
Appendix I
TAMWORTH (continued)Tamworth Regional Entertainment and Conference CentreHome to the Australian Country Music Awards Australia (CMAA) the Tamworth Regional Entertainment and Conference
Centre (TRECC), accommodates approximately 4,800 guests in full Concert Mode, 3,300 in Lyric Mode and 1,800 in
Intimate Mode. There are separate break-out rooms and meeting areas off the main auditorium. It boasts superior audio
and visual technology, catering and bar areas, green rooms and flexible stage configurations. The centre is home to
everything from rock concerts to agricultural shows, car launches, home exhibitions and school spectaculars.
Entertainment Venues, a division of Tamworth Regional Council, manages and operates the Tamworth Regional
Entertainment and Conference Centre (TRECC).
Tamworth Town HallSince its opening in 1934, Tamworth Town Hall has been a venue for a variety of events, conferences and concerts, as well
as career expos, antique shows and weddings. The venue has a full proscenium arch stage and three dressing rooms, and
a unique seated gallery level. The venue can seat up to 1,000 in theatre style. The Town Hall is located in the heart of the
CBD, is fully air-conditioned and has in-house kitchen facilities. The Passchendaele Room can be used as a break-out
room or for trade displays and exhibitions. Tamworth Town Hall was designed as a lasting memorial to Tamworth and
district soldiers and war workers. Large flags hang at intervals around the wall, while bronze plates carry the names of
battle areas where Australians fought during the Great War. Entertainment Venues, a division of Tamworth Regional
Council, manages and operates the Tamworth Town Hall.
ADDING VALUE!
List of cultural facilities (continued)
77
Appendix I
WAGGAMuseum of the RiverinaThe Museum of Riverina hosts a regular program of travelling exhibitions and in house curated temporary exhibitions. One
campus is located in the historic 1881 Council Chambers site which was originally the City’s Town Hall and Municipal
Offices as well as the seat of Local Government until 1999 when it was converted into the Museum of the Riverina. The
Botanic Gardens site of the Museum highlights the people, places and events that give Wagga Wagga its unique character
and is the home of the Museum’s permanent collection including the Wagga Wagga Sporting Hall of Fame. The Museum is
managed by Wagga Wagga Council.
Wagga Wagga Art GallerySituated in the heart of the city, Wagga Wagga Art Gallery is an innovative public art gallery with facilities which include
several large spaces for temporary exhibitions, located in the architect-designed Civic Centre, and incorporating a stand-
alone gallery to exhibit the National Art Glass Collection. The Wagga Wagga Art Gallery exhibits an exciting range of touring
shows and locally developed exhibitions from the Gallery’s extensive collections, as well as the work of Riverina based
artists. As well as displaying the National Art Glass Collection, the gallery also exhibits a number of curated exhibitions
which feature well known Australian and international glass artists throughout the year. It also provides a range of events,
educational and public programs. The gallery is managed by Wagga Wagga Council.
Wagga Wagga Civic TheatreBased in the Civic Precinct, the Wagga Wagga Civic Theatre is a main focus of cultural activities within the community. The
theatre attracts a great variety of national & international touring shows as well as many local events. The Wagga Wagga
Civic Theatre boasts a 488 seat auditorium, lighting and sound systems, spacious foyers, fully appointed bar and balcony
overlooking the beautiful Wollundry Lagoon.
ADDING VALUE!
• In this study WRI used marginal coefficients analysis to estimate the economic impact of cultural
facilities in Evocity regions on the local economies and New South Wales.
• The marginal coefficients model provides a more accurate representation of the flow-on effects of
expenditure than would be possible using a standard linear input-output model. That is, the marginal
coefficients model largely overcomes the overestimation of impacts that can result from using the
linear approach.
• The level of multipliers is lower than if conventional input-output models were used and higher than if
computable general equilibrium (CGE) frameworks and CGE-like input-output models were used. The
size of the flow on and total effects is higher than in conventional input-output models and lower than
the effects that would have been generated in the computable general equilibrium framework.
• The impacts are measured in terms of industry Value Added (Gross Regional Product), household
income and full-time equivalent jobs. All impacts are measured in either dollar terms or full-time
equivalent employment terms and as a percentage of the regional economy.
• Inter-industry models can be used for economic impact analysis, to estimate the benefits or costs
generated by new initiatives on each and every sector of an economy. For example, if there is a change
in the purchasing or sales pattern of any industry, the flow-on or multiplier effects on upstream
industries can be calculated.
Input-Output analysis
78
Appendix II

ADDING VALUE!
Constructing the Tables
• The tables for this project have been constructed using the GRIT technique developed by Professor
Guy West and Professor Rod Jensen of the University of Queensland. The GRIT technique, which uses
both national Australian Bureau of Statistics data and local superior data concerning the industry in
question, is the most reputable method of input-output table construction in Australia and indeed the
world.
• GRIT uses a series of non-survey steps to produce a prototype regional table from the national table,
but provides the opportunity at various stages for the insertion of superior data. The system is
“variable interference” in that the analyst is able to determine the extent to which they interfere with
the mechanical processes by introducing primary or other superior data.
• The GRIT system is designed to produce regional tables that are:
• consistent in accounting terms with each other and with the national table;
• capable of calculations to a reasonable degree of holistic accuracy; and
• capable of being updated with minimum effort as new data becomes available.
• The GRIT technique is basically a hybrid method of deriving state and regional input-output tables from
the national input-output table while at the same time allowing for the insertion of superior data at
various stages in the construction of the tables.
Input-Output analysis (continued)
79
Appendix II

ADDING VALUE!
Marginal coefficients model
• The use of marginal coefficients analysis in the tables will result in a more accurate estimate of the
economic significance of cultural facilities than would be possible with traditional input-output
analysis.
• One of the main limitations of input-output tables is the assumption of linear coefficients. To address
this problem and the associated problem of overestimation, the input-output analysis undertaken for
the operational and capital expenditures of cultural facilities incorporates the marginal coefficients
model.
• The marginal income coefficients model attempts to overcome the limitations of traditional input-
output analysis by removing the assumption of linear coefficients for the household sector. As is well
documented in the literature, the household sector is the dominant component of multiplier effects in
an input-output table so using marginal income coefficients for the household sector not only provides
a more accurate estimate of the multiplier effects but also provides results closer to those of a
computable general equilibrium (CGE) model. This should result in a more accurate estimate of the
economic significance of cultural facilities than would be possible with other types of analysis.
• Note: In calculating the economic impact of the cultural facilities it should be noted that the Australian Bureau of
Statistics applies a confidentiality technique to its census data tables. The technique involves small random
adjustments to the data which help prevent the disclosure of any identifiable data.
80
Appendix IIInput-Output analysis (continued)

ADDING VALUE!
Estimation of economic impacts
• The economic impacts of the cultural facilities in Evocity regions were estimated by constructing a new
sector row and column in the input-output table representing the aggregate operations of the cultural
establishments in each Evocity.
• To perform industry significance analysis, the operational expenditure, income and employment data
pertaining to cultural facilities in a given Evocity region were converted to basic prices using relevant
Evocity input-output table in order to make superior data consistent with the data contained in the
Evocity table. The converted data was then modelled using a new sector row and column representing
cultural facility sector in the Evocity region. The sizes of the new sector and the arts and recreation
sector in the table are adjusted by deflating the former based on the employment in each of the
sectors. To perform final demand analysis, the capital expenditure and induced expenditure by visitors
data was converted to basic prices using Evocity base input-output table and was then modelled using
a new sector row and column representing the cultural facility sector in the Evocity region.
81
Appendix IIInput-Output analysis (continued)

ADDING VALUE!
1 Agriculture, Forestry & Fishing
2. Coal and Oil Mining
3. Other Mining
4. Food and Beverage Manufacturing
5. Textile, Leather, Clothing & Footwear
Manufacturing
6. Wood and Wood Product Manufacturing
7. Pulp, Paper and Converted Paper Product
Manufacturing
8. Printing (including reproduction of recorded
media)
9. Chemical and Chemical Products Manufacturing
10. Non-Metallic Mineral Product Manufacturing
11. Primary Metal and Metal Products Manufacturing
12. Fabricated Metal Product Manufacturing
13. Transport and Equipment Manufacturing
14. Machinery and Equipment Manufacturing
15. Furniture and Other Manufacturing
16. Electricity, Gas, Water and Waste Services
Sector list (2006 ANZSIC)
82
Appendix III
17. Construction
18. Wholesale Trade
19. Retail Trade
20. Hospitality (Accommodation and Food Services)
21. Transport, Postal and Warehousing
22. Information Media and Telecommunications
23. Financial and Insurance Services
24. Rental, Hiring & Real Estate Services
25. Ownership of Dwellings
26. Professional, Scientific and Technical Services
27. Administrative and Support Services
28. Public Administration and Safety
29. Education and Training
30. Health Care and Social Assistance
31. Art and Recreation Services
32. Personal and Other Services
ADDING VALUE!
Comparisons to the creative industries
83
Appendix IV
• Released in Dec 2013 by the Creative Industries Innovation Centre (CIIC ), this data drew on the
2008/09 industry input-output tables pre-pared by Australian Bureau of Statistics from the 2006
census. As the methodology for the measurement of the multiplier is not the same as the GRIT
method, direct comparisons are not possible. The data is included here to better illustrate the
contributions made by the cultural facilities and their programs as part of the creative industries.
• The CIIC report defines the creative industries though the definitions of a creative intensity. This
method uses a ANZSCO classification of occupations and the tasks they undertake to create a creative
intensity score across five areas: “process novelty”, “resistance to mechanisation”, “non-repeating
output”, “creative function in process” and “interpretation not transformation”. If an ANZIC 4 digit
industry had at least 30% of its occupations with a high creative intensity, the industry was deemed as
creative.
• Broadly, the creative industries were categorised as:
• Music and Performing Arts,
• Film, Television & Radio,
• Adverting and marketing
• Software development and interactive content
• Writing, Publishing and Print media
• Design and Visual Arts
• Architecture
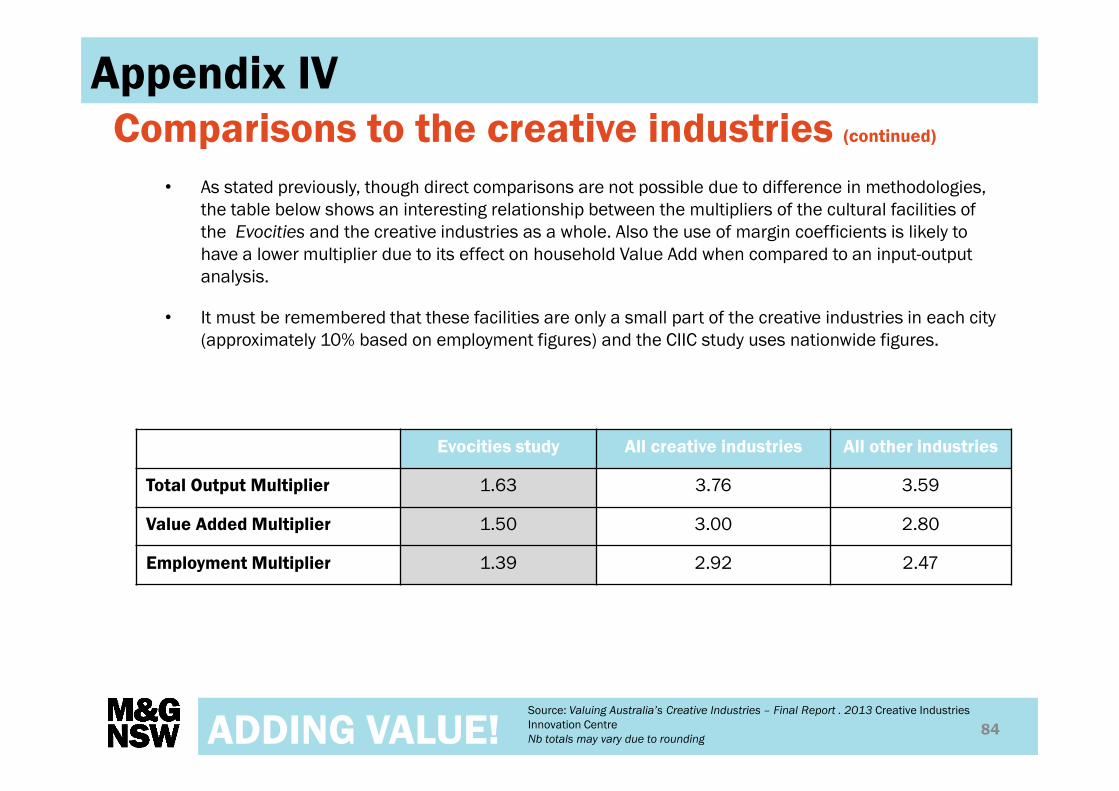
ADDING VALUE!
Comparisons to the creative industries (continued)
84
Appendix IV
• As stated previously, though direct comparisons are not possible due to difference in methodologies,
the table below shows an interesting relationship between the multipliers of the cultural facilities of
the Evocities and the creative industries as a whole. Also the use of margin coefficients is likely to
have a lower multiplier due to its effect on household Value Add when compared to an input-output
analysis.
• It must be remembered that these facilities are only a small part of the creative industries in each city
(approximately 10% based on employment figures) and the CIIC study uses nationwide figures.
Evocities study All creative industries All other industries
Total Output Multiplier 1.63 3.76 3.59
Value Added Multiplier 1.50 3.00 2.80
Employment Multiplier 1.39 2.92 2.47
Source: Valuing Australia’s Creative Industries – Final Report . 2013 Creative Industries
Innovation Centre
Nb totals may vary due to rounding

ADDING VALUE!
Non-economic benefits
85
Appendix V
• Though this study did not examine the non economic impact of the facilities and their related
programs, some of the benefits that arise from their activities are included here as suggested
pathways for further research.
Social Capital
• The work of Professor Mark Morrision as part of the 2009 Value Added! – The economic and social
impact of cultural infrastructure in Central Western NSW sought to quantify the effect of the cultural
facilities on social capital. One of the questions asked about the direct social impact of the facilities.
• By using a 5 point scale respondents were asked to agree with a number of statements - the higher
the number, the stronger the agreement. The table on the next page shows some of the statements
and the average score. The level of agreement with these statements suggests that cultural facilities
help people to think differently, enhance connections and trust between people, and help develop a
sense of place.
• Given the demographic similarities between all of the Evocities it may be possible to apply the results
in this area from the 2009 study to all of the Evocities. However, further studies would need to be
undertaken to confirm the validity of this comparison.
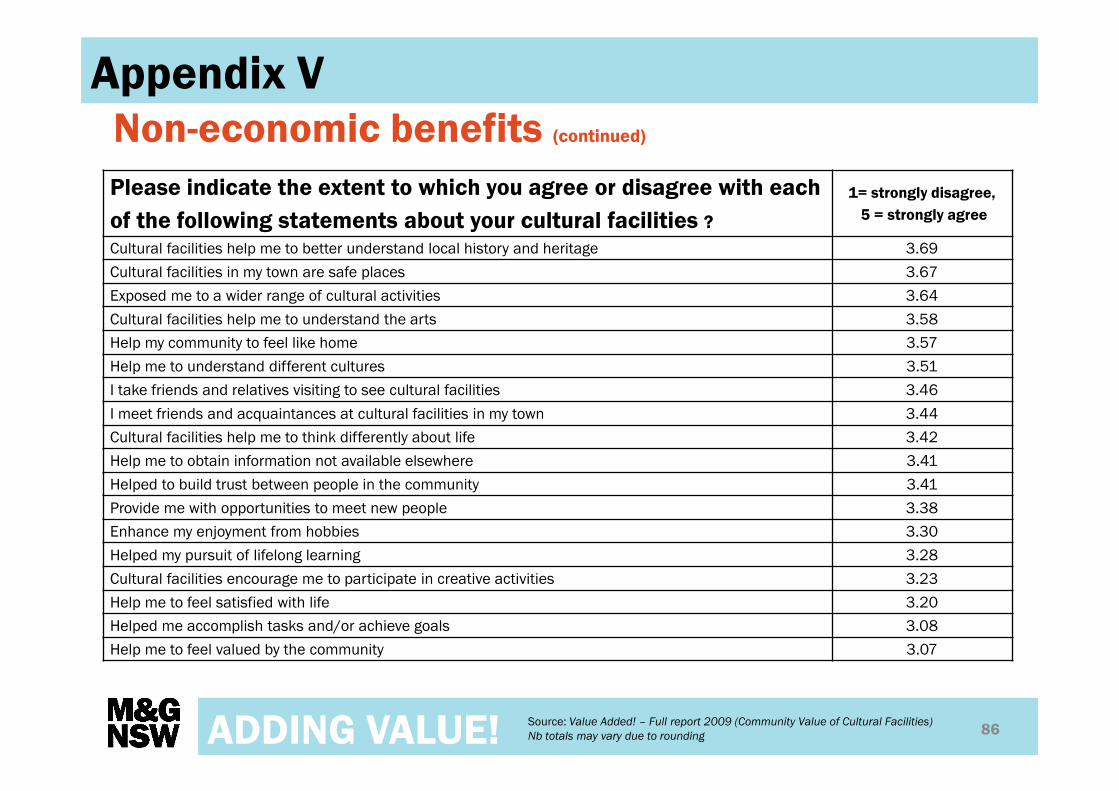
ADDING VALUE!
Non-economic benefits (continued)
86
Appendix V
Please indicate the extent to which you agree or disagree with each
of the following statements about your cultural facilities ?
1= strongly disagree,
5 = strongly agree
Cultural facilities help me to better understand local history and heritage 3.69
Cultural facilities in my town are safe places 3.67
Exposed me to a wider range of cultural activities 3.64
Cultural facilities help me to understand the arts 3.58
Help my community to feel like home 3.57
Help me to understand different cultures 3.51
I take friends and relatives visiting to see cultural facilities 3.46
I meet friends and acquaintances at cultural facilities in my town 3.44
Cultural facilities help me to think differently about life 3.42
Help me to obtain information not available elsewhere 3.41
Helped to build trust between people in the community 3.41
Provide me with opportunities to meet new people 3.38
Enhance my enjoyment from hobbies 3.30
Helped my pursuit of lifelong learning 3.28
Cultural facilities encourage me to participate in creative activities 3.23
Help me to feel satisfied with life 3.20
Helped me accomplish tasks and/or achieve goals 3.08
Help me to feel valued by the community 3.07
Source: Value Added! – Full report 2009 (Community Value of Cultural Facilities)
Nb totals may vary due to rounding
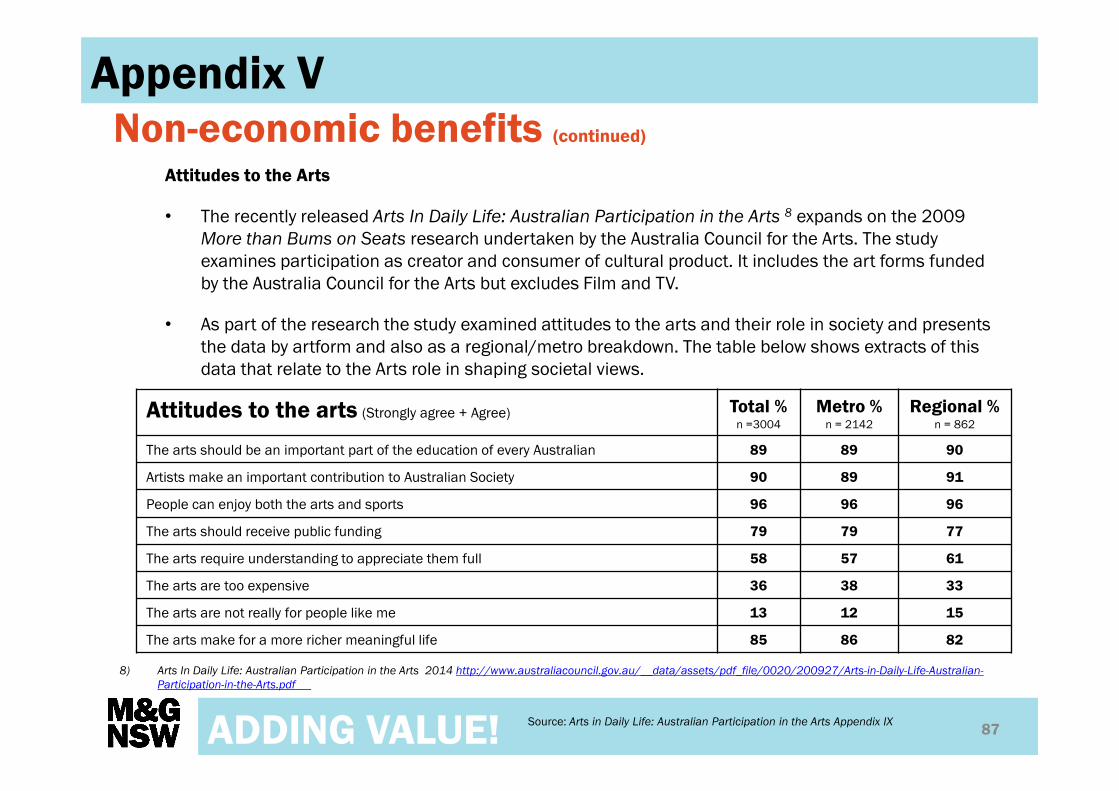
ADDING VALUE!
Non-economic benefits (continued)
87
Appendix V
Attitudes to the Arts
• The recently released Arts In Daily Life: Australian Participation in the Arts 8 expands on the 2009
More than Bums on Seats research undertaken by the Australia Council for the Arts. The study
examines participation as creator and consumer of cultural product. It includes the art forms funded
by the Australia Council for the Arts but excludes Film and TV.
• As part of the research the study examined attitudes to the arts and their role in society and presents
the data by artform and also as a regional/metro breakdown. The table below shows extracts of this
data that relate to the Arts role in shaping societal views.
8) Arts In Daily Life: Australian Participation in the Arts 2014 http://www.australiacouncil.gov.au/__data/assets/pdf_file/0020/200927/Arts-in-Daily-Life-Australian-Participation-in-the-Arts.pdf
Source: Arts in Daily Life: Australian Participation in the Arts Appendix IX
Attitudes to the arts (Strongly agree + Agree) Total %n =3004
Metro %n = 2142
Regional %n = 862
The arts should be an important part of the education of every Australian 89 89 90
Artists make an important contribution to Australian Society 90 89 91
People can enjoy both the arts and sports 96 96 96
The arts should receive public funding 79 79 77
The arts require understanding to appreciate them full 58 57 61
The arts are too expensive 36 38 33
The arts are not really for people like me 13 12 15
The arts make for a more richer meaningful life 85 86 82
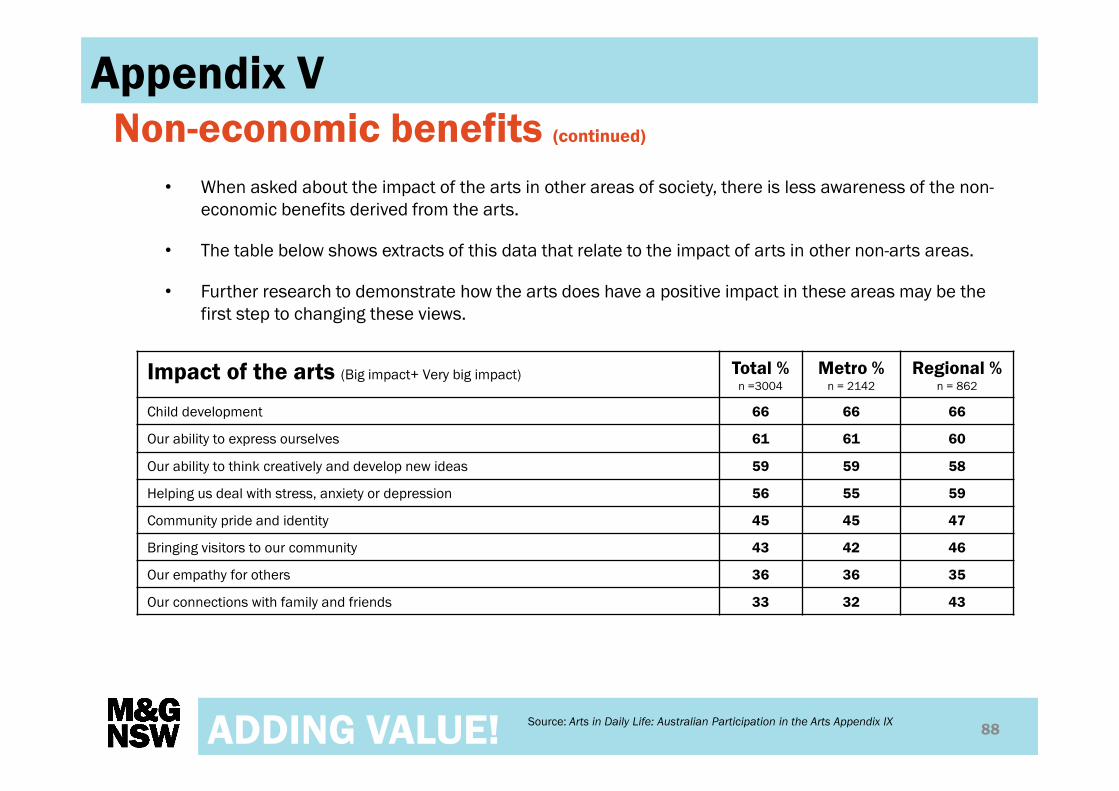
ADDING VALUE!
Non-economic benefits (continued)
88
Appendix V
• When asked about the impact of the arts in other areas of society, there is less awareness of the non-
economic benefits derived from the arts.
• The table below shows extracts of this data that relate to the impact of arts in other non-arts areas.
• Further research to demonstrate how the arts does have a positive impact in these areas may be the
first step to changing these views.
Source: Arts in Daily Life: Australian Participation in the Arts Appendix IX
Impact of the arts (Big impact+ Very big impact) Total %n =3004
Metro %n = 2142
Regional %n = 862
Child development 66 66 66
Our ability to express ourselves 61 61 60
Our ability to think creatively and develop new ideas 59 59 58
Helping us deal with stress, anxiety or depression 56 55 59
Community pride and identity 45 45 47
Bringing visitors to our community 43 42 46
Our empathy for others 36 36 35
Our connections with family and friends 33 32 43

ADDING VALUE!
School visitation
89
• The cultural facilities are providing services
to local and non-local schools
• Most are connecting with the equivalent of
65% or more of their available local
audiences aged 5-18 years
• Performing arts venues are more likely to
have repeat visitation from local audience
• A number of the facilities are attracting
audiences from beyond the LGA
Source: M&G NSW/WRI Evocities Economic impact report/ ABS Community Profiles
2011 (all valid response)
Nb totals may vary due to rounding
5938
4360
76238498
9447
72408136
9,026
4,876
7,668 8007 7595
1110211721
Albury Armidale Bathurst Dubbo Orange Tamworth Wagga Wagga
School Audiences from within the LGA 5-18 Years Old
Evocity
School audiences as a
percentage of the school
aged population
Albury* 65%
Armidale 89%
Bathurst 99%
Dubbo 106%
Orange 124%
Tamworth 65%
Wagga Wagga 69%
Appendix VI


