HEC Montréal Affiliée à l'Université de Montréal
ADR Listings and the Financing Decisions of Foreign Firms
Par Anis Samet
Service de l'Enseignement de la Finance BEC Montréal
Thèse présentée en vue de l'obtention du grade de Philosophioe Doctor (Ph. D.) en Administration
Spécialisation : Finance
Mai 2009
© Anis Samet, 2009
HEC Montréal Affiliée à l'Université de Montréal
Cette thèse intitulée :
ADR Listings and the Financing Decisions of Foreign Firms
présentée par : Anis Samet
a été évaluée par un jury composé des personnes suivantes :
Professeur François Leroux Président-rapporteur
Professeur Jean -Claude Cosset Co-directeur de recherche
Professeure Narjess Boubakri Co-directrice de recherche
Professeur Sergei Sarkissian Membre de jury
Professeure Usha Mittoo Examinateur externe
Professeur Martin Coiteux Représentant du doyen de la FES
ii
Résumé
De nombreuses motivations poussent les firmes à se lister à l'étranger comme la
possibilité de lever des capitaux avec de faibles coûts, l'amélioration de la liquidité de
leurs titres boursiers, l'élargissement de leurs bases d'actionnariat, l'amélioration de leur
visibilité et l'amélioration de leur gouvemance.
Pour se lister sur les marchés américains, les firmes disposent de plusieurs options : le
listing direct ou l'émission d'actions newyorkaises enregistrées ou bien l'émission des
certificats de dépôts américains (American Depositary Receipts : ADRs). Contrairement
aux firmes considérant les autres formes de listings sur les marchés américains, les
firmes qui choisissent de se lister à travers les ADRs proviennent aussi bien des marchés
développés que des marchés en voie de développement. Ceci nous permet d'examiner
l'impact des différences dans l'environnement institutionnel sur les décisions du listing
croisé et de la levée des capitaux subséquente.
Dans le premier papier, nous examinons les déterminants de la décision d'émettre un
ADR parmi les quatre programmes disponibles (programmes I, II, III et Règle 144A).
Nous montrons que les caractéristiques des firmes (la taille, la croissance de l'actif, le
levier financier, la privatisation, la structure de propriété et le pays d'origine) et les
variables institutionnelles (la notation comptable du pays et la protection des
actionnaires minoritaires) conditionnent ce choix. Nous examinons aussi, les
déterminants d'émettre un programme d'ADR avant et après la promulgation de la loi
Sarbanes-Oxley (SOX). Nous trouvons qu'à la suite de ce changement structurel, il y a
une réallocation entre les différents programmes d'ADRs. Nous trouvons aussi qu'après
SOX les firmes issues des marchés émergents et des pays où la protection des
iii
actionnaires minoritaires est faible vont plutôt choisir les ADRs sous la Règle 144A et
le niveau III respectivement.
Dans le deuxième article, nous examinons le lien entre les caractéristiques des firmes qui
ont émis des ADRs et leurs choix subséquents du titre à émettre (dette ou capitaux
propres) et du marché de destination. Nous trouvons que les firmes étrangères qui ont
émis des ADRs accroissent leurs émissions de la dette et des capitaux propres et ce
principalement pour les firmes issues des marchés émergents. De plus, nous trouvons
que les firmes issues des marchés émergents augmentent la proportion des émissions
primaires par rapport à leurs émissions secondaires après leurs listings. En outre, nous
trouvons que les firmes de grandes tailles vont plutôt émettre de la dette que des
capitaux propres. Nous trouvons aussi qu'après SOX, les firmes issues des marchés
émergents, listés sous les programmes III et Règle 144A, émettent plus de capitaux
propres durant cette période en comparaison avec la période avant SOX. Nous montrons
aussi qu'après SOX, les firmes issues des marchés développés et des marchés émergents
vont augmenter leurs levées des capitaux propres sur les marchés américains.
Finalement, nous trouvons que les firmes émettrices d'ADRs vont plutôt recourir aux
émissions primaires d'actions que de la dette pour financer leurs besoins et ce
spécialement pour les firmes issues des marchés émergents.
Mots clés : Certificats de dépôts américains; cotation croisée; engagement;
gouvernance; Sarbanes-Oxley; financement; capitaux propres; dette
iv
Abstract
Foreign firms that list abroad do so for a number of reasons, including to raise new
capital with lower costs, improve their stock liquidity, broaden their shareholders' base,
increase their visibility, and improve their information and corporate govemance
environment.
Cross-listing on U.S. markets can be achieved via a direct listing, New York Registered
Shares, or American depositary Receipts (ADRs). Firms that cross-list under ADR
programs originate from a wide array of developed and developing countries, while
firms under direct cross-listing are mostly Canadian. Focusing on ADRs thus allows us
to bring to light the impact of home-country variables on the cross-listing and capital-
raising decisions.
In the first paper, titled "The Choice of ADRs", we study the determinants of a firm's
decision to issue one of the four available ADR programs (Level I, Level II, Level III,
and Rule 144A). We find that the firm's attributes (size, income, asset growth, leverage,
privatization, ownership structure, and country-of-origin) and the firm's home-country
institutional variables (accounting rating and legal protection of minority shareholders)
condition this choice. We also examine the issuing activity and the determinants of the
ADR choice before and after the enactment of the Sarbanes-Oxley (SOX) Act.
Following this structural change, we provide evidence of a reallocation between ADR
programs. Compared to the pre-SOX period, firms from emerging markets, and those
from countries with weak legal protection of minority shareholders, are more likely after
SOX to choose Rule 144A and Level III, respectively.
V
In the second paper, titled "International Cross-Listings and Subsequent Security-
Market Choices: Evidence from ADRs", we study the link between the ADR-listed
firms' attributes and their subsequent security-market choices. First, we find that
following ADR listings, foreign firms increase their equity and debt issues, especially
emerging market firms. Moreover, being an emerging market firm increases the primary
shares in new equity issues after ADR listings. We also find that large firms are more
likely to issue debt and less likely to issue equity. Following SOX, we find that more
emerging market firms, under Level III and Rule 144A, issue equity compared to the
pre-SOX period. Moreover, we find that after SOX, Level III ADR firms increase their
public equity issues on U.S. markets. Finally, we find that ADR firms rely more on
primary-equity resources than on debt following their listings, especially for emerging
market firms.
Keywords: ADR; cross-listing; bonding; governance; Sarbanes-Oxley Act; financing;
equity; debt
Table des matières
Liste des tableaux ix Liste des figures x Liste des annexes xi Liste des abréviations xii Remerciements xv
Introduction générale 1
Chapter 1: ADR Listings: an Overview 4
1. Introduction 5
2. An overview of American Depositary Receipts 5
2.1. What are American Depositary Receipts? 5
2.2. Types of American Depositary Receipts 6
2.3. Issuance and cancellation of American Depositary Receipts 7
2.4. Benefits of American Depositary Receipts to investors 8
2.5. ADRs' market 8
3. What are the motives to list abroad? 9
3.1. Improving the protection of minority shareholders 9
3.2. Raising capital 10
3.3. Improving liquidity, broadening shareholder base, and increasing visibility and reputation 11
4. Research question 12
5. Contribution 13
References 15
Chapter 2 : The Choice of ADRs 19
1. Introduction 21
2. Related literature and hypotheses 26
2.1. Why do firms cross-list? 26
2.2. How do firms cross-list on U.S. markets? 28
2.3. Hypotheses development 30
vi
VII
2.3.1. Firm attributes and ADR Programs 30
2.3.2. Home-country institutional attributes and ADR programs 33 3. Data 33
4. Variables 35
4.1. Firm attributes 36
4.2. Home-country institutional attributes 38
5. Empirical analysis 39
5.1. Univariate analysis 39
5.2. Multivariate analysis 42
5.2.1. Mode! presentation 42
5.2.2. Estimation results 44
5.2.3. Sensitivity tests 48 5.2.4. Additional test: which firms cross-list on U.S. markets? 48
6. Does SOX affect ADR issuance? 53
6.1. Is there any reallocation between the different ADR programs before and after SOX? 54
6.2. Are the characteristics of issuing firms different before and alter SOX 9 56
6.3. SOX and ADRs: multivariate analysis 57
7. Conclusion 59
References 61
Chapter 3: International Cross-Listings and Subsequent Security-Market Choices: Evidence from ADRs 82
1. Introduction 84
2. Related literature 90
2.1. Security-market choices 90
2.1.1. Debt-equity choice 91
2.1.2. The market choice: public or private 9 92
2.1.3. Where do firms raise capital? 93 2.2. Capital-raising activity around the world 94
2.3. ADR listings and subsequent capital-raising activity 95
3. Data 97
4. Empirical analysis 99
4.1 Univariate analysis 99
4.1.1. Security issues by ADR firms 99 4.1.2. Equity issues made by ADR firms 101 4.1.3. Debt issues made by ADR firms 104 4.1.4. Security issues by emerging market firms 106 4.1.5. Sarbanes-Oxley Act and equity issues 107
4.2. Multivariate analysis 109
4.2.1. Equity issues following ADR listings 109 4.2.2. SOX and public equity issues on U.S. markets 112 4.2.3. Debt issues following ADR listings 113 4.2.4. Debt and equity issues following ADR listings 116
5. Sensitivity tests 118
6. Conclusion 119
References 122
Conclusion générale 148
ix
Liste des tableaux
Chapter 2: The Choice of ADRs
Table I: Main features of ADRs 65
Table II: Descriptive statistics ... ....... .... 66
Table III: The determinants of an issuer's ADR choice 67
Table IV: Comparison between ADR programs 68
Table V: Multinomial logit estimations: the choice between the four ADR
programs 70
Table VI: Robustness tests 74
Table VII: Comparison of the firms' and home-country's attributes before and after
SOX 76
Table VIII: Structural change: multinomial logit estimations before and after the enactment of
Sarbanes-Oxley Act 77
Chapter 3: International Cross-Listings and Subsequent Security-Market
Choices: Evidence from ADRs
Table I: Equity and debt issues before and after ADR listings 124
Table II: Types of equity issues 126
Table III: The location of equity issues one year after ADR listings .127
Table IV: Debt issues one year after ADR listings 128
Table V: Emerging market firms and their developed market counterparts 129 Table VI: Security issues before and after SOX 131 Table VII: Multivariate analysis: Equity issues following ADR listings 133 Table VIII: The choice between primary and secondary equity issues 135 Table IX: Public equity issues on U.S. markets by Level III ADR firms 136 Table X: Multivariate analysis: Debt issues following ADR listings 137
Table XI: Debt issues' locations 139 Table XII: Debt and equity issues within one year before and after ADR listings 140
X
Liste des figures
Chapter 1: ADR listings: an overview
Figure 1: Capital raised using ADRs 17
Figure 2: The largest ADR investors 17
Figure 3: Value of ADRs held by the largest ADR investors 18
Figure 4: Issuers with the most widely held ADRs 18
xi
Liste des annexes
Chapter 2: The Choice of ADRs
Appendix 1: Variables, definitions, and sources 80
Appendix 2: Distribution of ADRs by country of origin 81
Chapter 3: International Cross-Listings and Subsequent Security-Market
Choices: Evidence from ADRs
Appendix 1: Distribution of ADRs by country of origin 141
Appendix 2: The evolution of security issues through time 143
Appendix 3: The location of equity issues one year after ADR listings 145
Appendix 4: Debt issues one year after ADR listings 147
Liste des abréviations
ADR: American Depository Receipts
AMEX: American Stock Exchange
BNY: Bank of New York
CB: Citibank
CUSIP: Committee on Uniform Securities Identification Procedures
DB: the Deutsche Bank
GDP: Gross Domestic Product
UB/E/S: Institutional Brokers' Estimate System
IIA: Independence of Irrelevant Alternatives
IID: Independently and Identically Distributed
ISIN: International Securities Identification Number
JPM: JP Morgan
LSE: London Stock Exchange
NASDAQ: Association of Securities Dealers Automated Quotation System
NYSE: New York Stock Exchange
OTC: Over The Counter
xii
PORTAL: Automated Linkages
QIBs: Qualified Institutional Buyers
SDC: Securities Data Company
SEC: US Securities and Exchange Commission
SOX: Sarbanes-Oxley Act
U.K.: United Kingdom
U.S. GAAP: Generally Accepted Accounting Principles in the United States
U.S.: United States

À mes chers parents, pour leurs sacrifices;
À ma soeur et mes deux frères, pour leurs encouragements;
À ma fiancée, pour son soutien et sa patience;
À tous celles et ceux qui m'ont aidé à accomplir ce travail;
xiv
XV
Remerciements
Je tiens à remercier chaleureusement mes deux co-directeurs, Professeure Narjess
Boubakri et Professeur Jean-Claude Cosset pour tout le temps qu'ils m'ont accordé, pour
leurs soutiens continus et pour leurs conseils judicieux tout au long de mes années de
thèse.
Je remercie aussi les membres de mon comité de thèse : Professeure Usha Mittoo,
Professeur Sergei Sarkissian, Professeur François Leroux et Professeur Martin Coiteux.
Je remercie tous mes professeurs au Canada et en Tunisie qui m'ont permis de bien
réussir mes études et d'atteindre mes objectifs. Je remercie aussi Professeur Iwan Meier,
Professeur Moez Bennouri, Martine Cymon et Lise Cloutier-Delage pour leurs aides.
Je tiens également à remercier la Mission Universitaire de la Tunisie an Amérique du
Nord et le Ministère de l'Enseignement Supérieur, de la Recherche Scientifique et de
Technologie pour le soutien financier qu'ils m'ont offert pour mes études doctorales. Je
remercie aussi le Fonds Québécois de la Recherche sur la Société et la Culture, la
direction des programmes de M.Sc. et de Ph. D. et le Centre de Recherche en E-Finance
pour leurs financements.
Je remercie aussi tous mes amis qui m'ont encouragé tout au long de ce processus
difficile. En particulier, je tiens à remercier Oussama, Abdellatif, Moez, Faudhel,
Houda, Walid et Amine pour leurs présences et leurs amitiés.
Je tiens à exprimer ma gratitude envers ma chère mère Souad et mon cher père Youssef
pour tous leurs sacrifices et leurs amours infinis. Je remercie vivement ma soeur Jihène,
mes deux frères Nizar et Wassim, mon beau-frère Mongi et ma belle-sœur Itidel qui
xvi
m'ont toujours offert leurs supports et leurs encouragements. Je remercie aussi
chaleureusement ma fiancée Sameh pour son soutien continu et sa patience ainsi que
toute sa famille pour leurs encouragements. Aussi, je remercie toute ma famille, en
particulier mon oncle Moncef, pour leurs soutiens.
Finalement, je remercie Dieu de m'avoir donné la force, la patience et le courage pour
accomplir ce rêve.

Introduction générale
2
La dernière décennie a été caractérisée par un flux important de listings croisés des
firmes étrangères sur les marchés américains par l'émission de certificats de dépôts
s'intitulant les American Depository Receipts (dorénavant ADRs), ce qui a favorisé la
globalisation et l'intégration des marchés financiers. De plus, en 2002, le cadre légal,
régissant ces ADRs, a connu un changement majeur suite à l'introduction de la loi
Sarbanes-Oxley (dorénavant SOX) qui vise essentiellement l'amélioration de la
protection des investisseurs minoritaires. Étant donné l'importance de ces ADRs aussi
bien pour les marchés financiers et les investisseurs que pour les firmes émettrices, cette
thèse essaye d'apporter des réponses aux deux problématiques présentées ci-dessous.
Cette thèse est composée de trois volets : le premier volet introduit les ADRs et présente
les mécanismes liés à l'émission de ces certificats de dépôts. Ensuite, dans ce volet, nous
présentons une revue de la littérature qui examine les motivations derrière le choix
d'entreprendre un listing croisé. Finalement, nous présentons la question de recherche et
la contribution de la thèse à la littérature.
Une fois qu'une entreprise étrangère décide de se lister sur le marché américain via les
ADRs, elle a le choix entre quatre programmes différents (programme I, II, III et Règle
144A). Ces programmes différent essentiellement à deux niveaux : (a) la possibilité de
lever des capitaux sur les marchés américains et (b) la conformité avec les lois
comptables et de gouvernance américaines. Ainsi, le choix d'un programme spécifique
dépend étroitement des caractéristiques et des objectifs de la firme. De ce fait, le
deuxième volet de la thèse examinera les déterminants (au niveau de la firme et de son
pays d'origine) du choix d'un programme particulier d'ADR. De plus, dans ce volet,
3
nous examinerons l'impact de SOX sur le choix des quatre programmes d'ADRs
disponibles.
Après leur émission d'ADRs, les firmes accroissent leurs levées de capitaux. Bien que
certaines études récentes aient apporté quelques éclaircissements sur les levées de
capitaux subséquentes à l'émission d'ADRs, quelques questions demeurent sans
réponses. Par exemple : (1) quels sont les déterminants d'émettre des capitaux propres
ou de la dette après l'émission d'ADRs par les firmes étrangères? (2) où est-ce que ces
firmes vont-elles lever ces capitaux? (3) quels sont les déterminants des émissions
primaires et secondaires des capitaux propres? (4) quel a été l'impact de SOX sur ces
décisions de financement? Les réponses à ces questions feront l'objet du troisième volet
de la thèse.
Chapter 1:
ADR Listings: an Overview
5
1. Introduction
In this chapter of the thesis, we firstly define American Depositary Receipts (ADRs)
and then we present the different types of ADR. The issuance and the cancellation of
ADRs follow and then we present the benefits of ADRs to investors. After that, we
briefly present a literature review that examines the motives to cross-list abroad.
Finally, we present the research question and the contribution of this thesis.
2. An overview of American Depositary Receipts
2.1. What are American Depositary Receipts?
Non-U.S. firms can cross-list on U.S. markets via a direct listing, New York Registered
Shares, or American Depositary Receipts (ADRs). Contrary to the other types of U.S.
cross-listings, ADRs attract firms that originate from a wide array of developed and
developing countries. ADRs are dollar-denominated negotiable certificates that
represent a non-U.S. company's publicly traded equity or debt. Each issued ADR
represents a fraction or a multiple of the underlying share held in custody in the foreign
firm's home market, which is called the ratio. Ratios vary based on the share price of
the underlying share and the U.S. share price of U.S. companies in the same industry.
An ADR can be sponsored or unsponsored. A sponsored ADR is issued with the
agreement and the approval of the underlying firm which works with a designated
depositary bank. However, an unsponsored ADR is issued in accordance with the
market demand and without the agreement of the underlying firm. Since 1980, new
ADR programs listed on the major U.S. exchanges must be sponsored.
6
2.2. Types of American Depositary Receipts
There are four types of ADRs: Level I, Level II, Level III, and Rule 144A. Level II and
Level III ADRs can be traded on the New York Stock Exchange (NYSE), the National
Association of Securities Dealers Automated Quotation System (NASDAQ), or the
American Stock Exchange (AMEX). Level I ADRs are traded Over The Counter
(OTC) 1 , while Rule 144A ADRs, that are initially sold as a private placement, are
traded through Automated Linkages (PORTAL) among Qualified Institutional Buyers
(QI:13s). Levels II and III are listed programs, whereas Level I and Rule 144A are
unlisted programs.
The four types of ADRs have different features that allow different benefits and
mandate different costs. In what follows, we briefly present the main differences:
• Raising capital on U.S. markets: only Level III and Rule 144A ADRs allow
foreign firms to raise equity capital on U.S. markets. Level III programs tap public
investors, while Rule 144A programs aim at QIB, which are institutional investors.
• Disclosure and accounting standards: Level III and Level II programs mandate
full and partial reconciliation with U.S. Generally Accepted Accounting principles
(GAAP), respectively. However, Level I and Rule 144A require only home
markets' reconciliation.
• U.S. reporting requirements: only Levels II and III ADRs are required to fil
Form 20-F, while Level I and Rule 144A are exempt from filling this form. This
'In March 2006, a new trading platform for Level I ADRs, named international OTCQX, was also offered to foreign firms that are considering listing on OTC or the U.K. Source: Alternative Investment Market, Cromwell Coulson, president and CE0 of Pink Sheet LLC (OTCQX website: www.otcqx.com).
7
form contains wide information such as the names of major shareholders and
related party transactions along with financial information in accordance with U.S.
GAAP.
• Sarbanes-Oxley Act: the enactment of the Sarbanes-Oxley Act (SOX) in 2002
introduced more stringent and costly corporate govemance requirements for the
firms listed on major U.S. exchanges, including foreign firms that are listed on
NYSE, NASDAQ, and AMEX. Levels II and III ADR firms have to comply with
SOX requirements, while Level I and Rule 144A are exempt from these
requirements.
2.3. Issuance and cancellation of American Depositary Receipts
ADRs are created following a U.S. investors' decision to purchase a non-U.S.
company's share. Brokers then purchase the underlying shares on the company's home
market and request that the shares be delivered to the depositary bank's custodian in
that country. The broker who initiated the transaction will convert the U.S. dollars
received from the investor into the corresponding foreign currency and then pay the
local broker for the shares purchased. This consists in issuing a new ADR. However,
brokers can also obtain ADRs by purchasing existing ones, which is flot a new issuance.
Once ADRs are issued, they are traded on U.S. markets like the other U.S. securities
and they can be freely sold to other investors.
To sel! their ADRs, U.S. investors notify their broker who can sell the ADR in the U.S.
markets or sell the shares outside the U.S., typically into the company's home market
8
through a cross-border transaction. When the broker sells the underlying shares in the
company's home market, the depositary bank will cancel the ADR.
2.4. Benefits of American Depositary Receipts to investors
Low correlations between U.S. and foreign equities lead to international diversification
benefits that have been emphasized by previous studies (e.g., Errunza, 1997; DeSantis
and Gerard, 1997). However, due to the increasing number of ADRs that are traded on
U.S. markets, U.S. investors can benefit from international diversification without
trading in foreign assets that trade in the home markets (Errunza et al., 1999).
Increasingly, U.S. investors tend to diversify their portfolios internationally and are not
obliged to trade abroad to achieve the diversification benefits as ADRs offer these
investors the diversification benefits without bearing additional foreign exchange and
information risks. In addition, ADRs' quotations are in U.S. dollars and dividends are
also paid in U.S. dollars. Moreover, ail financial information is available in English and
is in accordance with U.S. requirements (only for ADR firms listed on major U.S.
exchanges).
2.5. ADRs' market
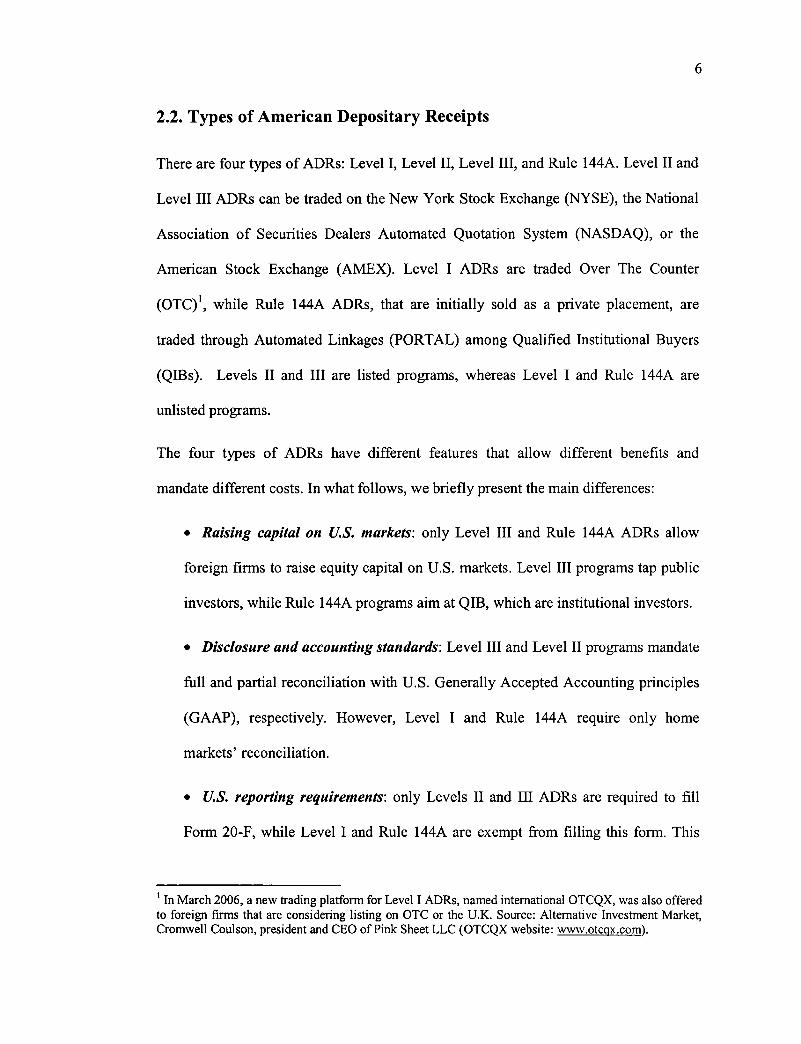
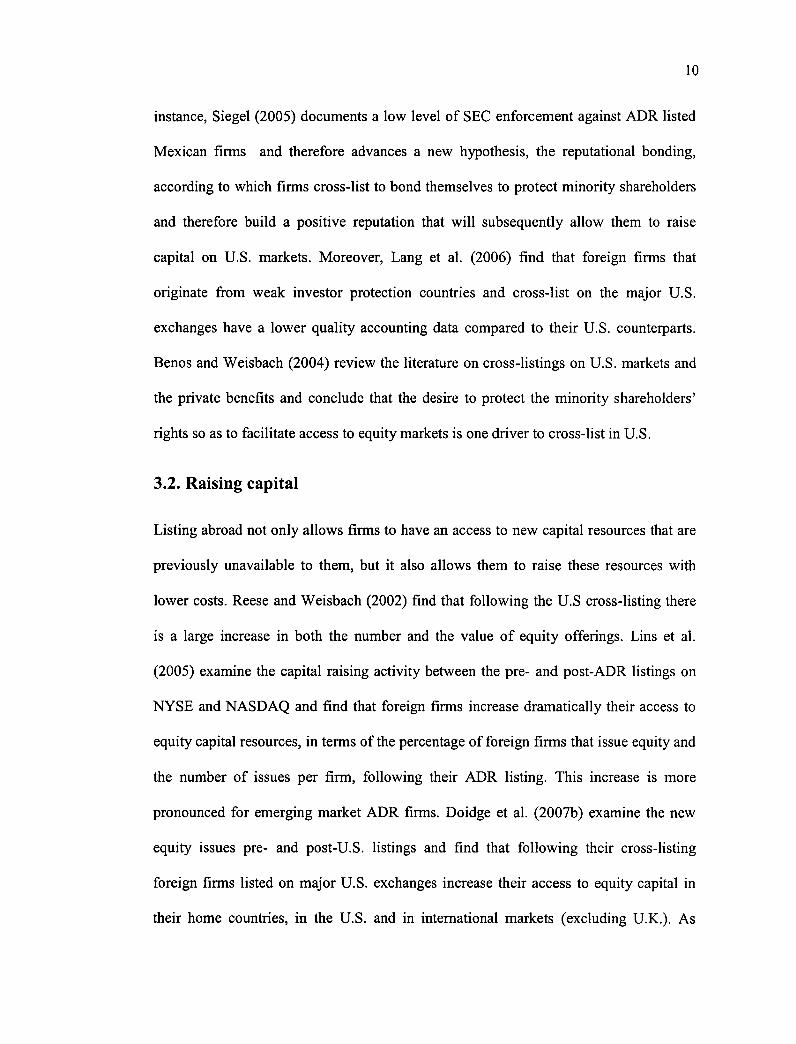
As emphasized in the literature, raising capital on U.S. markets is one motive to list
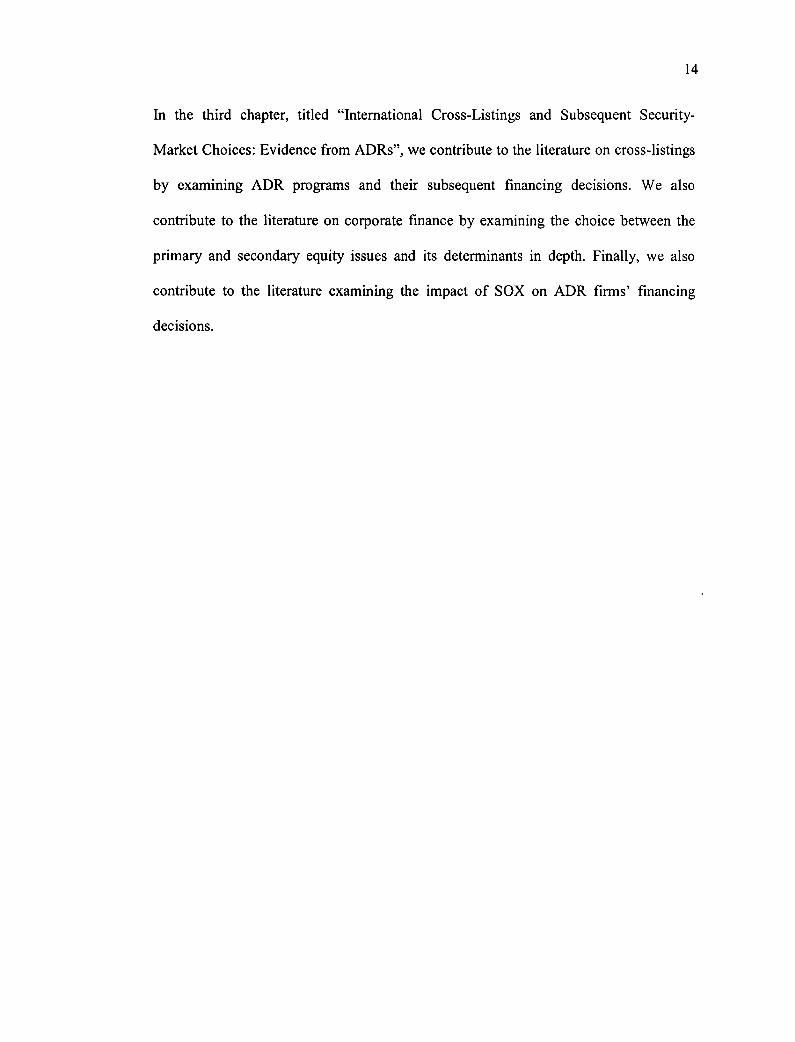
abroad. Figure 1 shows that ADR firms raise substantial amounts of capital following
their listing. Indeed, the capital raised by ADR firms has increased from $11.7 billion in
1995 to $30 billion in 2000 and to $57.3 billion in 2007.
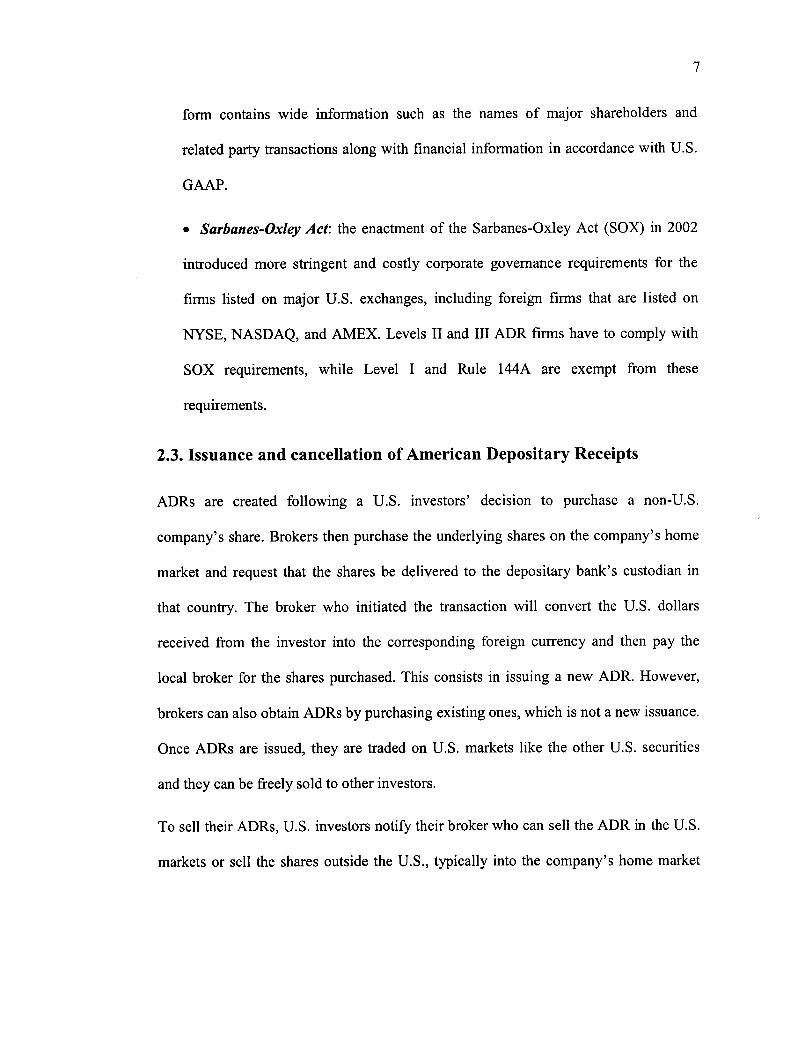
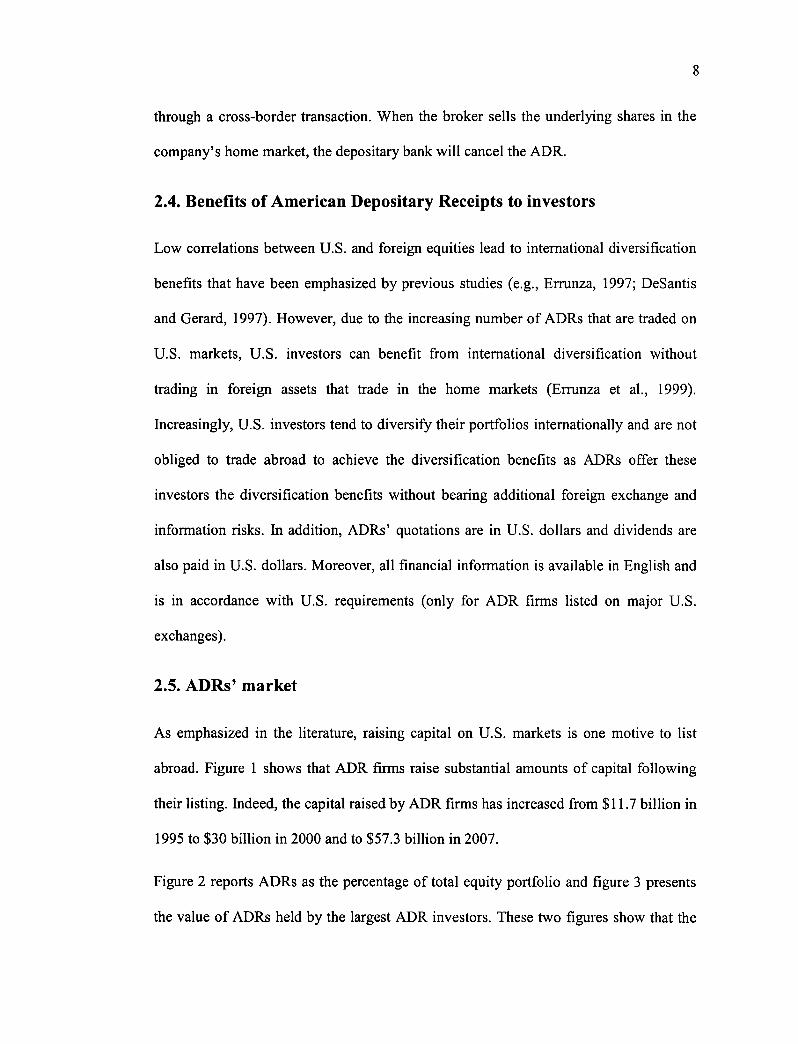
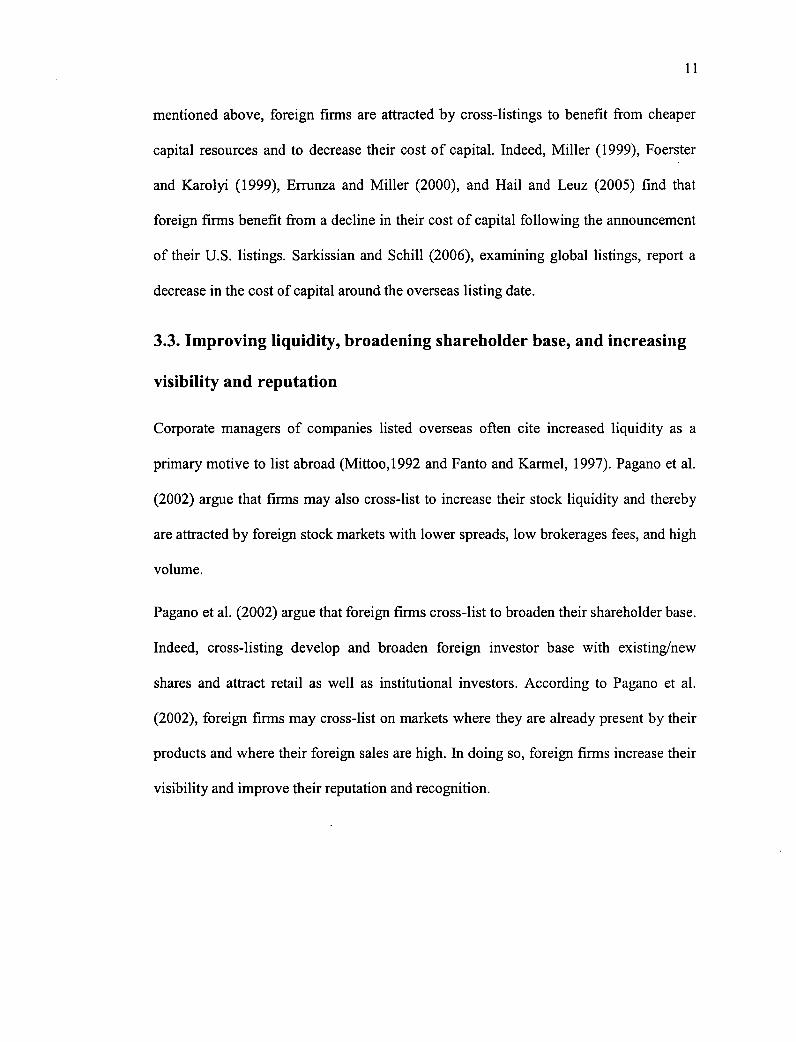
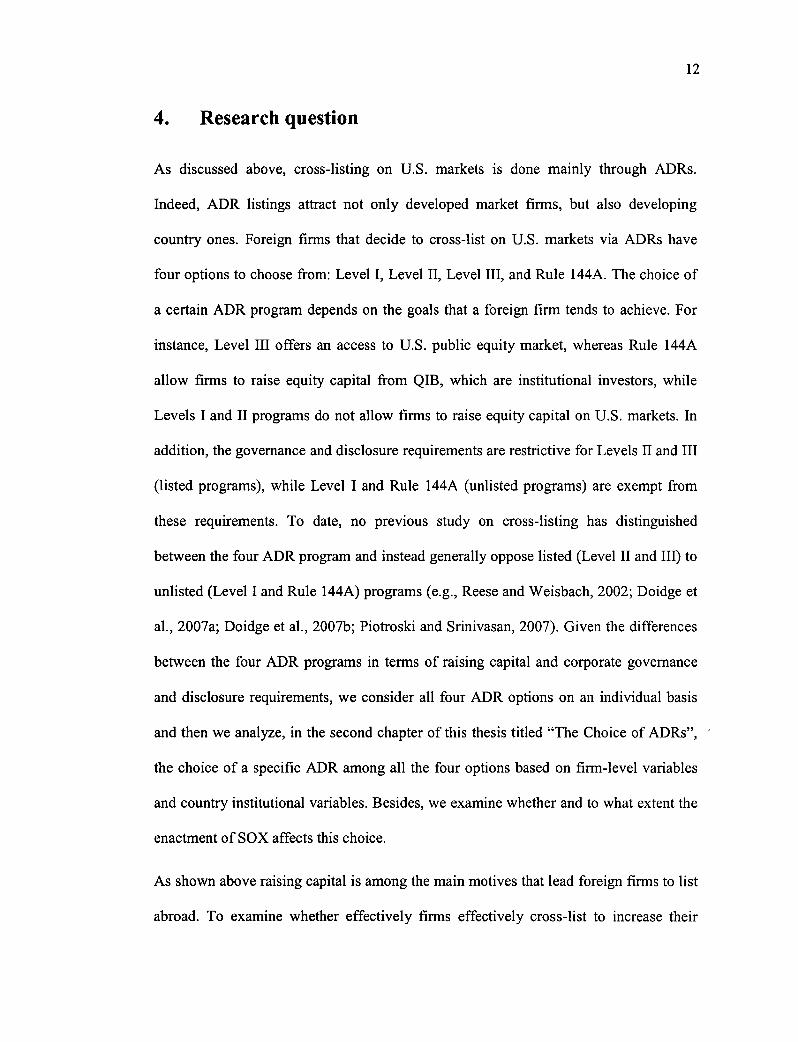
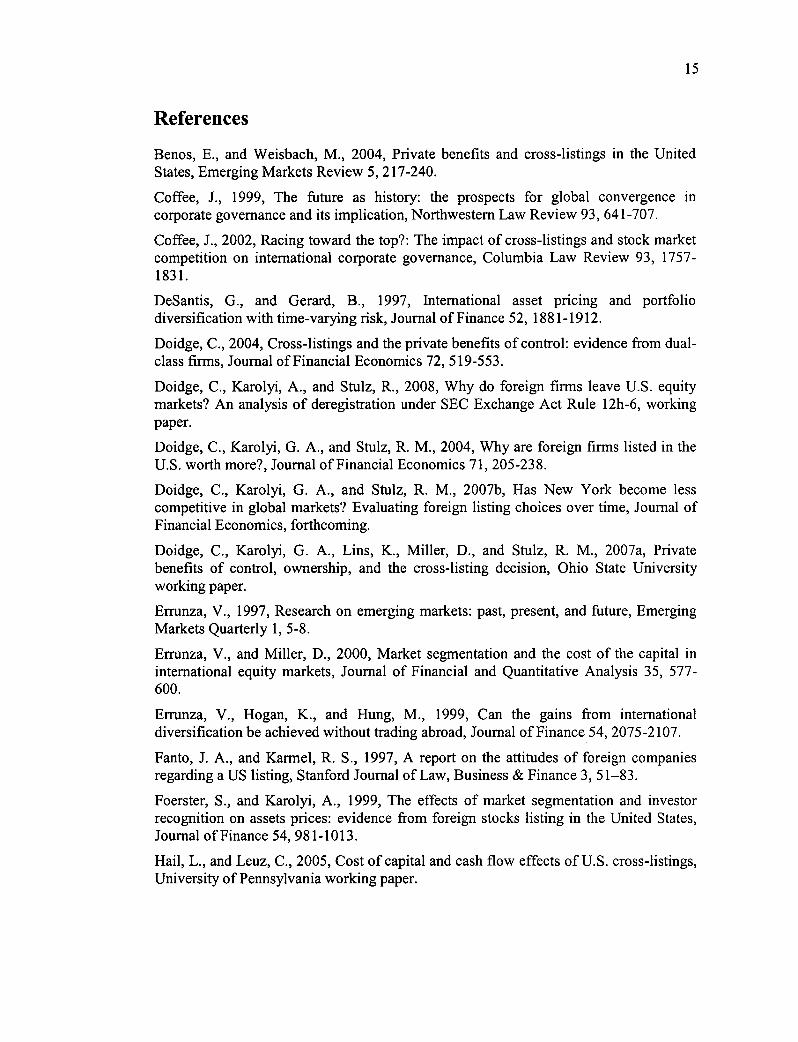
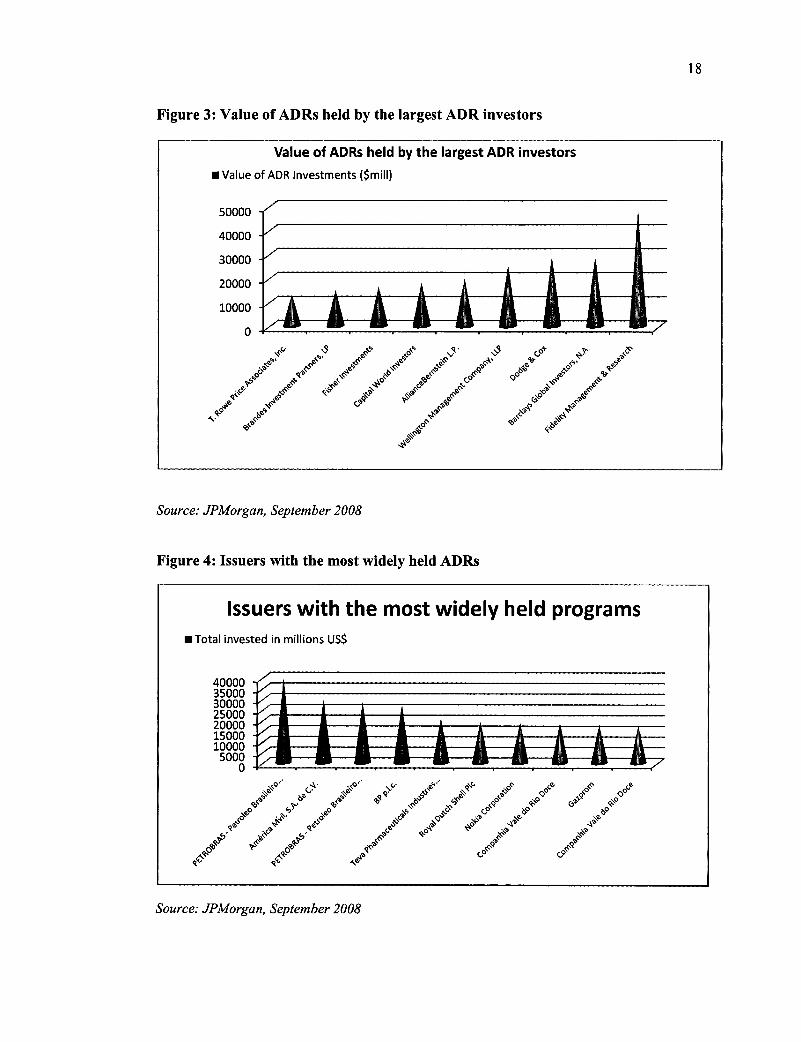
Figure 2 reports ADRs as the percentage of total equity portfolio and figure 3 presents
the value of ADRs held by the largest ADR investors. These two figures show that the
9
largest ADR investors hold a substantial amount and a significant percentage of ADRs
in their equity portfolios.
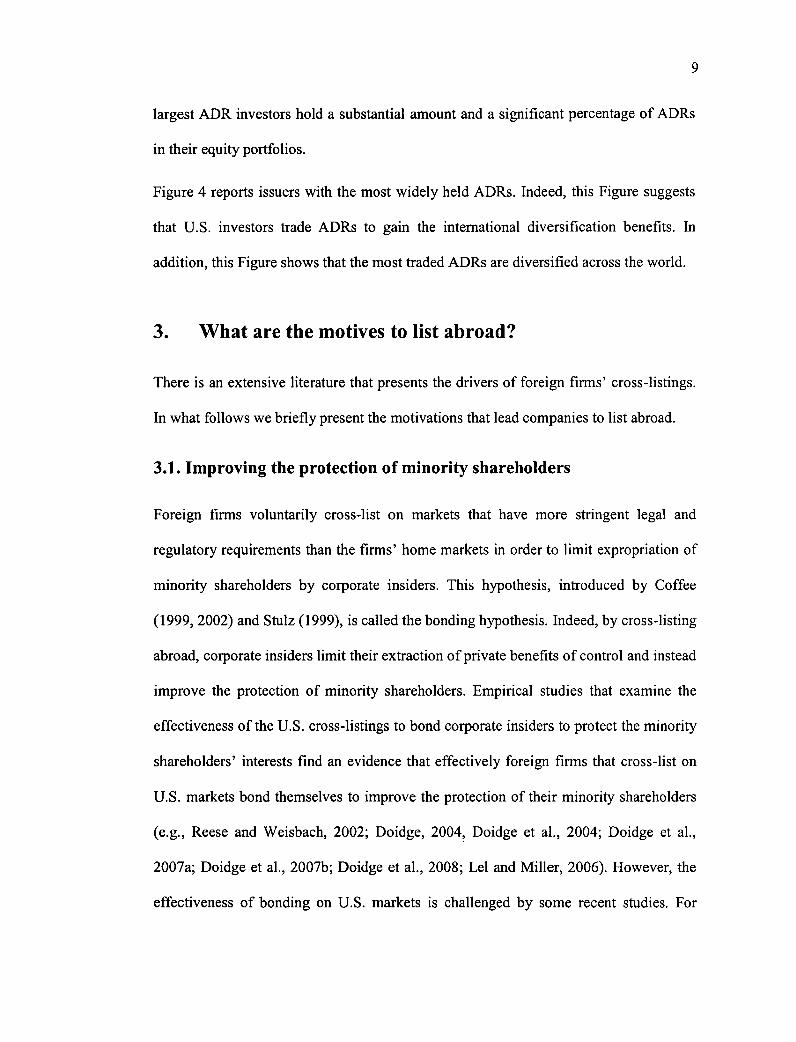
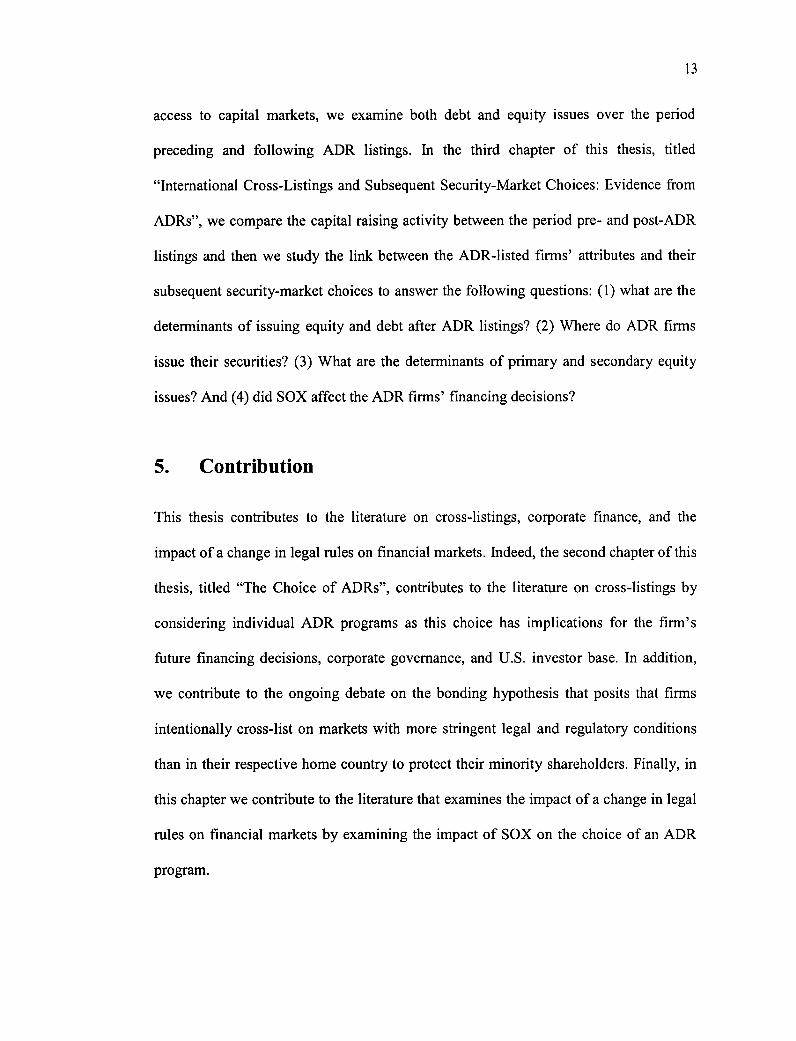
Figure 4 reports issuers with the most widely held ADRs. Indeed, this Figure suggests
that U.S. investors trade ADRs to gain the international diversification benefits. In
addition, this Figure shows that the most traded ADRs are diversified across the world.
3. What are the motives to list abroad?
There is an extensive literature that presents the drivers of foreign firms' cross-listings.
In what follows we briefly present the motivations that lead companies to list abroad.
3.1. Improving the protection of minority shareholders
Foreign firms voluntarily cross-list on markets that have more stringent legal and
regulatory requirements than the firms' home markets in order to limit expropriation of
minority shareholders by corporate insiders. This hypothesis, introduced by Coffee
(1999, 2002) and Stulz (1999), is called the bonding hypothesis. Indeed, by cross-listing
abroad, corporate insiders limit their extraction of private benefits of control and instead
improve the protection of minority shareholders. Empirical studies that examine the
effectiveness of the U.S. cross-listings to bond corporate insiders to protect the minority
shareholders' interests find an evidence that effectively foreign firms that cross-list on
U.S. markets bond themselves to improve the protection of their minority shareholders
(e.g., Reese and Weisbach, 2002; Doidge, 2004, Doidge et al., 2004; Doidge et al.,
2007a; Doidge et al., 2007b; Doidge et al., 2008; Lei and Miller, 2006). However, the
effectiveness of bonding on U.S. markets is challenged by some recent studies. For
10
instance, Siegel (2005) documents a low level of SEC enforcement against ADR listed
Mexican firms and therefore advances a new hypothesis, the reputational bonding,
according to which firms cross-list to bond themselves to protect minority shareholders
and therefore build a positive reputation that will subsequently allow them to raise
capital on U.S. markets. Moreover, Lang et al. (2006) find that foreign firms that
originate from weak investor protection countries and cross-list on the major U.S.
exchanges have a lower quality accounting data compared to their U.S. counterparts.
Benos and Weisbach (2004) review the literature on cross-listings on U.S. markets and
the private benefits and conclude that the desire to protect the minority shareholders'
rights so as to facilitate access to equity markets is one driver to cross-list in U.S.
3.2. Raising capital
Listing abroad not only allows firms to have an access to new capital resources that are
previously unavailable to them, but it also allows them to raise these resources with
lower costs. Reese and Weisbach (2002) find that following the U.S cross-listing there
is a large increase in both the number and the value of equity offerings. Lins et al.
(2005) examine the capital raising activity between the pre- and post-ADR listings on
NYSE and NASDAQ and find that foreign firms increase dramatically their access to
equity capital resources, in terms of the percentage of foreign firms that issue equity and
the number of issues per firm, following their ADR listing. This increase is more
pronounced for emerging market ADR firms. Doidge et al. (2007b) examine the new
equity issues pre- and post-U.S. listings and find that following their cross-listing
foreign firms listed on major U.S. exchanges increase their access to equity capital in
their home countries, in the U.S. and in international markets (excluding U.K.). As
11
mentioned above, foreign firms are attracted by cross-listings to benefit from cheaper
capital resources and to decrease their cost of capital. Indeed, Miller (1999), Foerster
and Karolyi (1999), Errunza and Miller (2000), and Hail and Leuz (2005) find that
foreign firms benefit from a decline in their cost of capital following the announcement
of their U.S. listings. Sarkissian and Schill (2006), examining global listings, report a
decrease in the cost of capital around the overseas listing date.
3.3. Improving liquidity, broadening shareholder base, and increasing
visibility and reputation
Corporate managers of companies listed overseas often cite increased liquidity as a
primary motive to list abroad (Mittoo,1992 and Fanto and Karmel, 1997). Pagano et al.
(2002) argue that firms may also cross-list to increase their stock liquidity and thereby
are attracted by foreign stock markets with lower spreads, low brokerages fees, and high
volume.
Pagano et al. (2002) argue that foreign firms cross-list to broaden their shareholder base.
Indeed, cross-listing develop and broaden foreign investor base with existing/new
shares and attract retail as well as institutional investors. According to Pagano et al.
(2002), foreign firms may cross-list on markets where they are already present by their
products and where their foreign sales are high. In doing so, foreign firms increase their
visibility and improve their reputation and recognition.
12
4. Research question
As discussed above, cross-listing on U.S. markets is done mainly through ADRs.
Indeed, ADR listings attract flot only developed market firms, but also developing
country ones. Foreign firms that decide to cross-list on U.S. markets via ADRs have
four options to choose from: Level I, Level II, Level III, and Rule 144A. The choice of
a certain ADR program depends on the goals that a foreign firm tends to achieve. For
instance, Level III offers an access to U.S. public equity market, whereas Rule 144A
allow firms to raise equity capital from QIB, which are institutional investors, while
Levels I and II programs do flot allow firms to raise equity capital on U.S. markets. In
addition, the govemance and disclosure requirements are restrictive for Levels II and III
(listed programs), while Level I and Rule 144A (unlisted programs) are exempt from
these requirements. To date, no previous study on cross-listing has distinguished
between the four ADR program and instead generally oppose listed (Level II and III) to
unlisted (Level I and Rule 144A) programs (e.g., Reese and Weisbach, 2002; Doidge et
al., 2007a; Doidge et al., 2007b; Piotroski and Srinivasan, 2007). Given the differences
between the four ADR programs in terms of raising capital and corporate govemance
and disclosure requirements, we consider all four ADR options on an individual basis
and then we analyze, in the second chapter of this thesis titled "The Choice of ADRs",
the choice of a specific ADR among ail the four options based on firrn-level variables
and country institutional variables. Besides, we examine whether and to what extent the
enactment of SOX affects this choice.
As shown above raising capital is among the main motives that lead foreign firms to list
abroad. To examine whether effectively firms effectively cross-list to increase their
13
access to capital markets, we examine both debt and equity issues over the period
preceding and following ADR listings. In the third chapter of this thesis, titled
"International Cross-Listings and Subsequent Security-Market Choices: Evidence from
ADRs", we compare the capital raising activity between the period pre- and post-ADR
listings and then we study the link between the ADR-listed firms' attributes and their
subsequent security-market choices to answer the following questions: (1) what are the
determinants of issuing equity and debt after ADR listings? (2) Where do ADR firms
issue their securities? (3) What are the determinants of primary and secondary equity
issues? And (4) did SOX affect the ADR firms' financing decisions?
5. Contribution
This thesis contributes to the literature on cross-listings, corporate finance, and the
impact of a change in legal rules on financial markets. Indeed, the second chapter of this
thesis, titled "The Choice of ADRs", contributes to the literature on cross-listings by
considering individual ADR programs as this choice has implications for the firm' s
future financing decisions, corporate govemance, and U.S. investor base. In addition,
we contribute to the ongoing debate on the bonding hypothesis that posits that firms
intentionally cross-list on markets with more stringent legal and regulatory conditions
than in their respective home country to protect their minority shareholders. Finally, in
this chapter we contribute to the literature that examines the impact of a change in legal
rules on financial markets by examining the impact of SOX on the choice of an ADR
program.
14
In the third chapter, titled "International Cross-Listings and Subsequent Security-
Market Choices: Evidence from ADRs", we contribute to the literature on cross-listings
by examining ADR programs and their subsequent financing decisions. We also
contribute to the literature on corporate finance by examining the choice between the
primary and secondary equity issues and its determinants in depth. Finally, we also
contribute to the literature examining the impact of SOX on ADR firms' financing
decisions.
15
References Benos, E., and Weisbach, M., 2004, Private benefits and cross-listings in the United States, Emerging Markets Review 5, 217-240.
Coffee, J., 1999, The future as history: the prospects for global convergence in corporate governance and its implication, Northwestern Law Review 93, 641-707.
Coffee, J., 2002, Racing toward the top?: The impact of cross-listings and stock market competition on international corporate governance, Columbia Law Review 93, 1757- 1831. DeSantis, G., and Gerard, B., 1997, International asset pricing and portfolio diversification with time-varying risk, Journal of Finance 52, 1881-1912.
Doidge, C., 2004, Cross-listings and the private benefits of control: evidence from dual-class firms, Journal of Financial Economics 72, 519-553.
Doidge, C., Karolyi, A., and Stulz, R., 2008, Why do foreign firms leave U.S. equity markets? An analysis of deregistration under SEC Exchange Act Rule 12h-6, working paper. Doidge, C., Karolyi, G. A., and Stulz, R. M., 2004, Why are foreign firms listed in the U.S. worth more?, Journal of Financial Economics 71, 205-238. Doidge, C., Karolyi, G. A., and Stulz, R. M., 2007b, Has New York become less competitive in global markets? Evaluating foreign listing choices over time, Journal of Financial Economics, forthcoming.
Doidge, C., Karolyi, G. A., Lins, K., Miller, D., and Stulz, R. M., 2007a, Private benefits of control, ownership, and the cross-listing decision, Ohio State University working paper.
Errunza, V., 1997, Research on emerging markets: past, present, and future, Emerging Markets Quarterly 1, 5-8. Errunza, V., and Miller, D., 2000, Market segmentation and the cost of the capital in international equity markets, Journal of Financial and Quantitative Analysis 35, 577- 600.
Errunza, V., Hogan, K., and Hung, M., 1999, Can the gains from international diversification be achieved without trading abroad, Journal of Finance 54, 2075-2107.
Fanto, J. A., and Karmel, R. S., 1997, A report on the attitudes of foreign companies regarding a US listing, Stanford Journal of Law, Business & Finance 3, 51-83.
Foerster, S., and Karolyi, A., 1999, The effects of market segmentation and investor recognition on assets prices: evidence from foreign stocks listing in the United States, Journal of Finance 54, 981-1013.
Hail, L., and Leuz, C., 2005, Cost of capital and cash flow effects of U.S. cross-listings, University of Pennsylvania working paper.
16
Lang, M., Raedy, J., and Wilson, W., 2006, Earnings management and cross-listing: Are reconciled earnings comparable to US earnings?, Journal of Accounting and Economics 42, 255-283.
Lel, U., and Miller, D., 2006, International Cross-listing, Firm Performance and Top Management Turnover: A Test of the Bonding Hypothesis, Journal of Finance, forthcoming.
Lins, K., Strickland, D., and Zenner, M., 2005, Do non-U.S. firms issue equity on U.S. exchanges to relax capital constraints?, Journal of Financial and Quantitative Analysis 40, 109-133.
Miller, D., 1999, The market reaction to international cross-listing: Evidence from depositary receipts, Journal of Financial Economics 51, 103-123.
Mittoo, U., 1992, Managerial perceptions of the net benefits of foreign listing; Canadian evidence, Journal of International Financial Management and Accounting 4, 40-62.
Pagano, M. Roel, A., and Zechner, J., 2002, The geography of equity listing: why do companies list abroad?, Journal of Finance 57, 2651-2694.
Piotroski, J., and Srinivasan, S., 2007, The Sarbanes-Oxley Act and the flow of international listings, University of Chicago working paper.
Reese, W., and Weisbach, M., 2002, Protection of minority shareholder interests, cross-listings me the United States, and subsequent equity offerings, Journal of Financial Economics 66, 65-104.
Sarkissian, S., and Schill, M. 2006, Are there permanent valuation gains to overseas listing? Evidence from market sequencing and selection, Review of Financial Studies, forthcoming.
Siegel, J., 2005, Can foreign firms bond themselves effectively by submitting to U.S. law?, Journal of Financial Economics 75, 319-360.
Stulz, R., 1999, Globalization of equity markets and the cost of capital, Journal of Applied Corporate Finance 12, 8-25.
Capital raised using ADRs
1995 1996 1997 1998 1999 2000 2001 2002 2003 2004 2005 2006 2007
60
40
20
• US$ volume in billions
42% 43%
26%
17
Figure 1: Capital raised using ADRs
Source: JPMorgan, September 2008
Figure 2: The largest ADR investors
The largest ADR investors • ADRs as a percentage of total equity portfolio
50% 40% 30% 20%
5% 6% 10% 6% 8% 0%
_, le c• ,ce' g • e« <, ■.: r ‘...e,' ••le" , c's ee ..,e, ,.•
4-e.e. e") ->‘ CP e 4P6b. é e 0,.s.- g* 1> il,s.' e e .,‘,.' e & ,
„,• ,‹e Ç\C" (`•
e .4e Ass e
, e
é oe- .0 A., ..., ..e.
(.7,- ,..., ,(s çc, <,,$) .çs of .cs.s, ç, ,..- g,'" • _..., g•
e- e c, • 62'
9% 9%
•‘..")
Source: JPMorgan, September 2008
Value of ADRs held by the largest ADR investors Value of ADR lnvestments ($mill)
50000 Y
40000 -/
30000 -7
20000 -V
10000 -V
0
vq . e- _« e e nee (y 0- .e• re' \-e°
q / et gs, a. «;e1 " e 0
<be
'
44,e/ eie" oçe oge •e' e e 5,Q 4.„.
ARP
'se q 9 ee oe
, ,... e
çte . b,) ee ,f` - e
e e eq-
ee ., ..,,e` e' ee , +e
,,,,,, %. e .<b e'e e e
0 (5, „ze
18
Figure 3: Value of ADRs held by the largest ADR investors
Source: JPMorgan, September 2008
Figure 4: Issuers with the most widely held ADRs
lssuers with the most widely held programs • Total invested in millions US$
40000 35000 30000 25000 20000
15000 -V
10000 -7 5000 -7
0
Source: JPMorgan, September 2008
Chapter 2:
The Choice of ADRs
The Choice of ADRs
20
Abstract
We study the determinants of a firm's decision to issue one of the four available ADR programs (Level I, Level II, Level III, and Rule 144A). We find that the firm's attributes (size, income, asset growth, leverage, privatization, ownership structure, and country-of-origin) and the firm's home-country institutional variables (accounting rating and legal protection of minority shareholders) condition this choice. We also examine the issuing activity and the determinants of the ADR choice before and after the enactment of the Sarbanes-Oxley (SOX) Act. Following this structural change, we provide evidence of a reallocation between ADR programs. Compared to the pre-SOX period, firms from emerging markets, and those from countries with weak legal protection of minority shareholders, are more likely after SOX to choose Rule 144A and Level III, respectively.
JEL: G15, G32, G34, KOO
Keywords: ADR; bonding; governance; Sarbanes-Oxley Act
21
1. Introduction
Cross-listings on U.S. markets have become a major phenomenon over the past two
decades (Karolyi, 2006). These cross-listings can be achieved via a direct listing, New
York Registered shares, global registered shares, or American Depositary Receipts
(ADRs). Firms that cross-list under ADR programs corne from a wide array of
developed and developing countries, while those under direct cross-listing are mostly
Canadian. I Focusing on ADRs thus allows us to bring to light the impact of home-
country variables on the cross-listing decision.
Any firm that cross-lists via an ADR has basically four options to choose from: Level I,
Level II, Level III, and Rule 144A programs, ail of which have distinct attributes. For
instance, Level III and Rule 144A offer an access to U.S. primary capital markets (i.e.,
raising capital), whereas Levels I and II allow an access to U.S. secondary markets only.
Moreover, the governance and disclosure requirements vary across the four ADR
programs, and are more restrictive in Levels II and III (listed programs) than in Level I
and Rule 144A (unlisted programs). Pater the enactment of the Sarbanes-Oxley Act
(SOX hereafter) in 2002, these governance and disclosure requirements have become
more stringent and costly for listed firms, U.S. and foreign alike. Finally, Rule 144A
allows foreign firms to target only U.S. private institutional investors, while Levels I, II,
and III give access to public as well as private U.S. investors.
I Karolyi (2006) reports that in 2003 the United Kingdom, Australia, and Japan accounted for 17%, 10%, and 6% of the ADR listings in U.S., while, South Africa, Mexico, and Brazil, were respectively home to 6%, 5%, and 4% of the firms issuing ADRs. In the same year, ADRs accounted for 73.2% of the U.S. cross-listings.
22
The main objectives of this paper are twofold: first, we analyze the choice of a specific
ADR among ail four options. Second, we examine whether, and to what extent, the
enactment of SOX affects such a choice.
In the first part of the analysis, we specifically examine the choice of a particular ADR
based on firm-level variables (financial characteristics, governance, and ownership
structure) and home-country institutional variables. To date, no previous study on cross-
listing has distinguished between the four different ADRs. Instead, available studies
generally oppose listed to unlisted programs (e.g., Reese and Weisbach, 2002; Doidge et
al., 2007a; Doidge et al., 2007b; Piotroski and Srinivasan, 2007). Distinguishing among
ADR programs according to their listed/unlisted nature is important, but does flot take
into account other differences that exist within these two categories. For instance, within
unlisted programs, Rule 144A (private placements) provides access to primary U.S.
capital markets, while Level I does not. Similarly, within listed programs, Level II
provides no access to primary capital markets, while Level III does so through public
offerings. These differences will naturally condition the choice of a particular ADR, and
we consequently consider ail four options on an individual basis.
The choice of a specific ADR is of primary importance for both practical and theoretical
grounds: In practice, this choice has implications for the firm's future financing
decisions, corporate governance, and U.S. investor base: More precisely, (1) it affects
the firm's access to U.S. capital (i.e., its financing decision) by private placements (Rule
144A) or public offerings (Level III). (2) The choice of a particular ADR (listed versus
unlisted) also affects the firm's corporate governance, as listed programs (i.e., Level II
or Level III) commit the firms to higher governance, disclosure, and accounting
standards. (3) Moreover, by choosing Levels I, II, and III, foreign firms develop and
23
broaden their U.S. investor base by using either their existing shares or by issuing new
ones (Level III).
On theoretical grounds, our study contributes to the debate on the convergence of
functional corporate governance, also called the bonding hypothesis (Coffee, 1999,
2002; and Stulz, 1999). This hypothesis posits that firms voluntarily cross-list on
markets with more stringent legal and regulatory conditions than in their respective
home country. Controlling shareholders/managers thus bond themselves to limit the
expropriation of minority shareholders (i.e., private benefits of control), as shown by
Reese and Weisbach, 2002; Doidge, 2004; Doidge et al., 2004; Doidge et al., 2007a;
Doidge et al., 2007b; and Lei and Miller, 2008. 2 To cross list under Levels II and III, the
firm's expected benefits must outweigh the expected costs related to the compliances
with U.S. and major exchanges' stringent mies. Although Level II programs virtually
induce the same costs as Level III listings, their respective expected benefits are quite
different given that the former does flot allow U.S. capital-raising activities.
Additionally, the compliance to more stringent rules after SOX increased the costs of
choosing Level II and Level III programs. As a result, a new trade-off emerges and some
foreign firms may find that it is more costly to choose Level II after SOX. Based on
these arguments, we offer an additional test for bonding as a motive to cross-list on U.S.
markets by considering the four levels of ADRs as they have different corporate
governance implications (Coffee, 2002).
The results of our empirical investigation of the choice of an ADR program show that
capital-raising Level III attracts large firms, firrns with high pre-tax income, those with
2 However, the effectiveness of the cross-listings on major U.S exchanges in limiting expropriation by controlling shareholders/managers and in providing compliances with U.S. and exchanges' stringent rules was questioned by some recent studies (e.g. Siegel, 2005; and Lang et al., 2006)
24
high growth opportunities, privatized firms, and firms from weak investor protection
environments. This latter result is consistent with the bonding hypothesis. We likewise
find that firms from weak investor protection environments are attracted by Rule 144A
programs. Finally, we document that firms with high ultimate control rights and excess
control rights, and those from emerging markets are less likely to choose Level II and
more likely to choose Level I.
In the second part of the paper, we examine whether, and to what extent, the
introduction of SOX in 2002 had an impact on the choice of a particular ADR. SOX
represents a structural change in the regulatory and legal environment surrounding ADR
listings, particularly Level II and Level III programs as it introduces more stringent
corporate governance and disclosure requirements for the firms that list on the major
U.S. exchanges. This may lead to a new trade-off between the costs and the benefits
from choosing a particular ADR program, making for example, Level II ADRs less
attractive in this respect.
After we control for SOX in our multinomial logit estimation, we find that foreign firms
are indeed less likely to choose Level II ADRs after SOX. We also find that after SOX,
foreign firms are more attracted by Rule 144A programs which allow them to
circumvent the new stringent SOX mies and tap the U.S. primary market. This latter
result is consistent with Zingales' (2006) evidence.
Furthermore, a doser look at the distribution of firms across the four ADR programs
after SOX shows that there is indeed an inter-program reallocation that cannot be
explained by a change in firms' characteristics. More precisely, after SOX, firms are
more attracted by capital-raising programs, either Level III or Rule 144A, and are more
reluctant to issue Level II. Thus, the possibility to raise fresh capital on U.S. markets
25
seems to drive cross-listing after SOX. By choosing Level III programs, firms subject
themselves to more stringent rules but also benefit from the access to U.S. capital
resources through public offerings, which is consistent with more bonding and, more
generally, enhanced bonding benefits after the implementation of SOX. For those
foreign firms that want to avoid such restrictive listings but still raise capital, 144A
private placements allow them to do so, as this unlisted program exempts them from
governance and disclosure requirements and from compliance to U.S. GAAP (Zingales,
2006).
Finally, the results of a re-estimation of our multivariate model over the pre- and post-
SOX periods suggest that some attributes have a larger impact on the ADR choice
decision in the post-SOX period than in the pre-SOX. For instance, being an emerging
market firm heightens the probability of choosing Rule 144A. Similarly, coming from a
country with weak legal protection of minority shareholders increases the likelihood of
cross-listing under Level III in the post-SOX period as compared to the pre-SOX period.
This latter result is consistent with more bonding and the enhanced bonding benefits
after the implementation of SOX. Overall, our evidence contributes to the ongoing
debate on the impact of SOX on U.S. cross-listings and the enhanced bonding benefits
following SOX (e.g., Coffee, 2007; Doidge et al., 2007b; Piotroski and Srinivasan,
2007).
The rest of the paper is organized as follows: the second section presents the literature
related to cross-listings and the key hypotheses. The data and descriptive statistics are
presented in section 3. Section 4 describes the different variables, while section 5
presents the empirical analysis. Section 6 analyzes the SOX Act and its implications on
ADRs, and section 7 concludes.
26
2. Related literature and hypotheses
In this section, we review the literature on what drives foreign firms to cross-list. We
also describe the four ADR programs available to these firms, and develop our
hypotheses about the determinants of the choice of a specific ADR program.
2.1. Why do firms cross -list?
An extensive literature examines the motivations that lead companies to cross-list. The
most important ones can be summarized as follows:
Raising capital: Cross-listing allows firms to raise new capital at lower costs. In fact,
after their U.S. listings, foreign firms increase their capital-raising activity both at home
and abroad (Reese and Weisbach, 2002; Lins et al., 2005; and Doidge et al., 2007b),
especially emerging market firms (Lins et al., 2005). Foreign firms explicitly mention
their need to "relax" capital constraints and to access external capital markets when they
list in the U.S. (Lins et al, 2005). 3
Protecting minority shareholders by renting higher disclosure and governance
standards: A strand of literature (Coffee, 1999; 2002; Stulz, 1999) sustains that firms
intentionally cross-list on markets that have more stringent legal and regulatory
requirements than the firms' home markets in order to limit expropriation of minority
shareholders by managers or controlling shareholders (i.e., private benefits of control),
which should in turn facilitate the firms' access to capital markets. 4 This is called the
bonding hypothesis. Empirical evidence on bonding implied by cross-listings on the
3Further, foreign firms benefit from a decline in their cost of capital following the announcement of their U.S. listing, as documented by Miller (1999), Foerster and Karolyi (1999), Errunza and Miller (2000), and Hail and Leuz (2005). Sarkissian and Schill (2006) also examine global listings and report a decrease in the cost of capital around the foreign overseas listing date. 4 Benos and Weisbach (2004) and Karolyi (2006) offer a thorough literature review on private benefits and cross-listings in the U.S.
27
major U.S. exchanges appears in Reese and Weisbach (2002), Doidge (2004), Doidge et
al. (2004), Doidge et al. (2007a), Doidge et al. (2007b), and Lei and Miller (2008).
However, the effectiveness of U.S. cross-listings in bonding foreign firms is questioned
by some recent studies. For instance, Siegel (2005) documents a low level of SEC
enforcement against ADR listed Mexican firms and argues that firms cross-list to bond
themselves to protect minority shareholders in order to build a positive reputation that
will subsequently allow them to raise capital on U. S. markets: According to the author,
this is evidence of reputational bonding, rather than legal bonding. In the same vein,
Lang et al. (2006) find that foreign firms that originate from weak investor protection
countries and cross-list on the major U.S. exchanges have a lower quality accounting
data compared to their U.S peers. Burns et al. (2007), examining foreign acquisitions of
U.S. targets, find that legal and reputational bonding determines whether U.S. investors
will hold the shares of U.S. cross-listed firms that acquire U.S. firms and the required
premiums to do so.
Reducing the stake held by existing shareholders: Pagano et al. (2002) note that
cross-listing may raise the market value of the stakes held by current shareholders that
want to sell out. This is parncularly relevant in privatization transactions in which the
government is the divesting shareholder. Very often, especially when local stock
markets are neither developed nor liquid enough, governments choose liquid foreign
stock markets to sell state-owned firms and maximize privatization proceeds (Bortolotti
et al., 2002).
Improving liquidity and broadening the shareholder base: Pagano et al. (2002) argue
that firms may cross-list to draw foreign investors so as to broaden their shareholder
base and to increase their stock liquidity. Indeed, Aggarwal et al. (2007) find that
28
institutional investors prefer to invest in ADRs than underlying shares if the local market
of the emerging-market firm has weak investor protection, low liquidity, and high
transaction costs. Managers also mention improving stock liquidity as the main
motivation for cross-listing (Karolyi, 2006).
Ail the above-mentioned objectives put forward to explain the decision to cross-list are
flot mutually exclusive: in other words, firms that cross-list their shares could pursue
either one or several of these objectives. For example, firms that cross-list on U.S.
markets could do so to simultaneously raise capital, improve their stock liquidity,
broaden their shareholder base, and commit themselves to higher disclosure and
govemance standards.
2.2. How do firms cross -list on U.S. markets?
Non-U.S. firms can cross-list on U.S. markets via a direct listing, New York Registered
Shares, or an American Depositary Receipt (ADR). In this paper, we focus on ADRs
which are dollar-denominated negotiable certificates that represent a non-U.S.
company's publicly traded equity or debt. 5 ADRs carry the corporate and economic
rights, such as dividend and voting rights, of its underlying share.
There are four types of ADRs: Level I, Level II, Level III, and Rule 144A. Level II and
Level III ADRs can be traded on the New York Stock Exchange (NYSE), the National
Association of Securities Dealers Automated Quotation System (NASDAQ), or the
American Stock Exchange (AMEX). Level I ADRs are traded Over The Counter
5 An ADR can be sponsored or unsponsored. A sponsored ADR is issued with the agreement and the approval of the underlying firm which works with a designated depositary bank. However, an unsponsored ADR is issued in accordance with market demand and without the agreement of the underlying firm. Since 1980, new ADR programs listed on the major U.S. exchanges must be sponsored. See ADR reference guide, JPMorgan, February 2005, page 13.
29
(OTC)6, while Rule 144A ADRs, that are initially sold as a private placement, are traded
through Automated Linkages (PORTAL) among Qualified Institutional Buyers (QIBs).
The four types of ADRs have different features, as discussed earlier, and which we
summarize in Table I. For instance, they differ according to their ability to raise fresh
capital on U.S. capital markets and to their degree of compliance with governance and
disclosure requirements. As argued in section 2.1, firms that choose to cross-list on U.S.
markets via an ADR, will select an ADR type that allows them to achieve their
objectives. To date, previous studies treat the choice of a given type of ADR from a
global perspective by regrouping different ADR types in one category. Reese and
Weisbach (2002) put, on the one hand, firms listed on NYSE and NASDAQ together
(which includes Level II and Level III), and, on the other, Level I and Rule 144A firms
in order to examine the probability that a firm cross-lists in the U.S. Similarly, Doidge et
al. (2007a) assess the marginal effect of firm- and home-country variables on the
probability of (1) not being cross-listed, (2) choosing LSE (London Stock Exchange),
(3) selecting 144A/Level I ADR, and (4) being listed on the major U.S. exchanges
(which include Level II and Level III ADRs). More recently, Piotroski and Srinivasan
(2007) and Doidge et al. (2007b) examine U.S. and U.K. foreign listings. For U.S.
listings, they consider finns that cross-list on the major U.S. exchanges, which include
Level II and Level III ADRs.
Since, as discussed above, each ADR type (1) has distinct attributes, (2) offers different
benefits to firrns, and (3) bears different costs, we seek to examine why a foreign issuer
6 In March 2006, a new trading platform for Level I ADRs, named international OTCQX, was also offered to foreign firms that are considering listing on OTC or the U.K. Alternative Investment Market, Cromwell Coulson, president and CEO of Pink Sheet LLC (OTCQX website: www.otcux.com).
30
choo ses a particular ADR from among the four options, controlling for the firms and
their home-country characteristics.
Insert Table I about here
2.3. Hypotheses development
We conjecture that the choice of a specific ADR depends upon variables related to the
firms' attributes (e.g., size, profitability, growth opportunities, leverage, turnover
volume, and country of origin), its corporate governance (privatization, ownership
structure, and SOX), and home-country institutional attributes (accounting standards and
investor protection). More precisely, we derive the four hypotheses presented in the
following paragraphs.
2.3.1.Firm attributes and ADR Programs
Larger and more profitable firms are more likely to choose Level II and Level III
because these two ADR programs require that (1) firms pay large continuing fees and
(2) meet size and earnings requirements to cross-list. Firms with high turnover volume
(relatively to their local market turnover volume) are more likely to opt for Level II and
Level III to enhance their liquidity and circumvent their local market financial
constraints. Hence,
Hl: Larger, firms with higher relative turnover volume, and higher earning firms are
more likely to choose a listed ADR (Level II or Level III).
Firms with higher growth opportunities generally need additional equity capital. More
indebted firms are also more likely to issue equity offerings to finance their operations.
Given that only Level III and Rule 144A allow capital-raising, we expect that the higher
the leverage ratio and the higher the growth opportunities of foreign firms, the more
31
likely they will choose Rule 144A and Level III. In the same vein, privatized firms are
more likely to choose Rule 144A or Level III than Level I or Level II. The aim of
privatization through ADRs is usually to raise capital for firms, and is typically done
through primary issues. Since Level I does flot offer any liquidity and does flot allow the
firms to raise new capital on U.S. markets, we conjecture that privatizing govemments
are less likely to choose this ADR. Similarly, we do not expect govemments to choose
Level II to privatize their state-owned firms as Level II does flot allow these
govemments to raise capital, and to divest gradually through subsequent primary
offerings.
Firms from emerging markets are relatively more capital constrained, and have higher
needs to raise external capital (Lins et al., 2005). Therefore, these firms are more likely
to choose Rule 144A and Level III. They are also less likely to choose Level II since it is
costly in terms of compliance and does flot allow the raising of new capital. We
summarize our expectation in the following hypothesis:
H2: Firms with higher growth opportunities, more indebted firms, privatized firms, and
firms from emerging markets are more likely to choose Rule 144A or Level III ADRs.
Emerging market firms are less likely to choose Level II.
The enactment of SOX is likely to have an impact on the issuer's ADR choice. After
SOX, we expect firms to be more likely to issue Rule 144A ADRs which allow firms to
raise capital on U.S. markets, and require no particular compliance with SEC, U.S.
GAAP, or the SOX Act.
The implementation of SOX raised the costs of cross listing by imposing compliance to
more stringent new rules; it particularly affected the costs related to the choice of Level
H and Level III programs alike. Keeping in mind that only Level III allows firms to raise
32
fresh capital on U.S. markets, we expect foreign firms to find it less interesting to list
under Level II after SOX. Accordingly, we enunciate the following hypothesis:
H3: Firms issuing ADRs after SOX are more likely to choose Rule 144A and less likely
to select Level II.
According to Doidge et al. (2007a), when controlling shareholders have tighter control
(greater voting rights) of the firm, they are more reluctant to list their firms on a U.S.
major stock exchange because the costs of the extraction of private benefits of control
exceed the benefits of such listings. Doidge et al. (2007a) find evidence for this
conjecture. Therefore, we would expect that controlling shareholders who control a large
stake (voting rights) in one firm are more reluctant to relinquish their private benefits of
control and are thus more likely to choose less restrictive programs. Additionally, when
the separation between control and cash flow rights is less pronounced, this means,
according to Claessens et al. (2002), that it is less likely that controlling shareholders
extract private benefits of control from minority shareholders. Doidge et al. (2007a) find
that the higher this separation is in a firm, the less likely it is that this fïrm will list on
major U.S. exchanges. Hence, we expect that the tighter the control in a firm and the
larger the difference between the control and cash flow rights, the less likely it is that the
firm will choose a listed ADR program, (i.e., Levels II or III) as these two levels
increase the costs of extracting private benefits. Thus,
H4: Firms where the largest controlling shareholder holds greater control rights, and
firms with a high separation between control and cash flow rights are less likely to be
listed under Level II or Level III, and more likely to select Rule 144A and Level I.
33
2.3.2. Home-country institutional attributes and ADR programs
In une with the bonding hypothesis introduced by Coffee (1999, 2002) and Stulz (1999),
and discussed above, firms from countries with a lower level of investor protection and
weak accounting standards are more likely to choose a listed ADR (i.e., Level II and
Level III) to protect minority shareholders against "managerial self-dealing" and private
benefit extractions (Karolyi, 2006). Therefore, firms from countries with poor investor
protection and weak accounting standards are more likely to choose a listed ADR
program, as they offer an additional protection for minority shareholders compared to
the two other unlisted programs (Level I and Rule 144A). However, to avoid the
stringent compliances and disclosure requirements, especially those related to SOX,
foreign firms from countries with poor investor protection and weak accounting
standards may be more willing to choose an unlisted ADR program (i.e., Level I and
Rule 144A) rather than an exchange-listed one. Based on these two competing
arguments, we cannot put forward any directional hypothesis, and we leave this issue to
be resolved by empirics.
3. Data
The Bank of New York (BNY), Citibank (CB), the Deutsche Bank (DB), and JP Morgan
(JPM), are the major depositaries of ADRs, although BNY alone accounts for 64% of
the ADR market. 7 We downloaded valuable information from these depositaries'
websites8 regarding ADRs, namely the type, the effective issuance date, the market
where the ADR is traded, the sponsorship status (whether the ADR is sponsored or not),
7 See "The depositary receipt markets: The year in review" - 2006, Bank of New York. 8 The respective websites are as follows http://www.adrbny.com/, http://wwss.citissb.com/adr/www/ (Universal Issuance Guide), http://www.adr.db.com/, and http://www.adr.com/.
34
the underlying share and its country of origin, the Committee on Uniform Securities
Identification Procedures (CUSIP) number of the ADR, and the International Securities
Identification Number (ISIN) of the underlying share.
Our sample includes only sponsored ADRs because unsponsored ADRs are created on
investors' initiatives (primarily institutional investors), independently from the
manager/controlling shareholder's preferences for a particular ADR program. We also
exclude the sponsored ADRs that change from their initial levels. More precisely, we
exclude the firms that upgrade, downgrade, or delist from their initial programs as we
cannot obtain full information about these changes, which is the first ADR type and the
first date of issuance. We also disregard the subsequent ADRs that the firm may have
issued. Moreover, we eliminate the ADRs that have a debt as an underlying security
rather than equity. Finally, we exclude the "side by side" ADR programs, which were
introduced in 1991. Under this program, the company establishes a public Level I ADR
program as well as a private Rule 144A ADR for the same class of stock. This structure
allows companies to combine the benefits of publicly traded programs with the
possibility of raising capital without complying with the Securities and Exchange
Commission's (SEC) and the exchanges' standards. As Rule 144A ADRs were
introduced in April 1990, we consider only programs which were issued after 1990. We
verify the ADRs' characteristics, using Lexis-Nexis, NASDAQ, NYSE, and the firms'
websites.
We obtain the accounting and financial information on the sample firms one year before
the ADR issuance date from different sources which we describe in Appendix 1. The
final sample consists of 647 ADRs and spans the period from 1990 through 2006. We
present summary statistics on this sample in Table II.
35
Panel A of Table II indicates that most ADRs, namely 287 (44.4%), are issued by firms
from the Asia/Pacific region. European firms follow with 263 (40.6%) ADRs.9
Panel B of Table II shows that firms from high income countries dominate the sample
with 442 (68.3%) ADRs. Panel C presents the industry classification (Campbell, 1996)
of the ADR firms, and shows that financial and real estate firms issue most ADRs with
100 (15.5%) programs. Basic industries, consumer durables, and utilities follow with 98
(15.1%), 91 (14.1%), and 85 (13.1%) ADRs, respectively.
Our sample includes 130 (20.1%) Rule 144A, 326 (50.4%) Level I, 106 (16.4%) Level
II, and 85 (13.1%) Level III ADRs. The NYSE attracts more programs than NASDAQ 1°
(146 (22.6%) versus 45 (7%) ADRs respectively). The distribution of our sample across
ADR programs is close to the universe of sponsored ADRs, since, over our study period,
Rule 144A accounted for 26.1% of ADRs, Level I for 44.2%, Level II for 17.1%, and
Level III for 12.6%.
Insert Table II about here
4. Variables
We consider two categories of variables to examine the choice of an ADR program:
those applying to the underlying firms (section 4.1) and to the home country's
institutions (section 4.2). Appendix 1 describes the data sources for these variables.
9 Appendix 2 presents the distribution of ADRs by country of origin, and shows that, in our sample, 72 (11.1%) ADRs are issued by the United Kingdom. Hong Kong and Australia follow with 52 (8%) and 47 (7.3%) ADRs, respectively. I° Note that our sample does flot include firms listed on the AMEX because of the unavailability of data for these firms. The Bank of New York reports that only four ADRs are traded on the AMEX.
36
4.1. Firm attributes
• SIZE: The natural logarithm of the total assets (in thousands of U.S. dollars) of
an ADR firm. As previously argued, larger firms are more likely to be listed on
Level II and Level III.
• INCOME: The pre-tax income (in billions of U.S. dollars) of the ADR firm.
Firms with a higher pre-tax income are more likely to choose Level II or Level
III ADR programs.
• ASSETGR: The annual asset growth rate of the ADR firm. This variable is a
proxy for the firm' s growth opportunities, and may condition the choice of a
given ADR on the grounds that when growth opportunities are greater, there is a
greater need to raise new capital, and thus it is more likely that a firm will choose
Level III or Rule 144A.
• LEV: The leverage ratio is defined as total debt divided by total assets. To reduce
their leverage and to decrease their cost of capital, firms need to raise new
capital. As only Level III and Rule 144A allow firms to do this, we expect that
the higher the leverage ratio, the more likely foreign firms will choose either one
of these two programs.
• RELTOV: The underlying firm's annual turnover volume divided by the country
of origin's annual stock market turnover volume. We expect that firms with a
relatively high turnover volume ratio will opt for Level II or Level III to enhance
their liquidity and circumvent their local market financial constraints.
• EMC: A dummy variable that is equal to 1 if the home country is an emerging
market (using the Standard and Poor's Emerging Market Database
37
classification), and 0 otherwise. Firms from emerging markets are more capital
constrained and have greater need to raise external capital (Lins et al., 2005).
Therefore, they are more likely to choose Rule 144A and Level III. Additionally,
firms from emerging markets are less likely to choose Level II.
• PRIVA: A dummy variable that is equal to 1 when a government privatizes a
state-owned firm using an ADR program and 0 otherwise. As discussed above,
governments are less likely to choose Level I or Level II since they offer no
possibilities for privatized firms to raise new capital, and are more likely to
choose Level III or Rule 144A instead.
• ULOW: The percentage of total ultimate control rights of the ADR finn. This
variable measures the ability of the controlling shareholder to extract private
benefits of control (Doidge et al., 2007a). Accordingly, the higher are the
ultimate control rights, the less likely it is that this firm will choose a listed ADR
(i.e., Level II or Level III) which makes consuming private benefits more costly
compared to Level I and Rule 144A.
• ULOWDIF: The percentage point difference between the ultimate control rights
and the ultimate cash flow rights of the underlying firm, i.e., the excess control
rights. This is a proxy of the separation between control and cash flow rights held
by the ultimate owner, which measures the controlling shareholder's incentive to
extract private benefits of control (Doidge et al., 2007a). Accordingly, we expect
that the larger ULOWDIF is, the less likely it is that the firm will choose a listed
ADR program, i.e., Level II or Level 111 . 11
n To calculate the ultimate cash flow rights and ultimate control rights, we follow La Porta et al. (1999), Claessens et al. (2000), and Faccio and Lang (2002).
38
• SOX: The SOX dummy variable is equal to 1 if the firm issues its ADR after
April 24, 2002 and 0 otherwise. This date corresponds to the report of the Oxley
bill in the House (Litvak, 2007). We expect that firms which issue ADRs after
SOX are more likely to issue Rule 144A programs since they allow firms to raise
capital on U.S. markets and do flot require any compliance with SEC, U.S.
GAAP, or the SOX Act. Moreover, we expect that foreign firms are less likely to
issue Level II after SOX.
4.2. Home-country institutional attributes
• SELFDEAL: The difference in the anti-self dealing indexes of the ADR home
country and the United States. This index, introduced by Djankov et al. (2008),
measures the legal protection of minority shareholders against insider
expropriation and allows us to test the bonding hypothesis. If bonding prevails,
the controlling shareholders/managers who wish to offer more protection for
their minority shareholders will select an exchange-listed program. If, instead,
controlling shareholders/managers wish to avoid the U.S. and major exchanges'
stringent corporate governance rules, they will select an unlisted program.
• ACRAT: The difference in the accounting ratings of the ADR country of origin
and the United States. On the one hand, under the bonding hypothesis,
controlling shareholders/managers who are willing to follow the strict disclosure
and high accounting standards of the U.S. will choose an exchange-listed
program to offer more protection for their minority shareholders. On the other
hand, those that wish to avoid such requirements will select Rule 144A or Level I
instead.
39
In short, our model takes the following form:
ADR Choice = F (firm attributes and home-country institutional variables),
where the firm attributes are: SIZE, INCOME, ASSETGR, LEV, RELTOV, EMC, PRIVA,
ULOW, ULOWDIF, and SOX. The home-country institutional variables are:
SELFDEAL, and ACRAT.
5. Empirical analysis
In Table III, we summarize the predicted relations between the explanatory variables and
the probability of choosing a given type of ADR.
Insert Table III about here
In Section 5.1, we examine whether the explanatory variables differ across the four ADR
programs. We then perform a multivariate analysis in Section 5.2 and present sensitivity
tests in Section 5.3.
5.1. Univariate analysis
Table IV presents the means of the explanatory variables for the different types of
ADRs. Differences in the means of these variables between the three types of ADRs and
Level I (the base outcome) are then tested using a two-tailed t-test of means. 12
Table IV shows that Level II and Level III firms are larger and have a higher pre-tax
income than those choosing Level I. This result, significant at the 1% level, is expected
since both the NYSE and NASDAQ impose minimum size and earnings requirements
for non-U.S. firms that list on U.S. exchanges. Although they are smaller than Level II
and Level III, Rule 144A firms are larger, at the 5% level, than Level I firms. These
12 Correlation coefficients between the regression variables are reported in Appendix 3.
40
results are consistent with Doidge et al.'s (2007a) evidence that foreign firms that
choose unlisted programs (Rule 144A/Level I) are smaller than those that are listed on a
U.S. exchange.
Rule 144A and Level III firms have higher asset growth rates than Level I firms. This
result supports our prediction presented in Table III. In fact, as Rule 144A and Level III
allow firms to raise new capital on U.S. markets, firms with relatively high growth
opportunities will opt for these two programs. Moreover, Rule 144A firms have a higher
leverage than Level I firms, a result which is in une with the predicted relation as Rule
144A allows firms to raise capital on U.S. markets.
Non-U.S. firms that choose Level III exhibit a high relative turnover ratio compared to
Level I firms, a difference that is significant at the 1% level. Such a result is expected for
these firms, which are more likely to seek an ADR that allows them to circumvent the
narrowness and illiquidity of their home market (i.e., the financing constraints).
Privatizing governments are more likely to choose Rule 144A, Level II, and Level III
than Level I. Of the first three, privatizing governments are more likely to choose Rule
144A and Level III than Level 11. 13 These results are consistent with the predicted
relation, presented in Table III, since Rule 144A and Level III are the two ADR
programs that allow governments to divest gradually through subsequent primary share
offerings.
A total of 57% of the Rule 144A ADRs are issued after the implementation of SOX.
This result is consistent with Zingales' (2006) evidence. He points out the large increase
in the number of 144A registrations by foreign firms alter SOX which, by allowing them
to avoid U.S. legal liability, helps them tap the U.S. markets via the "back door."
13 This result is statistically significant at the 1% level.
41
Firms that list under Rule 144A and Level III have larger ultimate control rights
compared to those opting for Level I. In contrast, Level II firms have lower ultimate
control rights than Level I firms. As argued previously, the tighter the control of the
firm, the more likely that controlling shareholders will extract private benefits of control,
and hence the less likely that these shareholders will choose a listed program. In this
respect, the univariate results for Level III appear somewhat surprising. In an attempt to
provide an explanation for these results, we take a closer look at the data and find that
the largest shareholder of many firms listed under Level III is the State. To the extent
that governments pursue different objectives from private controlling shareholders, we
exclude firms with the State as the largest shareholder from our sample. We find that the
ultimate control rights of Level I firms are larger than Level II firms and lower than Rule
144A firms. Moreover, we find that level III firms no longer have higher ultimate
control rights than Level I firms. This result is consistent with evidence in Doidge et al.
(2007a) who find that firms that cross-list on the major U.S. exchanges have lower
ultimate control rights than those that choose Level I or Rule 144A.
Emerging market firms are more likely to choose Rule 144A and less likely to choose
Level II than Level I. This is in keeping with evidence in Lins et al. (2005) that firms
from emerging markets are capital constrained, and seek access to U. S. markets through
a capital-raising issue that is flot allowed under Level II.
Furthermore, as described previously in section 4.3, anti-self dealing (SELFDEAL)
represents the difference in the anti-self dealing indexes of the ADR's home country and
the U.S. This difference is generally negative since the U.S has a higher index. We find
that firms choosing Rule 144A, Level II, and Level III ADRs present a higher difference
in the anti-self dealing index than firms which choose Level I, i.e., these firms originate
42
from countries with poorer investor protection compared to the U.S. This result is
consistent with Reese and Weisbach (2002) who document that firms from French civil
law countries are more likely to list on the NYSE/NASDAQ than those from English
common law countries. Moreover, the difference in the accounting ratings (ACRAT)
(between the home country and the U.S.) is higher for Rule 144A and Level III firms
than Level I firms, i.e., firms from countries with weaker accounting standards than the
U.S. opt for Rule 144A and Level III.
Insert Table IV about here
5.2. Multivariate analysis
5.2.1. Model presentation
Once the decision of cross-listing via an ADR is taken, the firtn's manager must decide
which type of ADR program to choose. His set of choices includes the four different
ADR programs, namely, Rule 144A, Level I, Level II, and Level III.
As the choice set has more than two outcomes, we opt for the multinomial choice model.
Suppose that the utility of the individual i from choosing the alternative j is as follows:
U, i =X03-Es, i j= 0,1,2,....,J (2)
Where
Xii: is l*K vector that differs across individuals with first-element unity.
: j: 0, 1, 2, ..., J are the non-observables affecting the tastes.
Let Yi denote the choice of the individual i that maximizes his/her utility:
Yi = argmax (Uio, Uil, Ui2, • • • ••Uii) (3)

43
McFadden (1974) shows that if the e,, j=0, 1, 2, ....,J, are independently and identically
distributed (IID hereafter) with a cumulative distribution function F(a) = exp[-exp(-a)],
then the response probabilities are as follows:
P(yi = »Xi) = jexp(Xufi)
(4) [EexP(X1kfl)]
k=0
The IID hypothesis for the unobserved terms e u has an equivalent behavioral property
which is known as the Independence of Irrelevant Alternatives (IIA, hereafter). The IIA
implies that adding another alternative or changing the characteristics of a third
alternative does flot affect the relative probability for any two alternatives. In other
words, the IIA implies that all pairs of alternatives are equally similar or dissimilar
(Hensher et al., 2005).
To test the IJA hypothesis, Hausman and McFadden (1984) (noted hereafter as
Hausman) offer a test which compares the estimation of the parameters' vector, fi,
using different subsets of alternatives. If the IIA is true, the use of any subset of
alternatives will consistently estimate fi.
In a multinomial logit model, we cannot estimate ail the coefficients for all the choices.
In other words, the model is unidentified. To remove this indeterminacy, I4 we have to
assume a base outcome or a base choice for which ah l the coefficients are set to 0, and
then interpret the estimated coefficients as measuring the change relative to the base
outcome for the same variable. The choice of the base outcome is arbitrary and does flot
affect the predicted probabilities (Greene, 2003).
14 See Greene (2003), page 721.
44
In what follows we report the marginal effects of the multinomial logit estimation for the
four ADR choices. Moreover, we assume that the choice set of the four ADR pro grams
is available to ail firms that choose an ADR program as the NYSE and NASDAQ have
the discretion to decide whether a foreign firm could cross-list even though it does flot
meet these exchanges' requirements in terms of size, earnings, and the number of
shareholders 15 . JP Morgan ADR guide (October, 2006 P. 54) mentions that: "The NYSE,
we are advised, is prepared to be flexible in applying these standards to non-US issuers,
and has broad discretion regarding the listing of a company. In determining eligibility
for listing, particular attention is given to such qualifications as the degree of national
interest in the company; its relative position and stability in the industry; and whether it
is engaged in an expanding industry, with prospects of at least maintaining its relative
position."
5.2.2. Estimation results
The results of the Hausman test suggest that we cannot reject the ITA assumption for ail
the specifications; we therefore estimate multinomial logit models, correcting for
clustering at the country level.
To gauge the power and fit of each estimated model, we rely on two characteristics,
namely McFadden's pseudo R-squared, and the percentage of the correctly classified
observations predicted by each mode1. 16 Table V summarizes the results of our
estimations.
15 According to our sample, 8.3% of levels II and III that were listed on NYSE did flot meet the NYSE eamings requirement of $25 million of pre-tax income in each of the 2 most recent years. However, 60% of Level I and Rule 144A firms do meet this requirement. 16 See Hensher et al. (2005).
45
Panel A of Table V shows that larger firms (SIZE) are more likely to choose Level II and
Level III and less likely to select Level I. These results are respectively significant at the
10%, 5%, and 1% levels. More specifically, an increase of one unit in the log of total
assets increases the probability of choosing Level III by 0.0203 and selecting Level II by
0.0168, and decreases the probability of choosing Level I by 0.0373. Moreover, this
panel shows that the higher the firm's pre-tax income (INCOME), the more likely that it
will choose Level II. More precisely, a one billion U.S. Dollar increase in pre-tax
income increases the probability of choosing Level II by 0.0344. These results are
consistent with the predicted relations shown in Table III. Indeed, to be listed as Level II
or Level III, firms have to meet minimum size and earnings requirements.
Results in Panel A of Table V also suggest that highly-leveraged firms (LEV) are more
likely to issue a Rule 144A ADR that allows them to raise new capital. Furthermore,
having a high asset growth rate (ASSETGR) increases the probability of selecting Level
III and decreases the probability of choosing Level I. More precisely, because firms with
high growth in their investment opportunities generally need to raise fresh capital to
finance them, they are less likely to choose Level I since it does not offer this possibility.
The fact that a firm cornes from an emerging market (EMC) decreases the probability of
choosing Level II by 0.1591, and increases the probability of choosing Rule 144A by
0.2993. This result stems from the fact that Level II ADRs require that listed firms
observe partial compliance with U.S. GAAP and SEC rules, and does flot offer the
possibility of raising fresh capital. Therefore, choosing Level II is costly for firrns from
emerging markets and does flot allow them to raise capital on U.S. markets.
Issuing a privatization ADR (PRIVAI) increases the probability of choosing Level III
and Rule 144A by 0.3181 and 0.3103, respectively, and decreases the probability of
46
choosing Level I and Level II by 0.5509 and 0.0775, respectively. These findings bear
out our prediction that govemments are less likely to choose Level I and Level II to
privatize their firms on U.S. markets. In addition, by privatizing the firm under Level III
or Rule 144A ADRs, the govemment provides firms with the option of raising capital on
U.S. markets, which is particularly valuable in the case of graduai privatization, where
subsequent equity issues are needed.
The Sarbanes-Oxley dummy variable (SOX) in Panel A of Table V shows that a firm
that issues an ADR aller April 24, 2002 is more likely to issue Rule 144A and less likely
to choose Level II, which is in line with our predicted relation. More precisely, issuing
an ADR after April 24, 2002 increases the probability of selecting Rule 144A by 0.1055
and decreases the probability of selecting Level II by 0.0616. These results are
significant at the 5% level. The first result is also consistent with Zingales' (2006) claim
that foreign firms, after SOX, tend to issue more Rule 144A ADRs than previously so as
to avoid U.S. legal liability and tap the U.S. primary market via the "back door". In
addition, SOX increased the costs of issuing Level II programs as they require
complying with the new stringent rules of this Act, without the benefit of raising capital
on the U.S. markets. Therefore, SOX has brought about a switch in the expected
costs/benefits in issuing Level II ADRs that leads to reluctance to select this program
after SOX,
In Panels B and C, we report two specifications that control for the level of investor
protection, and, to this end, we respectively introduce the accounting rating (ACRA7)
and the anti-self dealing variables (SELFDEAL). Panel B shows that a unit decrease in
the accounting rating difference increases the probability of choosing Level III by
0.0081. Panel C shows that a unit decrease in the anti-self dealing difference increases
47
the probability of choosing Rule 144A and Level III by 0.2477 and 0.2292, respectively,
and decreases the probability of choosing Level I by 0.4323. The results for Level III
and Level I corroborate the bonding hypothesis, while the Rule 144A result shows that
there are some foreign firms that avoid U.S. and major exchanges' requirements by
choosing a private placement program. Previous studies test bonding by regrouping
listed versus unlisted programs. We demonstrate here the importance of considering
each program individually, since, within listed programs, only Level III supports the
bonding hypothesis. The rest of the variables in Panels B and C exhibit virtually the
same results as in Panel A.
In panel D, we introduce the relative turnover ratio (RELTOV) for which we have a
smaller number of observations. We find that a unit increase in a firm's relative turnover
ratio increases the probability of choosing Level III by 0.5524. This result is consistent
with the argument that firms which dominate their local capital markets, and therefore
being faced with the financial constraints of their markets of origin, choose U.S. liquid
markets in order to improve their liquidity.
Panels E and F control for the firm ownership structure. They add the ultimate control
rights (ULOW) and the difference between the ultimate control rights and the ultimate
cash flow rights (ULOWDIF) to the specifications reported in Panels B and C. Panel E
shows that firms with high ultimate control rights are more likely to choose Level I. This
result is expected and supports our prediction since Level I virtually does flot increase
the costs of extracting private benefits, and does flot require compliance with SEC and
U.S. GAAP. In fact, a one percent increase in the ultimate control rights increases the
probability of choosing Level I by 0.0032. Moreover, Panel F shows that a one percent
48
increase in the ultimate control rights increases the probability of choosing Level I by
0.0026, and decreases the probability of selecting Level II by 0.0020.
In Panel G and H, we add the relative turnover ratio variable (RELTOV) to panels E and
F. Panel H shows that the higher the relative turnover ratio (RELTOV) in a firm is, the
less likely it is that this firm will opt for Rule 144A. More precisely, a one percent
increase in the relative turnover ratio decreases the probability of selecting Rule 144A
by 0.0144. This result is consistent with the predicted relations in Table III.
Moreover, Panel H shows that the higher the percentage point difference between the
ultimate control and cash flows rights, the lower the probability of choosing Level III
and the higher the probability of choosing Level I. These results are in une with the
literature on private benefits of control in so far as the higher the control stake held by
the ultimate owner and the higher the difference between the ultimate control and cash
flow rights are, the lower the probability that the controlling shareholder will choose a
listed program. The rationale behind this result is that the higher regulatory and
governance standards required by these programs will increase the costs of extracting
private benefits by controlling shareholders from minority ones.
In general, the results of the multinomial logit models corroborate the evidence from the
univariate analysis as well as the predicted relations between the explanatory variables
and the probability of choosing a given type of ADR.
Insert Table V about here
5.2.3. Sensitivity tests
a- Sample composition and corporate governance
Our initial sample includes financial and real estate firms whose financial characteristics
may be different from those of non-financial firms (e.g., leverage). Therefore, we
49
perform a sensitivity test that excludes the former firms by re-estimating the baseline
model of Table V, Panel A. The reported results in Table VI, Panel A that exclude
financial and real estate firms are generally the same as those that we find in Table V,
Panel A for the whole sample.
In addition, since we have ownership data for 286 firms (out of an initial sample of 647
firms), one may question whether the results that we find for the entire sample still hold
for the sub-sample for which we have ownership data. Accordingly, we re-estimate in
Table VI, Panel B the same model as in Table V, Panel B, but only for those firms with
data on ownership. The estimated model shows that the results for this sub-sample are
generally consistent with those of the whole sample.
The univariate results, shown in Panels A and B of Table IV, suggest that the ultimate
control rights of Level III firms are higher than those under Level I, which stems from
the fact that there are some state-owned firms that are listed under Level III. We
therefore perform an additional test in Table VI, Panel C, by excluding those firms in
which the State is the largest shareholder. After we re-estimate the same model as in
Table V, Panel H, we find that higher ultimate cash flow rights increase the probability
of choosing Level I, and decrease the probability of selecting Level II. These results are
consistent with the predicted relations in Table III, and are in line with those that we
found previously.
Insert Table VI about here
50
The literature on private benefits suggests that the presence of a second blockholder in
the firm could limit the consumption of private benefits by the largest shareholder. 17 As
a result, minority shareholders can free-ride on the protection that is offered by the
presence of this second blockholder. This, in turn, could affect the choice of a given
ADR program. More precisely, we expect that the presence of a second blockholder
increases the probability of choosing Level II and Level III, and decreases the
probability of choosing Level I and Rule 144A. To examine this conjecture, we re-
estimate the models that appear in Panels E and F of Table V by adding a dummy
variable (2BLOC) which is equal to 1 if there is a second blockholder who holds more
than 10% in the firm. The unreported results show that 2BLOC does flot significantly
affect the choice of any given ADR program. 18
Finally, we test whether the type of the largest shareholder may have an impact on the
future consumption of private benefits of control, and then the choice of the ADR
program. More precisely, we introduce a dummy variable (SHTYPE) which is equal to 1
if the largest shareholder is either a family or management or unlisted firm, and then we
re-estimate the models of Panel E and F of Table V. The unreported results show that
SHTYPE does flot affect the choice of a given ADR program. The presence of a foreign
largest shareholder does flot seem to alter our previous results either. When we add a
new dummy variable (FORGN) which is equal to 1 if the largest shareholder is foreign,
0 otherwise, we find that FORGN does flot significantly affect the probability of
choosing any given ADR program.
17 Note that the second blockholder could also, in some cases, share some private benefits of control with the largest shareholder. Bennedsen and Wolfenzon (2000) and Gomes and Novaes (1999) discuss the role of the second largest shareholders. 18 The unreported results that we discuss in this section are available from the authors upon request.
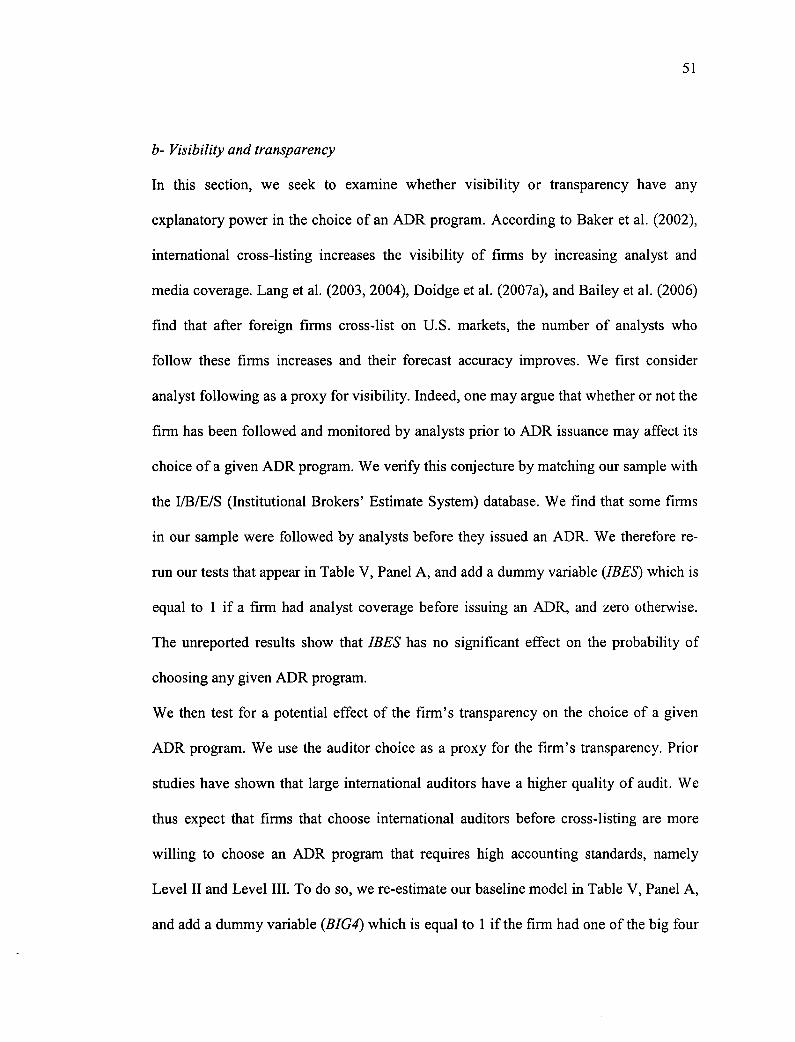
51
b- Visibility and transparency
In this section, we seek to examine whether visibility or transparency have any
explanatory power in the choice of an ADR program. According to Baker et al. (2002),
international cross-listing increases the visibility of firms by increasing analyst and
media coverage. Lang et al. (2003, 2004), Doidge et al. (2007a), and Bailey et al. (2006)
find that after foreign firms cross-list on U.S. markets, the number of analysts who
follow these firms increases and their forecast accuracy improves. We first consider
analyst following as a proxy for visibility. Indeed, one may argue that whether or flot the
firm has been followed and monitored by analysts prior to ADR issuance may affect its
choice of a given ADR program. We verify this conjecture by matching our sample with
the I/B/E/S (Institutional Brokers' Estimate System) database. We find that some firms
in our sample were followed by analysts before they issued an ADR. We therefore re-
mn our tests that appear in Table V, Panel A, and add a dummy variable (IBES) which is
equal to 1 if a firm had analyst coverage before issuing an ADR, and zero otherwise.
The unreported results show that IBES has no significant effect on the probability of
choosing any given ADR program.
We then test for a potential effect of the firm's transparency on the choice of a given
ADR program. We use the auditor choice as a proxy for the firm's transparency. Prior
studies have shown that large international auditors have a higher quality of audit. We
thus expect that firms that choose international auditors before cross-listing are more
willing to choose an ADR program that requires high accounting standards, namely
Level II and Level III. To do so, we re-estimate our baseline model in Table V, Panel A,
and add a dummy variable (BIG4) which is equal to 1 if the firm had one of the big four
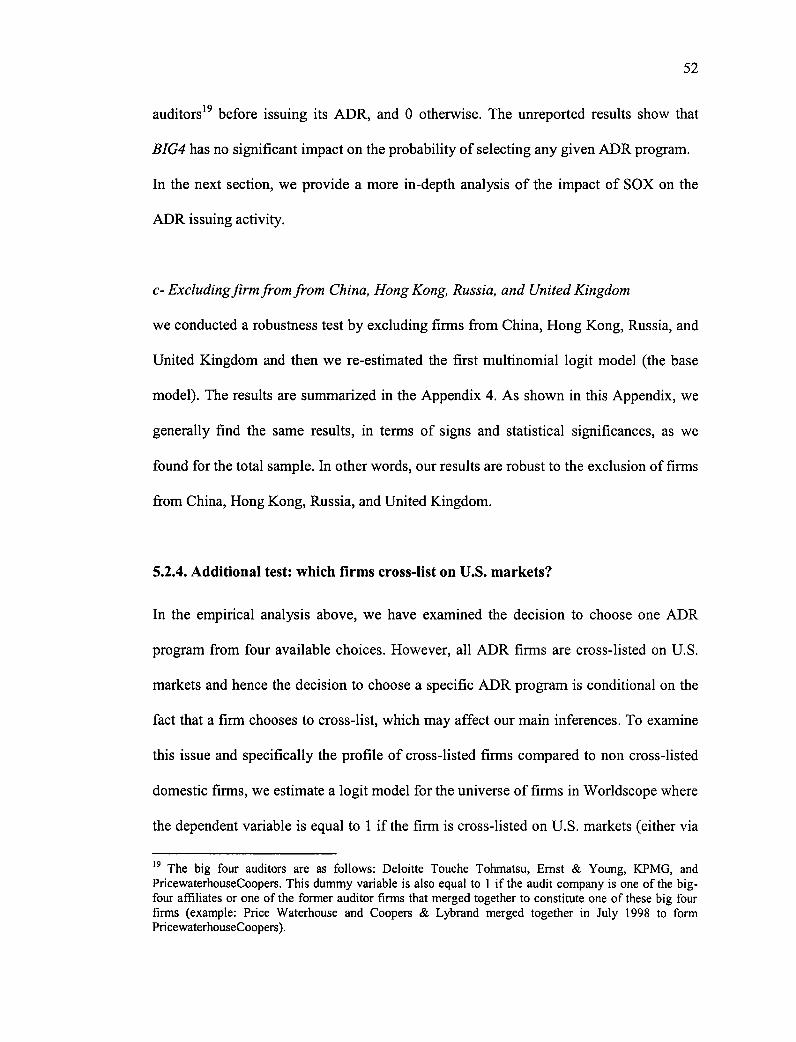
52
auditors 19 before issuing its ADR, and 0 otherwise. The unreported results show that
BIG4 has no significant impact on the probability of selecting any given ADR program.
In the next section, we provide a more in-depth analysis of the impact of SOX on the
ADR issuing activity.
c- Excluding firm from from China, Hong Kong, Russia, and United Kingdom
we conducted a robustness test by excluding firms from China, Hong Kong, Russia, and
United Kingdom and then we re-estimated the first multinomial logit model (the base
model). The results are summarized in the Appendix 4. As shown in this Appendix, we
generally find the same results, in terms of signs and statistical significances, as we
found for the total sample. In other words, our results are robust to the exclusion of firms
from China, Hong Kong, Russia, and United Kingdom.
5.2.4. Additional test: which firms cross-list on U.S. markets?
In the empirical analysis above, we have examined the decision to choose one ADR
program from four available choices. However, ail ADR firms are cross-listed on U.S.
markets and hence the decision to choose a specific ADR program is conditional on the
fact that a firm chooses to cross-list, which may affect our main inferences. To examine
this issue and specifically the profile of cross-listed finns compared to non cross-listed
domestic firms, we estimate a logit model for the universe of firms in Worldscope where
the dependent variable is equal to 1 if the firm is cross-listed on U.S. markets (either via
19 The big four auditors are as follows: Deloitte Touche Tohmatsu, Ernst & Young, KPMG, and PricewaterhouseCoopers. This dummy variable is also equal to 1 if the audit company is one of the big-four affiliates or one of the former auditor firms that merged together to constitute one of these big four firms (example: Price Waterhouse and Coopers & Lybrand merged together in July 1998 to form PricewaterhouseCoopers).
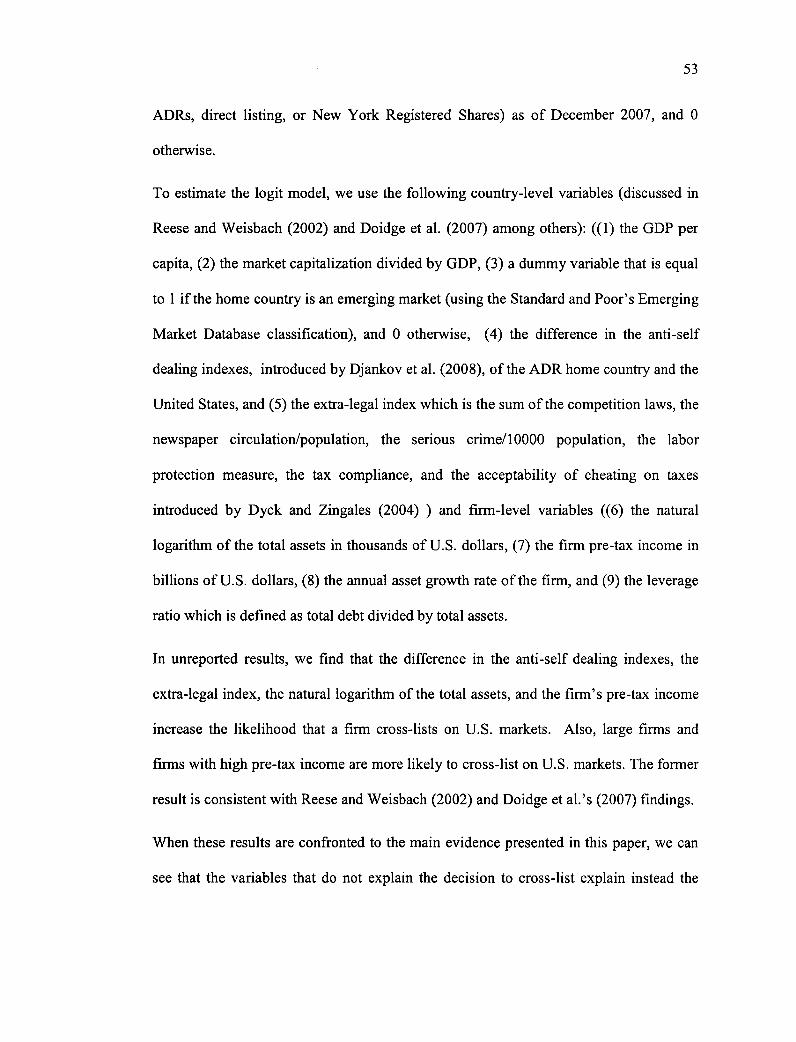
53
ADRs, direct listing, or New York Registered Shares) as of December 2007, and 0
otherwise.
To estimate the logit model, we use the following country-level variables (discussed in
Reese and Weisbach (2002) and Doidge et al. (2007) among others): ((1) the GDP per
capita, (2) the market capitalization divided by GDP, (3) a dummy variable that is equal
to 1 if the home country is an emerging market (using the Standard and Poor's Emerging
Market Database classification), and 0 otherwise, (4) the difference in the anti-self
dealing indexes, introduced by Djankov et al. (2008), of the ADR home country and the
United States, and (5) the extra-legal index which is the sum of the competition laws, the
newspaper circulation/population, the serious crime/10000 population, the labor
protection measure, the tax compliance, and the acceptability of cheating on taxes
introduced by Dyck and Zingales (2004) ) and firm-level variables ((6) the natural
logarithm of the total assets in thousands of U.S. dollars, (7) the firm pre-tax income in
billions of U.S. dollars, (8) the annual asset growth rate of the firm, and (9) the leverage
ratio which is defined as total debt divided by total assets.
In unreported results, we find that the difference in the anti-self dealing indexes, the
extra-legal index, the natural logarithm of the total assets, and the firm's pre-tax income
increase the likelihood that a firm cross-lists on U.S. markets. Also, large firms and
firms with high pre-tax income are more likely to cross-list on U.S. markets. The former
result is consistent with Reese and Weisbach (2002) and Doidge et al.'s (2007) findings.
When these results are confronted to the main evidence presented in this paper, we can
see that the variables that do flot explain the decision to cross-list explain instead the
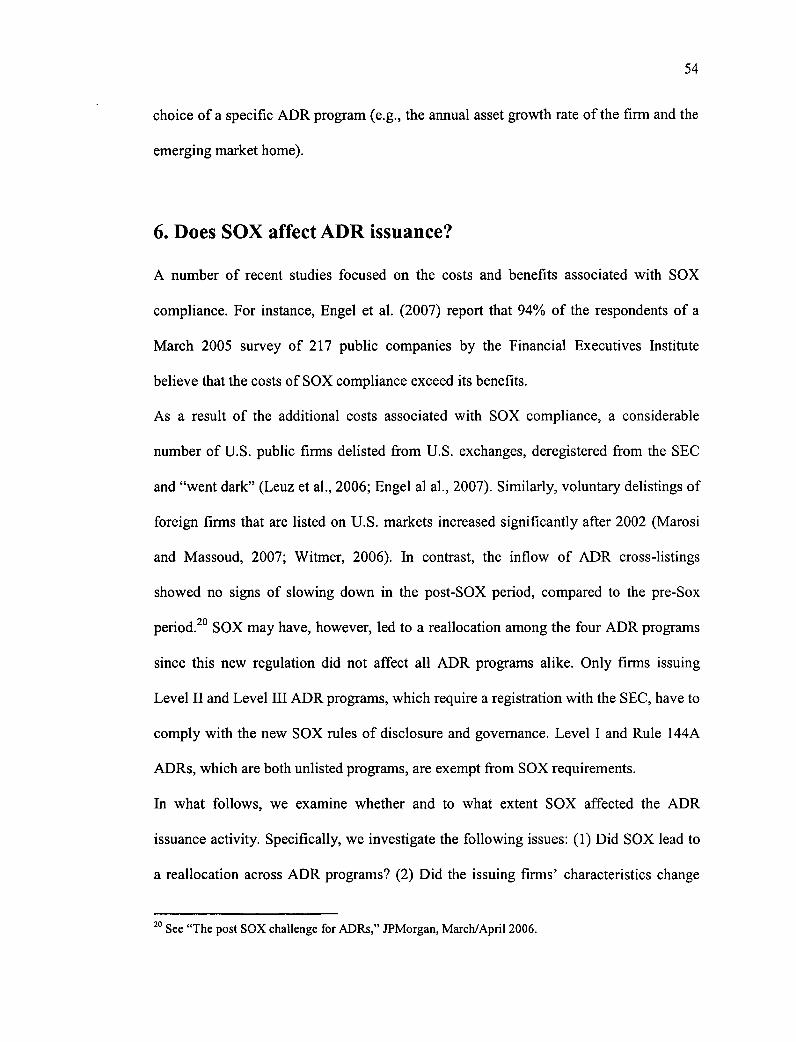
54
choice of a specific ADR program (e.g., the armual asset growth rate of the firm and the
emerging market home).
6. Does SOX affect ADR issuance?
A number of recent studies focused on the costs and benefits associated with SOX
compliance. For instance, Engel et al. (2007) report that 94% of the respondents of a
March 2005 survey of 217 public companies by the Financial Executives Institute
believe that the costs of SOX compliance exceed its benefits.
As a result of the additional costs associated with SOX compliance, a considerable
number of U.S. public firms delisted from U.S. exchanges, deregistered from the SEC
and "went dark" (Leuz et al., 2006; Engel al al., 2007). Similarly, voluntary delistings of
foreign firrns that are listed on U.S. markets increased significantly after 2002 (Marosi
and Massoud, 2007; Witmer, 2006). In contrast, the inflow of ADR cross-listings
showed no signs of slowing clown in the post-SOX period, compared to the pre-Sox
period. 2° SOX may have, however, led to a reallocation among the four ADR programs
since this new regulation did not affect ail ADR programs alike. Only firms issuing
Level II and Level III ADR programs, which require a registration with the SEC, have to
comply with the new SOX rules of disclosure and governance. Level I and Rule 144A
ADRs, which are both unlisted programs, are exempt from SOX requirements.
In what follows, we examine whether and to what extent SOX affected the ADR
issuance activity. Specifically, we investigate the following issues: (1) Did SOX lead to
a reallocation across ADR programs? (2) Did the issuing firms' characteristics change
20 See "The post SOX challenge for ADRs," JPMorgan, March/April 2006.
55
around the implementation of SOX? (3) Did the determinants of the likelihood of
choosing one type of ADR in the period before SOX differ from the period after? Since
our sample spans the period 1990 through 2006 and includes the four ADR programs, it
provides us with a unique opportunity to examine these issues.
In the following sections, we investigate the impact of SOX on ADR activity, the choice
of a given ADR program, and the determinants of the probability of choosing a specific
ADR program.
6.1. Is there any reallocation between the different ADR programs
before and after SOX?
We draw from the universe of ADRs those that were issued between 1998 and 2001 (the
pre-SOX period), and between 2003 and 2006 (the post-SOX period), and we compare
the percentage of each ADR program from these two periods. We find that the share of
capital-raising programs (i.e., Rule 144A and Level III) increases in the post-SOX
compared to the pre-SOX period. Indeed, in the post-SOX period, 30.4% of ail ADRs
are issued as Rule 144A as compared to 12.7% in the pre-SOX period, and Level III
programs attract 15.7% of the total ADRs in the post-SOX period compared to 10.3% in
the pre-SOX. We also find that the proportion of Level II ADRs decreased in the post-
SOX period, dropping from 27.1%. to 14.4%. Likewise, firms issue relatively fewer
Level I ADRs in the post-SOX period, decreasing from 41.9% to 39.5%.
This evidence suggests that SOX induced a reallocation among ADR programs, as firms
tend to issue more Rule 144A and Level III and fewer Level II ADRs in the post-SOX
than in the pre-SOX period. Zingales (2006) also documents a significant increase in the
56
number of 144A registrations after SOX. The advantage of Rule 144A is that it allows
issuing firms to raise extemal capital on U.S. markets among Qualified Institutional
Buyers, without having to comply with the full SEC disclosure, accounting obligations,
and public offering requirements. In other words, they are exempt from the mandatory
govemance and accounting requirements imposed on the major U.S. exchanges after
SOX, and still benefit from access to U.S. externat capital resources via "the back door"
(Zingales, 2006). As for Level II, it became more costly after SOX as this program
requires virtually the same compliances as Level III without the access to new capital,
hence explaining the reluctance of firms to seek Level II ADRs, and therefore opting for
Level III in the post-SOX period. This result is in line with what we discussed
previously. Indeed, SOX switches the expected costs/benefits associated with Level II,
therefore some firms find that their benefits no longer outweigh their costs in issuing
Level II ADR after SOX. Level III result is consistent with more bonding and enhanced
bonding benefits following SOX. In the following paragraph, we examine whether the
Level II result is an artifact and is simply due to a change in firms' characteristics that
leads to this reallocation.
6.2. Are the characteristics of issuing firms different before and after
SOX?
We rely on our sample firms to discuss this issue. Table VII reports the results of the
univariate analysis that compares the firms' characteristics over the pre- and post-SOX
periods. The results show that firms issuing Rule 144A in the post-SOX period have
lower growth opportunities (ASSETGR) and relative turnover ratio (RELTOV) than
before SOX. After SOX, firms from emerging markets issue more Rule 144A programs
57
than before. The absolute value of the difference in accounting rating standards
(ACRA7) in the post-SOX period is higher than in the pre-SOX period for those firms
issuing Rule 144A. More precisely, firms that opt for Rule 144A after SOX originate
from countries that present weaker investor protection. Moreover, Rule 144A firms
present a lower wedge between the ultimate control and cash flow rights in the post-
SOX period.
Firms that choose Level I after SOX are smaller, and have lower growth opportunities
(ASSETGR), leverage (LEV), and relative turnover ratio (RELTOV). The results for SIZE
and LEV are consistent with Doidge et al.' s (2007b) findings. Also, the percentage of
emerging market firms selecting Level I is smaller in the post-SOX period. The absolute
values of the differences in accounting ratings (ACRA7) and investor protection
(SELFDEAL) indices are higher. Finally, the ultimate control rights and the difference
between the excess control rights are unexpectedly smaller for firms that choose Level I
after SOX.
Level II firms have a higher pre-tax income (INCOME), a higher difference in
accounting ratings and lower leverage ratios after SOX compared to the period before
SOX. These results are statistically significant at the 10% level.
Finally, for Level III films, the only difference is in the firms' leverage, which is lower
in the post-SOX than in the pre-SOX period.
Insert Table VII about here
Overall, these univariate results suggest that generally firms' attributes, except for
leverage (LEV), do flot change between the period before and after SOX across the four
ADR programs. Moreover, the decrease in Level II programs after SOX is flot due to a
change in firms' characteristics because, firstly, contrary to Level II programs, we assist
58
in an increase in Level III ADRs in the post-SOX period, and secondly, the firms'
attributes, especially those required to be listed on the major U.S. exchanges, generally
do flot change for Levels II and III between the periods before and after SOX. In the
next section, we perform a multivariate analysis that allows us to simultaneously control
for ail these determinants.
6.3. SOX and ADRs: multivariate analysis
To examine whether the impact of our explanatory variables on the probability of
choosing a given ADR program differs across the pre- and post-SOX periods, we re-
estimate the multinomial logit models (reported in Table V) for each sub-period
independently. We separately re-estimate Panels A, E, and F of Table V for each sub-
period. The results of these estimations are summarized in Table VIII.
Table VIII shows that, generally, the estimated marginal effects are in accordance with
those that we report in Table V, and are consistent with the predicted relations in Table
III. We find that the Level I marginal effects for the asset growth variable (ASSETGR)
exhibit a significant and different sign.
Table VIII shows that while they have the same sign, some marginal effects are higher
or lower in the post-SOX period compared to the pre-SOX. When we examine, for
example, the emerging market country dummy, firms from emerging market countries
are more likely to choose Rule 144A in the post-SOX period. More precisely, Panels A,
B, and C of Table VIII show that being an emerging market firm increases the
probability of choosing Rule 144A in the post-SOX period by, respectively, 0.6869,
0.3913, and 0.6729. In the pre-SOX period, this variable is statistically significant only
in Panel A, and the increase in the probability of choosing Rule 144A for an emerging
59
market firm is only 0.1191. 21 The evidence that firms from emerging markets are more
willing to issue Rule 144A ADRs after SOX was enacted is consistent with Lins et al.'s
(2005) and Zingales' (2006) findings that emerging market firms that are faced with
more financial constraints than are developed country firms need to raise more extemal
capital on U.S markets, and are able to do so through Rule 144A (private placements) or
Level III (public offerings). As Level III becomes costly after SOX, especially for
emerging markets firms, these latter become more inclined to issue a Rule 144A ADR (a
relatively less costly program), and raise external capital on U.S. markets among
Qualified Institutional Buyers.
For the difference in anti-self dealing index (SELFDEAL), Panel C shows that a unit
decrease in this difference increases the probability of choosing Level III by 0.1904 and
0.286222 in the pre and post-SOX periods, respectively. This result is consistent with
more bonding and the enhanced bonding benefits after the implementation of SOX.
More precisely, firms from countries where the legal protection of minority shareholders
is weak (compared to the U.S.) are more willing to issue Level III programs in the post-
SOX period than in the pre-SOX one, despite the additional costs implied by the SOX
Act for this level.
Insert Table VIII about here
21 For Panel A, Table 8, we test whether the estimated marginal effect of the emerging market dummy (EMC) in the post-SOX period is higher than in the pre-SOX period using a Wald test. This test shows that the difference between the estimated marginal effects is statistically significant at the 1% level. 22 For Panel C, Table 8, we test whether the estimated marginal effect of the anti-self dealing variable (SELFDEAL) in the post-SOX period is lower than in the pre-SOX period using a Wald test. This test shows that the difference between the estimated marginal effects is statistically significant at the 1% level.
60
7. Conclusion
In this paper, we examine the determinants of firms' decisions to issue one of the four
available ADR programs on an individual basis (Level I, Level II, Level III, and Rule
144A). These four options have distinct attributes. On the one hand, only Level III and
Rule 144A offer an access to U.S. primary capital markets (i.e., raising capital) through
public offerings and private placements, respectively. On the other hand, Level II and
Level III (listed programs) are more restrictive in terms of governance and disclosure
requirements as compared to Level I and Rule 144A (unlisted programs).
Our empirical evidence shows that capital raising Level III programs attract large firms
with high pre-tax income, firms with high growth opportunities, privatized firms, and
firms from weak investor protection environments, which is consistent with the bonding
hypothesis. We likewise find that firms from weak investor protection environments are
also attracted to Rule 144A programs. In addition, we find that after SOX foreign firms
are more reluctant to issue Level II ADRs as SOX switches the expected costs/benefits
associated with these programs. Finally, we document that firms with high ultimate
control rights and excess control rights and those from emerging markets are less likely
to choose Level II and more likely to choose Level I.
We also examine whether the introduction of SOX in 2002 had an impact on the choice
of a particular ADR. We find that after SOX, firms are more attracted by capital-raising
programs, either Level III or Rule 144A, and are more reluctant to issue Level II.
Indeed, this inter-program reallocation shows that raising fresh capital on U.S. markets
seems to be an important motive to cross-list after SOX. Our multivariate analysis shows
that being an emerging market firm heightens the probability of choosing Rule 144A
61
after SOX compared to the period before. Similarly, coming from a country with weak
legal protection of minority shareholders increases the likelihood of cross-listing under
Level III in the post-SOX period as compared to the pre-SOX. This latter result is
consistent with more bonding and the enhanced bonding benefits after the
implementation of SOX. Indeed, the corporate governance requirements of SOX
strengthen the bonding characteristics of the listed programs (Level II and Level III).
62
References
Aggarwal, R., Dahiya, S., Klapper, L., 2007. ADR holdings of US-based emerging market funds. Journal of Banking and Finance 31, 1649-1667.
Bailey, W., Karolyi, A., Salva, C., 2006. The economic consequences of increased disclosure: Evidence from international cross-listings. Journal of Financial Economics 81, 175-213.
Bank of New York, The depositary receipts markets, 2005 yearbook.
Baker, H., Nofsinger, J., Weaver, D., 2002. International cross-listing and visibility. Journal of Financial and Quantitative Analysis 37, 495-521.
Benos, E., Weisbach, M., 2004. Private benefits and cross-listings in the United States. Emerging Markets Review 5, 217-240. Bennedsen, M., Wolfenzon, D., 2000. The balance of power in closely held corporations. Journal of Financial Economics 58,113-139.
Bortolotti, B., Fantini, M., Scarpa, C., 2002. Why do governments privatize abroad? International Review of Finance 3, 131-163.
Burns, N., Francis, B., Hasan, I., 2007. Cross-listing and legal bonding: Evidence from mergers and acquisitions. Journal of Banking and Finance 31,1003-1031.
Campbell, J., 1996. Understanding risk and return. Journal of Political Economy 104, 298-345. Citibank, 2005. Depositary receipts: information guide.
Claessens, S., Djankov, S., Lang, L., 2000. The separation of ownership and control in East Asian corporations. Journal of Financial Economics 58, 81-112.
Coffee, J., 1999. The future as history: the prospects for global convergence in corporate governance and its implication. Northwestern Law Review 93, 641-707.
Coffee, J., 2002. Racing toward the top?: The impact of cross-listings and stock market competition on international corporate governance. Columbia Law Review 93, 1757- 1831.
Coffee, J., 2007. Law and the market: The impact of enforcement. Columbia University School of Law working paper.
Djankov, S., La Porta, R., Lopez-de-Silanes, F., Shleifer, A., 2008. The law and economics of self-dealing. Journal of Financial Economics 88, 430-465.
Doidge, C., 2004. Cross-listings and the private benefits of control: evidence from dual-class firms. Journal of Financial Economics 72, 519-553.
Doidge, C., Karolyi, G. A., Stulz, R. M., 2004. Why are foreign firms listed in the U.S. worth more? Journal of Financial Economics 71, 205-238.
Doidge, C., Karolyi, G. A., Lins, K., Miller, D., Stulz, R. M., 2007a. Private benefits of control, ownership, and the cross-listing decision. Journal of Finance, forthcoming.
63
Doidge, C., Karolyi, G. A., Stulz, R. M., 2007b, Has New York become less competitive in global markets? Evaluating foreign listing choices over time. Journal of Financial Economics, forthcoming. Dyck, A. Zingales, L., 2004. Private Benefits of Control: An International Comparison. Journal of Finance 59, 537-600. Eiteman, D., Stonehill, A., Moffett, M., 2007. Multinational Business Finance. Pearson Education, Inc. Engel, E., Hayes, R., Wang, X., 2007. The Sarbanes-Oxley Act and firms' going-private decisions. Journal of Accounting and Economics 44, 116-145.
Errunza, V., Miller, D., 2000. Market segmentation and the cost of the capital in international equity markets. Journal of Financial and Quantitative Analysis 35, 577- 600. Faccio, M., Lang, L., 2002. The ultimate ownership of Western European corporations. Journal of Financial Economics 65, 365-395. Foerster, S., Karolyi, A., 1999. The effects of market segmentation and investor recognition on assets prices: evidence from foreign stocks listing in the United States. Journal of Finance 54, 981-1013. Gomes, A., Novaes, W., 1999. Multiple large shareholders in corporate governance. Unpublished working paper, University of Pennsylvania, Wharton.
Greene, W., 2003. Econometric analysis, Prentice Hall. Hail, L., Leuz, C., 2005. Cost of capital and cash flow effects of U.S. cross-listings. University of Pennsylvania working paper. Hausman, J., McFadden, D., 1984. A specification test for the multinomial logit model, Econometrica 52, 1219-1240. Hensher, D., Rose, J., Greene, W., 2005. Applied choice analysis: a primer. Cambridge University Press. JPMorgan, February 2006. ADR reference guide. JPMorgan, March/April 2006. The post-SOX challenge for ADRs.
JP Morgan, October 2006. ADR guide. Karolyi, G. A., 2006. The world of cross-listings and cross-listings of the world: challenging conventional wisdom. Review of Finance 10, 1-54.
La Porta, R., Lopez-de-Silanes, F., Shleifer, A., 1999. Corporate ownership around the world. Journal of Finance 54, 471-517. La Porta, R., Lopez-de-Silanes, F., Shleifer, A., Vishny, R., 1997. Legal determinants of external finance. Journal of Finance 52, 1131-1150. La Porta, R., Lopez-de-Silanes, F., Shleifer, A., Vishny, R., 1998. Law and finance. Journal of Political Economy 106, 1113-1155.
64
Lang, M., Lins, K., Miller, D., 2003. ADRs, analysts, and accuracy: does cross-listing in the US improve a firm's information environment and increase market value? Journal of Accounting Research 41, 363-386.
Lang, M., Lins, K., Miller, D., 2004. Concentrated Control, Analyst Following, and Valuation: Do analysts matter most when investors are protected least? Journal of Accounting Research 42, 589-623.
Lang, M., Raedy, J., Wilson, W., 2006. Earnings management and cross-listing: Are reconciled earnings comparable to US earnings? Journal of Accounting and Economics 42, 255-283.
Lel, U., Miller, D., 2008. International Cross-listing, Firm Performance and Top Management Turnover: A Test of the Bonding Hypothesis. Journal of Finance 63, 1897- 1937.
Leuz, C., Triantis, A., Wang, T., 2006. Why do firms go dark? Causes and economic consequences of voluntary SEC deregistrations. University of Maryland working paper.
Lins, K., 2003. Equity ownership and firm value in emerging markets. Journal of Financial and Quantitative Analysis 38, 159-184.
Lins, K., Strickland, D., Zenner, M., 2005. Do non-U.S. firms issue equity on U.S. exchanges to relax capital constraints? Journal of Financial and Quantitative Analysis 40, 109-133.
Litvak, K., 2007. The effect of the Sarbanes-Oxley Act on non-US companies cross-listed in the US. Journal of Corporate Finance 13, 195-228.
Marosi, A., Massoud, N., 2007. Why do firms go dark? Journal of Financial and Quantitative Analysis 42, 421-442.
McFadden, D., 1974. Conditional logit analysis of qualitative choice behavior. In P. Zarembka (ed.), Frontiers of Econometrics, New York: Academic Press, 105-142.
Megginson, W., Netter, J., 2001. From state to market: a survey of empirical studies on privatization. Journal of Economic Literature 39, 321-389.
Miller, D., 1999. The market reaction to international cross-listing: Evidence from depositary receipts. Journal of Financial Economics 51, 103-123.
Pagano, M. Roel, A., Zechner, J., 2002. The geography of equity listing: why do companies list abroad? Journal of Finance 57, 2651-2694.
Piotroski, J., Srinivasan, S., 2007. The Sarbanes-Oxley Act and the flow of international listings. University of Chicago working paper.
Reese, W., Weisbach, M., 2002. Protection of minority shareholder interests, cross-listings in the United States, and subsequent equity offerings. Journal of Financial Economics 66, 65-104.
Sarkissian, S., Schill, M. 2006. Are there permanent valuation gains to overseas listing? Evidence from market sequencing and selection. Review of Financial Studies, forthcoming.
65
Siegel, J., 2005. Can foreign firms bond themselves effectively by submitting to U.S. law? Journal of Financial Economics 75, 319-360.
Stulz, R., 1999. Globalization of equity markets and the cost of capital. Journal of Applied Corporate Finance 12, 8-25. Witmer, J., 2006. Why do firms cross-delist? An examination of the determinants and effects of cross-delisting. Queen's University working paper.
Wooldridge, J., 2001. Econometric analysis of cross section and panel data. The MIT Press. Zingales, L., 2006. Is the U.S. capital market losing its competitive edge? Journal of Economic Perspectives, forthcoming.
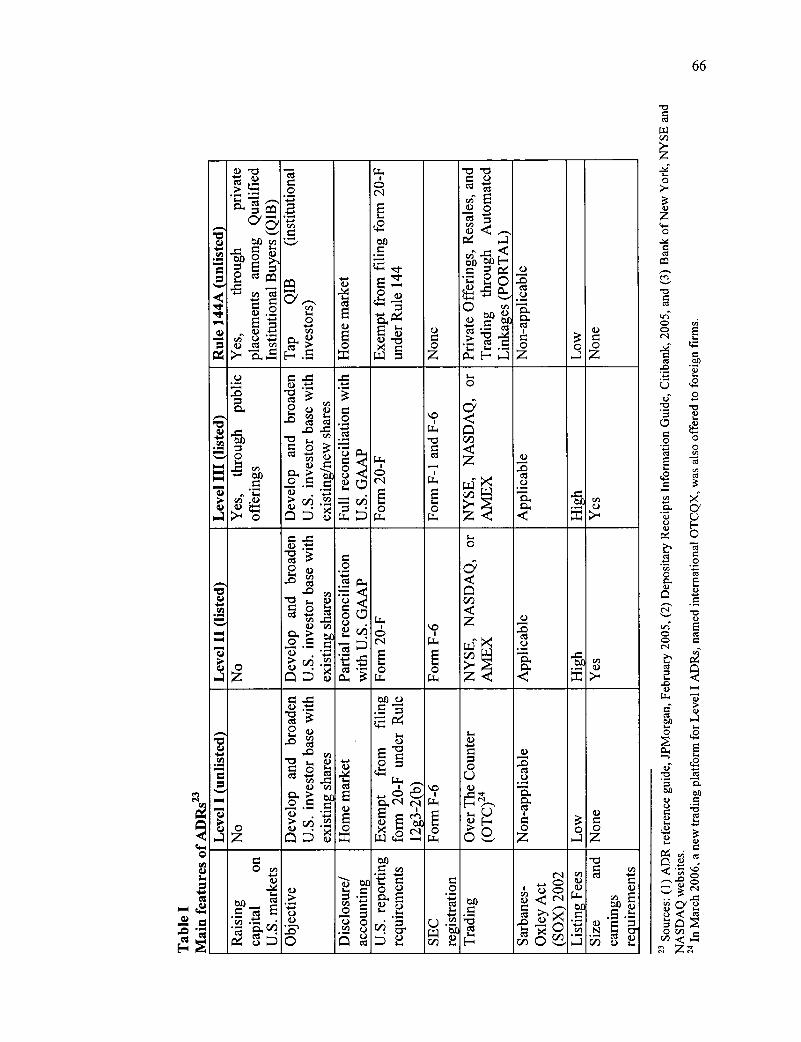
r•I
Rul
e 14
4A (u
nlis
ted)
Yes
, t
hrou
gh p
rivat
e pl
acem
ents
amon
g Q
ualif
ied
Inst
itutio
nal B
uyer
s (Q
IB)
Tap Q
IB
(in
stitu
tiona
l in
vesto
rs)
Hom
e m
arke
t
Exem
pt f
rom
fili
ng f
orm
20-
F un
der R
ule
144
a) z 0 Z Pr
ivat
e O
fferin
gs, R
esal
es, a
nd
Trad
ing t
hrou
gh A
utom
ated
Li
nkag
es (P
ORT
AL)
Non
-app
licab
le
Low
là = 0 Z
.--, "CS a> ,i-■ cil ..-. 4—. ,.....,
1.4.44
7.i › CI)
Yes
, t
hrou
gh p
ublic
of
ferin
gs
Dev
elop
and br
oade
n U
.S.
inve
stor
base
with
ex
istin
g/ne
w s
hare
s
Full
reco
ncili
atio
n w
ith
U.S
. GA
AP
Form
20-
F
Form
F-1
and
F-6
NY
SE,
NA
SDA
Q, o
r A
MEX
App
licab
le
High
cn (1)
.s, a> -+-. e .... .--, .....,
N. 1-1
7.) › cu 0
Dev
elop
and br
oade
n U
.S.
inve
stor
base
with
ex
istin
g sh
ares
Part
ial r
econ
cilia
tion
with
U.S
. GA
AP
Fo
rm 2
0-F
`f w Ê 0 N
YSE
, N
ASD
AQ
, or
AM
EX
App
licab
le
Hig
h cn a.)
Lev
el I
(unl
iste
d)
0Z D
evel
op a
nd br
oade
n U
.S.
inve
stor
bas
e w
ith
exist
ing
shar
es
Hom
e m
arke
t
Exem
pt
from
fil
ing
form
20-
F un
der
Rule
12g3
-2 ( b
)
%.0
Ê 0
Us Ove
r The
Cou
nter
(O
TC)"
Non
-app
licab
le
Low
cl) = 0 Z
Rais
ing
capi
tal
on
U.S
. mar
kets
[
Obj
ectiv
e
Disc
losu
re/
acco
untin
g U
.S. r
epor
ting
requ
irem
ents
SEC
regi
stra
tion
Trad
ing
Sarb
anes
- O
xley
Act
(S
OX
) 200
2 I L
istin
g Fe
es
Size
an
d ea
rnin
gs
requ
irem
ents
66
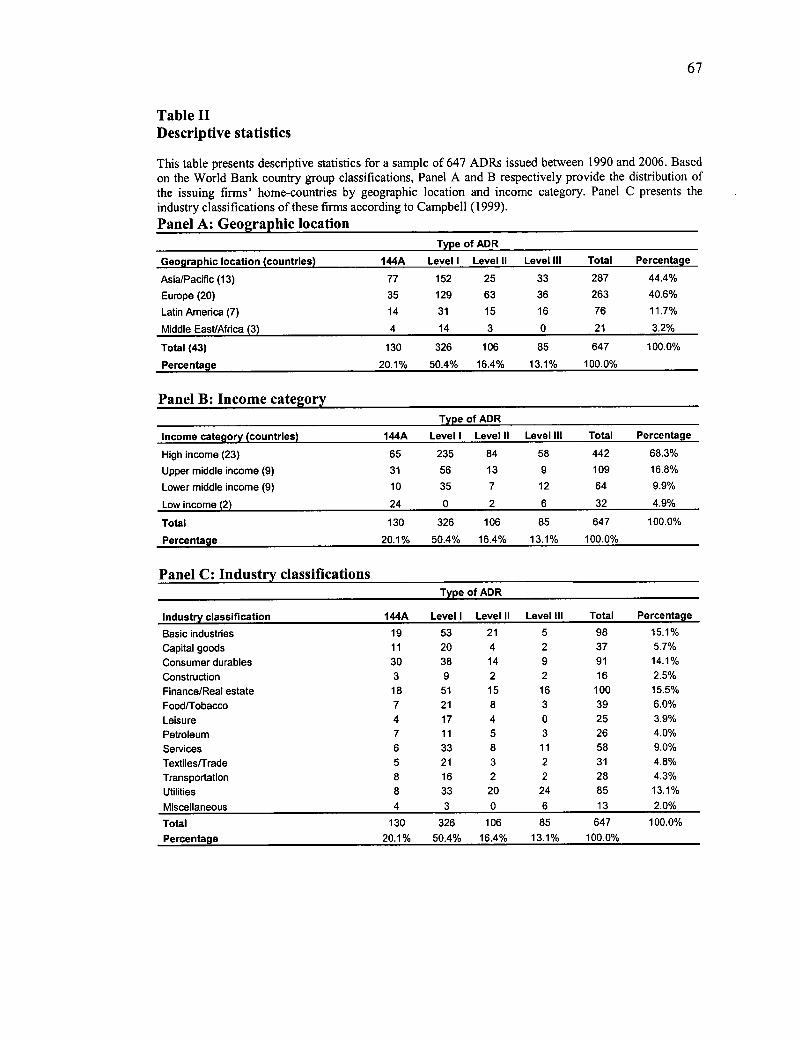
67
Table II Descriptive statistics
This table presents descriptive statistics for a sample of 647 ADRs issued between 1990 and 2006. Based on the World Bank country group classifications, Panel A and B respectively provide the distribution of the issuing firms' home-countries by geographic location and income category. Panel C presents the industry classifications of these firms according to Campbell (1999). Panel A: Geographic location
Type of ADR
Geographic location (countries) 144A Level I Level II Level III Total Percentage
Asia/Pacific (13) 77 152 25 33 287 44.4%
Europe (20) 35 129 63 36 263 40.6%
Latin America (7) 14 31 15 16 76 11.7%
Middle East/Africa (3) 4 14 3 0 21 3.2%
Total (43) 130 326 106 85 647 100.0%
Percentage 20.1% 50.4% 16.4% 13.1% 100.0%
Panel B: Income category Type of ADR
Income category (countries) 144A Level I Level II Level III Total Percentage
High income (23) 65 235 84 58 442 68.3%
Upper middle income (9) 31 56 13 9 109 16.8%
Lower middle income (9) 10 35 7 12 64 9.9%
Low income (2) 24 0 2 6 32 4.9%
Total 130 326 106 85 647 100.0%
Percentage 20.1% 50.4% 16.4% 13.1% 100.0%
Panel C: Industry classifications Type of ADR
Industry classification 144A Level I Level II Level III Total Percentage
Basic industries 19 53 21 5 98 15.1% Capital goods 11 20 4 2 37 5.7% Consumer durables 30 38 14 9 91 14.1% Construction 3 9 2 2 16 2.5% Finance/Real estate 18 51 15 16 100 15.5% Food/Tobacco 7 21 8 3 39 6.0% Leisure 4 17 4 0 25 3.9% Petroleum 7 11 5 3 26 4.0% Services 6 33 8 11 58 9.0% Textiles/Trade 5 21 3 2 31 4.8% Transportation 8 16 2 2 28 4.3% Utilities 8 33 20 24 85 13.1%
Miscellaneous 4 3 0 6 13 2.0%
Total 130 326 106 85 647 100.0% Percentage 20.1% 50.4% 16.4% 13.1% 100.0%
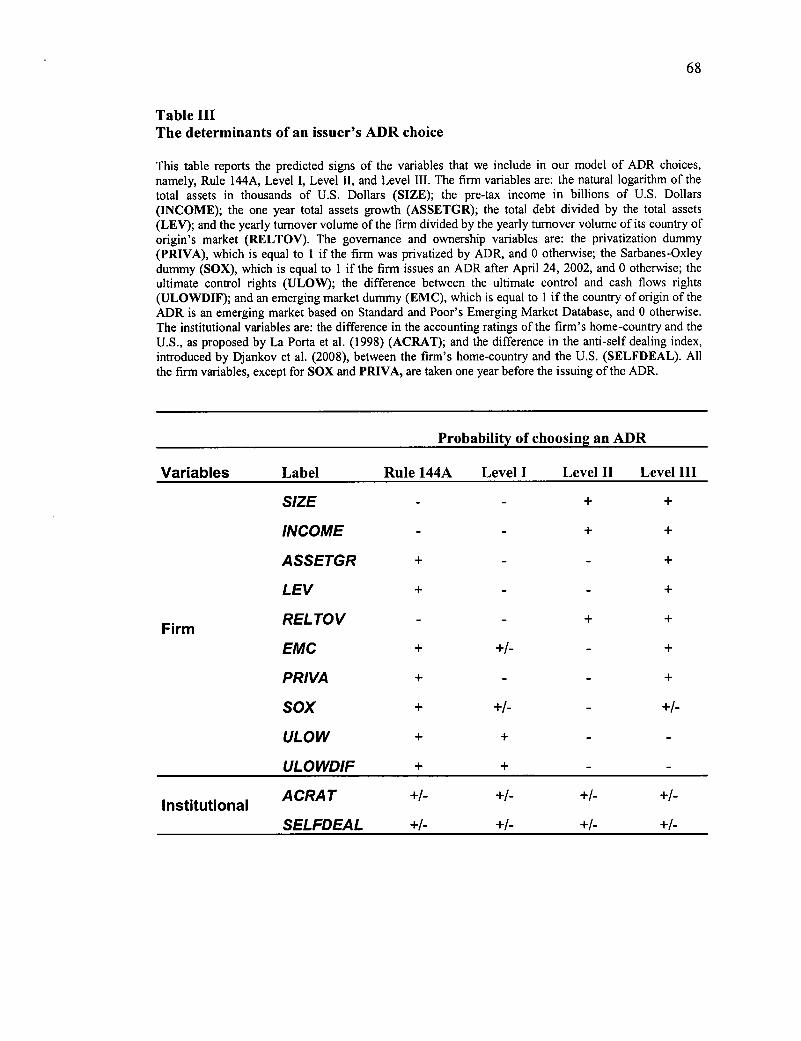
68
Table III The determinants of an issuer's ADR choice
This table reports the predicted signs of the variables that we include in our model of ADR choices, namely, Rule 144A, Level I, Level II, and Level III. The firm variables are: the natural logarithm of the total assets in thousands of U.S. Dollars (SIZE); the pre-tax income in billions of U.S. Dollars (INCOME); the one year total assets growth (ASSETGR); the total debt divided by the total assets (LEV); and the yearly turnover volume of the firm divided by the yearly turnover volume of its country of origin's market (RELTOV). The governance and ownership variables are: the privatization dummy (PRIVA), which is equal to 1 if the firm was privatized by ADR, and 0 otherwise; the Sarbanes-Oxley dummy (SOX), which is equal to 1 if the firm issues an ADR after April 24, 2002, and 0 otherwise; the ultimate control rights (ULOW); the difference between the ultimate control and cash flows rights (ULOWDIF); and an emerging market dummy (EMC), which is equal to 1 if the country of origin of the ADR is an emerging market based on Standard and Poor's Emerging Market Database, and 0 otherwise. The institutional variables are: the difference in the accounting ratings of the firm's home-country and the U.S., as proposed by La Porta et al. (1998) (ACRAT); and the difference in the anti-self dealing index, introduced by Djankov et al. (2008), between the firm's home-country and the U.S. (SELFDEAL). All the firm variables, except for SOX and PRIVA, are taken one year before the issuing of the ADR.
Probability of choosing an ADR
Variables Label Rule 144A Level I Level II Level III
SIZE + +
INCOME + +
ASSETGR + +
LEV + +
Firm RELTOV + +
EMC + +I- +
PRIVA + +
SOX + +/- +/-
ULOW + +
ULOWDIF + +
Institutional ACRAT +/- +/- +1-
SELFDEAL +I- +I- +I- +I-
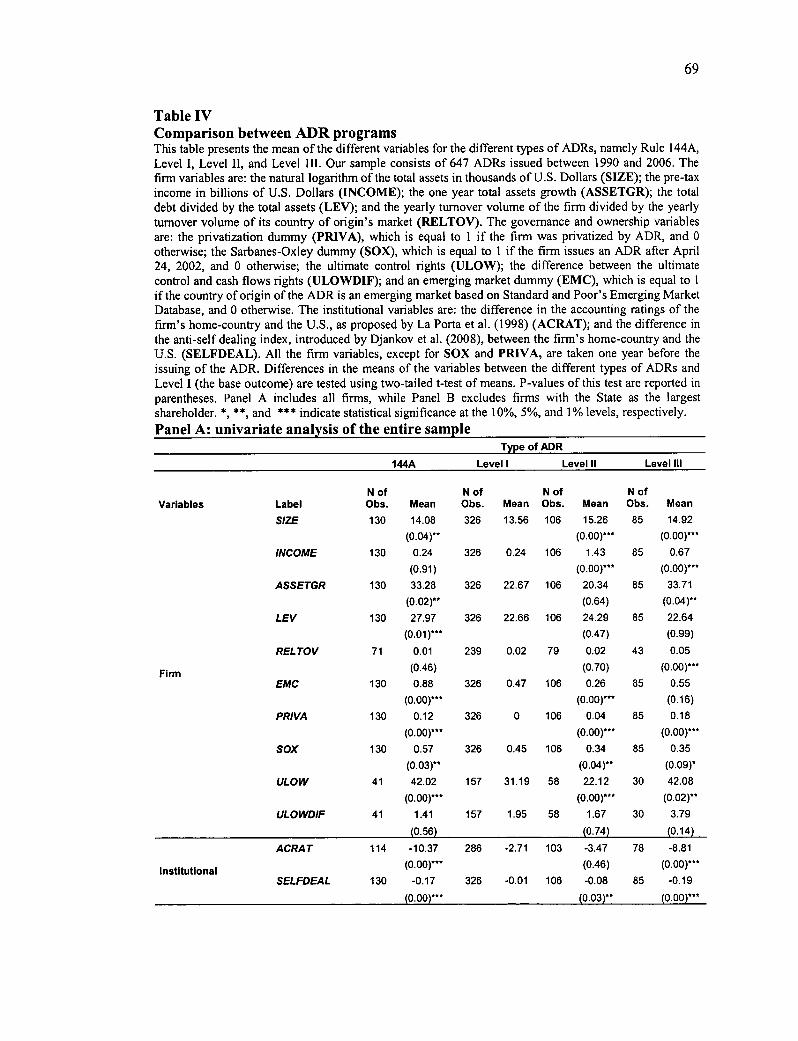
69
Table IV Comparison between ADR programs This table presents the mean of the different variables for the different types of ADRs, namely Rule 144A, Level I, Level II, and Level III. Our sample consists of 647 ADRs issued between 1990 and 2006. The firm variables are: the natural logarithm of the total assets in thousands of U.S. Dollars (SIZE); the pre-tax income in billions of U.S. Dollars (INCOME); the one year total assets growth (ASSETGR); the total debt divided by the total assets (LEV); and the yearly turnover volume of the firm divided by the yearly turnover volume of its country of origin's market (RELTOV). The governance and ovvnership variables are: the privatization dummy (PRIVA), which is equal to 1 if the firm was privatized by ADR, and 0 otherwise; the Sarbanes-Oxley dummy (SOX), which is equal to 1 if the firm issues an ADR after April 24, 2002, and 0 otherwise; the ultimate control rights (ULOW); the difference between the ultimate control and cash flows rights (ULOWDIF); and an emerging market dummy (EMC), which is equal to 1 if the country of origin of the ADR is an emerging market based on Standard and Poor's Emerging Market Database, and 0 otherwise. The institutional variables are: the difference in the accounting ratings of the firm's home-country and the U.S., as proposed by La Porta et al. (1998) (ACRAT); and the difference in the anti-self dealing index, introduced by Djankov et al. (2008), between the firm's home-country and the U.S. (SELFDEAL). All the firm variables, except for SOX and PRIVA, are taken one year before the issuing of the ADR. Differences in the means of the variables between the different types of ADRs and Level I (the base outcome) are tested using two-tailed t-test of means. P-values of this test are reported in parentheses. Panel A includes ail firms, while Panel B excludes firms with the State as the largest shareholder. *, **, and *** indicate statistical significance at the 10%, 5%, and 1% levels, respectively. Panel A: univariate analysis of the entire sample
Type of ADR
144A Level I Level II Level III
Variables Label N of Obs. Mean
N of Obs. Mean
N of Obs. Mean
N of Obs. Mean
SIZE 130 14.08 326 13.56 106 15.26 85 14.92
(0.04)** (0.00)*** (0.00)***
INCOME 130 0.24 326 0.24 106 1.43 85 0.67
(0.91) (0.00)*** (0.00)***
ASSETGR 130 33.28 326 22.67 106 20.34 85 33.71
(0.02)** (0.64) (0.04)**
LEV 130 27.97 326 22.66 106 24.29 85 22.64
(0.01)*** (0.47) (0.99)
RELTOV 71 0.01 239 0.02 79 0.02 43 0.05
Firm (0.46) (0.70) (0.00)***
EMC 130 0.88 326 0.47 106 0.26 85 0.55 (0.00)*** (0.00)*** (0.16)
PRIVA 130 0.12 326 0 106 0.04 85 0.18
(0.00)*** (0.00)*** (0.00)***
SOX 130 0.57 326 0.45 106 0.34 85 0.35
(0.03)** (0.04)** (0.09)*
ULOW 41 42.02 157 31.19 58 22.12 30 42.08
(0.00)*** (0.00)*** (0.02)**
ULOVVDIF 41 1.41 157 1.95 58 1.67 30 3.79
(0.56) (0.74) (0.14)
ACRAT 114 -10.37 286 -2.71 103 -3.47 78 -8.81
Institutional (0.00)*** (0.46) (0.00)***
SEL FDEAL 130 -0.17 326 -0.01 106 -0.08 85 -0.19
(0.00)*** (0.03)** (0.00)***
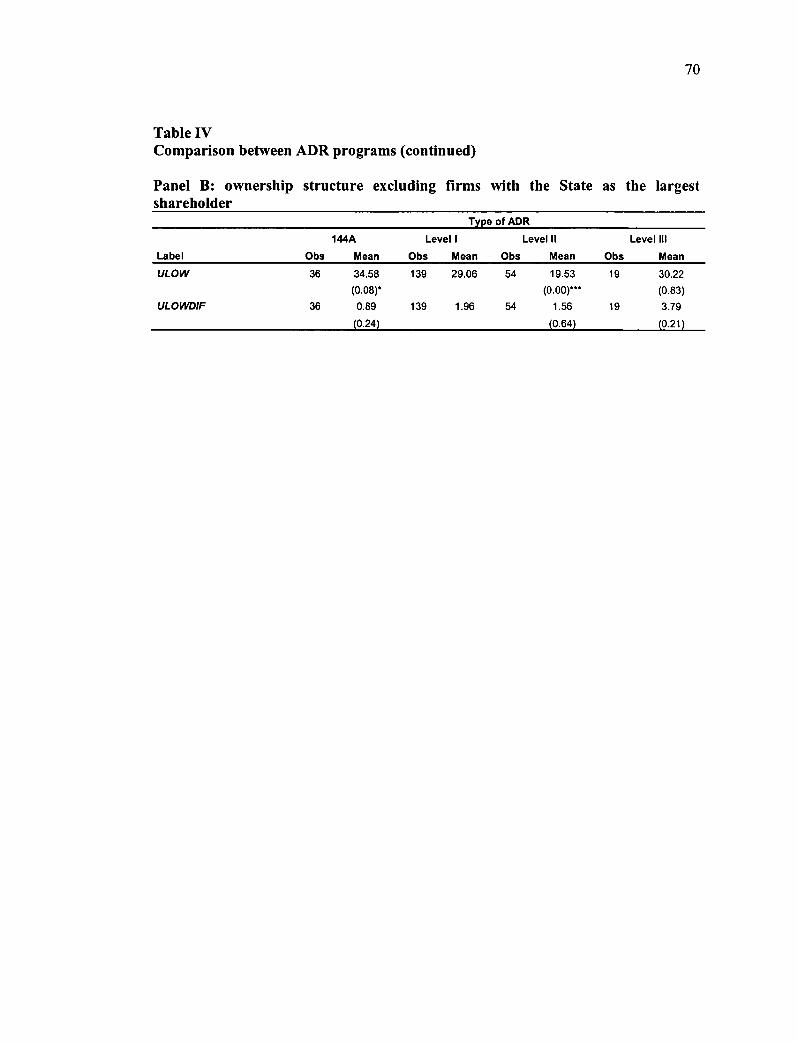
70
Table IV Comparison between ADR programs (continued)
Panel B: ownership structure excluding firms with the State as the largest shareholder
Type of ADR
144A Level I Level II Level III
Label Obs Mean Obs Mean Obs Mean Obs Mean
ULOW 36 34.58 139 29.06 54 19.53 19 30.22 (0.08)* (0.00)*** (0.83)
ULOWDIF 36 0.89 139 1.96 54 1.56 19 3.79
(0.24) (0.64) (0.21)
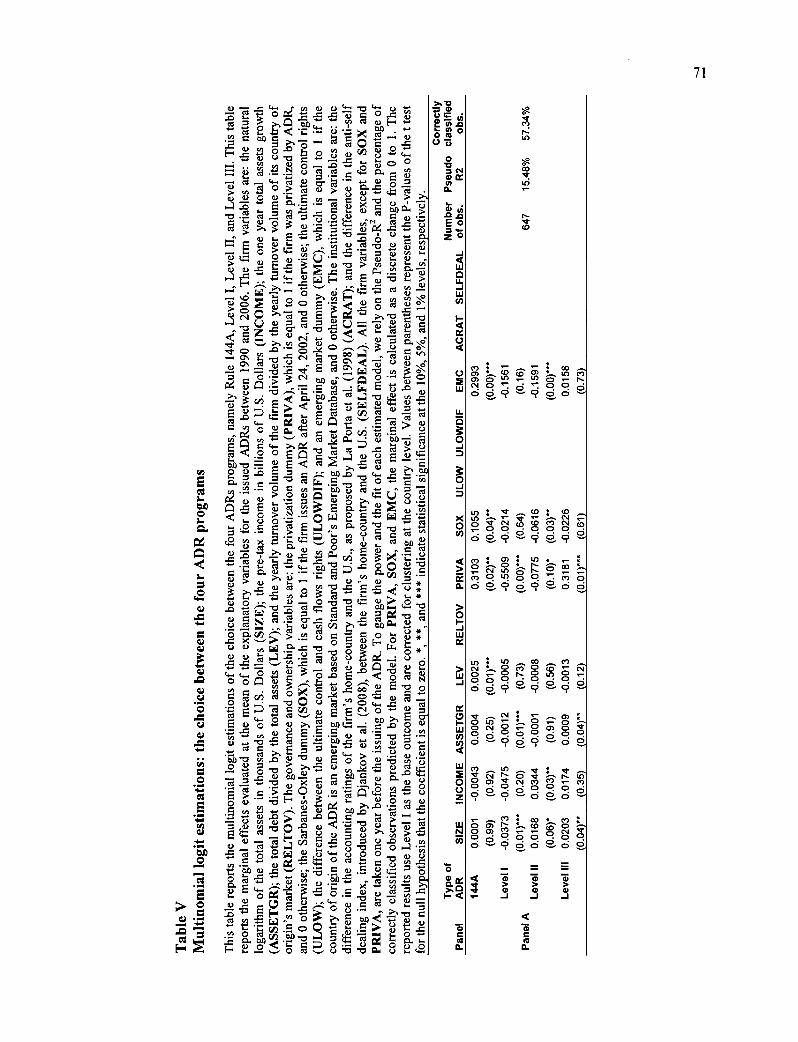
• s- : co CD co
O) c) .- in 0 •- CNI a d •". o dg-9c:So
co co - "c1' CNIco CO C', (N cr, 0 0 • CD c7 0 • d g (2- ci' d e.
0 O CNI IX)
ce, 0 IO ez)
Odgd
11) « o
9e.
IX) CO ln C■J 0 Fs) C'S ‘- O. icr);
• o d
z d 9 9 9
<,1 - : 0 F., 0 NI"
o d d 9d ; do d o e.
ef a ô' ir r- ô " ci c , ; „.G . 9; , ...z;
oz) c, • O (0--- O 0 Cs! 't
° d -cj • g° d°° °° d d d
4II > a- -I -I -I
r- d
ULO
W U
LOW
DIF
IN
CO
ME
AS
SE
TG
R
it O. >L 0
<
Q.
71
0, 7 •zt ..= 4. _ j• çn CU Q ce: '0 .47:,. 0 cn -■-• I- - o 7-1 X ce • ,,,,
vl a bl) = C = ,... -•-• '"' o >. -c3 '-' - ce %•-•' o -5- A cl) in 0 «0 1. VI ci) el 04' .L:) 4.
■-■ . . 'el cn u Ô -7, -e à '47) ° vo, _ li 0 â•le•L■4 ("Le e ''' e' E ° > vi
1.) -o . ce ô°C -E•oôô
co E ;
> .-6 e
.... -•-• 3 ..o. "e ..75 o ' -E. cn i-i E C ce L,':" 4)" - `e ..'M •=j "e 4'-.) a c.) 8.- o 0 y .e' Ci- - ,'rd. 5 Li.). cià . ....
ct . i E ..c F ri, -cs > ..- ce, ..0 g t-. •- u 4 „t,-0 - >
E- ,..., >, .... -.5_ ...., • - - .0 0 C.)
Iii 1-• > g fi o E - cu o `a co o a (si 0 >, 1 -
2 E '-' >••• ms = -0 )4 uu=„1 0 .1>u=.1-,,It u 0 ‹.. ces '''''-• ° cN" .-. 0 ,-., d" •;1- C, '...... I' .:1 g 1) C7 .-. •"•, 3 o
7 er,
.., ,...,, ce .4 , -
t' u -
4à .CP ° t . o o ..e e c•I ,,,, ..--..,p o -- ce 5 A V . ,,i :E -7.9 • e â '-' E ti 2 _ 0 >, e •.--,i ra. en
Q .àej 15 "1A -'7) « te U ' E - ce cn MI 4. tu 0 (Z `-' c v) 0 a) ou 0 ...., .: "c
< '-' e/ c% 1̀" 0.
c -4
,.,.-'1 r) .a.,,L, cg
I...
s-■ m . c
oe •, c„ > 0 t? rz b,.. „, 4-■ %.„,4 _ . 2 ' .' F) e g
2 e *.t.I''''3 0 2 b. ''' W -e• Fs' o
.o 3... 2 - C? -cl '5 .-■-, - $... > .'s, v) cu 0 e3 0,
4. 0 cn x E •ir, te ....., 0 ce ,.., 5_, cu .., ,,, ,.„(1) 70- 2," a) ..0 .-. r/i b' e x S. ••.I.'
Ir+ e I) â -5- 0 0 1 0-1" e, , ..4:.- .
.0
I-■ """' C.) - Cà ., -. *
yb '' 7.5 e' 0 0 ... G.) - 0 - cs "V ca tau ....• 4.,c, ..„, g g 0=ee .,,,c 0 N es .5- tes .- ..= ,e .._
' „, ca
' I ' (p e z . z . ' ; u e
.« x »--,> ;. - ° o ' CU E. 0 C.) 0 y W CL. .0 -17 0 0 *
0 0 7 1. 2 2 ° 'a o • c) ...= e .4. •■-• 1.4 4. ci. -75 Ln (1) 0 0 o n 1„),..e, g 11-.) Q 0,- 0 E -ce Q VI
0- ... CD "..5 0 g 2".:. 0 cl) • "0 çieR 0 â ...." C0'. te.. ..0 CO -c-a c cn , E e eq 0 - g 1 E
0«, g•'-' .g a; >-, ,-- tp-o te -
, t... e .... ce ...-, .,_.
.t.,,•2 .......,,, j, _a) 6.) E • E •,-,e or e . e.- « "..."' C) ..... -e, e E .±.-: vl a) •- rn -4. o CC o o 1- .... _a ..4) •-• 0.) ti).17 .7 0 "' 0 = 0 d cu -o Cà v) . 5 o 2 « ..,:, 0
ce ° t).) bf) --. z t1:1 z 1-‘,. 0 -,E mi 4., x g ca c cu e.). n' 0 '') . -É. 0 . -0 E- c.„ . ci) . ,...,-- 4. >-,..0 •- ce ..o
.... .-. *A •26. ■••••■ = ..,, Q › es ' .-- -o u
III
1-/. 4-4 c â '""' •-• ri ..0 0 +a. •0 >., ,i.) ..:,..?...c „, ._ - P (*) cl) .... = 0 ... u el ,. CA 4.) ,...t, 0 0 1.) ..0 0 VI
CL) C,1 c) -01 0 0 ,- ',71
, ,,,....„ , -F,,, ,,•>, .0A w 0 k; ti. 0 o o
E'Ez .. . ., .
••-. 0 ..&? .,5. 0 „2 = ... ...... ...- :
. Et. E ,.. •-•• -bd . k ,e I-' = hj , cct e ...
- ..._-
s-. o -g, ..= F c, •-• • ;----.3 = eoârtlep.,,,4S ) .71.z °È 'i:.,,_ 7...
le, e ...5 . g" mie s..., cr° 'E:1 -ou ie. 8 P745
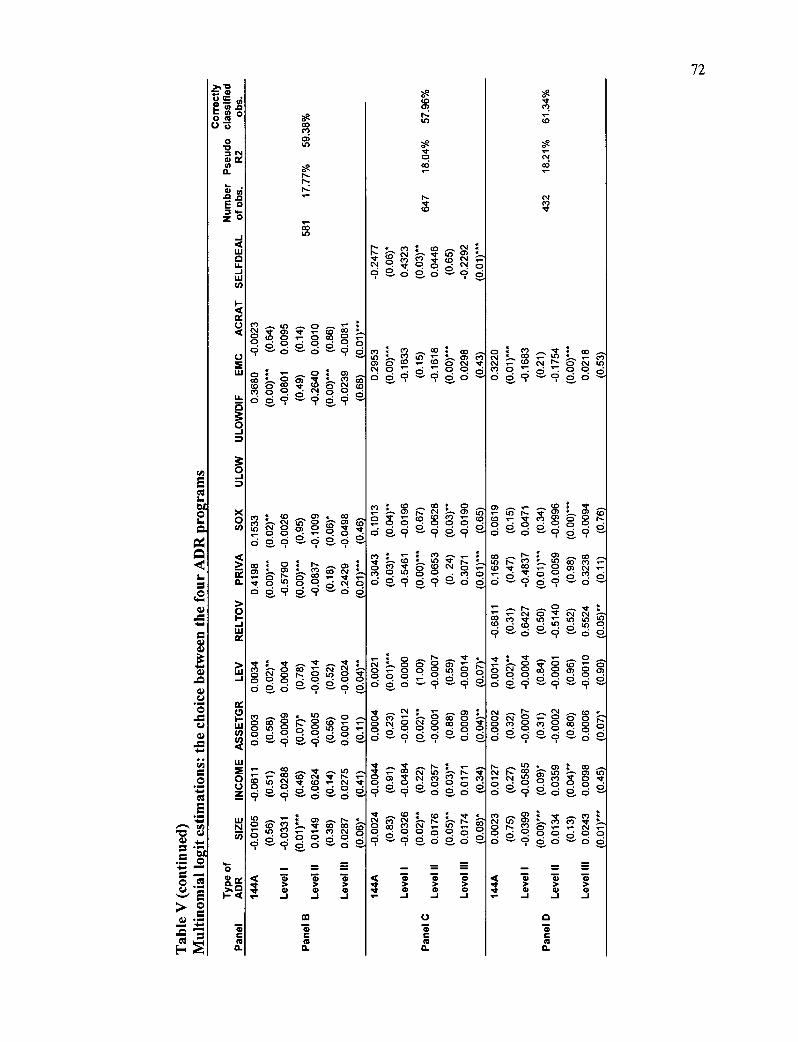
the
choi
ce b
etw
72
AC
RAT
SEL
FDEA
L
o o
Q.
m" .
•
..4‘ •d- o co Q.-
a dddqo 9; d •••••-d----d d
— 9 ci
• 17 : CO 0 " e co co Csi CO. 0)0 0 d,CsiCOCF0 d d9—dcid-'
: CO 0) • CO c.) CN1 (D Q a) co • CV Qa) 0 sr 7- 0 0 • .7 °. 0 •
qe.9e. e. o f.
- ô N (Oo; Ou").a 0l csrv o o o 9 ci 9 —d ci
0
• ce) c0 Cs1 r•••• Cs1 CY) xi' 5 ce) r) m• CO Csi Cl • st ° o 9 a ci e.d -9 ci
e ào,
CO O 0 0 C•1 C.10‘70'- 000• O e.9 •-•• 9 c)
• CO CO • 0 CsI 7. CO Lo
O ml• .7 (D CD Cl 0 0 000 cz,
• 9 e' 9 e.9
•
" ce) co c‘i • co,•"="• Lo Cs! 'ô
• Cs1 .7
t7)
CO N ce) o •- a o ci ci é ci
.7 (D 1"7 ..j. CI) . Cl) co C.0 .- Mr ce) c:» ô d r-• odo cid.cod° d --. d — 9 e.9 ---
r- a Cs1 O 't t‘l
co ce) •*- •- in la
co • 0, • 10 • L0 0 çiecieci;ed .
• • •nr O O •-•
o° o° • 8 ) d° • d ci d'- 9 '- 9 a
: LCD MI• CD 1....
Q C') •4' a cc) cl CO mi• CO 7- 0 0) Csi C,) ° 0 0 • MO cine.0 0 ce) • O d; 9d9add d ••-•• 9 ci 9 —
INC
OM
E A
SS
ET
GR
7. ne tm) •-•-••0 CO "- CN C•1 OC•1 017 0 10 0 1 00 •0 •Omug
d d■0 ci — 9 --- 9 9
Fio o e' '- e' O 000c;10(30c;
d d 9 - 9 -
oda .0 c;d cz; • ci; e, çîj s, 0 d a
4 r•-• 0) : CO • •••••■
•
CO C./ r- •-- a 7, 8 cs, 01.4" 7-C \I Ne:* LOC° g „I rt coLoN•eco‘-c.,•crco,• 6° c:1 0d° •o ° o c o •co csacio, •
Mr C‘i • c‘i P••• (.0 • OD 0 ^ 0 CN1 .7 d ô o
o IN 0 Csi OD CD 't CD 0). ad co oo 01.0 0 0
▪
0 1.00.- d •000 •00 ° 0 0 0
•- •
▪
a) — œ r••• • co
ci) •- ta Cs1 o• d. a o • o o •
9_- 9 é d o e.
• CO : (.0 : • ce) CN1
0 10 0) C.1 LO 0. d 0. 0 0. 9 - 9 dd°d e.
cf" C■1 LO 92 ".7 ce) r)
s' , o e- 0,5 0.00 c300
9 dd•--ecid
.- o
ct Q.
<
az
-
zz > > > - _1 _1
< lb" Tu > > > _I _1 _1
0
Q.
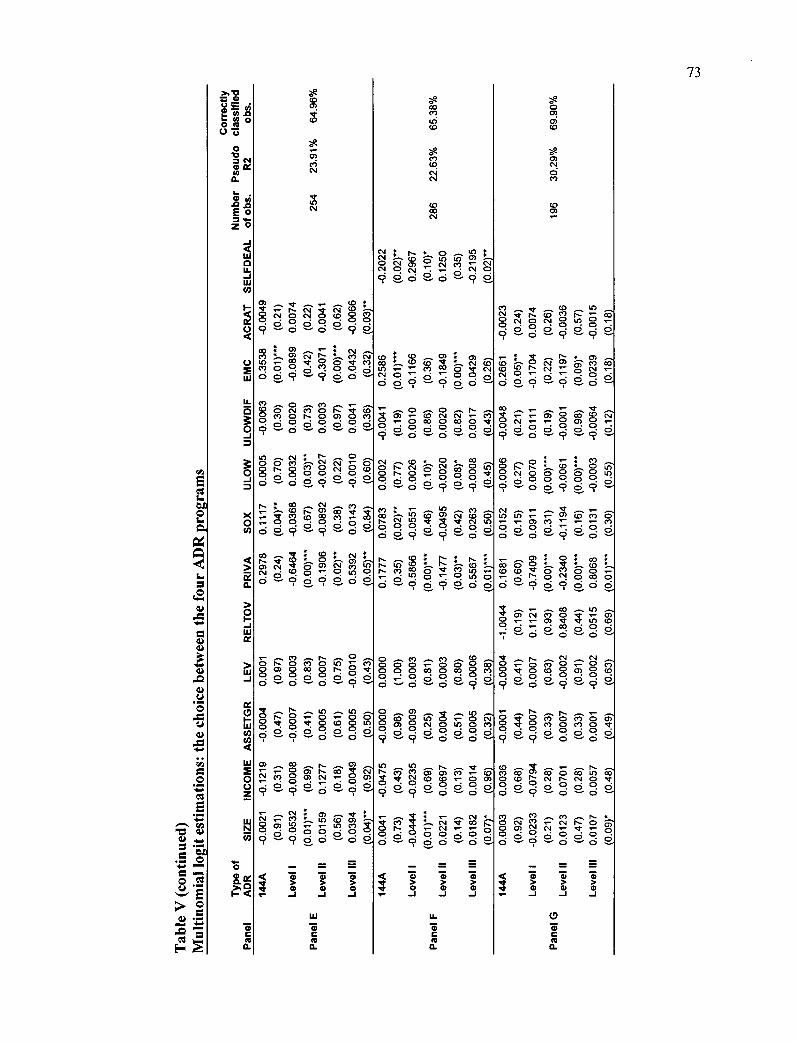
ri •a• o("1 or- csico _ ,Ce) ci
• •cr N CEn' ri ro Cs1 ‘'" C■I csi 0 1••• • 0
d e.9 "-9 d
ra r- (.0 r-- _03 o o
o —9 d
• N. • ■•■ (D C') 1,••••
ui a d e.d d
C): 03 0 0 (D CO 't 0 0 0 I-
N COO ci---gog000
i- <
C.)
0 D
0
o
a.
o>
INC
OM
E A
SS
ETG
R
o 03 lx Q.
I-
en t
he fo
ur
AD
R
ions
: the
cho
i
r•••••■ C6e
E o 0 — oc
g
e
o
o
: 141 • In O CSi N. cv N r-) (sr ar
c'J o e.d e.d 0
•a- o r• 0N gi g és1".' CO er, .. 0 0 va
'-f à 2 d ° ,r:, — d •op: ci
co ; 03 nr 0 me) E, 0 o d . ,,, Ô ‘1" 03 CO • 0 <0 st IL,. c\j co
0 .- ,-- r) œ o •a- c., co d d g e' g d d N CD 7 ci •-,clo cs
d d 9 — 9 e.° .--'
7 3
a ,e2 o (NI N 0) '-‘- Er-, - O 0-3- «D rs,- 0, d • d d :fi d
9"..
03 a-, 0 0 0 N 0 1.■ 'd" CO ° V) 0 P.- °mar) 0 a,..ododrod
(;;; g•dp.F..„i ccf e cp._ 9 d
Cri •cr d
ln fg . • r... N 0 0 0) 0 t■ 0 0) 0
Ce à e.9
0 • 0 •00 csi 0 0 0 o 7 . 0. e, e. 9
rz..- . . 0 .0 (.1 E7 0 ô • oo 0 c).0
-9- ci d d d
Cri O
o o 0 o o
: (boa œ c., ee N. CD 0 LC)Cs4 43 s- 0> CO (7) C')
0 0 (°. C°0 2)1 mt C■1 LC) s— s— 03 s— 03
ci c.i° • o ce„ e, ezi cic, cc)). 9 0 d
CO 1" ; D CNI 0) .•••■.
N .1" o O'C'l c.) u, c•i (D. c) 0. d -•-•:•• 9 ci 9 0 o e.
0 R 0 ,-, tr) •ct r•-• N Cs1 e 0 C7> 1"-- 0 Cl 0 LO 0 0 0 c■ 70 E3 C'e OCAOCOON- •a...000 a co O c2, O ,e;o 0 8 a). g 0 d 0 c; 0 c; . 0 d d 9 ci d d
"ei" ro O
‘1" r••• 0 1,0 ,-0‘-00 0 <• 0 •a-o0o0 o • o • 0 0 •
(0 0 Lf3 C5 0 N Ce?' IC Cl '5 0) 0 0) 0 N0(D00) 0 •1• 0 0)00)Ont
9 — 9 — d — d g a g .._ o d
œ d œ ei (V 17. 0 c» csi 0) va
C'• • o
9 — d e. e.e. r- r- Fi' a) Fi a) c"? osr C‘i CO CO •-• 0 0)
O " a • o
cc) — (D .71" coocoirico O N N 0 •.:1' ‘â Cc:: )'. e' 9
: Cs) • Lo
o o 9 ci d
4 Tu TD 'ci 4 >
> > 0 0 0 ...1 ...1 ...J
• (7, o •cr 00
a N. g ô ô• co a9do o
azzz > ar J
01 0 N 0 Fe o C» C•I N "a? •- 0
o 9 o o
00) 0 d q o
r- o
■71.." à
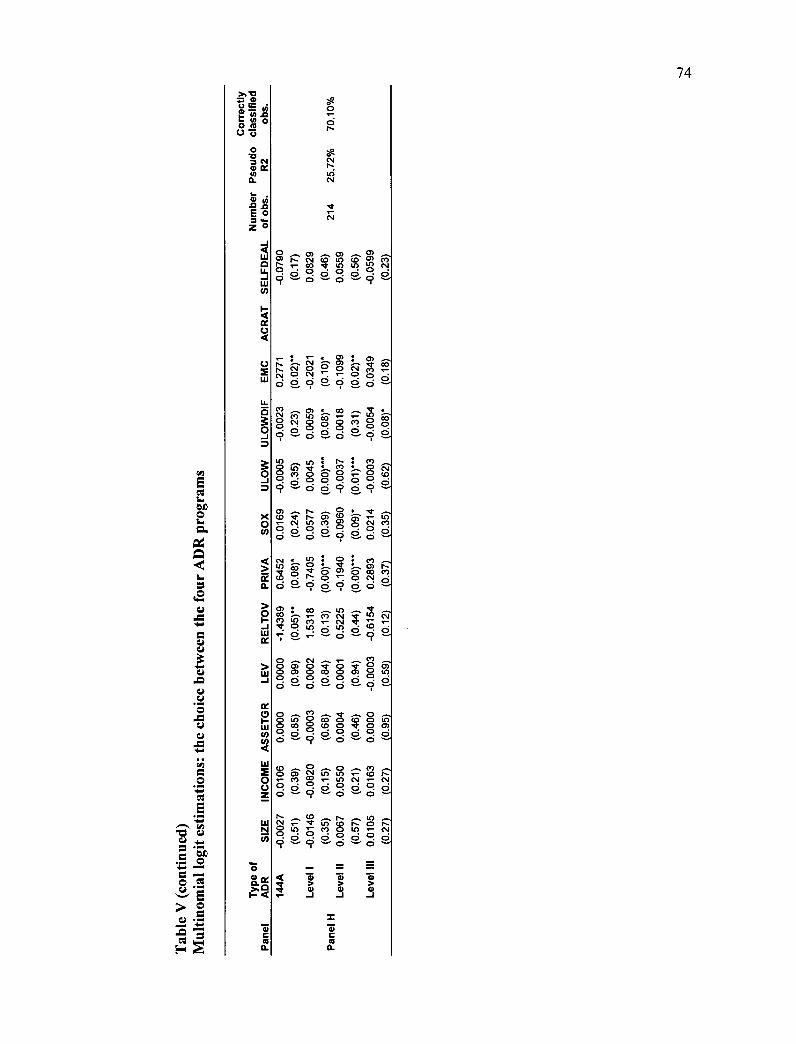
• O.
71 ô ej, g
esi O
o t:>" d 9
O •-
a (Ni d 6cz,'.
Li.
0
D
0
D
o
o.
0
- J
INC
OM
E A
SS
ETG
R
(:).5
o o r£ O. >, F-
C»C»
0 g' 0.1 re ie c.'3' sr Rn Rn Ln cs.1
0 • a • a • 0 • g e, d e, .0 g 0
•• ,-,
('J CCO)j Ca:)) *EZ C° N O Cs) Op • • g ° d d €0 e-
c:1) Csi el Ln ° Csi
• 0q0 S5 °
r- O (0 Mi"
ts") a .0 O o -`-'• ci e-9
r- rn r- ) (0 • 0.1 ts)
o q d '- 9
R n o ic?)1 .ee e ° 8
•
— 8 ce-9090o
74
• 14) • (NI ■-• Cs/ d in d
•rru) • ,0 gi
csi d
0,1 OC:00 ,ctOst 0 F) 0 o œ o a) Oin 9dOdOd dld O• d --- 9
O —
cn o re 0 . Fo g ER.' o o G' co co o co cm sr o œ o •0 0 •odod o • d .--- 9 — d ---- ci
(O O ..--, 0 0") 0 01 C•1 LO x- (D • 0) CO 1- LO CNI Cs! Od d.dOddd à --- 9 •-• d
(0 ■-
0 r) o o • o • 0 9;2, 9;e, c;
4 •,,, 7 lu
> > > 4 0) ce 0
I- _1 _1 _1
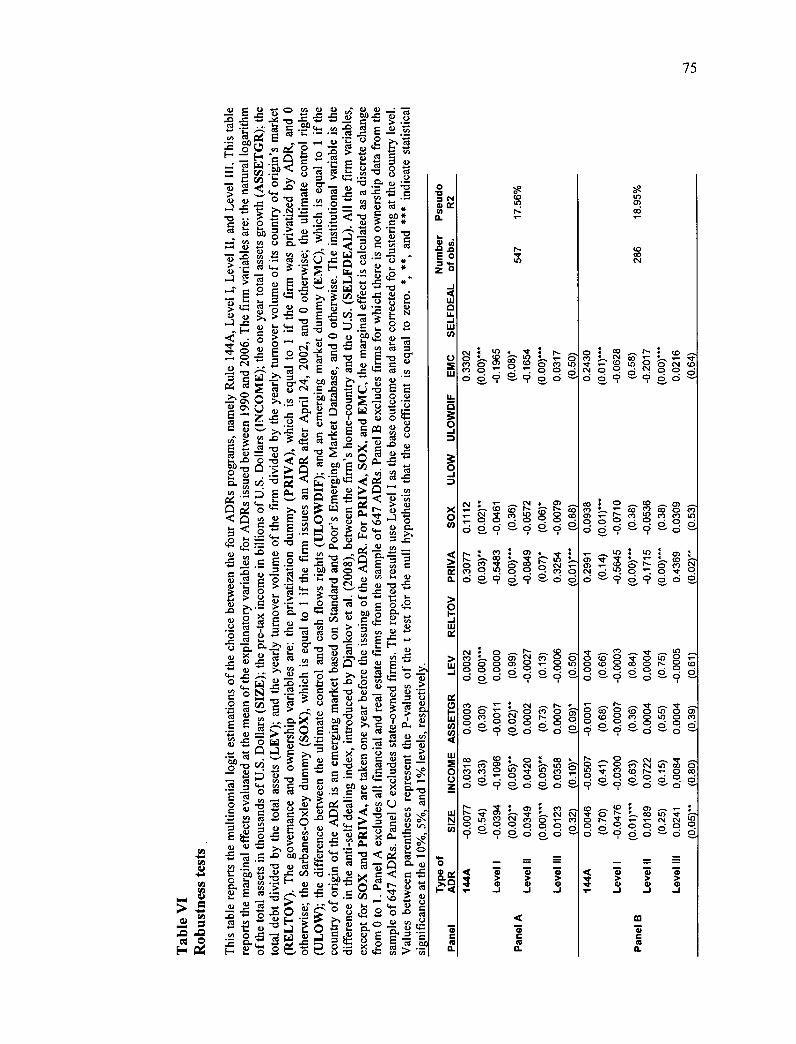
re 8 (9, ez.., 8 f:2 8 cr, - d c•-) u, d c., d •ood •0-.0 •0 • o • o • d a ggd o dog e-g o d e, d e,
• o «- C.) a) (%, •••■ 1.) - 1:". 41 I s 10- c•-) La st La ° r) o • ,-o d o 0 ,-.0 •o • d • 0 • d e-ciiddcidac,se-cia -2- d
r- c» Cel
‘t c0 G' sr o 01 •", 0. 0.00r5„...•0 • 0• 00d0 0
d 0 Q - 9 à ci Q e-
4 z• z 4 > > >
0 0 0
,- ....1 _1 _1
INC
OM
E A
SSET
GR
SE
LFD
EAL
ULO
W U
LOW
DIF
• C■I c. 0 h- CO C') • oô c•I F) 0 ô Q ô o a) o «- 0 Ln 000,5 0 ,:jc? d ci e-° - g - 9 ---
•7 0(0 0 .1- 010 0 1- CD dg000r-gd °ci c) dc'à ° Q d
75
a)Eutoeueu vrou •-cii 7c ..c 15 .0 .0 .«...a. •"-F-, f. ce g") .."5, c;-)...c...) . ...-. . 00 0CU th. ,,, , rx E ‘.«. 1- •- •- o.= - - •-- o o ..- :E [- E-, -Qbc)-Pi>15.=`'' = - •.... . ,... -.el c 0
-c-d, e :eu,- 0 7., ta. tà .,, o la. ..., = v) 0 0 7). -1-,•2 ..„ o 4, 0 cr - , "o .e-• ,..,a> ;43 : e 4 - ou . ' "e 'E . ' 8 -e_.... 7g
-- --t .' -0 E ei)** e 'ai o .E. l'ai o o .-E a) > o *
a) ..-a il. .--z, ci 0 *C •
=.‘ 8 . E"--.5 ! * 5 ›' -à 8 t, g ...,-, e, v> •
i•i• •,...: es e..... e•5. x E-ei „,2 ....71 -,-;°E g., ...câ w .,,,ai r4,4 ...d `2.t;
''' Ô ›, .e
= co CL) ip ' (1) ..0."3.) 0)
0 G) >, › E ...c c - ,. h M •- .0
- h., L) 0 •- cu "0 < 0 › C7 là 00 0
«zr co d) E n „rsi -bd , - - ■ (9 , g , - csi 0 2, ..d ,.:-z: __ y ,_, cd Ri .= '4. czt til = = W .2:,.... 0 ,,..‘ im, b e' t> • ee - e ta g'ci. ...". ig .a. C.5-8 E >.• CD ..., CU .__, • bi:, Cl b■i 0 0 0
7. `-'
, , 0 „, 4 tu "
c a.) .,•, - o c ••bd v. ,..,
t. Cl cri I- ..0 ,, p., -0
ep • ) -- . ... •.. • - •,_. ,. . c,. - e
. > c - . e4 .`"EttcutZE-f, ir, 4 Tu' ',71 Q c`2 ô ›).1)
cn a) E o 10 v. ,,,Q (D •.' c Ln e-0 - qu' 4-• `. -,
_,>, ,..... o r-
o- Ê ••••" p.., .0 • ,1) - z, _ t e) r5 "7 ..1"="'`n là ce" Q g" -É
o "e a) •-- § 'r. 0.) CO Ve CD 0 0
›. •-• c.«., cn 15. .., 'I) 0 .a. ..-. à ,e •-," • 4. 4 •e 4 1) 0,•c 4.1007:1000,2 .0 • „, 8 fa.. , „cl. •.<5. 0.0 5 8.... 0 0@ E .-_,v) 0 * ,_,..,„ .c.) cl .T. 0 ..0 - - 0 5 ,,, a) •;11 3 c a.) ........00
Ê.E.9 ...,
a) 1.) ,,,; 20) C) .>2 1 lia se .‘«12 g e-e. ..... E - .
4. ..0 ,.:::, 0 .0 0 ›•-■ L.. •«.• Ir« 0 -tr) c•D ... w 0) Z C-) S. 15 „D 0 .1 ...
cn > -e. . :h.. _, -,, c- - -0 " 0 .__. 0 d •
14 .0 g e 8 ,) .m e . 2.c2,E> .• e 'd - 2 .,, e
.+.§ - , cn
e . .. ... ,, ,.... .-. •,.„, ce ..-- •
i.-1 >, o 0 ><- _ („) " "7 ÇA cn E . 0 ° ) 10 0 "0 ca
0 ;-• cu tr, 0
9Q • ,,, 0 E ., = . 0 0 „, ..,..::. '12, no c e Cl e tr-- 0 2 -,..._,
•ce ' 'A g le 8 .e. g) e = L< 8-0 >, k •- 0 «S k. =
.4-1 ,M er9 •2 ce 0>< -0 -0 "Ce ° cn »c>. ee
,-- = 0 = 8 a) E .a) E k: 0 -5, ,.) ,,,.)) ,a) .2 ,,,,u ge ), 0... •.a. er ..0 > cu Q- 2 ••1. cu c> à -, e g_, C.I. •.• VI e vi "C 0 C.ri 4".' e «: T ..) in tao CD
Clà 1••■ 0 1., cl,h) "0 [-y 0 "49•
e - 5 2 E cl -.A.... 0.c Up ,_• ,,,c, e 0 "0 ••--
g
Cle ..c 2
,„e1) ,...,e Z"-Ê0 -ce 5O L* 20..0
' •-•••'''` v1 0••=7iwa.),4 .ga9),E=_= •-•
el © *-E eL.t... .-. g -.F- 0 :4-. )‘- ('-u• -a ,.) c.) e .e * . .
U) r- cd) • ■••:i •0f 1- (0 C) Q CN1
(V 0 °. C•1. 0 0 d à e- 9 9 c; d
*s g." ô reg I, g3 c,?; cp. g co. g>„ •cs ccg d d g t:7.3, g e-9 d
r)00.coo. •noc•I ci 0 9 ci 9 e. dde-(iidciidd d
« 2,1 î ("2 o r.ôoeScoome o • o co • ddg gàd-9--
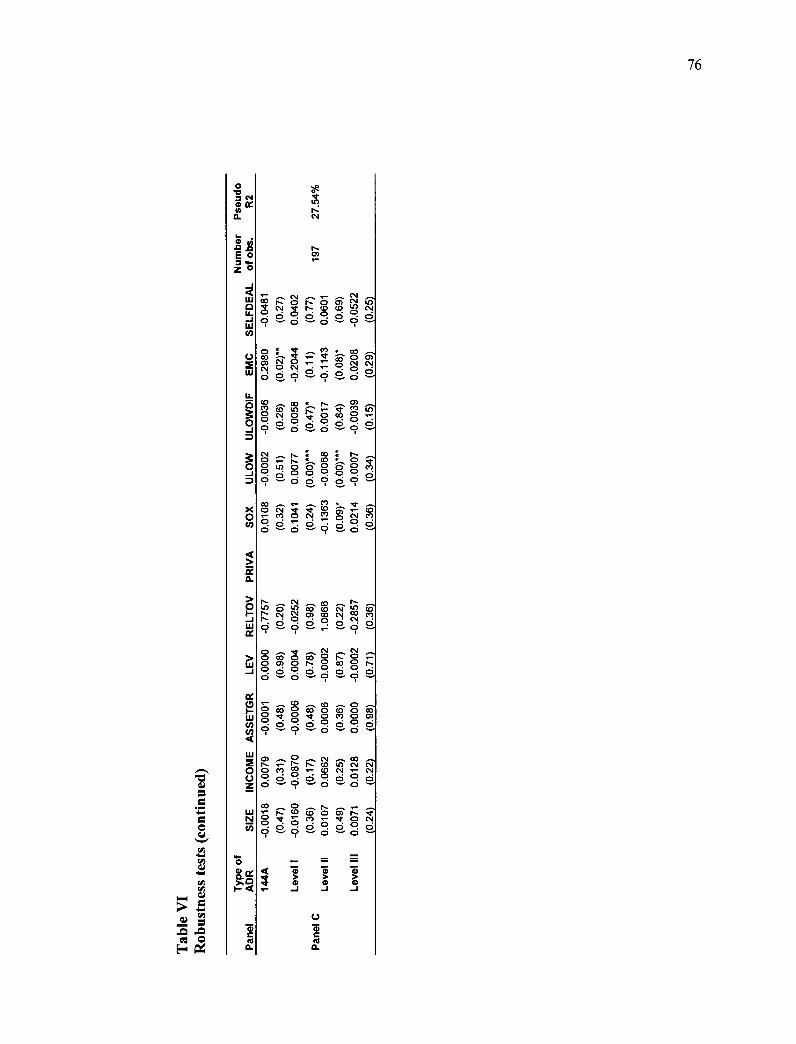
SE
LFD
EAL
o z
ULO
W U
LOW
DIF
o
r- sc,
("4
76
113. Cs.1
C•1
Ps [;' o (NI
g cs, co uc2 ci 0. o •
z= d o 9
co
ej, .cr Co-- o 0 csi
(Ni 0. • ci •"-. • d d .
d Fi-) 9 c'
co • rs. co gr)
0 cm 0 ,t0 9 d e
co a • a o
8 N.N" 1°- Q u) 8 8 8. .0
9'd cici9d9".""
s- CI • •zr sr e- (D (•,1 C, Ce' cl .- • • o
c?'
0 CM ce" 0 d O
ré o.
N- (D MI CO CO
CM C•I CO œ• a • 7) 0 e,
0 ..-. • Csl 0 CO 0 co o cr> O rs.
• a d •-•
INC
OM
E A
SS
ET
GR
o. F- <
CO (D c- o 63' ie a co
Q st o Cl Q 0) (c) •0,...7)d0 9-9— Q — Q
° co N- cz Da,
d d E-) d e- d
C•1
co „_, CD C) 0 )".‘. Er
CO o. '4: "3 (.1
,4
0 d a d 9
e, d
.<3 > > C) o .- _1 -1
CC o.
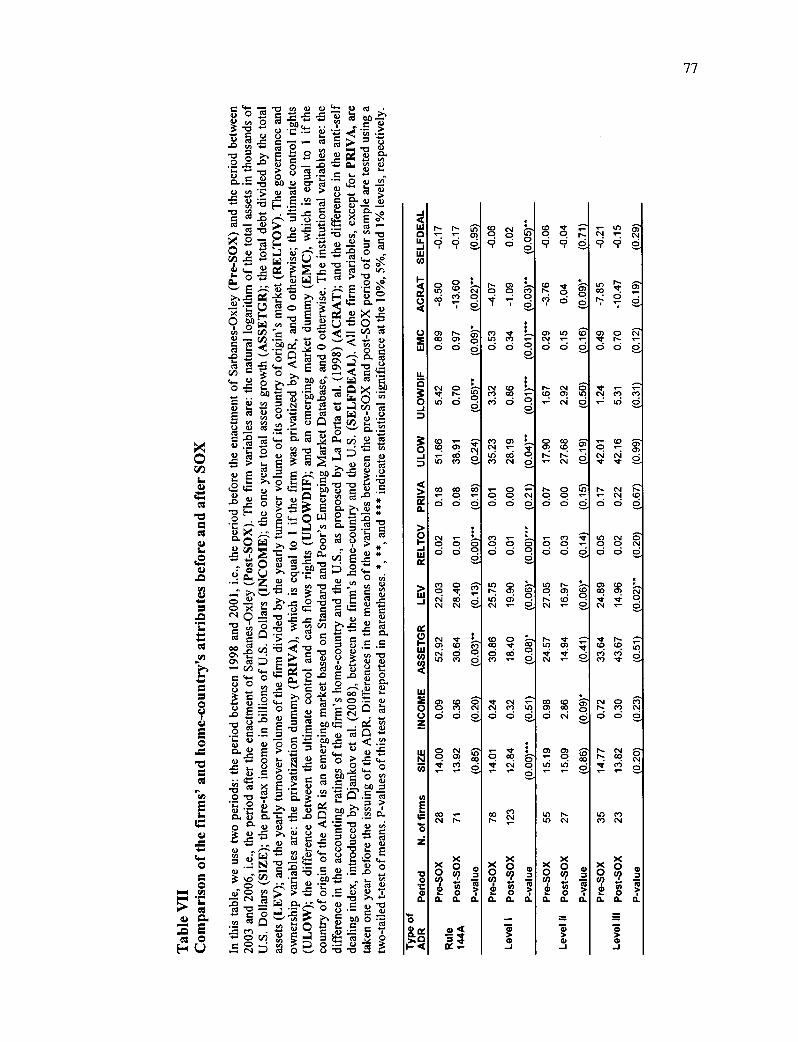
O) a) «- d tr) O O.
co d
d
•
d d
U) o d
o o
CO (e.
cci o
C')
d d
cs, co • co C') d
r-œ a) ci ci
cN r- ici d
• h- a) !-- d. -r d
CO CO 03 '- 0 ‘- ci ci d
• • cr) .' c Z• si cr
cci 0 r) c>
.•••••■ a-0 a- 0 0 CNI ci ci ci
o ri «-
ro •cr 0 0
99
«- 1.0 CNI (i; C13 d
ar)
d a) . r-:
axa h 0 0 cl d d
d
CO
• Csi 11"
0, «0 <D Cs,1 1- «- O 05,
IN- NI 0 CO C) «0 • Ni ci
0 CO 0) CO
• N
CM 0 NI
Ci ci ci
cl" (1,3 c7)
o o o «- O 05,
co d d d
Pl 0 e. o <V 07 CNI
Lo «-t-, o (D
(
▪
D CD. N «- 0
r• a) 0 cri ai q csi 0
Ni 'Ici' 0) (D csi d
•
o
<D 0 CO cl. d ai • «--
a7i
d • CI) si si d
0) CD CO CO
CN1
'CP ,._ CO CD C') ri
CN/ «- Ps
10 Cc) Csi
•
O
co co O) œ d hi
CNI C, 0 Pl NJ
0) CD 0
ci ci ci ci ci ci (NI O r) h- Cc) NI O 05,
op
01 CNI co
-J
*1) < 3 4
• r") 0 0 0 0 0 d d_. ci ci
«ca -
«- (C) o o d ci d
«0 NI 0 0 Cc CNI O 05,
o o
o d
CNI IN: CO
a- a-
O O
AC
RA
T S
ELFD
EAL
o
U.
0
o
o.
0
cc 1- w
o o
11J
o
o
a.
o re Q. >,0 1-4
_e... .004-00 ; : •
4.) d -„, c 0 0 • • -
• .-i -o o -0 g >, E •-̀-' .E clàe' CO«fZ Cà9,..
g) a e, o o •r...- .-• fa-- mg tga a.) cr ce a 0 ,,ç O o.5..eura'u>8 Te -e., 1:),* :E., -if, ,Ii_d. .5_, --
•
n z _A -.g. -5 .0 di..,) x E e 0
es Oc_ •-. .. o ■-• O (1.) 0 U ,"'"•' Ê 1) .-C1.--' oe
„ncle ,..... 0) ,e,e,
•
â o ° cn .e .- e .!e.g u • 0 - 4. ••••;> g. 0 ...d ,_, o. O a.) W [-■ ce › -1:3- o s•-• E ,:-. • • - - 0-
,,, ...... Ê $... 0
. leç, E
0 to -o , .1.) , ,I,, ° g 10 i5 .','„, -- re cr/ ...._. 0 _ — . o C.0) •,.„,-- _,« -ts. ‘...., < 1..„., p g -È ‹ • rn" 0 -, -. © ,--, 0 Ê
Q4-, E v)
•
c 0
•
F-
▪
1 4. 4) Ce Ce `--' W 0 E o ..«...0 E v, . tz x 00 ° ..e ta -c-c -c) • tg, au ca w.., r., .-j; • •-.
cl 15. .,/I- -,-,• = , , el ei 0
Q 0 ul > 4) e , '-' Q 0
-E ,J.cu O
•
au ej .... tl.) .._.(e = ..■ c.) cià IF+ › § › = e ›-•1 ) ° Q â c cn o
Y« >, 0
.•-■ o > e47.• 1-' oi) 1.) =
c4-1 (1) (I) = •-. ,,, A '- và ao -0 *
cn -e:1' „a o o = > g
.-0 o -o E.o 0 w ,.... •-• .0
e •r., -4, -E E •":-.10 8 :
,,, cl. e ,eu X • - = - -.‘.. tn 0 la rs
1U — OW ›...0 ■-- 8 c"? > *-
1.• I' e.) X .r..„. ‘. 0., o - - ,-,
g. .. CA %.,4 Ci) .■ ._ ... -Op
Clè ..8 c•-• *
«f:t • ° U ›' Er•êr g o ,,; ..8 u an
cu -- •..".'
▪
ç cn
.4x.■ -cl ,1) f, E 0 u à 2.). o È ..= ■--:. -o =
,t1 cqoà .") âg e'E= -cc T.
•
â.
an 3
-P .1' le)
ç 4-«
-
4.• ,:-. re ^ â
•
'I" u () t 0 fli g..0
= tu 0 (1., ,...... = a-. Q., t., a. o „.= ---.4.) a.)
oo 4,« C. E (.) â ,cn c) •.. o
.
•
.0E=.E.e..).Enl, ...
ce o c) (Z. â I
Clà 17 .5 "e) E..ggtcatr4 .C4r) PIS = E -,,, O o . . CI) 77 e .1-2 t'o.= •.< .
.= ct...1) E › i> e e`• (i... Il o e
^0 8- ,pEo>.-ce..... .= .... 0 ' o
= .. a., .= e .. e om,d t>0 = 0 r)
E › o ' ..E. .5, to o •..
o •""' e '-. -à l'e •- ta. n„, .... ___ o >
E ' r..1 0 già O . i_. >-. <1.) 0 P.-, - - .1 .
1... a co a. â f, .0 e .2...
Ir« o. o o o d.) ,t.. •-« -0 a) ai hi u cu = (L) «7 0
= C.) 0.) <L) 0) „ ..4Z.....5., ,,, 8. o -17 E .4.. VI •W u 0 4. 0 0 0 <4..<
0 Q o
•
e .0- (i) • c
▪ .
00-c • ,.., 1-,;
. .
•
a.î à 4, • 4.,
V)
•
CC
e E ,,,A le 0 • .a .,-, . E ,f, . « .-E
© cD
- vi .;
- ,4 = -a-o ,u 5) F'4 C..)
77
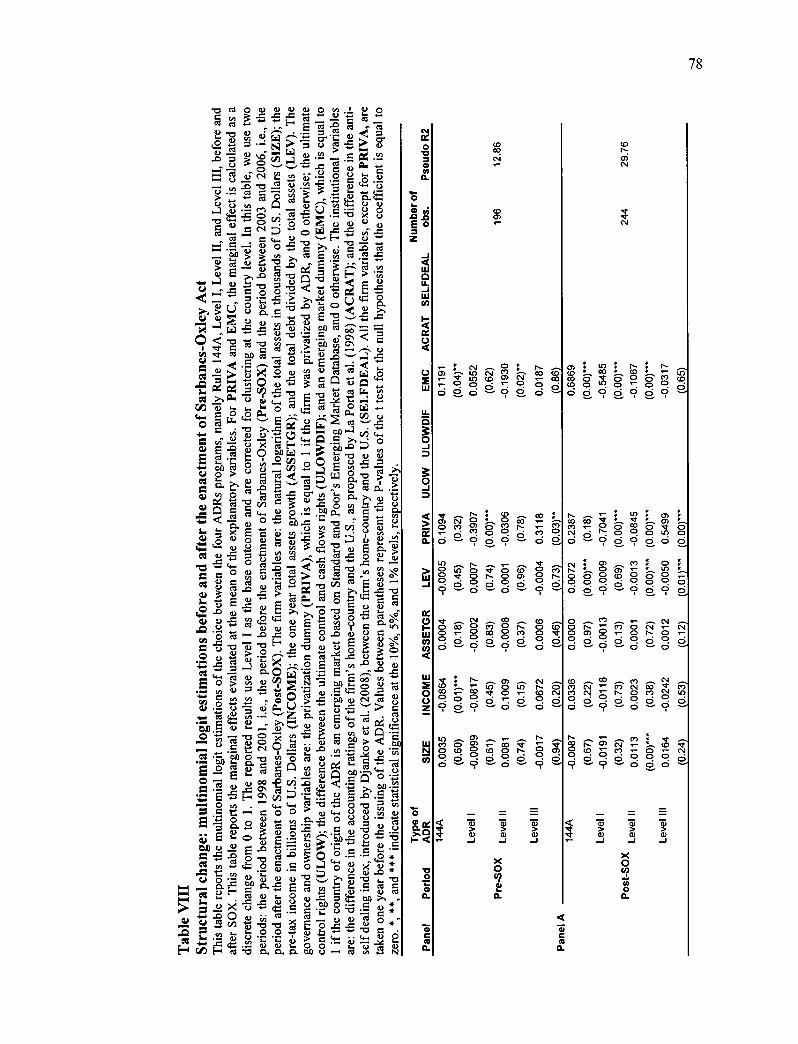
ULO
W U
LO
WD
IF
Pseu
do R
2
cr,
AC
RA
T S
ELF
DE
AL
N in,r) <ris 0 a ••-0 O o '-90 d
1?, î 8 c 0 D C., C) s r- d -- si ci 9 - d
cy) n • en • e, • ‘- cociecsoatn oc) .o•-.o 0. ci ci 9 ci 9 ci 9
; `» ‘1. c» «e ,-s œ eN D tc-,
dSicidd
0 Ui
co D
o. a O
,r) Ô a ce-) 8 r. 8 c» o - d -
r- D
0 0 â
C)o ‘_c 0
'e c C. (D O
O
cse; •cr •cr a ci h.: 8 c» c; o • c;
N o‘- N D a) 0 n • a e, d d d ce d D d à
CO CN1 C'e
2 N. c,`- 1,-. 8 cg cl •. _a d 9
dociod ddd--
cc 0 Cl) ci)
o C.)
f• co Ce c)
cî; Q
CN
d CN D
0 00 F", 0 d
D ••-••
s- vo r, (.0 •""'
0 • 0
e•
Tu Ti Ti > > > Q) a) ru J .J -1
_ = F- < Ti Ti Ti •*- > > > Ni- a) a) a) ,-- _1 _I _1
o '9 o Q.
78
-ci re 0 eu o r1 a) ru a) ) . 4) 0 _ _ u _ .. • .. E eti -° ed - re tu• -•-• • c2, .e.-.., = .- N > -• 0 , - ,.., .
o x - -, a-. ,Ç = 0 1:61 4-• o •••-. ,•■' = )-. vo ed eN E 0/1 • ^ .9. 0 0 s- o.) ■-■ 0) ... 0) ,.= •.. 0 0 - et, Te .L.1 ,e cua =0 . ....) . A ,_ cn 7., le U . 0 :,3 ••,)1 0 ..cs 4{ .. z... e. 8 „;
_. 0 0 ci) 0, . cià g eu a <-1 .•-• G, r4 ..a ..a „r „a .... 0 vs c 4... g„, ....., E-1 ,-:' 0 -.4 0 o f.. no >, • "E ..7) 5 .-. • eo e. ,,., t u›, .5 _ _ ,d. ) e - rd ..SZ ee g . É. • - g ,,, . - ... > .D.,.
P,J e Ê fu) <e.4 -.- Tl; r ç o .0 4-• :.,:, ..ite à CD >., > 4., c.) ty . 0 tv
1 -vr rn cr rs oe ss - •-... . 1.-« ° 2 '-'' -01) .E. ,-, °- E e " d - =
ces .112 > b>‹..9.. 0 al u 'ei n'w 16. t'l 0 0 ›.•,,:« -,-.) S.
CA -45 1-. M 0 0 Ci • - - • . '.G. "". CO) Clà tm = 0c
c • -ci cd) o..)
'la' E•.- >....eu Ê ° .. Clà ...0 ■ • '' ... 4. c-1 0 e) 0 , ..
)61 - cf) 0
o > (-) ' 5 < - e'l çu '6 -'"c; e - .5 , c•J 8, . (;) ... = ._ 0 „D ô e â 1-,'s -= 0, t g.) -
0 4., 1--,•e -re ,,„ = 5 = 0 ,„, e ...5. g.) = = ,/,
- e . - . xn Eu 5° "U el 87 ° 71) , 1 e n . .
86 ' 1 25 - - -12 ' 0 0 00CUàC1),0 -4■, c.,,.
C4.1 Y 2 E et 0 o ,-...,..a ..0 -,... .0 ,- u ,.= _0 .-. = .0 ,,, ,, = , . . = ,i . , . . . ''' ,li rn 11.) ... -.' 0 8 g ,2 rx. ,,, v) ce . là u e co O. 0 a a ,3 I. •r-' E 1) g) •-., ir I) (j)
4.1 C _0° tu - 2 Ê >, ›..:(5 -te = .F., oz,,-• ,e,' rle c).0 cn,Otecub1)0 ,,„, cl -,•-■ = IQ Y C Ln .0 .9 0 0 a .- rm .2 1-4 s-i ..0 ..= o g 8 f ki 8 5 s e. .
-(1.) -0 0 0',:-,- e co u o t., >..o ,....:„.e, 0 -.Fi ... _a- 0 ce 4-. -_,_,,-■ 5 ,1' ti"; a) -i$ c:-.. 2 ira..ozz-- ur.E-=
E o ce Y, 1.> ci? . © 0 cl V 0 la, ,.. -a. , .= t d 8 . cu
-4■, CU q..) M • ...., Z ks. e •... e r) ."..... ,,o.) ,_ ,_, t) .... `ô te». , ..,.. ›. _ . .2 lie; • 'e
„, .5 o - Tai .le 'En* ae •ffl !DA 1-. 7.1 T., 2 E " y oo .0 cil .7:; a- •- r:à o ..,.., CA
.= Ce.' â .-; cd 41..) '-' ›,, 0.0 • --é= E '''' E'"" 4.1 4_,I's "5-, "0 -5 .8 -̀ê -- a o 0 0 eu u) 1.) C.) •-■ ... ,,,, ee...= o clà = , = ' F
â
•-' •.=.-9 .-9“e 0cs u = E-° t• •,... .6 ;(5. .E ..F: sà.. .:
4.1.*o e aol-oux"u* c.,-, ,.= t ,n 0 Fr * u 0 Y "° s-' ,... = [_, a •-• ,-, vs tn ..., ce )-i mi 2 DOI-Ou.00',-.0.11>«,. a". ux ." : 5 -0 4) ° = - c * •-• ca .5 a t u -5 - u * 0 tu ce ce _0.) ai 51) oc *- 0 uernt-o -teEo.a.= .0 E c11 c. 1-. 0 0 •,-, G) s "7 = •
occ ...E T.' T.. 6 > .5 ki u u 1-. 0 0 4-■ 0.) 0 -. ,à4 ot.) cu u
E 4 (0) F-, cl 45, Q. Q. Q.
cm u -. 5 ',)) .E N
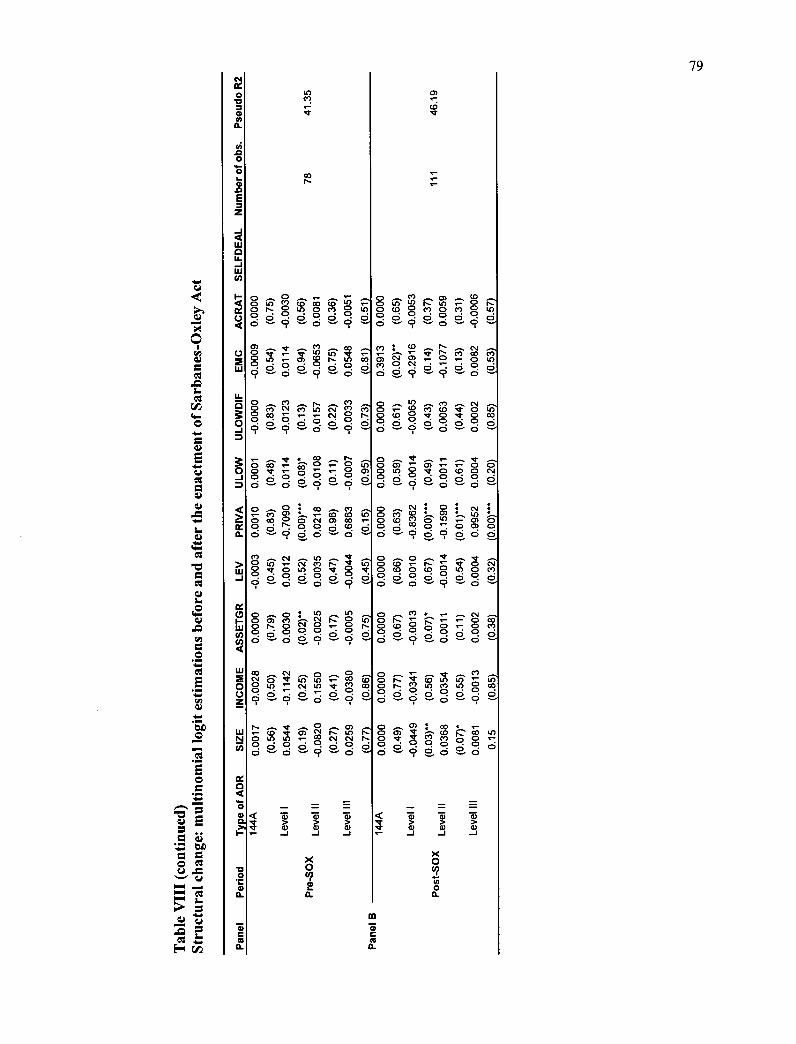
79
co
SE
LFD
EA
L N
um
ber o
f o
bs
<
▪
c) Cr3' o ici re ▪ or-outocnou) ridd c'dddqd 9
- - C)
•
U)
• o
u) ,rj• 0 in a) CO 1••• 10 CO
w
•
° d°d ° d°d - -
5 0 c•i el in cn O • 0 a) ‘- ••••• N
O Rci cId 0 dqd
,̀
•
3 c'ô ti3 ce O o) 0 o • o • _Iodo • . 0 . 0 D ci d a 9 9
‹ 0 o co C) 0 u-) ••••- oco 0 ocsraia)‘- ctodr.:coodrod ct. ci 9 czi ci
> 0 Lo cs4 ce) F.:. U)
•
Cal at 0 o ‘t- nt
- 0: 0
IX CD 0 0 :1° U)I- 0 CD CO •-•• C.•1 1••••• 0 10 LU o r- 0 C%1 0 a- C ra• 0 000 •0 • CO 0 • 0 • 0 rn 0 .....• 0 e.
.9 —9 .....
<
W CO N 0 • CI Q '4" 10 a- C° O 0 0 •- Cal Ln ‘t- co o • • o • z •-• o
r". W •-•C.0 r-- N O •ri tu, N Cal 1•••• (i) dcS°d °•ddd
à O - 9 d
CD U) co r) o 0 in o 0 • o • 0 • O
si e, ci;
cv, op in- co Cs.} Cr) a- 0 ID ce, 0 Cal • a- • • d ci si a ssede
° el 0 e 0 0 0 CD 0 Mt 0 st 0 CO 0 • 0 • 0 ci 0 • o 9
n1" 0 CO ‘- 0) 1-• 0 0
10 Q st 0 CO 0 CNI dciqd°r5da Q 9 --- d - d -
N : Q: (Ni : a cn o am 0 0 0 ‘-ceta adoo7occo • --- 9 ci 9 ci à d
0 d°ci cRadd Q 9 — ci
,•••■ 1 a- a 77_ o co O U) 0 0 au à o. •o0cod Q 9 d - d
orgeQ e t i") ;51c2) o • 0 • o • • ciesiedecie,
co O co.4.
- CD F.: 0 0 -
a a.0.0 •od • 9 0 °
- = = Q < T) Tu' T.) • 4
> > • > Q) W Q) I- .- ...1 -I -I
• rit • > > > CU
-1 -I -1
X 0 u? 0
u? Q. o.
47) 47)
Q. a.
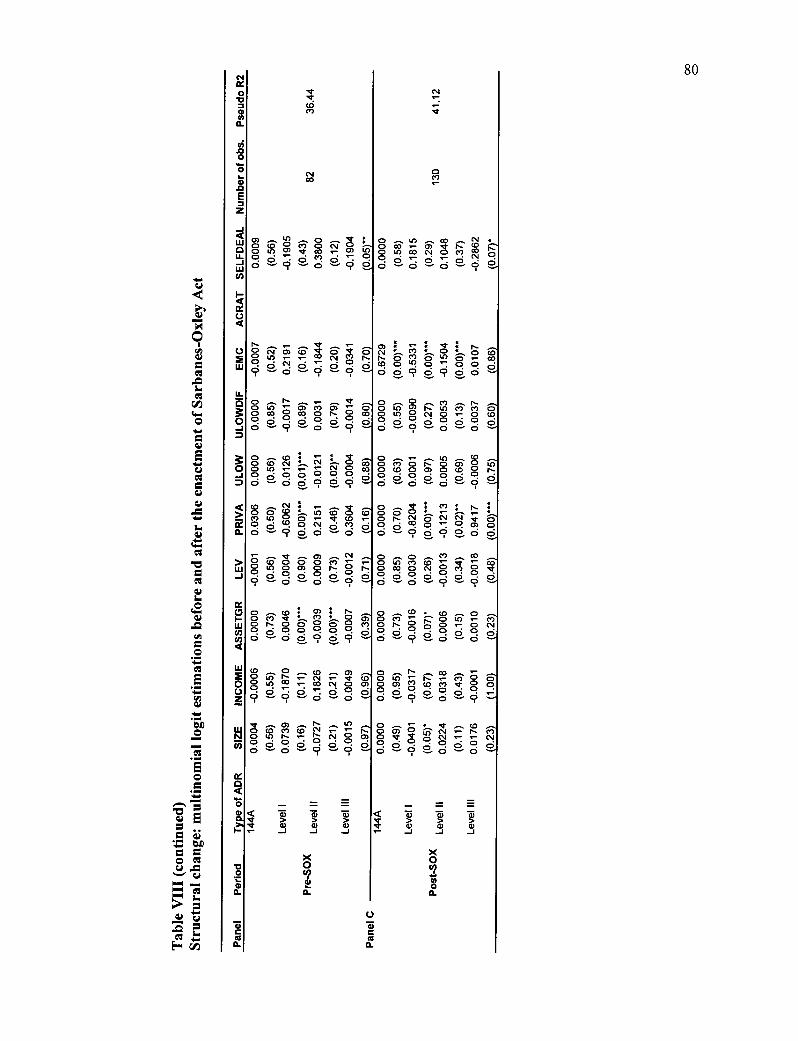
80
Pseu
do R
2 A
CR
AT
SEL
FDEA
L LO 'st
o 0 t1.3* o --- O U) O •cr U) 0 in o —o ei
rs- - O g iiifF)rezôô N
LM adagag
O U) •-• F) 0) ," 5 oco 0 coor-.0co 0°d°d°d°d
d 9 — d 9 -...
0 CD Cs1 (si ••••••• ' C1-3 0 0 113 "c- ° CO
O •00°O° • d 9- cs c., 9 à 9 a
< d N sd• > 0 0
c., 5e SO CO di rie
..; —
ce 0 .
d ° d
O. o 9 ci d •••-• d ---
O co r‘l • O co •g- r„, N
0. d 7 ci 7 o • d o o o — 9 —
: : : —" o o u") o •- co co.ca ,r).o•-:ood
o ci 9 ci 9 ci —
0 0 .... CO ...c. r, ..... O tri 0 r- u, CO CI 0 0 g» 0 Cl 0 1- 0 W. ° à ° 0 ° C5 ° d; ..... Ci; ..-.. d .-.• d 0 .......
0 — — o r•- o 0 Ln O o co O -- 0 d°d 0.d°d à o o 9 —
o : p.. 0 0 0 • •- ••-■ 1- • o e•1 o e‘l e‘l 'I" a o •roo•- ocno de-9d9cidd
0 03 01
...-. '0" ...-. 01 ..... es.' ..... > ° CO 0 0 0 CO •'s s- LU 0 SO 0 C» 0 Is- 0 N.• J •d°.do.dqd
9 —o — c, — 9 —
o o U) 8 c̀f:3 Cc;")' .0
Ui 2 0 O
CO c. " a> O c." nr Fe o oca 0 wh- o 9 r) odoo 0.0 0.6
od --- d d 9 d 9 —
CD °se es s- N s- .0" 0 03 s- CO N C» 0 • • • •
Iii o o r, (0 eN t•-• N o u) n- N CM d — —
CD s e»... O o o •-• o 0 s- O CV
o 0 0 0 • 0 d;
e• ° 9-
O r- co •- ole•- r-•-m0o O •zr O o o • 0 o d 0. a • o d — C — d ..-- 9
o •-• • ni- — 0 0 ils-j Csi s- 03 ° ve. a csi
• 0 • • ID o 9 a o
<
o = - =
TI.) lir> TU > > > CD CD Cl> -I -J -.J
o 9 Q.
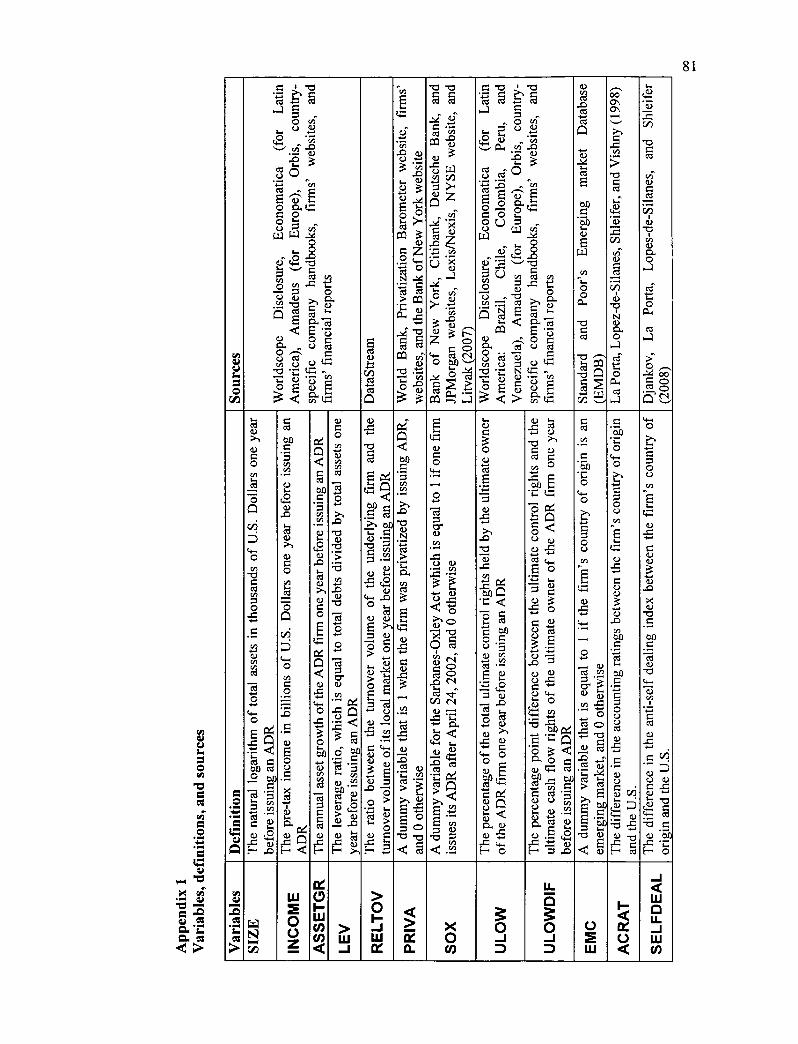
Sour
ces
Wor
ldsc
ope
Disc
losu
re,
Econ
omat
ica (
for L
atin
A
mer
ica)
, Am
adeu
s (
for E
uro
pe),
Orb
is, c
ou
ntry
-sp
ecifi
c co
mpa
ny
hand
book
s, fir
ms'
we
bsite
s, an
d fir
ms' fin
anci
al re
ports
Dat
aStre
am
Wor
ld B
ank,
Pri
vatiz
atio
n B
arom
eter
web
site,
fir
ms'
w
ebsi
tes,
and
the
Ban
k of
New
Yor
k w
ebsi
te
Ban
k o
f N
ew Y
ork,
Citi
bank
, Deu
tsch
e B
ank,
and
JP
Mor
gan
web
site
s, L
exis/
Nex
is, N
YSE
web
site
, and
Li
tvak
(200
7)
Wor
ldsc
ope
Disc
losu
re,
Econ
omat
ica (
for L
atin
A
mer
ica:
Bra
zil,
Chi
le,
Colo
mbi
a, P
eru
, a
nd
Ven
ezue
la),
Am
adeu
s (
for
Euro
pe),
Orb
is, c
ount
ry-
spec
ific
com
pany
ha
ndbo
oks,
firm
s' w
ebs
ites,
and
firm
s' fin
anci
al re
ports
Stan
dard
and
Poor
's Em
ergi
ng m
arke
t Da
taba
se
(EM
DB)
La P
orta
, Lop
ez-d
e-Si
lane
s, Sh
leife
r, an
d V
ishny
(19
98)
Dja
nkov
, La
Po
rta, L
opes
-de-
Sila
nes,
and
Shle
ifer
(200
8)
= o E L: e Th
e na
tural l
ogar
ithm
of t
otal
ass
ets
in t
hous
ands
of U
.S.
Dol
lars
one
yea
r be
fore
issu
ing
an A
DR
Th
e p
re-ta
x in
com
e in
bill
ions
of U
.S. D
olla
rs o
ne y
ear
befo
re i
ssui
ng a
n A
DR
The
annu
al a
sset
gro
wth
of t
he A
DR
firm
one
yea
r bef
ore
issui
ng a
n A
DR
Th
e le
vera
ge r
atio
, whi
ch is
equa
l to
total d
ebts
divi
ded by
tota
l ass
ets o
ne
year
bef
ore
issui
ng a
n A
DR
Th
e ra
tio b
etw
een
the
turn
over
vo
lum
e o
f th
e un
derly
ing
firm
an
d th
e tu
rnov
er v
olum
e of
its l
ocal
mar
ket o
ne y
ear b
efor
e iss
uing
an
AD
R
A du
mm
y va
riab
le t
hat
is 1
whe
n th
e fir
m w
as p
rivat
ized
by i
ssui
ng A
DR,
an
d 0
othe
rwise
A
dum
my
varia
ble
for t
he S
arba
nes-
Oxl
ey A
ct w
hich
is eq
ual t
o 1 if
one
firm
iss
ues
its A
DR
afte
r Apr
il 24
, 200
2, a
nd 0
othe
rwise
The
perc
enta
ge o
f the
tota
l ulti
mat
e co
ntro
l rig
hts
held
by th
e ul
timat
e ow
ner
of th
e A
DR
firm
one
yea
r bef
ore
issui
ng a
n A
DR
The
perc
enta
ge p
oint
diff
eren
ce b
etw
een
the
ultim
ate
cont
rol r
ight
s an
d th
e ul
timat
e ca
sh flo
w r
ight
s o
f the
ulti
mat
e ow
ner o
f th
e A
DR
firm
one
yea
r be
fore
issu
ing
an A
DR
A du
mm
y va
riab
le t
hat
is eq
ual t
o 1
if th
e fir
m's
coun
try o
f orig
in i
s an
emer
ging
mar
ket,
and 0
othe
rwis
e
The
diff
eren
ce in
the
acco
untin
g ra
tings
bet
wee
n th
e fir
m's
coun
try o
f orig
in
and
the
U.S
. Th
e di
ffer
ence
in
the
anti-
self
deal
ing
inde
x be
twee
n th
e fir
m's
coun
try o
f or
igin
and
the
U.S
.
Var
iabl
es
w .'`.? cA IN
CO
ME
I ASS
ETG
R
> w _1 REL
TOV
< > E a
x o Cl)
* o —J M U
LOW
DIF
C.) 2 W A
CR
AT
SELF
DEA
L
81
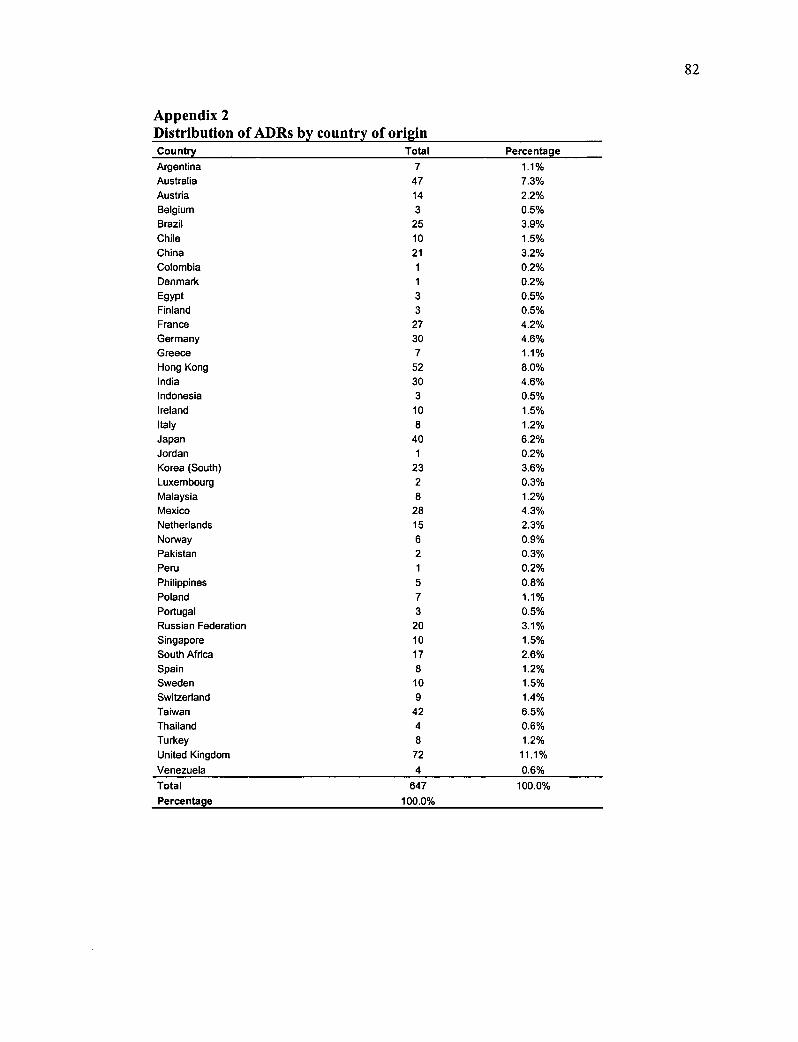
Appendix 2 Distribution of ADRs by country of origin Country Total Percentage Argentina 7 1.1% Australia 47 7.3% Austria 14 2.2% Belgium 3 0.5% Brazil 25 3.9% Chile 10 1.5% China 21 3.2% Cotombia 1 0.2% Denmark 1 0.2% Egypt 3 0.5% Finland 3 0.5% France 27 4.2% Germany 30 4.6% Greece 7 1.1% Hong Kong 52 8.0% India 30 4.6% Indonesia 3 0.5% Ireland 10 1.5% Italy 8 1.2% Japan 40 6.2% Jordan 1 0.2% Korea (South) 23 3.6% Luxembourg 2 0.3% Malaysia 8 1.2% Mexico 28 4.3% Netherlands 15 2.3% Norway 6 0.9% Pakistan 2 0.3% Peru 1 0.2% Philippines 5 0.8% Poland 7 1.1% Portugal 3 0.5% Russian Federation 20 3.1% Singapore 10 1.5% South Africa 17 2.6% Spain 8 1.2% Sweden 10 1.5% Swierland 9 1.4% Taiwan 42 6.5% Thailand 4 0.6% Turkey 8 1.2% United Kingdom 72 11.1% Venezuela 4 0.6% Total 647 100.0% Percentage 100.0%
82
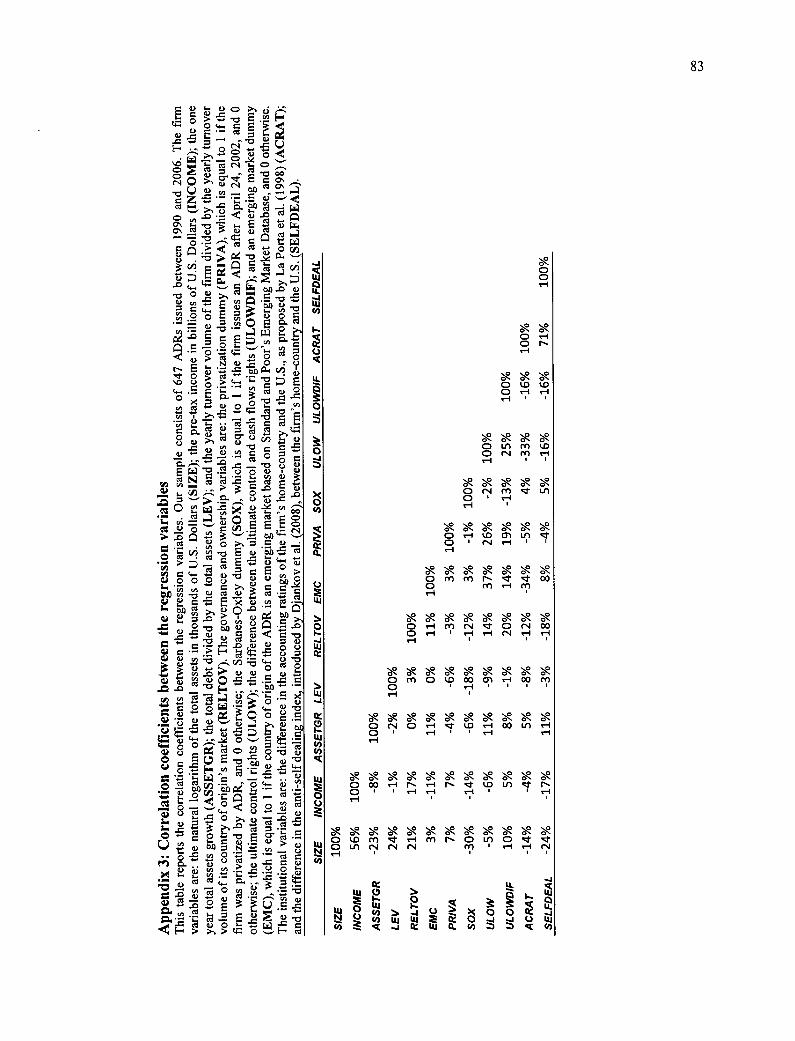
g e 0 1.0
ri I
eeee 0 m 0 hl 01 ri ri I
eeeee 0 N m e-I
ri
eeeeee VD 0• U1 d'
' Nri g-I
eeeeeee 0 KI (11 N " d' 00
o IY1 g-1 01 ri
eeeeeeee O g-I mhl gz:1" 0 hl 00 0 g-1'ri ri N g-1 ri 1-1 r I
eeeeeeeee O m 0 a.!) 00 01 ri 00 CO 1,_1.
'0 'O LO g-1 00
' ri ri g-I ri
eeeeeeeeeee
0 00 ri N ri Nge U1 Gl" 0 I ri ri e-1 1-1
eeeeeeeeeeee 0 V) 01 g-I m h 0 U1 0 0 LI1 N N hl In e-1 I I I
1Y li. ...IL 0 ›
4 0 4 4 nC 3
(j8 1'4 › -.1 (-) k x oo ei e 0 .:C 4 CC LU Cl. Cf) Z •zE SE
LFD
EAL
83
E 0,.., t. ....cL) 0 i, gj ;-: E .e, E",
t+11- 04,=Ege 0) 1 2 • e = L- -c .-• = — ,...,Î 7:, .--- rj
1.-' ,,c>
I lr. • ail ' I - c °D= i • e`' r ,`. „, là <••1 te Ce C> i'Z 1:J ,o, ..• CA ■ -.;:. .. .■•••
g Z 15. • m..= ,,,0 --' ‹ I■1 LU) Ed ,--; W
,0 „,......2 ..... o ..,..,.. 0, i- •-ic > ‘.. E • ■Z 15 W.( Ct■ cd u u tu cd e .1
O c > < «stov)
-0 .
•
cn 7-1 E t..-. Th er, -■-•
• -, .--, ,„ = .) 0 E a c ^' .. n::, • ^.
s";,-", ■,O,. â g u 0 > ..... 0 ...c o r u N E b ..;.-...E bo o. ch
4. • = •-• ,,, ,,,,o 2
.,.., 0 ,,, ,.. _ • • ..... ‹„
0 . cr a., •.-. Q .2 ,.;
,..= •=.' c o = -. "0" . fe f.) 15e le 8. tue
„„ t,4 c , •- 1..., Ln 6)
.0 0 ..0 m.
• 0
0 ......,› cl e w .-,),...,,u . .r.'3. 4 t 0 -d ee Ê c) e 0 -8"--"gv).--- ° > Ztme-73`-';-Itn'̀ Al''' = gu 0 o >, -5 e 0 • - • CA • .«« 1.=
O à Cil IQ "Ce E . se..."' cl ...e > ..._, ,,c, 5 75 o e c48. 15 o o , cdn C te. ..» tu -0 - - >
O a.) CU0000 tu e> oz 71 ÇA >1 ;., 0 .1 . CO gn nc .1) erlI ci.) e ..„ _
•_,- — " w pe 0)
.i,.) c <a> •-• -0 g = —
•
.— ..= ,,,, 0, 0, 0 0 cid = — ..?-.. (- â -...5. . 0 su ...
- ''' 0 • ,,r,- a) z , . ,4.) 0 0 -e, .5 ln - .o
.,. •-4-...= .,
— 1.... .a.
q8 8, "g O IL) 0.) ,...., v ,4 ..,.._
"e E 71--' f. r.) -e. .F • , lei czt o. •■-• o -o (..)
O (.7 E -o -go u â •.= E.., „, ...f. a. 1-. ..0 -1-. —. = "4: s... _, . . CL) O e e
•tu
z., •i; oz en to ce 2 4•= 1̀'`e e 0 **-d u 0 g) C.) ... .--.'' 2 „
•
" ' . - . -c.,-• ° >, c 7; -CD -=
= (-)
gn „G) .= gn 0'- ' ' '-' —‘- ' • 0 •■••• .... = ce... , . 2 9 - - - - ... ..... ,.... ..,..- . . „.., c. • .. e 0 :-.
. E
— u u 0 , .e.' . o g X c, 2 â 0 ▪ F- ›. >, ›, ir. 0
SELF
DEA
L
o
Co
ASS
ET
GR
LE
V
(*)
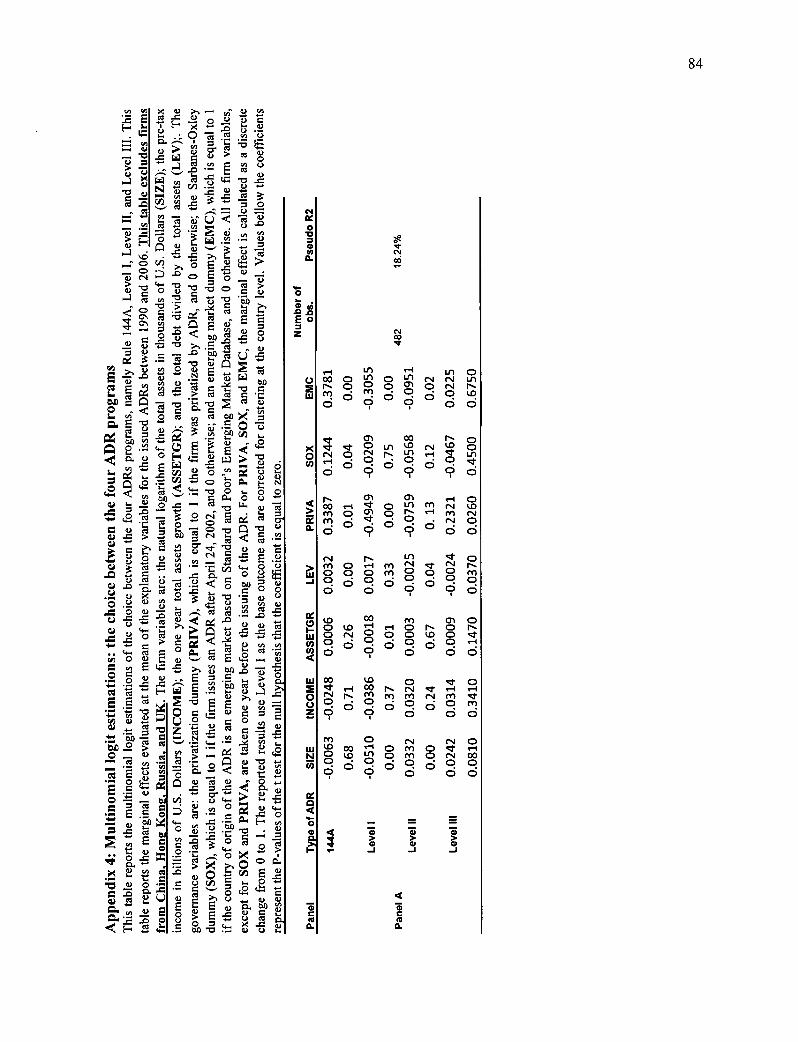
,
.2 y, à isi Q cp> .- e o y,
o cl.) Lu •E•
T [-■ x .0 $••• 0 a)
■-■ te 1...V . 9 cd e 0 0. ..:-t. 71 •.-.
,-■ e a) > ru g 51 , a.) ^0 > • - t cn 0
ni
-0
. ea
....z.• .... 0-- .. e
e g 3 I■1 • ... , f /I C.) .°
Tu. k X a; tn
...Lc. .`' 0•A e n c
, sà ..... • e t. c., .cr -1 .6 _, 7-'• f., >, •., cu 74
c4. › Od1 •-• G.
E r> u • co
7 7 0 "6 ,-J cu e le
•,,,l's c),., g ...a ees ...a
E *a. E 0 •er 0, vl
c.) Z (NI 03
7 (1) cu
e .c. e. a)
sEle _cl ..0 ce .- -0 a.) w se e4) e a.) c • Ln r-i >, ' = 7) •Je le .N.... 05 ,-'0, M '"LEito 0 CO 0 Ln 0 Ln eq eNi Ln
.-1 Ln 0
> 7 cd 7 • "k;
,.bC 2N•0 0 0CnOtN h. Ill en Cle e C2 11 . à m • a __. 0 0 ‘.0
Co eu o d ° d à d s. ce ci« e -0 e 0 •-.
a , ,,9 -= Pin •- e. ....
O cl. cn oo r-- a n 0 - X 't 'e ° Ir) u) Ln cv uo 0
0 ri 0 eN N 0 ri cl. Ln
-a •O ..= E ..e - ,.-- •-• ci.
co 1(5 0« Ë M a 9 Y Le d
c.. Q 4",„ toce ....• •- ô c.) cn cn 0 1: ‹ 4.• -0 o o o clà 1- a.) o ,.= ^. g el"
-ci I-, o 7',LI < co ,-4 •I" a Ir) m N t.0 N
> cn 0 r--. ,-1 m o _.: o •fel tN
d d d
a e 1-.4 0
tu o. rn_.: c•-)....: .-:. L l"le cu ,..e, , ,i,.3. an e ev •-•
.5 cl, 0 . ..0 r., L--- Ln a- 0 . ja/ os -= `i' •- •c (rl 4« 0 (-3
7 > en 0 ri m N nr N h
0 0 w000MCDOOM a? cas '03 .0 a.
c.) _20 •00 -1 0_. ci o _ • coo - 0 -
, ..= ... , 0 o o. a 9 9 d .2 co x LL, Ln ...-.L e ci) .1:, -5 ?.,,, c
0 .° cL) 0) •-• . ec, - ce _- • .. ,11.) 7.-n rZ 00 m 01 0
•-i a VD r-I 0 h 0 h O rs, 0 0 0 VD 0 d- 4,.. .■-• (nW 0C) 02 0 ...: 1:5 (:). Cil QI ‘--4
U) --: t..., t...) 0 0 d a
0 c "C) 73 -50 • ■■■ 0 4.) 1.) e = c > w00
0 c-.4 r--. m m m t■I rfl d" E .E rl 1/4) -o c Ê E g) VI
>, a) 0 0 _..: 0 _. 0 ...:
1.) 7 0 '-‘ QI ,.. C I, . c...0 0 m
Le cL, o o z d '7' a ci ci
U .?.... c ° VI
,1) c,:t 0.) = 9:1 Z = ..= = el . eei C . 1 -e •1-. e 0 0 4-. fr) 0
r..4 r .4 0 ce° n 1 el: w sts 00 <-1 0 MI 0 O.R1 cl 0 Clà , N o u::, Ln o m o eN oo
C.1 t CU
Vl Ci ° -:
d a d d 0 0 •odoo a
. ,.., •..- o ,.... e c 1.) 7,3 C.) - 0 ..e, , ..= < O. 0 e •e 403' 0" .4
f- c .- à • e) = ..z o
84
ce 0
...-.= • r: C1 "0 ) < .... 711)
= e Ti E Ô) - ...b,) 6- . . &à r. u• ..= •- P« [-• . =
c.c, e 2 g 0 -eee 4 > 0 > 0 > 0
Q ? 1- _1 -, -1 •• a ..,
...x ....̀u 1.0 =ci 0 CA E 0 mt o o - c.) (nC) .E.= I.. o f,
a.) u 5 › , c .9 = ..0 o. = a> e 1... c E cu tl. 0.0
o o cu
cif a; TD 0« „, E (L) e e c 0..2 -
o cz '-' to to Q. Q. •< (.-■ e '''
Chapter 3:
International Cross-Listings and Subsequent Security-Market Choices:
Evidence from ADRs
86
International Cross-Listings and Subsequent Security- Market Choices: Evidence from ADRs
Abstract
In this paper, we study the link between the ADR-listed firms' attributes and their subsequent security-market choices. First, we find that following ADR listings, foreign firms increase their equity and debt issues, especially emerging market firms. We also find that being an emerging market firm increases the primary shares in new equity issues after ADR listings. We also find that large firms are more likely to issue debt and less likely to issue equity. Following SOX, we find that more emerging market firms, under Level III and Rule 144A, issue equity compared to the pre-SOX period. Moreover, we find that after SOX, Level III ADR firms increase their public equity issues on U.S. markets. Finally, we find that ADR firms rely more on primary-equity resources than on debt following their listings, especially for emerging market firms.
JEL: G15, G32, G34, KOO
Keywords: cross-listing; financing; equity; debt; Sarbanes-Oxley
87
1. Introduction Raising fresh capital is one motive to list abroad since cross-listings facilitate and
improve the firms' access to capital resources (Coffee, 1999; 2002; and Stulz, 1999),
and allow them to raise capital with lower costs. 1 The U.S. is a "net exporter" of both
equity and debt, and is the most common location for firms that issue equity abroad
(Henderson et al., 2006). Following their U.S. cross-listings, foreign firms increase their
capital-raising activity at home and abroad (Reese and Weisbach, 2002; Lins et al.,
2005; and Doidge et al., 2007), especially emerging markets firms (Lins et al., 2005).
When they list in the U.S., foreign firms explicitly mention their need to "relax" capital
constraints and access external capital markets (Lins et al., 2005). Contrary to other
types of U.S. cross-listings, American Depositary Receipts (ADRs) attract firms that
originate from a wide array of developed and developing countries and are used as an
important tool to raise capital. 2 ADRs are dollar-denominated negotiable certificates that
represent a non-U.S. company's publicly traded equity or debt. 3 ADRs carry the
corporate and economic rights, such as dividend and voting rights, of its underlying
share. According to JPMorgan, the capital raised using ADRs has increased from $20.4
billion in 2005 te $42.6 billion in 2006, and to $57.3 billion in 2007. In addition, in
2000, ADR finns have issued 7% of the total non-convertible debt issued on capital
markets around the world. Similarly, in 2001 ADR firms have issued 19.3% of the total
1 Sarkissian and Schill (2007) examine global listings and report a decrease in the cost of capital around the foreign overseas listing date. Further, foreign firms benefit from a decline in their cost of capital following the announcement of their U.S. listing, as documented by Miller (1999), Foerster and Karolyi (1999), Errunza and Miller (2000), and Hail and Leuz (2005). 2 Further, firms using direct cross-listing are mostly Canadian. 3 An ADR can be sponsored or unsponsored. A sponsored ADR is issued with the agreement and the approval of the underlying firm which works with a designated depositary bank. However, an unsponsored ADR is issued in accordance with market demand and without the agreement of the underlying firm. Since 1980, new ADR prograrns listed on the major U.S. exchanges must be sponsored. See ADR reference guide, JPMorgan, February 2005, page 13.
88
non-convertible equities issued on capital markets ail over the world. Focusing on ADRs
thus allows us to examine the firms' security-market choices in an international
framework.
In this paper, we study the link between the ADR-listed firms' attributes and their
subsequent security-market choices, and specifically address the following, yet
unexplored issues: (1) what are the determinants of issuing equity and debt after ADR
listings? (2) Where do ADR firms issue their securities? And (3) what are the
determinants of primary and secondary equity issues? These questions are important in
many aspects: (1) ADR firms issue large debt and equities' amounts on capital markets
thus their choice between debt and equity influences the repartition between debt and
equity capital markets. (2) Moreover, ADR firms raise their equity proceeds on U.S.
markets, international markets (excluding U.S.), and domestic markets. Thus, the choice
of issues' venue of ADR firms' issuances affects the development of one market relative
to the others. (3) As discussed above, foreign firms cross-list to facilitate their access to
capital markets and consequently to be able to raise fresh capital to finance their growth
opportunities, which in turn boosts the economic growth of their home country.
When ADR firms need external financing, they need to choose both the security to issue
(i.e., debt or equity) and the market-venue in which this issue takes place (domestic or
international). Indeed, the choice between debt and equity issues depends on the firm's
target capital structure. Different theories try to explain a firm's capital structure such as
the tradeoff theory and the pecking order theory of financing hierarchy. According to
the former, firms "tradeofr the costs and benefits of debt, and will target a debt-equity
optimal ratio (Modigliani and Miller, 1963; Miller, 1977). The latter theory does flot
89
assume that firms target such a ratio and instead firms use external financing resources
only when their internai sources of funds are insufficient to meet their financing needs
(Myers and Majluf, 1984; Myers, 1984). According to the pecking order theory, firms
start by issuing the less information-sensitive securities, such as debt securities and at
the last resort they issue the most information-sensitive issues, such as equity securities.
In other words, the firm needs to design the optimal security-market choice that meets its
characteristics and goals. As financial markets have become increasingly integrated, the
choice set of eligible securities becomes larger, especially for ADR firms, as they have
now an access to additional resources which were previously unavailable to them.
To meet their financing needs, ADR firms can issue either equity or debt. For equity
issues, firms can issue either new shares (i.e., primary shares), or sell outstanding shares
that are already held by existing shareholders (i.e., secondary shares), or a combination
of both. Primary share issuances allow capital inflows to the firm, which in turn can be
used to finance its investment opportunities. However, secondary shares do flot benefit
the firms as there are no capital inflows from these issues and consequently firms cannot
use them to cover their financial needs. Primary, secondary, and combined issues are not
emphasized in the corporate finance literature (Kim and Weisbach, 2008). Raising new
capital through primary issues or debt can also occur domestically or on international
markets.
The enactment of the Sarbanes-Oxley Act (SOX) in 2002 introduced more stringent and
costly corporate governance requirements for the firms listed on major U.S. exchanges.
SOX, therefore, represents a structural change in the regulatory and legal environment
surrounding ADR listings, particularly Level II and Level III programs. After SOX,
90
Level II program requires virtually the same compliances as Level III, without the
access to U.S. new equity capital. However, by choosing Level II ADR, foreign firms
offer more protection for their minority shareholders, even those outside the U.S, as they
free-ride on the additional protection provided by SOX requirements. Zingales (2006)
provides preliminary evidence on the impact of SOX on ADR programs and documents
a significant increase in the number of 144A registrations after SOX. The advantage of
Rule 144A is that it allows issuing firms to raise external capital on U.S. markets among
Qualified Institutional Buyers (QIBs), while exempting them fi -om the stringent U.S.
requirements.
Given that ADR programs are affected by SOX, the ADR firms' financing decisions
may change from the period before to the period after SOX. Consequently, in this paper
we also examine whether SOX had an impact on the ADR firms' financing decisions?
To the best of our knowledge, we are flot aware of any other study that examines this
issue.
We contribute to the literature on cross-listings by considering all ADR programs on an
individual basis. As the four ADR programs mandate different compliances, in terms of
corporate governance and disclosure requirements, they offer different levels of
protection for minority shareholders, including those outside the U.S. 4 Firms with a
better corporate governance environment should have an easier access to capital
resources. Additionally, certain ADRs allow firms to access U.S. capital resources,
4Indeed, shareholders outside the U.S. free-ride on the protection provided by the higher legal and regulatory U.S. requirements. According to Benos and Weisbach (2004), p. 234, "Shareholder protection arising from SEC regulations acts as a public good".
91
while others do flot. These differences are very likely to influence/constrain the foreign
firms' financing decisions after their ADR listings.
We also contribute to the literature on corporate finance by assessing the firms' capital
structure and offering further insights on the capital structure theories (trade-off and
pecking order theories) in an international basis. Moreover, we contribute to this
literature by examining in depth the choice between primary and secondary equity issues
made by ADR firms and its determinants in an international framework. Indeed, by
doing so, we disentangle the insiders' motives to issue only secondary shares from the
firm's investment incentives to issue primary shares. More precisely, insiders have the
incentives to issue secondary shares and decrease their participation when the stock
price is high and consequently they benefit from this issue whereas there is no capital
inflow to the firm. However, when a firm has investment opportunities to finance, a
primary shares will be issued to allow capital inflow to the firm. Finally, we contribute
to the literature that examines the impact of SOX, which is a major regulatory change of
U.S. financial markets, on ADR firms' financing decisions. By doing so, we contribute
to the ongoing debate on the impact of SOX on the attractiveness of U.S. markets.
The empirical results of this paper show that foreign firms indeed increase their equity
and debt issues following their ADR listings. This increase is the highest during the year
that follows the listing for the four ADR programs. Moreover, emerging market firms
show the highest increase in their equity and debt issuances after ADR listings compared
to their developed markets counterparts. We also find that ail ADR firms mostly rely on
debt rather than equity to raise funds, except for Rule 144A ADRs, which is consistent
with the pecking order theory.
92
The equity multivariate analyses show that being a developed market firm increases the
probability of issuing equity by ADR firms during the year following the listing, as well
as the total amount of proceeds raised within the same period. Moreover, being an
emerging market firm increases the percentage of primary shares in new equity issues
made within one year after ADR listings. We also find that large fil-ms are less likely to
issue equity after their ADR listings.
Following SOX, we find that more emerging market firms, under Level III and Rule
144A, issue equity compared to the pre-SOX period, while developed market
counterparts do not show this trend. Moreover, after SOX, Level III ADR firms increase
their public equity issues on U.S. markets. This result is consistent with the hypothesis
of more bonding and the enhanced benefits on U.S. markets after SOX. Indeed, firms
that issue Level III ADR after SOX have to comply with ail SOX new stringent
requirements, and therefore increase their protection of their minority shareholders,
which in turn facilitates their access to U.S. capital markets.
The debt multivariate results show that being a developed-market firm increases the
probability of issuing debt within one year following the ADR listing, and increases the
proceeds raised from issuing debt within the same period. Compared to Level I ADR
firms, Levels II and III firms are less likely to issue debt at home, and more likely to
issue debt on international markets. We also find that large firms are more likely to issue
debt after their ADR listings.
As debt and equity issues' decisions are dependent and as only primary-equity and debt
issues allow capital inflows to the firrn, we further examine the ratio between debt
proceeds to the total of debt and primary-equity proceeds during the year following the
93
ADR listings. According to the univariate analysis, we find that ail ADR firms decrease
their ratio following ADR listings. In other words, ADR firms rely more on primary-
equity resources than on debt to finance their capital needs following their listings.
Moreover, in the multivariate analysis, we find that being an emerging market firm
decreases this ratio during the period following ADR listing, which suggests that these
firms cross-list to principally have an access to equity capital markets.
Overall, we find that ADR firms increase their debt and equity issues following their
cross-listings which allows them to finance their growth opportunities and consequently
increase their values. We also find that emerging market firms show the highest increase
in debt and equity issues, which not only facilitates the financial integration of their
home capital markets but also has a direct impact on the economic development of their
home countries.
The remainder of this paper is organized as follows. In section 2, we briefly present the
capital-raising activity around the world and the subsequent U.S. cross-listings capital-
raising activity related literature. Section 3 describes the data. Section 4 presents
univariate and multivariate empirical analyses. Section 5 presents the sensitivity tests,
while section 6 concludes.
2. Related literature
2.1. Security-market choices
In this section, we briefly present the literature related to the security design. First, firms
have the choice between issuing debt or equity. Then, and beyond this choice, firms
must decide where debt or equity securities should be issued, whether in public or in
94
private markets. Moreover, firms could issue their securities either at home or abroad on
international markets. As listings abroad facilitate the firms' access to capital resources,
and provide them with an opportunity to raise capital at lower costs, we predict that
ADR firms will be active on capital markets soon after their ADR listings. In what
follows, we briefly discuss the types as well as the market venues of these securities.
2.1.1. Debt-equity choice
When firms need externat finance, they have the choice to issue either debt or equity.
This choice depends on some firm's characteristics and goals. Different theories try to
explain a firm's capital structure such as the tradeoff theory and the pecking order theory
of financing hierarchy.
First, in the presence of tax, firms benefit from the tax advantage of debt (Modigliani
and Miller, 1963). However, debt is also costly, particularly because it increases the
likelihood of financial distress, and the bondholders' interest-income tax (Miller, 1977).
Thus, firms "tradeoff' the costs and benefits of debt, and will target an optimal capital
structure (i.e., a target debt-equity optimal ratio).
Contrary to the tradeoff theory, the pecking order theory does flot assume that firms
target an optimal debt-equity ratio. Instead, due to information asymmetries between
managers and investors and adverse selection costs, externat financing resources are
undervalued and then firms use these resources only when their internat sources of funds
are insufficient to meet their financing needs (Myers and Majluf, 1984; Myers, 1984).
According to the pecking order theory there is also a financing hierarchy between the
different externat financing choices. First, firms start by issuing the less information-
sensitive securities, such as debt securities. At the last resort, they issue the most
95
information-sensitive issues, such as equity securities. In addition, within debt and
equity, firms prefer to issue convertible debt than equity because convertible debt has
lower debt costs, especially those related to financial distress, and are less undervalued
than equity.
Assuming that ADR firms will become active on capital markets raises issues such as
whether these firms issue debt or equity after their ADR listings, and whether they adjust
their financing resources from before to alter their ADR listings.
2.1.2. The market choice: public or private?
When firms decide to use external funds, they have the choice to raise these funds either
on public or private markets. Private markets have become increasingly important
recently. In fact, Gomes and Phillips (2007) report that more than half of U.S. public
firms' issues are in the private market. Moreover, they find that the choice of the type of
the security issued in both private and public markets is related to asymmetric
information.
Denis and Mihov (2003), examining debt issues, find that public borrowers are larger
and more profitable, have a higher proportion of fixed assets to total assets, and have
higher credit ratings than firms borrowing from either banks or non-bank private lenders.
They also show that firms with the highest credit quality borrow from public sources,
while firms with a higher degree of information asymmetry and a higher probability of
default will issue private debt before public debt. Moreover, Wu (2004) and Hertzel and
Smith (1993), examining equity issues, find that asymmetric information is important for
equity private placement issues as private investors may collect information about firms
more efficiently and thus mitigating adverse selection problems.
96
ADR finns have access to private placements through Rule 144A ADRs. Thus, one may
ask whether these firms will rely on public markets or on both public and private
markets. As ADR firms are generally larger and more profitable than their local market
peers (Reese and Weisbach, 2002; Doidge et al., 2007) and since these firms cross-list to
facilitate their access to capital resources, we would expect them to be more likely to
choose public rather private capital markets to cover their financing needs.
2.1.3. Where do firms raise capital?
Financial markets have become increasingly integrated, which provides firms with a
larger set of financing choices they should seek to raise capital. For instance, firms can
raise capital either at home or on international markets. The choice of market venue
might depend on some variables such as capital availability, cost of capital, and taxes.
Henderson et al. (2006), examining the world debt and equity markets, find that U.S.
markets are the main sources of equity capital to foreign firms, whereas European debt
markets are the most popular for foreign issuers. Indeed, they show that foreign firms
issue 66% of their cross-border equities on the U.S. market, which is followed by the
U.K. market with 10%, and they find that 20.2% of debt is issued overseas.
After their ADR listings, foreign firms have the choice of raising their capital at home or
on international markets. As raising capital is among the main motives behind cross-
listing abroad, we expect that ADR firms will rely on international markets to raise
capital, either under debt or equity issues.
97
2.2. Capital-raising activity around the world
Firms wishing to raise capital can do so by choosing: (1) the type of security to issue
(i.e., equity or debt), and (2) the location where they intend to raise these funds (i.e., at
home or abroad). As discussed above, Henderson et al. (2006) examine these two
questions and find that firms ail over the world rely mostly on debt, rather than on
equity, to raise new capital. They also find that the U.S. markets are common locations
for firms willing to issue equity; instead, firms issue debt mainly on the Eurobond
market. As a final result, Henderson et al. (2006) show that, in most countries, firms
time their security issuance decisions.
Kim and Weisbach (2008), examining initial public offerings and seasoned equity
offerings all over the world, find that market timing as well as investment financing
motivates firms to issue equity. Following these public equity offers, Kim and Weisbach
(2008) examine how the new raised capital is used by firms, and find that firms invest
these new resources in R&D and capital expenditures, among others.
In our paper, we first extend the results of these two papers by examining
simultaneously debt and equity issues of ADR firms around the world and distinguishing
between primary and secondary equity issues. Second, we extend these results to the
recent period that includes the enactment of SOX in the U.S. Third, we examine the
difference in the financing behavior of emerging market and developed market firms.
Finally, we extend these results by conducting a separate analysis of the financing
behavior of cross-listed firms
98
2.3. ADR listings and subsequent capital-raising activity
The four types of ADRs have different features in terms of their ability to raise fresh
equity capital on U.S. capital markets and to their degree of compliance with governance
and disclosure requirements. In fact, only Level III programs allow firms to raise capital
on U.S. markets and to benefit from these resources, while Level II programs do flot.
Consequently, in what follows we will examine the capital raising possibility made by
each ADR type, separately.
Firms intentionally cross-list on markets that have more stringent legal and regulatory
requirements than the firm's home market, in order to limit expropriation of minority
shareholders by managers or controlling shareholders (i.e., private benefits of contro1 5),
which should in turn facilitate the firms' access to capital markets (Coffee, 1999; 2002;
and Stulz, 1999). This is called the bonding hypothesis. Consistent with the bonding
hypothesis, Reese and Weisbach (2002) find that following their U.S. cross-listing, firms
from countries with weak shareholder protection issue more equity than those from
countries with strong shareholder protection. Additionally, they find that after their U.S.
cross-listings, firms with weak shareholder protection rely mostly on their home markets
to issue new equity, while those from countries with strong shareholder protection rely
mainly on U.S. markets to do so.
More recently, Siegel (2005) contributes to the debate on bonding by providing evidence
of low SEC enforcement against Mexican firms with ADRs and introduces what he calls
the reputation bonding rather than the legal bonding, according to which firms cross-list
5 Benos and Weisbach (2004) and Karolyi (2006) offer a literature review on private benefits and cross-listings in the U.S.
99
to bond themselves to protect minority shareholders, thus acquiring a positive reputation
that will subsequently allow them to raise capital on U.S. markets.
After SOX, Zingales (2006) documents a significant increase in the number of 144A
registrations. The advantage of Rule 144A is that it allows issuing firms to raise external
capital on U.S. markets through private placements among QI:13s, without having to
comply with the full SEC disclosure, accounting obligations, and public offering
requirements. In other words, they are exempt from the mandatory governance and
accounting requirements imposed on the major U.S. exchanges after SOX, and still
benefit from the access to U.S. external capital resources via "the back door" (Zingales,
2006).
Lins et al. (2005), examining the capital raising activity between the pre- and post- ADR
listings on NYSE and NASDAQ, find that the percentage of foreign firms that issue
equity increases dramatically in the period following the ADR listings, while there is no
significant change in the debt issue between these two periods. Moreover, the number of
equity as well as the number of debt issues per firm increases in the post-ADR period.
Additionally, following their ADR listings, Lins et al. (2005) find that emerging market
firms increase more their access to external capital markets, either under equity or debt
issues, than those from developed countries.
Doidge et al. (2007), comparing the new equity issues before and after U.S. listings, find
that following their cross-listing on major U.S. exchanges (which include Levels II and
III), firms increase their access to equity capital at their home countries, in the U.S. and
in international markets (excluding the U.K.).
100
Our paper complements the previous literature on the capital raising activity before and
after the cross-listings on U.S. markets in many aspects. First, we extend the results for
Level II and Level III ADRs (listed programs) of previous studies to Level I and Rule
144A (unlisted programs). Second, as previous studies do flot differ between primary
and secondary issues, we extend previous findings by examining in depth primary and
secondary issues separately. Third, contrarily to previous studies, we examine debt and
equity issues simultaneously. Finally, we offer an additional test of the bonding
hypothesis by examining the impact of the more bonding offered by SOX on the capital
raising activity.
In this paper, we address some questions that remain unanswered: (1) what are the
determinants of issuing equity and debt after ADR listings? (2) Where do ADR firms
issue their securities? (3) What are the determinants of primary and secondary equity
issues? And (4) does SOX have an impact on the ADR firms' financing decisions?
3. Data
From the websites of the Bank of New York (BNY), Citibank (CB), the Deutsche Bank
(DB), and JP Morgan (JPM)6, we download all the information regarding ADRs (e.g. the
type; the effective issuance date; the sponsorship status; the underlying share and its
country of origin; ...).
Our sample includes only sponsored ADRs because unsponsored ADRs are created on
investors' initiatives (primarily institutional investors), independently from the
manager/controlling shareholder's preferences for a particular ADR program. We also
6 The respective websites are as follows http://www.adrbny.com/, http://wwss.citissb.com/adr/www/ (Universal Issuance Guide), http://www.adr.db.com/, and http://www.adr.com/.
101
exclude the sponsored ADRs that upgrade, downgrade, or delist from their initial
programs as we cannot obtain full information about these changes, which is the first
ADR type and the first date of issuance. We also disregard the subsequent ADRs that the
firm may have issued. Finally, we exclude the "side by sicle" ADR programs. Under this
program, the company establishes a public Level I ADR program as well as a private
Rule 144A ADR for the same class of stock. This structure allows companies to
combine the benefits of publicly traded programs with the possibility of raising capital.
As Rule 144A ADRs were introduced in April 1990, we consider only programs which
were issued after 1990. We verify the ADRs' characteristics, using Lexis-Nexis,
NASDAQ, NYSE, and the firms' websites. We end up with 1120 ADRs that were issued
between 1990 and 2007. The countries of origin of our sample ADRs are presented in
Appendix 1.
The data on security issuance are from the Securities Data Company (SDC) Platinum.
SDC offers information on the global new issues of common stock, preferred stock, and
debt. We extract ail the SDC private and public issues for ah l regions7 and for ail types of
securities, and then by the Committee on Uniform Securities Identification Procedures
(CUSIP) and the firm's name of the ultimate parent; we match the ADRs with the SDC
data. By doing so, we include in our data ail equity or debt issues made by the
subsidiaries of the ADR underlying firm.
We obtain the accounting and financial information on the sample firms from Amadeus
(for Europe), Datastream, Economatica (for Latin America), Orbis, Worldscope
7 The SDC comprises different regional databases which are: United States, International (cross-border issues), Asia Pacific, Australia and New Zealand, Canada, Continental Europe, India and subcontinent, Japan Domestic, Korean Domestic, Latin America, United Kingdom, and the rest of the world.
102
Disclosure, countries' companies hand books, firms' websites, and firms' financial
reports.
4. Empirical analysis
4.1 Univariate analysis
4.1.1. Security issues by ADR firms
In this section, we firstly start by comparing the security issues (equity and debt) by
ADR firms between the periods pre- and post-ADR listings. In this section: (1) we
consider simultaneous issues (i.e. issues that take place in more than one country) as one
issue, (2) we do flot make distinction between primary, secondary, and combined equity
issues, (3) we group private and public issues together, and (4) we group issues made by
a parent or its subsidiaries together. Parent and subsidiary issues and private and public
issues will be examined in depth in robustness checks.
Panels A and B of Table I compare the different security issues in the pre- and post-
ADR periods by considering two different windows, namely one and three years. This
Table shows that ADR firms increase their access to capital markets (either through
equity or debt) in terms of total proceeds raised in the period following their U.S. cross-
listings, compared to the period before, for both windows. 8
When we break down the results into ADR types, Panels A and B of Table I show that
Levels II and III firms flot only increase their access to extemal capital resources by
issuing either debt or equity in the period following their ADR listings compared to the
8 In unreported results, we find that ADR firms increase their access to capital markets following their U.S. listings even when we consider a five-year window.
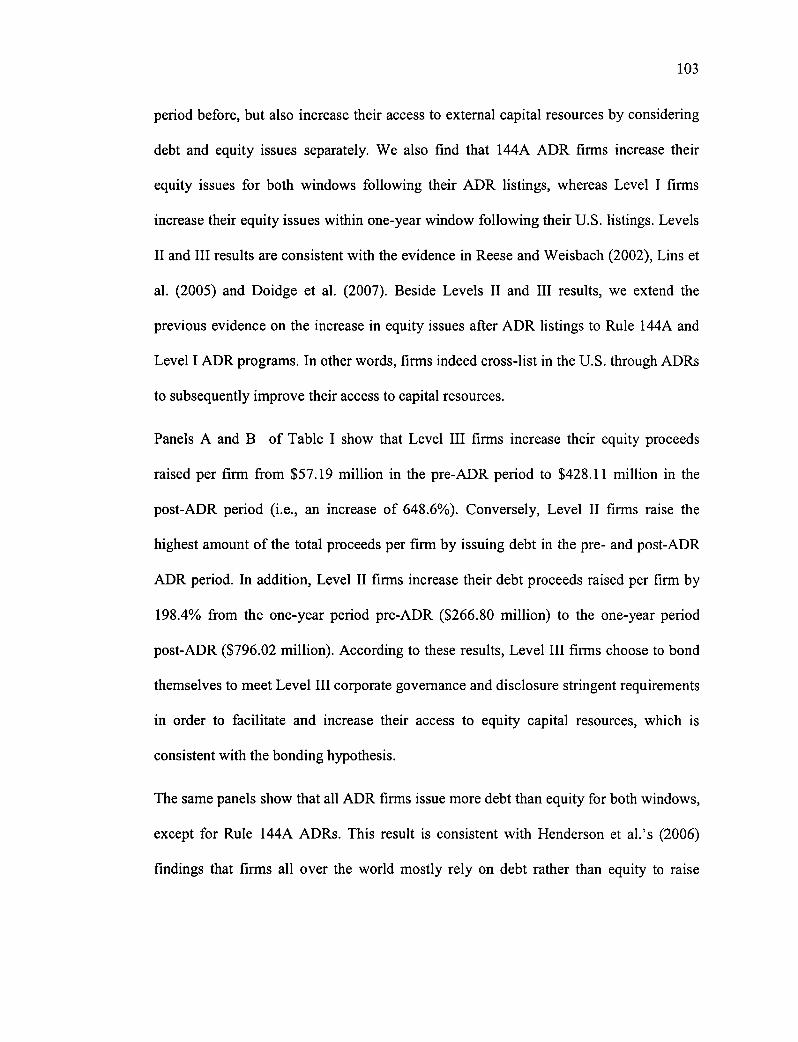
103
period before, but also increase their access to external capital resources by considering
debt and equity issues separately. We also find that 144A ADR firms increase their
equity issues for both windows following their ADR listings, whereas Level I firms
increase their equity issues within one-year window following their U.S. listings. Levels
H and III results are consistent with the evidence in Reese and Weisbach (2002), Lins et
al. (2005) and Doidge et al. (2007). Beside Levels II and III results, we extend the
previous evidence on the increase in equity issues after ADR listings to Rule 144A and
Level I ADR programs. In other words, firms indeed cross-list in the U.S. through ADRs
to subsequently improve their access to capital resources.
Panels A and B of Table I show that Level III firms increase their equity proceeds
raised per firm from $57.19 million in the pre-ADR period to $428.11 million in the
post-ADR period (i.e., an increase of 648.6%). Conversely, Level II firms raise the
highest amount of the total proceeds per firm by issuing debt in the pre- and post-ADR
ADR period. In addition, Level II firms increase their debt proceeds raised per firm by
198.4% from the one-year period pre-ADR ($266.80 million) to the one-year period
post-ADR ($796.02 million). According to these results, Level III firms choose to bond
themselves to meet Level III corporate governance and disclosure stringent requirements
in order to facilitate and increase their access to equity capital resources, which is
consistent with the bonding hypothesis.
The same panels show that ah l ADR firms issue more debt than equity for both windows,
except for Rule 144A ADRs. This result is consistent with Henderson et al.'s (2006)
findings that firms all over the world mostly rely on debt rather than equity to raise
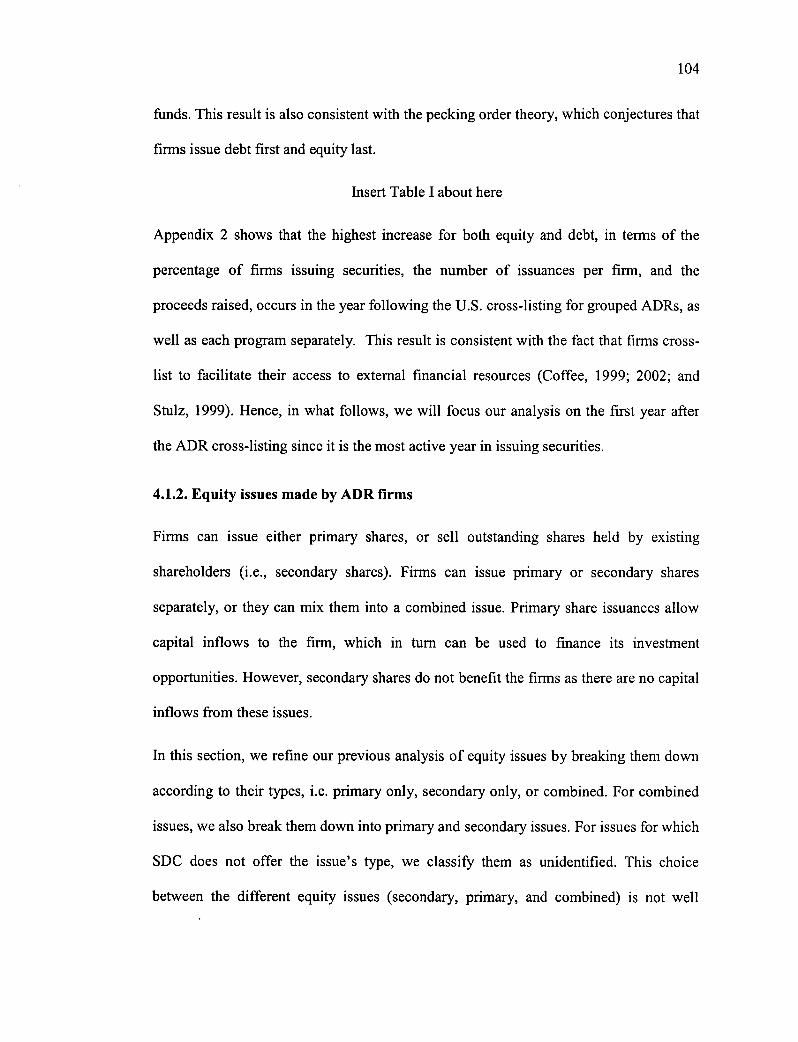
104
funds. This result is also consistent with the pecking order theory, which conjectures that
firms issue debt first and equity last.
Insert Table I about here
Appendix 2 shows that the highest increase for both equity and debt, in ternis of the
percentage of firms issuing securities, the number of issuances per firm, and the
proceeds raised, occurs in the year following the U.S. cross-listing for grouped ADRs, as
well as each program separately. This result is consistent with the fact that firms cross-
list to facilitate their access to external financial resources (Coffee, 1999; 2002; and
Stulz, 1999). Hence, in what follows, we will focus our analysis on the first year after
the ADR cross-listing since it is the most active year in issuing securities.
4.1.2. Equity issues made by ADR firms
Firms can issue either primary shares, or sell outstanding shares held by existing
shareholders (i.e., secondary shares). Firms can issue primary or secondary shares
separately, or they can mix them into a combined issue. Primary share issuances allow
capital inflows to the firm, which in turn can be used to finance its investment
opportunities. However, secondary shares do not benefit the firms as there are no capital
inflows from these issues.
In this section, we refine our previous analysis of equity issues by breaking them down
according to their types, i.e. primary only, secondary only, or combined. For combined
issues, we also break them down into primary and secondary issues. For issues for which
SDC does flot offer the issue's type, we classify them as unidentified. This choice
between the different equity issues (secondary, primary, and combined) is not well
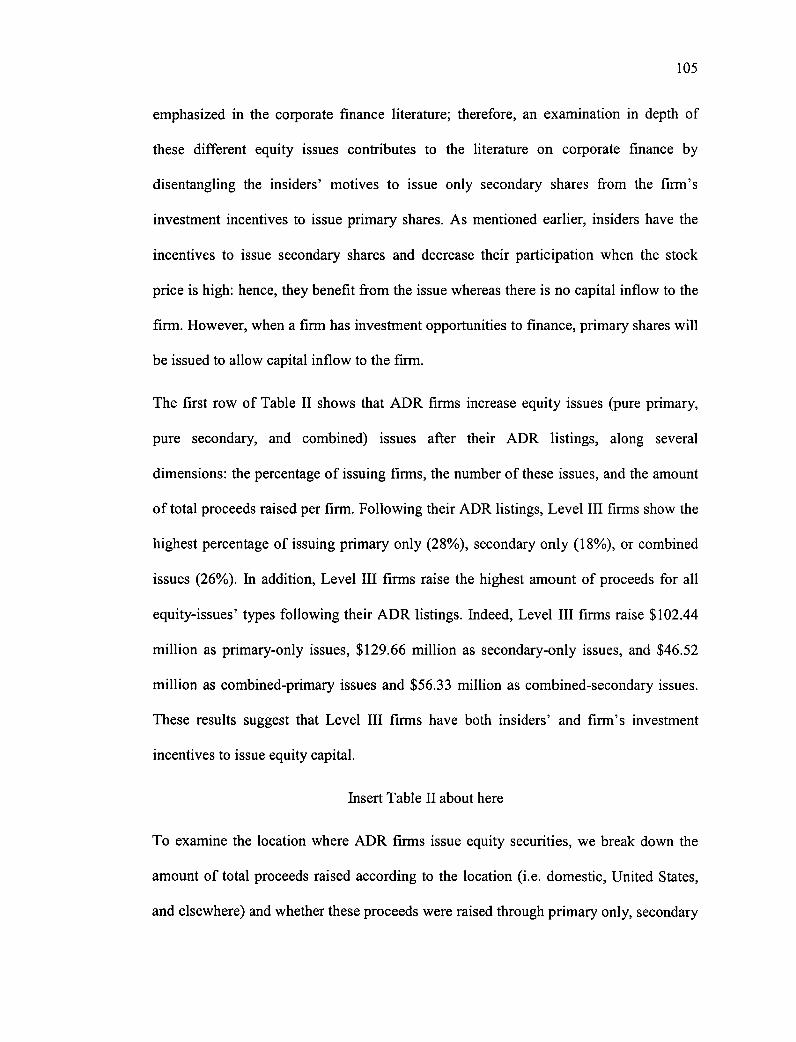
105
emphasized in the corporate finance literature; therefore, an examination in depth of
these different equity issues contributes to the literature on corporate finance by
disentangling the insiders' motives to issue only secondary shares from the firm's
investment incentives to issue primary shares. As mentioned earlier, insiders have the
incentives to issue secondary shares and decrease their participation when the stock
price is high: hence, they benefit from the issue whereas there is no capital inflow to the
firm. However, when a firm has investment opportunities to finance, primary shares will
be issued to allow capital inflow to the firm.
The first row of Table II shows that ADR firms increase equity issues (pure primary,
pure secondary, and combined) issues after their ADR listings, along several
dimensions: the percentage of issuing firms, the number of these issues, and the amount
of total proceeds raised per firm. Following their ADR listings, Level III firms show the
highest percentage of issuing primary only (28%), secondary only (18%), or combined
issues (26%). In addition, Level III firms raise the highest amount of proceeds for ahl
equity-issues' types following their ADR listings. Indeed, Level III firms raise $102.44
million as primary-only issues, $129.66 million as secondary-only issues, and $46.52
million as combined-primary issues and $56.33 million as combined-secondary issues.
These results suggest that Level III firms have both insiders' and firm' s investment
incentives to issue equity capital.
Insert Table II about here
To examine the location where ADR firms issue equity securities, we break down the
amount of total proceeds raised according to the location (i.e. domestic, United States,
and elsewhere) and whether these proceeds were raised through primary only, secondary
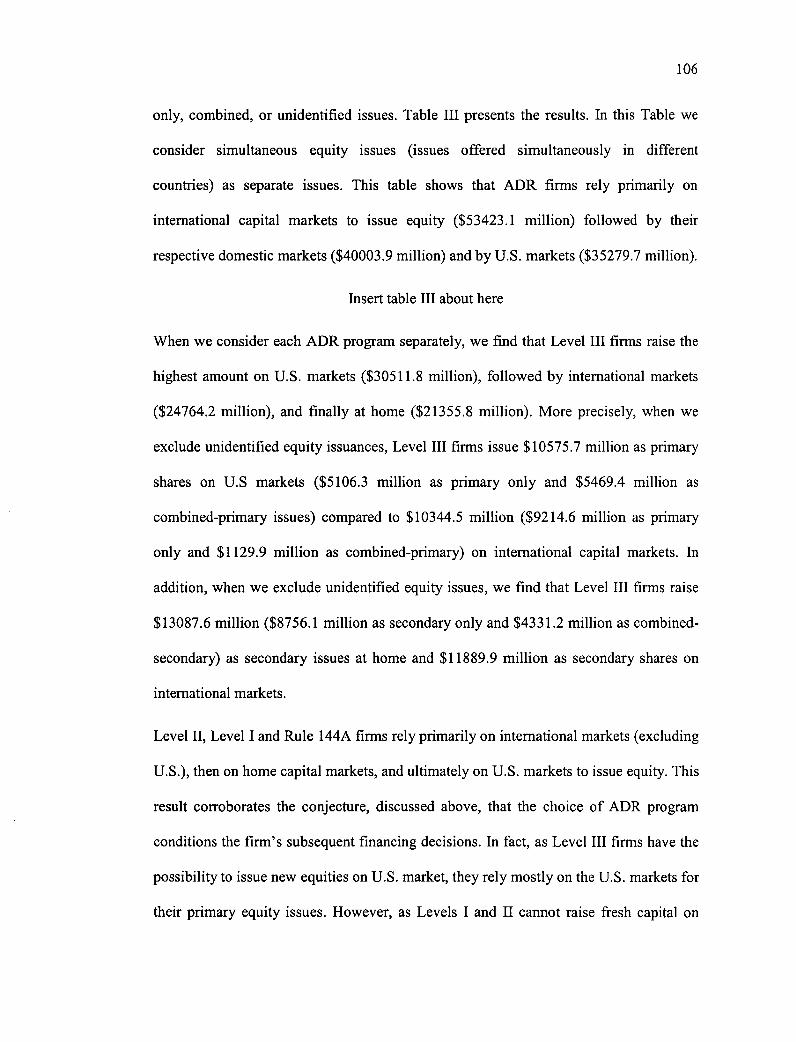
106
only, combined, or unidentified issues. Table III presents the results. In this Table we
consider simultaneous equity issues (issues offered simultaneously in different
countries) as separate issues. This table shows that ADR firms rely primarily on
international capital markets to issue equity ($53423.1 million) followed by their
respective domestic markets ($40003.9 million) and by U.S. markets ($35279.7 million).
Insert table III about here
When we consider each ADR program separately, we find that Level III firms raise the
highest amount on U.S. markets ($30511.8 million), followed by international markets
($24764.2 million), and finally at home ($21355.8 million). More precisely, when we
exclude unidentified equity issuances, Level III firms issue $10575.7 million as primary
shares on U.S markets ($5106.3 million as primary only and $5469.4 million as
combined-primary issues) compared to $10344.5 million ($9214.6 million as primary
only and $1129.9 million as combined-primary) on international capital markets. In
addition, when we exclude unidentified equity issues, we find that Level III firms raise
$13087.6 million ($8756.1 million as secondary only and $4331.2 million as combined-
secondary) as secondary issues at home and $11889.9 million as secondary shares on
international markets.
Level II, Level I and Rule 144A firms rely primarily on international markets (excluding
U.S.), then on home capital markets, and ultimately on U.S. markets to issue equity. This
result corroborates the conjecture, discussed above, that the choice of ADR program
conditions the firm' s subsequent financing decisions. In fact, as Level III firms have the
possibility to issue new equities on U.S. market, they rely mostly on the U.S. markets for
their primary equity issues. However, as Levels I and II cannot raise fresh capital on
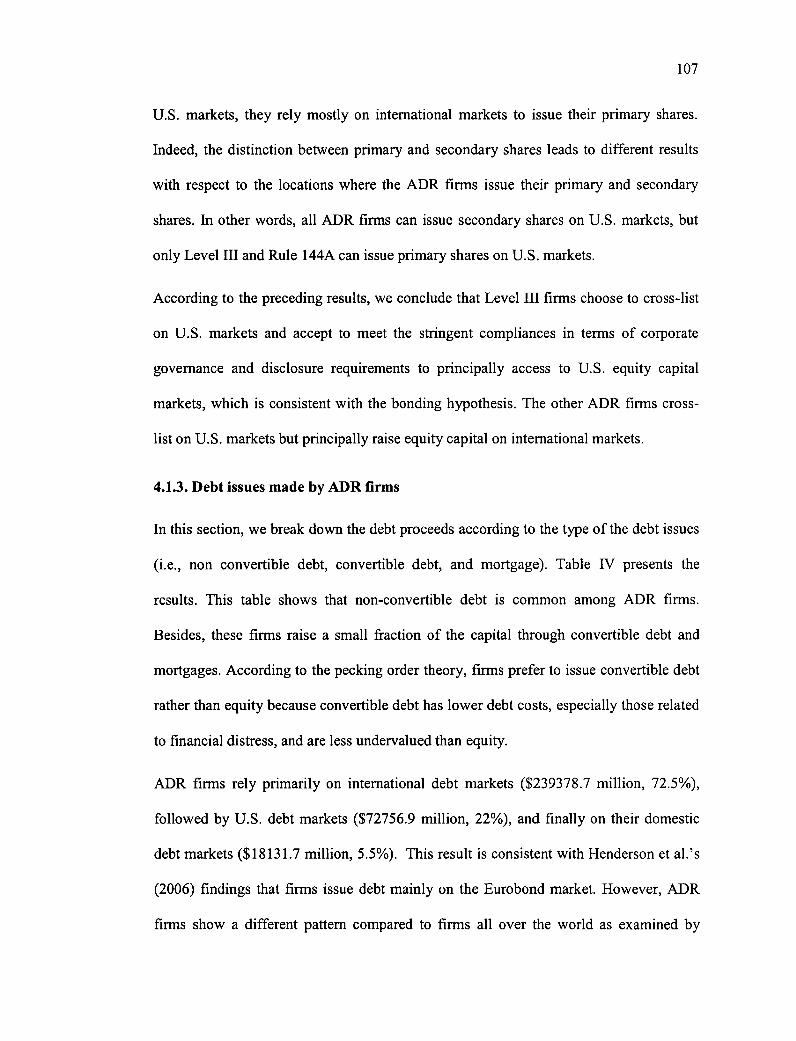
107
U.S. markets, they rely mostly on international markets to issue their primary shares.
Indeed, the distinction between primary and secondary shares leads to different results
with respect to the locations where the ADR firms issue their primary and secondary
shares. In other words, ah l ADR firms can issue secondary shares on U.S. markets, but
only Level III and Rule 144A can issue primary shares on U.S. markets.
According to the preceding results, we conclude that Level III firms choose to cross-list
on U.S. markets and accept to meet the stringent compliances in terms of corporate
governance and disclosure requirements to principally access to U.S. equity capital
markets, which is consistent with the bonding hypothesis. The other ADR firms cross-
list on U.S. markets but principally raise equity capital on international markets.
4.1.3. Debt issues made by ADR firms
In this section, we break down the debt proceeds according to the type of the debt issues
(i.e., non convertible debt, convertible debt, and mortgage). Table IV presents the
results. This table shows that non-convertible debt is common among ADR firms.
Besides, these firms raise a small fraction of the capital through convertible debt and
mortgages. According to the pecking order theory, firms prefer to issue convertible debt
rather than equity because convertible debt has lower debt costs, especially those related
to financial distress, and are less undervalued than equity.
ADR firms rely primarily on international debt markets ($239378.7 million, 72.5%),
followed by U.S. debt markets ($72756.9 million, 22%), and finally on their domestic
debt markets ($18131.7 million, 5.5%). This result is consistent with Henderson et al.' s
(2006) findings that firms issue debt mainly on the Eurobond market. However, ADR
firms show a different pattern compared to firms all over the world as examined by
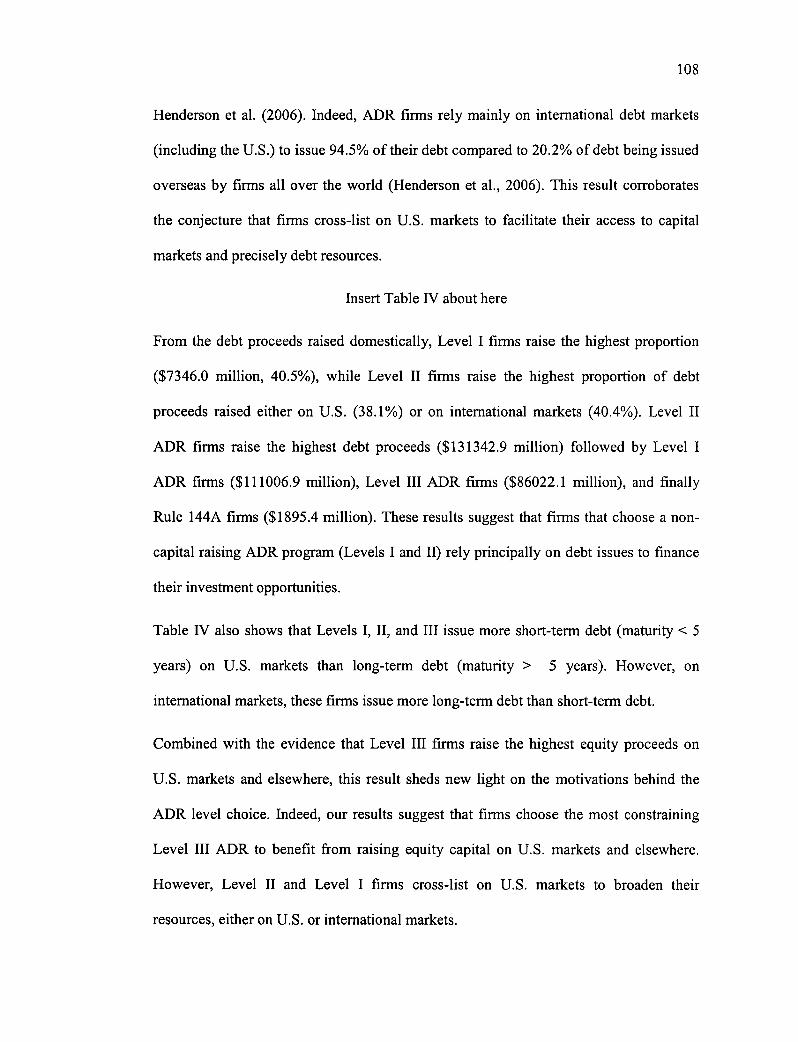
108
Henderson et al. (2006). Indeed, ADR firms rely mainly on international debt markets
(including the U.S.) to issue 94.5% of their debt compared to 20.2% of debt being issued
overseas by firms ail over the world (Henderson et al., 2006). This result corroborates
the conjecture that firms cross-list on U.S. markets to facilitate their access to capital
markets and precisely debt resources.
Insert Table IV about here
From the debt proceeds raised domestically, Level I firms raise the highest proportion
($7346.0 million, 40.5%), while Level II firms raise the highest proportion of debt
proceeds raised either on U. S. (38.1%) or on international markets (40.4%). Level II
ADR firms raise the highest debt proceeds ($131342.9 million) followed by Level I
ADR firms ($111006.9 million), Level III ADR firms ($86022.1 million), and finally
Rule 144A firms ($1895.4 million). These results suggest that firms that choose a non-
capital raising ADR program (Levels I and II) rely principally on debt issues to finance
their investment opportunities.
Table IV also shows that Levels I, II, and III issue more short-term debt (maturity < 5
years) on U.S. markets than long-term debt (maturity > 5 years). However, on
international markets, these firms issue more long-term debt than short-term debt.
Combined with the evidence that Level III firms raise the highest equity proceeds on
U.S. markets and elsewhere, this result sheds new light on the motivations behind the
ADR level choice. Indeed, our results suggest that firms choose the most constraining
Level III ADR to benefit from raising equity capital on U.S. markets and elsewhere.
However, Level II and Level I firms cross-list on U.S. markets to broaden their
resources, either on U.S. or international markets.
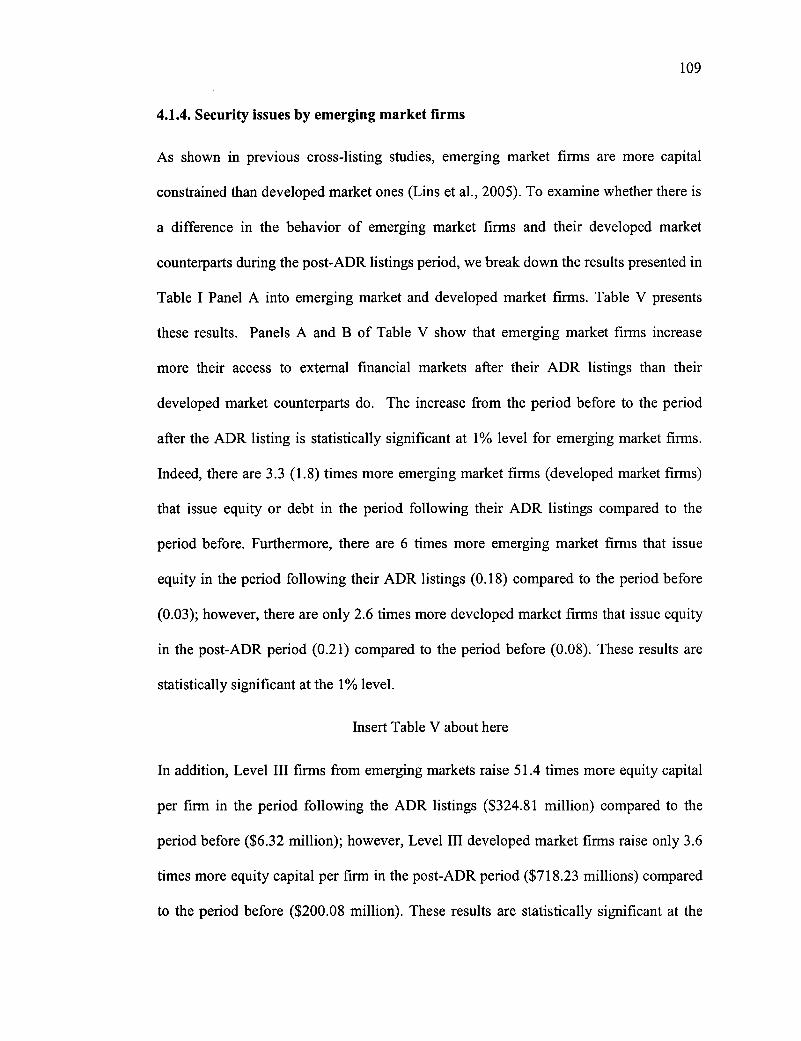
109
4.1.4. Security issues by emerging market firms
As shown in previous cross-listing studies, emerging market firms are more capital
constrained than developed market ones (Lins et al., 2005). To examine whether there is
a difference in the behavior of emerging market firms and their developed market
counterparts during the post-ADR listings period, we break down the results presented in
Table I Panel A into emerging market and developed market firms. Table V presents
these results. Panels A and B of Table V show that emerging market firms increase
more their access to externat financial markets after their ADR listings than their
developed market counterparts do. The increase from the period before to the period
after the ADR listing is statistically significant at 1% levet for emerging market firms.
Indeed, there are 3.3 (1.8) times more emerging market firms (developed market firms)
that issue equity or debt in the period following their ADR listings compared to the
period before. Furthermore, there are 6 times more emerging market firms that issue
equity in the period following their ADR listings (0.18) compared to the period before
(0.03); however, there are only 2.6 times more developed market firms that issue equity
in the post-ADR period (0.21) compared to the period before (0.08). These results are
statistically significant at the 1% levet.
Insert Table V about here
In addition, Level III firms from emerging markets raise 51.4 times more equity capital
per firm in the period following the ADR listings ($324.81 million) compared to the
period before ($6.32 million); however, Level III developed market firms raise only 3.6
times more equity capital per firm in the post-ADR period ($718.23 millions) compared
to the period before ($200.08 million). These results are statistically significant at the
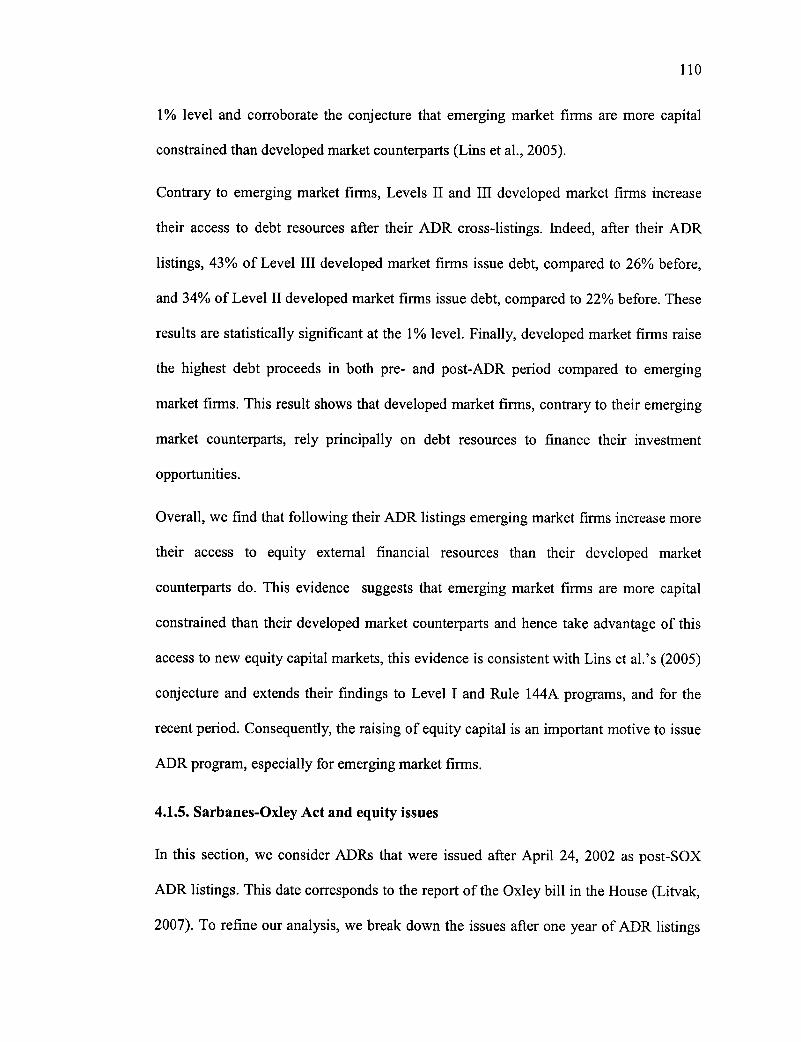
110
1% level and corroborate the conjecture that emerging market firms are more capital
constrained than developed market counterparts (Lins et al., 2005).
Contrary to emerging market firms, Levels II and III developed market firms increase
their access to debt resources after their ADR cross-listings. Indeed, after their ADR
listings, 43% of Level III developed market firms issue debt, compared to 26% before,
and 34% of Level II developed market firms issue debt, compared to 22% before. These
results are statistically significant at the 1% level. Finally, developed market firrns raise
the highest debt proceeds in both pre- and post-ADR period compared to emerging
market firms. This result shows that developed market firms, contrary to their emerging
market counterparts, rely principally on debt resources to finance their investment
opportuniti es.
Overall, we find that following their ADR listings emerging market firms increase more
their access to equity extemal financial resources than their developed market
counterparts do. This evidence suggests that emerging market firms are more capital
constrained than their developed market counterparts and hence take advantage of this
access to new equity capital markets, this evidence is consistent with Lins et al.' s (2005)
conjecture and extends their findings to Level I and Rule 144A programs, and for the
recent period. Consequently, the raising of equity capital is an important motive to issue
ADR program, especially for emerging market firms.
4.1.5. Sarbanes-Oxley Act and equity issues
In this section, we consider ADRs that were issued after April 24, 2002 as post-SOX
ADR listings. This date corresponds to the report of the Oxley bill in the House (Litvak,
2007). To refine our analysis, we break down the issues after one year of ADR listings
111
into pre- and post-SOX issues, and into emerging market and developed market firrns.
Table VI presents these results. This Table shows that the percentage of emerging
market firms issuing equity is higher in the post-SOX period for Level III (72%) and
Rule 144A (13%) compared to the period pre-SOX (57% and 3%, respectively). These
results are statistically significant at the 10% and 5% levels, respectively. However,
Level III and Rule 144A developed market firms show no statistically significant
difference in the percentage of firms issuing equity between these two periods. In
contrast, we report that emerging market firms choosing one of the capital-raising ADR
programs (Rule 144A and Level III) increase their equity issues after SOX compared to
the period before.
Insert Table VI about here
Contrary to Rule 144A developed market firms, Rule 144A emerging market firms
increase their debt issue in the post-SOX period compared to the pre-SOX one.
Moreover, Table VI shows that Level III emerging market firms decrease their access to
debt markets in the post-SOX period compared to the pre-SOX one.
Overall, we find that after SOX, Level III emerging-market firms increase their access to
capital markets, which is consistent with the more bonding hypothesis after SOX.
Indeed, these firms choose to bond themselves to increase the protection of their
minority shareholders by selecting Level III and also accept the additional costs related
to SOX to facilitate their access to equity capital resources. However, emerging market
firms that choose Rule 144A avoid SOX stringent requirements, but can only raise their
equity capital among QIB.
112
4.2. Multivariate analysis
In what follows, we examine the equity and debt issuing activities following the ADR
listing in a multivariate framework.
4.2.1. Equity issues following ADR listings
In this section, we examine the determinants of the probability of issuing equity during
the one year period following the ADR listings by estimating a Logit model. Finally, we
estimate a right-censored (at 0) Tobit model to find the determinants of the proceeds
raised from issuing equity one year following the ADR listing. Table VII summarizes
the results. In this Table: (1) we consider simultaneous equity issues (i.e. equity issues
that take place in more than one country) as one issue, (2) we do not make a distinction
between primary, secondary, and combined equity issues, (3) we group private and
public equity issues together, and (4) we group equity issues made by a parent or its
subsidiaries together. We further relax these hypotheses and examine these equity issues
separately.
Insert Table VII about here
Table VII shows that being a developed market firm (DE V) increases the probability of
issuing equity by ADR firms over the year following the ADR listing and also increases
the proceeds raised within the same period. This table also shows that coming from a
country where the protection of minority shareholder is high increases the probability of
issuing equity following ADR listing. These results are consistent with Reese and
Weisbach's (2002) evidence and extend their evidence to Level I and Rule 144A ADRs.
Moreover, being a privatized firm (PRIVZ) decreases the probability of issuing equity
113
one year following ADR listing. In addition, when we control for the home market
equity activity, we find that the higher the equity issues made in the home country of the
ADR firm (EQSUM), the higher the probability that the ADR firm issues new equity.
However, the higher the debt issues made in the home country of the ADR firm
(DBSUM), the higher the probability that the ADR firm issues new equity. The equity
issues made in the home country of the ADR firm (EQSUM) and the debt issues made in
the home country of the ADR firm (DBSUM) control for the number of new equity and
debt issues in the firm' s home country within the period of one year following the ADR
listings. According to the trade-off theory, firms will target an optimal capital structure
and hence if a firm issues debt during the year preceding its ADR listing, it will issue
equity following its ADR listing to maintain an optimal capital structure.
Compared to Level I ADR firms, Rule 144A and Levels II and III firms increase the
likelihood to issue equity over the year following their ADR listing, which is statistically
significant. Finally, this Table shows that being a large firm (SIZE) decreases the
probability of issuing equity within one year after ADR listing. This result is statistically
significant at the 1% level and is consistent with the fact that large firms have the
possibility to rely on other sources of capital beside the equity resources with a relatively
lower cost.
When we estimate the total proceeds using a Tobit model, we find that being a
developed market firm increases the proceeds raised over the year following an ADR
listing. Moreover, we find that the total debt proceeds raised by ADR firms within one
year before its ADR listing (PREPRCDB) are positively related to the equity proceeds
raised within one year following the ADR listing. This result is consistent with the
114
pecking order theory that suggests that firms exhaust their capacity to raise debt first and
then issue equity last following their ADR listing. In addition, levels II and III firms
raise more proceeds from their equity issues than Level I firm following one year of
their ADR listing. This evidence is consistent with the bonding hypothesis that firms
bond themselves to comply with U.S. stringent corporate governance and disclosure
requirements to facilitate their access to capital markets.
Given that firms have the choice between primary, secondary, and combined issues; it
would be interesting to examine the drivers of such choice as this choice is flot
emphasized in corporate finance literature (Kim and Weisbach, 2006). As discussed
previously, primary shares issues provide firms with financial resources which could be
used to finance their investment opportunities, whereas secondary shares issues consist
in selling shares, held by existing shareholders, therefore no fresh capital will flow to
the ADR firms. Consequently, if the ADR firm wants to raise fresh capital to finance its
investment opportunities, it can use either primary or combined issues. However, if the
ADR firm rather wants to favor its existing shareholders, it issues only secondary shares.
Table VIII examines the percentage of primary shares offered in new issues made by
ADR firms by estimating right- and lefl- censored Tobit model (at 0 and 100) (Panel B),
respectively. These equity issues are made within the one-year period following the
ADR listing. In this Table: (1) we consider simultaneous issues (i.e. issues that take
place in more than one country) as one issue, (2) we group private and public issues
together, and (3) we group issues made by a parent or its subsidiaries together.
Insert Table VIII about here
115
The results of Table VIII suggest that being an emerging market firm increases the
percentage of primary shares in new equity issues made within one year after ADR
listings. This result is consistent with Lins et al.'s (2005) findings. Indeed emerging
market firms are more capital constrained than developed market ones and need fresh
capital to finance their investment opportunities, which can be reached mainly by issuing
primary shares. Moreover, this Panel shows that being highly leveraged firm (LEV)
increases the percentage of primary shares in new equity issues made by ADR firms.
This result is plausible since highly leveraged ADR firms would intend to decrease their
leverage ratio by increasing their equity capital, and therefore their total assets, through
primary share issuances.
4.2.2. SOX and publie equity issues on U.S. markets
As discussed previously, Level II and Level III ADR firms have to comply with SOX
requirements, whereas Level I and Rule 144 A are exempt from these requirements. As
Level III ADR programs allow foreign firms to raise capital on U.S. markets, we focus
on the impact of SOX on their subsequent equity issues on U.S. markets. By doing so,
we contribute to the ongoing literature that examines the attractiveness of the U.S.
markets following SOX. In fact some studies (e.g., Zingales, 2006) suggests that
following SOX U.S. markets have lost their competitiveness compared to other markets,
such as the U.K. market.
Table IX reports the estimation results of two Logit models: (1) the probability of
issuing public equity by Level III ADR firm on U.S. markets within one year after its
ADR listing (unconditional Logit estimation), and (2) the probability of issuing public
equity by Level III ADR firm on U.S. markets within one year after its ADR listing

116
conditionally that this firm issues equity within the same period (conditional Logit
estimation). In the first model, the dependent variable is equal to 1 if ADR firm issues
equity on U.S. markets and 0 if the ADR firm does flot issue equity on U.S. markets or
issues equity outside the U.S. markets. However, in the second model (conditional
model) the dependent variable is equal to 1 if the ADR firm issues equity on U.S.
markets and 0 if the ADR firm issues equity elsewhere. Consequently, the second model
allows us to compare the choice of the U.S. markets to the others markets as a venue for
equity issues.
Insert Table IX about here
In Table IX, we examine the impact of SOX on the public equity issues by Level III
ADR firms on U.S. markets. In fact, this Table shows that after SOX, Level III ADR
firms increase their public equity issues on U.S. markets. This result is consistent with
the hypothesis of more bonding and enhanced bonding benefits on U.S. markets after
SOX. Indeed, firms that issue Level III ADR after SOX have to comply with all SOX
new stringent requirements and therefore increase their protection of their minority
shareholders, which in turn facilitates their access to U.S. capital markets. In a nutshell,
our results suggest that firms issuing Level III ADRs after SOX offer a higher protection
to their minority shareholders and then more access to U.S. capital resources compared
to firms issuing Level III ADR before SOX.
4.2.3. Debt issues following ADR listings
In this section, using logit models, we examine the determinants of the probability of
issuing debt within one year period following the ADR listings. We then examine the
determinants of the proceeds raised from issuing debt one year following the ADR
117
listing using a right-censored (at 0) Tobit model. Table X presents the estimation results.
In this Table: (1) we consider simultaneous debt issues (i.e. debt issues that take place in
more than one country) as one issue, (2) we group private and public debt issues
together, and (3) we group debt issues made by a parent or its subsidiaries together.
Insert Table X about here
Compared to Level I ADR firms, listed ADR firms (levels II and III) are more likely to
issue debt and raise higher proceeds from issuing debt within the period of one year
following the ADR listing. Combined with the equity issues results discussed above, this
latter result shows that Levels II and III firms rely on both equity and debt resources to
raise capital.
Table X shows that being a developed market firm (DE V) increases the probability of
issuing debt within the period of one year following the ADR listing and increases the
proceeds raised from issuing debt within the same period.
Firms coming from countries where the protection of minority shareholders is weak
(SELFDEAL) raise a higher amount of debt than those coming from countries that offer
a higher protection to minority shareholders. This result is statistically significant and
suggests that finns from countries where the investors' protection is weak are more
likely to issue the less information-sensitive source of capital, i.e. debt, compared to
their counterparts from countries where the protection of investors is high.
Table X also shows that larger firms (SIZE) are more likely to issue debt, and raise
higher proceeds following their ADR listings. This result suggests that large firms have
the possibility to raise debt funds with a relatively lower cost and is consistent with
118
equity multivariate results that show that large firrns are less likely to issue equity.
Moreover, the higher the ultimate control rights and the difference between the ultimate
control and cash flow rights are, the less likely that this firm issues debt following its
ADR listing.
In Table XI we examine the debt issues' locations (on domestic market, on U.S.
markets, or elsewhere) by estimating a multinomial logit model. In this Table, we
perform the Hausmann test to assess the independence across the different choices and
we find that we cannot reject the null hypothesis that the different choices are
independent. This Table shows that firms coming from countries where the protection of
minority shareholders is weak are more likely to issue debt on their home markets.
However, firms coming from countries where the protection of minority shareholders is
high are more likely to issue debt on international markets (excluding U.S. markets).
This result suggests that firms from countries where the investors' protection is weak are
more likely to issue the less information-sensitive source of capital, i.e. debt on their
local markets and firms from countries where the protection of investors is high choose
international markets to issue their debt
Compared to Level I ADR firrns, Levels II and III firms are less likely to issue debt at
home and more likely to issue debt on international markets (excluding U.S. markets).
This result is consistent with Henderson et al.'s (2006) findings that firms issue debt
mainly on the Eurobond market. Indeed, these results suggest that Levels II and III firms
cross-list to gain the facility to access to debt international markets. However, Rule
144A ADR firms are less likely to issue debt on U.S. markets compared to Level I ADR
firms. Overall, these results suggest that levels II and III ADR firms cross-list to
119
diversify their debt resources, to decrease their dependence on their home debt market,
and consequently facilitate their access to international debt markets.
Insert Table XI about here
4.2.4 Debt and equity issues following ADR listings
As the decisions to issue equity or debt are dependent, we examine, in the following
section, these two decisions simultaneously. To check whether ADR firms change their
sources of capital between the period before and after ADR listings, we use a ratio
which is equal to debt proceeds divided by the total of debt and equity proceeds one year
before and after the ADR listing. For equity issues, we consider only primary shares
(including primary shares in the combined issues) as the ADR firm can raise fresh
capital through these issues. Table XII summarizes the results. Interestingly, Panel A,
Table XII shows that the post-listing proportion of debt proceeds in relation to the total
of debt and equity proceeds decreased for an ADRs. Indeed, this ratio decreases from
0.787 during the pre-ADR period to 0.286 during the post-ADR period. These results
suggest that ADR firms rely more on primary-equity capital than on debt resources to
raise fresh capital and therefore to finance their investments' opportunities during the
period following their listings. This result is consistent with Lins et al.'s (2005) evidence
that ADR firms cross-list to "relax" their capital constraints and extends their findings to
Level I and Rule 144A ADRs and to the recent period. To the best of our knowledge, we
are not aware of any other study that examines this issue.
Insert Table XII about here
120
To explore the determinants of the ratio of the debt proceeds divided by the total of debt
and primary-equity proceeds, we estimate a right- and left-censored Tobit model at 0
and 100, respectively. The results are summarized in Table XII Panel B. This Panel
shows that being a developed market firm (DE V) increases the ratio during the period
following the ADR listing. This latter result is again consistent with Lins et al.' s (2005)
evidence that emerging market firms are more capital constrained then developed market
ones and extends their findings to all ADR programs and to the recent period.
Moreover, these multivariate results corroborate the univariate results in Lins et al.
(2005) for Levels II and III ADRs. This panel also shows that ADR firms coming from
countries where the protection of minority shareholders is weak (SELFDEAL) decreases
their ratio of debt proceeds following their ADR listings, which is consistent with the
bonding hypothesis. Indeed, foreign firms cross-list on U.S. markets to improve the
protection of their minority shareholders and subsequently facilitate their access to
capital resources, especially equity resources. Moreover, Levels II and III ADR firms
decrease their ratio following their ADR listing. This result suggests that listed firms
(levels II and III) choose the most constraining ADR programs that offer a higher
protection to their minority shareholders and rely principally on primary equity issues to
finance their investrnent opportunities. Finally, large firms (SIZE) tend to increase their
ratio following their ADR listing. This result is consistent with what we have found
above i.e., that large firms are more likely to issue debt as these firms have the
possibility to raise debt funds with a relatively lower cost.
Overall, by disentangling primary and secondary equity issues we were able to examine
the financing resources of ADR firms following their ADR listings. Indeed, we find that
121
ADR firrns rely more on primary equity issues than on debt issues to finance their
investment opportunities following their ADR listing, a result that is consistent with the
conjecture that firms cross-list to facilitate their access to capital markets. Moreover, we
find that emerging market firms, contrary to their developed market counterparts, rely
more on equity resources than on debt resources to gain capital inflows that finance their
growth opportunities.
5. Sensitivity tests
ADR firms can issue their debt or equity securities either on private or public markets.
To examine in depth these issues on these two markets, we break down Table III and
Table IV into private and public issues made by ADR firms within one year following
their ADR listing. The results are presented in Appendices 3 and 4. These two
appendices show that ADR firms rely mainly on public market to issue equity and debt
and access the private equity and debt markets seldom. This result is consistent with the
conjecture that ADR firms cross-list to facilitate their access to capital markets,
especially public ones. Moreover, Appendix 3 shows that ADR firms raise a proportion
of their equity through their subsidiaries. Indeed, ADR firms issue equity through direct
sales and ADRs (78.3%), and through their subsidiaries (21.7%). Consequently,
multinationals firms have a higher financial flexibility since they can finance the parent
and subsidiaries in different ways, and consequently choose their desired capital
structures. This result is consistent with Nanda's (1991) model that funds raised by a
parent can be utilized by the subsidiary and vice versa, which enhances the financing
flexibility of both structures (parent and subsidiary).
122
In Table VII, we have presented the probability of issuing equity following ADR
listings. In these tests we do flot make a distinction between primary and secondary
shares. One can ask the following question: do these results hold if we break-down the
equity issues in primary and secondary shares? In other words, do secondary and
primary equity issues have the same determinants? To answer this question, we estimate
logit models for secondary and primary issues separately. Unreported results show that
firms from developed markets (DE V) are more likely to issue secondary-shares than
firms from emerging markets. We also find that being a listed ADR firm (Levels II and
III) increases both the probability to issue primary and secondary shares at home and on
international markets (U. S. and elsewhere). This latter result is consistent with the fact
that foreign firms cross-list to facilitate their access to capital markets, especially for
those that commit themselves to improve the protection of their minority shareholders
by cross-listing on the major U.S. stock exchanges.
6. Conclusion
In this paper, we study the link between the ADR-listed firms' attributes and their
subsequent security-market choices by addressing some questions that remain
unanswered: (1) what are the determinants of issuing equity and debt after ADR listings?
(2) Where do ADR firms issue their securities? And (3) what are the determinants of
primary and secondary equity issues?
The four ADR programs (Rule 144A, Level I, Level II, and Level III) mandate different
compliances and offer firms different benefits. For instance, Rule 144A and Level III
allow foreign firms to raise equity capital on U.S. markets; however, Level I and Rule
123
144A do flot. Moreover, Levels II and III obligate ADR firms to meet high compliances
in terms of disclosure and corporate governance, especially following the enactment of
SOX. Consequently, we also examine whether SOX has an impact on the financing
decisions of ADR firms.
Our empirical evidence shows that following ADR listings, foreign firms increase their
equity and debt issues, especially during the year following the ADR issuance for the
four ADR programs. Moreover, emerging market firms show the highest increase in
their equity and debt issuances after ADR listings compared to their developed market
counterparts.
The equity multivariate analyses show that developed market firms, compared to their
emerging market counterparts, increase both their equity issues during the year
following their ADR listing and the total amount of the proceeds raised within the same
period. Moreover, compared to developed market firms, emerging market firms increase
the percentage of piimary shares in their new equity issues made within one year after
ADR listings. However, compared to emerging market firms, debt results show that
being a developed market firm increases the probability of issuing debt within the period
of one year following the ADR listing and increases the proceeds raised from issuing
debt within the same period. Compared to Level I ADR firms, Levels II and III firms are
less likely to issue debt at home and more likely to issue debt on international markets.
We also find that large firms are more likely to issue debt and less likely to issue equity.
Following SOX, we find that the percentage of firms issuing equity is higher for Level
III and Rule 144A emerging market firms compared to the period pre-SOX, while
developed market counterparts do not show this trend. Moreover, we find that after
124
SOX, Level III ADR firms increase their public equity issues on U.S. markets. This
result is consistent with the hypothesis of more bonding and the enhanced benefits on
U.S. markets after SOX.
When we examine the ratio between debt proceeds to the total of debt and primary-
equity proceeds during the period following the ADR listings, we find that ail ADR
firms decrease their ratio following ADR listings. Indeed, ADR firms rely more on
primary-equity resources than on debt following their listings especially for emerging
market firms.
Overall, we find that international ADR listings effectively improve the firm's access to
capital markets, either through debt or equity issues, which is again an evidence of the
raising capital motive of cross-listing abroad. Further, we find that the choice of a
specific ADR program effectively conditions the firm's future financing decisions as we
find different behaviors among the four ADR programs. This result is important in the
sense that managers who intend to cross-list their foreign firms on U.S. markets via
ADRs should choose the ADR level that allows them to meet their future financing
needs. Finally, we find that following SOX, cross-listings on U.S. markets still have
benefits that are larger than the compliances' costs, especially for emerging market firms
and firms coming from countries where the protection of minority shareholders is weak.
125
References Benos, E., and Weisbach, M., 2004, Private benefits and cross-listings in the United States, Emerging Markets Review 5, 217-240. Coffee, J., 1999, The future as history: the prospects for global convergence in corporate governance and its implication, Northwestern Law Review 93, 641-707.
Coffee, J., 2002, Racing toward the top?: The impact of cross-listings and stock market competition on international corporate governance, Columbia Law Review 93, 1757- 1831. Denis, D.J., Mihov, V.T., 2003, The choice among bank debt, non-bank private debt, and public debt: evidence from new corporate borrowings, Journal of Financial Economics 70, 3-28. Djankov, S., La Porta, R., Lopez-de-Silanes, F., and Shleifer, A., 2008, The law and economics of self-dealing, Journal of Financial Economics 88, 430-465
Doidge, C., Karolyi, G. A., and Stulz, R. M., 2007, Has New York become less competitive in global markets? Evaluating foreign listing choices over time, Journal of Financial Economics, forthcoming. Errunza, V., and Miller, D., 2000, Market segmentation and the cost of the capital in international equity markets, Journal of Financial and Quantitative Analysis 35, 577- 600. Foerster, S., and Karolyi, A., 1999, The effects of market segmentation and investor recognition on assets prices: evidence from foreign stocks listing in the United States, Journal of Finance 54, 981-1013. Gomes, A., Phillips, G., 2007, Why do public firms issue private and public securities, Washington University working paper.
Graham, J.R., Harvey, C.R., 2001, The theory and practice of corporate finance: evidence from the field 60, 187-243. Hail, L., and Leuz, C., 2005, Cost of capital and cash flow effects of U.S. cross-listings, University of Pennsylvania working paper. Henderson, B. J., Jegadeesh, N, and Weisbach, M., 2006, World market for raising new capital, Journal of Financial Economics 82, 63-101.
Hertzel, M., Smith, R.L., 1993, Market discounts and shareholder gain for placing equity privately, Journal of Finance 48, 459-485.
Karolyi, G. A., 2006, The world of cross-listings and cross-listings of the world: challenging conventional wisdom, Review of Finance 10, 1-54.
Kim, W., and Weisbach, M., 2008, Motivations for public equity offers: An international perspective, Journal of Financial Economics 87, 281-307.
Lins, K., Strickland, D., and Zenner, M., 2005, Do non-U.S. films issue equity on U.S. exchanges to relax capital constraints?, Journal of Financial and Quantitative Analysis 40, 109-133.
126
Litvak, K., 2007, The effect of the Sarbanes-Oxley Act on non-US companies cross-listed in the US, Journal of Corporate Finance 13, 195-228.
Miller, D., 1999, The market reaction to international cross-listing: Evidence from depositary receipts, Journal of Financial Economics 51, 103-123.
Miller, M.H., 1977, Debt and taxes, Journal of Finance 32, 261-275.
Modigliani, F., Miller, M.H., 1963, Corporate income taxes and the cost of capital: a correction, American Economic Review 53, 433-443.
Myers, S.C., 1984, The capital structure puzzle, Journal of Finance 39, 575-592.
Myers, S.C., Majluf, N., 1984, Corporate financing and investment decisions when firms have information that investors do not have, Journal of Financial Economics 13, 187- 224.
Nanda, V., 1991, On the good news in equity carve-out, Journal of Finance 46, 1717- 1737.
Reese, W., and Weisbach, M., 2002, Protection of minority shareholder interests, cross-listings me the United States, and subsequent equity offerings, Journal of Financial Economics 66, 65-104.
Sarkissian, S., and Schill, M. 2007, Are there permanent valuation gains to overseas listing? Evidence from market sequencing and selection, Review of Financial Studies, forthcoming.
Siegel, J., 2005, Can foreign firms bond themselves effectively by submitting to U.S. law?, Journal of Financial Economics 75, 319-360.
Stein, J.C., 1992, Convertible bonds as backdoor equity financing, Journal of Financial Economics 32, 3-21.
Stulz, R., 1999, Globalization of equity markets and the cost of capital, Journal of Applied Corporate Finance 12, 8-25.
Wu, Y., 2004, The choice of equity-selling mechanisms, Journal of Financial Economics 74, 93-119.
Zingales, L., 2006, Is the U.S. capital market losing its competitive edge?, Journal of Economic Perspectives, forthcoming.
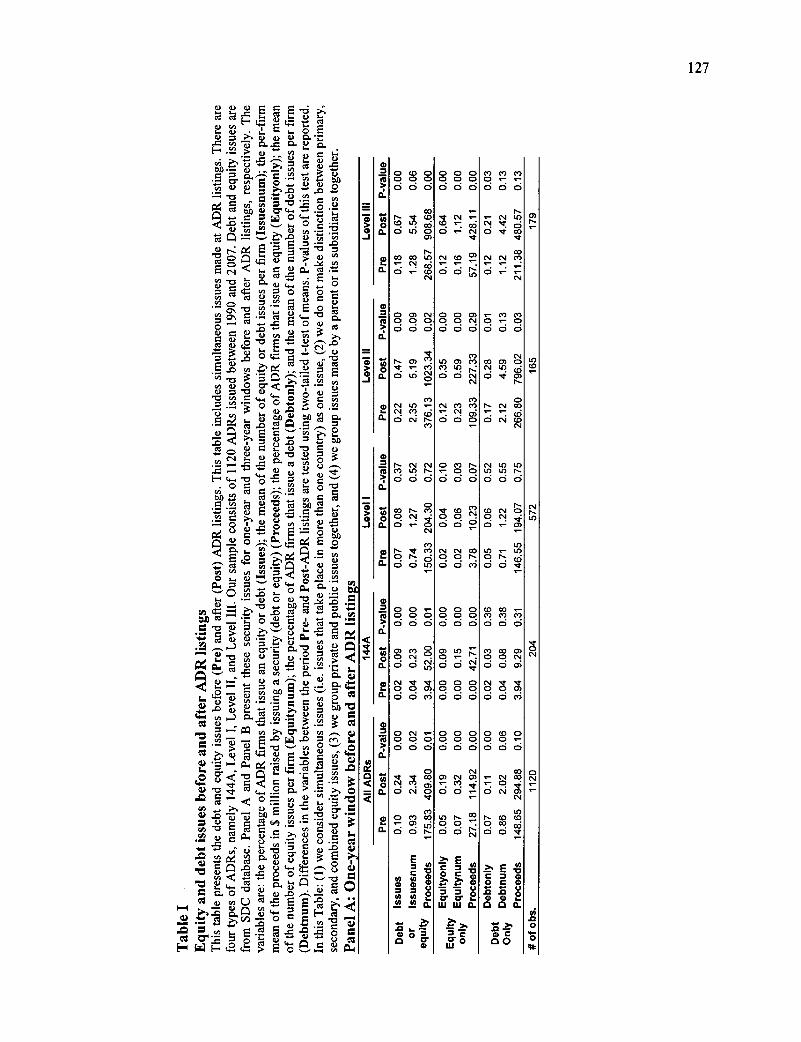
r-
CO
r-
r- N Nt Ln r- cs d d
= r- co cl • O a
0 0 .- o 0 0 d ci d
O Cc) 0 0 N O it̀)1
c.1 •ct 0 0 o) Q d ri
0 (NI 0 0 0 ci ci d
Q N. o d d d
r) o o cs' d d d
NI NI CO 0 0 N. d d rd
o Q 0 cp 0 ci ci Ci
O 0 0 0 0 CD ci ci d
(si 1.0
CD • r.-) ci ci ci
o 0 N Q d ci cu 'sr nt o o Q d ei
0 CO 0 0 0 7
Q.
Q.
Q.
o Q.
Q.
o.
o Q.
Q.
a.
a.
a.
Q.
o Q.
Q.
Q.
••-•
•••••
CA 0
CV Cl NI) 0; d d o
P, 15 o c 0 0
o o ‘":
o o 2 o en tà,
e' cu 17% 3
• <D CO
OQ0 CO cd,
•,r
0 CO 0 0 0 ci ci d
0 0 0 0 0 0 ci d d
(C) Q ' -
o od
0 CD NI 0 0 0 ci ci d
Q o cc ci d d cc
N) D.■ ‘- 0 d d
N Cr'
d cd ri,
127
o • ,... co .E.o5 . cu D ›, 4) 4) là P.1"-: .= cn 75 tD.. .= 0. e D. E-■ .:2 > 6) ,n - C '`
, dri-> 1") 01) • •-• 1.) .-. e' D = DL, ,'',' C • 4i -tic' eb).0 •,,,.., cr vt E o .,... o o a. . - : .0 ..---- - -0 c •-• 0 .....•0 . E- e g r.; ro ..< -0 ..c.. ro2 •--, 1.. 0 e) ''"' > • ..22.) .- ''"' :c7)., _. 0,
. „...: e oc .1) o et .te
vt -0 ‘A E t; 0 cg cle '5 g o e 4) e 5 ` g • o. ID ,;1 2. -.. - e çn 0., g ..., D. o c,_,e.,.....c ou, 4.) ,...,..., C es CL) 4. _ e ci, e ,5 -0 ..!.. ■-, 45)
os e .,... e ct) ..0 e •5 Q --',.,.0- .- ce) ,-. .-,. •-• a.) a? c -0 u e mi e c 4. ••• > 0 cil D cil • „_•-• D 0 *4-. ." 0
--. ..."‘ › 4-■ ..
0 .0 cl . C.) u> t^ op e c■O R. ,•±)
..0 '.-• "gt 4) p i: 0 "0 e là ..,2 rsi..... 1.) 22 c,..c1) ": . Q-'
g ;-z. •''' ,cz' 0 g _ > _...1 g
•
>,. , a.,' .":, *,,,- o •.= ...1 o
c o
,
-
„ÉQ.5 ,......, g3 e. e .e- , e 0 . Q....,.. " . :6, ...... ,,,... _ , •- -
Ir
-
•••• 6) 0 0 "." ..0 .-0 ••. 4)L
to ce ' .0 0 .81-.el -ce :-.
- 4? = D • c Cf) › ,1-, , p, = ..). ,4 .c L. ci. . . - - ,. . . ... . ..,, • 0 -z. ....: -, z -e- - g 00 6 2,, Te' ig .4) .5 I c ri'J t o ne e .e.
!! ._11 :!; "e:f .:›C !ie- ! •:‘.2 le n - - e -0 w -rà (z2- . cq.e‘vg4-0d,Ê T,g.Q <là ..• 4 0.4 e4 'es te, c e e2, e 41 ;-■ cr. _...,- -.,. Q i- Ir. = u› > 0 0 à -, a = t cl E • -. P.. 4e .I" OC 0 P. › • ... e) 0 ci., CI ...., me :D g-<0=r),.=k1 •
erc `ôo e c :"0 eu "i a) -o a) u e ,,,,. ,n •- cn .0 = U E = ••- ,n c 1.) y.. e -c ,,,elec,e, uoco .5C, g .7„.12, ,,,, .4_, -4-z. „„- d t- -0 Er- 0.) tà c
5• 1
5.,) 0 ‘48 ..Z‘ c â - e , .41- ,-.. -0 , -0 e„ 4. •;Z U el' 0 . ej4) „, oae.EE-g;:t = o. o - o .0 ..---. -
p-i ,„ ..m. itrz t2 c..... Ê = [-■ ta .7D ° 0 .0k = ‘,]$.., E. e g= e.-Ee' e ri te:Emo l-0),:: 1" - `) e E-L4E-.4)..*>j Eoe,b1) a
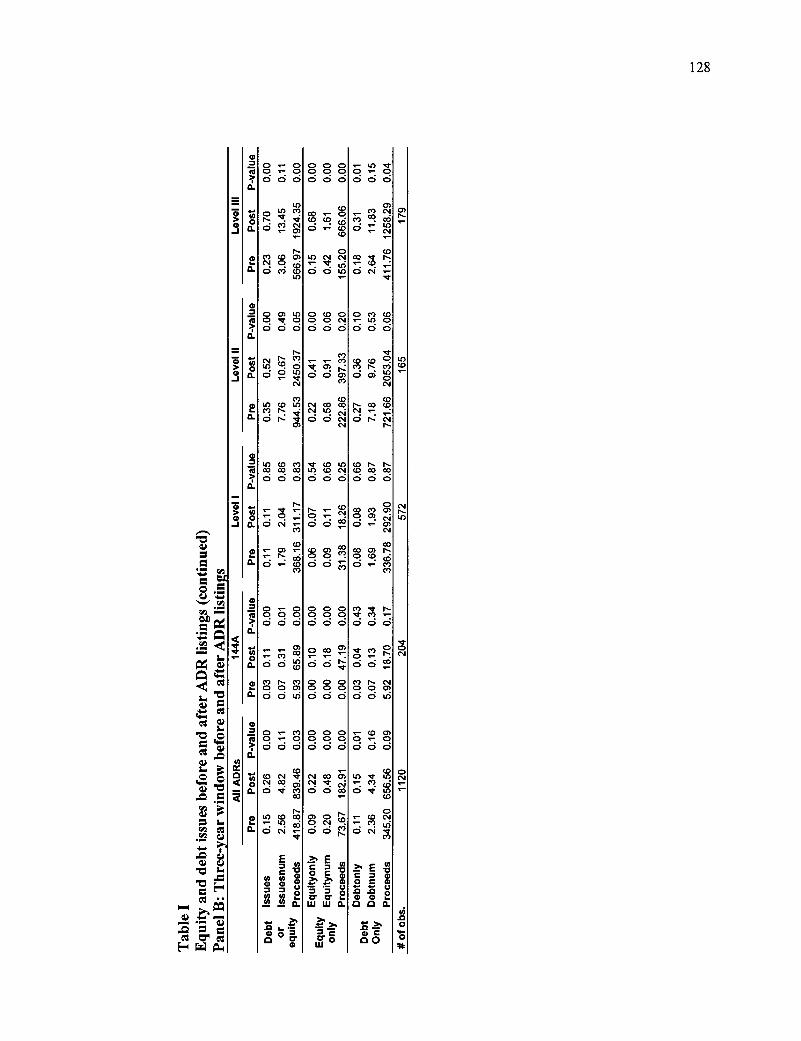
0 Y- 0 0 Y- 0 d d CO
o o o a o d d o
.cr o o d d d
o o o d o d
0 co 0 Cd 0. Cl d o o
0 CO CO ■- In d d d
721
.66 205
3.04
d
CI Cs/ CC! CO
LO Cs.1
(o co cor d oi
e ri d
o O)
C') o d d
N CO (7) •:1•.
d 0 co
LI) CD
d c.
oo ai
0) 0 0 Ol °. d d
to p.
o c 0 0
o Q.
Q.
o Q.
Q.
76
Q.
o a.
Q.
ro
Q.
(0 0 Q.
Q.
76
Q. co rt
.se
o Q.
Q.
O
128
e CO CI CO CO co O d d
le CO LO
d o
r- „,„(0 .- • 1
a ci œ
co œ a o ci ci
CO 1■•• r- co co o d d
r-
0 0 0 ci ci ci
0 0 0 Ci 0 0 d ci ci
"zr ty)
d ci d
0) CO
do <Ci
CO I,- CO 0 0 CS Cid
) tri
o co
d ci
0 0 0 0 0 0 d d Ci
CO N 0 0 0)
CS tri
0 Y- O) 0 •-• 0 d Ci Ci
0 0 0 0 0 0 ci ci ci
‘- 0) 0 Ci d Ci
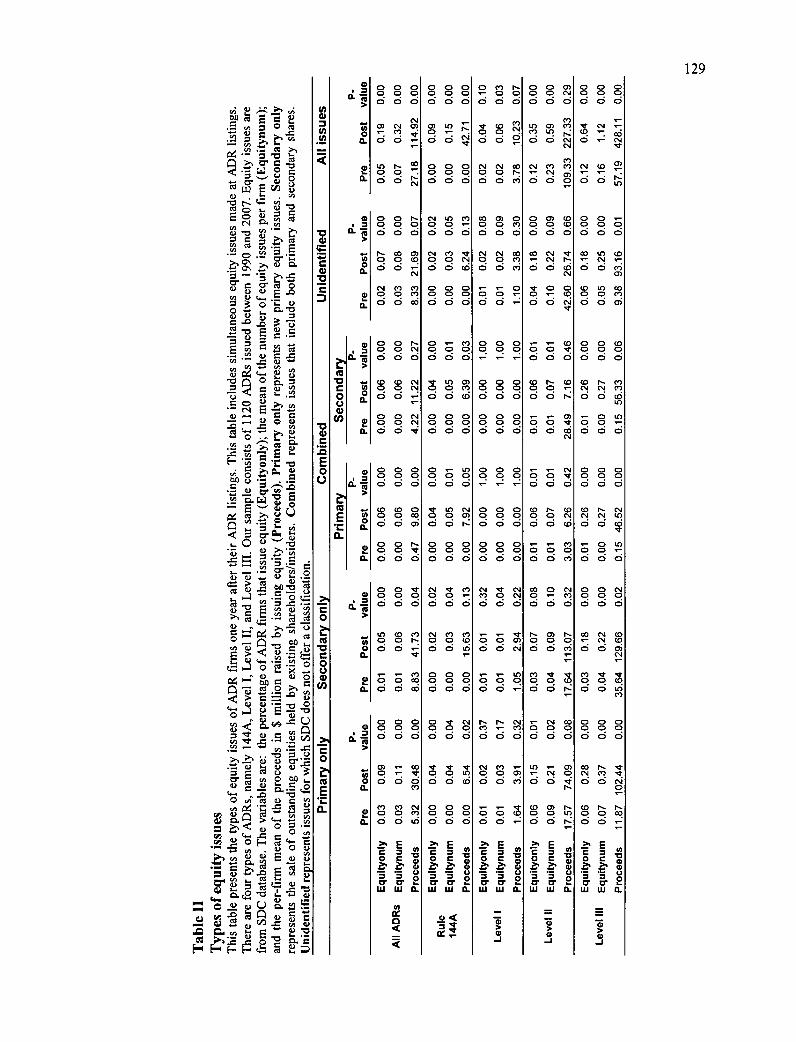
0 0 0 0 0 0 d ci d
CNI
CD 0 0 0 0 0 d ci d
csi
d d e).
0 0 11. 0 0 c) d d d
N. (0 0) q o cc 0 d
0 0 PI à d ci
CO CM Cal
d d
e o o d ci
0 0 0 d ci ci
NI Cal r, O d cd
C7O
) 1.0
ci d d
0 0 0 0 0 0
0 N. N
d d cci •rr o 1.0
0 0 NI 0 0 0
0 0 0 0 0 0 d d d
0< "5 cc
to O O
2
129 0 0 Ch 0 CD NI d d d
0 0 0 0 0 0
O C,) 0 0 7„
> d ci c; ci c5 ci o
U E e .= o t; c
e ri — •E
'5 e cr ,s,e 8 N. té. re c> e g (NI
cif - a) -o t • es cd cl n E c) .1 5 -r«,
ta■
Cr CU0 0.) e .0
1/1 0.) e 0 r. (t) o «TZJ CU CO 0) e ./Z 3 173
-o E .c
E '05 •-
e - ta. eQ =o rn
o •.". Cal ••■•I 42)
tugE
cG
- 1/1 .5. 48
1-,•, E ("'o• -te • a 8 E -•A'Jc
E e, u 0
cr Ci« aij CL o c„),e •E .E
QQ 12.0 1.-„•
tom, , st. -
•'" e -71
g ce -
É.7j cl) 4. • e' 0 &I • 0
8. X to C0 0 ce -
c Tu' ce . < > 0.) o 0 2 E 1.)
fe.) CU
Ule "el) . „9 >" 72 cr.A
'5 â 8 e rd ta. .5
c 5,ç (I Q c -g
8.n > e< 0 5 4-■ 0 E. cri ,■-■ v) ° e • CA 1) 03 E vo ta. â
„cezt cu
Cij .713 n •É .e Vi CL) 0 Io
4. ...I "e C
E-■ g '12
ou) Ca) U) C,)
lt) d à CY
CNI
•rr to 0 0 d d °
.- r..
ci V. rio 0
d d Cal
CO
1••■ o o o 0 o 0 d d d
Cal C) C.) (1 cri
d o
CNI Q0
d d
Cal Cal CO 0 0 d d ri
2 Q.
0 0 d d
0 0 .- 0 0 0 d d d
O 7 (73
co ai o 0 d d à
0 01 CO 0 0 CD 0 0
ci ci d ci ci à
42.60 26
.74 CO 0 CO
d 0 Cc) •1•
0 0 Csl d d c.ci
CNI <V CO 0 0 CI d d ri o
o 0 c) d d
0 0 0 0 0 0
U) CO 0 0 ri O d ai
O a. ci ci ci
o o o o d d d
o o o dqq
0 0 r- o o cs, d d d
1- 1- (O 0 0 .1t d d d
O
CL cl
<D r- co o d d n:
(0 (0 0 0 d d
C■I `Cr 10 0) 0 0 r, d d cd
0 0 0 0 0 0 o d ci ci
0 0 Cal CD 0 Cal d d Ni
0 0 0 0 0 0
0 0 0 0 0 0
a- a-- 0) 0 0 •1• d d co
Cal ci ci ci ci ci ci
0 .- o o o d d à
0 0 0 0 0 0
0 0 0
Co N
0 0 •It 0 s 7
o- -i ° 0.
c; c; c; ci ci ci
CO CO 0 0 0 CO O d à
•4" M Cal 0 0 0) d d
0 0 0 0 0 0
10 r- o Cal O d (.C.)
te o ci ci 0
0 0 1,- 0 0 cl• 000
0 0 0 0 0 CD a- s- C) 2 0 0 0 0 0 0 0 0 0
d d ci ci ci ci c:•'.
O 0 Nt °
0 0 d CO 0 0 a- CI d d d
Cal tt C) 0 0 d d d
NI XI' NI C.1 0 NI d d 0
Seco
ndar
y on
ly
7 CL Tu
r- n co co
d d ri co gr. d à
1.0 C) 0 0 d d a-
s,'
Cal M 0 0 CO d d M
a- a- •cr 0 0 0.)
35.64 12
9.66
7.1) a° ci ci ni
C') 'J•
O d N: c•-) •cr a d d
0 0 0 0 0 0
a-- e- 141 0 0 0 O
Q. 0 0 CO d d CO ci 0 ci ci ci
0 0 0 8 a o cicici r- C■1
d d à
(.1 (0 0 CD 0 O
O. 75 0 0 0 ci ci ci ci ce ci
at 0 0 0 d d cd
LÉ) a- 0) s- Cs4 d d Nt:
<V el a- 0 0 0) d d ri
CO h- c■) ■*-
o d ni o 0 1- •cr. 000 o o.
o o o c) o ci ci d
CI Cl (N 0 0 C.)
CO 0) P. 0 0 0
d N: n-
CDh o o d d
ô ô d d Q. ci ci tri
ce
o 2
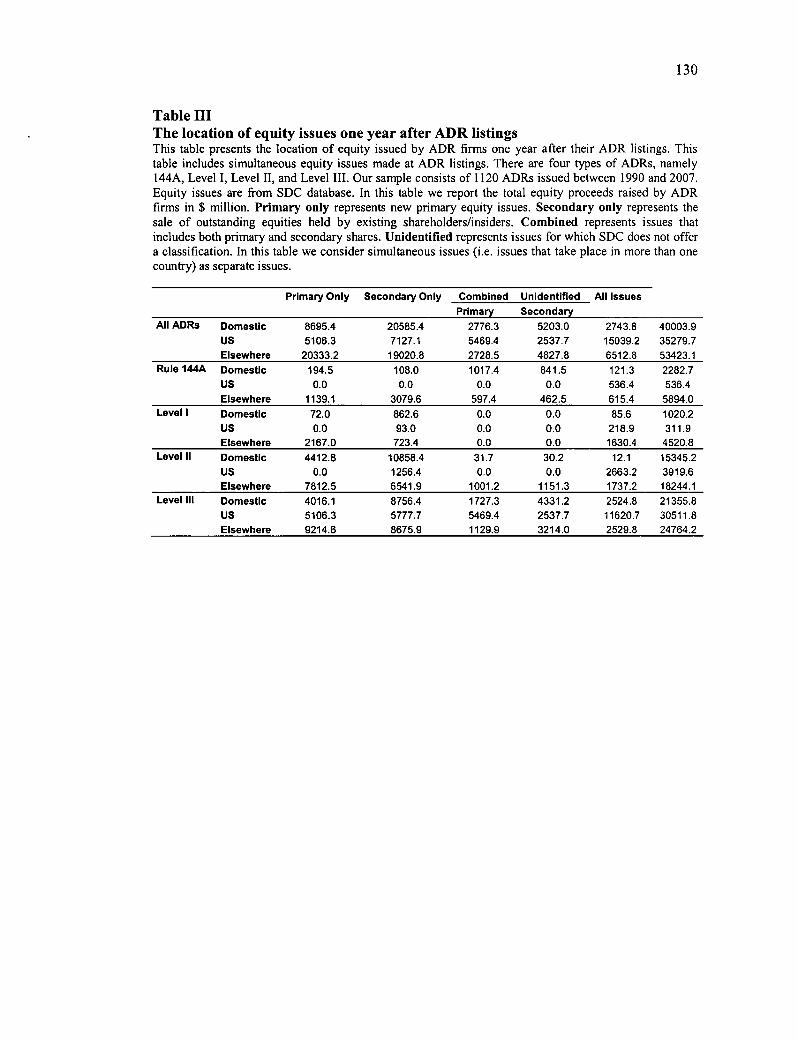
130
Table III The location of equity issues one year after ADR listings This table presents the location of equity issued by ADR firms one year after their ADR listings. This table includes simultaneous equity issues made at ADR listings. There are four types of ADRs, namely 144A, Level I, Level II, and Level III. Our sample consists of 1120 ADRs issued between 1990 and 2007. Equity issues are from SDC database. In this table we report the total equity proceeds raised by ADR firms in $ million. Primary only represents new primary equity issues. Secondary only represents the sale of outstanding equities held by existing shareholders/insiders. Combined represents issues that includes both primary and secondary shares. Unidendfied represents issues for which SDC does not offer a classification. In this table we consider simultaneous issues (i.e. issues that take place in more than one country) as separate issues.
Primary Only Secondary Only Comblned Unidentified Ail Issues Primary Secondary
Ail ADRs Domestic 8695.4 20585.4 2776.3 5203.0 2743.8 40003.9 US 5106.3 7127.1 5469.4 2537.7 15039.2 35279.7 Elsewhere 20333.2 19020.8 2728.5 4827.8 6512.8 53423.1
Rule 144A Domestic 194.5 108.0 1017.4 841.5 121.3 2282.7 US 0.0 0.0 0.0 0.0 536.4 536.4 Elsewhere 1139.1 3079.6 597.4 462.5 615.4 5894.0
Level I Domestic 72.0 862.6 0.0 0.0 85.6 1020.2 US 0.0 93.0 0.0 0.0 218.9 311.9 Elsewhere 2167.0 723.4 0.0 0.0 1630.4 4520.8
Level II Domestic 4412.8 10858.4 31.7 30.2 12.1 15345.2 US 0.0 1256.4 0.0 0.0 2663.2 3919.6 Elsewhere 7812.5 6541.9 1001.2 1151.3 1737.2 18244.1
Level III DomestIc 4016.1 8756.4 1727.3 4331.2 2524.8 21355.8 US 5106.3 5777.7 5469.4 2537.7 11620.7 30511.8 Elsewhere 9214.6 8675.9 1129.9 3214.0 2529.8 24764.2
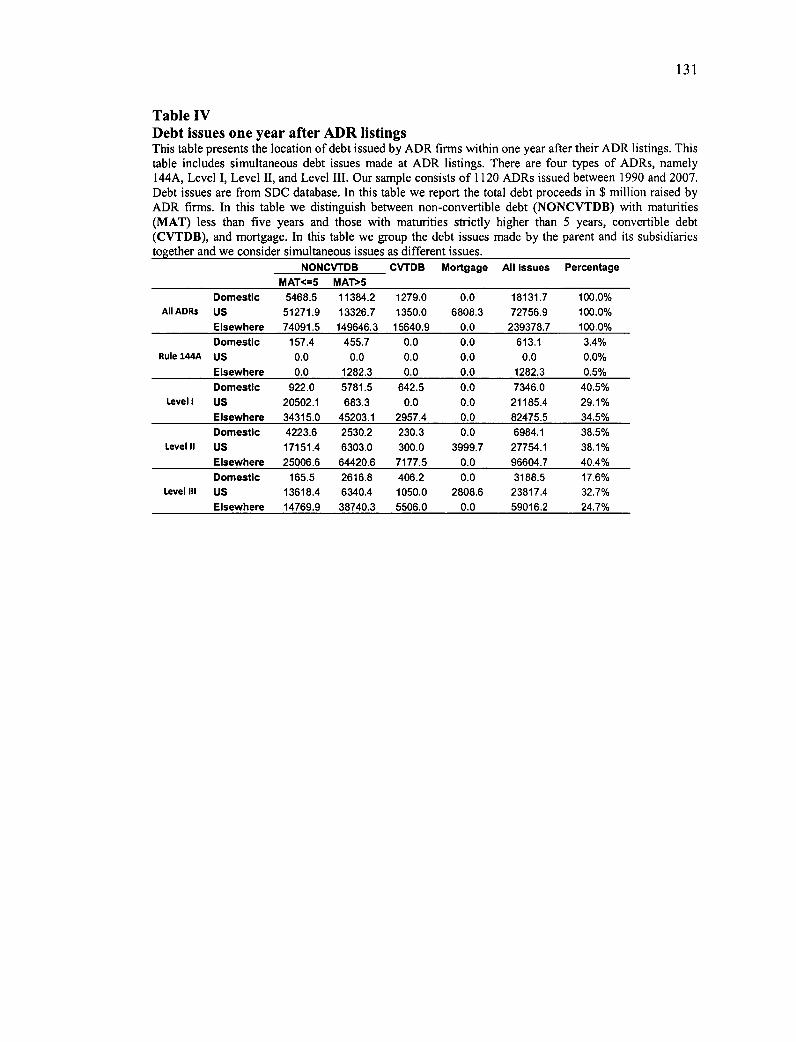
131
Table IV Debt issues one year after ADR listings This table presents the location of debt issued by ADR firms within one year aller their ADR listings. This table includes simultaneous debt issues made at ADR listings. There are four types of ADRs, namely 144A, Level I, Level II, and Level III. Our sample consists of 1120 ADRs issued between 1990 and 2007. Debt issues are from SDC database. In this table we report the total debt proceeds in $ million raised by ADR firms. In this table we distinguish between non-convertible debt (NONCVTDB) with maturities (MAT) less than five years and those with maturities strictly higher than 5 years, convertible debt (CVTDB), and mortgage. In this table we group the debt issues made by the parent and its subsidiaries together and we consider simultaneous issues as different issues.
NONCVTDB CVTDB Mortgage Ail Issues Percentage M AT<=5 MAT>5
All ADRs Domestic US
Elsewhere
5468.5 51271.9 74091.5
11384.2 13326.7 149646.3
1279.0 1350.0
15640.9
0.0 6808.3
0.0
18131.7 72756.9 239378.7
100.0% 100.0% 100.0%
Domestic 157.4 455.7 0.0 0.0 613.1 3.4% Rule 144A US 0.0 0.0 0.0 0.0 0.0 0.0%
Elsewhere 0.0 1282.3 0.0 0.0 1282.3 0.5% Domestic 922.0 5781.5 642.5 0.0 7346.0 40.5%
Level 1 US 20502.1 683.3 0.0 0.0 21185.4 29.1% Elsewhere 34315.0 45203.1 2957.4 0.0 82475.5 34.5% Domestic 4223.6 2530.2 230.3 0.0 6984.1 38.5%
Level II US 17151.4 6303.0 300.0 3999.7 27754.1 38.1% Elsewhere 25006.6 64420.6 7177.5 0.0 96604.7 40.4% Domestic 165.5 2616.8 406.2 0.0 3188.5 17.6%
Level III US 13618.4 6340.4 1050.0 2808.6 23817.4 32.7% Elsewhere 14769.9 38740.3 5506.0 0.0 59016.2 24.7%
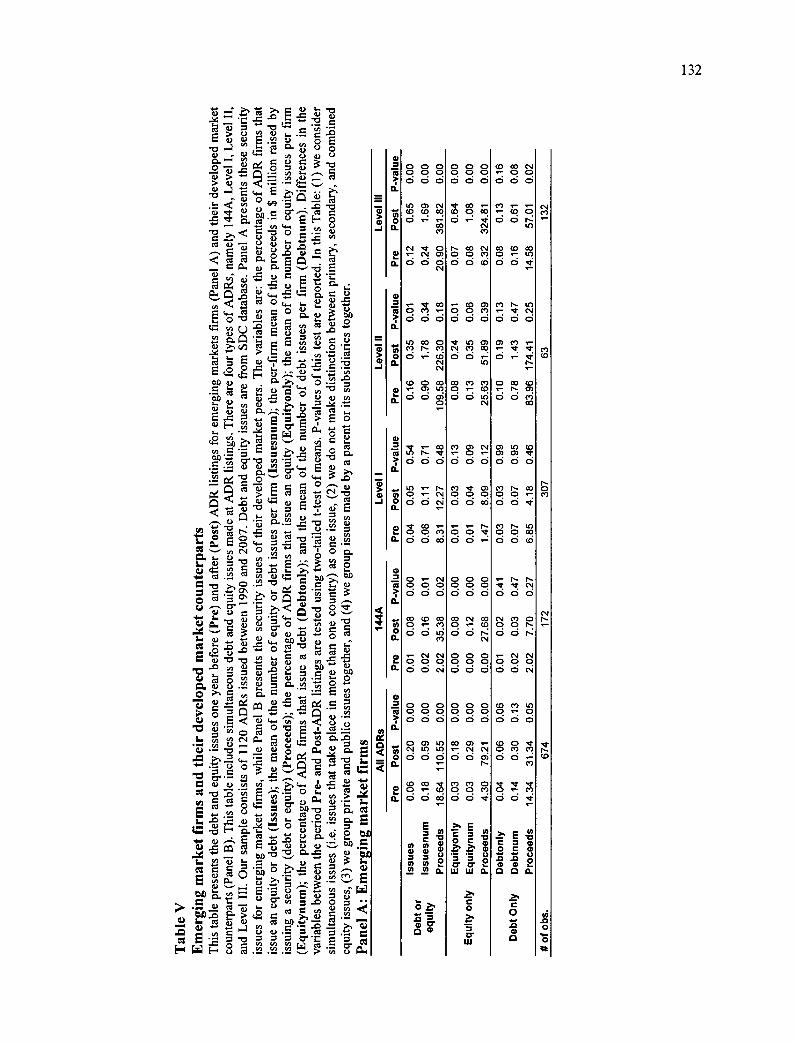
Q
.7)
ta
Go
▪
co Q Q d tri o
Q.
o Q.
Q.
in
Q.
a.
D.
Q.
ID o Q.
Q.
ro Q.
Q.
Q.
in
Q.
cf) o Q.
2 Q.
o
0 0 0 0 0 0
C:i
Cs1 1.1" 0 N O)
Ci d Ci
•••• •Cr CO 0 CO ■-• d d d
co o
▪
rs Q d d
0 N Q d csi
•ch od 0 0 CO Q d od
0 Cs1 0 0 0 ci ci ci
N CF, 0 0 d d csi
0 0 0 0 CD 0 d d d
(0 Go co Q o Q d cd
0 0 0 0 CG 0 d d d
Q
r- co o o d d cO
s- CO 0) 0 0 CO d ci ci
'V' 0) N 03 Q d
U)
03 CO CO 0 à d ID
CO a) CNI ■-• ci ci ci
co -a- à o o d d cd
0
•
0 1;1"
0 0 0 0 0 0
0 0 0 0 0 0 d d d
ci d
d ci d
CO N CO 0 1' CD. Q d g--
Q o o QQQ d d ci
CO CO ■- ••• N N Q d cri
Q o o ci d
CO CO
0 CO C • •-• 0 0 Q à d
‘- a- •- CD 0 Q à r-
U)
CO CD c0 0 it) C5 Ci si
0) CO
0 CO (D - r- O) Q d rd co
Go 111 CO Oi •ct
0 0 •-• Ci Ci mi
0 0 CO
E • o O C .o a) a) C1 Cà
d d cri
• r, 0 0 d
N 0 0 0 N à ci r:
• N N 0 0 o Q d csi
CD CO ID 0 ■-• 0 Ci à C:1
co o 0 CC d s-el
d ci si
ci)
o 2 Q.
r- o)
V3 V3 a.
,i,' e-1" p '5' 1.. Ê 1.) , ,,-• -0 :0 c â Ti c -o
- 1.-.. , 7, -
- = -° o E o o a.) ai c.) d., „,., o ai o
0 -a-) ..c Q'-' .2 e 2 e le ›. ,.. ... re
., -
.15 4:1 -X 4: 2,1, „en.' Fie. g
CG
• -
43 7.) 2 ai ;,-). 1.• ,-, E = tu ci?, < CG . . c o., ,., o.. = ..._.., mi E
ai 1) = -■-• t a, , 0
nd e o 4., , 2 8 f, C 0 'r, 61' eSe o e 1...° eu
1 ) e ... ce 0 ..... esEgo ,, ..o . cEe.6 = 0 CA
..Sd › I-. Cl.) •
à à E E a g Q+
.5 • -• Dl
do • -, co = 1...
•
"a y
?..q..9 .1.) c.) CA
11 le cu c. el 0 ... E -e v9 te, .--il -cd E e 0.) ..''.. ..be o •-• c A. ,- ."a'
5.1 cn •-• co
•
i = â E -5 c co CA
(n.- ,- 0 -•-• - A. e" cr 0 > >, -
. ,e, e‘ -o 0 •-• 0.) 4.. .....0
e Vs TeÊ g ul ....., .... -
Q r, là -8 '',.:".. 8 g 4 tr g 0 tu -•-• 7
= nz r, tu 0) le '") s• ..e .A ,-•
- Q G - ng .
•
o ci., L.. 0 = -ce t'› =
.5 Ê ts:, 4 Ce ......,,c" ••-■ cu .1-4 - y) QG_ = c .4-.‘" ON k.. O cu = 0, .., 0Q.,:itee c., - CS' • .8:■ CL) = ,....
a+ a) = o .r.• Cà "2 8 .'1,- id 1. u 0 '''' 4. •■., '''
'P., <0 a) e 0 cil 0 -0 .2 ...... •- v., es- ■-• .1) c g ...-• 0 s., fzià pi) , 2....) . 4.
•
0 , .0 •1. 0 .,.., e e ,-1) e .. o -0 -e. ,-0 I5 CG 6 9:3 .0 tel là op a) = .0 c) eu = = a> , 1-.
a) = E 2 e cn 0 0 cn ... 0 ..... CI« a) •
. 2 . o..0 .,,
:- E t 71; tm .±-2, p.. 0 =Q__,-.e.,,,.....Q
0.) 4-1 ''CJ o •,-,-, e 0 ^0 1 Cl • .. .. ir v)ce t e'l in.q e a> - e, C1.-5, z •.-. ,,, a) ,-. co c.,, ... 0
.?2, e i-..,_. 73 0
e .8 g ; g ce -te g..5 e g .,, ,u : . . m. ec.- Z P.:4-so 1.4 - Le
tim 43 ce 0.) .^ 0.) • L..CA = m
" os © _ „. ,.) e tià ce r; e i. -0. :E 4) 14.) 4 ,à• .a., •.c....., 5.. E ,..0- - - _ 8 •G 0 ..... 6 -A e
• g .-1- • rà 3. . .: PI = g)0.) CL) .. .= œ r#,:, --. x . „ a) c,, ci) , tu 3 I. ug,-, el.) E
•
§ s-',..1 1) 4>-' = ,..:::, Le ...- • r, g.) . ,/, CZ E
1) E
M " •... 0) MI Tà co..0 E. 0 > 4., = cià s... ce 0.,• a.. e • -c.
c •- ;.i-_, wrà ° ... •-• Ci EL) ... M Ce e cn G o o m er •r, 5 o cl E-1 ;•T•7 E-.
•
8 g'''''`a ,g, e• ._ .52. •._. - >. ;,.. .,..
132
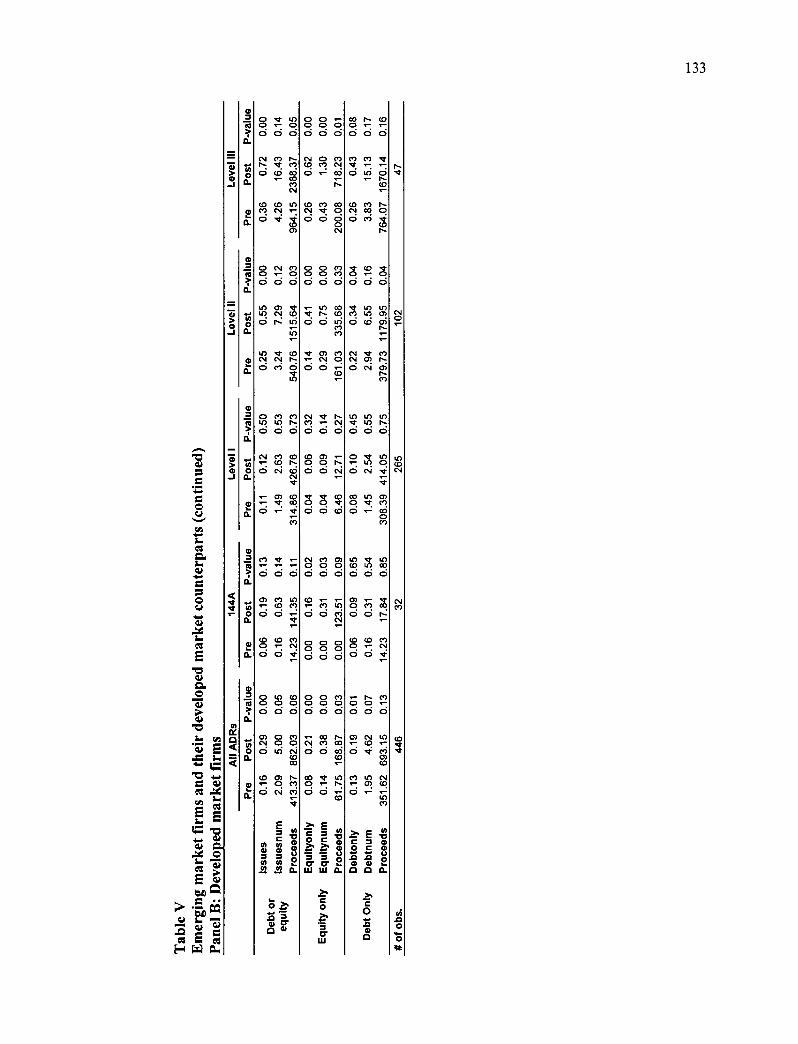
• Cl)
413.37 86
2.03
0) N O U)
co a) o O ri 61
.75 16
8.87
C.; elC° O d
C) O .- O d
o o O d d
0 0 s- C. 0 0 ci ci ci
OD N. CO o 1- a- d d d
Q.
cn o N r- d co
CD CD N
d Ni
964.15 23
88.3
7
Q.
o Q.
Q.
o O N (a) 0 a- 0 d d d
Q.
U) 0) cs, d o
Q.
• azr N Cal d i r
o O C) tri ci ci d
Q.
co
o at a-a--
Ci Ci Q.
O o ro o o d d d
N N
d d d
CD CO 0 r-- ci d cNi
al• 0 0 ■7". à à CD
N 0 0 0 d ci d
•I" CD •4" o d d d
O (0
N N O csi
379.73 11
79.9
5
to •zr r-- ci d d
C) 7.e Ln
O d d
540.
76 1
515.
64
o Q.
Q.
0) r) o d d
o CD CD 0 ‘- d d
O U, 0 0 0 ci ci ci
Q.
0 0 0 0 0 0 ci ci ci
0 0 Cl 0 0 0 ci d ci
0 Pl CO d d
CCD Ca) 0 a- Cal ci ci
r- o à ci ci
14.2
3 14
1.35
o Q.
o Q.
e .3 3
C)
CD
rt
o
133
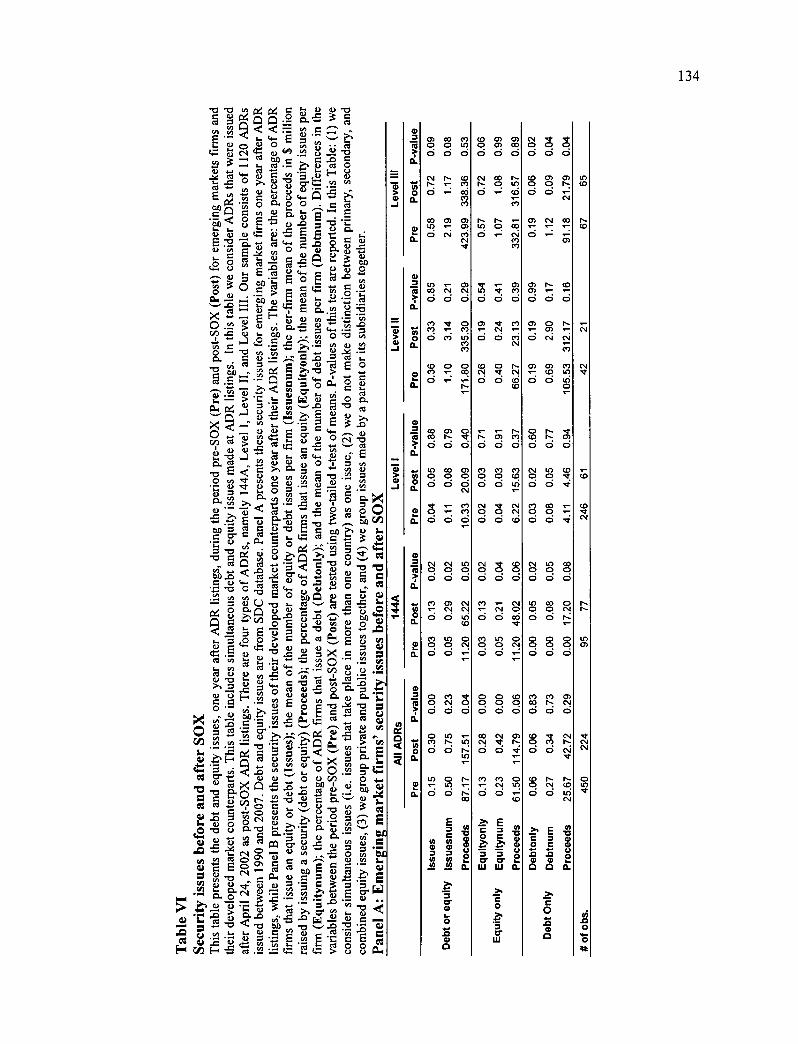
71)
-J
17)
71)
O
Q.
•■••■
o
2 Q.
O
Q.
Q.
2 Q.
Q.
Q.
O
Q.
O
Q.
te) o Q-
G,
Q.
te)
o
O
o
cn op o o d d d
CO 0 0
Q ci Ci
0) CO N CM ci ci ci
ri 4 o d ci tri
(.0 0 0 OD • • •
0
co co r- d d o
U) CO 0) 0 0 0 Q d à cs,
.-- 0. .C? d ci •-•
CNi CM à 0 0 Ci à Ci
CI) • N O d ui co • ui a o o d d .-
0 C.) NJ• 0 Cg o O d d
U) o r à t-œ
C.)
à 0 CO 0 0) 03 Ci d Ci
CNI CO h h 0 à
ci d d
.- Cg d ci ci cs,
N
•
I• C.)
CO 0 h
O N Nt". Cg
Q
r- cm c.) O d d
cl (.) r) o o CD à à ui
cà d d à
a ô ci cs
N o Q d
c-, o QQN O d
0 0 CO 0 0 0 ci ci ci
cs, N N 't. o
C.) o • N Ci 0
CO
r■I •zt- 0 0 0 Ci d d
CO 0) CO 0 0 h Q ci
C) co . . Q
cy, r- d d à
CO 0 h
ci ci N
0) 0) c.) ‘- (D à d ci ui
0 (O P.- 0) O d d
CNI à CO 0 0 '4" O 0 Si
• o ci d •
Cg à CO 0 CD 0 0 • à
U) CO 0 0 0 CV d d N.
0 0 0 0 0 0 ci d d
Ci Ci CO CO h N Ci Ci à
(D mr 0 Pl h Q d c%i
CO h h OC') CD O d tri
Deb
t or
eq
uity
CN
z-0"
•*. c.1
N.
O 0 tà.
-cs -a v, ee ee c I- c.) c.) -a g g e QQ.3e1- 15 e g v, v, v, .= „, .-■
.
s---' c! t.
; g e 0 ie
U) .E ..e) d.9 'g oc g 0 . ..5. b t-. 8 ,... 0 , te -0 .. . . O - - 0 i_. 0 E tz pl'cuu4-.A.-•
•,,-, o c. o o . 0 I) c, t- --e-1 E C0 0 •.-. 0 ..0 z "C . i..."
Q b cl)e."' .0-if.E.S E 70-51.+-. à4-. Ê 4) 0 1)
•
. e. ,_., 15. - . .... . c 0 4-•
rneon toi Eo Ê â_rz t
0 2 0, . ,.... .F0 ; . Ê 5 `.. i> . 5 *g •-•.' JZ — T.-• .. •Ll) tm c Cl 13' ••-■
o• v)u ).) v) • °) .•cu •- > c..-• 0 4. •..
•
= , „.„ ,..1 o a ..= ,:-:.' v, '''
0 •-• "V col co '-' .-' g "a. .... 0 C 4-' ',.= ... ›•'''' 9 e Q. c a.) •-
r,ima moc.) cuEo n ee .t'' "e > -.-. g 0 = .- Q = - 4.. . - c ._ c 0 0 0. 0 0 --...-, - .e, - cr • e à
o a pi ee
•
o a •41 ,„ •-•• _a ce -a
x Q ,,•• Vj , »••■•, • 1■1 = 0 e ..0
C) ,..9' 0 .... ,.., c.,1 le
.... CCS tir.. .0 ........, cu = .-• (n 2 "0 i.. .... à 1-■ OU 4. .„„ii „, ,a. ›, ,,,,, 0 , - 1.2 t
O VI '4' ° "' cnv, "ed, — e 1:-., g) 4 c.) e ,Q - g) - 'n — cl., v) , = _, ,... o - ' c •-!
tz- VI CAe> ."'C'd . -. . .e i c9 •-fa. ry>sdi eu •: -05 < ...., ••••• ,...4,, o. a
til 2 ,....,
•E• 75 E. -2 e e c cr e Au 3 c. ic• cit c • +;.: e CL> ,-. 0.) ..,-■ = (D •.-.
= - = +al
5 -te a ris c) ee -'-'• '' ^ 0 1,- e u e.,, 0-
a ... •- • c ao.
•
15 ct ..w „ se" 4. ...• gg= 0 . ,... .,,-,• .es. - o am o 0 ces I -a o ..,,, - c....
VI ,n — . <,..) (..) ..,,,, ,_ ,s, •-•-• â 5 f, „.„
A
•
e 4--vD ErE8utiluo'e <i113EMetre 2 sd . e uE 4•-c,u0., (1)>< 0 g mcie a •- v
.:-... -■-• ... ‘,,,,) 0 .- v) 0 • cu 4-. .. „.. u.) CU (.) e CG e . ,„ .., 0 .— c.) .- — CA •■+ .1 cu .. Cl) "15 " 1) -....0 >s el) O 4..,-, 0 a.) -= 0 a. 6 ,
[.-. ce) - e e — 'ai
• CO c.) 0 u e 0 8
v) ....n .....'e . ...1 2 . e Q ,...,0-, ‘., .r..,' % O = 2_ _ 2 cy t i-g = vi
4-, •- ..a.)-0.)„ 0.,,,g. tz. 1.à.a`F■ Q e v) v. ,..K ,•-' cl ce t Q)) ''' o d) v.) . 2 -,.., ..-m u el X A -•-• cee o '4 to il) - -c 2.0 ,.) ).. •- - c c eg czt 2 ci,) c, = -0 0.) ,..... tA 3 0
h: e -0„. ‘...,1) s ,...c1. ,•-- c)
>-. •° e In E e .4- ° r- vl ....., © -0 0 cl....a ia... r... gl• 1.) .re ..=
tm b- a 0 a. . ,44; =
.e '0 114,_ es' 0 g■I ti.) V1C) «'' •-M ô g •-« • 2c) ;A; '...= 61) ' 'n L- >., - c
•
e.2.0 - 0 a.occo.-....: e -3 c 3 3 w
.c.e. 1^ c-c,i u • n..e.Ep,- 3 . , — >, g. U) r 7,3 4'ee
• à e LI . '- t `à) -.5, Ê g Ê •r, E o e as '2 e e ce, t • a o o Çà. El CID E-• -e cu .- :- tz: .... ur.' > c.) c.)
134
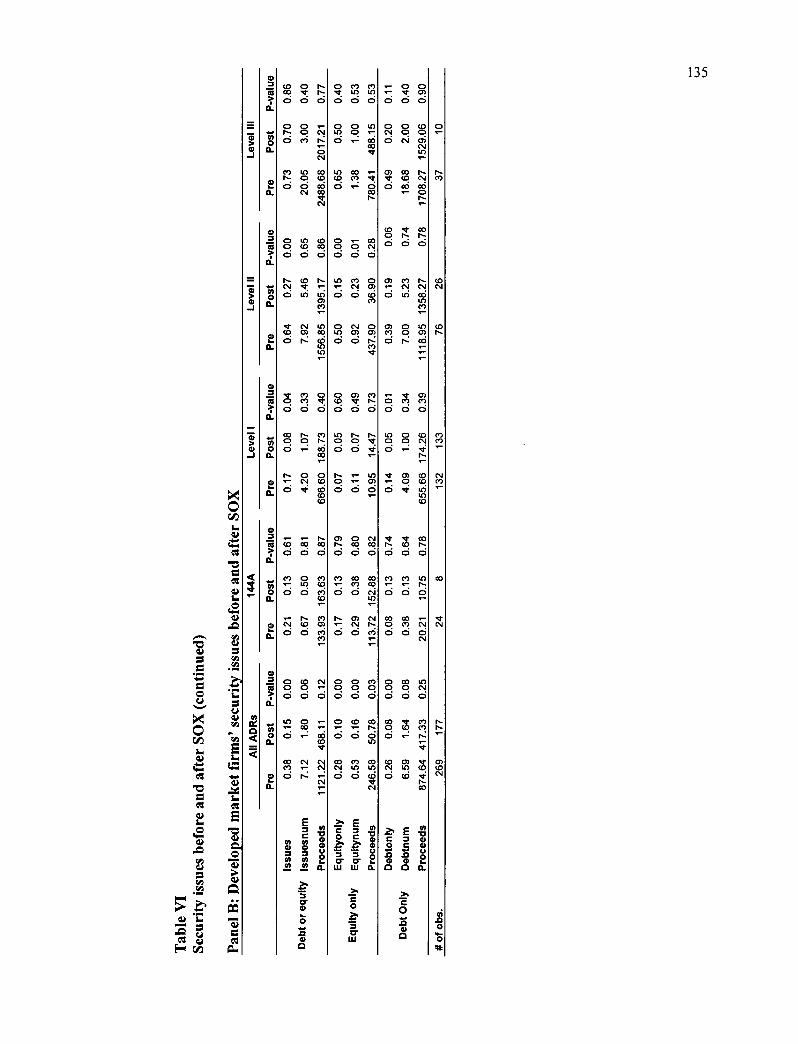
C d
co O r- co a r- d o d
11.0 0 CD 03 ci ci d
Q r, 141
C
▪
3 C3 C3
LO CO
o
•
o co r-
0 a- CO 0 Q N ci ci ci
CD 1,3' OD 0 h N. d d d
LO 03 0
Q d à
655.66 17
4.26
U3 0 0 0
a-
0) •- o Q a
0 O.
•
Q.
iG," Q.
le.
o.
o O.
sues
bef
ore
and
afte
r SO
X
Q.
fn o
71"
arke
t fir
ms'
secu
o
ari o o a Q Q o
co o o d .-
r- o a- N Q .0:
666.
60 1
88.7
3
• ‘- <D 00 o0 ci ci ci
Q Q d
• itso Q d
Q cr) co. r- o d d
ID I,- h 0 0 .0' d d '11'
r- ‘- 0. — oi d d d
0) Q N 1`.. 03 03 ci d ci
C.) co co co O d N
N. 0) N a- N Q d ri
d
•
M d d
aa C r-
d d d
C) ui d d c)
co co o N Q d d cs, 13
3.93 1
63.6
3
0 CD hl 0 0 d d ci
co o o o o d d d
0 03 LO 0 0 CNI d d d
10 0 a- 00 Q .--- c
▪
d 0 CD 03
O d d
03 PI CO hl ID ID CO CO CO
C.)
Deb
t or
eq
u itY
Iss
ue
snum
135
N.
CO
U)
C.) C.) a-
co
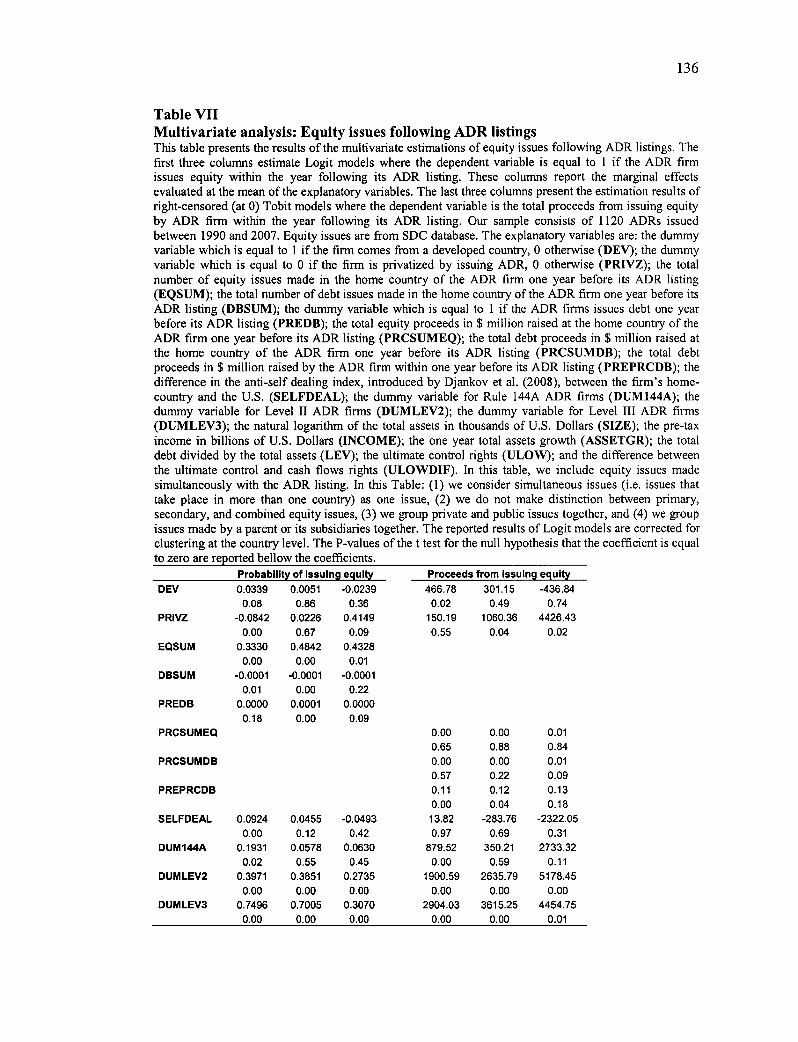
136
Table VII Multivariate analysis: Equity issues following ADR listings This table presents the results of the multivariate estimations of equity issues following ADR listings. The first three columns estimate Logit models where the dependent variable is equal to 1 if the ADR firm issues equity within the year following its ADR listing. These columns report the marginal effects evaluated at the mean of the explanatory variables. The last three columns present the estimation results of right-censored (at 0) Tobit models where the dependent variable is the total proceeds from issuing equity by ADR firm within the year following its ADR listing. Our sample consists of 1120 ADRs issued between 1990 and 2007. Equity issues are from SDC database. The explanatory variables are: the dummy variable which is equal to 1 if the firm cornes from a developed country, 0 otherwise (DEY); the dummy variable which is equal to 0 if the firm is privatized by issuing ADR, 0 otherwise (PRIVZ); the total number of equity issues made in the home country of the ADR firm one year before its ADR listing (EQSUM); the total number of debt issues made in the home country of the ADR firm one year before its ADR listing (DBSUM); the dummy variable which is equal to 1 if the ADR firms issues debt one year before its ADR listing (PREDB); the total equity proceeds in $ million raised at the home country of the ADR firm one year before its ADR listing (PRCSUMEQ); the total debt proceeds in $ million raised at the home country of the ADR firm one year before its ADR listing (PRCSUMDB); the total debt proceeds in $ million raised by the ADR firm within one year before its ADR listing (PREPRCDB); the difference in the anti-self dealing index, introduced by Djankov et al. (2008), between the firm's home-country and the U.S. (SELFDEAL); the dummy variable for Rule 144A ADR firms (DUM144A); the dummy variable for Level II ADR firms (DUMLEV2); the dummy variable for Level III ADR firms (DUMLEV3); the natural logarithm of the total assets in thousands of U.S. Dollars (SIZE); the pre-tax income in billions of U.S. Dollars (INCOME); the one year total assets growth (ASSETGR); the total debt divided by the total assets (LEV); the ultimate control rights (ULOW); and the difference between the ultimate control and cash flows rights (ULOWDIF). In this table, we include equity issues made simultaneously vvith the ADR listing. In this Table: (1) we consider simultaneous issues (i.e. issues that take place in more than one country) as one issue, (2) we do not make distinction between primary, secondary, and combined equity issues, (3) we group private and public issues together, and (4) we group issues made by a parent or its subsidiaries together. The reported results of Logit models are corrected for clustering at the country level. The P-values of the t test for the null hypothesis that the coefficient is equal to zero are reported bellow the coefficients.
Probability of issuing equity Proceeds from issuing equity DEV 0.0339 0.0051 -0.0239 466.78 301.15 -436.84
0.08 0.86 0.36 0.02 0.49 0.74 PRIVZ -0.0842 0.0226 0.4149 150.19 1060.36 4426.43
0.00 0.67 0.09 0.55 0.04 0.02 EQSUM 0.3330 0.4842 0.4328
0.00 0.00 0.01 DBSUM -0.0001 -0.0001 -0.0001
0.01 0.00 0.22 PREDB 0.0000 0.0001 0.0000
0.18 0.00 0.09 PRCSUMEQ 0.00 0.00 0.01
0.65 0.88 0.84 PRCSUMDB 0.00 0.00 0.01
0.57 0.22 0.09 PREPRCDB 0.11 0.12 0.13
0.00 0.04 0.18 SELFDEAL 0.0924 0.0455 -0.0493 13.82 -283.76 -2322.05
0.00 0.12 0.42 0.97 0.69 0.31 DUM144A 0.1931 0.0578 0.0630 879.52 350.21 2733.32
0.02 0.55 0.45 0.00 0.59 0.11 DUMLEV2 0.3971 0.3851 0.2735 1900.59 2635.79 5178.45
0.00 0.00 0.00 0.00 0.00 0.00 DUMLEV3 0.7496 0.7005 0.3070 2904.03 3615.25 4454.75
0.00 0.00 0.00 0.00 0.00 0.01
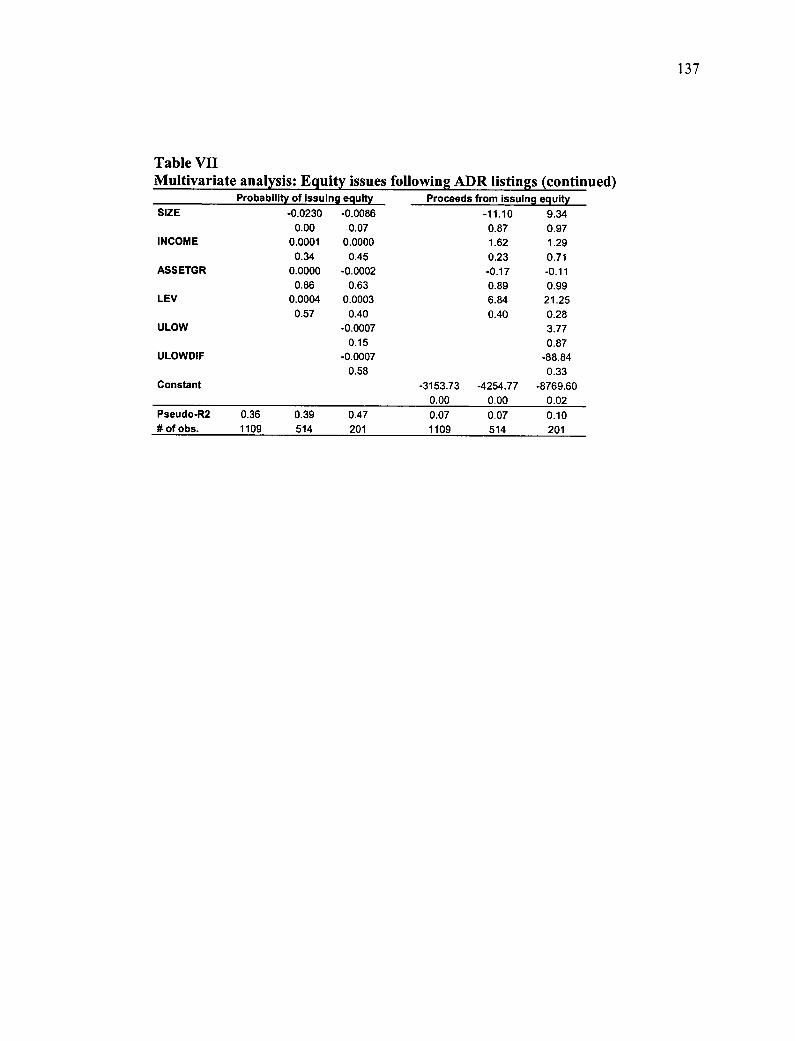
Table VII Multivariate analysis: Equity issues following ADR listings (continued)
Probabllity of Issuing equity Proceeds from issuIng equity SIZE -0.0230 -0.0086 -11.10 9.34
0.00 0.07 0.87 0.97 INCOME 0.0001 0.0000 1.62 1.29
0.34 0.45 0.23 0.71 ASSETGR 0.0000 -0.0002 -0.17 -0.11
0.86 0.63 0.89 0.99 LEV 0.0004 0.0003 6.84 21.25
0.57 0.40 0.40 0.28 ULOW -0.0007 3.77
0.15 0.87 ULOWDIF -0.0007 -88.84
0.58 0.33 Constant -3153.73 -4254.77 -8769.60
0.00 0.00 0.02 Pseudo-R2 0.36 0.39 0.47 0.07 0.07 0.10 # of obs. 1109 514 201 1109 514 201
137
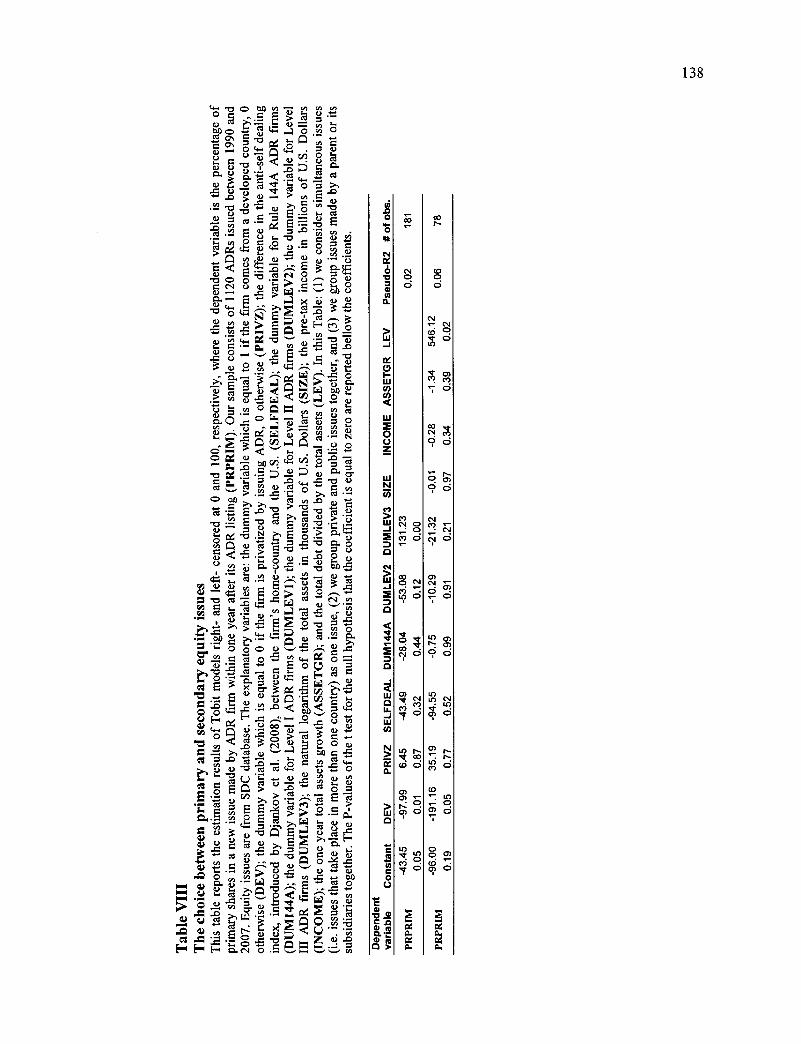
Pse
udo
-R2
# o
f o
bs.
(73
INC
OM
E A
SS
ETG
R LE
V
SE
LFD
EAL D
UM
144A
DU
MLE
V2
DU
MLE
V3
SIZ
E
to 0 a)
Tabl
e V
III
0 Q = o _c • -■ ,t) ''" ..0 &I b o. c? ,,, ;A' ,-. 3 ecu Il E ,-1 ' 41.2 e ) .11 Ê 0 >`î2i•-",','-'„,
7: : 7:- - eeo '+e2
'n o
cn ce cs •r: a) - .., .... g) •e ,L) .......,,,a •,,,
or cn = "cl o f. 'n 4- = ÊOçe = E Ç4 ....s..._ .:* el E (II ! ° o ..0 4-. , u 2 E._,....z. ,--■ - 0.) pz• • 0 oo —
5 :::: z 4" Q ce7d 0 20 .... a) "te c0) .0 - r•I ,_ e,
c. -0 co els) cn -Q y.,, t .4 o =
co cr, t : $-.
-5 0 = 0., - , ..... .
0 4. r■ 4. ,,,: !, là)
ti..) (1) 0 .1., _, .0 ■-' Gt.
cs. u cl › ct. .-'-' •cr ni c.,.., ;LI ..,, o •-- 0„),4o cu•ttâo= 0 CU 15 ct .....
tu -ce 0 0 0 = -5 E ::_--1, t e — e — "c f,— . c.„2- E a) = -0 -in- ‘n • o $... 'V 0 - +-■ ., CA
0 e 0 › * 4. .0 , .., •
rià <4.. I) • , vl ca
Q w 6) 0 '.". 6) • 0
..re©40•E: .4--_, ..c,— ,......- ,e, 0 -0 .re c t, ,-, 0 o ‘.. ..., 0 .--. ;.... o 0 c.) o o a w . - ..... te o 0, ,.-
0....- -.5. > 'ai là u 0 c.,_ Ê • ^ >-, IL- 1 .1 ..̂ d e "e» 6.1 cn 1.) › 5 ■-• sr. rl 0
Q -cs u5 4. ›.I s. 0 p., "' à' 0., 0 _ .........0 0) Ê 1-. 0 e , .2 1,.;,) . o t •.- • - _, w ---...= 0 > ; ,'?,-''E Z''' N > t; e- ic —. , ..‹ Q..w.ei. . .... › CA Cr .= W ■'.!. , 4 2 0 .-• ‘.,
'n 'n LA â 0 ,-, — co ;z ■ — a ru 0 12. ..<7;. ,:..,:« t /I
C3' 1 I, c:3 pe u .1.' —, tau 55 te vi a cri
cu. e , re ., •E 0 — > ...,ei., .,,.5 •._ '4°
e) "C) m Cl) >, me "le -te .‘,'?•, e -8 cu E ,!). . 0) 7 c e. . .;- • c„..
'e CA ce -g .t'. 5 Q 0, ,g a C.)
;s:".2) 0 0
00 C 15. ce -5 .o -.F2' — • 5 a' cn .-, 4. 0
b Q 0 .0 "g 0 4=i ,.. -, ...: ,... c. ..M e' 0 e' I 0 01 0 '-'• cl3 e E c) › .o o = E e« E „.,
ai ...• * ›.., w à 8 o ..— cm 0 E
>,-- F-
m ul. È
-o § 0.) 0. ...: _.e ...... t - = , a) o cl) 1.)
2 . E • -, e = ;..r,-o ' ci) › eià ..= 0 .1. Q)
•JD 0 ci, .,', w '') ee) f... rt oel) O_ ._ tu te 2 à . , E1,7, -.-;îâ :4, _ r.„ .., ..- ....72. „, .., •5 •er w cn V ..... ,=, v) cr 0,h) .= .1. e X .
• x- X o ca +.--, u ir:-.; ..., = E-I 0. cs1 0 .i..: ...... ■-■ ,...., s.-..• cn
138
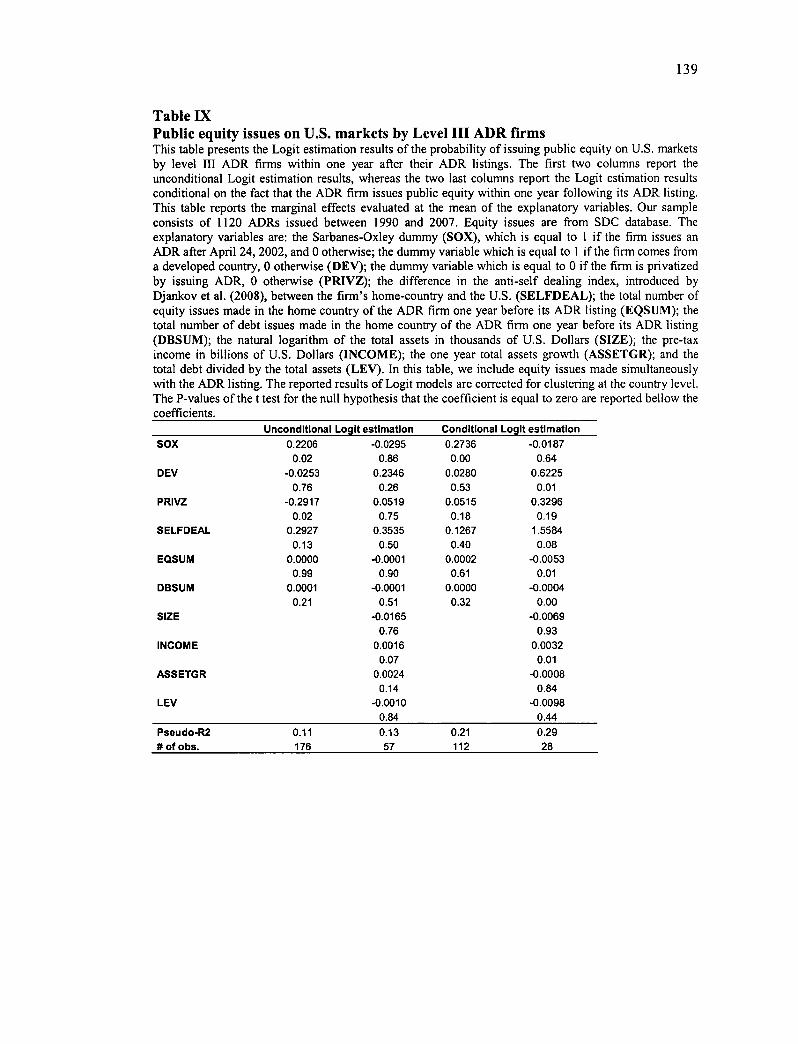
139
Table IX Publie equity issues on U.S. markets by Level III ADR firms This table presents the Logit estimation results of the probability of issuing public equity on U.S. markets by level III ADR firms within one year after their ADR listings. The first two columns report the unconditional Logit estimation results, whereas the two last columns report the Logit estimation results conditional on the fact that the ADR firm issues public equity within one year following its ADR listing. This table reports the marginal effects evaluated at the mean of the explanatory variables. Our sample consists of 1120 ADRs issued between 1990 and 2007. Equity issues are from SDC database. The explanatory variables are: the Sarbanes-Oxley dummy (SOX), which is equal to 1 if the firm issues an ADR after April 24, 2002, and 0 otherwise; the dummy variable which is equal to 1 if the firm cornes from a developed country, 0 otherwise (DEY); the dummy variable which is equal to 0 if the firm is privatized by issuing ADR, 0 otherwise (PRIVZ); the difference in the anti-self dealing index, introduced by Djankov et al. (2008), between the firm's home-country and the U.S. (SELFDEAL); the total number of equity issues made in the home country of the ADR firm one year before its ADR listing (EQSUM); the total number of debt issues made in the home country of the ADR firm one year before its ADR listing (DBSUM); the natural logarithm of the total assets in thousands of U.S. Dollars (SIZE); the pre-tax income in billions of U.S. Dollars (INCOME); the one year total assets growth (ASSETGR); and the total debt divided by the total assets (LEV). In this table, we include equity issues made simultaneously with the ADR listing. The reported results of Logit models are corrected for clustering at the country level. The P-values of the t test for the null hypothesis that the coefficient is equal to zero are reported bellow the coefficients.
Unconditional Logit estimation Conditional Logit estimation SOX 0.2206 -0.0295 0.2736 -0.0187
0.02 0.86 0.00 0.64 DEV -0.0253 0.2346 0.0280 0.6225
0.76 0.26 0.53 0.01 PRIVZ -0.2917 0.0519 0.0515 0.3296
0.02 0.75 0.18 0.19 SELFDEAL 0.2927 0.3535 0.1267 1.5584
0.13 0.50 0.40 0.08 EQSUM 0.0000 -0.0001 0.0002 -0.0053
0.99 0.90 0.61 0.01 DBSUM 0.0001 -0.0001 0.0000 -0.0004
0.21 0.51 0.32 0.00 SIZE -0.0165 -0.0069
0.76 0.93 INCOME 0.0016 0.0032
0.07 0.01 ASSETGR 0.0024 -0.0008
0.14 0.84 LEV -0.0010 -0.0098
0.84 0.44 Pseudo-R2 0.11 0.13 0.21 0.29 # of obs. 176 57 112 28
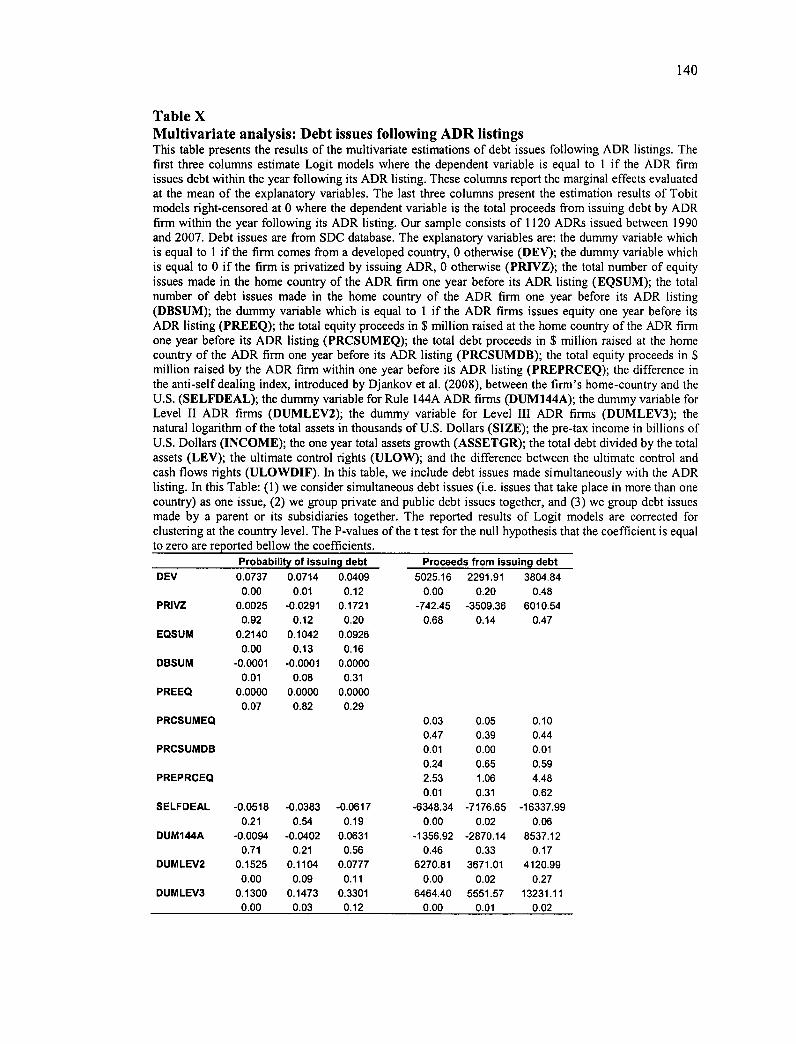
140
Table X Multivariate analysis: Debt issues following ADR listings This table presents the results of the multivariate estimations of debt issues following ADR listings. The first three columns estimate Logit models where the dependent variable is equal to 1 if the ADR firm issues debt within the year following its ADR listing. These columns report the marginal effects evaluated at the mean of the explanatory variables. The last three columns present the estimation results of Tobit models right-censored at 0 where the dependent variable is the total proceeds from issuing debt by ADR firm within the year following its ADR listing. Our sample consists of 1120 ADRs issued between 1990 and 2007. Debt issues are from SDC database. The explanatory variables are: the dummy variable which is equal to 1 if the firm cornes from a developed country, 0 otherwise (DEY); the dummy variable which is equal to 0 if the firm is privatized by issuing ADR, 0 otherwise (PRIVZ); the total number of equity issues made in the home country of the ADR firm one year before its ADR listing (EQSUM); the total number of debt issues made in the home country of the ADR firm one year before its ADR listing (DBSUM); the dummy variable which is equal to 1 if the ADR firms issues equity one year before its ADR listing (PREEQ); the total equity proceeds in $ million raised at the home country of the ADR firm one year before its ADR listing (PRCSUMEQ); the total debt proceeds in $ million raised at the home country of the ADR firm one year before its ADR listing (PRCSUMDB); the total equity proceeds in $ million raised by the ADR firrn within one year before its ADR listing (PREPRCEQ); the difference in the anti-self dealing index, introduced by Djankov et al. (2008), between the firm's home-country and the U.S. (SELFDEAL); the dummy variable for Rule 144A ADR firms (DUM144A); the dummy variable for Level II ADR firms (DUMLEV2); the dummy variable for Level III ADR firms (DUMLEV3); the natural logarithm of the total assets in thousands of U.S. Dollars (SIZE); the pre-tax income in billions of U.S. Dollars (INCOME); the one year total assets growth (ASSETGR); the total debt divided by the total assets (LEV); the ultimate control rights (ULOW); and the difference between the ultimate control and cash flows rights (ULOWDIF). In this table, we include debt issues made simultaneously with the ADR listing. In this Table: (1) we consider simultaneous debt issues (i.e. issues that take place in more than one country) as one issue, (2) we group private and public debt issues together, and (3) we group debt issues made by a parent or its subsidiaries together. The reported results of Logit models are corrected for clustering at the country level. The P-values of the t test for the null hypothesis that the coefficient is equal to zero are reported bellow the coefficients.
Probability of issuing debt Proceeds from issuing debt DEV 0.0737 0.0714 0.0409 5025.16 2291.91 3804.84
0.00 0.01 0.12 0.00 0.20 0.48 PRIVZ 0.0025 -0.0291 0.1721 -742.45 -3509.36 6010.54
0.92 0.12 0.20 0.68 0.14 0.47 EQSUM 0.2140 0.1042 0.0926
0.00 0.13 0.16 DBSUM -0.0001 -0.0001 0.0000
0.01 0.08 0.31 PREEQ 0.0000 0.0000 0.0000
0.07 0.82 0.29 PRCSUMEQ 0.03 0.05 0.10
0.47 0.39 0.44 PRCSUMDB 0.01 0.00 0.01
0.24 0.65 0.59 PREPRCEQ 2.53 1.06 4.48
0.01 0.31 0.62 SELFDEAL -0.0518 -0.0383 -0.0617 -6348.34 -7176.65 -16337.99
0.21 0.54 0.19 0.00 0.02 0.06 DUM144A -0.0094 -0.0402 0.0631 -1356.92 -2870.14 8537.12
0.71 0.21 0.56 0.46 0.33 0.17 DUMLEV2 0.1525 0.1104 0.0777 6270.81 3671.01 4120.99
0.00 0.09 0.11 0.00 0.02 0.27 DUMLEV3 0.1300 0.1473 0.3301 6464.40 5551.57 13231.11
0.00 0.03 0.12 0.00 0.01 0.02

Table X Multivariate analysis: Debt issues following ADR listings (continued)
Probability of issuing debt Proceeds from issuing debt SIZE
INCOME
ASSETGR
LEV
ULOW
ULOWDIF
Constant
0.0227 0.00
0.0003 0.14
-0.0003 0.37
0.0005 0.31
0.0101 0.06
0.0002 0.25
-0.0008 0.00
0.0006 0.08
-0.0011 0.02
-0.0047 0.07
-18130.90 0.00
1963.76 0.00 7.94 0.13 -2.55 0.86
60.86 0.05
-45344.72 0.00
3774.71 0.00 -4.10 0.76 -7.84 0.92
131.72 0.06
-158.55 0.09
-862.15 0.12
-81664.88 0.00
Pseudo-R2 # of obs.
0.22 1109
0.33 514
0.46 201
0.04 1109
0.07 514
0.09 201
141
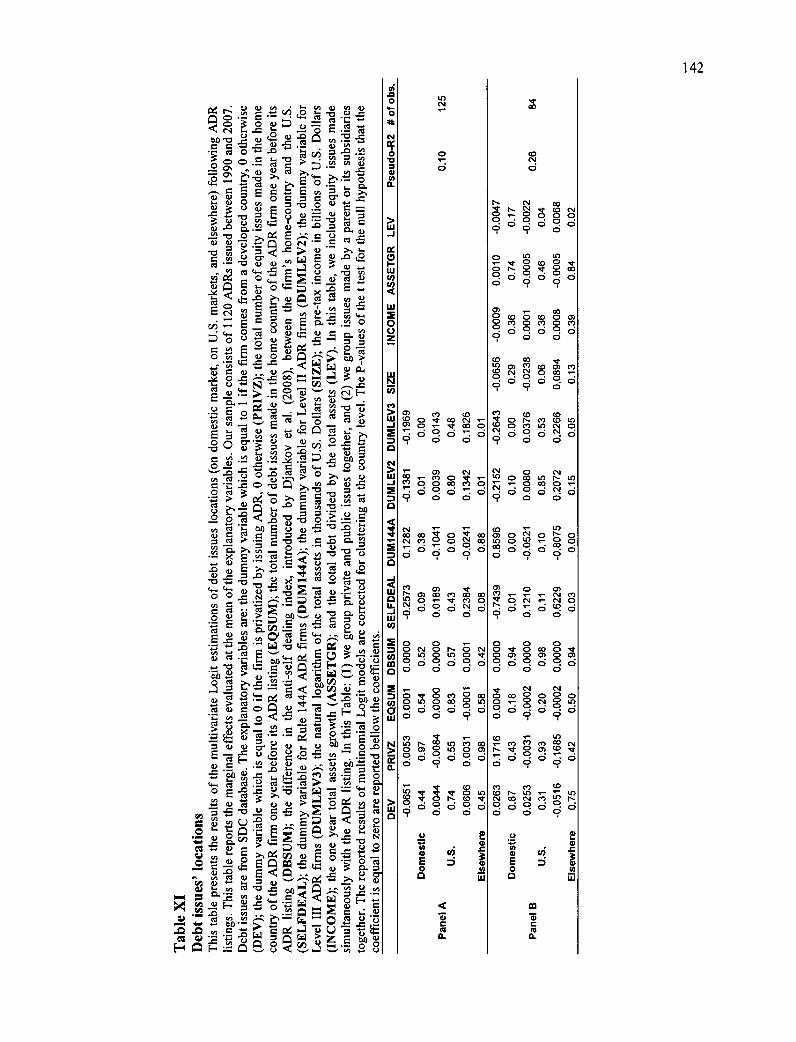
142
CD
O
C7) e) «D c s .0 Q r co „.- .- o .- st• co a ..-. 0. o • s- • o _ o 9 d o
'c3 2 ci o. ci ci d 9
ccg g- 8 'cf, 8 d 9 9
,,,N- œ co - 0 st C') o
cz; 0 Cs1 Q
0 0 0 N Q r•-. c7) N 0 u") Q u-) Q -
0
O O 'cr; U)o o co Q to °Oddqd O d 9
0) Iss / In C7) CO Q 0 o a)
c'dqddd d 9 d
L7> mr 4 0 N. cr, o.do cso c; Ui 9 à
N- Nc0 1•••• N N
0 • 0 • 0 • dco cÉ.o cs 0
1.0 O •- nr Q co Q r O N- 0 sr 0 op a • 0 0 • •c; o
9. o o
9
œcooô000> C') O cs) a cs) 0.00000 9 0
co •*- Lo o c» cs) 0 N N Qco .- 0 • 0 • c, • • 0 • 0 0 9 9 0
eD «D Q r-•• Q C') u-) o N• ci Q ci cs4 ci
9 Q ci
N o c., to a co to r.- u, c`à • cs, o • 0. • a • o 9 0 d
0)0 1 0 1.-- 0 GD 0
co 0 • 0 • 03 •
• 0 • co d 9
co o ° s 0 N .-N 0 r••• • ,- • (0 • csO ci O d o
8 'à', 8 e 8 0 000°0 d ci d
st N N Oco 0 0 0 0 Q .- 0 N 0 u" 0 • 0 0 • • 0 ....;0 d 0
9 •I•
«D
Z".; N
N. st 0 c0 si• ,- •
9
0 • Y- • •0 • 0 0
C') e) «D «D h- ul .- ,- Lo N c0 N el le r•-• °ciddqd d d• 9
C-) '2 ro a> a> oi .o E e (1) 0 V) 0 LM
INC
OM
E A
SSET
GR
LE
V
DB
SU
M S
ELF
DEA
L DU
M14
4A D
UM
LEV
2 D
UM
LE
V3
S
2 co o
o.
o
E o
Else
whe
re
rc...zocue,.,;,!..;.;/oDp Q l.) co . .̀2
1.0 I-
E •- - 1 e.4o a "ui .'L., cDeo,=,.,... C•11 I.
•,..5. g ... - .0 - •.:-.. • .0 ce') el Cil 0 = 4i a ,a , e: '.; . . t,)' • • • 1 1 > ,› 4 . 1. 2 : là
o e 0 -.. E ci, •E '-' " cià ti.) i
,.? 0 >, -o ,1) ,..., (4 tlà •■•-•
.61) (.) cu p -0 .52 o - ,. r.. .0 o o
F) 0 o z--. 4.) I.) -E ,.. a> CA , ,-.1 . = • •-• "0 ‘• Ct.
a)..e) C
ch ie, -"' CI) '...' ••10 0 ,,,,,
0.)275.4-. - P o eq - _c s' v■--- -c, e; > E .... ,••= > cu • >, -
e ? -0 a .., -, 4 0 •-• tu .._.
_tilé %Ill ô Ial 48 4- : ' 0 0
,i.... = ,.,-- a.."-.5 ‘1 ° •"" CA
2 E 4
O ,--: 0 ce t1)
• -• te ..= ..0 .+ a . ri., •■••• W '4 cu = . tU e
(1) .--: N , .0„..) ,:t■ se o .. :-:Z..c cc ,t1 1■■ I■1 > , b NI '.. Cà 0 CID »"--. ,...., .0
E -tEL ,... ,_ m • f.:1 , ■ - • , . . 0 E 0 e •-g . :2,-, ce 5,, -0 -,-, - cci ... g t
0 t•-% -rd .- 0 Cl) b
Qo n cr.• cl) __ .2
c , c u = 0 e; .:12 _,0 •`/' .14 . «1 -.1 ..c ,,t11 o o •I') „ = 7.=
az 0 0 .0 . . e 4., ---. = T ..E ., . © no A >,.‘'g 'e 0 -e. 0 e e - c+. ^0 v, ...• 0
..a. t o„
o 0 1"-g < _g -o .8
g *'5' . 14 tu -e ' 3 0 nt › •= -■ c -0 ..-■ .= ,..o 0. ;, ca 0 >, ,, - p., • - ,„ ..g -0 -r, - E .... .5.5 6. E ' E P
..ée 15 _ g ,_ -. 0- >, 2 -o ... -o ..0 _0 •03 e c.,...., . .>. 0
! ! - : . • . 1-1 c : ‘ 0 : ± li. 5-e n: - ": ....;:: : c ):1 2 ...-...: •-• .o ' 1.4 -o tr-1 w a> 0
0 a> ,..c.)
E ..= 0 L,2 a) f-, 0 """‘ a •-•
Q
ee E ue _t>2 0.) e •-
eu cn cy -c,1 té. ... t,l) P v;
› ••'• e'
40 = 0 Q .•-• '-' 1:e 5." 'ce+ °A :5 ......; ci) cu .,... (à
- o rd a) g 0 y, -, el _ F.... ...W.
•ir. 0 c°, 0 W -'-. cu - 7i *-• > g x . In. o - . '„E .-a 0 .z. 4,...,... •- • .à.._.
g. e 4.4 ,.., 4, ee 0 01) E -el ,.L , a) a (a) 40. f, v, .= .0 Q 0 `1. •`) ..c9 2 ..•- s ...---.'" .9 ob") '§«
..= •-■ c 0
c-) e !•-■ ccs > t'A ° E 'es «-E- e, "'Ce- i >4 -cr, = 4,5 e. . - e - 4.) ,-4, 0 0 = ;g -0 u 0 f, ›.., e ''' Q •=1 ta
0 0 ,....1 0 , e â < 0 - . .--L5 0 0 •,-. ,t) - ci) tu _ , ....., _c _ o i- ,t- g .,...- E î E ..u. ›, a.) $.. i‘i
a '„, i'...'
Q id) ^,,,,
0,) 1. v, 0 -0 ...0 to dû • .. -,7,. t, „, ■-■ = O. ',E .> o '-' o ‹ < 'c.] e -c - X n .12_ E-1) -e't ii „, ,, e CU . =
•• 0 F. •.•
:L.-3. r.a . CeA eZ, rz: ED,- g, c'5.2 e e ., 0 0.):e•4:1 4) 41 mcw>zekou E-( A E-■ ''A'' C e, 8 •• ci, -?) - .c7› ° 8
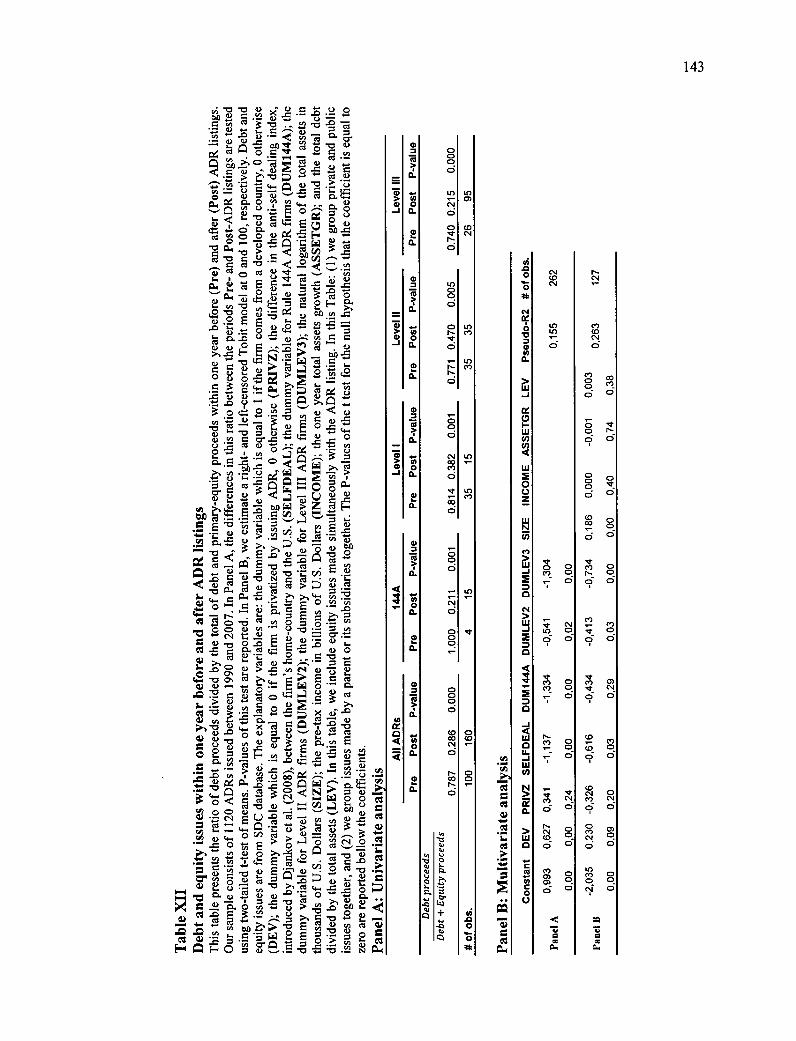
C•1
10
0.7
40
0.21
5 >
o Q.
Q.
0 Q.
Q.
4 Q.
Q.
cc
o Q.
o r•-e
e o.
0
PRIV
Z S
ELFD
EA
L D
UM
14
4A
DU
MLE
V2
DU
MLE
V3
SIZ
E I
NC
OM
E A
SS
ETG
R LE
V P
seu
do-R
2 #
of
obs
.
P- o, 0 Q
o o Q
C)
Pane
l B: M
ulti
vari
ate
anal
ysis
co
'et 9
cl 0 9 d'
C) •cr Si 6
co co
°
CO N
N
0) Q
C') Q
to o ci
c7e
ci
143
uj -0 0 '•-•' 0 0 tm <0 0 .0 Il f. •- -0 •-■ - .0 0 .... 2 •■-' e... c ;-■ ri, - = g cie ..c 0.) -• - .,ee 47> - to., 0-. :- g ezi -.e. uLort E 0 -0 u
- • • .-i •--
< o u •-• c*.:,.).. a, ci.) -0 ._ C) •-■ ..= 0 ee eu o eu »----' ,... eu 00...
ni; 0 :-. 'L:g _. : CD: 7....,.: 71)
....., tà#5., o ..--,
cu ,,, e 0 0 •,L - [-, -
-0 > ...IQ vi g •zi 0 g rj•I ,.... -..,
= CCI
k.. 1 ..... ° •ct" 5 -•
ok■ LI.,,) e E
'-' '-' I. ,n -o
u u-c' .." ..= ,nee ..=e ="c c. 0 .° EE
e-> 7-.. ,1) ,:-:,. ,n o o o o 0 N su te .= .5 w e o r e c o ,,, .:i• 0
....5 u > - ..... ,... .,.,. , e>, ... - clà
. .....
.0 0 0 à "‘ o cA o cn = u G.)
.; te •"' '0 ‘01 = u
-t -C
e' à ' Tu' Ê e eu ,_, 0 no o eu 4 0 ., 4 -5,„, eu . m uo- .3 --,.., '-; và 4)
0 :3 eu . e =)
,l'àcuURE CD g ta.
oi, .,...E .-enc, „E ».....,CA A) e• E-' -.e; o tn u ° e ,,, u • -, 4.. - z 15
r... ..... 3 >s . ID> , '-'4, _o -0'n • 4:3) g ... la -0 4.1 r.0.3 E •P 0 <1. • VI à
•eCu.25 > 0) -o r:1-• ‘. ° 't-",',1"" e e :•,7,- 4) . b *e •p_
s.1-1 - N. cs.. E E o e <0 -0 n vl 0
"0 0 g,' .e 0, • :.E eu cu := es. •-
g. ,,,, E . CU •,-: s- m o -=:•- e e Sm _0 cr,C0 0 > .0 0 ri a) -5 2
CZ g- le
c,) ,n 0 •7•-• t ;Z.1 0 ''''' CA. •IM :CS 0 0 ru <0, te 2 e. . ,...
e +2. f, cu cn "E
X CI. ..c.1
Q) ••° 0 0 O 5 •-•, cià 1.5 m 61.) 5 -o „, 1.) cr > Cn L,' VI 2
o , ,,e E = u 4 E *.E. ce i... o E-i en tu tu ... a; •-`
C Cl• iii 7,1 _ ,.=•-- ,....r,"° . _ ,e ... • › . .... e i ” «, ee . ;.:, . • • .. uet:,,,,..c. j ce, qw ,..;, 0« e„ •4■) -0 ...,
c•I e-gr-T.10001 -8 ,„ 4 •0 Q =
e o o t)
c.1 c (,,) -0 'rd •-• 0 .M 01 = i.e.,-7' ‘..1e1.Êt veht..e., e ...,...ele z 0 cr) , r0 0 cs. > › )- 0 5.0, C51 0 C, ...
.0 0 tij E o .........- •_. e e .2 en >,..X c-• n ^' 6. e
cr c`g g 1.■i >,.scs .0 s, ii 0 0 ..- •■••• C.
le n >1 CL) CU • •
cl Tz. E .5 „ o o ,,, --■
elet -1:à1: 75r, ._.cl ân i W> 7. E 'e° . 9 l . - ' , , 961' 1
r . ,...■ = = •,,, o. = ... o .> Mn i■i [-■ 0 e .......•.5. -0 .̂.5.■ 'V • 'hl N et4
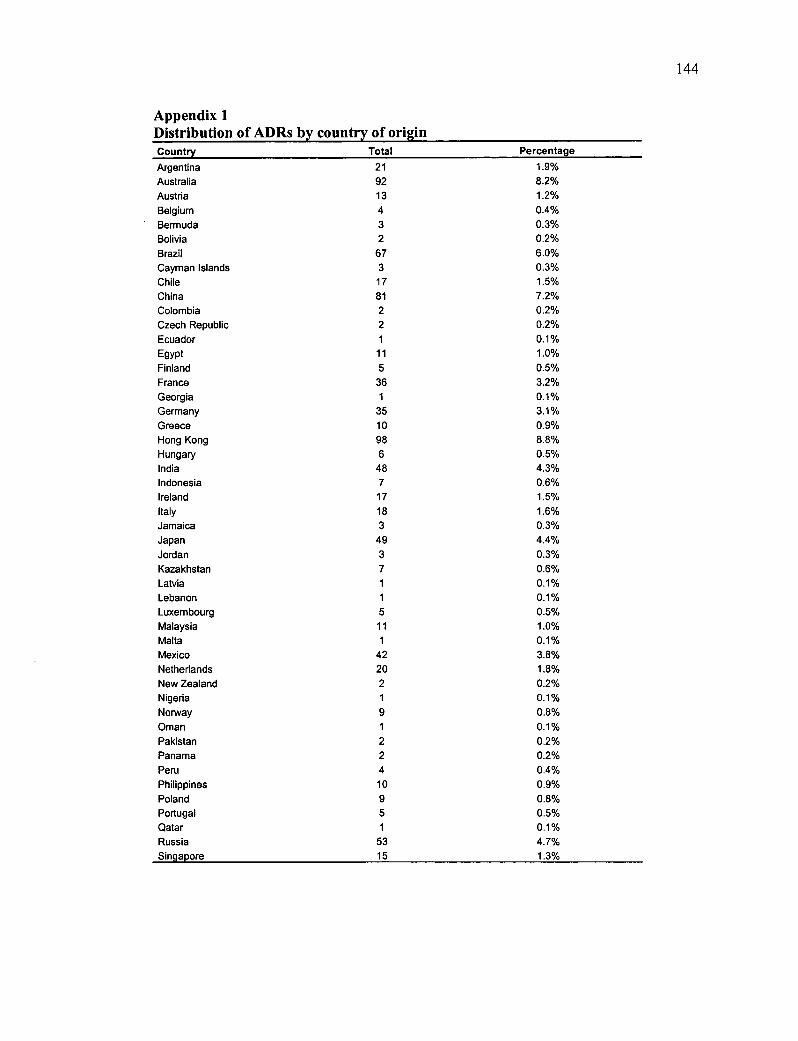
Appendix 1 Distribution of ADRs by country of origin Country Total Percentage
Argentina 21 1.9% Australia 92 8.2% Austria 13 1.2% Belgium 4 0.4% Bermuda 3 0.3% Bolivia 2 0.2% Brazil 67 6.0% Cayman Islands 3 0.3% Chile 17 1.5% China 81 7.2% Colombia 2 0.2% Czech Republic 2 0.2% Ecuador 1 0.1% Egypt 11 1.0% Finland 5 0.5% France 36 3.2% Georgia 1 0.1% Germany 35 3.1% Greece 10 0.9% Hong Kong 98 8.8% Hungary 6 0.5% India 48 4.3% Indonesia 7 0.6% Ireland 17 1.5% Italy 18 1.6% Jamaica 3 0.3% Japan 49 4.4% Jordan 3 0.3% Kazakhstan 7 0.6% Latvia 1 0.1% Lebanon 1 0.1% Luxembourg 5 0.5% Malaysia 11 1.0% Malta 1 0.1% Mexico 42 3.8% Netherlands 20 1.8% New Zealand 2 0.2% Nigeria 1 0.1% Norway 9 0.8% Oman 1 0.1% Pakistan 2 0.2% Panama 2 0.2% Peru 4 0.4% Philippines 10 0.9% Poland 9 0.8% Portugal 5 0.5% Qatar 1 0.1% Russia 53 4.7% Singapore 15 1.3%
144
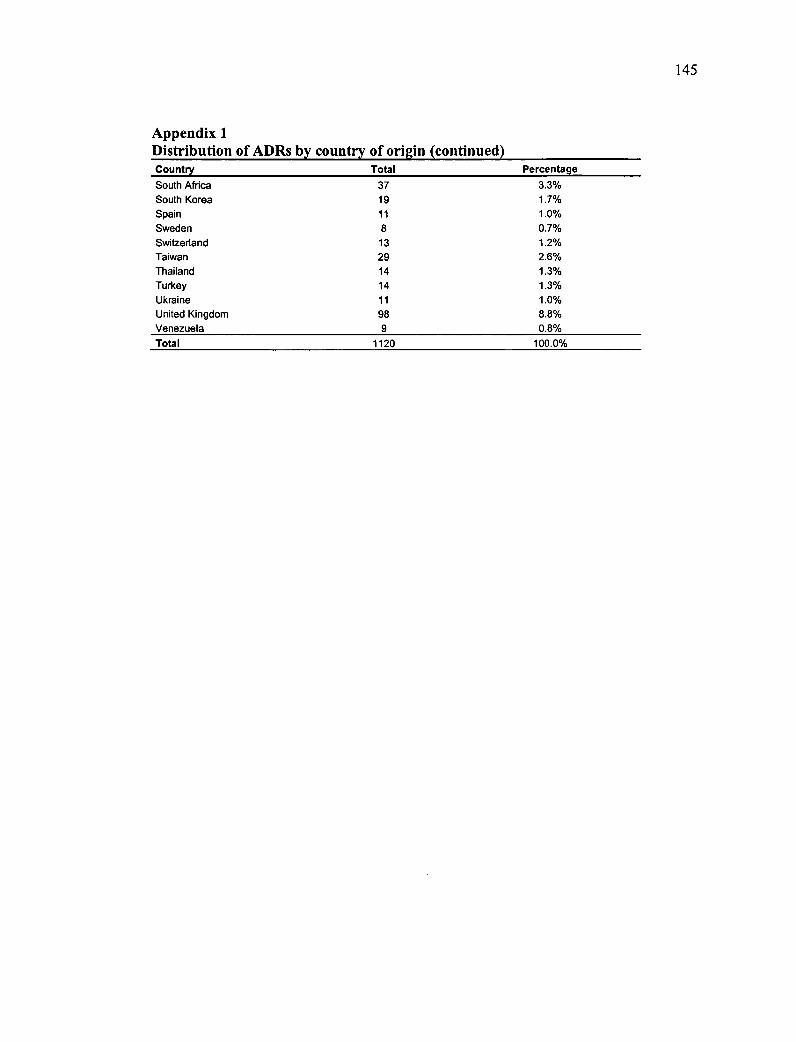
Appendix 1 Distribution of ADRs by country of origin (continued) Country Total Percentage
South Africa 37 3.3% South Korea 19 1.7% Spain 11 1.0% Sweden 8 0.7% Swierland 13 1.2% Taiwan 29 2.6% Thailand 14 1.3% Turkey 14 1.3% Ukraine 11 1.0% United Kingdom 98 8.8% Venezuela 9 0.8% Total 1120 100.0%
145
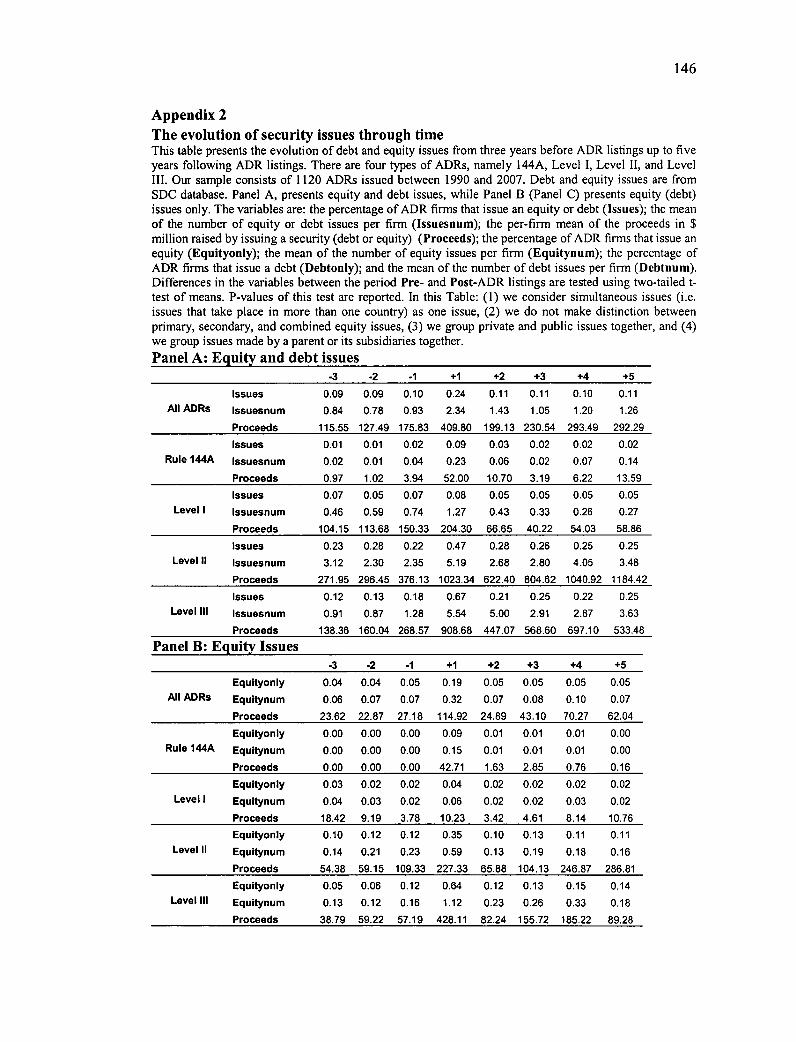
146
Appendix 2 The evolution of security issues through time This table presents the evolution of debt and equity issues from three years before ADR listings up to five years following ADR listings. There are four types of ADRs, namely 144A, Level I, Level II, and Level III. Our sample consists of 1120 ADRs issued between 1990 and 2007. Debt and equity issues are from SDC database. Panel A, presents equity and debt issues, while Panel B (Panel C) presents equity (debt) issues only. The variables are: the percentage of ADR firms that issue an equity or debt (Issues); the mean of the number of equity or debt issues per firm (Issuesnum); the per-firm mean of the proceeds in $ million raised by issuing a security (debt or equity) (Proceeds); the percentage of ADR firms that issue an equity (Equityonly); the mean of the number of equity issues per firm (Equitynum); the percentage of ADR firms that issue a debt (Debtonly); and the mean of the number of debt issues per firm (Debtnum). Differences in the variables between the period Pre- and Post-ADR listings are tested using two-tailed t-test of means. P-values of this test are reported. In this Table: (1) we consider simultaneous issues (i.e. issues that take place in more than one country) as one issue, (2) we do flot make distinction between primary, secondary, and combined equity issues, (3) we group private and public issues together, and (4) we group issues made by a parent or its subsidiaries together. Panel A: Equity and debt issues
-3 -2 -1 +1 +2 +3 +4 +5
Ali ADRs Issues
Issuesnum
0.09
0.84
0.09
0.78
0.10
0.93
0.24
2.34
0.11
1.43
0.11
1.05
0.10 1.20
0.11 1.26
Proceeds 115.55 127.49 175.83 409.80 199.13 230.54 293.49 292.29
Issues 0.01 0.01 0.02 0.09 0.03 0.02 0.02 0.02 Rule 144A Issuesnum 0.02 0.01 0.04 0.23 0.06 0.02 0.07 0.14
Proceeds 0.97 1.02 3.94 52.00 10.70 3.19 6.22 13.59
Issues 0.07 0.05 0.07 0.08 0.05 0.05 0.05 0.05 Level I Issuesnum 0.46 0.59 0.74 1.27 0.43 0.33 0.26 0.27
Proceeds 104.15 113.68 150.33 204.30 66.65 40.22 54.03 58.86
Issues 0.23 0.28 0.22 0.47 0.28 0.26 0.25 0.25 Level II Issuesnum 3.12 2.30 2.35 5.19 2.68 2.80 4.05 3.48
Proceeds 271.95 296.45 376.13 1023.34 622.40 804.62 1040.92 1184.42
Issues 0.12 0.13 0.18 0.67 0.21 0.25 0.22 0.25 Level Ill Issuesnum 0.91 0.87 1.28 5.54 5.00 2.91 2.87 3.63
Proceeds 138.36 160.04 268.57 908.68 447.07 568.60 697.10 533.48
Panel B: Equity Issues -3 -2 -1 +1 +2 +3 +4 +5
Equityonly 0.04 0.04 0.05 0.19 0.05 0.05 0.05 0.05 Ail ADRs Equitynum 0.06 0.07 0.07 0.32 0.07 0.08 0.10 0.07
Proceeds 23.62 22.87 27.18 114.92 24.89 43.10 70.27 62.04
Equityonly 0.00 0.00 0.00 0.09 0.01 0.01 0.01 0.00 Rule 144A Equitynum 0.00 0.00 0.00 0.15 0.01 0.01 0.01 0.00
Proceeds 0.00 0.00 0.00 42.71 1.63 2.85 0.76 0.16
Equityonly 0.03 0.02 0.02 0.04 0.02 0.02 0.02 0.02 Level I Equitynum 0.04 0.03 0.02 0.06 0.02 0.02 0.03 0.02
Proceeds 18.42 9.19 3.78 10.23 3.42 4.61 8.14 10.76 Equltyonly 0.10 0.12 0.12 0.35 0.10 0.13 0.11 0.11
Level II Equitynum 0.14 0.21 0.23 0.59 0.13 0.19 0.18 0.16
Proceeds 54.38 59.15 109.33 227.33 65.88 104.13 246.87 286.81
Equityonly 0.05 0.06 0.12 0.64 0.12 0.13 0.15 0.14 Level Ill Equitynum 0.13 0.12 0.16 1.12 0.23 0.26 0.33 0.18
Proceeds 38.79 59.22 57.19 428.11 82.24 155.72 185.22 89.28
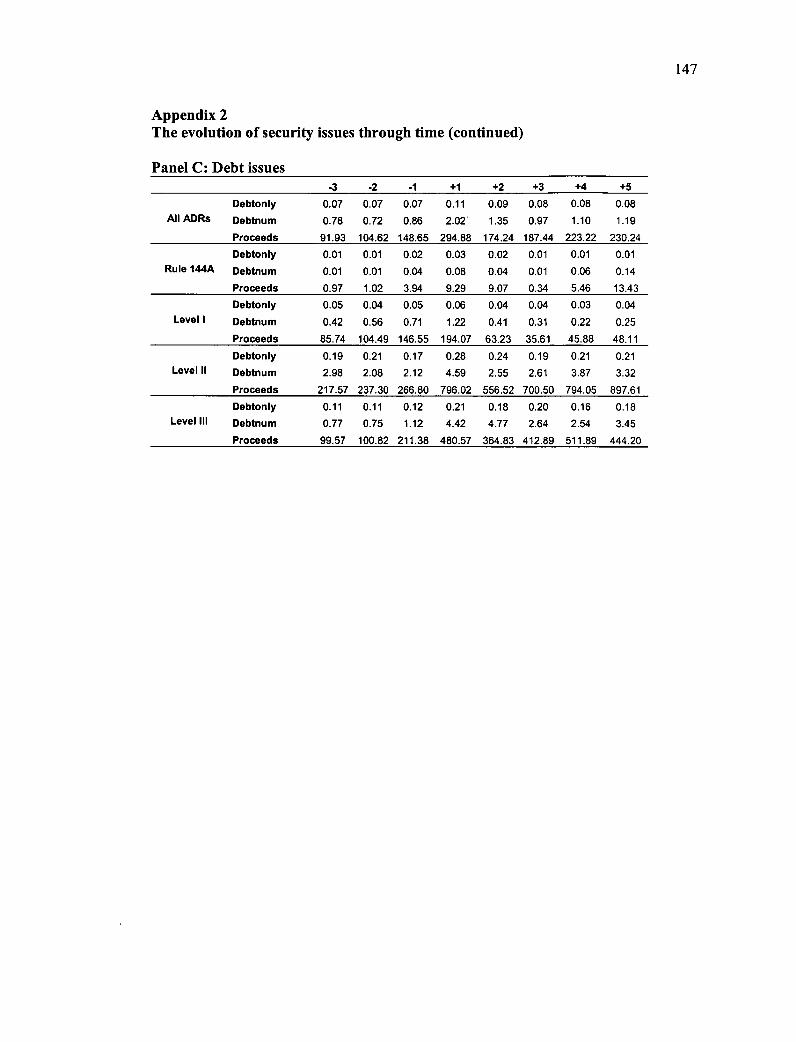
Appendix 2 The evolution of security issues through time (continued)
Panel C: Debt issues -3 -2 -1 +1 +2 +3 +4 +5
Ail ADRs Debtonly
Debtnum
0.07
0.78
0.07
0.72
0.07
0.86
0.11
2.02
0.09
1.35
0.08
0.97
0.08
1.10
0.08
1.19
Proceeds 91.93 104.62 148.65 294.88 174.24 187.44 223.22 230.24
Debtonly 0.01 0.01 0.02 0.03 0.02 0.01 0.01 0.01 Rule 144A Debtnum 0.01 0.01 0.04 0.08 0.04 0.01 0.06 0.14
Proceeds 0.97 1.02 3.94 9.29 9.07 0.34 5.46 13.43 Debtonly 0.05 0.04 0.05 0.06 0.04 0.04 0.03 0.04
Level I Debtnum 0.42 0.56 0.71 1.22 0.41 0.31 0.22 0.25
Proceeds 85.74 104.49 146.55 194.07 63.23 35.61 45.88 48.11 Debtonly 0.19 0.21 0.17 0.28 0.24 0.19 0.21 0.21
Level II Debtnum 2.98 2.08 2.12 4.59 2.55 2.61 3.87 3.32
Proceeds 217.57 237.30 266.80 796.02 556.52 700.50 794.05 897.61 Debtonly 0.11 0.11 0.12 0.21 0.18 0.20 0.16 0.18
Level III Debtnum 0.77 0.75 1.12 4.42 4.77 2.64 2.54 3.45 Proceeds 99.57 100.82 211.38 480.57 364.83 412.89 511.89 444.20
147
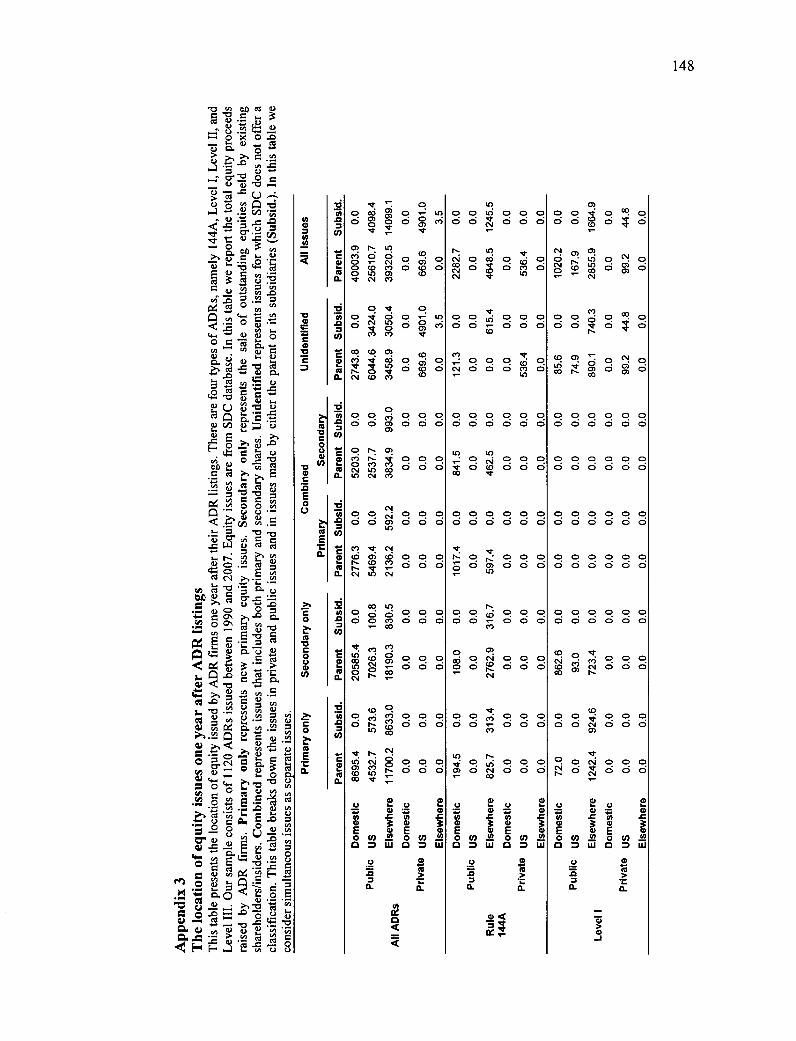
co O d cl o
ci g>, ci CO
7.s
Else
whe
re
Else
whe
re
0 o co Cl D
o os co. Q o •-
cc:I.icocoo
C•1
cr) o o o ‘- d ci à oo O
g•-
CO LO OD
0 0 0 0 N- d d à
o o d d ci
Q O
0 nt. osiooz; csi
g c9-i d °)„,. c0 0, CD
,cr 4 'nec; r- (o
co O ‘r
co Q o à o d
3932
0.5 1
4099.1
o cc; ci 00>
C) d co O (o O
C•I
o Q. 0 d d a)
o o Q d d
csj000 04,c, 0 Q 0
0 0 d d
‘e. ooc0000 CO tn") ci d
Cs1 u, eg
co ,c;do 0 o 0 o gi ci g;
CO
CO
o Cs)
o c? co os cl o 0 co
Else
whe
re
0 0 0 d d à
0i ci ci „I: 0 .0. d
0,. LID o cl 0
CNI CO i° 0, co C•1
oc4do cgo Q d d -4- d
.00ocdoo oodddd
0000dd ociddcid
000000 oodddd
000000 ociciddà
cd00000 o o d ci ci ci
CO 0 sr
CsiCD C■le; CiC> co
co Q d° • cl. d° cd° d°
-cr gocNi000
o ci d ci
71)
o
0 0 O ci
148
o
a.
'c7) .0
o 10 O.
.o
.C12 CO o.
-ci in da
o (a o.
si .o
:d (7) .o
o
o o co ‘c7, d d d co •-
o • 000co oodddd
.o .00cd ■71-diicidd u,s:r
oc00000 Q cm ddàd
0 0 d o os 0 o d d
r-- ,,:o us000 cpcocNddci
d) .(J
ei 0 .c _ .1.7) a) .c o % 0 e E CI) E o cl (ô tri ô cg tri
Q o = .o fo > o -r. o. a.
< 3 4
ci
0 0 Ole c000 ci à 't ci ci ci
csicocOo • (Nc° d d or
•4-
0 0 0 0 d à c•r:. à à ci
Unid
endf
ied
cl
o O
cl
h. o.
Seco
ndar
y on
l
"0 V) On 0
g 73. e 0., - CL)
2 ;< 0 .d 71)‘
t cr o
Q -0 .4
•—■ c...) > ...Il CID
••
"zr -c
o 3 bo >, .cu 15 1- E cl 3 o e
ejo ci) ci)
4.-'00.)• el """ Q CU 0
0 C $-•
"0 â 0 Cl. ..0e1
0 ee 4-1'0
u - -o *E v)
Q g • ›-• CA F. 0 CU
o -o ele cl) cn C â E
cn , el col :—• = 'Cl •sj %) ee `4' g e cn o cn
Q p cx c. .•
. — , . .—
I-. Qcl g 0
0 c::, . CA ,.., CU
Ce CD w e E cl c-4 >..... cn e... z -9 -F.." a. •—•
m . 'B' a. 0 te là ,,- c r _c •-
0 "-' .-75 le . là o .2) =
._..e. ,o,
e Ê 5 -g 3
f, F,
01 „7.,. ? .. . . , .,-..., ‹ ee .0 0
-= 0- c. .5 c .o „, 3
e., -0 . cl M . e ...,2 e, ›,
..- c >• ..`e Q E 3 0
o e. to
•B. o — ‘,..1 E e (1.) 0 u P> a.
'"" ■-. o Q 4. = 0 (4.. ?'• .0 "CS tle,)
C ..W .C.:0e2E cle
' 0 0 .1 il0-d . 0=e p.i. ": r 17:1E .ove Mcn
..... cl- - . ,.„ 0 t. a) cz e E -0 cL) c «, o co> •i _ c frà r, . Q .5 -...
- •L1 'I"
o 0.0 15 2 .9 _. >, -0 -te, c. = 0 ..g ■•••■ .0 --. c.) i... 0 ,_„ 01 ■-■ 0 tz..... tu
•-• — "D .0 . ne b... 0 rA CL)tu 0 cU)j
. e. A .
‹ E-ci E- ■...J " i! c9J T.') g
;
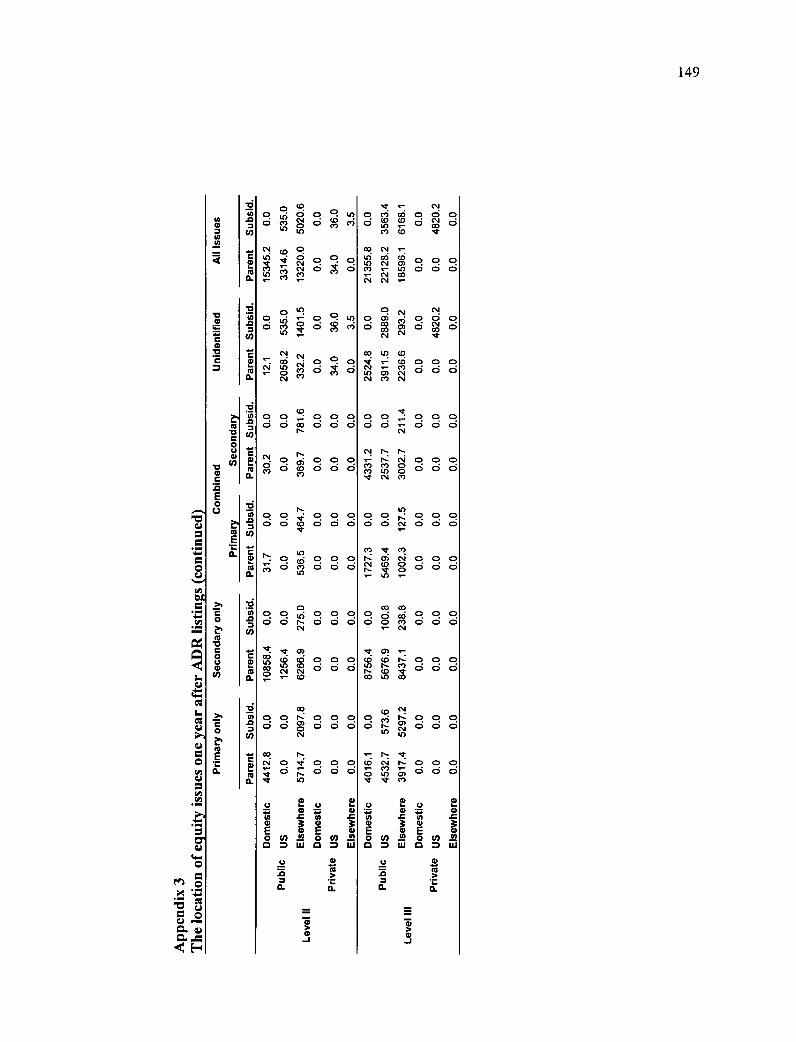
co cl '- tri co cri Cr) CNI à 0 0 0 CO c•zi d d d d ‘- co Cs4 CY 1—
0
CNJ
0 eN1
Csi
r"«.. o •-• cci 0. m000
•— CNJ O cd o d ci
co C■1 CO
CO 7) d se
Unid
entif
ied o
o . tri ci ri ° ci° CO ri
Csl 0 CN 0 •Q cci d d
ro oo -000 d ci i; d d d
0 0 0 0 0 cicoddd
0 0 OiC
■1 ei a d a
CNI C° ci co ci co (N (N st
CO CO. CO à 0 0 0
C"I ,,e) ci ci ci CSI eSI
o r-
o o o o o ci ci ro ci ci ci
0 dO,
C:i 1•••• 0 0 0 e■I
St 0) d • • Lo CO CO 0 0 0 CO in <0 d d d 0 C•1 Csi
Ce)
oz) oon000 d ci ci ci ci
co o o o o d d d d
C) cv
N: 0 d a a dd dd
c.:1 a o a eV CD 0 d Ci Ci st 0 .—
co co o cd o o doricidd
Cse
•rt .-- cri cri o a Lo I.- ri ci ci ci CO d CD
CO Cse 0 ej 0 Ci 0 dncidd
inr`l
h. nt cric■in000
Le) 0) 'O' ‘1"
..r.co ..r... fo . 0 t: . o o E
o E d oe o E
3 o u) o co o u) 0 o ci) s 0 D 0 D 0 D ILI 0 D Lil
da > = .C.. = o. a Q.
Seco
nda
ry o
nly
car a
fter
AD
R li
stin
Pare
nt
Subs
id.
Pare
nt S
ubs
id.
in .0 (f)
co
CO 0.
-ci in
122 ta û.
(1). 0 mi 0 0 o c, Csi
Le) d po a
ese
g
0 o o
ci g 0
Z•3
149
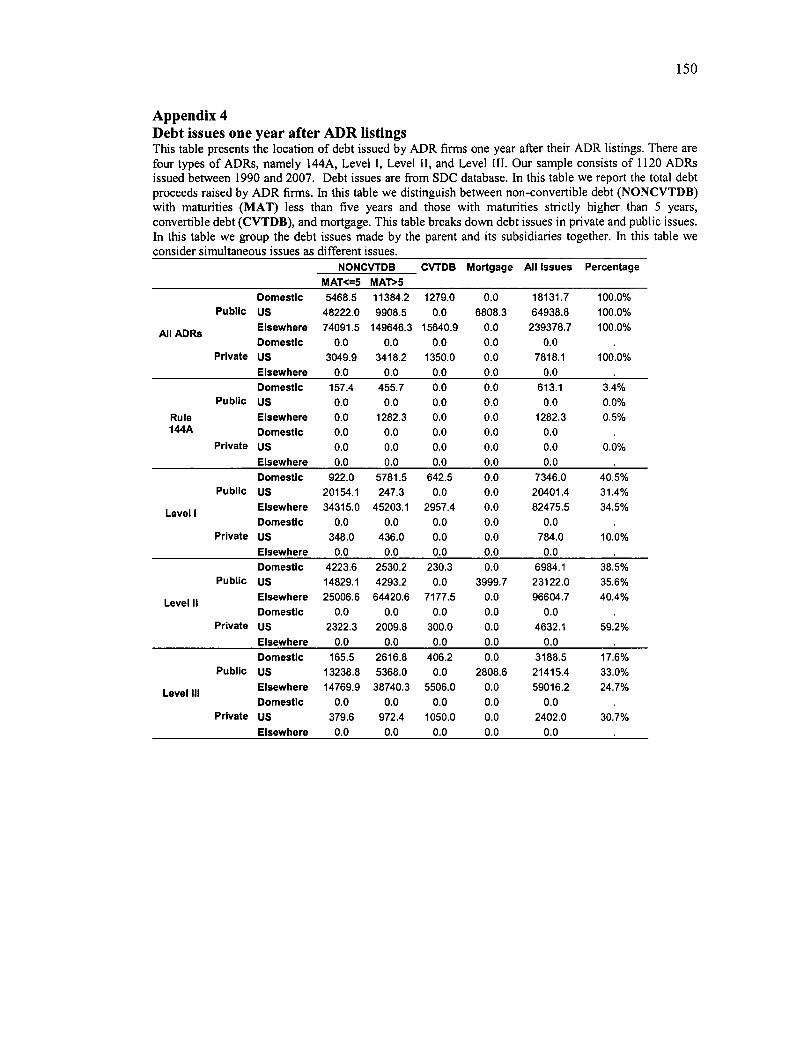
150
Appendix 4 Debt issues one year after ADR listings This table presents the location of debt issued by ADR firms one year after their ADR listings. There are four types of ADRs, namely 144A, Level I, Level II, and Level III. Our sample consists of 1120 ADRs issued between 1990 and 2007. Debt issues are from SDC database. In this table we report the total debt proceeds raised by ADR firms. In this table we distinguish between non-convertible debt (NONCVTDB) with maturities (MAT) less than five years and those with maturities strictly higher than 5 years, convertible debt (CVTDB), and mortgage. This table breaks down debt issues in private and public issues. In this table we group the debt issues made by the parent and its subsidiaries together. In this table we consider simultaneous issues as different issues.
NONCVTDB CVTDB Mortgage Ail issues Percentage MAT<=5 MAT>5
Ail ADFts
Public
Private
Domestic US Elsewhere Domestic US Elsewhere
5468.5 48222.0 74091.5
0.0 3049.9
0.0
11384.2 9908.5
149646.3 0.0
3418.2 0.0
1279.0 0.0
15640.9 0.0
1350.0 0.0
0.0 6808.3
0.0 0.0 0.0 0.0
18131.7 64938.8
239378.7 0.0
7818.1 0.0
100.0% 100.0% 100.0%
100.0%
Domestic 157.4 455.7 0.0 0.0 613.1 3.4% Public US 0.0 0.0 0.0 0.0 0.0 0.0%
Rule Elsewhere 0.0 1282.3 0.0 0.0 1282.3 0.5% 144A DomestIc 0.0 0.0 0.0 0.0 0.0
Private US 0.0 0.0 0.0 0.0 0.0 0.0% Elsewhere 0.0 0.0 0.0 0.0 0.0 Domestic 922.0 5781.5 642.5 0.0 7346.0 40.5%
Public US 20154.1 247.3 0.0 0.0 20401.4 31.4%
Level I Elsewhere 34315.0 45203.1 2957.4 0.0 82475.5 34.5% Domestic 0.0 0.0 0.0 0.0 0.0
Private US 348.0 436.0 0.0 0.0 784.0 10.0% Elsewhere 0.0 0.0 0.0 0.0 0.0 Domestic 4223.6 2530.2 230.3 0.0 6984.1 38.5%
Public US 14829.1 4293.2 0.0 3999.7 23122.0 35.6%
Level II Elsewhere 25006.6 64420.6 7177.5 0.0 96604.7 40.4% Domestic 0.0 0.0 0.0 0.0 0.0
Private us 2322.3 2009.8 300.0 0.0 4632.1 59.2% Elsewhere 0.0 0.0 0.0 0.0 0.0 Domestic 165.5 2616.8 406.2 0.0 3188.5 17.6%
Public US 13238.8 5368.0 0.0 2808.6 21415.4 33.0%
Level III Eisewhere 14769.9 38740.3 5506.0 0.0 59016.2 24.7% Domestic 0.0 0.0 0.0 0.0 0.0
Private US 379.6 972.4 1050.0 0.0 2402.0 30.7% Elsewhere 0.0 0.0 0.0 0.0 0.0

Conclusion générale
152
Les ADRs ont pris beaucoup d'importance ces dernières années aussi bien à travers leur
nombre qui n'a cessé de croître que par les fonds levés à travers ces certificats de dépôts
américains. Dans le but de mieux comprendre les mécanismes sous-jacents à l'émission
de ces certificats et le rôle que jouaient ces certificats pour lever des fonds à travers le
monde, nous nous sommes intéressés dans cette thèse à examiner la décision d'émettre
un programme d'ADR et les décisions subséquentes de lever des capitaux dans l'année
qui suit l'émission de ces certificats de dépôts.
Dans le premier papier, nous avons examiné les déterminants de la décision d'émettre
un ADR parmi les quatre programmes disponibles (programmes I, II, HI et Règle 144A)
et nous avons montré que les caractéristiques des firmes et les variables institutionnelles
conditionnent le choix d'un programme spécifique d'ADR. Ce résultat suggère que les
gestionnaires/actionnaires qui décident de lister leurs firmes étrangères sur les marchés
américains via les ADRs choisissent le programme qui correspond le mieux à leurs
caractéristiques et à leurs objectifs. En examinant ce choix pour la période avant et après
SOX, nous avons trouvé que les firmes étrangères vont préférer des programmes
d'ADRs plutôt que d'autres. En effet, après SOX, il y a eu effectivement une
réallocation des programmes d'ADRs et aussi nous avons trouvé que les firmes issues
des marchés émergents et des pays où la protection des actionnaires minoritaires est
faible vont plutôt choisir les ADRs sous la Règle 144A et le niveau III respectivement.
Ces résultats montrent bien que SOX a certes apporté de nouveaux coûts liés à la
conformité avec ses lois, mais il y a encore des firmes qui peuvent tirer avantage de leur
listing sur les niveaux d'ADRs les plus contraignants, spécialement le niveau III.
153
Dans le deuxième papier, nous avons examiné le lien entre les caractéristiques des
firmes qui ont émis des ADRs et leurs choix subséquents du titre à émettre (dette ou
capitaux propres) et du marché sur lequel ces émissions ont eu lieu. Nous avons montré
que les firmes étrangères accroissent leurs émissions de la dette et des capitaux propres
après l'émission d'ADRs et ce principalement pour les firmes issues des marchés
émergents, ce qui montre qu'effectivement la levée des capitaux est parmi les
principales motivations de se lister à l'étranger. En outre, nous avons trouvé que les
firmes issues des marchés émergents augmentent la proportion des émissions primaires
par rapport à leurs émissions secondaires après leurs listings et que les firmes de grande
taille vont plutôt émettre de la dette que d'émettre des capitaux propres. Après SOX,
nous avons montré que les firmes issues des marchés émergents, listés sous les
programmes niveau III et Règle 144A, émettent plus de capitaux propres durant cette
période en comparaison avec la période avant SOX et que les firmes qui choisissent le
niveau III après SOX vont recourir plus aux capitaux propres américains après leurs
listings. Finalement, nous avons montré que les émissions primaires constituent la
principale source de financement pour les firmes étrangères après leur émission d'ADRs
et ce spécialement pour les firmes issues des marchés émergents.
En conclusion, dans cette thèse on a examiné une décision majeure dans la vie d'une
entreprise, à savoir se lister sur un marché étranger. Cette décision a un grand impact
aussi bien au niveau de la firme qu'au niveau de son pays d'origine. En effet, au niveau
de la firme cette décision affecte l'environnement informationnel, la gouvernance et le
mode de gestion au sein de cette firme, ce qui va surtout conditionner sa politique de
financement et les ressources disponibles pour financer ses opportunités de croissance.
154
On peut donc s'attendre à ce que cette décision ait un impact sur l'expansion, la
croissance et le positionnement international de cette firme.
Au niveau de son pays d'origine, cette décision permet de multiplier les ressources pour
financer les opportunités de croissance de la firme listée, favorisant la croissance et le
développement de la firme et en conséquence contribuant au développement
économique de son pays d'origine. En outre, le listing d'une firme à l'étranger
contribuera à l'intégration du marché de capitaux de son pays d'origine au sein du
marché mondial de capitaux.
Finalement, le développement de ces firmes incitera d'autres firmes du même pays à
s'engager à améliorer leur gouvernance et à mieux protéger leurs actionnaires et en
conséquence à suivre la trace de ces firmes pour ensuite accéder à des sources de fonds
importantes, leur permettant de croître et donc de contribuer davantage aux
développements économique et financier de leur pays d'origine.


