Adsorption and Desorption of Methylene Blue on Porous
Carbon Monoliths and Nanocrystalline Cellulose Xiaoyun He,
Keith B. Male,
Pavel N. Nesterenko,
Dermot Brabazon,
Brett Paull,
and John H.T. Luong
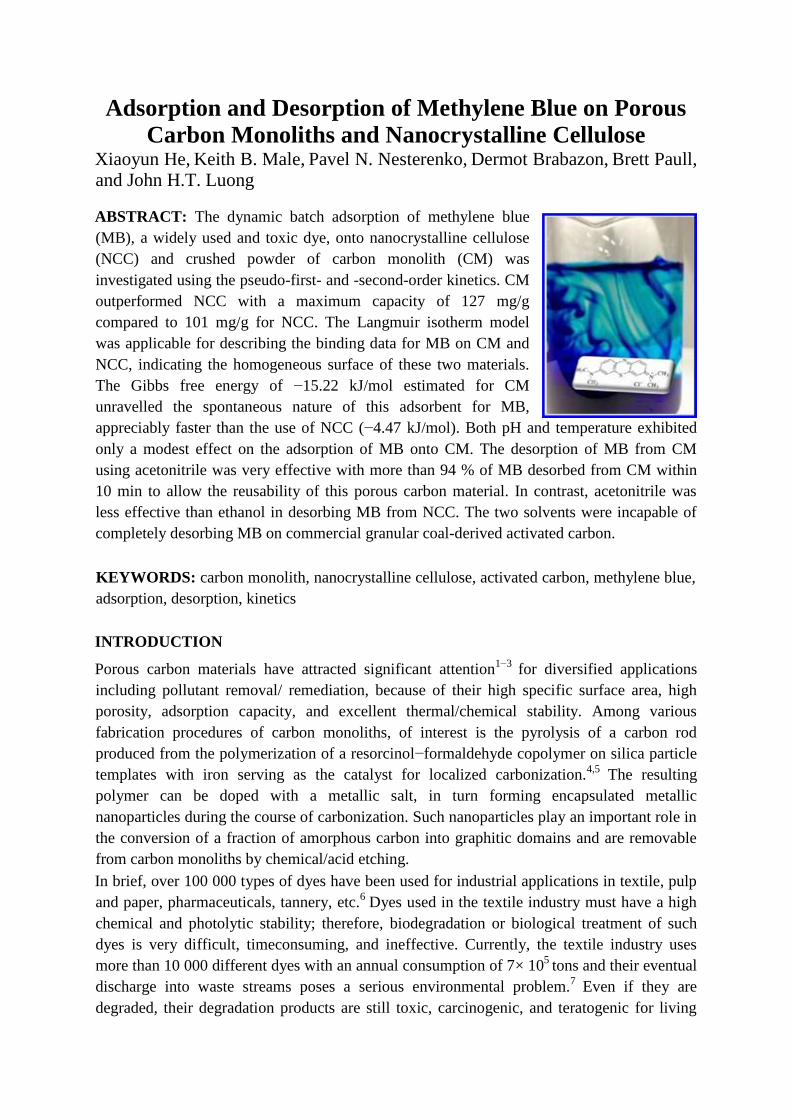
ABSTRACT: The dynamic batch adsorption of methylene blue
(MB), a widely used and toxic dye, onto nanocrystalline cellulose
(NCC) and crushed powder of carbon monolith (CM) was
investigated using the pseudo-first- and -second-order kinetics. CM
outperformed NCC with a maximum capacity of 127 mg/g
compared to 101 mg/g for NCC. The Langmuir isotherm model
was applicable for describing the binding data for MB on CM and
NCC, indicating the homogeneous surface of these two materials.
The Gibbs free energy of −15.22 kJ/mol estimated for CM
unravelled the spontaneous nature of this adsorbent for MB,
appreciably faster than the use of NCC (−4.47 kJ/mol). Both pH and temperature exhibited
only a modest effect on the adsorption of MB onto CM. The desorption of MB from CM
using acetonitrile was very effective with more than 94 % of MB desorbed from CM within
10 min to allow the reusability of this porous carbon material. In contrast, acetonitrile was
less effective than ethanol in desorbing MB from NCC. The two solvents were incapable of
completely desorbing MB on commercial granular coal-derived activated carbon.
KEYWORDS: carbon monolith, nanocrystalline cellulose, activated carbon, methylene blue,
adsorption, desorption, kinetics
INTRODUCTION
Porous carbon materials have attracted significant attention1−3
for diversified applications
including pollutant removal/ remediation, because of their high specific surface area, high
porosity, adsorption capacity, and excellent thermal/chemical stability. Among various
fabrication procedures of carbon monoliths, of interest is the pyrolysis of a carbon rod
produced from the polymerization of a resorcinol−formaldehyde copolymer on silica particle
templates with iron serving as the catalyst for localized carbonization.4,5
The resulting
polymer can be doped with a metallic salt, in turn forming encapsulated metallic
nanoparticles during the course of carbonization. Such nanoparticles play an important role in
the conversion of a fraction of amorphous carbon into graphitic domains and are removable
from carbon monoliths by chemical/acid etching.
In brief, over 100 000 types of dyes have been used for industrial applications in textile, pulp
and paper, pharmaceuticals, tannery, etc.6
Dyes used in the textile industry must have a high
chemical and photolytic stability; therefore, biodegradation or biological treatment of such
dyes is very difficult, timeconsuming, and ineffective. Currently, the textile industry uses
more than 10 000 different dyes with an annual consumption of 7× 10⁵
tons and their eventual
discharge into waste streams poses a serious environmental problem.7
Even if they are
degraded, their degradation products are still toxic, carcinogenic, and teratogenic for living
organisms.8
Besides the undesirable color, their breakdown products also exhibit a mutagenic
or carcinogenic effect on human beings and their ingestion can cause severe damage to
organisms. Several methods have been attempted to remove or remediate dyecontaminated
wastes and adsorption is a low-cost and effective method for the removal of dyes from
aqueous solutions.
Various organic and inorganic adsorbents including modified graphite powder and emerging
carbon nanotubes have been attempted for the removal of organic dyes from aqueous waste
waters. However, such adsorbents usually suffer from difficulties in the regeneration and
separation from the waste stream. In particular, activated carbon with high surface areas
(700−1500 m2/g) is highly effective for the removal of dyes, pigments, and other
inorganic/organic pollutants. However, activated carbon regeneration typically involves
drying at elevated temperature, i.e., it is costly and causes partial destruction of this material.
As an important basic dye used for printing calico, dyeing cotton and leather, methylene
blue (MB) could cause various harmful effects such as eye burns, irritation to the
gastrointestinal tract and to the skin.9
The article describes the applicability of powdered
monolithic carbon for the removal of MB from solution. Porous CM was synthesized and
characterized to study the adsorption-desorption kinetics and equilibrium isotherms for MB.
Carbon monoliths have been used as the stationary phase for HPLC10,11
or electrode
materials.12
To the best of our knowledge, this study is the first demonstration for the use of
CM to remove this toxic dye and unravel an effective procedure for its regeneration. The
binding capacity and kinetics of this carbon material are also compared with that of
nanocrystalline cellulose13
(NCC), a rod-shaped renewable nanomaterial with exceptional
strength and physicochemical properties that can be prepared from inexpensive renewable
biomass. NCC is virtually nontoxic and poses no serious environmental concerns, providing
impetus for its use in waste water treatment. Although NCC has been developed for a plethora
of diversified applications, its applicability as an effective reusable adsorbent for the removal
of organic pollutants, dyes, etc. has not been demonstrated. For comparison, commercial
activated carbon is also included in this study.
MATERIALS AND METHODS
Carbon monolith (CM) was prepared using the same grade of silica gel as the template. More
detailed information on the fabrication of CM can be found elsewhere.10−12
Granular coal-
based activated carbon (AquaSorb 2000) was obtained from Jacobi Carbons (Birkenhead,
UK). This activated carbon material has a surface area of 1100 m2/g (BET, N2). The NCC
used in this study was produced by hydrolysis of microcrystalline cellulose (MCC, Sigma) in
1 M ammonium persulfate, APS, (FMC Industrial Chemicals, Philadelphia, PA) as previously
reported by our group.13,14
The starting biomass material MCC (10 g) was added to 1 L of 1M
APS solution (conductivity 230 mS/cm). The suspension was heated to 60 °C for 16 h,
resulting in a white NCC suspension. After centrifugation at 12000 rpm, RCF = 22 100 for 10
min, the supernatant was decanted, and 1 L of water was added to the NCC pellet, followed
by 5 min of vigorous mixing and repeated centrifugation. After 4−5 repeated
centrifugation/washing cycles, the solution conductivity approached that of deionized water,
∼5 μS/cm (pH ). The final pellet was reconstituted in 100 mL of deionized water and
lyophilized to yield a white powder.
Instrumentation and Characterization. High-resolution scanning electron microscopy
(SEM) micrographs of the prepared monolithic materials were obtained using a field-
emission Hitachi S5500 (FE-SEM) (Dallas, TX) at an accelerating voltage of 10−20 kV.
High-resolution imaging for such carbon materials was also performed by using a JOEL
JEM-2100 LaB6 transmission electron microscope (TEM) (Tokyo, Japan) operated at 200 kV.
The samples for TEM measurements were suspended in 2-propanol and dropped onto holey
carbon-coated copper grids. For NCC imaging, low-voltage transmission electron
micrographs were obtained by a Delong LVEM (Soquelec, Montreal, QC, Canada) low-
voltage TEM operating at 5 kV. A small amount of NCC material (10 mg) was suspended in
water (10 mL) and sonicated to disperse the material. A 4 μL drop of welldispersed
suspension was then dried on a Formvar-carbon-coated grid and analyzed. Measurements
were made using QCapture Pro Version 6.0 software and statistical analysis was performed
using GraphPad InStat Version 3.06 software. Atomic force microscopy (AFM) micrographs
of the prepared NCC were obtained using a Nanoscope IV (Digital Instruments, Veeco, Santa
Barbara, CA) with a silicon tip operated in tapping mode with a silicon cantilever (MPP-
11100, spring constant ∼40 N/m, resonance frequency ∼300 kHz, NanoDevices, CA) at scan
rates of 0.5 Hz with 512 × 512 pixels
A Micromeritics TriStar II 3020 surface area analyzer, (Norcross, GA) was used to measure
the specific surface area and the pore volume using the nitrogen adsorption/desorption
technique. The Raman spectrum was obtained on a Horiba Jobin Yvon LabRam800HR with a
CCD detector (Edison, NJ). The argon ion laser used is the Innova 70-C-2 made by Coherent
(Santa Clara, CA). The laser power was 6 mW with excitation wavelength 514.5 nm. A
magnification of ×50 on the objective lens was used to focus the laser beam and collect
backscattering radiation. The exposure time of all spectra recorded was 10 s and each
spectrum was the accumulation of three scans. Thermogravimetric analysis (TGA) was
conducted with an Netzsch STA 449F1 (Netzsch Instruments, Burlington, MA, USA) at a
heating rate of 10 °C/min from room temperature to 600 °C under helium purge gas.
Adsorption Kinetics of Methylene Blue (MB). The adsorption capacity of MB on the
adsorbent is calculated as q = V(Co −Ct)/m, where V is the solution volume, Co is the initial
MB concentration, Ct is the MB concentration in the solution at a given time (t), and m is the
adsorbent mass. The dye used was purchased from Sigma-Aldrich with a molecular weight
∼320 g/mol, corresponding to anhydrous methylene blue. All containers used for methylene
blue solutions were of polypropylene to minimize the dye adsorption. The adsorption kinetics
was investigated using the pseudo-first-order and pseudosecond-order models. The
concentration of active sites on the surface of the adsorbent greatly outnumbers the MB
concentration, i.e., only the dye concentration significantly affects the adsorption rate, so the
reaction behaves more like a first- or second-order reaction ( pseudo ).
For each initial dye concentration (C o), the amounts of MB adsorbed at a given time, qt, can
be related to Ct as shown in Table 1.
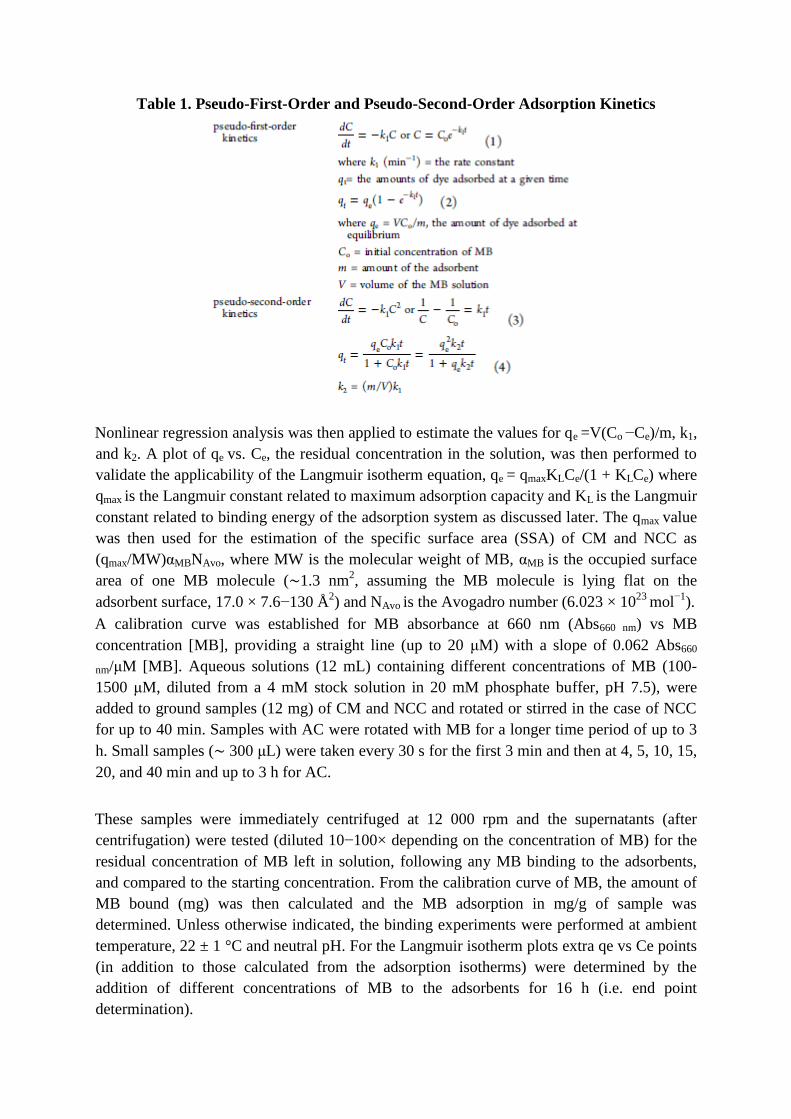
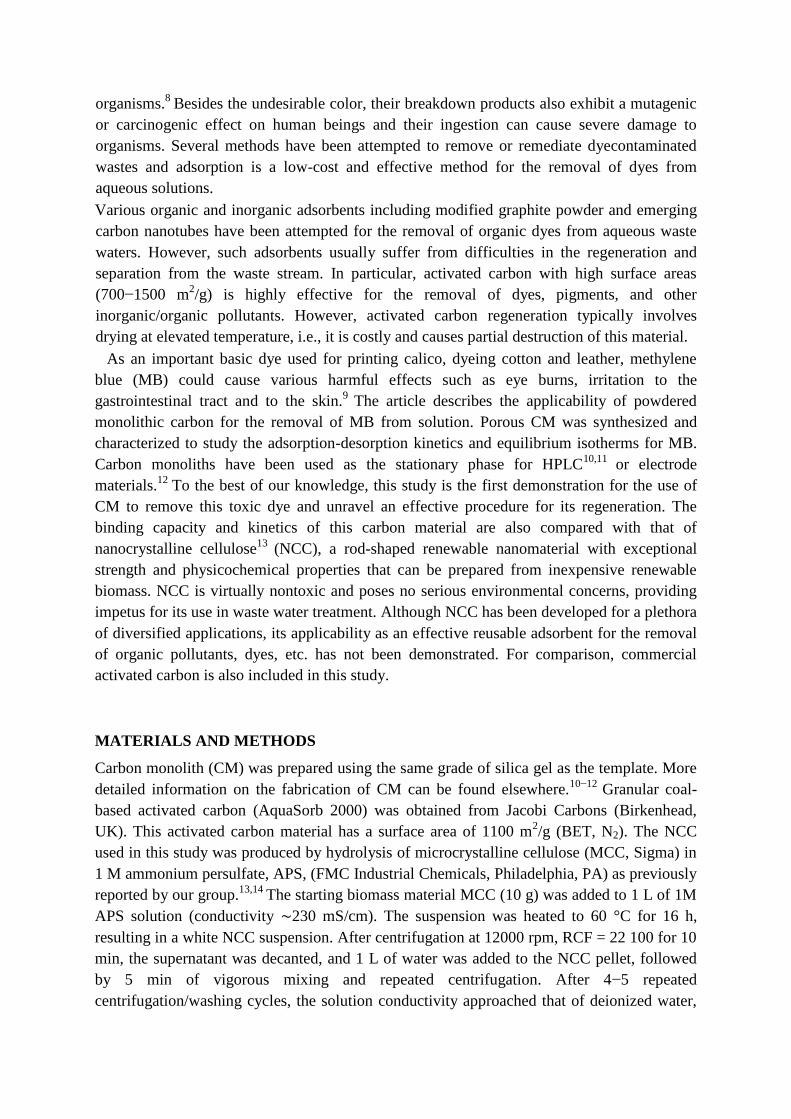
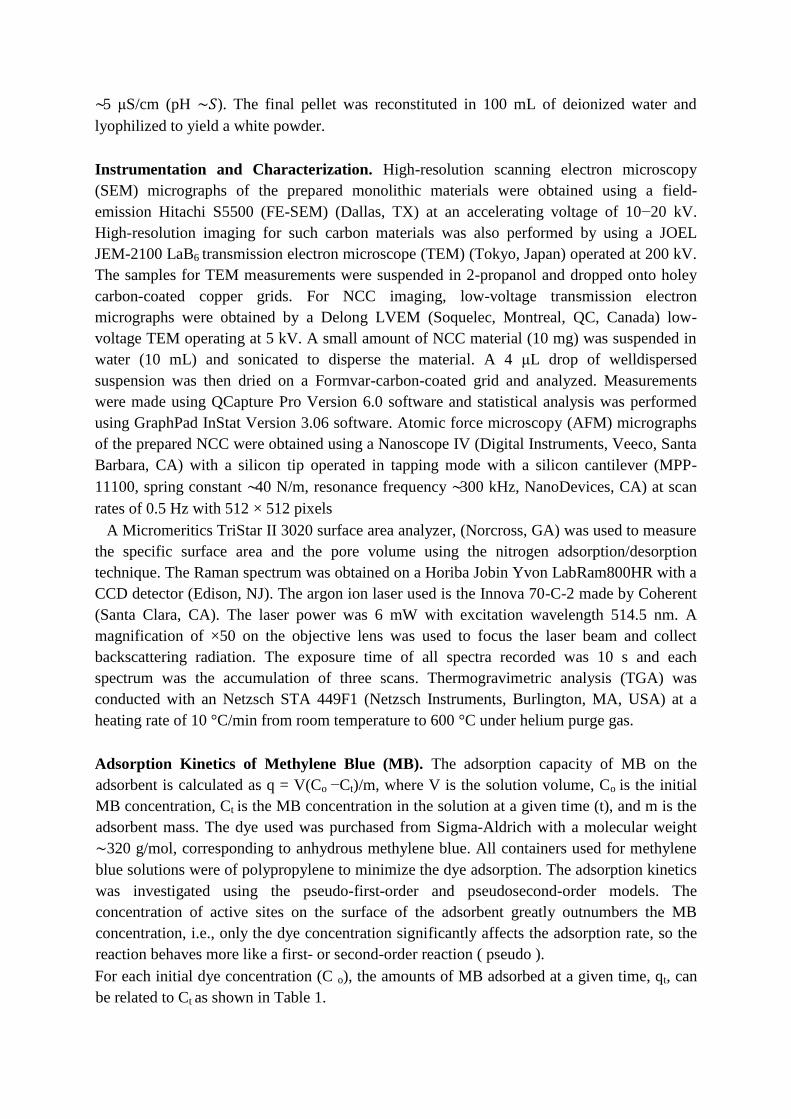
Table 1. Pseudo-First-Order and Pseudo-Second-Order Adsorption Kinetics
Nonlinear regression analysis was then applied to estimate the values for qe =V(Co −Ce)/m, k1,
and k2. A plot of qe vs. Ce, the residual concentration in the solution, was then performed to
validate the applicability of the Langmuir isotherm equation, qe = qmaxKLCe/(1 + KLCe) where
qmax is the Langmuir constant related to maximum adsorption capacity and KL is the Langmuir
constant related to binding energy of the adsorption system as discussed later. The qmax value
was then used for the estimation of the specific surface area (SSA) of CM and NCC as
(qmax/MW)αMBNAvo, where MW is the molecular weight of MB, αMB is the occupied surface
area of one MB molecule (∼1.3 nm2, assuming the MB molecule is lying flat on the
adsorbent surface, 17.0 × 7.6−130 Å2) and NAvo is the Avogadro number (6.023 × 10
23 mol
−1).
A calibration curve was established for MB absorbance at 660 nm (Abs660 nm) vs MB
concentration [MB], providing a straight line (up to 20 μM) with a slope of 0.062 Abs660
nm/μM [MB]. Aqueous solutions (12 mL) containing different concentrations of MB (100-
1500 μM, diluted from a 4 mM stock solution in 20 mM phosphate buffer, pH 7.5), were
added to ground samples (12 mg) of CM and NCC and rotated or stirred in the case of NCC
for up to 40 min. Samples with AC were rotated with MB for a longer time period of up to 3
h. Small samples ( 300 μL) were taken every 30 s for the first 3 min and then at 4, 5, 10, 15,
20, and 40 min and up to 3 h for AC.
These samples were immediately centrifuged at 12 000 rpm and the supernatants (after
centrifugation) were tested (diluted 10−100× depending on the concentration of MB) for the
residual concentration of MB left in solution, following any MB binding to the adsorbents,
and compared to the starting concentration. From the calibration curve of MB, the amount of
MB bound (mg) was then calculated and the MB adsorption in mg/g of sample was
determined. Unless otherwise indicated, the binding experiments were performed at ambient
temperature, 22 ± 1 °C and neutral pH. For the Langmuir isotherm plots extra qe vs Ce points
(in addition to those calculated from the adsorption isotherms) were determined by the
addition of different concentrations of MB to the adsorbents for 16 h (i.e. end point
determination).
Desorption of Methylene Blue (MB). Desorption of MB from AC, CM, and NCC was
performed using ethanol or acetonitrile. In this serial desorption experiment, MB containing
ethanol or acetonitrile was removed by centrifugation and fresh ethanol or acetonitrile was
added every 2 min to prevent the readsorption of MB onto the absorbent.
RESULTS AND DISCUSSION
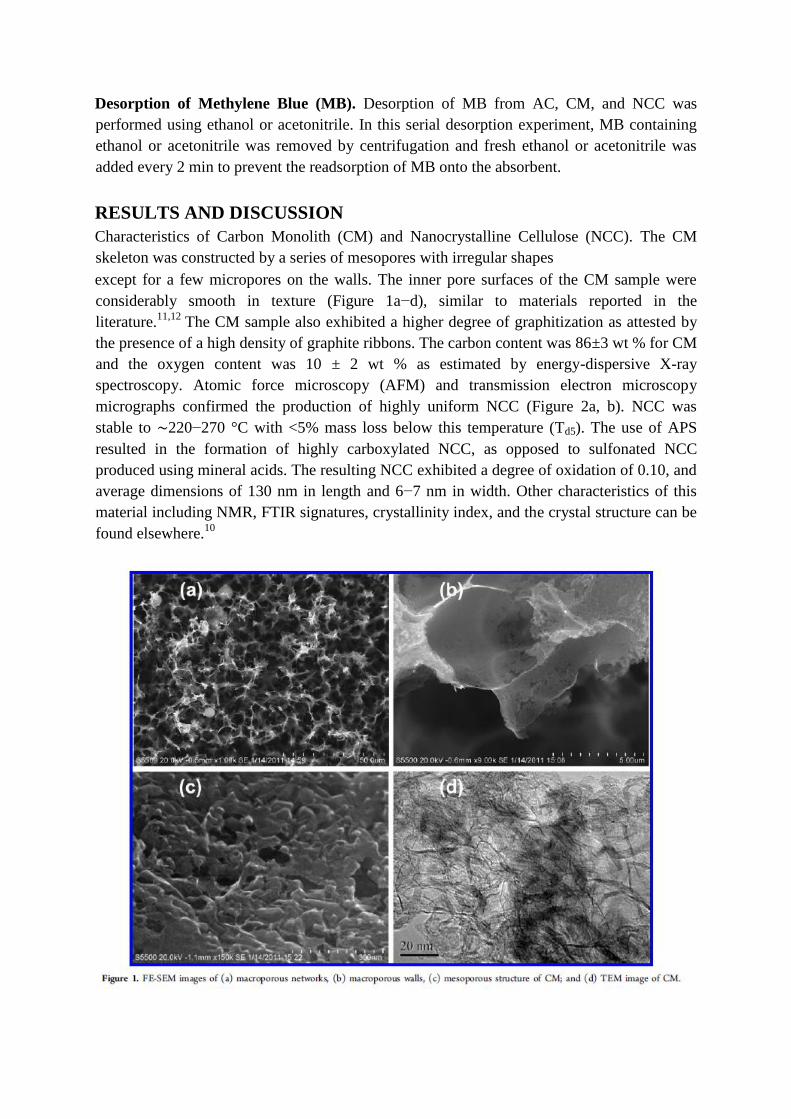
Characteristics of Carbon Monolith (CM) and Nanocrystalline Cellulose (NCC). The CM
skeleton was constructed by a series of mesopores with irregular shapes
except for a few micropores on the walls. The inner pore surfaces of the CM sample were
considerably smooth in texture (Figure 1a−d), similar to materials reported in the
literature.11,12
The CM sample also exhibited a higher degree of graphitization as attested by
the presence of a high density of graphite ribbons. The carbon content was 86±3 wt % for CM
and the oxygen content was 10 ± 2 wt % as estimated by energy-dispersive X-ray
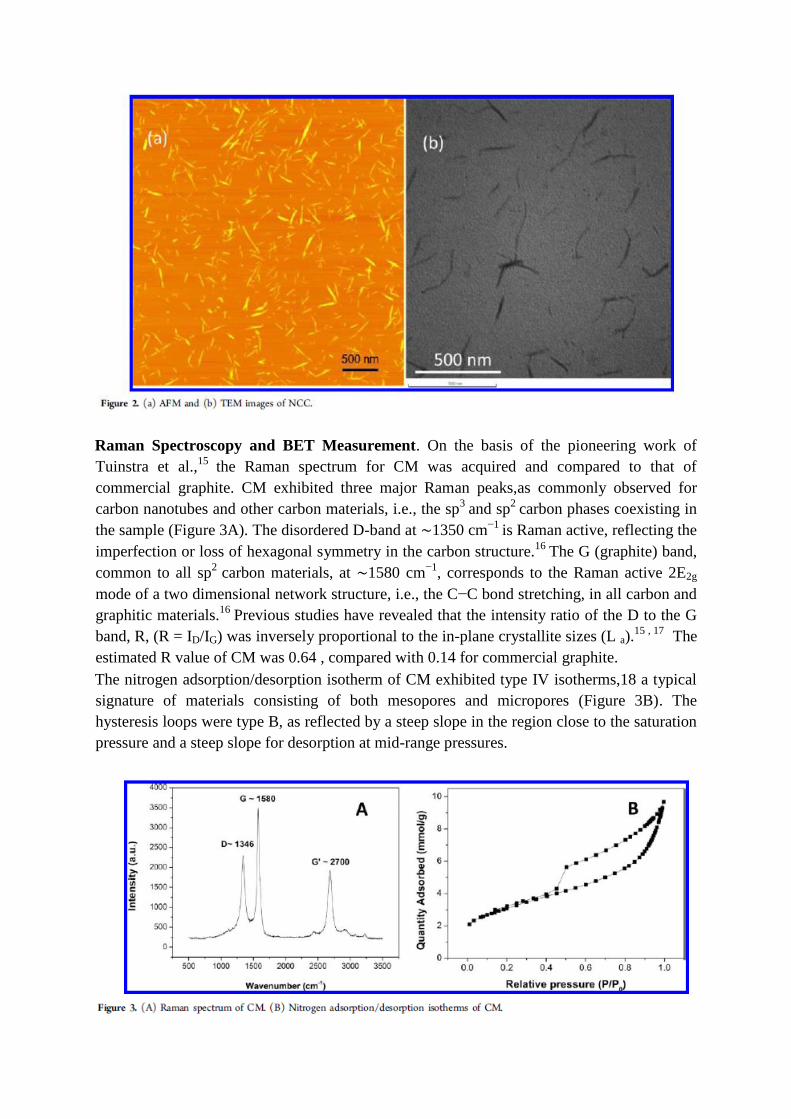
spectroscopy. Atomic force microscopy (AFM) and transmission electron microscopy
micrographs confirmed the production of highly uniform NCC (Figure 2a, b). NCC was
stable to ∼220−270 °C with <5% mass loss below this temperature (Td5). The use of APS
resulted in the formation of highly carboxylated NCC, as opposed to sulfonated NCC
produced using mineral acids. The resulting NCC exhibited a degree of oxidation of 0.10, and
average dimensions of 130 nm in length and 6−7 nm in width. Other characteristics of this
material including NMR, FTIR signatures, crystallinity index, and the crystal structure can be
found elsewhere.10
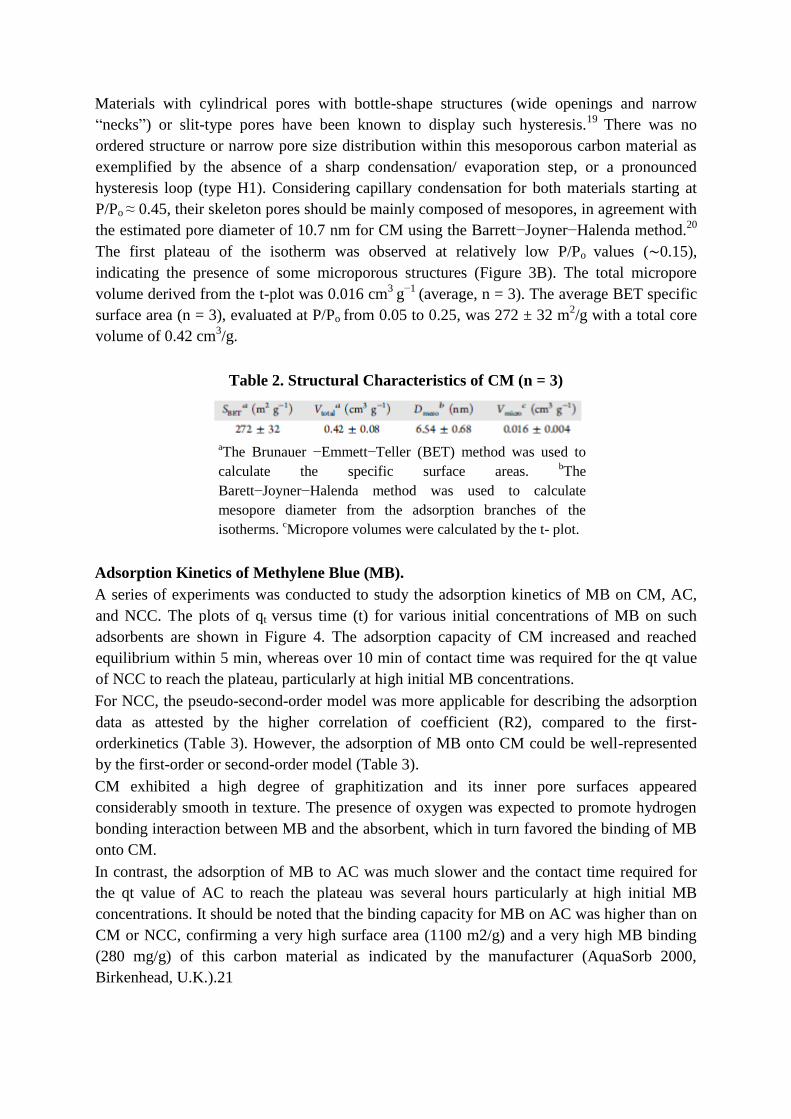
Raman Spectroscopy and BET Measurement. On the basis of the pioneering work of
Tuinstra et al.,15
the Raman spectrum for CM was acquired and compared to that of
commercial graphite. CM exhibited three major Raman peaks,as commonly observed for
carbon nanotubes and other carbon materials, i.e., the sp3
and sp2
carbon phases coexisting in
the sample (Figure 3A). The disordered D-band at ∼1350 cm−1
is Raman active, reflecting the
imperfection or loss of hexagonal symmetry in the carbon structure.16
The G (graphite) band,
common to all sp2
carbon materials, at ∼1580 cm−1
, corresponds to the Raman active 2E2g
mode of a two dimensional network structure, i.e., the C−C bond stretching, in all carbon and
graphitic materials.16
Previous studies have revealed that the intensity ratio of the D to the G
band, R, (R = ID/IG) was inversely proportional to the in-plane crystallite sizes (L a).15 , 17
The
estimated R value of CM was 0.64 , compared with 0.14 for commercial graphite.
The nitrogen adsorption/desorption isotherm of CM exhibited type IV isotherms,18 a typical
signature of materials consisting of both mesopores and micropores (Figure 3B). The
hysteresis loops were type B, as reflected by a steep slope in the region close to the saturation
pressure and a steep slope for desorption at mid-range pressures.
Materials with cylindrical pores with bottle-shape structures (wide openings and narrow
“necks”) or slit-type pores have been known to display such hysteresis.19
There was no
ordered structure or narrow pore size distribution within this mesoporous carbon material as
exemplified by the absence of a sharp condensation/ evaporation step, or a pronounced
hysteresis loop (type H1). Considering capillary condensation for both materials starting at
P/Po ≈ 0.45, their skeleton pores should be mainly composed of mesopores, in agreement with
the estimated pore diameter of 10.7 nm for CM using the Barrett−Joyner−Halenda method.20
The first plateau of the isotherm was observed at relatively low P/Po values (∼0.15),
indicating the presence of some microporous structures (Figure 3B). The total micropore
volume derived from the t-plot was 0.016 cm3
g−1
(average, n = 3). The average BET specific
surface area (n = 3), evaluated at P/Po from 0.05 to 0.25, was 272 ± 32 m2/g with a total core
volume of 0.42 cm3/g.
Table 2. Structural Characteristics of CM (n = 3)
aThe Brunauer −Emmett−Teller (BET) method was used to
calculate the specific surface areas. bThe
Barett−Joyner−Halenda method was used to calculate
mesopore diameter from the adsorption branches of the
isotherms. cMicropore volumes were calculated by the t- plot.
Adsorption Kinetics of Methylene Blue (MB).
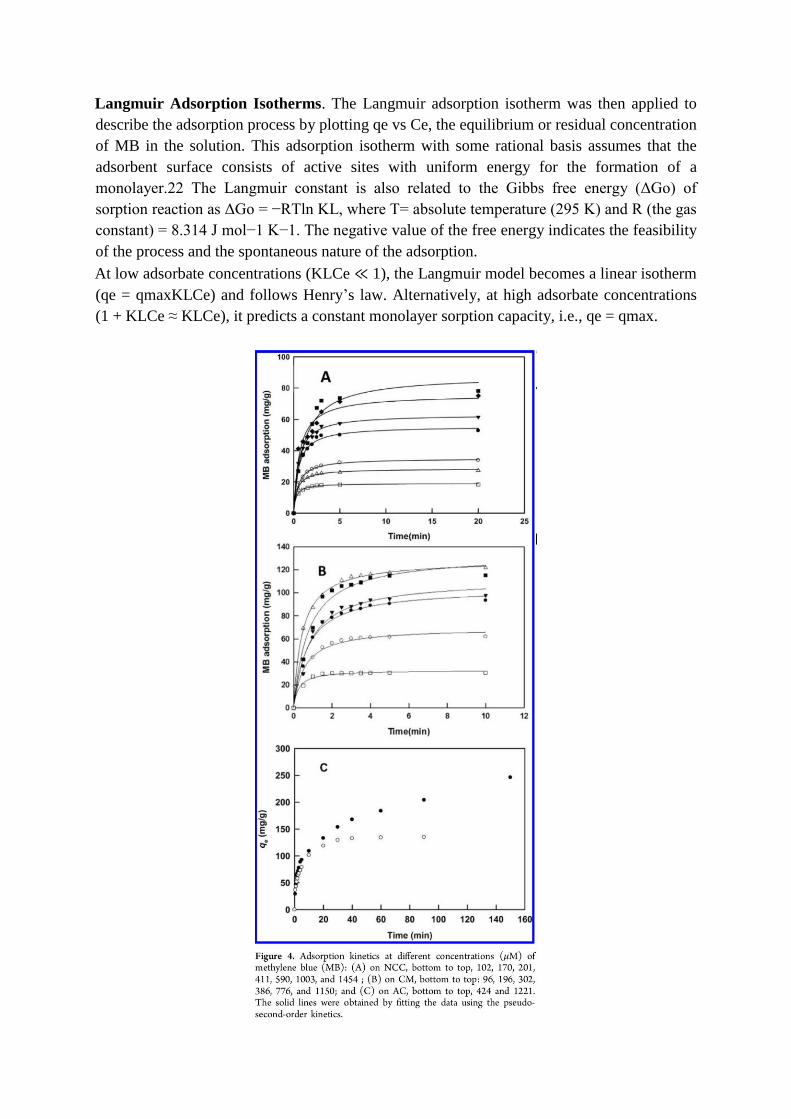
A series of experiments was conducted to study the adsorption kinetics of MB on CM, AC,
and NCC. The plots of qt versus time (t) for various initial concentrations of MB on such
adsorbents are shown in Figure 4. The adsorption capacity of CM increased and reached
equilibrium within 5 min, whereas over 10 min of contact time was required for the qt value
of NCC to reach the plateau, particularly at high initial MB concentrations.
For NCC, the pseudo-second-order model was more applicable for describing the adsorption
data as attested by the higher correlation of coefficient (R2), compared to the first-
orderkinetics (Table 3). However, the adsorption of MB onto CM could be well-represented
by the first-order or second-order model (Table 3).
CM exhibited a high degree of graphitization and its inner pore surfaces appeared
considerably smooth in texture. The presence of oxygen was expected to promote hydrogen
bonding interaction between MB and the absorbent, which in turn favored the binding of MB
onto CM.
In contrast, the adsorption of MB to AC was much slower and the contact time required for
the qt value of AC to reach the plateau was several hours particularly at high initial MB
concentrations. It should be noted that the binding capacity for MB on AC was higher than on
CM or NCC, confirming a very high surface area (1100 m2/g) and a very high MB binding
(280 mg/g) of this carbon material as indicated by the manufacturer (AquaSorb 2000,
Birkenhead, U.K.).21
Langmuir Adsorption Isotherms. The Langmuir adsorption isotherm was then applied to
describe the adsorption process by plotting qe vs Ce, the equilibrium or residual concentration
of MB in the solution. This adsorption isotherm with some rational basis assumes that the
adsorbent surface consists of active sites with uniform energy for the formation of a
monolayer.22 The Langmuir constant is also related to the Gibbs free energy (ΔGo) of
sorption reaction as ΔGo = −RTln KL, where T= absolute temperature (295 K) and R (the gas
constant) = 8.314 J mol−1 K−1. The negative value of the free energy indicates the feasibility
of the process and the spontaneous nature of the adsorption.
At low adsorbate concentrations (KLCe ≪ 1), the Langmuir model becomes a linear isotherm
(qe = qmaxKLCe) and follows Henry’s law. Alternatively, at high adsorbate concentrations
(1 + KLCe ≈ KLCe), it predicts a constant monolayer sorption capacity, i.e., qe = qmax.
Nonlinear regression analysis was performed to estimate the Langmuir constants because the
linearization of the Langmuir model tends to fit experimental data better at higher
concentrations23
and might violate the error variance and normality assumptions of standard
least squares.24
Other modified Langmuir models such as Radke−Prausnitz isotherm25
and
Langmuir−Freundlich (Sips equation)26
were not attempted in this study because they involve
more than two fitting parameters with no physical meaning or rational basis.
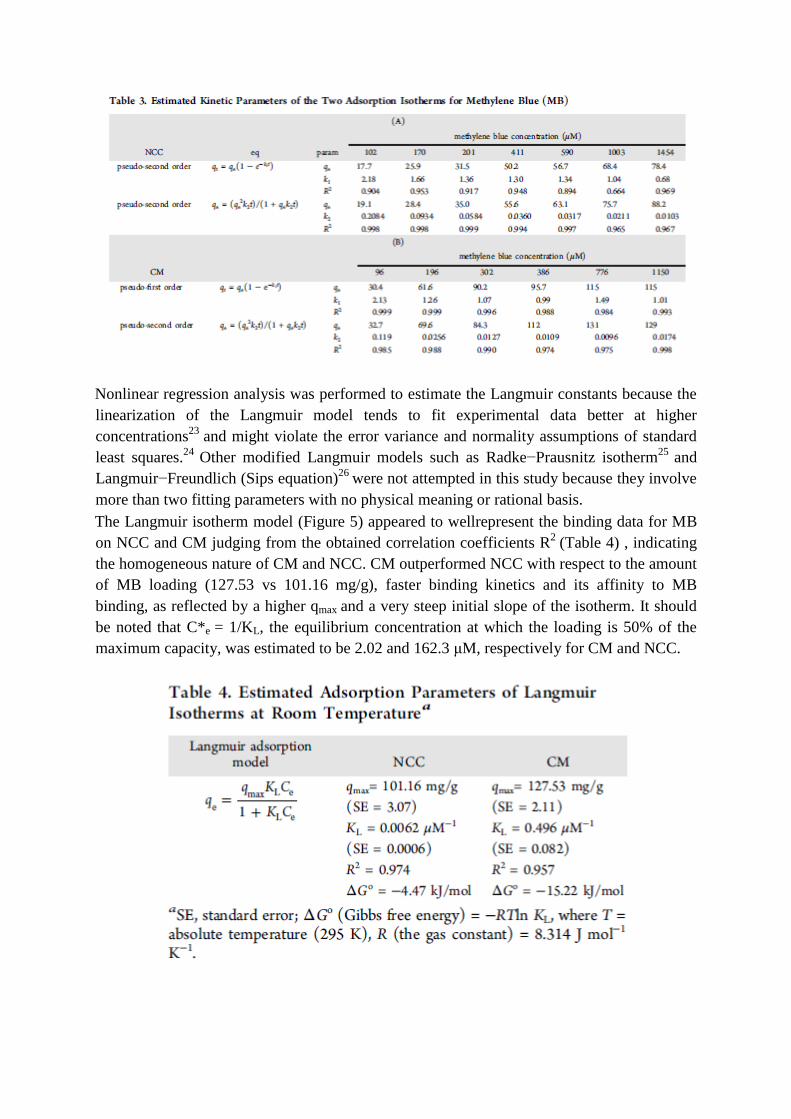
The Langmuir isotherm model (Figure 5) appeared to wellrepresent the binding data for MB
on NCC and CM judging from the obtained correlation coefficients R2
(Table 4) , indicating
the homogeneous nature of CM and NCC. CM outperformed NCC with respect to the amount
of MB loading (127.53 vs 101.16 mg/g), faster binding kinetics and its affinity to MB
binding, as reflected by a higher qmax and a very steep initial slope of the isotherm. It should
be noted that C*e = 1/KL, the equilibrium concentration at which the loading is 50% of the
maximum capacity, was estimated to be 2.02 and 162.3 μM, respectively for CM and NCC.
The Gibbs free energy (ΔGo = −RTln KL) was estimated at −15.22 and −4.47 kJ/mol for CM
and NCC, respectively, to confirm the spontaneous nature of the adsorption of CM for this
dye (Table 4).
Thus, one could use CM to saturate this adsorbent with MB at both low and high
concentrations, corresponding to very low residual MB in the solution. This was an important
finding since the regulatory authorities always desire to limit the maximum concentration of a
pollutant such as organics, metals, etc. For comparison, the binding of MB on Polyalthia
longifolia (Ashoka) seed powder is time-consuming,26
more than 60 min, and the binding
capacity of this material for MB is below 10 mg/g. The qmax values of CM and NCC were
compared favorably with those obtained for activated carbon prepared from different sources,
ranging from a few mg/g to hundreds of mg/g. Notably, the monolayer sorption capacity of
activated carbon prepared from pea shell for MB is as high as 246.9 mg/g. However, the
equilibrium time is 40 and 100 min at concentrations of 100 and 150 mg/L, respectively, and
180 min for higher concentrations (200, 250, 300, and 350 mg/L).27 Similarly, in this study
the value of qmax for the granular coal based activated carbon (AquaSorb 2000) approached
300 mg/g, but the equilibrium time was in the order of hours at 384 mg/L.
As a rectangular volume of dimensions 1.7 × 0.76 × 0.325 nm,28−31, the projected area of
MB has been given as 1.35, 1.32 , and 1.30 nm2, and in this work will be taken as 1.30 nm
2.
Thus, it is very unlikely that MB is able to fill in micropores of the adsorbent (< 2 nm) and
the sorption should occur in mesopores and macropores.

Nevertheless, the two −-N(CH3)2 groups of this dye should be able to protrude into such
micropores to display hydrophobic interaction and hydrogen bonding with the walls of such
micropores. In macropores and mesopores, the sorption depends not only upon the fluid wall
attraction but also on the attractive interactions between the MB molecules, leading to
possible multilayer adsorption.
On the basis of the qmax estimated from the Langmuir model for CM and NCC (Table 4), a
surface area of 312 and 248 m2/ g was estimated for CM and NCC. The surface area
estimated by BET (272 ± 32 m2/g) was in agreement with the MB adsorption procedure for
CM (312 m2/g). Considering NCC as a cylinder with a length of 130 nm, a diameter of 6−7
nm, and a density of 1.6 g/cm3, the specific surface area (SSA) of NCC should be 426 and
367 m2/g, respectively. SSA for 1 g of NCC is estimated as NSa, where Sa is the surface area
of one NCC molecule or 2π(radius)2
+ 2π(radius)(length). The number (N) of NCC molecules
per gram is estimated as VT/Vs, where Vs is the volume of one NCC molecule or
2π(radius)2(length) and VT is the volume for 1 g of NCC = 1 / density.
Of interest was the comparison of the performance of NCC and CM obtained in this study
versus some cellulose-based materials reported in the literature. Spent mushroom substrate, a
renewable biowaste was used as an adsorbent to remove MB from aqueous solution.32
The
adsorption kinetics is governed by the pseudo-second-order model with a maximum
adsorption capacity of 63.5 mg/g at 303 K. The equilibrium time ranges from 25−100 min
and is dependent on the initial MB concentration. A review paper of Sharma et al.33
presents
activated carbon derived from various natural or agricultural wastes which have been used as
dye adsorbents with their adsorption capacity ranging from 2−600 mg/g. Foo and Hameed34
also provide an overview of dye removal via activated carbon adsorption process. Numerous
publications concerning biomass-derived substrates and their adsorption capacity for different
classes of dyestuffs from dilute aqueous solutions have been described in the literature.35 , 36
The intraparticle diffusion model37
can be expressed as qt = x +Kpt1/2
, where t is the contact
time, x is the boundary layer thickness, and Kp is the intraparticle diffusion rate constant.
The plot qt vs t1/2
for CM and NCC at different MB concentrations displayed multilinearity
(figure not shown), indicating that besides intraparticle diffusion other processes were also
involved in the rate controlling step. Initially, sharp linear curves showed rapid transport of
adsorptive molecules from the bulk solution to the adsorbent surface. The adsorbate was then
subject to internal diffusion, where it was transferred to the interior of the adsorbent by the
diffusion of the adsorbate molecules through macropores, wider and smaller mesopores, and
micropores.38
The gradual adsorption showed by the second linear portion confirmed that
intraparticle diffusion was the rate-limiting step.39
Finally, the equilibrium was reached due to
the saturation of the binding sites and/or extremely low MB concentration in the solution. The
curves did not pass through the origin, again confirming more than one step involved in the
adsorption process.40
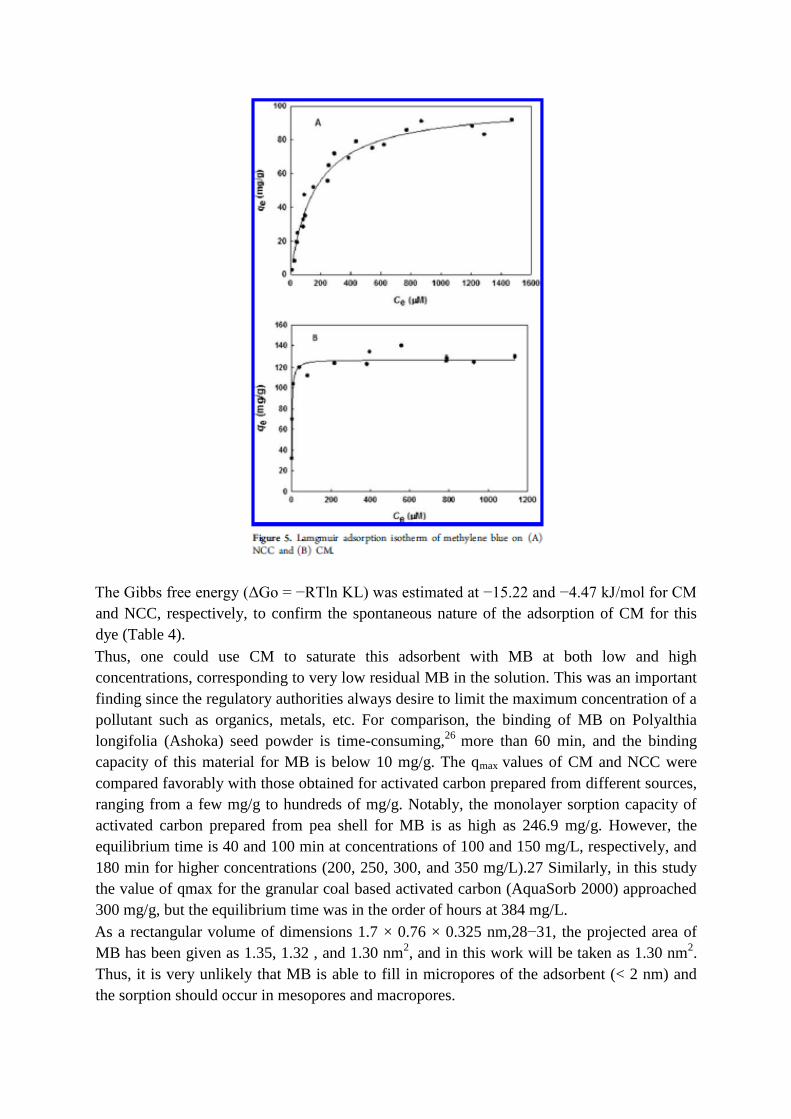
Effects of pH and Temperature. On the basis of binding kinetics and binding capacity, CM
was chosen for further investigation with respect to pH and temperature effects as well as its
plausible regeneration. The sorption capacity was identical at three different pHs: 4.5 (20 mM
sodium acetate), 7.5, and 10.5 (20 mM sodium borate), indicating no noticeable charge
interaction between MB and CM (Figure 6A).
Such results were not completely unexpected since the MB surface with pKa of 3.8 was
predominantly neutral and did not participate in ionic/electrostatic interaction with
hydrophobic and neutral CM. Thus, CM adsorbed MB mainly via hydrophobic interaction,
π−π stacking and hydrogen bonding.
As described earlier, kinetics of MB onto CM followed the pseudo-second-order model,
implying that the rate-limiting step might be chemisorption.41
The adsorption capacity of CM
slightly increased with the increase of adsorption temperature to 60 °C (Figure 6B).
Considering the apparent activation energy of MB adsorption on CM using the Arrhenius
equation
k2 = koe−Ea/RT
where k2 is the pseudo-second-order rate constant defined in Table 1, ko is the temperature-
dependent factor, Ea is the apparent activation energy of the adsorption, R is the gas constant,
and T is the adsorption absolute temperature. The activation energy was estimated to be 18.52
kJ/mol, compared to 27.63 kJ/mol for the adsorption of MB onto bamboo charcoal.42
Notice
also that the contact time of MB adsorbed onto bamboo charcoal requires several hours to
reach equilibrium.
Apparently, increasing temperature decreased the solution viscosity, leading to an enhanced
diffusion rate of adsorptive molecules across the external boundary layer and in the internal
pores. From a practical viewpoint, the adsorption of MB on CM should be carried out at room
temperature and neutral pH.
The desorption using 1 M KOH or nitric acid as described for the desorption of MB onto
activated carbon was not effective,43 thus, this approach was not considered in this study.
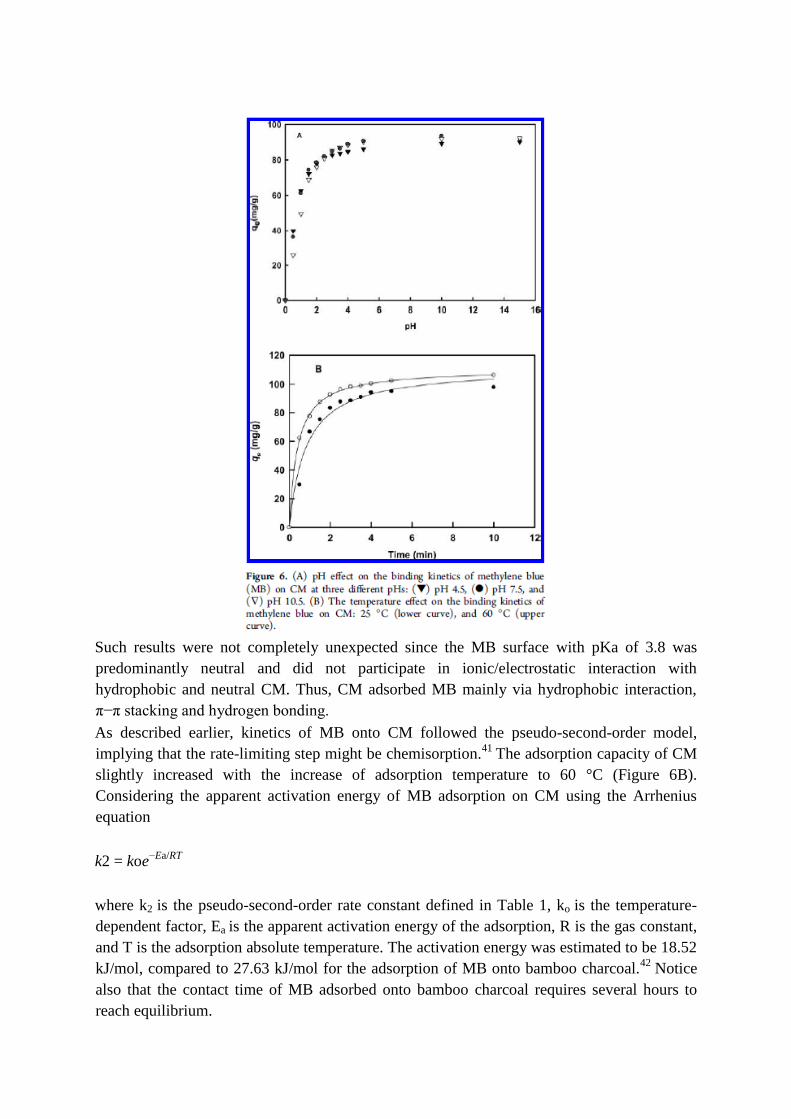
The desorption of MB adhered on CM by ethanol was rapid at room temperature, however,
only 50% of MB was desorbed and increasing desorption temperature up to 60 °C did not
accelerate the desorption process (Figure 7A). Apparently, ethanol was only capable of
effecting the desorption of MB adhered on the CM surface, not in the macro and mesopores.
Finally, desorption of MB adhered on CM by acetonitrile using the above protocol even at
room temperature was most effective, with ∼95% of the MB desorbed in the first 10 min.
Such a result confirmed that acetonitrile could remove the MB from the surface, macro and
mesopores.
In contrast, the desorption of MB from AC was not very effective as only 42 and 40 % of MB
was desorbed with ethanol and acetonitrile, respectively (Figure 7B). It should be note that
activated carbon regeneration typically involves drying the carbon followed by heat treatment
at 500−900 °C. This procedure is costly and causes partial cracking and charring of the
activated carbon, resulting in up to a 20% loss of adsorptive capacity due to a decrease in
surface area.44 In comparison, the desorption of MB from NCC using acetonitrile was not
very effective as only 18% of MB was desorbed. However, the desorption with ethanol was
much more effective with more than 90% removal after 7 desorption cycles (Figure 7C).
CONCLUSION
In brief, we have demonstrated the application of powdered porous carbon monolith and
nanocrystalline cellulose with high surface areas for the adsorption of methylene blue. In
particular, carbon monoliths with a high specific surface area, high mesopore volume, and
narrow size distributed mesopores can be designed in any dimension and shape to facilitate
their reusability without tedious separation from the treated waste stream such as experienced
with activated carbon powder. The test model, methylene blue with a molecular weight of
320 was adsorbed and easily desorbed from CM and NCC. Such results attested the potential
use of these promising materials, which can be easily prepared from inexpensive and
abundant materials for the removal of recalcitrant contaminants in water and waste waters.
Magnetic nanoparticles45 and/or TiO246 can be readily prepared and incorporated into
carbon monoliths via adsorption to facilitate the process design and perform both adsorption
and photocatalytic remediation of this blue dye as well as other organic pollutants.
AUTHOR INFORMATION
Corresponding Author
*E-mail: [email protected] or [email protected].
Notes
The authors declare no competing financial interest.
ACKNOWLEDGMENTS
The authors thank Science Foundation Ireland (Grant 08 / SRC/B1412) for research funding
under the Strategic Research Cluster program and (Grant 03/IN.3/1361/EC07) for FESEM
imaging. Silica gel was a gift from Prof. Peter Myers, University of Liverpool, U.K.
REFERENCES
(1) Lee, J.; Kim, J.; Hyeon, T. Adv. Mater. 2006, 18, 2073−2094. (2) Liang, C.; Li, Z.; Dai, S. Angew. Chem., Int. Ed. 2008, 47, 3696−3717.
(3) Lu, A. H.; Hao, G. P.; Sun, Q.; Zhang, X. Q.; Li, W. C. Macromol. Chem. Phys. 2012, 213, 1107−1131. (4) Ryoo, R.; Joo, S. H.; Kruk, M.; Jaroniec, M. Adv. Mater. 2001, 13, 677−681.
(5) Meng, Y.; Gu, D.; Zhang, F. Q.; Shi, Y. F.; Yang, H. F.; Li, Z.; Yu, C. Z.; Tu, B.; Zhao, D. Y. Angew. Chem., Int. Ed. 2005, 44, 7053−7059.
(6) Ghanizadeh, G.; Asgari, G. React. Kinet. Mech. Catal. 2011, 102, 127−142. (7) Joshi, J. D.; Jabali, V.; Sharma, S.; Patel, C. C.; Patel, A. B. Asian J. Chem. 2004, 2,
1069−1075.
(8) Liu, T. H.; Li, Y. H.; Du, Q. J.; Sun, J. K.; Jiao, Y. Q.; Yang, G. M.; Wang, Z. H.; Xia, Y. Z.; Zhang, W.; Wang, K. L.; Zhu, H. W.; Wu, D. H. Colloids Surf., B 2012, 90, 197−203.
(9) http://ntp.niehs.nih.gov/ntp/htdocs/Chem_Background/ ExecSumm/MethyleneBlue/MethBlue_exp_toxeffects.html. (10) Liang, C.; Dai, S.; Guiochon, G. Anal. Chem. 2003, 75, 4904−4912.
(11) Eltmimi, A. H.; Barron, L.; Rafferty, A.; Hanrahan, J. P.; Fedyanina, O.; Nesterenko, E.; Nesterenko, P. N.; Paull, B. J. Sep. Sci. 2010, 33, 1231−1243. (12) He, X.; Zhou, L.; Nesterenko, E. P.; Nesterenko, P. N.; Paull, B.; Omamogho, J. O.;
Glennon, J. D.; Luong, J. H. T. Anal. Chem. 2012, 84, 2351−2357. (13) Leung, A. C. W.; Hrapovic, S.; Lam, E.; Liu, Y.; Male, K. B.; Mahmoud, K. A.;
Luong, J. H. T. Small 2011, 7, 302−305.
(14) Lam, E.; Leung, A. C. W.; Liu, Y.; Majid, E.; Hrapovic, S.; Male, K. B.; Luong, J. H. T. ACS Sustainable Chem. Eng. 2013, 1, 278−283. (15) Tuinstra, F.; Koenig, J. L. J. Chem. Phys. 1970, 53, 1126−1130. (16) Maldonado-Hodar, F. J.; Moreno-Castilla, C.; Rivera-Utrilla, J.; Hanzawa, Y.;
Yamada, Y. Langmuir 2000, 16, 4367−4373. (17) Dresselhaus, M. S.; Jorio, A.; Hofmann, M.; Dresselhaus, G.; Saito, R. Nano Lett.
2010, 10, 751−758.
(18) Thommes, M. Chem. Ing. Tech. 2010, 82, 1059−1071. (19) Gregg, S. J.; Sing, K. S. W. Adsorption, Surface Area, And Porosity; Academic Press:
London, 1967.
(20) Barrett, E. P.; Joyner, L. G.; Halenda, P. P. J. Am. Chem. Soc. 1951, 73, 373−380. (21) AquaSorb 2000-granular coal based activated carbon, Technical Data Sheet,
www.jacobi.net.
(22) Langmuir, I. J. Am. Chem. Soc. 1918, 40, 1361−1403. (23) Richter, E.; Schutz, W.; Myers, A. L. Chem. Eng. Sci. 1989, 44, 1609−1616.
(24) Ratkowski, D. A. Handbook of Nonlinear Regression Models; Marcel Dekker, New York, 1990. (25) Radke, C. J.; Prausnitz, J. M. AIChE J. 1972, 18, 761−768.
(26) Sips, R. J. Chem. Phys. 1948, 16, 490−495. (27) Mundhe, K. S.; Gaikwad, A. B.; Torane, R. C; Deshpande, N. R.; Kashalkar, R. V. J.
Chem. Pharm. Res. 2012, 4, 423−436.
(28) Kipling, J. J.; Wilson, R. B. J. Appl. Chem. 1960, 10, 109−113. (29) Johnson, C. E., Jr. Methylene blue adsorption and surface area measurements. Paper
presented at the 131st National Meeting of the American Chemical Society; April 7−12, 1957 ; American Chemical Society: Washington, D.C., 1957,. (30) Kalousek, M.; Blahnik, R. Coll. Czech. Chem. Commun. 1955, 20, 782−788.
(31) Los, J. M.; Tompkins, C. K. J. Chem. Phys. 1956, 24, 630. (32) Yan, T.G.; Wang, L.J. BioResources 2013, 8, 4722−4734. (33) Sharma, P.; Kaur, H.; Sharma, M.; Sahoe, V. Environ. Monit. Assess. 2011, 183,
151−195. (34) Foo, K.Y.; Hameed, B.H. Desalin. Water Treat. 2010, 19, 255−274. (35) Hubbe, M. A.; Beck, K. R.; O’Neal, WG.; Sharma.. BioResources 2012, 7,
2592−2687. (36) Srinivasan, A.; Viraraghavan, T. J. Environ. Manage. 2010, 91, 1915−1929. (37) Cigdem, S. O. Physicochem. Probl. Miner. Process. 2012, 48, 441−454.
(38) Hosseini, S.; Khan, M. A.; Malekbala, M. R.; Cheah, W.; Choong, T.S.Y. Chem. Eng. J. 2011, 171, 1124−1131.
(39) Mohd-Din, A. T.; B.H. Hameed, B. H.; Ahmad, A. L. J. Hazard. Mater. 2009, 161, 1522−1529. (40) Dogan, M.; Ozdemir, Y.; Alkan, M. Dyes Pigm. 2007, 75, 701−713.
(41) Hosseini, S.; Khan, M. A.; Malekbala, M. R.; Cheah, W.; Choong, T. S. Y. Chem. Eng. J. 2011, 171, 1124−1131. (42) Zhu, Y.; Wang, D. Q.; Zhang, X. C.; Qin, H. D. Fresenius Environ. Bull. 2009, 18,
369−376. (43) Rahman, M. A.; Ruhul Amin, S. M.; Shafiqul Alam, A. M. Dhaka Univ. J. Sci. 2012,
60, 185−189.
(44) Berenguer, R.; Marco- Lozar, P.; Quijada, C.; Cazorla- Amoros, D.; Morallon, E. Energy Fuels 2010, 24, 3366−3372. (45) Liu, R.-J.; Shen, X.-Q.; Yang, X.-C.; Wang, Q. J.; Yang, F. J. Nanopart. Res. 2013,
15, 1679. (46) Joshi, K. M.; Shrivastava, V. S. Int. J. Nano Dimens. 2012, 2 (4) , 241−252.


