
© 3M 2012. All Rights Reserved.
Advancing Enhancing
Improving July 26, 2012
2012 Second Quarter Business Review (unaudited)
3M
© 3M 2012. All Rights Reserved.
Forward-Looking Statements
This presentation contains forward-looking information about 3M’s financial results and estimates and business prospects
that involve substantial risks and uncertainties. You can identify these statements by the use of words such as “anticipate,”
“estimate,” “expect,” “project,” “intend,” “plan,” “believe,” “will,” “target,” “forecast” and other words and terms of similar
meaning in connection with any discussion of future operating or financial performance or business plans or prospects.
Among the factors that could cause actual results to differ materially are the following: (1) worldwide economic and capital
markets conditions and other factors beyond the Company’s control, including natural and other disasters affecting the
operations of the Company or its customers and suppliers; (2) the Company’s credit ratings and its cost of capital;
(3) competitive conditions and customer preferences; (4) foreign currency exchange rates and fluctuations in those rates;
(5) the timing and market acceptance of new product offerings; (6) the availability and cost of purchased components,
compounds, raw materials and energy (including oil and natural gas and their derivatives) due to shortages, increased
demand or supply interruptions (including those caused by natural and other disasters and other events); (7) the impact of
acquisitions, strategic alliances, divestitures, and other unusual events resulting from portfolio management actions and
other evolving business strategies, and possible organizational restructuring; (8) generating fewer productivity
improvements than estimated; (9) security breaches and other disruptions to the Company’s information technology
infrastructure; and (10) legal proceedings, including significant developments that could occur in the legal and regulatory
proceedings described in the company’s Annual Report on Form 10-K for the year ended December 31, 2011 and its
subsequent quarterly reports on Form 10-Q (the "Reports"). Changes in such assumptions or factors could produce
significantly different results. A further description of these factors is located in the Reports under “Cautionary Note
Concerning Factors That May Affect Future Results” and “Risk Factors” in Part I, Items 1 and 1A (Annual Report) and in
Part I, Item 2 and Part II, Item 1A (Quarterly Report). The information contained in this presentation is as of the date
indicated. The company assumes no obligation to update any forward-looking statements contained in this presentation as
a result of new information or future events or developments.
2

© 3M 2012. All Rights Reserved.
Q2 2012 Results Marked by Strong Operational Execution
GAAP EPS of $1.66, up 3.8% YOY
Operating income of $1.7 billion, up 4.4% YOY
Operating margins of 22.9%, up 1.3 percentage points YOY
All 6 business segments > 20%
Sales of $7.5 billion, down 1.9% in dollar terms
FX -4.3%, acquisitions +0.5%
Organic local currency +1.9%
Latin America/Canada +11%, U.S. +4%, APAC -1%, EMEA (Europe/Middle
East/Africa) -2%
Results demonstrate 3M’s operating strength and flexibility
Returned >$1.0 billion of cash to shareholders via dividends/share
repurchases
3

© 3M 2012. All Rights Reserved.
($M) Q2 11 Q2 12 Change
Sales $7,680 $7,534 -1.9%
Q2 2012 P&L Highlights
SG&A $1,581 $1,528 -3.3%
% sales 20.6% 20.3% -0.3 pts
R&D & related $404 $408 +1.1%
% to sales 5.2% 5.4% +0.2 pts
Operating income $1,655 $1,728 +4.4%
% to sales 21.6% 22.9% +1.3 pts
Net income $1,160 $1,167 +0.6%
Earnings per share $1.60 $1.66 +3.8%
Gross profit $3,640 $3,664 +0.7%
% to sales 47.4% 48.6% +1.2 pts
4 Refer to 3M’s July 26, 2012 press release for full details
Operating margin of 22.9%, up 1.3
percentage points:
Price/RMs +1.6 pts
FX +0.3
Pension/OPEB (0.3)
Other (0.3)
Net change +1.3 pts
Lower shares added $0.05/share
Higher tax rate cost ($0.07)/share
Insurance recoveries added $0.02/share
Restructuring/consolidation cost ($0.03)/share
© 3M 2012. All Rights Reserved.
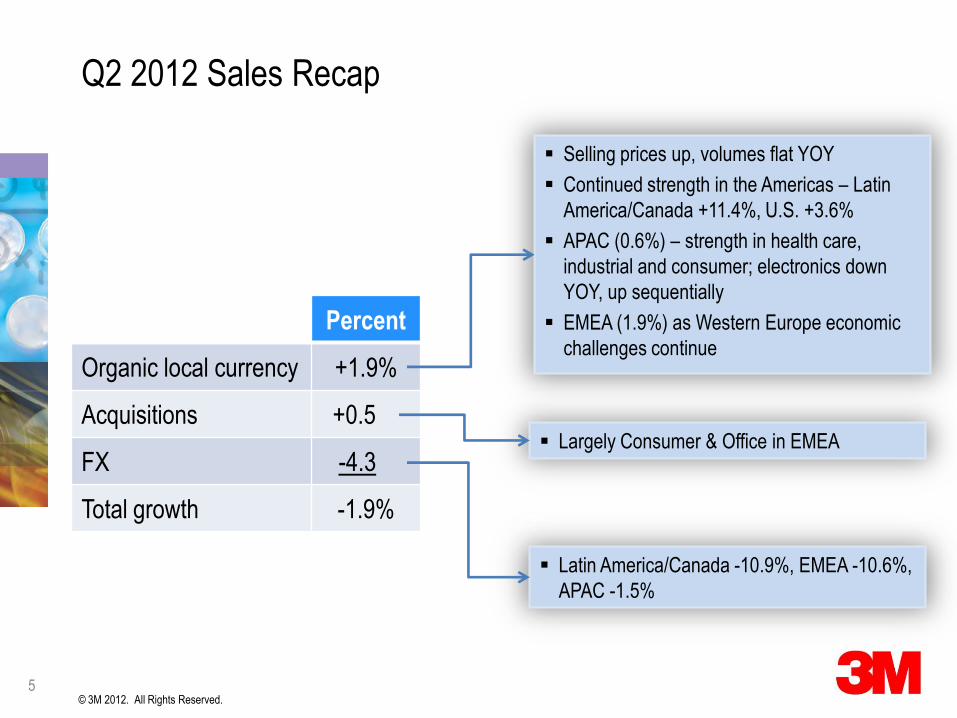
Percent
Organic local currency +1.9%
Acquisitions +0.5
FX -4.3
Total growth -1.9%
Q2 2012 Sales Recap
Largely Consumer & Office in EMEA
5
Selling prices up, volumes flat YOY
Continued strength in the Americas – Latin
America/Canada +11.4%, U.S. +3.6%
APAC (0.6%) – strength in health care,
industrial and consumer; electronics down
YOY, up sequentially
EMEA (1.9%) as Western Europe economic
challenges continue
Latin America/Canada -10.9%, EMEA -10.6%,
APAC -1.5%

© 3M 2012. All Rights Reserved.
Sales Change Components
($M)
Sales
Q2 2012
YOY
Chg
* Organic
Local
Currency Acq FX
Operating
Income
Q2 2012
YOY
Chg
Operating
Margin
Q2 2012
YOY
Chg
Industrial &
Transportation $2,627 -0.6% +4.2% +0.2% -5.0% $614 +13.0% 23.4% +2.8 pts
Health Care $1,283 +1.1% +5.4% +0.4% -4.7% $414 +13.4% 32.3% +3.6 pts
Consumer &
Office $1,062 +2.3% +3.1% +2.7% -3.5% $222 +10.2% 21.0% +1.5 pts
Safety, Security
& Protection $991 -1.9% +3.1% ---- -5.0% $258 +6.3% 26.0% +2.0 pts
Display &
Graphics $882 -9.3% -6.6% ---- -2.7% $179 -19.1% 20.3% -2.5 pts
Electro &
Communications $824 -4.7% -1.8% ---- -2.9% $195 -2.3% 23.7% +0.6 pts
Total Company $7,534 -1.9% +1.9% +0.5% -4.3% $1,728 +4.4% 22.9% +1.3 pts
Q2 2012 Segment Performance
Refer to 3M's July 26, 2012 press release section entitled "Business Segments" for further detail. 6
* Organic local currency = organic volume growth + selling price change

© 3M 2012. All Rights Reserved.
($M) Q2 2011 Q2 2012 Change
Operating cash flow $1,451 $1,389 ($62) Pluses: net income, working capital
Minuses: pension/OPEB contributions
Capital expenditures ($295) ($358) ($63) Targeting $1.3 to $1.5B in 2012
Free cash flow $1,156 $1,031 ($125)
Free cash flow
conversion 100% 88%
Excluding pension/OPEB contributions:
Q2 2012 = 117%, Q2 2011 = 105%
Dividends ($391) ($410) ($19) 54th consecutive annual per-share
increase
Share repurchase ($678) ($639) $39 Targeting $2.0B to 2.5B in 2012
Q2 2012 Cash Flow
7

© 3M 2012. All Rights Reserved.
Affirming 2012 EPS Outlook
8
Q1 Earnings Call
4/24/12
Today
7/26/12
GAAP EPS $6.35 to $6.50 $6.35 to $6.50 Includes additional FX
headwinds
Organic local-currency
sales growth +2% to +6% +2% to +5%
Strong pricing, economy
remains uncertain
FX impact on sales -1% to -2% -3% Assumes Euro 1.21
Operating margin 21.0% to 22.5% 21.5% to 22.5% Strong H1 start
Tax rate Approx. 29.5% Approx. 29.5% No change

© 3M 2012. All Rights Reserved.
Q & A
9
© 3M 2012. All Rights Reserved.
Appendix
10

© 3M 2012. All Rights Reserved.
Industrial and Transportation
($M)
Q2
2011
Q2
2012
Total %
Growth
YTD
2011
YTD
2012
%
Chg
Sales $2,641 $2,627 -0.6% $5,091 $5,287 +3.8%
Operating Income $544 $614 +13.0% $1,060 $1,214 +14.5%
Operating Margin 20.6% 23.4% +2.8 pts 20.8% 23.0% +2.2 pts
• Sales of $2.6 billion, down 0.6%; organic local-currency sales increased 4.2%, acquisitions
added 0.2% and foreign currency translation reduced sales by 5.0%
• On an organic local-currency basis:
• Sales growth was strongest in automotive OEM, aerospace, abrasives and energy/advanced
materials
• Sales expanded in Latin America/Canada, Asia Pacific and the U.S.; EMEA declined slightly
• Operating income rose 13.0% to $614 million; operating income margin of 23.4%
• Completed manufacturing expansion for 3M™ Ultra Barrier Solar Film; expansion will support the growing demand for high
efficiency flexible photovoltaic (PV) modules
• Aerospace introduced improved 3M™ Polyurethane Protection Tapes that cover seams in floor panel joints; also
introduced wide-area tapes to protect against moisture on aircraft
• Automotive OEM driving higher penetration on major European hybrid electric vehicle platforms
11
Financial Highlights
Business Wins
© 3M 2012. All Rights Reserved.
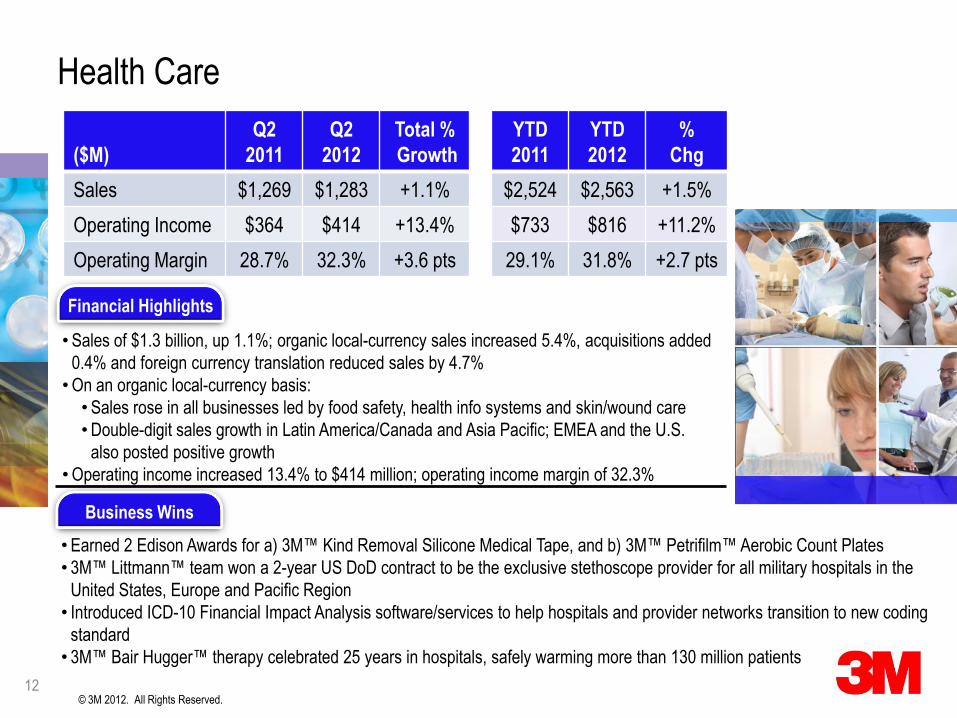
• Sales of $1.3 billion, up 1.1%; organic local-currency sales increased 5.4%, acquisitions added
0.4% and foreign currency translation reduced sales by 4.7%
• On an organic local-currency basis:
• Sales rose in all businesses led by food safety, health info systems and skin/wound care
• Double-digit sales growth in Latin America/Canada and Asia Pacific; EMEA and the U.S.
also posted positive growth
• Operating income increased 13.4% to $414 million; operating income margin of 32.3%
Health Care
($M)
Q2
2011
Q2
2012
Total %
Growth
YTD
2011
YTD
2012
%
Chg
Sales $1,269 $1,283 +1.1% $2,524 $2,563 +1.5%
Operating Income $364 $414 +13.4% $733 $816 +11.2%
Operating Margin 28.7% 32.3% +3.6 pts 29.1% 31.8% +2.7 pts
12
Financial Highlights
• Earned 2 Edison Awards for a) 3M™ Kind Removal Silicone Medical Tape, and b) 3M™ Petrifilm™ Aerobic Count Plates
• 3M™ Littmann™ team won a 2-year US DoD contract to be the exclusive stethoscope provider for all military hospitals in the
United States, Europe and Pacific Region
• Introduced ICD-10 Financial Impact Analysis software/services to help hospitals and provider networks transition to new coding
standard
• 3M™ Bair Hugger™ therapy celebrated 25 years in hospitals, safely warming more than 130 million patients
Business Wins

© 3M 2012. All Rights Reserved.
Consumer and Office
($M)
Q2
2011
Q2
2012
Total %
Growth
YTD
2011
YTD
2012
%
Chg
Sales $1,038 $1,062 +2.3% $2,038 $2,105 +3.3%
Operating Income $202 $222 +10.2% $417 $456 +9.5%
Operating Margin 19.5% 21.0% +1.5 pts 20.4% 21.7% +1.3 pts
13
• Sales of $1.1 billion, up 2.3%; organic local-currency sales increased 3.1%, acquisitions added
2.7% and foreign currency translation reduced sales by 3.5%
• On an organic local-currency basis:
• Sales growth led by DIY and home care businesses
• Sales expanded in Latin America/Canada, Asia Pacific and the U.S., partially offset by
declines in EMEA
• Operating income rose 10.2% to $222 million; operating income margin of 21.0%
Financial Highlights
• Introduced new Filtrete™ Odor Reduction Filter – the most effective carbon filter at removing odors and
improving air quality throughout the home
• Launched the Pruven™ Pet Care product line into the mass retail channel
• Introduced new line of Command™ Clear products, utilizing a new and innovative clear strip technology
• Launched several new products for back-to-school season: Scotch® Color and Pattern Duct Tapes, Scotch®
Decorative Packaging and Shipping Tapes, Post-it® Note color collections and dispensers
Business Wins

© 3M 2012. All Rights Reserved.
Safety, Security and Protection Services
($M)
Q2
2011
Q2
2012
Total %
Growth
YTD
2011
YTD
2012
%
Chg
Sales $1,011 $991 -1.9% $1,940 $1,972 +1.6%
Operating Income $242 $258 +6.3% $441 $489 +10.8%
Operating Margin 24.0% 26.0% +2.0 pts 22.8% 24.8% +2.0 pts
14
• Sales of $991 million, down 1.9%; organic local-currency sales increased 3.1% and foreign
currency translation reduced sales by 5.0%
• On an organic local-currency basis:
• Sales growth was strongest in infrastructure protection, personal safety and building and
commercial services; sales declined year-on-year in security systems
• Sales increased in Latin America/Canada, Asia Pacific and the U.S., partially offset by
declines in EMEA
• Operating income rose 6.3 percent to $258 million; operating margin of 26.0 percent
Financial Highlights
•3M Cogent won new biometric contracts in Western Europe, Latin America and the U.S.
•Introduced a new reusable respirator in Korea
• Building and commercial services business won 2 new contracts with major universities
•Earned significant wins for pipeline-protection solutions for El Sauz project in Mexico
Business Wins

© 3M 2012. All Rights Reserved.
Display and Graphics
($M)
Q2
2011
Q2
2012
Total %
Growth
YTD
2011
YTD
2012
%
Chg
Sales $973 $882 -9.3% $1,916 $1,714 -10.5%
Operating Income $222 $179 -19.1% $452 $342 -24.2%
Operating Margin 22.8% 20.3% -2.5 pts 23.6% 20.0% -3.6 pts
15
• Sales of $882 million, down 9.3%; organic local-currency sales declined 6.6% and foreign
currency translation reduced sales by 2.7%
• On an organic local-currency basis:
• Lower film volumes for LCD TVs drove double-digit sales declines in optical systems
• Double-digit sales increases in both architectural markets and commercial graphics; sales
declined slightly in traffic safety systems
• Sales declined in Asia Pacific and EMEA, partially offset by increases in the U.S. and Latin
America/Canada
• Operating income declined 19.1% to $179 million; operating margin of 20.3%
Financial Highlights
• Announced acquisition of Federal Signal Technologies Group, a provider of electronic toll collection and
parking management hardware and software services
•Commercial graphics business gaining share via new product penetration in the fleet graphics space
•Architectural markets business debuted the 3M AIR and FLEX lighting solutions at annual NeoCon show
Business Wins
© 3M 2012. All Rights Reserved.
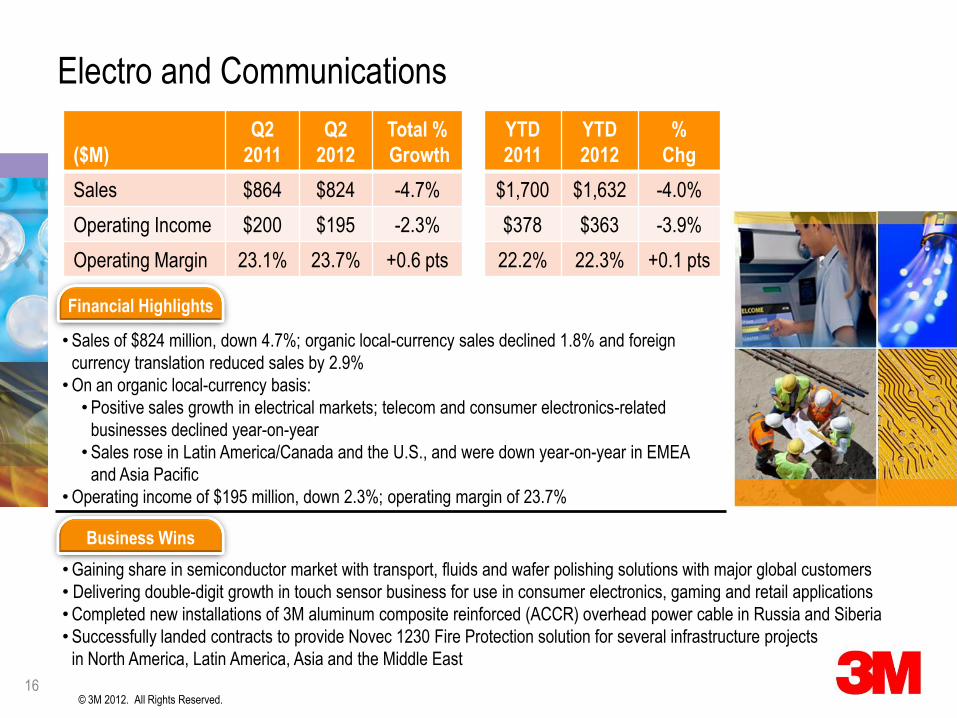
Electro and Communications
($M)
Q2
2011
Q2
2012
Total %
Growth
YTD
2011
YTD
2012
%
Chg
Sales $864 $824 -4.7% $1,700 $1,632 -4.0%
Operating Income $200 $195 -2.3% $378 $363 -3.9%
Operating Margin 23.1% 23.7% +0.6 pts 22.2% 22.3% +0.1 pts
16
• Sales of $824 million, down 4.7%; organic local-currency sales declined 1.8% and foreign
currency translation reduced sales by 2.9%
• On an organic local-currency basis:
• Positive sales growth in electrical markets; telecom and consumer electronics-related
businesses declined year-on-year
• Sales rose in Latin America/Canada and the U.S., and were down year-on-year in EMEA
and Asia Pacific
• Operating income of $195 million, down 2.3%; operating margin of 23.7%
Financial Highlights
• Gaining share in semiconductor market with transport, fluids and wafer polishing solutions with major global customers
• Delivering double-digit growth in touch sensor business for use in consumer electronics, gaming and retail applications
• Completed new installations of 3M aluminum composite reinforced (ACCR) overhead power cable in Russia and Siberia
• Successfully landed contracts to provide Novec 1230 Fire Protection solution for several infrastructure projects
in North America, Latin America, Asia and the Middle East
Business Wins

© 3M 2012. All Rights Reserved.
($M)
Business Segment Information
Net Sales
Q2 2011 Q2 2012
Operating Income
Q2 2011 Q2 2012
Industrial and Transportation $2,641 $2,627 $544 $614
Health Care $1,269 $1,283 $364 $414
Consumer and Office $1,038 $1,062 $202 $222
Safety, Security & Protection Services $1,011 $991 $242 $258
Display and Graphics $973 $882 $222 $179
Electro and Communications $864 $824 $200 $195
Corporate and Unallocated $3 $2 ($93) ($124)
Elimination of Dual Credit ($119) ($137) ($26) ($30)
Total $7,680 $7,534 $1,655 $1,728
Business Segment Information
17
© 3M 2012. All Rights Reserved.
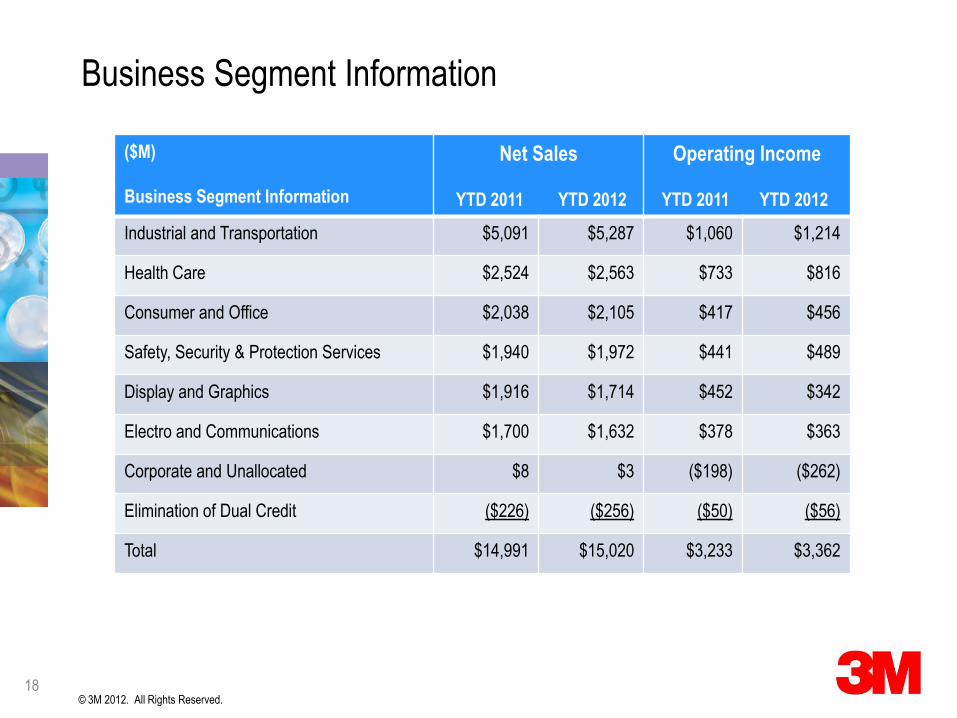
($M)
Business Segment Information
Net Sales
YTD 2011 YTD 2012
Operating Income
YTD 2011 YTD 2012
Industrial and Transportation $5,091 $5,287 $1,060 $1,214
Health Care $2,524 $2,563 $733 $816
Consumer and Office $2,038 $2,105 $417 $456
Safety, Security & Protection Services $1,940 $1,972 $441 $489
Display and Graphics $1,916 $1,714 $452 $342
Electro and Communications $1,700 $1,632 $378 $363
Corporate and Unallocated $8 $3 ($198) ($262)
Elimination of Dual Credit ($226) ($256) ($50) ($56)
Total $14,991 $15,020 $3,233 $3,362
Business Segment Information
18

© 3M 2012. All Rights Reserved.
Advancing Enhancing
Improving


