Download - AFSC PROCESSED REPORT 2006-13
Alaska Fisheries Science Center
National Marine Fisheries Service
U.S DEPARTMENT OF COMMERCE
AFSC PROCESSED REPORT 2006-13
Results of the February-March 2006 Echo Integration-trawl Surveys of Walleye Pollock (Theragra chalcogramma) Conducted in the Gulf of Alaska, Cruises MF2006-01 and MF2006-04
October 2006
This report does not constitute a publication and is for information only. All data herein are to be considered provisional.


Notice to Users of this Document
This document is being made available in .PDF format for the convenience of users; however, the accuracy and correctness of the document can only be certified as was presented in the original hard copy format.


Results of the February-March 2006 Echo Integration-Trawl Surveys
of Walleye Pollock (Theragra chalcogramma) Conducted in
the Gulf of Alaska, Cruises MF2006-01 and MF2006-04
by Michael A. Guttormsen and P. Tyler Yasenak
Alaska Fisheries Science Center
7600 Sand Point Way N.E.
Seattle, WA 98115
October 2006


CONTENTS
INTRODUCTION……..………………………….……………………………………..… 1
METHODS……..…………………………………………………………………….……. 1
Itinerary…..…………………………………………………………………..…..… 1
Acoustic Equipment….….………………………………………………….……… 2
Trawl Gear……………..…………………………………………………………... 2
Oceanographic Equipment..………………………………………………………... 3
Survey Design…………….……………………………………………………….. 4
Data Analysis………………..……………………………………....……………... 5
RESULTS and DISCUSSION…………………….………………………….…………… 6
Calibration…………………………………………………………….………….... 6
Shumagin Islands…………………………………….………………….…………. 6
Oceanographic Sampling……………………….……………….…………. 6
Biological Sampling…………………………………….……….…………. 7
Distribution and Abundance……………………………………..………… 9
Biological Sampling………………….………………………….………… 9
Distribution and Abundance………………………..…………..………… 10
Biological Sampling………………….………………………….…….…. 11
Gear Testing……………….…………………………….……….….……. 15
Sanak Trough……………………………………………………….…….………... 9
Oceanographic Sampling……………………….…………………………. 9
Morzhovoi Bay..……………………………………………………………….…. 10
Oceanographic Sampling……………………….……………….…….….. 10
Biological Sampling………………….………………………….……….. 10
Distribution and Abundance……………………………………..……….. 11
Shelf Break Area Near Chirikof Island………………………….…………...…... 11
Oceanographic Sampling……………………….……………….………... 11
Distribution and Abundance……..……………………………………….. 12
Shelikof Strait……………………………………………….…………………...... 13
Oceanographic Sampling……………………….……………….……..…. 13
Biological Sampling………………………………….…………………... 13
Distribution and Abundance…………………………….………….…….. 14
ACKNOWLEDGMENTS………………………..……………………………..……..…. 16
CITATIONS………………………………………..…………………………………….. 17
SCIENTIFIC PERSONNEL……………….……….………………………….…………. 19
TABLES and FIGURES……………………………………………………..…………… 21
iii


INTRODUCTION
Scientists from the Midwater Assessment and Conservation Engineering Program of the Alaska
Fisheries Science Center (AFSC) routinely conduct echo integration-trawl (EIT) surveys in the Gulf
of Alaska (GOA) during late winter and early spring to estimate the distribution and abundance of
walleye pollock (Theragra chalcogramma, hereafter referred to as pollock). Most of this effort has
been focused on the Shelikof Strait area, which has been surveyed annually since 1980, except in
1982 and 1999. Surveys were also conducted in the Shumagin Islands area in 1994-96, 2001-03,
and 2005 and along the GOA shelf break east of Chirikof Island in 2002-05. Results presented here
are from EIT surveys carried out between 13 and 21 February in the Shumagin Islands, Sanak
Trough, and Morzhovoi Bay (Cruise MF2006-01) and between 13 and 28 March in the Shelikof
Strait area, and along the GOA shelf break near Chirikof Island (Cruise MF2006-04).
METHODS
Shumagin Islands/Sanak Trough/Morzhovoi Itinerary
13 Feb Embark scientists in Kodiak, AK.
13 Feb Calibration of acoustic system in Three Saints Bay, AK.
14 Feb In transit.
15-19 Feb EIT survey of the Shumagin Islands, Sanak Trough, and Morzhovoi Bay.
20 Feb In transit.
21 Feb In port in Kodiak, AK.
Shelikof Strait/Shelf Break Itinerary
13 Mar Embark scientists in Kodiak, AK.
14-16 Mar EIT survey of the shelf break east of Chirikof Island.
16-22 Mar EIT survey of the Shelikof Strait area.

22 Mar Calibration of acoustic system in Uganik Bay, AK.
23-27 Mar Experimental trawls and orthogonal transects.
28 Mar In port in Kodiak, AK.
Acoustic Equipment
1Acoustic data were collected with a Simrad ER60 quantitative echosounding system using 18, 38,
120, and 200 kHz split-beam transducers (Simrad 1997, 2004; Bodholt and Solli 1992). The
transducers were installed on the NOAA ship Miller Freeman, a 66-m stern trawler equipped for
fisheries and oceanographic research, on the bottom of a retractable centerboard extending 9 m
below the water surface. Data were logged using ER60 software (version 2.1.2) and SonarData
EchoLog 500 (version 3.45). Data were analyzed using SonarData Echoview (version 3.45.53) PC-
based post-processing software. Results presented here are based on ER60 38 kHz data.
Trawl Gear
Midwater and near-bottom echosign were sampled using an Aleutian wing 30/26 trawl (AWT).
This trawl was constructed with full-mesh nylon wings and polyethylene mesh in the codend and aft
section of the body. The headrope and footrope each measured 81.7 m (268 ft). Mesh sizes tapered
from 325.1 cm (128 in) in the forward section of the net to 8.9 cm (3.5 in) in the codend. The net
was fitted with a 1.3 cm (0.5 in) nylon mesh codend liner except during the Shelikof Strait survey,
for which a 3.2 cm (1.25 in) codend liner was used. The AWT was fished with 82.3 m (270 ft) of
1.9 cm (0.75 in) diameter (8 × 19 wire) non-rotational dandylines, 113.4 kg (250 lb) or 226.8 kg
2(500 lb) tom weights on each side, and 5 m Fishbuster trawl doors [1,247 kg (2,750 lb) each].
Vertical net opening and depth were monitored using a WESMAR third wire system attached to the
Reference to trade names or commercial firms does not constitute U.S. Government endorsement.
2
1
headrope. The vertical net opening for the AWT ranged from 13 to 33 m (43-108 ft) and averaged
25 m (80 ft) while fishing.
Demersal echosign was sampled with a poly Nor’eastern bottom trawl (PNE) with roller gear. The
PNE is a high-opening trawl equipped with roller gear and constructed with stretch mesh sizes that
range from 13 cm (5 in) in the forward portion of the net to 8.9 cm (3.5 in) in the codend. The
codend was fitted with a 3.2 cm (1.25 in) nylon mesh liner. The 27.2 m (89.1 ft) headrope held 21
floats [30 cm (12 in) diameter]. A 24.7 m (81 ft) chain fishing line was attached to a 24.9 m
(81.6 ft) footrope constructed of 1 cm (0.4 in) 6 × 19 wire rope wrapped with polypropylene rope.
The trawl was also rigged with triple 54.9 m (180 ft) galvanized wire rope dandylines. The
rollergear was attached to the fishing line using chain toggles [2.9 kg (6.5 lb) each] comprised of
five links and one ring. The 24.2 m (79.5 ft) roller gear was constructed with 36 cm (14 in) rubber
bobbins spaced 1.5-2.1 m (5-7 ft) apart. A solid string of 10 cm (4 in) rubber disks separated some
of the bobbins in the center section of the roller gear. Two 5.9 m (19.5 ft) wire rope extensions with
10 cm (4 in) and 20 cm (8 in) rubber disks were used to span the two lower flying wing sections and
were attached to the roller gear. The net was fished with the Fishbuster trawl doors. The vertical
net opening and depth were monitored with a Furuno netsounder system attached to the headrope.
The PNE trawl vertical mouth opening ranged from 6 to 10 m (20-32 ft) and averaged 7 m (23 ft)
while fishing.
Oceanographic Equipment
Physical oceanographic data collected during the cruise included temperature/depth profiles
obtained with a Sea-Bird Electronics temperature-depth probe (SBE-39) attached to the trawl
headrope, and conductivity-temperature-depth (CTD) observations collected with a Sea-Bird CTD
system at calibration sites. Sea surface temperature and salinity data were measured using the Miller
Freeman's Sea-Bird Electronics SBE-21 probe located mid-ship, approximately 5 m below the
water line. These and other environmental data were recorded using the ship’s Scientific
Computing System (SCS).
3

Survey Design
Parallel transect designs were used, except where it was necessary to reorient tracklines in order to
maintain a perpendicular alignment to the bathymetry. A random start position was generated for
the first transect for all surveys. The Shumagin Islands survey was conducted between 15 and 18
February using transects spaced 9.3 km (5 nautical miles (nmi)) apart within Shumagin Trough,
1.9 km (1 nmi) apart east of Renshaw Point, and 4.6 km (2.5 nmi) apart elsewhere (Fig. 1). Bottom
depths did not exceed 220 m along any transect, and transects generally did not extend into waters
less than about 50 m depth. The Sanak Trough survey was conducted between 18 and 19 February
using transects spaced 3.7 km (2 nmi) apart. Bottom depths did not exceed 160 m along any
transect, and transects generally did not extend into waters less than about 50 m depth (Fig. 1). The
Morzhovoi Bay survey was conducted 19 February using transects spaced 4.6 km (2.5 nmi) apart.
Bottom depths did not exceed 161 m along any transect, and transects generally did not extend into
waters less than about 50 m depth (Fig. 1). The survey of the shelf break southeast of Chirikof
Island to near the mouth of Barnabas Trough was conducted between 14 and 16 March along
transects spaced 11.1 km (6 nmi) apart between the 200 and 1,000 m depth contours (Fig. 2). The
Shelikof Strait sea valley was surveyed from south of Chirikof Island to north of Kuliak Bay on the
Alaska Peninsula between 16 and 22 March using 13.9 km (7.5 nmi) transect spacing (Fig. 2).
Bottom depths did not exceed 340 m along any transect, and transects generally did not extend into
waters less than about 100 m depth. All surveys were conducted 24 hours per day.
Trawl hauls were conducted to identify echosign and to provide biological samples. Average
trawling speed was approximately 1.5 m/s (3 knots). Pollock were sampled to determine sex, fork
length (FL), body weight, age, maturity, and ovary weight of selected females (Tables 1 and 2).
Pollock were measured to the nearest centimeter. An electronic motion-compensating scale (Marel
M60) was used to weigh individual pollock. For age determinations, pollock otoliths were collected
and stored in a 50% ethanol-water solution. Maturity was determined by visual inspection and was
4

2categorized as immature, developing, pre-spawning, spawning, or post-spawning . All data were
electronically recorded using the Fisheries Scientific Computing System (FSCS) developed by
NOAA’s Office of Marine and Aviation Operations to digitally collect data aboard research vessels.
Data were stored in a relational database. Additional samples of ovaries were collected for ongoing
3research by AFSC scientists . Whole fish were frozen for training specimens for the AFSC
Fisheries Monitoring and Analysis Division’s Observer Program.
Standard sphere acoustic system calibrations (Foote et al. 1987) were conducted to measure acoustic
system performance for the ER60. During the calibrations, the Miller Freeman was anchored at the
bow and stern. Weather, sea state conditions, and acoustic system settings were recorded. A
tungsten carbide sphere (38.1 mm diameter) and a copper sphere (64 mm diameter) were suspended
below the centerboard-mounted transducers. The tungsten carbide sphere was used to calibrate the
38, 120, and 200 kHz systems, and the copper sphere was used to calibrate the 18 kHz system.
After each sphere was centered on the acoustic axis, split beam target strength and echo integration
data were collected. Transducer beam characteristics were modeled by moving each sphere through
the beam and collecting target strength (TS) data using Simrad EKLOBES software.
Data Analysis
Echo integration data were collected between 14 m of the surface and 0.5 m of the bottom, except
where the bottom exceeded 1,000 m, the lower limit of data collection. Echosign data identified as
pollock were stored in a relational database. Pollock length data were aggregated into strata based
on echosign type, geographic proximity of hauls, and similarity in size composition data. Estimates
of pollock backscattering strength for each stratum were then calculated using an sV threshold of
–70 decibels (dB). The echo integration values were summed and scaled using a previously derived
relationship between TS and fish lengths (TS = 20 Log L - 66; Traynor 1996) and the length
2 ADP Codebook. 2005. Unpublished document. Resource Assessment and Conservation Engineering Division, Alaska
Fisheries Science Center, NMFS, NOAA; 7600 Sand Point Way NE, Seattle, WA 98115
3 B. Megrey, Alaska Fisheries Science Center, NMFS, NOAA; 7600 Sand Point Way NE, Seattle WA 98115
5

composition data to produce estimates of pollock numbers by length. Mean weight-at-length was
estimated from the trawl data when there were more than five pollock for that length; otherwise
mean weight was estimated from a linear regression of the natural logs of all the length-weight data.
Age-specific estimates of biomass and numbers will be generated for the surveys after the otolith
samples are aged.
Relative estimation errors for the acoustic data were derived using a 1D geostatistical method
(Petitgas 1993, Williamson and Traynor 1996, and Rivoirard et al. 2000). Relative estimation error
is defined as the ratio of the square root of the estimation variance to the estimate of acoustic
abundance. Geostatistical methods are used for computation of error because they account for the
observed spatial structure in the fish distribution. These errors quantify only transect sampling
variability. Other sources of error (e.g., target strength, trawl sampling) are not included.
RESULTS and DISCUSSION
Calibration
Acoustic system calibrations were conducted before, during, and after the winter EIT surveys in the
Bering Sea and Gulf of Alaska (Table 3). The 38-kHz collection system showed no significant
differences in gain parameters or transducer beam pattern characteristics between calibrations,
confirming that the acoustic system was stable throughout the surveys.
Shumagin Islands
Oceanographic Conditions
Surface water temperatures, which were based on SBE-39 data, ranged from 3.0º to 4.2º C with a
mean of 3.4º C (Fig. 3). Mean surface temperatures for the 2001-2003 and 2005 surveys ranged
from 3.4º to 5.6º C. Temperatures at the depths where the bulk of the pollock biomass occurred off
6

Renshaw Point (130-180 m) ranged from 3.8º to 4.0º C, whereas temperatures at fish depth in
Shumagin Trough (130-160 m) were warmer, ranging from 5.2º to 5.8º C.
Biological Sampling
Biological data and specimens were collected in the Shumagin Islands from nine AWT trawl hauls
and two bottom trawls (Tables 1 and 4; Fig. 1). In the midwater tows, pollock was the most
abundant species, comprising 95.7% by weight (Table 5). By numbers, pollock, eulachon and
capelin contributed 42.9%, 29.6% and 21.8% of the catch, respectively. The eulachon
(Thaleichthys pacificus) and capelin (Mallotus villosus) occurred primarily in Shumagin Trough.
Pollock comprised 51.2% by weight of the bottom trawl catches (Table 6). Arrowtooth flounder
(Atheresthes stomias), flathead sole (Hippoglossoides elassodon) and Pacific halibut (Hippoglossus
stenolepis) were the next most abundant species by weight, comprising 23.1%, 9.1% and 8.0%,
respectively.
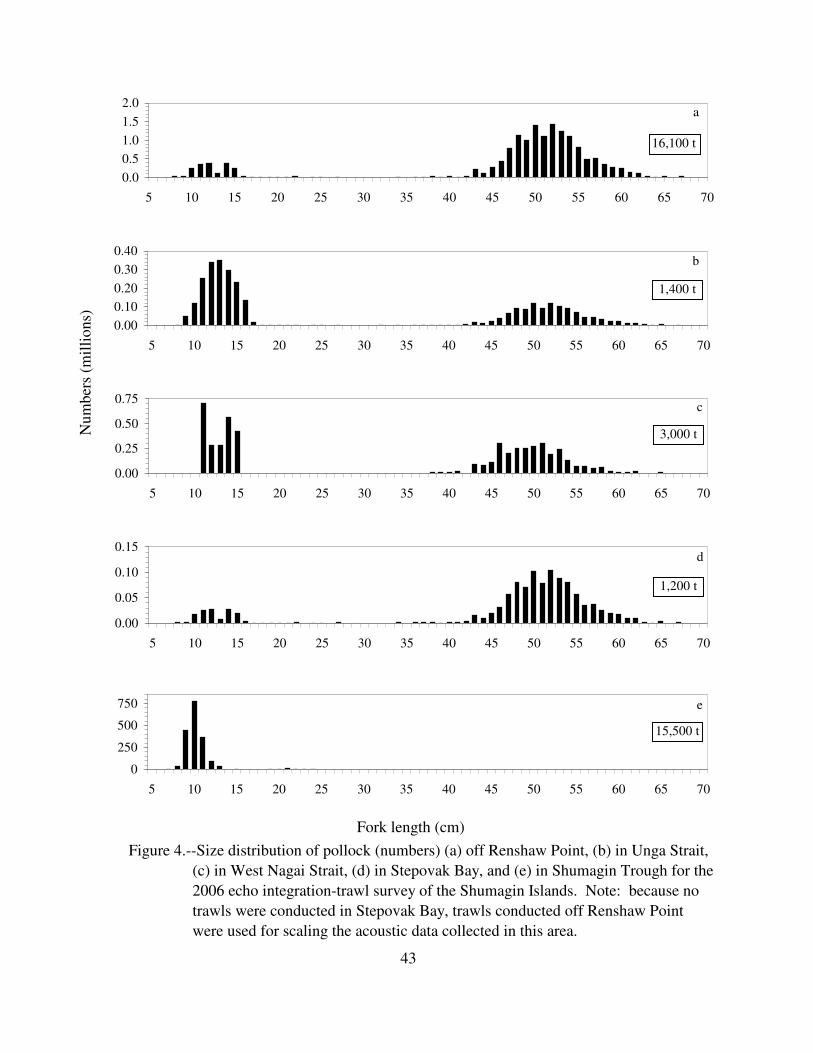
Trawl catches contained bimodal length distributions of age-1 and adult pollock with few fish
between 15 and 40 cm FL (Fig. 4). The length distributions of adults were similar in all areas
surveyed. Catches in Shumagin Trough contained primarily age-1 pollock, with trace amounts of
age-2 pollock. Within the age-1 category, the distribution was bimodal off Renshaw Point, with
modes at 12 and 14 cm FL. Bimodality with the age-1 category has never before been observed in
any GOA survey.
The unweighted maturity composition for males longer than 40 cm FL was 0% immature, 3%
developing, 66% pre-spawning, 30% spawning, and <1% spent (Fig. 5a). The maturity composition
of females longer than 40 cm was 0% immature, 3% developing, 92% pre-spawning, 2% spawning,
and 2% spent (Fig. 5b). A logistic model fit to the female maturity-at-length data predicted that
50% of females (l50) were mature at 38 cm FL (Fig. 5c), although there were no observations
between 36 and 50 cm FL. The 2006 l50 is similar to the 2005 l50 of 36 cm FL. The average GSI
7

(gonadosomatic index: ovary weight/body weight) of pre-spawning females was 0.13 (Fig. 5d),
which also was similar to previous Shumagin Island surveys.
Distribution and Abundance
Acoustic data were collected along 723 km (390 nmi) of tracklines. The densest aggregations were
off Renshaw Point, although in significantly less quantities than detected in previous surveys (Fig.
6). Pollock were distributed demersally as well as in dense, midwater schools. Most of the biomass
was deeper than 140 m and was within 40 m of the bottom (Fig. 7). Little echosign was detected
outside of the Renshaw Point area except for the eastern transects in Shumagin Trough.
The abundance estimate for the Shumagin Islands area is 1,788 million pollock weighing
37,000 metric tons (t). The area off Renshaw Point accounted for 43% of the biomass. Significant
quantities of age-1 pollock were observed in the Shumagin Trough for the first time since 2001,
which accounts for the dramatic increase in the number of pollock, up from the 2005 survey
estimate of 64 million. The relative estimation error of the biomass based on the one-dimensional
analysis of echosign was 10.1%.
The abundance of pollock in the Shumagin Islands has declined since the mid-1990s. The 2006
biomass estimate is the lowest in survey history and is only 12% of the 1995 estimate of 290,000 t
(Table 7, Fig. 8). Inference about abundance trends, however, is difficult to make for several
reasons. Only the 1995, 2001-03, and 2005-06 surveys covered the entire Shumagin Islands area.
Also, it is unknown whether changes in abundance reflect variation in the timing of peak spawning
or actual changes in the population. With the exception of the 1994 survey, which occurred in
March well after peak spawning had occurred, the dates of the Shumagin Island survey have been
similar between years but the timing of peak spawning has varied. For example, for the 2001
survey, 52% of the adult females were classified as pre-spawning whereas 15% were spawning and
30% were spent, which suggests that the peak had already occurred and that some fish might have
already left the area. The Shumagin Islands surveys also may not provide predictions of future
pollock abundance in the Gulf of Alaska. For example, over one-half of the adult pollock in 2001
8

consisted of fish from the 1993, 1994, and 1995 year classes; however, these year classes were
either detected in low numbers or were absent entirely as juveniles during the 1994, 1995, and 1996
surveys (Fig. 9).
Sanak Trough
Oceanographic Conditions
Surface water temperatures ranged from 1.9º to 3.3º C with a mean of 2.8º C (Fig. 10). Mean
surface temperatures were cooler than in 2003 (5.1º C) and 2005 (4.2º C). Temperatures where
most of the pollock biomass was located (60-110 m) ranged from 2.8º to 3.5º C with a mean of
3.1º C, which was cooler than water at depths where most of the pollock biomass was located in
2003 (5.3º C) and 2005 (4.4º C).
Biological Sampling
Biological data and specimens were collected in Sanak Trough from two AWT trawl hauls and two
bottom trawl hauls fished in mid-water (Tables 1 and 4; Fig. 1). Pollock was the most abundant
species in the AWT catches, comprising nearly 99.5% by weight (Table 8). Pollock comprised
100% of the bottom trawl catches (Table 9). Most pollock captured ranged from 40 to 65 cm FL
(Fig. 11) with a mean of 52 cm FL, which was similar to the previous surveys.
The unweighted maturity composition for males longer than 40 cm FL was 0% immature, 2%
developing, 19% pre-spawning, 67% spawning, and 11% spent (Fig. 12a). The maturity
composition of females longer than 40 cm FL was 1% immature, 1% developing, 64% pre-
spawning, 7% spawning, and 17% spent (Fig. 12b). The high percentage of post-spawning fish
suggests that the survey timing was late. A similar result was obtained for the 2003 and 2005 Sanak
Trough surveys, where 27% and 17% of the females were spent, respectively, which suggests that
Sanak Trough should be surveyed earlier in the season. However, competition for vessel time with
9

other user groups makes this schedule change uncertain. Because of the lack of fish shorter than 40
cm FL, a logistic model could not be fitted to the female maturity at length data (Fig. 12c). The
average GSI for pre-spawning females was 0.16 (Fig. 12d), which was similar to the previous
surveys.
Distribution and Abundance
Acoustic data were collected along 200 km (108 nmi) of tracklines. The densest aggregations were
observed in the northern part of the trough, which is similar to the 2003 survey results but opposite
from 2005, when the densest aggregations were detected off Sanak Island (Fig. 6). Pollock were
distributed both demersally as well as in dense, midwater schools over bottom depths between 70
and 130 m (Fig. 13). The abundance estimate for Sanak Trough is 120 million pollock weighing
127,000 t. The relative estimation error of the biomass based on the 1D analysis of echosign was
10.4%. The biomass in 2006 increased substantially from 2003 (82,000 t) and 2005 (68,000 t;
Table 7). Age-1 pollock have not been observed in a Sanak Trough survey.
Morzhovoi Bay
Oceanographic Conditions
Surface water temperatures ranged from 1.4º to 1.7º C with a mean of 1.5º C (Fig. 14).
Temperatures were slightly warmer where most of the pollock biomass was located (80-100 m),
ranging from 1.5º to 2.2º C with a mean of 1.9º C.
Biological Sampling
Biological data and specimens were collected in Morzhovoi Bay from PNE trawl hauls, one of
which was fished in mid-water (Tables 1 and 4; Fig. 1). Pollock comprised 99.6% by weight of the
10

catch (Table 10). Most of the pollock in Morzhovoi Bay ranged from 40 to 60 cm FL, with a mean
of 51 cm FL (Fig. 15). A small amount of age-1 pollock was also present in the catches.
The unweighted maturity composition for males longer than 40 cm FL was 0% immature, 1%
developing, 15% pre-spawning, 79% spawning, and 4% spent (Fig. 16a). Only four females were
collected for length and maturity measurements, thus the maturity composition, logistic model fit,
and GSI estimates could not be completed. The large proportion of males categorized as spawning
and the absence of females suggest that peak spawning biomass may have already occurred.
Distribution and Abundance
Acoustic data were collected along 122 km (66 nmi) of tracklines. The densest aggregations were
detected in the mouth of the bay near the sea floor over bottom depths of 95-115 m (Figs. 6, 17).
The abundance estimate for Morzhovoi Bay is 13 million pollock weighing 12,000 t. The relative
estimation error of the biomass based on the 1D analysis of echosign was 15.1%. This was the first
survey in this area.
Shelf Break Area Near Chirikof Island
Oceanographic Conditions
Surface water temperatures ranged from 4.0º to 4.6º C with a mean of 4.3º C (Fig. 18). Mean
surface temperatures were similar to 2004 (4.8º C) and 2005 (4.4º C). Temperatures where most of
the pollock biomass was located (300-400 m) ranged from 4.5º to 5.1º C with a mean of 4.8º C,
which was similar to 2004 (4.7º C) and 2005 (4.8º C).
11

Biological Sampling
Biological data and specimens were collected along the Gulf of Alaska shelf break near Chirikof
Island from four AWT trawl hauls (Tables 2, 11; Fig. 2). No bottom trawls were conducted in this
area. Pollock was the most abundant species by weight, comprising 93.4% of the catch
(Table 12). By numbers, pollock, myctophids, and shrimp contributed 35.2%, 28.8, and 26.7% of
the catch, respectively. Most pollock captured ranged from 45 to 60 cm FL with a mean of 49 cm
FL (Fig. 19), which was similar to the 2004-2005 surveys. In contrast, most of the pollock captured
during the 2002-2003 surveys in this area were longer than 50 cm FL. No juvenile pollock have
been captured during Chirikof surveys.
The unweighted maturity composition in the Chirikof Island area for males longer than 40 cm FL
was 0% immature, 0% developing, 46% mature pre-spawning, 54% spawning, and 0% spent
(Fig. 20a). The maturity composition of females longer than 40 cm FL was 0% immature, 2%
developing, 98% pre-spawning, 0% spawning, and 0% spent (Fig. 20b). The high percentage of
pre-spawning females indicates that peak spawning had not occurred. Because of the lack of fish
shorter than 40 cm FL, a logistic model could not be fitted to the female maturity-at-length data
(Fig. 20c). The average GSI for pre-spawning females of 0.14 (Fig. 20d) was similar to previous
surveys.
Distribution and Abundance
Acoustic data were collected along 300 km (162 nmi) of tracklines. Most of the echosign attributed
to pollock occurred in midwater layers between 275 and 400 m depth south of the mouth of
Barnabas Trough over bottom depths of 300-1,000 m (Figs. 21-22). Substantial acoustic
backscattering attributed to myctophids and other micronekton species occurred offshore at about
200-300 m depth. This myctophid scattering layer, which occurred mostly over bottom depths from
800 m to deeper than 1,500 m, may have obscured low densities of pollock.
12

The abundance estimate for the Chirikof Island area is 61 million pollock weighing 69,000 t. The
relative estimation error of the biomass based on the one-dimensional analysis of echosign was
11.0%. The biomass in 2006 was slightly less than the 77,000 t observed in 2005, but greater than
the 2004 and 2003 estimates of 30,000 and 31,000 t, respectively (Table 7). Because of the absence
of age-1 and age-2 pollock during these surveys, forecasts of future pollock abundance are not
possible.
Shelikof Strait
Oceanographic Conditions
Surface water temperatures ranged from 2.1º to 4.5º C with a mean of 3.5º C (Fig. 23). Mean
surface temperatures were slightly cooler than in 2004 (3.8º C) and 2005 (4.0º C). Temperatures
increased with depth, rising to an average of 4.4º at 150 m to 5.3º C at 250 m. Similar temperature
distributions were observed during 2004 and 2005.
Biological Sampling
Biological data and specimens were collected in Shelikof Strait from 17 AWT trawl hauls and 2
bottom trawls (Tables 2, 11; Fig. 2). Pollock and eulachon were the most abundant species by
weight in midwater trawl hauls, comprising 78.7% and 17.8%, respectively, of the total catch (Table
13). A single Pacific sleeper shark (Somniosus pacificus) accounted for 40.8% of the catch weight
in the bottom trawls. Arrowtooth flounder comprised 33.4% of the catch in the bottom trawls,
while pollock comprised 15.4% of the catch (Table 14).
Trawl hauls conducted in near-bottom pollock echosign between Cape Unalishagvak and Katmai
Bay on the western side of the Strait contained fish mostly from 35 to 50 cm FL (Fig. 24a). Trawl
hauls conducted in near-bottom pollock echosign south of Cape Ikolik as well as on the Kodiak
Island side of the Strait caught significant amounts of 1-and 2-year old pollock (9-16 and 17-24 cm
13

FL, respectively), although adults dominated by weight (Fig. 24b). Hauls conducted in mid-water
layers caught mostly 2-year old pollock with a lesser amount of 1-year old pollock and older fish
(Fig. 24c).
The unweighted maturity composition in the Shelikof Strait area for males longer than 40 cm FL
was 3% immature, 4% developing, 60% mature pre-spawning, 34% spawning, and 0% spent
(Fig. 25a). The maturity composition of females longer than 40 cm FL was 3% immature, 4%
developing, 91% pre-spawning, 1% spawning, and 0% spent (Fig. 25b). These results are similar to
previous survey results in terms of low numbers of spawning and spent female fish, which suggests
that the survey timing was appropriate. A logistic model provided a reasonable fit to the female
maturity at length data and predicted that 50% of females were mature at 43 cm FL (Fig. 25c),
which is similar to most estimates since 1985. The average GSI for pre-spawning females of 0.14
(Fig. 25d) was similar to the mean GSI in 2005 (0.15) and 2004 (0.16), but greater than the mean
GSIs for 2002 (0.12) and 2003 (0.11). The current mean is also similar to the mean GSIs (0.14
0.19) reported for other recent (1992-2001) surveys.
Distribution and Abundance
Acoustic data were collected along 1,760 km (950 nmi) of tracklines. Mature, pre-spawning
pollock were detected along the northern side of the Strait from Cape Unalishagvak to Katmai Bay
(Fig. 21), although the abundance was lower than in 2005, which in turn was lower than in the mid-
to late-1990s. Adult pollock mixed with juvenile pollock were located farther offshore and on the
Kodiak Island side of the Strait as well as south of the mouth of the Strait (between Cape Ikolik and
Wide Bay) to near the Semidi Islands. Fish were generally located within 50 m of the seafloor over
bottom depths exceeding 200 m (Fig. 26). Mid-water layers of juvenile pollock were detected
primarily in the northern portion of the survey area on the Kodiak Island side of the Strait (Fig. 27).
These fish were located well off bottom from 100 m to 175 m below the surface (Fig. 26).
14
The abundance estimate for Shelikof Strait is 1.2 billion pollock weighing 294,000 t. The relative
estimation error of the biomass based on the one-dimensional analysis of echosign was 4.0%. The
pollock biomass in Shelikof Strait declined dramatically in the 1980s, falling from 2.8 million t in
1981 to 290,000 t in 1989 (Fig. 29). The biomass gradually rose in the 1990s, reaching 777,000 t in
1996. The biomass then declined to an all-time low of 257,000 t in 2002. Since then, the
population gradually increased to 356,000 t in 2005 before dropping to its current level of 293,600 t
(Table 7).
The 1994 year class, which represented the largest contributor of 1-year old pollock (10.7 billion
fish) in the history of the Shelikof Strait area EIT surveys and dominated abundance estimates
through 1998, effectively disappeared by 2003 (Figs. 29-30; Tables 15-18). The 1999 year class
(4.5 billion fish in 2000) provided the second largest 1-year old estimate in survey history and has
dominated biomass estimates since 2001. The estimate of 162 million 1-year old pollock in 2006 is
substantially less than the 2005 estimate of 1.6 billion pollock and suggests a relatively weak 2005
year class.
Gear Testing
Following the Shelikof Strait survey, six pairs of alternate AWT trawls were conducted to compare
the retention rate of juvenile pollock to older pollock between the two mesh sizes of the codend
liners used during GOA surveys (Table 11). An AWT was loaded onto each net reel with a 1.3-cm
liner attached to one codend and a 3.2-cm codend liner attached to the other. The study was
conducted near the site where Haul 10 was conducted, where a mixture of age-1, age-2, and older
pollock were caught. The first choice for each pair of tows was chosen at random. After three pairs
of tows were completed, the codends were switched to the opposite AWT in case there was an
AWT effect. Preliminary analysis showed about a threefold higher retention of age-1 pollock for
the 1.3 cm codend liner than for the 3.2 cm liner (Fig. 31). Additionally, pocket nets attached to the
outsides of the forward and intermediate areas of the trawls captured a higher ratio of age-1 to older
15
pollock than was observed in either codend, suggesting that a substantial amount of age-1 pollock
are filtered out of the trawl. Further analysis is in progress.
Another exercise conducted following the Shelikof Strait survey was the continued field testing of
an acoustically controlled multiple opening and closing codend (MOCC) device installed in place of
the standard AWT codend. The MOCC is controlled by an acoustic link to the ship and contains
three codends so up to three discrete samples may be collected during a single trawl haul. Primary
objectives of this gear trial were to determine the transit time of fish through the entire length of the
AWT and to configure the MOCC so that fish did not accumulate immediately in front of the
MOCC frame within the AWT. Thirteen MOCC tows were conducted, the last five with the back
end of the codends tied shut so that fish could be retained (Table 11). A video camera attached near
the MOCC frame along with the WESMAR net sounder was used for data collection. Preliminary
information suggests about 5-10 minutes are required for pollock to transit through the AWT,
although more work is needed to verify this under different environmental conditions. Overall, the
MOCC performed well, and although needing several minor modifications, the MOCC will soon
become a standard component of the MACE gear.
ACKNOWLEDGMENTS
The authors would like to thank the officers and crew of the NOAA ship Miller Freeman for their
contribution to the successful completion of this work.
16

CITATIONS
Bodholt, H., and H. Solli. 1992. Split beam techniques used in Simrad EK500 to measure target
strength, p.16-31. In World Fisheries Congress, May 1992, Athens, Greece.
Foote, K.G., H.P. Knudsen, G. Vestnes, and E.J. Simmonds. 1987. Calibration of acoustic
instruments for fish density estimation: a practical guide. ICES Cooperative Research
Reports, International Council for the Exploration of the Sea, No. 144. 69 p.
Petitgas, P. 1993. Geostatistics for fish stock assessments: a review and an acoustic application.
ICES J. Mar. Sci. 50: 285-298.
Rivoirard, J., J. Simmonds, K.G. Foote, P. Fernandez, and N. Bez. 2000. Geostatistics for
estimating fish abundance. Blackwell Science Ltd., Osney Mead, Oxford OX2 0EL,
England. 206 p.
Simrad. 1997. Operator Manual for Simrad EK500 Scientific echo sounder – Base version.
Simrad AS, Strandpromenenaden 50, Box 111, N-3191 Horten, Norway.
Simrad. 2004. Operator Manual for Simrad ER60 Scientific echo sounder application. Simrad
AS, Strandpromenenaden 50, Box 111, N-3191 Horten, Norway.
Traynor, J. J. 1996. Target strength measurements of walleye pollock (Theragra chalcogramma)
and Pacific whiting (Merluccius productus). ICES J. Mar. Sci. 53: 253-258.
17

Williamson, N., and J. Traynor. 1996. Application of a one-dimensional geostatistical
procedure to fisheries acoustic surveys of Alaskan pollock. ICES J. Mar. Sci. 53: 423
428.
18

.
SCIENTIFIC PERSONNEL
Shumagin Island and Sanak Trough Surveys
Name Position Organization
Michael Guttormsen Chief Scientist AFSC
Scott Furnish Computer Spec. AFSC
Taina Honkalehto Fishery Biologist AFSC
Denise McKelvey Fishery Biologist AFSC
Robert Self Fishery Biologist AFSC
Kresimir Williams Fishery Biologist AFSC
Tyler Yasenak Fishery Biologist AFSC
William Floering Fishery Biologist AFSC
Shelikof Strait and Shelf Break Area Near Chirikof Island Surveys
Name Position Organization
Michael Guttormsen Chief Scientist AFSC
Paul Walline Fishery Biologist AFSC
Tyler Yasenak Fishery Biologist AFSC
Kresimir Williams Fishery Biologist AFSC
Robert Self Fishery Biologist AFSC
Josh Millstein Statistician AFSC
Scott Furnish Computer Spec. AFSC
Sandi Neidetcher Fishery Biologist AFSC
Steve Porter Fishery Biologist AFSC
AFSC – Alaska Fisheries Science Center, Seattle, WA
19


Table 1.--Number of biological samples and measurements collected during the winter
2006 echo integration-trawl survey of walleye pollock in the Shumagin Islands
area (hauls 1-11), Sanak Trough (hauls 12-15), and Morzhovoi Bay
(hauls 16-17) in the Gulf of Alaska.
Pollock
Haul Weights Ovaries Seabird Eulachon Capelin
No. Lengths and maturity weighed Otoliths observations lengths lengths
1 109 26 -- 5 y 91 112
2 127 21 -- 11 y 79 30
3 261 101 -- 5 y -- --
4 14 -- -- -- y -- --
5 308 49 30 49 y -- --
6 134 80 33 80 y -- --
7 309 64 26 64 y -- --
8 334 100 33 100 y -- --
9 254 42 18 -- y -- --
10 181 28 7 28 y -- --
11 306 68 14 30 y -- --
12 389 88 21 46 y -- --
13 298 75 36 75 y -- --
14 345 101 32 101 y -- --
15 327 60 10 30 y -- --
16 351 132 -- 101 y -- --
17 304 100 1 100 y
Totals 4351 1135 261 825 170 142
21

Table 2.--Number of biological samples and measurements collected during the winter 2006 echo
integration-trawl survey of walleye pollock in the Gulf of Alaska shelf break near Chirikof
Island (hauls 1-4) and Shelikof Strait area (hauls 5-23).
22
Pollock
Haul Weights Ovary Seabird Eulachon Eulachon Lanternfish
no. Lengths and maturity weights Otoliths observations lengths weights lengths
1 150 104 46 100 y -- -- 40
2 370 104 62 104 y -- -- --
3 48 48 27 48 y 30 30 --
4 178 103 47 103 y 23 23 --
5 76 27 4 14 y 41 41 --
6 356 93 22 69 y 51 -- --
7 227 81 19 61 y 100 26 --
8 190 20 -- 20 y 38 -- --
9 350 81 30 71 y 35 35 --
10 364 88 20 59 y 80 25 --
11 360 82 26 53 y 49 -- --
12 370 84 29 52 y 50 -- --
13 52 19 2 9 y 32 32 --
14 229 101 31 50 y 37 10 --
15 348 89 38 49 y 82 25 --
16 339 81 43 47 y 73 -- --
17 563 55 34 54 y 70 -- --
18 395 36 15 32 y 52 -- --
19 319 94 33 56 y 48 -- --
20 278 74 51 50 y 65 -- --
21 217 -- -- -- y 55 -- --
22 175 14 4 14 y 16 -- --
23 340 26 10 26 y 51 -- --
Totals 6294 1504 593 1141 1078 247 40
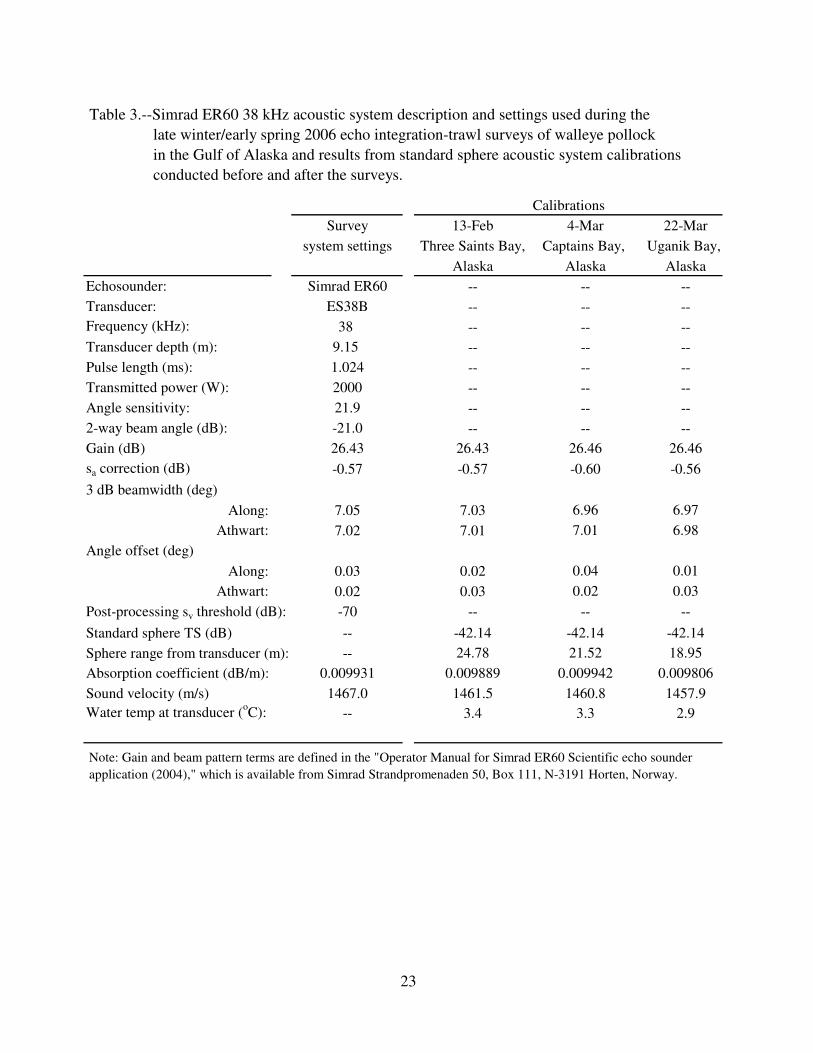
Table 3.--Simrad ER60 38 kHz acoustic system description and settings used during the
late winter/early spring 2006 echo integration-trawl surveys of walleye pollock
in the Gulf of Alaska and results from standard sphere acoustic system calibrations
conducted before and after the surveys.
Calibrations
Survey 13-Feb 4-Mar 22-Mar
system settings Three Saints Bay, Captains Bay, Uganik Bay,
Alaska Alaska Alaska
Echosounder: Simrad ER60 -- -- -
Transducer: ES38B -- -- -
Frequency (kHz): 38 -- -- -
Transducer depth (m): 9.15 -- -- -
Pulse length (ms): 1.024 -- -- -
Transmitted power (W): 2000 -- -- -
Angle sensitivity: 21.9 -- -- -
2-way beam angle (dB): -21.0 -- -- -
Gain (dB) 26.43 26.43 26.46 26.46
sa correction (dB) -0.57 -0.57 -0.60 -0.56
3 dB beamwidth (deg)
Along: 7.05 7.03 6.96 6.97
Athwart: 7.02 7.01 7.01 6.98
Angle offset (deg)
Along: 0.03 0.02 0.04 0.01
Athwart: 0.02 0.03 0.02 0.03
Post-processing sv threshold (dB): -70 -- -- -
Standard sphere TS (dB) -- -42.14 -42.14 -42.14
Sphere range from transducer (m): -- 24.78 21.52 18.95
Absorption coefficient (dB/m): 0.009931 0.009889 0.009942 0.009806
Sound velocity (m/s) 1467.0 1461.5 1460.8 1457.9 o
Water temp at transducer ( C): -- 3.4 3.3 2.9
Note: Gain and beam pattern terms are defined in the "Operator Manual for Simrad ER60 Scientific echo sounder
application (2004)," which is available from Simrad Strandpromenaden 50, Box 111, N-3191 Horten, Norway.
23

Table 4.--Summary of trawl and catch data from the 2006 pollock echo integration-trawl surveys of the Shumagin
Islands area (hauls 1-11), Sanak Trough (hauls 12-15), and Morzhovoi Bay (hauls 16-17) in the Gulf of
Alaska.
24
Haul Gear1
Date Time Duration Start position Depth (m) Temp. (deg. C) Pollock catch Other catch
no. type (GMT) (minutes) Lat. (N) Long. (W) footrope bottom footrope surface kg number kg number
1 AWT 15 Feb 4:29 20 55 28.02 158 38.39 155 167 5.7 4.2 2 270 48 7,156
2 AWT 15 Feb 14:50 13 55 21.22 158 57.49 171 182 5.5 4.0 45 3,635 88 12,544
3 AWT 15 Feb 19:11 6 55 19.59 159 08.09 167 184 5.5 3.9 65 8,992 156 3,910
4 AWT 16 Feb 5:15 13 55 29.50 159 39.07 154 169 4.5 3.9 1 14 1 67
5 PNE 16 Feb 17:23 15 55 33.89 160 04.64 168 168 4.0 3.3 332 475 282 1,540
6 AWT 17 Feb 0:16 3 55 35.03 160 17.09 144 193 3.8 3.4 165 134 0 0
7 AWT 17 Feb 2:14 3 55 33.32 160 16.19 152 184 -- -- 8,000 6,793 0 0
8 AWT 17 Feb 4:19 19 55 33.21 160 10.54 162 181 -- -- 1,834 1,532 2 403
9 AWT 17 Feb 14:35 10 55 26.69 160 29.52 131 148 3.9 3.0 313 3,632 14 3,042
10 PNE 17 Feb 16:21 15 55 25.78 160 34.55 133 133 4.0 3.0 251 6,052 275 579
11 AWT 17 Feb 21:46 20 55 12.88 160 11.43 200 221 3.8 3.5 859 1,459 191 8,030
12 AWT 18 Feb 10:28 1 54 27.60 162 30.40 134 158 3.4 3.0 2,310 2,420 54 12
13 AWT 18 Feb 19:35 1 54 39.80 162 32.96 86 126 2.8 2.7 7,500 6,899 0 0
14 PNE 19 Feb 0:36 1 54 43.11 162 37.77 97 127 3.3 3.4 7,200 7,005 0 0
15 PNE 19 Feb 3:54 2 54 45.00 162 55.42 72 99 3.0 1.9 556 545 0 0
16 PNE 19 Feb 11:14 7 54 55.26 162 59.24 101 120 1.8 1.5 751 804 0 0
17 PNE 19 Feb 15:22 3 54 51.20 163 06.34 100 100 2.1 1.4 463 508 5 2
1AWT = Aleutian wing trawl, PNE = poly Nor'eastern bottom trawl.

Table 6.--Summary of catch by species in two bottom trawls conducted during the 2006
Table 5.--Summary of catch by species in nine midwater trawls conducted during the 2006
pollock echo integration-trawl survey of the Shumagin Islands area.
Common name Scientific name Weight (kg) Percent Numbers Percent walleye pollock Theragra chalcogramma 11,282.5 95.7% 26,461 42.9%
eulachon Thaleichthys pacificus 144.0 1.2% 18,235 29.6%
salmon shark Lamna ditropis 120.0 1.0% 1 < 0.1%
arrowtooth flounder Atheresthes stomias 85.3 0.7% 122 0.2%
capelin Mallotus villosus 73.0 0.6% 13,440 21.8%
Pacific sleeper shark Somniosus pacificus 37.3 0.3% 2 < 0.1%
Pacific cod Gadus macrocephalus 19.2 0.2% 5 < 0.1%
Chinook salmon Oncorhynchus tshawytscha 13.8 0.1% 10 < 0.1%
flathead sole Hippoglossoides elassodon 3.3 < 0.1% 22 < 0.1%
fish larvae unident. fish larvae unident. 2.2 < 0.1% 2,219 3.6%
shrimp unident. Decapoda 1.3 < 0.1% 868 1.4%
squid unident. Teuthoidea 1.0 < 0.1% 151 0.2%
Pacific herring Clupea pallasi 0.3 < 0.1% 44 0.1%
rock sole sp. Lepidopsetta sp. 0.2 < 0.1% 1 < 0.1%
isopod unident. Isopoda 0.1 < 0.1% 25 < 0.1%
ribbed sculpin Triglops pingeli < 0.1 < 0.1% 5 < 0.1%
salps unident. Thaliacea < 0.1 < 0.1% 2 < 0.1%
Total 11,783.5 61,613
25

Table 6.--Summary of catch by species in two bottom trawls conducted during the 2006
pollock echo integration-trawl survey of the Shumagin Islands area.
Common name Scientific name Weight (kg) Percent Numbers Percent walleye pollock Theragra chalcogramma 583.7 51.2% 6,527 75.5%
arrowtooth flounder Atheresthes stomias 263.2 23.1% 415 4.8%
flathead sole Hippoglossoides elassodon 103.2 9.1% 302 3.5%
Pacific halibut Hippoglossus stenolepis 90.6 8.0% 28 < 0.1%
big skate Raja binoculata 23.1 2.0% 1 < 0.1%
rex sole Glyptocephalus zachirus 14.2 1.2% 68 0.8%
Aleutian skate Bathyraja aleutica 11.6 1.0% 1 < 0.1%
Pacific cod Gadus macrocephalus 10.2 0.9% 5 < 0.1%
starry flounder Platichthys stellatus 5.6 0.5% 3 < 0.1%
rock sole spp. Lepidopsetta sp. 5.3 0.5% 8 < 0.1%
eulachon Thaleichthys pacificus 4.9 0.4% 542 6.3%
Alaska plaice Pleuronectes quadrituberculatus 4.9 0.4% 4 < 0.1%
Tanner crab Chionoecetes bairdi 4.5 0.4% 57 0.7%
yellow Irish lord Hemilepidotus jordani 4.1 0.4% 4 < 0.1%
great sculpin Myoxocephalus polyacanthocephalus 2.0 0.2% 1 < 0.1%
Chinook salmon Oncorhynchus tshawytscha 1.5 0.1% 1 < 0.1%
jellyfish unident. Scyphozoa 1.2 0.1% 1 < 0.1%
sturgeon poacher Podothecus veternus 0.9 0.1% 13 < 0.1%
Oregon triton Fusitriton oregonensis 0.9 0.1% 10 < 0.1%
longsnout prickleback Lumpenella longirostris 0.9 0.1% 5 < 0.1%
sablefish Anoplogaster cornuta 0.6 0.1% 2 < 0.1%
longhead dab Limanda proboscidea 0.6 < 0.1% 2 < 0.1%
spinyhead sculpin Dasycottus setiger 0.6 < 0.1% 4 < 0.1%
northern shrimp Pandalus borealis 0.4 < 0.1% 619 7.2%
Dungeness crab Cancer magister 0.3 < 0.1% 1 < 0.1%
triton unident. Fusitriton sp. 0.3 < 0.1% 7 < 0.1%
Pacific herring Clupea pallasi 0.2 < 0.1% 3 < 0.1%
shortfin eelpout Lycodes brevipes 0.2 < 0.1% 2 < 0.1%
hermit crab unident. Paguridae 0.1 < 0.1% 1 < 0.1%
common mud star Ctenodiscus crispatus 0.1 < 0.1% 6 < 0.1%
starfish unident. Asteroidea unident. 0.1 < 0.1% 2 < 0.1%
crangonid shrimp unident. Crangon sp. < 0.1 < 0.1% 1 < 0.1%
Total 1,139.8 8,646
26

Table 7.--Estimates of pollock biomass (in metric tons) and relative estimation error for the Shelikof Strait area,
Shumagin Islands, Chirikof Island shelf break, and Sanak Trough echo integration-trawl surveys.
27
Year Shelikof Strait Shumagin Islands Chirikof Shelf break Sanak Trough
Biomass Est. Error Biomass Est. Error Biomass Est. Error Biomass Est. Error
1981 2,785,800
1982 no survey
1983 2,278,200
1984 1,757,200
1985 1,175,300
1986 585,800 *
1987 no estimate
1988 301,700
1989 290,500
1990 374,800
1991 380,300
1992 713,400 3.6%
1993 435,800 4.6%
1994 492,600 4.5% 112,000
1995 763,600 4.5% 290,100
1996 777,200 3.7% 117,700
1997 583,000 3.7% no survey
1998 504,800 3.8% no survey
1999 no survey no survey
2000 448,600 4.6% no survey
2001 432,700 4.5% 119,600
2002 256,700 6.9% 135,600 27.1% 82,100 12.2%
2003 317,300 5.2% 67,300 17.2% 30,900 20.7% 81,500 21.6%
2004 330,800 9.2% no survey 30,400 20.4% no survey
2005 356,100 4.1% 52,000 11.4% 77,000 20.7% 67,800 7.4%
2006 293,600 4.0% 37,300 10.1% 69,000 11.0% 127,200 10.4%
* Shelikof Strait was surveyed in 1987, but no estimate was made due to an equipment malfunction.

Table 8.--Summary of catch by species in two midwater trawls conducted during the
2006 pollock echo integration-trawl survey of Sanak Trough.
Common name Scientific name Weight (kg) Percent Numbers Percent walleye pollock Theragra chalcogramma 9,810.0 99.5% 6,899 99.9%
Pacific cod Gadus macrocephalus 53.1 0.5% 9 < 0.1%
flathead sole Hippoglossoides elassodon 0.9 < 0.1% 3 < 0.1%
Total 9,864.0 6,911
Table 9.--Summary of catch by species in two bottom trawls conducted during the
2006 pollock echo integration-trawl survey of Sanak Trough.
Common name Scientific name Weight (kg) Percent Numbers Percent
walleye pollock Theragra chalcogramma 7,755.7 100.0% 7,550 100.0%
Total 7,755.7 7,550
Table 10.--Summary of catch by species in the two bottom trawls conducted during the
2006 pollock echo integration-trawl survey of Morzhovoi Bay.
Common name Scientific name Weight (kg) Percent Numbers Percent
walleye pollock Theragra chalcogramma 1,213.8 99.6% 1,312 99.8%
Pacific cod Gadus macrocephalus 3.6 0.3% 1 0.1%
lumpsucker unident. Aptocyclus sp. 1.3 0.1% 1 0.1%
Total 1,218.7 1,314
28
29
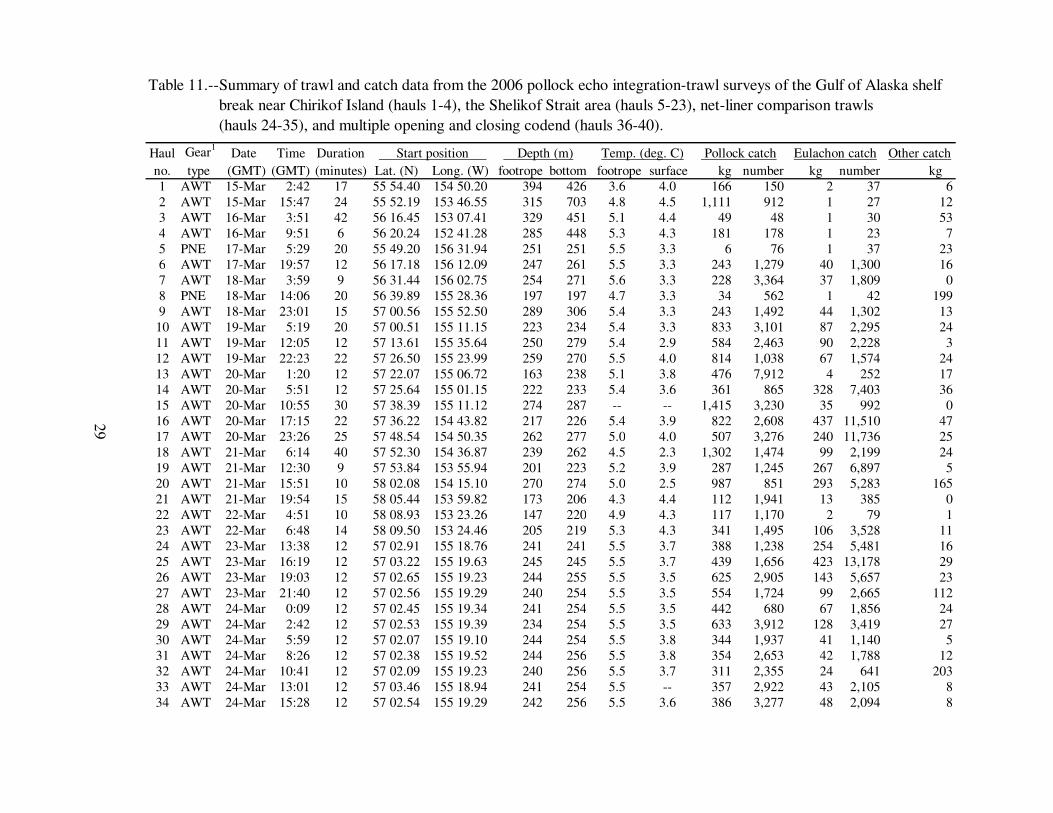
Table 11.--Summary of trawl and catch data from the 2006 pollock echo integration-trawl surveys of the Gulf of Alaska shelf
break near Chirikof Island (hauls 1-4), the Shelikof Strait area (hauls 5-23), net-liner comparison trawls
(hauls 24-35), and multiple opening and closing codend (hauls 36-40).
Haul Gear1
Date Time Duration Start position Depth (m) Temp. (deg. C) Pollock catch Eulachon catch Other catch
no. type (GMT) (GMT) (minutes) Lat. (N) Long. (W) footrope bottom footrope surface kg number kg number kg
1 AWT 15-Mar 2:42 17 154 50.20 55 54.40 394 426 3.6 4.0 166 150 2 37 6
2 AWT 15-Mar 15:47 24 153 46.55 55 52.19 315 703 4.8 4.5 1,111 912 1 27 12
3 AWT 16-Mar 3:51 42 153 07.41 56 16.45 329 451 5.1 4.4 49 48 1 30 53
4 AWT 16-Mar 9:51 6 152 41.28 56 20.24 285 448 5.3 4.3 181 178 1 23 7
5 PNE 17-Mar 5:29 20 156 31.94 55 49.20 251 251 5.5 3.3 6 76 1 37 23
6 AWT 17-Mar 19:57 12 156 12.09 56 17.18 247 261 5.5 3.3 243 1,279 40 1,300 16
7 AWT 18-Mar 3:59 9 156 02.75 56 31.44 254 271 5.6 3.3 228 3,364 37 1,809 0
8 PNE 18-Mar 14:06 20 56 39.89 155 28.36 197 197 4.7 3.3 34 562 1 42 199
9 AWT 18-Mar 23:01 15 57 00.56 155 52.50 289 306 5.4 3.3 243 1,492 44 1,302 13
10 AWT 19-Mar 5:19 20 57 00.51 155 11.15 223 234 5.4 3.3 833 3,101 87 2,295 24
11 AWT 19-Mar 12:05 12 57 13.61 155 35.64 250 279 5.4 2.9 584 2,463 90 2,228 3
12 AWT 19-Mar 22:23 22 155 23.99 57 26.50 259 270 5.5 4.0 814 1,038 67 1,574 24
13 AWT 20-Mar 1:20 12 155 06.72 57 22.07 163 238 5.1 3.8 476 7,912 4 252 17
14 AWT 20-Mar 5:51 12 155 01.15 57 25.64 222 233 5.4 3.6 361 865 328 7,403 36
15 AWT 20-Mar 10:55 30 155 11.12 57 38.39 274 287 -- -- 1,415 3,230 35 992 0
16 AWT 20-Mar 17:15 22 154 43.82 57 36.22 217 226 5.4 3.9 822 2,608 437 11,510 47
17 AWT 20-Mar 23:26 25 57 48.54 154 50.35 262 277 5.0 4.0 507 3,276 240 11,736 25
18 AWT 21-Mar 6:14 40 57 52.30 154 36.87 239 262 4.5 2.3 1,302 1,474 99 2,199 24
19 AWT 21-Mar 12:30 9 153 55.94 57 53.84 201 223 5.2 3.9 287 1,245 267 6,897 5
20 AWT 21-Mar 15:51 10 154 15.10 58 02.08 270 274 5.0 2.5 987 851 293 5,283 165
21 AWT 21-Mar 19:54 15 153 59.82 58 05.44 173 206 4.3 4.4 112 1,941 13 385 0
22 AWT 22-Mar 4:51 10 58 08.93 153 23.26 147 220 4.9 4.3 117 1,170 2 79 1
23 AWT 22-Mar 6:48 14 58 09.50 153 24.46 205 219 5.3 4.3 341 1,495 106 3,528 11
24 AWT 23-Mar 13:38 12 155 18.76 57 02.91 241 241 5.5 3.7 388 1,238 254 5,481 16
25 AWT 23-Mar 16:19 12 155 19.63 57 03.22 245 245 5.5 3.7 439 1,656 423 13,178 29
26 AWT 23-Mar 19:03 12 155 19.23 57 02.65 244 255 5.5 3.5 625 2,905 143 5,657 23
27 AWT 23-Mar 21:40 12 155 19.29 57 02.56 240 254 5.5 3.5 554 1,724 99 2,665 112
28 AWT 24-Mar 0:09 12 155 19.34 57 02.45 241 254 5.5 3.5 442 680 67 1,856 24
29 AWT 24-Mar 2:42 12 155 19.39 57 02.53 234 254 5.5 3.5 633 3,912 128 3,419 27
30 AWT 24-Mar 5:59 12 155 19.10 57 02.07 244 254 5.5 3.8 344 1,937 41 1,140 5
31 AWT 24-Mar 8:26 12 155 19.52 57 02.38 244 256 5.5 3.8 354 2,653 42 1,788 12
32 AWT 24-Mar 10:41 12 155 19.23 57 02.09 240 256 5.5 3.7 311 2,355 24 641 203
33 AWT 24-Mar 13:01 12 155 18.94 57 03.46 241 254 5.5 -- 357 2,922 43 2,105 8
34 AWT 24-Mar 15:28 12 155 19.29 57 02.54 242 256 5.5 3.6 386 3,277 48 2,094 8

Table 11.--Continued.
Haul Gear1
Date Time Duration Start position Depth (m) Temp. (deg. C) Pollock catch Eulachon catch Other catch
no. type (GMT) (GMT) (minutes) Lat. (N) Long. (W) footrope bottom footrope surface kg number kg number kg
35 AWT 24-Mar 18:19 12 57 02.38 155 18.95 250 255 5.5 3.6 325 2,329 228 5,063 14
36a AWT 25-Mar 21:19 2 57 43.96 154 17.06 107 238 4.2 3.8 38 770 0 11 2
36b AWT 25-Mar 22:07 2 57 45.50 154 13.48 83 208 3.9 3.8 70 2,453 1 82 2
36c AWT 25-Mar 22:55 2 57 47.15 154 09.91 73 200 4.1 3.8 70 5,094 3 523 0
37a AWT 26-Mar 7:08 2 57 50.49 154 52.26 213 283 5.2 3.5 181 203 8 65 0
37b AWT 26-Mar 7:17 2 57 50.43 154 53.24 225 284 5.3 3.5 282 335 10 350 0
37c AWT 26-Mar 7:37 2 57 50.41 154 55.10 230 288 5.3 3.5 522 544 6 203 1
38a AWT 26-Mar 16:10 3 57 49.95 154 35.30 185 229 5.5 4.1 26 30 3 190 2
38b AWT 26-Mar 16:14 16 57 50.02 154 35.61 187 233 4.5 4.1 102 143 11 549 2
39a AWT 26-Mar 18:55 8 57 50.69 154 42.76 210 260 5.4 3.9 320 703 59 2,091 10
39b AWT 26-Mar 19:03 4 57 50.87 154 43.53 210 262 5.4 3.9 243 362 23 899 6
39c AWT 26-Mar 19:08 11 57 50.99 154 43.97 210 271 4.3 3.9 155 206 12 415 10
40a AWT 26-Mar 23:05 8 57 50.29 154 03.28 135 208 4.4 4.3 61 4,959 0 12 0
40b AWT 26-Mar 23:43 19 57 48.91 154 06.51 167 207 4.4 4.3 35 258 5 246 4
1AWT = Aleutian wing trawl, PNE = poly Nor'eastern bottom trawl.
Note: Hauls 36-40 were MOC deployments that were fished with the back ends of the codends tied shut so that fish could be retained (see text for
a description).
30

Table 12.--Summary of catch by species in four midwater trawls conducted during the
2006 pollock echo integration-trawl survey of the Gulf of Alaska shelf-break
near Chirikof Island.
Common name Scientific name Weight (kg) Percent Numbers Percent walleye pollock Theragra chalcogramma 1,507.3 93.4% 1,289 35.2%
grenadier unident. Macrouridae 33.1 2.0% 10 0.3%
Pacific ocean perch Sebastes alutus 25.7 1.6% 40 1.1%
shortraker rockfish Sebastes borealis 18.7 1.2% 8 0.2%
Myctophidae Myctophidae 7.9 0.5% 1,054 28.8%
giant grenadier Albatrossia pectoralis 5.3 0.3% 2 0.1%
jellyfish unident. Scyphozoa (class) 4.8 0.3% 10 0.3%
eulachon Thaleichthys pacificus 4.0 0.3% 90 2.5%
arrowtooth flounder Atheresthes stomias 2.9 0.2% 4 0.1%
shrimp unident. Decapoda (order) 2.1 0.1% 978 26.7%
rougheye rockfish Sebastes aleutianus 1.5 0.1% 1 < 0.1%
squid unident. Teuthoidea 0.8 < 0.1% 88 2.4%
capelin Mallotus villosus 0.3 < 0.1% 49 1.3%
northern smoothtongue Leuroglossus schmidti 0.1 < 0.1% 33 0.9%
salps unident. Thaliacea < 0.1 < 0.1% 2 0.1%
Total 1,614.5 3,658
31

Table 13.--Summary of catch by species in 17 midwater trawls conducted during the
2006 pollock echo integration-trawl survey of the Shelikof Strait area.
Common name Scientific name Weight (kg) Percent Numbers Percent walleye pollock Theragra chalcogramma 9,679.1 78.7% 38,884 38.2%
eulachon Thaleichthys pacificus 2,190.8 17.8% 60,810 59.7%
Pacific sleeper shark Somniosus pacificus 150.0 1.2% 1 < 0.1%
majestic squid Berryteuthis magister 85.7 0.7% 220 0.2%
squid unident. Teuthoidea (order) 53.4 0.4% 998 1.0%
Chinook salmon Oncorhynchus tshawytscha 52.3 0.4% 27 < 0.1%
arrowtooth flounder Atheresthes stomias 47.8 0.4% 46 < 0.1%
Bering skate Bathyraja interrupta 13.4 0.1% 1 < 0.1%
northern smoothtongue Leuroglossus schmidti 13.3 0.1% 535 0.5%
smooth lumpsucker Aptocyclus ventricosus 7.5 0.1% 8 < 0.1%
Pacific cod Gadus macrocephalus 3.4 < 0.1% 1 < 0.1%
chum salmon Oncorhynchus keta 2.6 < 0.1% 1 < 0.1%
shrimp unident. Decapoda (order) 1.5 < 0.1% 297 0.3%
Pacific ocean perch Sebastes alutus 1.2 < 0.1% 1 < 0.1%
flathead sole Hippoglossoides elassodon 1.2 < 0.1% 3 < 0.1%
jellyfish unident. Cyanea sp. 1.0 < 0.1% 1 < 0.1%
Pacific sandfish Trichodon trichodon 0.8 < 0.1% 37 < 0.1%
sablefish Anoplopoma fimbria 0.4 < 0.1% 1 < 0.1%
capelin Mallotus villosus < 0.1 < 0.1% 3 < 0.1%
rex sole Glyptocephalus zachirus < 0.1 < 0.1% 1 < 0.1%
Total 12,305.3 101,876
32

Table 14.--Summary of catch by species in two bottom trawls conducted during the
2006 pollock echo integration-trawl survey of the Shelikof Strait area.
Common name Scientific name Weight (kg) Percent Numbers Percent Pacific sleeper shark Somniosus pacificus 107.9 40.8% 1 0.1%
arrowtooth flounder Atheresthes stomias 88.2 33.4% 137 14.0%
walleye pollock Theragra chalcogramma 40.7 15.4% 638 65.2%
Alaska skate Bathyraja parmifera 8.7 3.3% 1 0.1%
longnose skate Raja rhina 6.2 2.3% 1 0.1%
eulachon Thaleichthys pacificus 2.3 0.9% 79 8.1%
flathead sole Hippoglossoides elassodon 2.1 0.8% 5 0.5%
Bering skate Bathyraja interrupta 1.9 0.7% 2 0.2%
rougheye rockfish Sebastes aleutianus 1.7 0.6% 1 0.1%
squid unident. Teuthoidea (order) 0.9 0.3% 2 0.2%
Chinook salmon Oncorhynchus tshawytscha 0.8 0.3% 1 0.1%
shrimp unident. Decapoda (order) 0.8 0.3% 90 9.2%
majestic squid Berryteuthis magister 0.7 0.3% 1 0.1%
Pacific halibut Hippoglossus stenolepis 0.6 0.2% 1 0.1%
eelpout unident. Zoarcidae 0.4 0.2% 1 0.1%
Pacific ocean perch Sebastes alutus 0.2 0.1% 1 0.1%
sablefish Anoplopoma fimbria 0.2 0.1% 1 0.1%
rex sole Glyptocephalus zachirus 0.1 < 0.1% 3 0.3%
hermit crab unident. Paguridae 0.1 < 0.1% 3 0.3%
Pacific herring Clupea pallasi < 0.1 < 0.1% 3 0.3%
whelk unident. Gastropoda < 0.1 < 0.1% 1 0.1%
sculpin unident. Cottidae < 0.1 < 0.1% 2 0.2%
starfish unident. Asteroidea unident. < 0.1 < 0.1% 2 0.2%
Tanner crab unident. Chionoecetes sp. < 0.1 < 0.1% 1 0.1%
Total 264.4 978
33

Table 15.--Numbers-at-age estimates (millions) from echo integration-trawl surveys of walleye pollock in the Shelikof Strait
area. No surveys were conducted in 1982 or 1999, and no estimate was produced for 1987 because of mechanical problems.
Note: 2006 age estimates are not yet available.
34
Age 1981 1982 1983 1984 1985 1986 1987 1988 1989 1990 1991 1992 1993 1994 1995 1996 1997 1998 1999 2000 2001 2002 2003 2004 2005
1 78 -- 1 62 2,092 575 -- 17 399 49 22 228 63 186 10,690 56 70 395 -- 4,484 289 8 51 53 1,626
2 3,481 -- 902 58 544 2,115 -- 110 90 1,210 174 34 76 36 510 3,307 183 89 -- 755 4,104 163 90 94 157
3 1,511 -- 380 324 123 184 -- 694 90 72 550 74 37 49 79 119 1,247 126 -- 217 352 1,107 208 58 56
4 769 -- 1,297 142 315 46 -- 322 216 63 48 188 72 32 78 25 80 474 -- 16 61 97 802 160 35
5 2,786 -- 1,171 635 181 75 -- 78 249 116 65 368 233 155 103 54 18 136 -- 67 42 16 57 356 173
6 1,052 -- 698 988 347 49 -- 17 43 180 70 84 126 84 245 71 44 14 -- 132 23 16 8 49 162
7 210 -- 599 450 439 86 -- 6 14 46 116 85 27 42 122 201 52 32 -- 17 35 8 4 3 36
8 129 -- 132 224 167 149 -- 6 4 22 24 171 36 27 54 119 98 36 -- 13 13 7 2 3 4
9 79 -- 14 41 43 60 -- 4 2 8 29 33 39 44 17 40 53 74 -- 10 6 1 1 3 2
10 25 -- 12 3 6 11 -- 9 1 8 2 56 16 48 11 13 14 26 -- 8 3 1 1 1 --
11 2 -- 4 0 2 1 -- 2 10 1 4 2 8 15 15 11 2 14 -- 14 1 < 1 < 1 < 1 1
12 0 -- 2 1 1 0 -- 2 1 3 1 15 3 7 6 5 3 7 -- 7 2 < 1 0 0 --
13 0 -- 0 0 0 0 -- < 1 < 1 2 4 1 2 1 2 3 1 < 1 -- 2 1 < 1 < 1 1 --
14 0 -- 0 0 0 0 -- 0 0 1 0 < 1 < 1 2 < 1 < 1 < 1 1 -- 1 < 1 < 1 0 0 --
15 0 -- 0 0 0 0 -- 0 0 < 1 0 0 1 < 1 0 0 0 1 -- 0 < 1 0 0 0 --
16 0 -- 0 0 0 0 -- 0 0 < 1 0 0 1 0 0 < 1 0 0 -- 0 0 0 0 0 --
17 0 -- 0 0 0 0 -- 0 0 0 0 0 < 1 < 1 0 0 0 0 -- 0 0 0 0 0 --
18 0 -- 0 0 0 0 -- 0 0 < 1 0 0 0 0 0 0 0 0 -- 0 0 0 0 0 --
Total 10,122 -- 5,212 2,928 4,260 3,351 -- 1,267 1,119 1,781 1,109 1,339 740 728 11,932 4,024 1,865 1,425 -- 5,743 4,932 1,424 1,224 781 2,252

Table 16.--Biomass-at-age estimates (thousands of metric tons) from echo integration-trawl surveys of walleye pollock in the Shelikof
Strait area. No surveys were conducted in 1982 or 1999, and no estimate was produced for 1987 because of mechanical
problems. Note: 2006 age estimates are not yet available.
35
Age 1981 1982 1983 1984 1985 1986 1987 1988 1989 1990 1991 1992 1993 1994 1995 1996 1997 1998 1999 2000 2001 2002 2003 2004 2005
1 1 -- < 1 1 24 4 -- < 1 4 < 1 < 1 3 1 2 114 1 1 4 -- 57 2 < 1 1 1 18
2 309 -- 71 6 54 139 -- 8 8 67 12 3 6 3 46 180 15 8 -- 63 214 13 8 8 13
3 342 -- 117 83 41 40 -- 130 21 15 85 16 11 14 23 24 195 28 -- 60 60 164 43 14 17
4 255 -- 529 78 159 17 -- 91 86 23 13 60 34 20 41 12 28 153 -- 9 25 29 222 78 19
5 1,068 -- 650 373 109 56 -- 31 111 61 33 144 136 127 83 50 13 53 -- 54 27 12 25 179 132
6 496 -- 455 684 253 41 -- 9 27 120 54 68 90 75 220 73 53 12 -- 107 24 16 7 37 119
7 133 -- 332 331 353 76 -- 6 12 36 106 92 28 48 116 212 61 39 -- 17 40 9 5 4 29
8 92 -- 94 161 138 140 -- 6 4 24 23 194 43 34 55 132 120 47 -- 17 18 8 2 5 4
9 68 -- 11 36 35 58 -- 5 3 9 36 36 46 64 19 48 67 95 -- 15 8 2 3 5 3
10 19 -- 12 3 6 11 -- 11 1 11 3 71 21 68 15 17 20 33 -- 11 5 1 1 1 --
11 1 -- 5 0 2 2 -- 2 12 1 6 3 10 21 20 16 3 21 -- 22 2 1 < 1 1 1
12 0 -- 1 1 1 0 -- 3 1 4 1 21 4 10 7 7 5 10 -- 11 3 1 0 0 --
13 0 -- 0 0 0 0 -- < 1 < 1 2 7 1 3 2 3 4 1 < 1 -- 4 1 < 1 < 1 1 --
14 0 -- 0 0 0 0 -- 0 0 1 0 1 1 4 1 < 1 1 1 -- 2 1 < 1 0 0 --
15 0 -- 0 0 0 0 -- 0 0 < 1 0 0 1 < 1 0 0 0 1 -- 0 < 1 0 0 0 --
16 0 -- 0 0 0 0 -- 0 0 < 1 0 0 1 0 0 < 1 0 0 -- 0 0 0 0 0 --
17 0 -- 0 0 0 0 -- 0 0 0 0 0 < 1 1 0 0 0 0 -- 0 0 0 0 0 --
18 0 -- 0 0 0 0 -- 0 0 < 1 0 0 0 0 0 0 0 0 -- 0 0 0 0 0 --
Total 2,786 -- 2,278 1,757 1,175 586 -- 302 290 375 380 713 436 493 764 777 583 505 -- 449 433 257 317 331 356
36
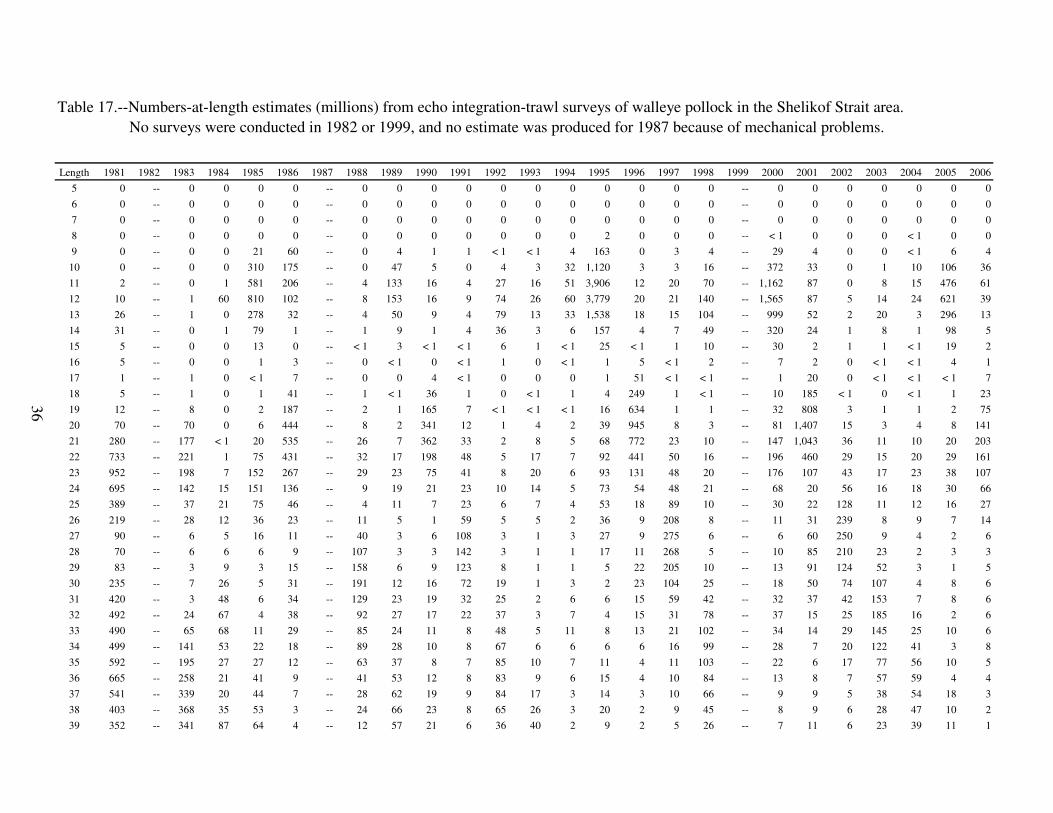
Table 17.--Numbers-at-length estimates (millions) from echo integration-trawl surveys of walleye pollock in the Shelikof Strait area.
No surveys were conducted in 1982 or 1999, and no estimate was produced for 1987 because of mechanical problems.
Length 1981 1982 1983 1984 1985 1986 1987 1988 1989 1990 1991 1992 1993 1994 1995 1996 1997 1998 1999 2000 2001 2002 2003 2004 2005 2006
5 0 -- 0 0 0 0 -- 0 0 0 0 0 0 0 0 0 0 0 -- 0 0 0 0 0 0 0
6 0 -- 0 0 0 0 -- 0 0 0 0 0 0 0 0 0 0 0 -- 0 0 0 0 0 0 0
7 0 -- 0 0 0 0 -- 0 0 0 0 0 0 0 0 0 0 0 -- 0 0 0 0 0 0 0
8 0 -- 0 0 0 0 -- 0 0 0 0 0 0 0 2 0 0 0 -- < 1 0 0 0 < 1 0 0
9 0 -- 0 0 21 60 -- 0 4 1 1 < 1 < 1 4 163 0 3 4 -- 29 4 0 0 < 1 6 4
10 0 -- 0 0 310 175 -- 0 47 5 0 4 3 32 1,120 3 3 16 -- 372 33 0 1 10 106 36
11 2 -- 0 1 581 206 -- 4 133 16 4 27 16 51 3,906 12 20 70 -- 1,162 87 0 8 15 476 61
12 10 -- 1 60 810 102 -- 8 153 16 9 74 26 60 3,779 20 21 140 -- 1,565 87 5 14 24 621 39
13 26 -- 1 0 278 32 -- 4 50 9 4 79 13 33 1,538 18 15 104 -- 999 52 2 20 3 296 13
14 31 -- 0 1 79 1 -- 1 9 1 4 36 3 6 157 4 7 49 -- 320 24 1 8 1 98 5
15 5 -- 0 0 13 0 -- < 1 3 < 1 < 1 6 1 < 1 25 < 1 1 10 -- 30 2 1 1 < 1 19 2
16 5 -- 0 0 1 3 -- 0 < 1 0 < 1 1 0 < 1 1 5 < 1 2 -- 7 2 0 < 1 < 1 4 1
17 1 -- 1 0 < 1 7 -- 0 0 4 < 1 0 0 0 1 51 < 1 < 1 -- 1 20 0 < 1 < 1 < 1 7
18 5 -- 1 0 1 41 -- 1 < 1 36 1 0 < 1 1 4 249 1 < 1 -- 10 185 < 1 0 < 1 1 23
19 12 -- 8 0 2 187 -- 2 1 165 7 < 1 < 1 < 1 16 634 1 1 -- 32 808 3 1 1 2 75
20 70 -- 70 0 6 444 -- 8 2 341 12 1 4 2 39 945 8 3 -- 81 1,407 15 3 4 8 141
21 280 -- 177 < 1 20 535 -- 26 7 362 33 2 8 5 68 772 23 10 -- 147 1,043 36 11 10 20 203
22 733 -- 221 1 75 431 -- 32 17 198 48 5 17 7 92 441 50 16 -- 196 460 29 15 20 29 161
23 952 -- 198 7 152 267 -- 29 23 75 41 8 20 6 93 131 48 20 -- 176 107 43 17 23 38 107
24 695 -- 142 15 151 136 -- 9 19 21 23 10 14 5 73 54 48 21 -- 68 20 56 16 18 30 66
25 389 -- 37 21 75 46 -- 4 11 7 23 6 7 4 53 18 89 10 -- 30 22 128 11 12 16 27
26 219 -- 28 12 36 23 -- 11 5 1 59 5 5 2 36 9 208 8 -- 11 31 239 8 9 7 14
27 90 -- 6 5 16 11 -- 40 3 6 108 3 1 3 27 9 275 6 -- 6 60 250 9 4 2 6
28 70 -- 6 6 6 9 -- 107 3 3 142 3 1 1 17 11 268 5 -- 10 85 210 23 2 3 3
29 83 -- 3 9 3 15 -- 158 6 9 123 8 1 1 5 22 205 10 -- 13 91 124 52 3 1 5
30 235 -- 7 26 5 31 -- 191 12 16 72 19 1 3 2 23 104 25 -- 18 50 74 107 4 8 6
31 420 -- 3 48 6 34 -- 129 23 19 32 25 2 6 6 15 59 42 -- 32 37 42 153 7 8 6
32 492 -- 24 67 4 38 -- 92 27 17 22 37 3 7 4 15 31 78 -- 37 15 25 185 16 2 6
33 490 -- 65 68 11 29 -- 85 24 11 8 48 5 11 8 13 21 102 -- 34 14 29 145 25 10 6
34 499 -- 141 53 22 18 -- 89 28 10 8 67 6 6 6 6 16 99 -- 28 7 20 122 41 3 8
35 592 -- 195 27 27 12 -- 63 37 8 7 85 10 7 11 4 11 103 -- 22 6 17 77 56 10 5
36 665 -- 258 21 41 9 -- 41 53 12 8 83 9 6 15 4 10 84 -- 13 8 7 57 59 4 4
37 541 -- 339 20 44 7 -- 28 62 19 9 84 17 3 14 3 10 66 -- 9 9 5 38 54 18 3
38 403 -- 368 35 53 3 -- 24 66 23 8 65 26 3 20 2 9 45 -- 8 9 6 28 47 10 2
39 352 -- 341 87 64 4 -- 12 57 21 6 36 40 2 9 2 5 26 -- 7 11 6 23 39 11 1

37
Table 17.--Continued.Length 1981 1982 1983 1984 1985 1986 1987 1988 1989 1990 1991 1992 1993 1994 1995 1996 1997 1998 1999 2000 2001 2002 2003 2004 2005 2006
40 339 -- 343 138 77 3 -- 13 52 33 10 30 53 3 15 2 8 15 -- 11 9 2 14 35 23 2
41 231 -- 290 170 82 8 -- 8 46 34 9 22 57 5 5 2 4 16 -- 13 12 2 13 35 22 2
42 224 -- 326 219 96 8 -- 5 36 37 13 15 57 9 7 2 5 6 -- 19 8 3 7 38 32 2
43 178 -- 311 271 106 12 -- 5 22 32 14 14 48 16 17 4 4 7 -- 19 7 2 6 32 33 4
44 145 -- 304 309 113 22 -- 3 16 37 19 14 37 23 18 6 5 5 -- 18 7 2 5 27 41 5
45 116 -- 256 316 119 35 -- 2 12 34 21 17 33 36 35 7 3 2 -- 19 8 3 3 24 39 7
46 84 -- 201 283 148 39 -- 2 6 25 24 22 23 39 53 13 4 2 -- 22 5 2 3 18 33 9
47 113 -- 171 213 140 50 -- 2 6 23 22 21 19 46 62 25 4 3 -- 19 5 3 3 17 37 11
48 62 -- 116 158 139 57 -- 2 4 20 26 32 17 37 74 37 6 4 -- 17 6 4 2 11 33 14
49 75 -- 91 104 117 52 -- 3 5 16 20 38 16 33 73 53 13 6 -- 13 9 3 2 8 22 15
50 58 -- 52 68 83 51 -- 4 5 15 19 46 17 29 66 64 20 13 -- 16 8 3 2 7 28 18
51 50 -- 49 40 52 42 -- 4 4 8 20 40 15 24 51 69 30 18 -- 10 5 4 2 5 14 19
52 25 -- 23 25 28 21 -- 3 4 8 14 38 14 21 40 64 36 24 -- 11 9 4 2 4 7 19
53 12 -- 17 13 23 18 -- 3 5 7 13 35 14 24 30 53 37 26 -- 10 6 3 2 2 6 16
54 9 -- 7 4 9 6 -- 2 4 5 9 35 13 18 22 39 34 23 -- 9 4 3 1 3 4 12
55 15 -- 9 3 4 11 -- 2 2 7 10 30 11 18 16 29 28 20 -- 9 5 2 1 3 3 13
56 5 -- 2 2 2 2 -- 2 1 2 6 15 9 18 14 19 24 19 -- 8 5 1 < 1 2 2 7
57 7 -- 2 1 2 < 1 -- 1 1 2 3 18 7 13 7 13 12 12 -- 9 3 1 < 1 1 1 5
58 3 -- 1 1 1 1 -- < 1 1 1 5 14 7 11 6 10 8 9 -- 6 2 1 < 1 1 1 3
59 1 -- 1 < 1 1 < 1 -- < 1 1 1 2 4 4 9 3 6 5 8 -- 5 3 1 1 1 1 3
60 0 -- 1 < 1 2 1 -- 0 1 1 2 2 3 7 2 5 3 4 -- 2 3 < 1 1 < 1 1 2
61 0 -- 1 < 1 < 1 1 -- < 1 < 1 < 1 1 2 2 5 1 3 2 2 -- 1 1 < 1 1 < 1 < 1 2
62 0 -- 0 1 1 < 1 -- < 1 < 1 < 1 < 1 3 1 2 2 2 1 2 -- 2 < 1 < 1 < 1 < 1 0 1
63 0 -- 0 1 1 < 1 -- 0 < 1 < 1 1 1 1 1 < 1 1 1 2 -- 1 1 < 1 < 1 < 1 1 1
64 0 -- 0 < 1 0 < 1 -- 0 < 1 < 1 < 1 < 1 < 1 1 < 1 < 1 < 1 < 1 -- < 1 < 1 < 1 < 1 < 1 < 1 < 1
65 0 -- 0 0 0 < 1 -- 0 0 < 1 1 0 < 1 1 < 1 < 1 < 1 < 1 -- < 1 < 1 < 1 0 < 1 < 1 < 1
66 0 -- 0 0 < 1 < 1 -- 0 < 1 < 1 0 < 1 < 1 < 1 0 < 1 < 1 < 1 -- < 1 1 0 0 0 < 1 < 1
67 0 -- 0 0 0 < 1 -- < 1 0 < 1 < 1 < 1 < 1 < 1 0 < 1 < 1 0 -- < 1 0 < 1 < 1 0 0 < 1
68 0 -- 0 0 0 0 -- 0 0 < 1 0 0 < 1 0 0 < 1 < 1 < 1 -- 0 < 1 < 1 0 < 1 0 < 1
69 0 -- 0 0 0 0 -- 0 0 < 1 1 0 < 1 < 1 0 < 1 < 1 0 -- 0 0 0 0 0 0 0
70 0 -- 0 0 0 0 -- < 1 0 0 0 0 0 0 0 0 0 0 -- 0 0 0 0 0 0 0
71 0 -- 0 0 0 0 -- 0 0 < 1 0 0 0 < 1 0 0 0 0 -- 0 0 < 1 0 0 0 0
72 0 -- 0 0 0 0 -- 0 0 0 0 0 0 0 0 < 1 0 0 -- 0 0 0 0 0 0 0
73 0 -- 0 0 0 0 -- 0 0 0 0 0 0 0 0 0 0 0 -- 0 0 0 0 0 0 0
74 0 -- 0 0 0 0 -- 0 0 0 0 0 0 0 0 0 0 0 -- 0 0 0 0 0 0 0
75 0 -- 0 0 0 0 -- 0 0 0 0 0 0 0 0 0 0 0 -- < 1 0 0 0 0 0 0
Total 10,121 -- 5,211 2,928 4,259 3,352 -- 1,266 1,119 1,782 1,109 1,339 740 729 11,931 4,024 1,866 1,425 -- 5,742 4,931 1,424 1,224 780 2,252 1,240

38
Table 18.--Biomass-at-length estimates (thousands of metric tons) from echo integration-trawl surveys of walleye pollock in the Shelikof Strait
area. No surveys were conducted in 1982 or 1999, and no estimate was produced for 1987 because of mechanical problems.
Length 1981 1982 1983 1984 1985 1986 1987 1988 1989 1990 1991 1992 1993 1994 1995 1996 1997 1998 1999 2000 2001 2002 2003 2004 2005 2006
5 0 -- 0 0 0 0 -- 0 0 0 0 0 0 0 0 0 0 0 -- 0 0 0 0 0 0 0
6 0 -- 0 0 0 0 -- 0 0 0 0 0 0 0 0 0 0 0 -- 0 0 0 0 0 0 0
7 0 -- 0 0 0 0 -- 0 0 0 0 0 0 0 0 0 0 0 -- 0 0 0 0 0 0 0
8 0 -- 0 0 0 0 -- 0 0 0 0 0 0 0 < 1 0 0 0 -- 0 0 0 0 < 1 0 0
9 0 -- 0 0 < 1 < 1 -- 0 < 1 < 1 < 1 < 1 < 1 < 1 1 0 < 1 < 1 -- < 1 < 1 0 0 < 1 < 1 < 1
10 0 -- 0 0 2 1 -- 0 < 1 < 1 0 < 1 < 1 < 1 7 < 1 < 1 < 1 -- 3 < 1 0 < 1 < 1 1 < 1
11 < 1 -- 0 < 1 6 2 -- < 1 1 < 1 < 1 < 1 < 1 < 1 35 < 1 < 1 1 -- 11 1 0 < 1 < 1 4 < 1
12 < 1 -- < 1 1 10 1 -- < 1 2 < 1 < 1 1 < 1 1 44 < 1 < 1 1 -- 20 1 < 1 < 1 < 1 7 < 1
13 < 1 -- < 1 0 4 < 1 -- < 1 1 < 1 < 1 1 < 1 < 1 23 < 1 < 1 1 -- 16 1 < 1 < 1 < 1 4 < 1
14 1 -- 0 < 1 2 < 1 -- < 1 < 1 < 1 < 1 1 < 1 < 1 3 < 1 < 1 1 -- 7 < 1 < 1 < 1 < 1 2 < 1
15 < 1 -- 0 0 < 1 0 -- < 1 < 1 < 1 < 1 < 1 < 1 < 1 1 < 1 < 1 < 1 -- 1 < 1 < 1 < 1 < 1 < 1 < 1
16 < 1 -- 0 0 < 1 < 1 -- 0 < 1 0 < 1 < 1 0 < 1 < 1 < 1 < 1 < 1 -- < 1 < 1 0 < 1 < 1 < 1 < 1
17 < 1 -- < 1 0 < 1 < 1 -- 0 0 < 1 < 1 0 0 0 < 1 2 < 1 < 1 -- < 1 1 0 < 1 < 1 < 1 < 1
18 < 1 -- < 1 0 < 1 2 -- < 1 < 1 1 < 1 0 < 1 < 1 < 1 9 < 1 < 1 -- < 1 6 < 1 0 < 1 < 1 < 1
19 1 -- < 1 0 < 1 8 -- < 1 < 1 7 < 1 < 1 < 1 < 1 1 27 < 1 < 1 -- 2 33 < 1 < 1 < 1 < 1 3
20 4 -- 4 0 < 1 23 -- < 1 < 1 16 1 < 1 < 1 < 1 2 48 < 1 < 1 -- 5 68 1 < 1 < 1 < 1 7
21 18 -- 11 < 1 1 33 -- 1 < 1 21 2 < 1 < 1 < 1 4 46 1 1 -- 10 59 2 1 1 1 12
22 53 -- 16 < 1 6 31 -- 2 1 13 3 < 1 1 1 7 30 4 1 -- 16 31 2 1 1 2 11
23 78 -- 16 1 14 22 -- 2 2 6 3 1 2 1 8 10 4 2 -- 17 8 4 1 2 3 8
24 65 -- 13 2 15 13 -- 1 2 2 2 1 1 1 7 5 5 2 -- 7 2 5 2 2 3 6
25 41 -- 4 2 9 5 -- < 1 1 1 2 1 1 < 1 6 2 10 1 -- 4 2 14 1 1 2 3
26 26 -- 3 2 5 3 -- 1 1 < 1 7 1 1 < 1 5 1 25 1 -- 1 4 29 1 1 1 2
27 12 -- 1 1 2 2 -- 5 < 1 1 14 < 1 < 1 < 1 4 1 38 1 -- 1 8 35 1 < 1 < 1 < 1
28 11 -- 1 1 1 1 -- 16 < 1 < 1 21 < 1 < 1 < 1 3 2 42 1 -- 2 13 33 3 < 1 < 1 < 1
29 14 -- 1 2 1 3 -- 26 1 1 20 1 < 1 < 1 1 4 36 2 -- 2 15 22 9 1 < 1 < 1
30 44 -- 1 5 1 6 -- 35 2 3 13 4 < 1 1 < 1 4 20 5 -- 4 9 15 20 1 2 1
31 86 -- 1 10 1 7 -- 27 5 4 7 5 < 1 1 1 3 13 9 -- 8 8 9 32 1 2 1
32 111 -- 5 16 1 9 -- 21 6 4 5 9 1 2 1 3 7 19 -- 10 3 6 43 4 1 1
33 122 -- 16 18 3 7 -- 22 6 3 2 12 1 3 2 3 5 26 -- 10 4 8 37 7 3 2
34 136 -- 39 15 6 5 -- 25 8 3 2 19 2 2 2 2 5 28 -- 9 2 6 34 12 1 2
35 176 -- 59 9 9 4 -- 19 11 2 2 27 3 2 4 1 4 33 -- 8 2 6 24 18 3 2
36 216 -- 84 7 14 3 -- 14 18 4 3 29 3 2 5 1 3 29 -- 5 3 2 19 20 1 1
37 191 -- 121 7 17 2 -- 11 23 7 3 32 6 1 5 1 4 25 -- 4 3 2 14 21 7 1
38 154 -- 142 14 21 1 -- 10 26 9 3 26 11 1 8 1 4 19 -- 4 4 2 11 20 4 < 1
39 146 -- 143 38 28 2 -- 5 25 9 3 16 18 1 4 1 2 12 -- 3 5 3 10 18 5 < 1

39
Table 18.--Continued.
Length 1981 1982 1983 1984 1985 1986 1987 1988 1989 1990 1991 1992 1993 1994 1995 1996 1997 1998 1999 2000 2001 2002 2003 2004 2005 2006
40 152 -- 155 66 37 1 -- 6 24 15 5 15 26 2 7 1 4 7 -- 6 4 1 7 17 12 1
41 112 -- 142 87 42 4 -- 4 23 17 4 11 30 3 3 1 2 8 -- 7 6 1 7 19 13 1
42 117 -- 172 121 53 4 -- 3 20 20 7 9 32 5 4 1 3 3 -- 11 5 2 4 22 19 1
43 100 -- 176 161 63 7 -- 3 13 19 9 9 29 10 10 2 2 4 -- 13 5 1 4 20 21 2
44 87 -- 185 197 72 14 -- 2 10 24 12 9 24 16 12 4 3 3 -- 13 5 1 3 19 27 4
45 75 -- 167 215 81 24 -- 2 8 23 15 12 23 26 24 5 2 2 -- 15 6 2 2 17 27 5
46 58 -- 140 206 107 29 -- 2 4 19 18 17 18 31 39 10 3 1 -- 17 4 2 3 15 24 7
47 83 -- 127 166 108 40 -- 1 5 18 18 17 16 39 49 20 3 3 -- 16 4 2 3 14 29 10
48 49 -- 92 131 115 49 -- 2 3 17 22 29 15 34 63 32 6 4 -- 15 6 3 2 10 28 12
49 63 -- 77 92 102 47 -- 2 4 15 19 36 15 32 66 48 13 6 -- 13 8 3 2 8 19 15
50 51 -- 46 63 78 49 -- 4 4 15 19 47 17 30 63 62 20 13 -- 16 8 3 2 8 28 18
51 47 -- 47 40 52 43 -- 4 4 8 21 43 16 26 52 71 32 20 -- 12 6 4 2 5 14 22
52 25 -- 23 26 29 24 -- 3 4 8 15 44 15 24 43 70 41 27 -- 13 10 5 2 5 8 23
53 13 -- 19 15 26 21 -- 4 5 8 15 43 17 29 34 62 45 32 -- 12 8 4 2 3 7 20
54 11 -- 8 5 10 7 -- 3 5 6 12 45 17 23 26 48 44 30 -- 13 6 4 1 4 5 16
55 18 -- 11 4 5 14 -- 3 2 9 14 41 15 24 20 38 38 27 -- 12 7 3 2 4 4 19
56 6 -- 2 2 3 3 -- 2 2 3 9 22 13 27 19 27 35 28 -- 12 8 2 < 1 3 3 10
57 10 -- 3 2 3 < 1 -- 1 2 4 5 28 11 21 10 20 19 18 -- 13 5 2 < 1 1 1 8
58 4 -- 1 1 1 2 -- 1 1 2 7 24 12 19 10 15 13 15 -- 11 4 2 1 2 2 6
59 1 -- 1 < 1 2 1 -- 1 1 2 3 8 7 16 4 11 8 13 -- 8 6 2 2 1 1 6
60 0 -- 1 < 1 3 1 -- 0 1 2 4 4 5 13 3 9 5 8 -- 4 6 1 1 < 1 1 4
61 0 -- 1 1 < 1 1 -- < 1 1 1 1 4 3 9 3 5 4 4 -- 2 3 1 1 < 1 < 1 4
62 0 -- 0 2 1 1 -- 1 < 1 < 1 1 5 2 4 3 3 2 3 -- 3 1 1 < 1 < 1 0 2
63 0 -- 0 2 2 < 1 -- 0 < 1 < 1 1 3 1 3 < 1 2 2 4 -- 1 3 < 1 < 1 1 1 2
64 0 -- 0 1 0 < 1 -- 0 < 1 < 1 < 1 1 < 1 2 1 1 < 1 1 -- 1 1 < 1 1 < 1 < 1 1
65 0 -- 0 0 0 < 1 -- 0 0 < 1 3 0 < 1 2 < 1 1 < 1 1 -- < 1 < 1 < 1 0 < 1 < 1 < 1
66 0 -- 0 0 < 1 1 -- 0 < 1 < 1 0 1 < 1 < 1 0 < 1 < 1 1 -- < 1 3 0 0 0 1 < 1
67 0 -- 0 0 0 1 -- 1 0 < 1 < 1 1 < 1 1 0 < 1 < 1 0 -- < 1 0 < 1 < 1 0 0 < 1
68 0 -- 0 0 0 0 -- 0 0 < 1 0 0 < 1 0 0 < 1 1 < 1 -- 0 1 < 1 0 < 1 0 < 1
69 0 -- 0 0 0 0 -- 0 0 < 1 2 0 < 1 < 1 0 < 1 < 1 0 -- 0 0 0 0 0 0 0
70 0 -- 0 0 0 0 -- < 1 0 0 0 0 0 0 0 0 0 0 -- 0 0 0 0 0 0 0
71 0 -- 0 0 0 0 -- 0 0 < 1 0 0 0 < 1 0 0 0 0 -- 0 0 < 1 0 0 0 0
72 0 -- 0 0 0 0 -- 0 0 0 0 0 0 0 0 < 1 0 0 -- 0 0 0 0 0 0 0
73 0 -- 0 0 0 0 -- 0 0 0 0 0 0 0 0 0 0 0 -- 0 0 0 0 0 0 0
74 0 -- 0 0 0 0 -- 0 0 0 0 0 0 0 0 0 0 0 -- 0 0 0 0 0 0 0
75 0 -- 0 0 0 0 -- 0 0 0 0 0 0 0 0 0 0 0 -- < 1 0 0 0 0 0 0
Total 2,786 -- 2,278 1,757 1,175 586 -- 302 290 375 380 713 436 493 764 777 583 505 -- 449 433 257 317 331 356 294

Lat
itude
40
Longitude
Figure 1.--Transect lines and distribution of trawls during the winter 2006 echo integration-trawl surveys of the
Shumagin Islands, Sanak Trough and Morzhovoi Bay in the Gulf of Alaska.

Longitude
Lat
itu
de
Figure 2.--Transect lines and distribution of trawls in the Shelikof Strait area and
along the Gulf of Alaska shelf break near Chirikof Island echo integration-
trawl surveys, 12-22 March 2006.
41

Temperature (°C)
2.5 3.0 3.5 4.0 4.5 5.0 5.5 6.0
Dep
th (
m)
0
20
40
60
80
100
120
140
160
180
200
Figure 3.--Average temperature (°C) (symbols) by 10-m depth intervals observed during the
winter 2006 echo integration-trawl survey of walleye pollock in the Shumagin
Islands area. The horizontal bars represent temperature range observed during the
survey. Data were collected at 10 locations.
42
2.0
1.5
1.0
0.5
0.0
5 10 15 20 25 30 35 40 45 50 55 60 65 70
a
16,100 t
0.40
0.30
0.20
0.10
0.00
0.75
0.50
0.25
0.00
0.15
0.10
0.05
0.00
5 10 15 20 25 30 35 40 45 50 55 60 65 70
b
1,400 t
5 10 15 20 25 30 35 40 45 50 55 60 65 70
c
3,000 t
5 10 15 20 25 30 35 40 45 50 55 60 65 70
d
1,200 t
750
500
250
0
5 10 15 20 25 30 35 40 45 50 55 60 65 70
e
15,500 t
Fork length (cm)
Figure 4.--Size distribution of pollock (numbers) (a) off Renshaw Point, (b) in Unga Strait,
(c) in West Nagai Strait, (d) in Stepovak Bay, and (e) in Shumagin Trough for the
2006 echo integration-trawl survey of the Shumagin Islands. Note: because no
trawls were conducted in Stepovak Bay, trawls conducted off Renshaw Point
were used for scaling the acoustic data collected in this area.
43
Nu
mb
ers
(mil
lio
ns)

35
15 20 25 30 35 40 45 50 55 60 65
Spent
Spawning
Prespawning
Developing
Immature
a Males
n = 233
1.00
30
Fre
quen
cy
actual
predicted
c L50% = 38 cm
n = 259 0.75 25
20
15
10
Gonad
oso
mat
ic i
ndex
P
roport
ion
mat
ure
0.50
0.25
5
0 0.00
10 15 20 25 30 35 40 45 50 55 60 65 70
30 0.40 Spent
Spawning
Prespawning
Developing
Immature
b Females
n = 206
d mean = 0.132
SD = 0.042
n = 161
0.35
0.30
0.25
0.20
0.15
0.10
0.05
25
20
15
10
5
0 0.00
15 20 25 30 35 40 45 50 55 60 65 10 15 20 25 30 35 40 45 50 55 60 65 70
Fork length (cm) Fork length (cm)
Figure 5.--Maturity stages for (a) male and (b) female pollock, (c) proportion mature by 1-cm size group for female pollock and
(d) gonadosomatic index for pre-spawning females examined during the 2006 echo integration-trawl survey of
Shumagin Islands in the Gulf of Alaska.
44

Lat
itude
45
Longitude
Figure 6.--Pollock biomass (metric tons) along track lines during the February 2006 echo integration-trawl
surveys of the Shumagin Islands, Sanak Trough and Morzhovoi Bay in the Gulf of Alaska.

0
Bottom depth (m)
Mea
n p
oll
ock
dep
th (
m)
0 25 50 75 100 125 150 175 200 225
25
50
75
100
125
150
175
200
225
Figure 7.--Average pollock depth (weighted by biomass) versus bottom
depth (m) by 0.5-nmi interval for pollock observed during the
winter 2006 echo integration-trawl survey of walleye pollock
in the Shumagin Islands area. Bubble size is scaled to the
maximum biomass.
46

Bio
mas
s (t
)
350,000
300,000
250,000
200,000
150,000
100,000
50,000
0
Par
tial
su
rvey
Par
tial
su
rvey
No s
urv
ey
No s
urv
ey
No s
urv
ey
No s
urv
ey
No s
urv
ey
19
94
19
95
19
96
19
97
19
98
19
99
20
00
20
01
20
02
20
03
20
04
20
05
20
06
Year
Figure 8.--Summary of annual pollock biomass estimates based on echo integration-trawl
surveys of the Shumagin Islands area.
47

5 15 25 35 45 55 65 75 5 15 25 35 45 55 65 75
5 15 25 35 45 55 65 75 5 15 25 35 45 55 65 75
5 15 25 35 45 55 65 75 5 15 25 35 45 55 65 75
Numbers (millions) Biomass (thousands of metric tons)
20
25
1994 15
1994
15 10
5
10 5
0 0
0
10
20
30
40
50
60
0
10
20
30
40
50
1995 1995
0
2
4
6
8
10
12
0
5
10
15
20
1996 1996
0
10
20
30
40
0
2
4
6
8
10
2001 2001
5 15 25 35 45 55 65 75 5 15 25 35 45 55 65 75
Fork length (cm)
Figure 9.--Pollock size composition estimates for the Shumagin Islands area based on
echo integration-trawl surveys during 1994-96, 2001-03, and 2005-06.
48
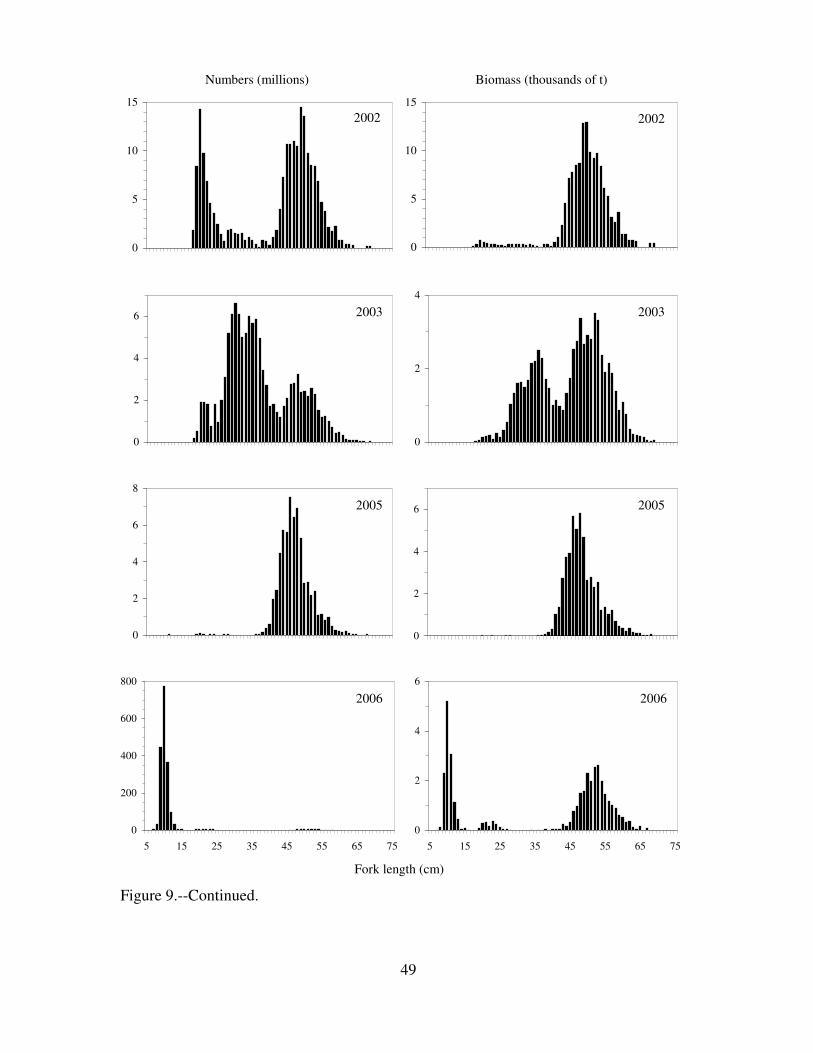
5 15 25 35 45 55 65 75 5 15 25 35 45 55 65 75
5 15 25 35 45 55 65 75 5 15 25 35 45 55 65 75
5 15 25 35 45 55 65 75 5 15 25 35 45 55 65 75
Numbers (millions) Biomass (thousands of t)
0
5
10
15
0
5
10
15
2002 2002
0
2
4
6
0
2
4
2003 2003
0
2
4
6
8
0
2
4
6 2005 2005
0
200
400
600
800
0
2
4
6
2006 2006
5 15 25 35 45 55 65 75 5 15 25 35 45 55 65 75
Fork length (cm)
Figure 9.--Continued.
49
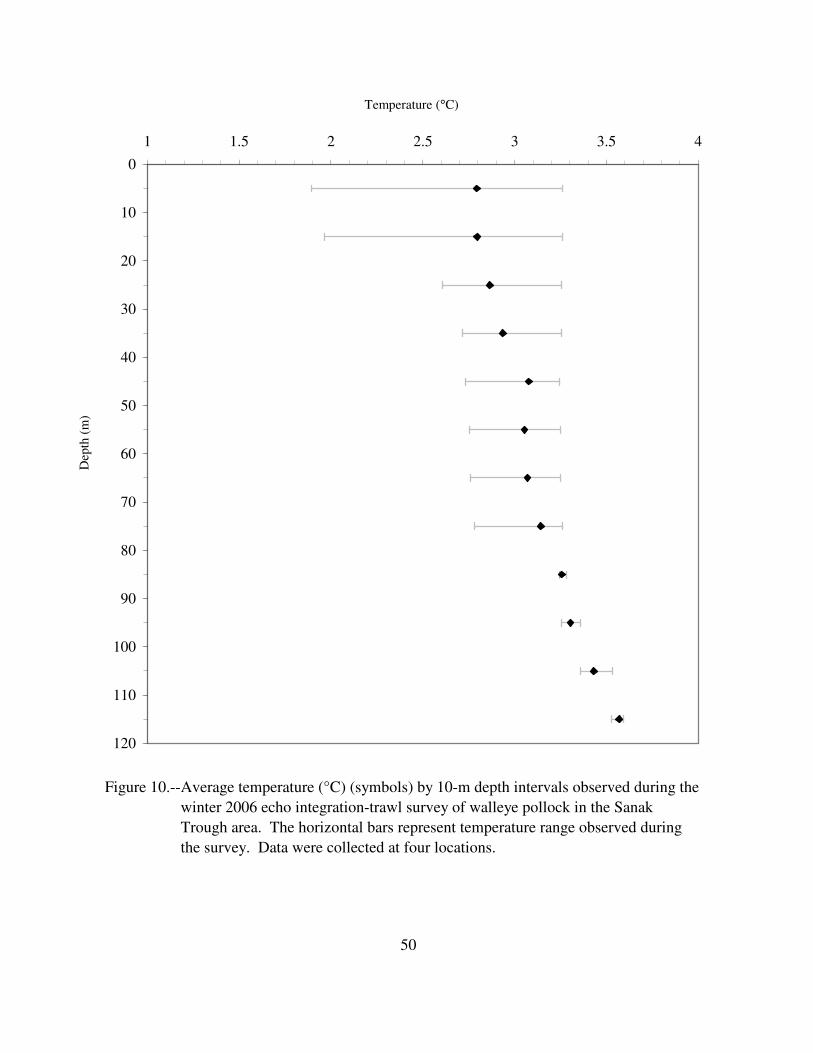
4
Temperature (°C)
1 1.5 2 2.5 3 3.5
Dep
th (
m)
0
10
20
30
40
50
60
70
80
90
100
110
120
Figure 10.--Average temperature (°C) (symbols) by 10-m depth intervals observed during the
winter 2006 echo integration-trawl survey of walleye pollock in the Sanak
Trough area. The horizontal bars represent temperature range observed during
the survey. Data were collected at four locations.
50

Num
ber
(th
ousa
nds)
10000
7500
5000
2500
0
10 15 20 25 30 35 40 45 50 55 60 65 70
127,200 t
Fork length (cm)
Figure 11.--The size distribution of pollock (numbers) for the 2006 echo integration-
trawl survey of Sanak Trough.
51

20 1.00
0 0.00
15 20 25 30 35 40 45 50 55 60 65 70 10 15 20 25 30 35 40 45 50 55 60 65 70 75
c n = 157
15 0.40
Spent
Spawning
Prespawning
Developing
Immature
a Males
n = 168 15 0.75
Go
nad
oso
mat
ic i
nd
ex
Pro
po
rtio
n m
atu
re
10 0.50
5 0.25
Spent
Spawning
Prespawning
Developing
Immature
b Females
n = 158
d mean = 0.161
SD = 0.048
n = 98
0.30
0.20
0.10
10
5
0 0.00
15 20 25 30 35 40 45 50 55 60 65 70 20 25 30 35 40 45 50 55 60 65 70
Fork length (cm) Fork length (cm)
Figure 12.--Maturity stages for (a) male and (b) female pollock, (c) proportion mature by 1-cm size group for female pollock
and (d) gonadosomatic index for pre-spawning females examined during the winter 2006 echo integration-trawl
survey of Sanak Trough in the Gulf of Alaska.
Fre
qu
ency
52

Bottom depth (m)
0
25
50
75
100
125
150
175
200
225
Mea
n p
oll
ock
dep
th (
m)
0 25 50 75 100 125 150 175 200 225
Figure 13.--Average pollock depth (weighted by biomass) versus bottom
depth (m) by 0.5-nmi interval for pollock observed during the
winter 2006 echo integration-trawl survey of walleye pollock
in Sanak Trough. Bubble size is scaled to the maximum biomass.
53

Temperature (°C)
1.0 1.5 2.0 2.5
Dep
th (
m)
0
10
20
30
40
50
60
70
80
90
100
110
Figure 14.--Average temperature (°C) (symbols) by 10-m depth intervals observed during the
winter 2006 echo integration-trawl survey of walleye pollock in the Morzhovoi
Bay area. The horizontal bars represent temperature range observed during the
survey. Data were collected at two locations.
54

Num
ber
(th
ousa
nds)
1750
1500
1250
1000
750
500
250
0
10 15 20 25 30 35 40 45 50 55 60 65 70
11,700 t
Fork length (cm)
Figure 15.--The size distribution of pollock (numbers) for the 2006 echo integration-
trawl survey of Morzhovoi Bay.
55

56
35 1.00
30
Pro
po
rtio
n m
atu
reG
on
ado
som
atic
in
dex
Fre
qu
ency
Insufficient data
20 25 30 35 40 45
Spent
Spawning
Prespawning
Developing
Immature
a Males
n = 223
b
c
Insufficient data
25
20
15
10
0.75
0.50
0.25
5
0 0.00
15 50 55 60 65 70 10 15 20 25 30 35 40 45 50 55 60 65 70
0.40
Insufficient data
d
0.30
0.20
0.10
1
0 0.00
15 20 25 30 35 40 45 50 55 60 65 70 20 25 30 35 40 45 50 55 60 65 70
Fork length (cm)
Figure 16.--Maturity stages for (a) male pollock examined during the winter 2006 echo integration-trawl survey of Morzhovoi
Bay in the Gulf of Alaska. Due to insufficent data, (b) maturity stages for female pollock, (c) proportion mature
by 1-cm size group for female pollock and (d) gonadosomatic index for pre-spawning females are not shown.

Bottom depth (m)
0
25
50
75
100
125
150
175
200
225
Mea
n p
oll
ock
dep
th (
m)
0 25 50 75 100 125 150 175 200 225
Figure 17.--Average pollock depth (weighted by biomass) versus bottom
depth (m) by 0.5-nmi interval for pollock observed during the
winter 2006 echo integration-trawl survey of walleye pollock in
Morzhovoi Bay. Bubble size is scaled to the maximum biomass.
57

6.5
Temperature (°C)
3.5 4.0 4.5 5.0 5.5 6.0
Dep
th (
m)
0
25
50
75
100
125
150
175
200
225
250
275
300
325
350
375
400
Figure 18.--Average temperature (°C) (symbols) by 10-m depth intervals observed during the
winter 2006 echo integration-trawl survey of walleye pollock of the Chirikof
Island area in the Gulf of Alaska. The horizontal bars represent temperature
range observed during the survey. Data were collected at four locations.
58

Num
ber
s (m
illi
ons)
10.0
7.5
5.0
2.5
0.0
10 15 20 25 30 35 40 45 50 55 60 65
69,000 t
Fork length (cm)
Figure 19.--The size distribution of pollock (numbers) of the shelf-break area near
Chirikof Island during the 2006 echo integration-trawl surveys in the Gulf of
Alaska.
59
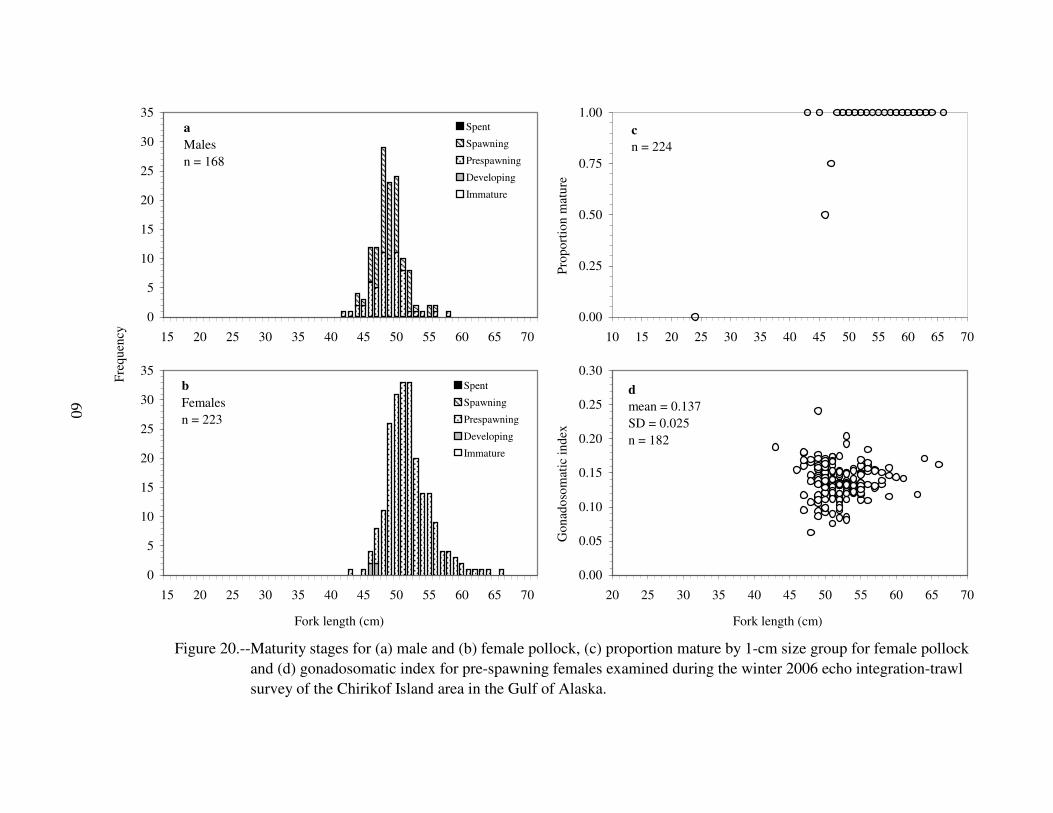
30
35
15 20 25 30 35 40 45 50 55 60 65 70
Spent
Spawning
Prespawning
Developing
Immature
a Males
n = 168
1.00
5
0 0.00
c n = 224
10 15 20 25 30 35 40 45 50 55 60 65 70
35 0.30
0.75 25
20
15
10
Go
nad
oso
mat
ic i
nd
ex
Pro
po
rtio
n m
atu
re
0.50
0.25
Spent
Spawning
Prespawning
Developing
Immature
b Females
n = 223
d mean = 0.137
SD = 0.025
n = 182
30
25
20
15
10
5
0.25
0.20
0.15
0.10
0.05
0 0.00
15 20 25 30 35 40 45 50 55 60 65 70 20 25 30 35 40 45 50 55 60 65 70
Fork length (cm) Fork length (cm)
Figure 20.--Maturity stages for (a) male and (b) female pollock, (c) proportion mature by 1-cm size group for female pollock
and (d) gonadosomatic index for pre-spawning females examined during the winter 2006 echo integration-trawl
survey of the Chirikof Island area in the Gulf of Alaska.
Fre
qu
ency
60

Longitude
Lat
itu
de
Figure 21.--Near-bottom pollock biomass along transects from the 2006 echo
integration-trawl survey of the Shelikof Strait area and all pollock along
the Gulf of Alaska shelf break near Chirikof Island.
61

Bottom depth (m)
0
100
200
300
400
500
600
700
800
900
1,000
Mea
n p
oll
ock
dep
th (
m)
0 100 200 300 400 500 600 700 800 900 1,000
Figure 22.--Average pollock depth (weighted by biomass) versus bottom
depth (m) by 0.5-nmi interval for pollock observed during the
winter 2006 echo integration-trawl survey of walleye pollock in
the Chirikof Island area. Bubble size is scaled to the maximum
biomass.
62
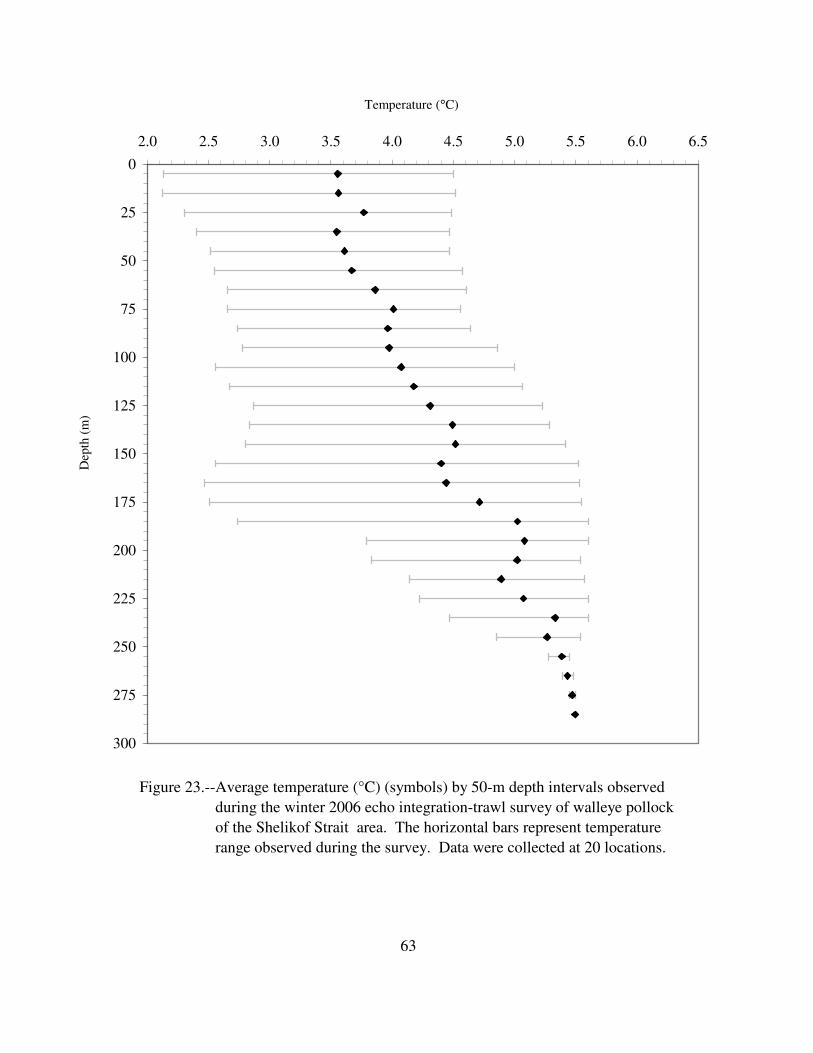
Temperature (°C)
2.0 2.5 3.0 3.5 4.0 4.5 5.0 5.5 6.0 6.5
Dep
th (
m)
0
25
50
75
100
125
150
175
200
225
250
275
300
Figure 23.--Average temperature (°C) (symbols) by 50-m depth intervals observed
during the winter 2006 echo integration-trawl survey of walleye pollock
of the Shelikof Strait area. The horizontal bars represent temperature
range observed during the survey. Data were collected at 20 locations.
63
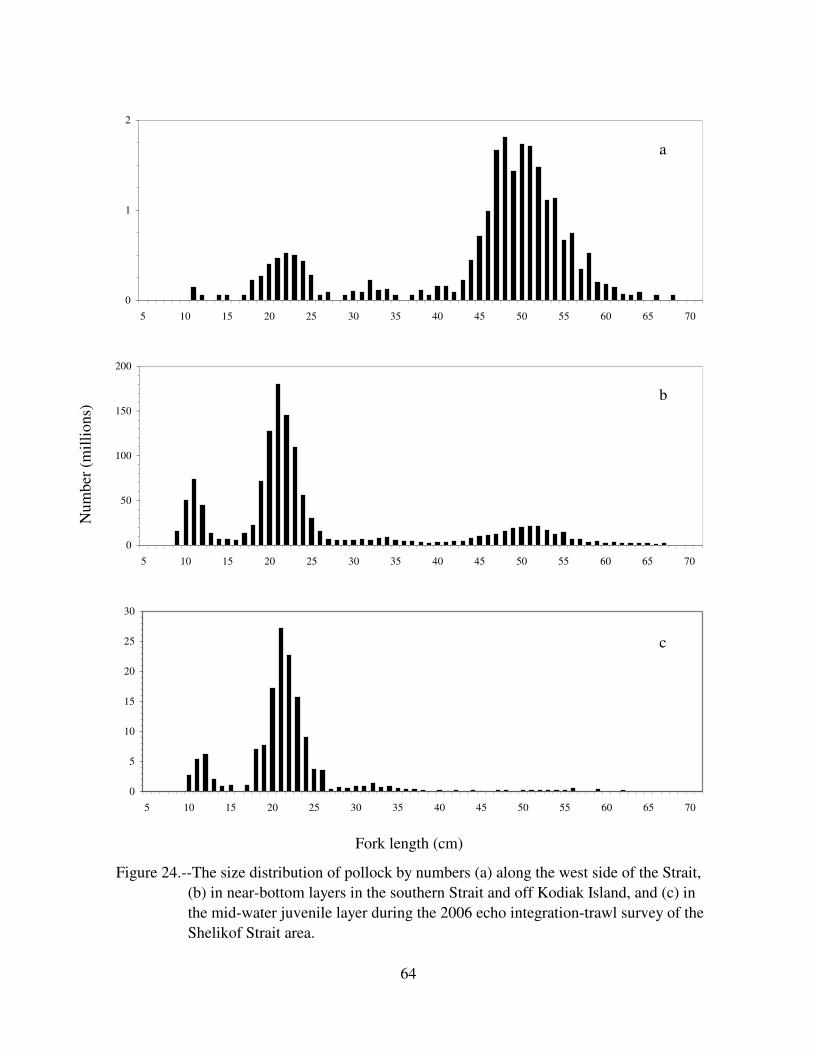
Nu
mb
er (
mil
lio
ns)
2
1
0
5 10 15 20 25 30 35 40 45 50 55 60 65 70
a
200
150
100
50
0
5 10 15 20 25 30 35 40 45 50 55 60 65 70
b
30
25
20
15
10
5
0
5 10 15 20 25 30 35 40 45 50 55 60 65 70
c
Fork length (cm)
Figure 24.--The size distribution of pollock by numbers (a) along the west side of the Strait,
(b) in near-bottom layers in the southern Strait and off Kodiak Island, and (c) in
the mid-water juvenile layer during the 2006 echo integration-trawl survey of the
Shelikof Strait area.
64

30
35
15 20 25 30 35 40 45 50 55 60 65 70
Spent
Spawning
Prespawning
Developing
Immature
a Males
n = 252
1.00
actual
predicted
c L50% = 43 cm
n = 663 25
20
15
10
0.75
Go
nad
oso
mat
ic i
nd
ex
Pro
po
rtio
n m
atu
re
0.50
0.25
5
0 0.00
10 15 20 25 30 35 40 45 50 55 60 65 70
0.30 Spent
Spawning
Prespawning
Developing
Immature
b Females
n = 496
d mean = 0.138
SD = 0.035
n = 409
50
40
30
20
10
0.25
0.20
0.15
0.10
0.05
0 0.00
15 20 25 30 35 40 45 50 55 60 65 70 20 25 30 35 40 45 50 55 60 65 70 75
Fork length (cm) Fork length (cm)
Figure 25.--Maturity stages for (a) male and (b) female pollock, (c) a fitted logistic function and proportion mature by 1-cm
size group for female pollock. and (d) gonadosomatic index for pre-spawning females examined during the winter
2006 echo integration-trawl survey of the Shelikof Strait in the Gulf of Alaska.
Fre
qu
ency
65

Bottom depth (m)M
ean
po
llo
ck d
epth
(m
)
0 50 100 150 200 250 300
0
50
100
150
200
250
300
Figure 26.--Average pollock depth (weighted by biomass) versus bottom
depth (m) by 0.5-nmi interval for near-bottom pollock (open
circles) and mid-water juvenile pollock (gray circles) for the
winter 2006 echo integration-trawl survey of walleye pollock
in the Shelikof Strait area. Bubble size is scaled to the
maximum biomass.
66

Lat
itu
de
Longitude
Figure 27.--Mid-water juvenile pollock biomass along transects from the 2006 echo
integration-trawl survey of the Shelikof Strait area.
67

68
Bio
mas
s (m
illi
on
t)
Year
Figure 28.--Summary of annual pollock biomass estimates based on echo integration-trawl surveys of the Shelikof
Strait area.
3.0
2.5
2.0
1.5
1.0
0.5
0.0
1981
1982
1983
1984
1985
1986
1987
1988
1989
1990
1991
1992
1993
1994
1995
1996
1997
1998
1999
2000
2001
2002
2003
2004
2005
2006
No
Su
rvey
No
est
imat
e
No
Su
rvey

1 3 5 7 9 11 13 15 17
1 3 5 7 9 11 13 15 17 1 3 5 7 9 11 13 15 17
1 3 5 7 9 11 13 15 17 1 3 5 7 9 11 13 15 17
1 3 5 7 9 11 13 15 17 1 3 5 7 9 11 13 15 17
1 3 5 7 9 11 13 15 17
1 3 5 7 9 11 13 15 17 1 3 5 7 9 11 13 15 17
Numbers (millions) Biomass (thousands)
12000
1995 250
2008000
150
100400050
0 0
1995
4000
3000
2000
1000
0
1996 250
200
150
100
50
0
1996
1500 250
2001000
1997 150
100500
50
0 0
1997
500
400
300
200
100
0
1998 200
150
100
50
0
1998
5000
4000
3000
2000
1000
0
2000 150
100
50
0
2000
5000
4000
3000
2000
1000
0
2001 250
200
150
100
50
0
2001
1 3 5 7 9 11 13 15 17 1 3 5 7 9 11 13 15 17
Age (years)
Figure 29.--Annual pollock age compostition estimates for the Shelikof Strait area
based on echo integration-trawl surveys conducted from 1995 to 2005.
Note: area was not surveyed in 1999.
69

1 3 5 7 9 11 13 15 17 1 3 5 7 9 11 13 15 17
1 3 5 7 9 11 13 15 17 1 3 5 7 9 11 13 15 17
1 3 5 7 9 11 13 15 17 1 3 5 7 9 11 13 15 17
Numbers (millions) Biomass (thousands)
2002 200
1000 150
100 500
50
0 0
2002
750
500
250
0
2003 250
200
150
100
50
0
2003
400
300
200
100
0
2004 200
150
100
50
0
2004
2005 150
1500
100 1000
50 500
0 0
2005
1 3 5 7 9 11 13 15 17 1 3 5 7 9 11 13 15 17
Age (years)
Figure 29.--Continued.
70

5 15 25 35 45 55 65 75 5 15 25 35 45 55 65 75
5 15 25 35 45 55 65 75 5 15 25 35 45 55 65 75
5 15 25 35 45 55 65 75 5 15 25 35 45 55 65 75
5 15 25 35 45 55 65 75 5 15 25 35 45 55 65 75
5 15 25 35 45 55 65 75 5 15 25 35 45 55 65 75
Numbers (millions) Biomass (thousands)
40001995 60
300040
2000
201000
0 0
1995
1000
1996 80
750 60
500 40
250 20
0 0
1996
300
200
100
0
1997 50
40
30
20
10
0
1997
150 40
30100
1998
20
5010
0 0
1998
2000 25
1500 20
15100010
5005
0 0
2000
1500
2001 75
1000 50
500 25
0 0
2001
5 15 25 35 45 55 65 75 5 15 25 35 45 55 65 75
Fork length (cm)
Figure 30.--Annual pollock size compostition estimates for the Shelikof Strait area
based on echo integration-trawl surveys conducted from 1995 to 2006.
Note: area was not surveyed in 1999.
71

5 15 25 35 45 55 65 75 5 15 25 35 45 55 65 75
5 15 25 35 45 55 65 75 5 15 25 35 45 55 65 75
5 15 25 35 45 55 65 75 5 15 25 35 45 55 65 75
5 5 15 25 35 45 55 65 75
Numbers (millions) Biomass (thousands)
300
225
150
75
0
2002 40
30
20
10
0
2002
2003
2004
2005
2006
200
150
100
50
0
2003 50
40
30
20
10
0
75
2004 20 50
10 25
0 0
750
5 15 25 35 45 55 65 7
2005 30
500 20
250 10
00
200 2006 20
100 10
0 0
5 15 25 35 45 55 65 75 5 15 25 35 45 55 65 75
Fork length (cm)
Figure 30.--Continued.
72

0%
5%
10%
15%
Pro
po
rtio
n
3.2 cm liner
1.3 cm liner
5 10 15 20 25 30 35 40 45 50 55 60 65 70
Fork length (cm)
Figure 31.--Mean length distribution by codend liner mesh size for six pairs of
tows conducted following the 2006 echo integration-trawl survey of
the Shelikof Strait area.
73


