AGE AND LENGTH COMPOSITION OF COLUMBIA
BASIN CHINOOK AND SOCKEYE SALMON AND
STEELHEAD AT BONNEVILLE DAM IN 2006
Technical Report 07-04
John Whiteaker
Jeffrey K. Fryer, Ph.D.
March 12, 2007

i
ABSTRACT
The Columbia River Inter-Tribal Fish Commission (CRITFC) conducted a field study at
Bonneville Dam in 2006 to assess the age, length-at-age and stock composition of adult Pacific
salmon migrating up the Columbia River. These data were then used to predict the 2007
Chinook salmon run. Adult spring, summer and fall Chinook salmon (Oncorhynchus
tshawytscha), sockeye salmon (O. nerka) and summer-run steelhead (O. mykiss) were collected,
sampled for scales and additional biological data, revived and released. Caudal fin clips were
also taken from Chinook salmon and steelhead for later genetic analysis. Scales were examined
to estimate age composition; the results contributed to an ongoing database for age structure of
Columbia Basin salmon runs. Based on scale pattern analysis four-year-olds were the most
abundant age group for spring Chinook salmon comprising 79.8% of the run. Five-year-olds
were the most abundant age class for summer and fall Chinook making up 53.3% and 35.8% of
their respective runs. Four-year-olds were the most abundant age group for sockeye salmon
comprising 65% of the run, and three and four-year-old were the most abundant in steelhead
comprising 39.7% and 35.4% respectively of the run. Based on fin marks for classification, the
steelhead migration consisted of 70% hatchery- and 30% natural-origin steelhead. A-run
steelhead, less than 78cm in length, comprised 71% of the steelhead run. B-run fish, equal to or
greater than 78cm, comprised 29% of the run.
A year-class regression based on up to 19 years of data was used to predict spring, summer, and
bright fall Chinook salmon population sizes for 2007. Based on three-year-old returns, the
relationship predicts four-year-old returns of 55,400 (+ 62,100, 90% predictive interval [PI])
spring Chinook, 13,600 (+ 24,000, 90% PI) summer, and 116,200 (+ 124,700, 90% PI) bright fall
Chinook salmon for the 2007 runs. Based on four-year-old returns, the relationship predicts five-
year-old returns of 13,700 (+ 49,800, 90% PI) spring, 21,700 (+ 9,200, 90% PI) summer, and
50,700 (+ 44,200, 90% PI) bright fall Chinook salmon for the 2007 runs.

ii
ACKNOWLEDGMENTS
We sincerely thank the following individuals for their assistance in this project: Bobby Begay,
Athena Stillinger, Ryan Branstetter, Denise Kelsey, Doug Hatch, Rishi Sharma, Stuart Ellis,
Marianne McClure, and Phil Roger of the Columbia River Inter-Tribal Fish Commission; Warm
Springs Tribe Interns Michael and Richard McConville; Tammy Mackey and Jon Rerecich of the
US Army Corps of Engineers; Megan Heinrich and Steven Lee of the University of Idaho; and
John Sneva of the Washington Department of Fish and Wildlife.
This report is the result of research funded by US Government (Bureau of Indian Affairs,
Department of Interior) Contract No. GTP00X90107 for implementation of the US-Canada
Pacific Salmon Treaty and The Northwest Fisheries Science Center (NWFSC), of the National
Oceanic and Atmospheric Administration Fisheries (NOAA-Fisheries).

iii
TABLE OF CONTENTS
ABSTRACT .................................................................................................... i
ACKNOWLEDGMENTS................................................................................ ii
INTRODUCTION ........................................................................................... 7
METHODS...................................................................................................... 8
Study Area ........................................................................................... 8
Sample Design ..................................................................................... 9
Fish Collection ..................................................................................... 9
Fish Coloration and Condition.............................................................. 9
Age Determination ............................................................................... 10
Age and Length-at-Age Composition ................................................... 10
Steelhead Hatchery/Wild Determination............................................... 10
Steelhead A/B Run Determination........................................................ 10
Steelhead Gender Determination .......................................................... 11
Steelhead Kelts..................................................................................... 11
Chinook Salmon Run-Size Prediction................................................... 11
RESULTS........................................................................................................ 12
Sampling.............................................................................................. 12
Age Composition ................................................................................. 12
Length-at-Age Composition ................................................................. 18
Steelhead Hatchery/Wild Determination............................................... 18
Steelhead A/B Run Determination........................................................ 18
Steelhead Gender Determination .......................................................... 18
Fish Coloration and Condition.............................................................. 23
Chinook Salmon Run-Size Prediction for 2005..................................... 23

iv
DISCUSSION.................................................................................................. 32
River Water Temperature ..................................................................... 32
Genetic Sampling ................................................................................. 32
Project Continuation............................................................................. 32
REFERENCES................................................................................................ 34
APPENDIX A ................................................................................................. 36
LIST OF TABLES........................................................................................... 36

v
LIST OF TABLES
1. Weekly and cumulative age composition estimates of Columbia Basin spring
Chinook salmon sampled at Bonneville Dam in 2006.........................................13
2. Weekly and cumulative age composition estimates of Columbia Basin
summer Chinook salmon sampled at Bonneville Dam in 2006 ...........................15
3. Weekly and cumulative age composition estimates of Columbia Basin
bright fall Chinook salmon sampled at Bonneville Dam in 2006 ........................17
4. Weekly and cumulative age composition estimates of Columbia Basin
sockeye salmon sampled at Bonneville Dam in 2006 .........................................19
5. Weekly and cumulative age composition estimates of Columbia Basin
steelhead sampled at Bonneville Dam in 2006....................................................20
6. Weekly and cumulative fin mark, gender, and A and B composition of
Columbia basin steelhead sampled at Bonneville Dam in 2006 ..........................21
7. Composition (%) of observed conditions and coloration categories of
Columbia Basin salmon sampled at Bonneville Dam in 2006.............................23
8 Predicted and estimated abundance of Chinook salmon returning to
Bonneville Dam.................................................................................................31
vi
LIST OF FIGURES
1. Map of the Columbia River displaying federal dams ............................................8
2. Weekly age composition estimates for the Columbia Basin Chinook
salmon age classes sampled at Bonneville Dam in 2006.....................................14
3. Weekly freshwater age composition estimates of Columbia Basin Chinook
salmon sampled at Bonneville Dam in 2006.......................................................16
4. Weekly mean length estimates of Columbia Basin Chinook salmon by age
class (showing stream- and ocean-type) sampled at Bonneville Dam in
2006...................................................................................................................22
5. Predicted 2007 four-year-old Columbia Basin spring Chinook salmon
abundance (at Bonneville Dam) based on a linear relationship between
four-year-old and three-year-old fish abundance during brood years 1984
through 2001......................................................................................................25
6. Predicted 2007five-year-old Columbia Basin spring Chinook salmon
abundance (at Bonneville Dam) based on a linear relationship between
five-year-old and four-year-old fish abundance during brood years 1983
through 2000......................................................................................................26
7. Predicted 2007 four-year-old Columbia Basin summer Chinook salmon
abundance (at Bonneville Dam) based on a linear relationship between
four-year-old and three-year-old fish abundance during brood years 1987
through 2001......................................................................................................27
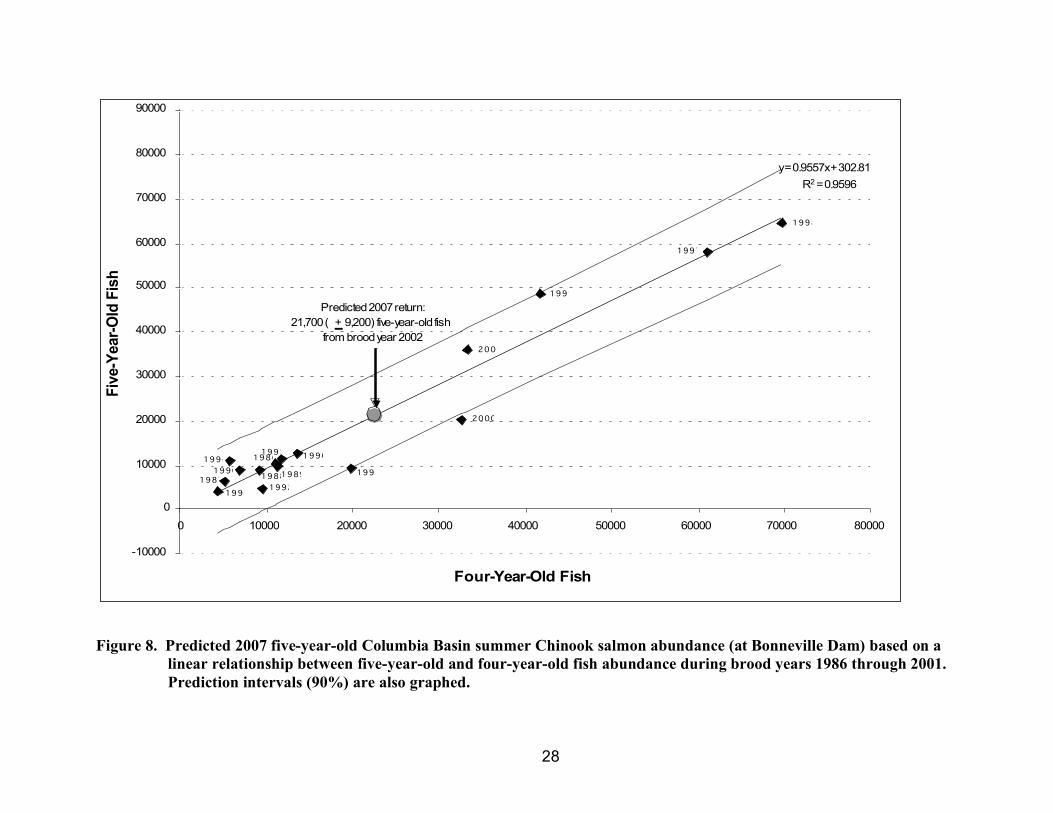
8. Predicted 2007 five-year-old Columbia Basin summer Chinook salmon
abundance (at Bonneville Dam) based on a linear relationship between
five-year-old and four-year-old fish abundance during brood years 1986
through 2000......................................................................................................28
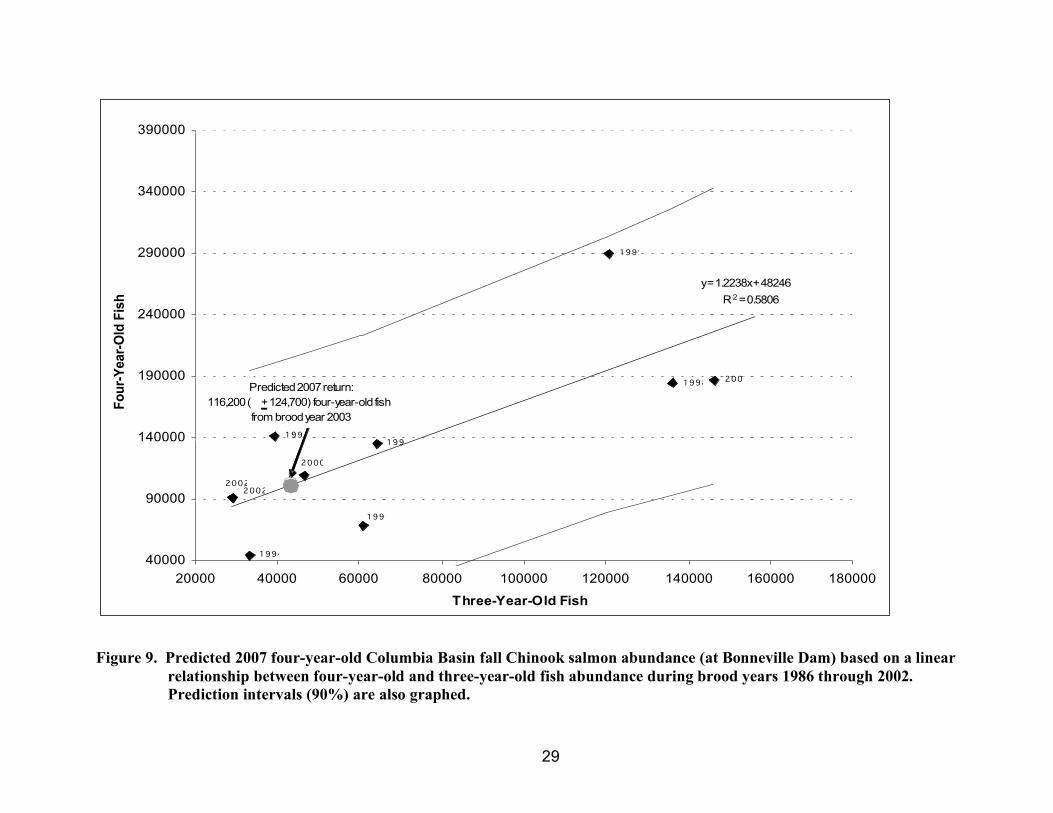
9. Predicted 2007 four-year-old Columbia Basin bright fall Chinook salmon
abundance (at Bonneville Dam) based on a linear relationship between
four-year-old and three-year-old fish abundance during brood years 1994
through 2001......................................................................................................29
10. Predicted 2007 five-year-old Columbia Basin bright fall Chinook salmon
abundance (at Bonneville Dam) based on a linear relationship between
five-year-old and four-year-old fish abundance during brood years 1993
through 2000......................................................................................................30
11. Chinook and steelhead daily run size and daily river temperature from
March 15 through November 1, 2006.................................................................33

7
INTRODUCTION
In 1985, the US-Canada Pacific Salmon Treaty was formed to manage research and enhance
Pacific salmon (PSC 2000). The treaty established the Spawning Escapement-Monitoring
program to assess indicator stocks within the Columbia River Basin and improve methods for
providing population estimates, escapement monitoring, establishing spawner-recruit
relationships and developing harvest management approaches (PST 1985). As part of this
program, the Columbia River Inter-Tribal Fish Commission (CRITFC) has developed a
comprehensive research strategy to monitor the age and stock composition of adult Pacific
salmon returning to the Columbia River. This project has monitored the above Bonneville Dam
adult migration of sockeye salmon (Oncorhynchus nerka) since 1985, spring Chinook salmon
(O. tshawytscha) since 1987, summer Chinook salmon since 1990, and up-river bright fall
Chinook salmon since 1998. Data on these runs are provided in near real time at www.critfc.org.
At the request of the NOAA Fisheries Northwest Fisheries Science Center, summer steelhead(O.
mykiss) were added to our sampling regime in 2004. The Conservation Biology Division
(NOAA Fisheries) formed the Mathematical Biology and Systems Monitoring Program to
develop, in collaboration with the existing Salmon Science Programs and Salmon Recovery
Planning Teams, quantitative tools for assessing population and habitat status and recovery
potential and progress. Monitoring the age structure, hatchery fraction and stock composition of
the adult Columbia River summer steelhead provides valuable information for this program.
Scale pattern analysis, the analysis of concentric rings or circuli to provide records of previous
life history, is a common method for age determination in Pacific salmon (Nielsen and Johnson
1983). Fast summer growth widens the distances between circuli on the scale and slow winter
growth shortens the distance between circuli. Typically, age can be determined by counting the
number of winters observed on the scale (Gilbert 1913, Rich and Holmes 1929). This method is
valuable in Pacific salmon management because scales can be collected without sacrificing the
fish and scale samples can be collected, processed, and aged promptly. Problems with this
method may include variability in scale growth, scale resorption, and difficulties in age
validation (Knudsen 1990, Beamish and McFarlane 1983).
Scale pattern analysis can also be used for stock identification if distinctive patterns can be
linked to specific stocks. This method has generally been successful in discriminating Columbia
River sockeye partly because there are only two major runs of sockeye in the system, which
experience dramatically different early rearing environments (Fryer 1995). However, this method
was found to be less successful with Chinook salmon where numerous populations can exhibit
similar scale growth patterns. Currently a coast wide genetic database is being developed to
create baseline microsatellite and SNP (Single Nucleotide Polymorphim) genetic data for
individual Chinook populations throughout the region. This baseline genetic stock information
can be utilized in mixed stock sampling to distinguish individual stocks and will be useful for the
Chinook sampling program at Bonneville Dam.
The primary objectives for the 2006 sampling year were to estimate the age composition and
length-at-age composition of Chinook, sockeye and steelhead using scale pattern analysis, to
forecast the 2007 run size for Chinook salmon using the age composition data, to PIT tag
summer Chinook and sockeye salmon, and to collect tissue samples for use in the development
of a genetic stock monitoring and identification program for Chinook salmon and steelhead.

8
METHODS
Study Area
Research was conducted at the Adult Fish Facility (AFF) located adjacent to the Second
Powerhouse at Bonneville Dam (river km 235) on the north side of the Columbia River (Figure
1). This facility uses a picket weir to divert migrating fish, ascending the Washington shore fish
ladder, into the adult sampling facility collection pool. An attraction flow is used to draw fish
through a false weir where they can be selected for sampling. Fish not selected and fish that have
recovered from sampling are returned to the Washington Shore Fish ladder above the picket
weir.
Chinook salmon generally migrate between March and November and are typically categorized
into three races based on migration timing past Bonneville Dam. Chinook salmon passing
Bonneville from March 15 through June 15 are classified as spring Chinook, from June 16
through July 31 are classified as summer Chinook and August 1 through November 15 are
classified as fall Chinook. The fall Chinook run consists of lower river Tules and the Upriver
Bright fall Chinook. Based on the needs of the Pacific Salmon Commission, this study only
collects information on Upriver Bright fall Chinook. Sockeye salmon typically migrate between
May 15 and August 1 and summer-run steelhead between April 1 and October 31. The steelhead
run is further divided into A- and B-run components based on length (greater than 78 cm for B-
run).
Figure 1. Map of the Columbia River displaying federal dams. Bonneville Dam (rkm 235)

9
Sample Design
Adult fish were sampled one to three days per Statistical Week1 from March through October. A
desired minimum sample size of 610 fish each was set for spring, summer, and fall Chinook,
steelhead and sockeye salmon. This sample size was derived from simulations we conducted
based on the work of Thompson (1987) and assumes that the sample is distributed approximately
proportional to the weekly run size. It also assumes that our weekly sample represents a random
sample of the run passing over Bonneville Dam that week. These sample sizes achieved
precision and accuracy levels of d=0.05, !=0.10 for age composition estimates. Additional
samples were collected to buffer for unreadable scales as well as to provide more precision in
weekly age composition estimates. The composite age and length-at-age estimates were
calculated from weekly estimates weighted by the number of each species migrating past
Bonneville Dam during the sample week (Fryer 1995). Weekly and annual fish passage2 counts
were obtained from DART (2006) and the Fish Passage Center (2006).
Fish Collection
Fish of each species were trapped at the AFF and anesthetized. Chinook salmon under 35 cm in
length were not sampled to exclude precocious juveniles (known as minijacks). All sizes of
sockeye and steelhead were sampled. Each fish was measured for fork length to the nearest 0.5
cm, checked for identifying fin marks, tags, coloration and condition. Scale samples were
collected from all fish for aging and caudal fin tissue was collected from all Chinook salmon for
genetic stock composition analysis. These genetic samples will be used in the development of a
genetic stock identification program for Columbia River Chinook salmon. Beginning
approximately May 15, all fish sampled were scanned for PIT tags and any PIT tag codes
recorded. Summer Chinook and non-adipose clipped sockeye salmon sampled on or after June
14, 2006 were PIT tagged. All fish were revived in a freshwater tank or pool and returned to a
fishway leading to the Washington shore fish ladder.
Fish Coloration and Condition
Fish coloration and condition were recorded for all species at the time of sampling. Coloration
was based on qualitative observations with the categories of Bright, Intermediate and Dark.
Overall fish condition was also qualitatively assessed and classified on a scale of 1 to 5. Fish
classified as a 5 had no major injuries that break the skin, 4 had injuries that broke the skin, 3 had
injuries that penetrate the muscle tissue, 2 had injuries that penetrate a body cavity and 1 are fish
missing large sections of the body. In addition to the fish condition classification, specific
recognizable injuries or afflictions were recorded. These included percentage of descaling,
marine mammal injuries, net damage, parasites, fungus, headburn3, gas bubble trauma,
deformities, and various other injuries.
1. Statistical Weeks are sequentially numbered calendar-year weeks starting with the week that includes January 1
(Week 1). Excepting the first and last weeks of most years, weeks are seven days long, beginning on Sunday
and ending on Saturday. In 2006, for example, Statistical Week 15 began on April 9 and ended on April 15.
2. Tule fall Chinook counts are subtracted from the total fall Chinook counts to estimate the upriver bright fall
Chinook.
3. Headburn, the exfoliation of skin and tissues of the jaw and cranial region, has been identified as a possible
stress indicator of high river flow conditions or spillway discharge from dams (Elston 1996, Groberg 1996).

10
Age Determination
To minimize the scale sample rejection rate, six scales (three per side) were collected for each
Chinook and steelhead sampled (Knudsen 1990) and four scales (two per side) were collected
from each sockeye salmon sampled. Scales were mounted and pressed according to methods
described by Clutter and Whitesel (1956) and the International North Pacific Fisheries
Commission (1963). Individual samples were visually examined and categorized using well-
established scale age-estimation methods (Gilbert 1913, Rich and Holmes 1929). A sub-sample
of scales were independently reviewed by John Sneva of the Washington Department of Fish and
Wildlife for corroboration of age estimates. Direct age validation (Beamish and McFarlane 1983)
was not performed, as there were no marked fish whose age was known.
The European method for fish age description (Koo 1962) is used in this report. The number of
winters a fish spent in freshwater (not including the winter of egg incubation) is described by an
Arabic numeral followed by a period. The number following the period indicates the number of
winters a fish spent in saltwater. Total age, therefore, is equal to one plus the sum of both
numerals.
Age and Length-at-Age Composition
Age composition was determined by weighing the proportion of each age class sampled by the
total counts of each species passing Bonneville dam during each Statistical Week. The length-at-
age composition for each species sampled was determined by calculating the mean length for
each age class present during each Statistical Week.
Steelhead Hatchery/Wild Determination
Most hatchery reared steelhead in the Columbia River Basin are marked by removing a fin,
typically the adipose fin. Some hatchery-origin steelhead are released unmarked and to identify
these individuals scale pattern analysis methods were developed by Oregon Department of Fish
and Wildlife (ODFW) to determine hatchery versus wild origin. Hatchery steelhead typically
experience faster freshwater growth which results in relatively wide spaces between circuli,
whereas natural origin fish typically show much slower fresh water growth narrowing the
distance between circuli. In addition, hatchery origin fish are reared to smolt in a single year
whereas the natural origin fish tend to remain in fresh water for two to three years.
Due to the wide variety of requests for hatchery and wild determinations by various agencies
using different methods, we decided in 2006 to allow the managing agencies to make their own
determinations based on the raw age, scale pattern, and fin mark data. For this report hatchery
and wild determinations are based on fin clips alone.
Steelhead A/B Run Determination
A-run steelhead occur throughout the Columbia and Snake river basins and rarely exceed the
length of 78 cm, whereas B-run steelhead are thought to be produced only in the Clearwater,
Middle Fork Salmon, and South Fork Salmon rivers and typically exceed 78cm (Busby et al.
1996). Determination of A-run or B-run was based on length measurement.

11
Steelhead Gender Determination
Methods developed by ODFW were used in gender determination. Gender was determined by
snout and/or body shape. Male steelhead tend to have a more protruding snout and may have
beak development. Female steelhead tend to have a more rounded, short snout and a wider body
near the anus indicating they contain roe.
Steelhead Kelts
Unlike other species of Pacific salmon (Oncorhynchus spp.), anadromous steelhead naturally
exhibit varying degrees of iteroparity (repeat spawning). Successful steelhead iteroparity
involves downstream migration of kelts (post-spawned steelhead) to the estuary or ocean
environments (Hatch et al. 2003). During scale pattern analysis we found a few steelhead scales
to have a iteroparous scale pattern. A kelt scale age is indicated through the use of the letter “S”
to indicate spawning. For instance, a steelhead of Age 1.2S1 would have one freshwater
annulus, two saltwater annuli, a spawning check, followed by one saltwater annulus. Note that
scale resorption often occurs in kelts which can eliminate saltwater annuli marks so a kelt is
likely older than would be indicated by summing the annuli. .
Chinook Salmon Run-Size Prediction
Salmon mature and return to spawn between two and seven years of age. Age composition, life
history and total age vary among species. For this analysis a brood year (BY) is defined as the
year in which the eggs are fertilized and a brood is defined as all the returning progeny of a given
BY. This run-size prediction model is based on the relationship between the survivors within a
single brood returning at different ages in successive years.
Fryer and Schwartzberg (1994) determined that adult returns of Columbia basin Chinook are
comprised almost entirely of 3, 4 and 5 year old fish, with the proportions of each age class being
relatively constant across years. As such, the number of three-year-old fish for a given BY is a
relatively good predictor of the number of four-year-old fish from the same BY that would return
in the subsequent year. This relationship and a regression analysis (Neter et al. 1985, Weisberg
1985) were used to predict the abundance of four-year-old fish for 2006, based on the number of
three-year-old fish estimated to have returned in 2006. A similar relationship was used to predict
abundance of five-year-old fish in 2007, from the estimated number four-year-old fish that
returned in 2006.

12
RESULTS
Sampling
Chinook salmon (spring, summer and fall) were sampled for 21 weeks (April through October)
during their migration. A total of 923 spring Chinook were sampled, 665 summer Chinook and
882 fall Chinook (Tables 1, 2 and 3 respectively). A total of 556 sockeye salmon were sampled
(Table 4) over 8 weeks (June through July), and 1459 steelhead were sampled (Tables 5 and 6)
over 28 weeks (April through October). Summer Chinook were not sampled during Statistical
Week 31 and Fall Chinook were not sampled during Statistical Weeks 31 through 35 due to river
water temperatures exceeding 21.1°C, which is approaching the lethal temperature for migrating
adult Chinook salmon (McCullough 1999).
Age Composition
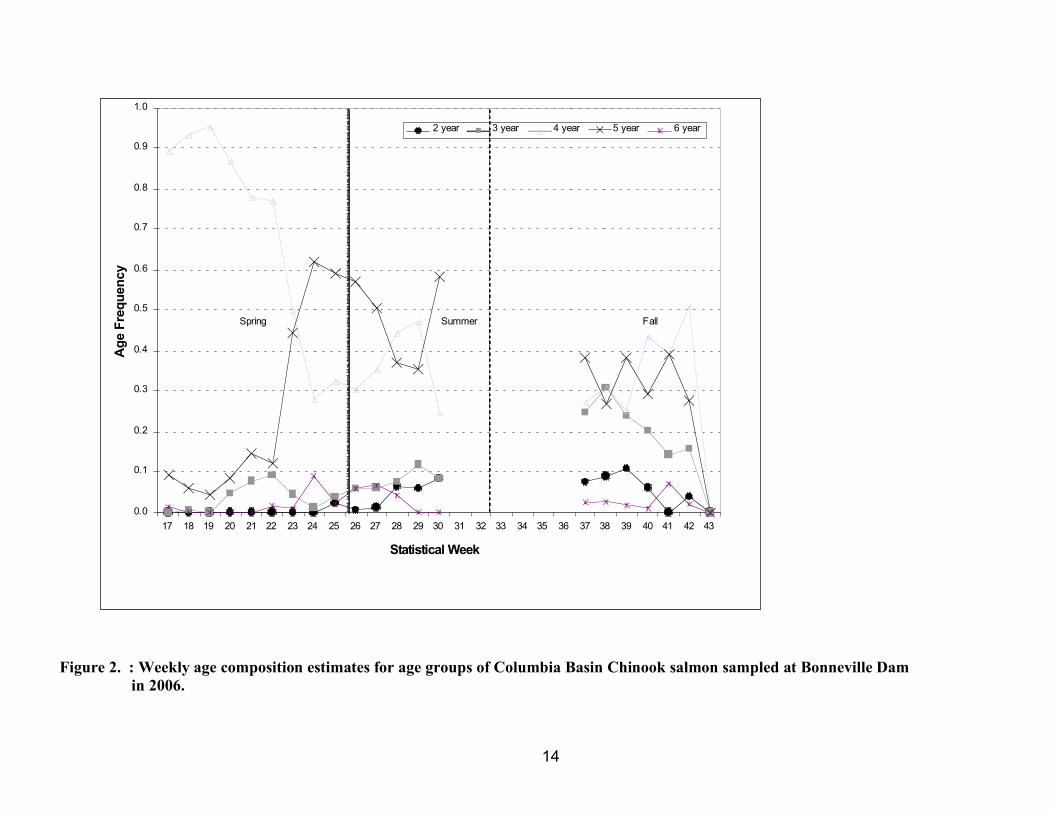
Based on scale pattern analysis four-year-olds were the most abundant age group for spring
Chinook salmon, comprising 79.8% of the spring Chinook migration (Table 1, Figure 2).
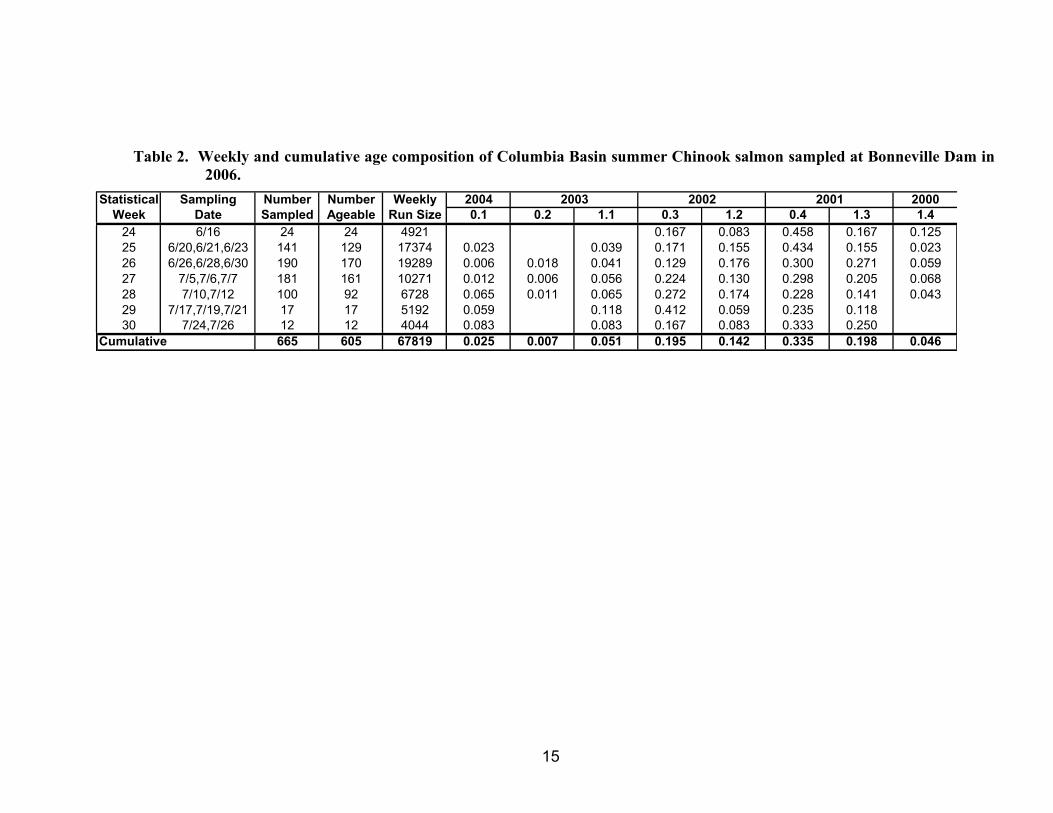
However, five-year-olds were the most abundant group for summer and fall Chinook salmon,
comprising 53.3% of the summer Chinook migration (Table 2) and 35.8% of the fall Chinook
migration (Table 3). Five-year-old fish were second most abundant for spring Chinook, while
four-year-olds were second most abundant for summer and fall Chinook. For all three races,
three-year-old fish were third most abundant.
Scale patterns indicated a steady increase in the percentage of ocean-type Chinook salmon from
0% in Statistical Week 21 to above 90% after Statistical Week 39, with a corresponding decrease
in the percentage of stream-type Chinook salmon (Figure 3).
The Sockeye salmon run also was composed primarily of four-year-olds (65.0%), with five-,
three-, and six-years-olds being less abundant (Table 4).
The steelhead age composition was composed of mostly three-year-olds (39.7%) and four-year-
olds (35.4%) which based on fin clips and a single year of freshwater residence is likely due to
the large percentage of hatchery origin fish in this run (Table 5, Table 6). Five-year-olds were
the next most abundant at 19.1%.

13
Statistical Sampling Number Number Weekly 2000
Week Date Sampled Ageable Run Size 0.2 1.1 0.3 1.2 0.4 1.3 1.4
17a
4/14,21,24,26,28 69 66 4455 0.894 0.091 0.015
18 5/1,5/3,5/5 200 177 23639 0.006 0.006 0.927 0.062
19 5/8,5/10 160 132 40422 0.955 0.045
20 5/16,5/17,5/19 150 129 17838 0.047 0.868 0.085
21 5/22,5/24,5/26 100 90 8293 0.078 0.778 0.144
22b
5/31,6/2 74 65 4670 0.092 0.769 0.046 0.077 0.015
23 6/5,6/7,6/9 100 90 13477 0.011 0.033 0.044 0.456 0.278 0.167 0.011
24c
6/12,6/14 70 65 13364 0.015 0.062 0.231 0.385 0.231 0.077
Through June 15 923 814 126158 0.001 0.021 0.012 0.786 0.072 0.096 0.010
Through May 31d
718 622 97687 0.000 0.020 0.001 0.908 0.001 0.068 0.002
2002 20012003
Notes:
a The official spring Chinook salmon run begins on March 15 (Week 12). Sampling began in Week 16 but only five fish were sampled and were
combined with Week 17. The weekly run size includes Chinook salmon passing Bonneville Dam in Weeks 12-17.
b. For the May 31 estimates, the spring Chinook run size for Week 22 includes fish passing Bonneville Dam for during the early part of Week 23 (May 27-
31)
c. The weekly run size only includes those fish passing through June 15.
d. May 31 estimates are presented for a better comparison to previous years when the spring Chinook run at Bonneville Dam ended on May 31.
Table 1. Weekly and cumulative age composition of Columbia Basin spring Chinook at Bonneville Dam in 2006.
14
0.0
0.1
0.2
0.3
0.4
0.5
0.6
0.7
0.8
0.9
1.0
17 18 19 20 21 22 23 24 25 26 27 28 29 30 31 32 33 34 35 36 37 38 39 40 41 42 43
Statistical Week
Ag
e F
req
uen
cy
2 year 3 year 4 year 5 year 6 year
Spring Summer Fall
Figure 2. : Weekly age composition estimates for age groups of Columbia Basin Chinook salmon sampled at Bonneville Dam
in 2006.
15
Statistical Sampling Number Number Weekly 2004 2000
Week Date Sampled Ageable Run Size 0.1 0.2 1.1 0.3 1.2 0.4 1.3 1.4
24 6/16 24 24 4921 0.167 0.083 0.458 0.167 0.125
25 6/20,6/21,6/23 141 129 17374 0.023 0.039 0.171 0.155 0.434 0.155 0.023
26 6/26,6/28,6/30 190 170 19289 0.006 0.018 0.041 0.129 0.176 0.300 0.271 0.059
27 7/5,7/6,7/7 181 161 10271 0.012 0.006 0.056 0.224 0.130 0.298 0.205 0.068
28 7/10,7/12 100 92 6728 0.065 0.011 0.065 0.272 0.174 0.228 0.141 0.043
29 7/17,7/19,7/21 17 17 5192 0.059 0.118 0.412 0.059 0.235 0.118
30 7/24,7/26 12 12 4044 0.083 0.083 0.167 0.083 0.333 0.250
Cumulative 665 605 67819 0.025 0.007 0.051 0.195 0.142 0.335 0.198 0.046
20022003 2001
Table 2. Weekly and cumulative age composition of Columbia Basin summer Chinook salmon sampled at Bonneville Dam in
2006.

16
0.0
0.1
0.2
0.3
0.4
0.5
0.6
0.7
0.8
0.9
1.0
17 18 19 20 21 22 23 24 25 26 27 28 29 30 31 32 33 34 35 36 37 38 39 40 41 42 43
Statistical Week
Ag
e F
req
uen
cy
0.X (Ocean) 1.X (Stream)
Spring Summer Fall
Figure 3. Weekly freshwater age composition estimates of Columbia Basin Chinook salmon sampled at Bonneville Dam in
2006.

17
Statistical Sampling Number Number Weekly 2004
Week Date Sampled Ageable Run Size 0.1 0.2 1.1 0.3 1.2 0.4 1.3 1.4 0.5
36a
9/5,9/6,9/8 180 174 141610 0.075 0.103 0.063 0.305 0.034 0.356 0.029 0.011 0.023
37 9/11,9/13,9/15 180 170 36955 0.076 0.188 0.059 0.247 0.024 0.335 0.047 0.012 0.012
38 9/18,9/20,9/22 157 146 52238 0.089 0.247 0.062 0.281 0.027 0.240 0.027 0.014 0.014
39 9/25,9/27,9/29 177 167 28909 0.108 0.204 0.036 0.240 0.012 0.371 0.012 0.006 0.012
40 10/2,10/4,10/6 105 99 13339 0.061 0.202 0.404 0.030 0.293 0.010
41 10/10,10/12 30 28 5898 0.143 0.393 0.393 0.071
42b
10/17,10/19 53 51 6127 0.039 0.137 0.020 0.510 0.275 0.020
Cumulative 882 835 285076 0.078 0.157 0.054 0.297 0.028 0.330 0.027 0.011 0.019
20002003 2002 2001
Notes:
a The fall Chinook run began on Week 31, however high temperatures prevented sampling prior to Week 36. The weekly run size for Week 36 includes
58,232 Chinook which passed during Weeks 30-35.
b. The weekly run size includes Chinook salmon passing from Weeks 43 through 47.
Table 3. Weekly and cumulative age composition of Columbia Basin bright fall Chinook salmon sampled at Bonneville Dam
in 2006.

18
Length-at-Age Composition
Length-at-age composition estimates for all Chinook salmon are presented in Figure 4 and
Appendix A.
Steelhead Hatchery/Wild Determination
When classifying hatchery and wild steelhead based on fin marks, the run consisted of 70.0%
hatchery and 30.0% wild steelhead (Table 6).
Steelhead A/B Determination
Assuming that A-run (less than 78 cm) and B-run (greater than 78 cm) steelhead can be
differentiated by length alone, the majority of the steelhead run (71.0%) passing Bonneville Dam
were A-run, and the remaining 29.0% were B-run. Though A-run steelhead dominate the run, the
percentage of B-run fish does generally increase as the run progresses (Table 6).
Steelhead Gender Determination
The 2006 steelhead consisted of 52.0% females and 48.0% males (Table 6).

19
Statistical Sampling Number Number Weekly 2003
Week Date Sampled Ageable Run Size 1.1 1.2 2.1 1.3 2.2 3.1 2.3 3.2 4.1
23 6/2,5,7,9 11 11 991 0.727 0.273
24 6/12,6/14,6/16 81 74 5552 0.595 0.054 0.189 0.162
25 6/20,6/21,6/23 95 92 9433 0.609 0.185 0.174 0.022 0.011
26 6/26,6/28,6/30 169 165 12467 0.679 0.018 0.176 0.109 0.018
27 7/5,7/6,7/7 138 127 5787 0.024 0.614 0.024 0.228 0.102 0.008
28 7/10,12,17,19,21 62 58 2836 0.034 0.552 0.034 0.155 0.207 0.017
556 527 37066 0.006 0.630 0.021 0.182 0.144 0.014 0.003 0.000 0.000
Comments: Weekly Run Size for Week 22 includes fish numbers from Weeks 21-22. Sampling began in Week 22.
Sockeye sampling ended July 26th due to high temperatures.
Weekly Run Size for Week 28 includes fish numbers from all Weeks subsequent to Week 29.
Cumulative
Age Composition by Brood Year and Age Class
2002 2001 2000
a Weekly run size includes sockeye passing Bonneville Dam between Weeks 20 and 22. Sampling began in Week 22 but only one fish was sampled, thus
it was combined with Week 23.
b. Weekly run size includes sockeye salmon passing Bonneville Dam between Weeks 29 and 43. Sampling ended in Week 30.
Table 4. Weekly and cumulative age composition of Columbia Basin sockeye salmon sampled at Bonneville Dam in 2006.

20
Table 5. Weekly and cumulative age composition of Columbia Basin steelhead sampled at Bonneville Dam in 2006.
Statistical Sampling Number Number Weekly 2003 Repeat
Week Date Sampled Ageable Run Size 1.1 1.2 2.1 1.3 2.2 3.1 1.4 2.3 3.2 4.1 3.3 4.2 Spawner
16 4/21 5 4 932 0.250 0.750
17 4/24,4/26,4/28 12 10 205 0.100 0.500 0.100 0.300
18 5/1,5/3,5/5 5 4 212 0.750 0.250
19 5/8,5/10 6 3 304 0.667 0.333
20 5/16,5/17,5/19 10 8 405 0.250 0.625 0.125
21 5/22,5/24,5/26 14 10 408 0.100 0.500 0.100 0.300
22 5/31,6/2 10 6 486 0.500 0.167 0.167 0.167
23 6/5,6/7,6/9 19 15 977 0.400 0.533 0.067
24 6/12,6/14,6/16 9 6 1333 0.500 0.333 0.167
25 6/20,6/21,6/23 17 12 1586 0.583 0.250 0.167
26 6/26,6/28,6/30 83 67 3610 0.433 0.299 0.060 0.015 0.119 0.075
27 7/5,7/6,7/7 77 67 5177 0.433 0.313 0.075 0.134 0.015 0.030
28 7/10,7/12 130 105 9353 0.390 0.248 0.133 0.143 0.038 0.048
29 7/17,7/19,7/21 18 15 12839 0.267 0.067 0.267 0.067 0.200 0.067 0.067
30 7/24,7/26 39 27 15216 0.370 0.185 0.296 0.148
31 7/31,8/1,8/2,8/3 73 56 23899 0.339 0.304 0.089 0.179 0.036 0.054
32 8/7,8/9,8/10 26 20 38982 0.450 0.250 0.050 0.150 0.100
33 8/14,8/15,8/16,8/17 58 52 35838 0.442 0.346 0.019 0.019 0.115 0.038 0.019
34 8/21,8/22,8/23,8/24 15 12 30082 0.750 0.083 0.083 0.083
35 8/28,8/29,8/30,8/31 29 26 34175 0.423 0.423 0.038 0.077 0.038
36 9/4,9/5,9/6,9/8 195 160 36676 0.388 0.394 0.013 0.119 0.019 0.013 0.019 0.038
37 9/11,9/13,9/15 170 136 25160 0.199 0.404 0.022 0.272 0.059 0.007 0.022 0.007 0.007
38 9/18,9/20,9/22 129 110 22977 0.282 0.400 0.273 0.009 0.018 0.009 0.009
39 9/25,9/27,9/29 154 135 10621 0.200 0.341 0.022 0.356 0.030 0.015 0.007 0.015 0.007 0.007
40 10/2,10/4,10/6 82 65 5772 0.154 0.523 0.062 0.169 0.015 0.015 0.015 0.031 0.015
41 10/10,10/12 40 33 2456 0.333 0.455 0.061 0.091 0.030 0.030
42 10/17,10/19 30 25 2105 0.360 0.400 0.040 0.040 0.080 0.080
43 10/24 4 4 1204 0.500 0.250 0.250
Cumulative 1459 1193 322990 0.397 0.312 0.042 0.076 0.101 0.014 0.000 0.003 0.039 0.002 0.004 0.001 0.009
2002 2001 2000 1999
a. Sampling was limited to 4 hours per day (6am – 10 am) from week 29 through week 36 due to high water temperatures.

21
Statistical Sampling
Week Date A run B run A run B run Female Male Adipose Other
16 4/21 1.00 0.00 0.20 0.00 0.40 0.60 0.40 0.40
17 4/24,4/26,4/28 1.00 0.00 0.42 0.00 0.75 0.25 0.42 0.17
18 5/1,5/3,5/5 1.00 0.00 0.40 0.00 0.60 0.40 0.40 0.20
19 5/8,5/10 1.00 0.00 0.17 0.00 0.17 0.83 0.67 0.17
20 5/16,5/17,5/19 0.80 0.20 0.20 0.00 0.50 0.50 0.80 0.00
21 5/22,5/24,5/26 1.00 0.00 0.21 0.00 0.50 0.50 0.79 0.00
22 5/31,6/2 0.80 0.20 0.30 0.00 0.60 0.40 0.70 0.00
23 6/5,6/7,6/9 0.89 0.11 0.37 0.00 0.47 0.53 0.53 0.11
24 6/12,6/14,6/16 1.00 0.00 0.22 0.00 0.56 0.44 0.78 0.00
25 6/20,6/21,6/23 0.94 0.06 0.29 0.00 0.53 0.47 0.59 0.12
26 6/26,6/28,6/30 0.97 0.03 0.31 0.00 0.75 0.25 0.54 0.10
27 7/5,7/6,7/7 0.98 0.02 0.39 0.00 0.56 0.44 0.60 0.06
28 7/10,7/12 0.98 0.02 0.45 0.02 0.65 0.35 0.48 0.05
29 7/17,7/19,7/21 1.00 0.00 0.72 0.00 0.78 0.22 0.17 0.11
30 7/24,7/26 1.00 0.00 0.51 0.00 0.44 0.56 0.44 0.05
31 7/31,8/1,8/2,8/3 0.99 0.01 0.45 0.01 0.69 0.31 0.48 0.05
32 8/7,8/9,8/10 0.96 0.04 0.38 0.04 0.54 0.46 0.54 0.04
33 8/14,8/15,8/16,8/17 0.93 0.07 0.21 0.05 0.47 0.53 0.64 0.10
34 8/21,8/22,8/23,8/24 1.00 0.00 0.20 0.00 0.50 0.50 0.80 0.00
35 8/28,8/29,8/30,8/31 0.83 0.17 0.21 0.00 0.38 0.62 0.69 0.10
36 9/4,9/5,9/6,9/8 0.62 0.38 0.11 0.09 0.50 0.50 0.72 0.08
37 9/11,9/13,9/15 0.46 0.54 0.09 0.12 0.42 0.58 0.74 0.05
38 9/18,9/20,9/22 0.47 0.53 0.08 0.06 0.50 0.50 0.80 0.06
39 9/25,9/27,9/29 0.42 0.58 0.11 0.12 0.45 0.55 0.71 0.06
40 10/2,10/4,10/6 0.40 0.60 0.17 0.11 0.40 0.60 0.59 0.13
41 10/10,10/12 0.65 0.35 0.08 0.08 0.50 0.50 0.65 0.20
42 10/17,10/19 0.77 0.23 0.10 0.07 0.53 0.47 0.73 0.10
43 10/24 0.50 0.50 0.25 0.25 0.25 0.75 0.50 0.00
Cumulative 0.71 0.29 0.23 0.06 0.52 0.48 0.63 0.07
Fin ClipsTotal Run Unmarked
Proportion
Table 6. Weekly and cumulative proportions of fin mark, gender, and A (less than 78cm) and B (greater or equal to 78cm)
run composition of Columbia Basin steelhead sampled at Bonneville Dam in 2006.

22
35
45
55
65
75
85
95
105
17 18 19 20 21 22 23 24 25 26 27 28 29 30 31 32 33 34 35 36 37 38 39 40 41 42 43
Statistical Week
Mean
Len
gth
(cm
)
Age 0.1 Age 0.2 Age 0.3 Age 0.4 Age 1.1 Age 1.2 Age 1.3
Spring Summer Fall
Figure 4. Weekly mean length estimates of common Columbia Basin Chinook salmon age classes (showing ocean- and stream-
type) sampled at Bonneville Dam in 2006. Sampling did not occur during Weeks 31 through 35.

23
Fish Coloration and Condition
Bright coloration was observed in the majority of each species, 97.6% of spring Chinook, 95.5%
of summer Chinook, 79.4% of fall Chinook, 100.0% of sockeye and 88.4% of steelhead. The
highest condition rating of 5 was given to 85.6% of spring Chinook, 88.2% of summer Chinook,
79.4% of fall Chinook, 96.6% of sockeye and 83.4% of steelhead (Table 7). Additional fish
condition data can be found in Appendix A.
Table 7. Composition (%) of observed coloration and condition of Columbia Basin salmon
and steelhead at Bonneville Dam in 2006.
Species Spring Summer Fall Sockeye Steelhead
Color
Bright 97.6 95.5 79.4 100.0 88.4
Intermediate 2.4 4.2 15.5 0.0 11.2
Dark 0.0 0.3 5.1 0.0 0.4
Condition
5 85.9 88.3 79.4 96.6 83.4
4 7.5 8.6 13.2 2.3 11.5
3 6.3 3.2 7.1 1.1 4.3
2 0.3 0.0 0.3 0.0 0.8
1 0.0 0.0 0.0 0.0 0.0
Chinook Salmon Run-Size Prediction for 2007
Using a linear relationship between the 2006 three- and four-year-old adult returns (Figure 5),
the estimated number of four-year-old spring Chinook salmon returning to Bonneville Dam in
2007 is 55,400 (+ 62,100, 90% prediction interval [PI]). Using the relationship between four-
and five-year-olds to construct the model (Figure 6), albeit poorer than that existing between
three-year-olds and four-year-olds, we predict that the 2006 five-year-old adult abundance at
Bonneville Dam will be 13,700 (+ 49,800, 90% PI).
For the 2006 summer Chinook salmon run at Bonneville Dam, the relationship between three-
and four-year-olds (Figure 7) results in a prediction of 13,600 (+ 24,000, 90% PI) four-year-olds.
The relationship between four- and five-year-olds (Figure 8), the model predicts a return of
21,700 (+ 9,200, 90% PI) five-year-olds.
Based on the relationship between three- and four-year-olds (Figure 9), the model results in a
prediction of 116,200 (+ 124,700, 90% PI) four-year-old Upriver Bright fall Chinook salmon
returns for 2006. Using the relationship between four- and five-year-olds (Figure 10), the model
results in a prediction of 50,700 (+ 44,200, 90% PI) returning five-year-olds.

24
Based on the 2005 report (Whiteaker et al. 2006), we made run size predictions for four- and
five-year-old spring, summer, and bright fall Chinook salmon returning to Bonneville Dam in
2006 using the methods discussed in this report. For the two principle age groups (four-year-old
and five-year-old), we predicted 99,600 spring, 44,200 summer, and 186,400 bright fall Chinook
versus DART (2006) and the Fish Passage Center (2006) estimated returns of 122,000 spring,
59,100 summer and 194,200 bright fall Chinook salmon. All six age groups predicted for 2006
were within the 90% prediction interval (Table 8). Overall, we predict the 2006 return of four-
and five-year old spring, summer, and fall Chinook salmon will all be less than the 2006 return
(Table 8).

25
20022001
1999
1990
1994
1991
1989
1992
1995
1987
1984
1993
1985
19881986
1996
1997
1998
2000
y = 11.879x + 9229.2
R2 = 0.8642
0
50000
100000
150000
200000
250000
300000
350000
400000
450000
0 5000 10000 15000 20000 25000 30000 35000
Three-Year-Old Fish
Fo
ur-Y
ear-O
ld F
ish
Predicted 2007 return:
55,400 ( + 75,100) four-year-old fish
from brood year 2003
Figure 5. Predicted 2007 four-year-old Columbia Basin spring Chinook salmon abundance (at Bonneville Dam) based on a
linear relationship between four-year-old and three-year-old fish abundance during brood years 1984 through 2002.
Prediction intervals (90%) are also graphed.

26
2001
20001999
1998
19891992
1993
1994
1983
1986
1988
1991
1984 1985
1992
1995
1987
1996 1997
y = 0.1678x + 9907.8
R2 = 0.2986
0
20000
40000
60000
80000
100000
120000
140000
0 50000 100000 150000 200000 250000 300000 350000 400000
Four-Year-Old Fish
Fiv
e-Y
ear-
Old
Fis
h
Predicted 2007 return:
13,700 ( + 49,800) five-year-old fish
from brood year 2002
Figure 6. Predicted 2007 five-year-old Columbia Basin spring Chinook salmon abundance (at Bonneville Dam) based on a
linear relationship between five-year-old and four-year-old fish abundance during brood years 1983 through 2001.
Prediction intervals (90%) are also graphed.

27
2002
20012000
1999
1998
19941987
1991
19901992
19891995
1988
1993
1996
1997
y = 3.1549x + 400
R2 = 0.6876
0
10000
20000
30000
40000
50000
60000
70000
80000
90000
0 2000 4000 6000 8000 10000 12000 14000 16000 18000 20000
Three-Year-Old Fish
Fo
ur-Y
ear-O
ld F
ish
Predicted 2007 return:
13,600 ( + 24,000) four-year-old fish
from brood year 2004
Figure 7. Predicted 2007 four-year-old Columbia Basin summer Chinook salmon abundance (at Bonneville Dam) based on a
linear relationship between four-year-old and three-year-old fish abundance during brood years 1987 through 2002.
Prediction intervals (90%) are also graphed.
28
2001
1997
1986
19891988
19921987
1991
1990
19941995
1996
1993
1998
1999
2000
y = 0.9557x + 302.81
R2 = 0.9596
-10000
0
10000
20000
30000
40000
50000
60000
70000
80000
90000
0 10000 20000 30000 40000 50000 60000 70000 80000
Four-Year-Old Fish
Fiv
e-Y
ear-
Old
Fis
h
Predicted 2007 return:
21,700 ( + 9,200) five-year-old fish
from brood year 2002
Figure 8. Predicted 2007 five-year-old Columbia Basin summer Chinook salmon abundance (at Bonneville Dam) based on a
linear relationship between five-year-old and four-year-old fish abundance during brood years 1986 through 2001.
Prediction intervals (90%) are also graphed.
29
2001
2002
1999
1998
1994
1996
19971995
2000
2002
y = 1.2238x + 48246
R2 = 0.5806
40000
90000
140000
190000
240000
290000
340000
390000
20000 40000 60000 80000 100000 120000 140000 160000 180000
Three-Year-Old Fish
Fo
ur-
Year-
Old
Fis
h
Predicted 2007 return:
116,200 ( + 124,700) four-year-old fish
from brood year 2003
Figure 9. Predicted 2007 four-year-old Columbia Basin fall Chinook salmon abundance (at Bonneville Dam) based on a linear
relationship between four-year-old and three-year-old fish abundance during brood years 1986 through 2002.
Prediction intervals (90%) are also graphed.

30
20002001
1997
1994
1996
1993
1995
1998
1999
y = 0.6273x - 6936.3
R2 = 0.8178
0
50000
100000
150000
200000
250000
0 50000 100000 150000 200000 250000 300000 350000
Four-Year-Old Fish
Fiv
e-Y
ear-
Old
Fis
h
Predicted 2007 return:
50,700 ( + 44,200) five-year-old fish
from brood year 2002
Figure 10. Predicted 2007 five-year-old Columbia Basin bright fall Chinook salmon abundance (at
Bonneville Dam) based on a linear relationship between five-year-old and four-year-old fish
abundance during brood years 1993 through 2001. Prediction intervals (90%) are also graphed.

31
Species and age class
Predicted in 2005
report for 2006 (±90%)
2006
Estimate
2007 Prediction
(±90%)
Spring Chinook 4-year-olds 75,700 (±63,100) 100,800 55,400 (±62,100)
Spring Chinook 5-year-olds 23,900 (±42,700) 21,200 13,700 (±49,800)
Summer Chinook 4-year-olds 13,200 (±32,600) 22,900 13,600 (±24,000)
Summer Chinook 5-year-olds 31,000 (±8,500) 36,200 21,700 (±9,200)
Bright Fall Chinook 4-year-olds 80,700 (±126,400) 92,600 116,200 (±124,700)
Bright Fall Chinook 5-year-olds 105,700 (±48,500) 101,600 50,700 (±44,200)
Table 8. Predicted and estimated abundance of Chinook salmon returning to Bonneville Dam.

32
DISCUSSION
River Water Temperature
High river water temperature has constrained our sampling efforts during most summer sampling
seasons. Our ESA section 10 permit allows sampling of Chinook salmon at temperatures up to
21.1oC. The ACOE also has modified sampling protocols for temperatures between 21.1 and
23.3oC with no sampling allowed at temperatures above 23.3
oC. Therefore, during the 2006
sampling season, fall Chinook were not sampled during Statistical Weeks 31 through 35. Unlike
past years, we were not required to stop steelhead sampling due to high temperatures but we did
follow the ACOE sampling restriction for temperatures over 21.1 C in 2006. McCullough
(1999) asserts that temperatures exceeding 21oC may delay the migration of Chinook salmon and
Figure (11) appears to support that notion. Temperatures in this range do not appear to be as
restrictive to the steelhead migration.
Genetic Sampling
In 2006, tissue samples (for DNA analysis) were collected from the majority of Chinook and
steelhead that were sampled at the Adult Fish Facility at Bonneville Dam. This was the fourth
full year for Chinook genetic collection and the third year that we collected samples from
steelhead. In previous years steelhead genetic samples were collected by ODFW and WDFW.
Significant progress has been made through the coast wide Chinook genetic database to assemble
baseline genetic stock identification information for all Columbia River Chinook populations.
The development of baseline genetic stock information for steelhead is still in its infancy. Once
this baseline stock information is readily available, mixed stock sampling at Bonneville Dam will
be a valuable tool for fisheries and ESA management within the Columbia River Basin.
Project Continuation
It is expected that this stock assessment study will continue to develop an accurate age
composition and length-at-age database for Columbia Basin upriver salmon populations, and
work towards improving the forecasting of terminal runs, which is important for the calibration
of the PSC Chinook Technical Committee’s Chinook model. These data will also aid fisheries
managers in formulating spawner-return relationships and analyzing productivity. Continued
data collection on age composition and length-at-age will allow managers to more accurately
monitor the effects of ocean harvest restrictions agreed upon by the Pacific Salmon Treaty. The
addition of steelhead to our normal sampling regime provides valuable information for NOAA-
Fisheries and TAC for use in steelhead assessments, fisheries forecasting and harvest
management. This study will work to improve accurate age determination, hatchery fraction,
and stock identification and assessment.

33
0
2000
4000
6000
8000
10000
12000
14000
16000
1/30 3/20 5/9 6/28 8/17 10/6 11/25
Date
Da
ily
Ru
n S
ize
0
5
10
15
20
25
Te
mp
C
Chinook Steelhead Temperature
Figure 11. Chinook and steelhead daily run size and daily river temperature at Bonneville Dam from January 30 through
December 31, 2006.
34
REFERENCES
Beamish, R.J., and G.A. McFarlane. 1983. The forgotten requirement for age validation in
fisheries biology. Transactions of the American Fisheries Society 112:735-743.
Busby, P. J., T. C. Wainwright, G. J. Bryant, L. J. Lierheimer, R. S. Waples, F. W. Waknitz, and
I. V. Lagomarsino. 1996. Status review of west coast steelhead from Washington, Idaho,
Oregon, and California. U.S. Dep. Commer., NOAA Tech. Memo. NMFS- NWFSC-27,
261 p. Online at: http://www.nwfsc.noaa.gov/publications/techmemos/tm27/tm27.htm.
Last accessed on 15 March 2004.
Clutter, R.I., and L.E. Whitesel. 1956. Collection and interpretation of sockeye salmon scales.
International Pacific Salmon Fisheries Commission Bulletin 9.
DART (Columbia River Data Access in Real Time). 2005. Online at:
http://www.cbr.washington.edu/dart/dart.html. Last accessed on 29 January 2005.
Elston, R. 1996. Investigation of headburns in adult salmonids. Final Report 1996. DOE/BP-96-
050-00. Bonneville Power Administration, Portland, Oregon.
Fish Passage Center. 2005. Brights vs. Tule fall Chinook at Bonneville Dam
2004. Online at: http://www.fpc.org/adult_history/bon_tule_brights2004.htm.
Last accessed on January 29 2005.
Fryer, J.K. 1995. Columbia Basin sockeye salmon: Causes of their past decline, factors
contributing to their present low abundance, and the future outlook. Ph.D. Thesis.
University of Washington, Seattle.
Fryer, J.K., and M. Schwartzberg. 1994. Age and length composition of Columbia Basin
spring and summer chinook salmon at Bonneville Dam in 1993. Columbia River Inter-
Tribal Fish Commission Technical Report 94-1. Portland, Oregon.
Gilbert, C.H. 1912. Age at maturity of the Pacific coast salmon of the genus Oncorhynchus.
Bulletin of the Bureau of Fisheries 32:1-22.
Groberg, W. 1996. Investigation of headburns in adult salmonids. Phase I: Examinations at
Lookingglass Hatchery in 1996. Addendum to final report 1995. DOE/BP-96-050-00.
Bonneville Power Administration, Portland Oregon.
Hatch, Douglas R., Ryan Branstetter, Joe Blodgett, Bill Bosch, David Fast, and Todd Newsome.
2003. Kelt Reconditioning: A Research Project to Enhance Iteroparity in Columbia Basin
Steelhead (Oncorhynchus mykiss) - 2003 Annual Report. Columbia River Inter-Tribal
Fish Commission Technical Report 2000-017-00. Portland, Oregon.
International North Pacific Fisheries Commission. 1963. Annual report – 1961. Vancouver,
Canada.

35
Knudsen, C.M. 1990. Bias and variation in stock composition estimates due to scale
regeneration. Pages 63-70 in N.C. Parker, A.E. Giorgi, R.C. Heidinger, D.B. Jester, Jr.,
E.D. Prince, and G.A. Winans (editors). Fish-Marking Techniques. American Fisheries
Society Symposium 7. Bethesda, Maryland.
Koo, T.S.Y. 1962. Age designation in salmon. Pages 37-48 in T.S.Y. Koo (editor). Studies of
Alaska Red Salmon. University of Washington Press, Seattle, Washington.
McCullough, D.A. 1999 A Review and Synthesis of Effects of Alterations to the Water
Temperature Regime on Freshwater Life Stages of Salmonids, with Special Reference to
Chinook Salmon. Environmental Protection Agency Report 910-R-99-010.
Nielsen L.A. and D.L. Johnson, editors. 1983. Fisheries Techniques. American Fisheries Society
USA.
Neter, J., W. Wasserman, and M.H. Kutner. 1985. Applied linear statistical models: regression,
analysis of variance, and experimental designs. Irwin, Homewood, Illinois.
PST (Pacific Salmon Treaty). 1985. Treaty between the United States of America and the
government of Canada concerning Pacific salmon. Treaty Document Number 99-2.
Rich, W.H., and H.B. Holmes. 1928. Experiments in marking young chinook salmon on the
Columbia River, 1916 to 1927. Bulletin of the Bureau of Fisheries 44:215-64.
Thompson, Steven K. 1987. Sample size for estimating multinomial proportions. The American
Statistician. 41:42-46.
Weisberg, S. 1985. Applied linear regression. John Wiley and Sons, New York, New York.
Whiteaker, J., J. K. Fryer, and J. Doyle. 2006. Age and Length Composition of Columbia Basin
Chinoook, sockeye, and coho salmon at Bonneville Dam in 2005. Columbia River Inter-
Tribal Fish Commission Technical Report 06-02. Portland, Oregon.

36
APPENDIX A
LIST OF TABLES
A1. Percent of sampled Chinook, sockeye and steelhead at Bonneville Dam
having clips by Statistical Week and total sampled in 2005................................37
A2. Composition (%) of observed injuries of Columbia Basin Chinook salmon
sampled at Bonneville Dam in 2005...................................................................38
A3. Composition (%) of observed injuries of Columbia Basin sockeye and
steelhead sampled at Bonneville Dam in 2005.................................................. ..39
A4. Length-at-age estimates for Columbia Basin spring Chinook salmon
sampled at Bonneville Dam in 2005...................................................................40
A5. Length-at-age estimates for Columbia Basin summer Chinook salmon
sampled at Bonneville Dam in 2005...................................................................41
A6. Length-at-age estimates for Columbia Basin bright fall Chinook salmon
sampled at Bonneville Dam in 2005...................................................................42
A7. Length-at-age estimates for Columbia Basin sockeye salmon sampled at
Bonneville Dam in 2005 ....................................................................................43
A8. Length-at-age estimates for Columbia Basin steelhead sampled at
Bonneville Dam in 2005 ....................................................................................44

37
Table A1: Percent of sampled Chinook, sockeye and steelhead at Bonneville
Dam having identifying clips by Statistical Week and total sampled in 2006.
Statistical Week
Spring Chinook
Summer Chinook
Fall Chinook
Sockeye Steelhead
11 X X
12 X X
13 X X
14 X X
15 X X
16 X 80.0
17 77.0 58.3
18 67.5 60.0
19 73.8 83.3
20 66.0 80.0
21 67.0 X 78.6
22 54.1 X 70.0
23 36.0 X 63.2
24 32.9 29.2 6.8 77.8
25 27.0 4.3 70.6
26 40.5 3.6 63.9
27 34.8 0.8 66.2
28 34.0 1.7 53.8
29 29.4 X 27.8
30 X X 48.7
31 X X 53.4
32 X X X 57.7
33 X X 74.1
34 X X 80.0
35 X X 79.3
36 7.2 X 80.0
37 8.9 X 78.8
38 2.5 86.0
39 3.4 77.3
40 0 72.0
41 3.3 85.0
42 1.9 83.3
43 X X
44 X X
45 X X
46 X X
47 X
48 X
Total 62.1 34.4 5.8 3.6 77.5
X Represents a week that a species was present, but sampling did not occur or sample sizes were small enough that data was pooled with the
previous or subsequent week. Therefore, the percent in a Statistical Week before or after an X is assumed to represent the weeks during which
sampling did not occur. For example, spring Chinook were first sampled in Week 15 and this week is assumed to represent Weeks 12 through
14 as well.

38
Table A2: Composition (%) of observed injuries of Columbia
Basin Chinook and sockeye salmon and steelhead sampled at Bonneville Dam in 2006.
Injury Category Spring Summer Fall Sockeye Steelhead
Marine Mammal
Bite 0.8% 0.0% 0.5% 0.0% 0.3%
Golden Arches 17.8% 2.0% 1.5% 0.5% 3.8%
Scrape 8.9% 5.4% 4.2% 2.3% 10.1%
Totala
26.1% 6.9% 5.3% 2.9% 13.2%
Descaling
<3%b
Left side 3.4% 5.3% 4.6% 22.6% 7.4%
Right side 3.3% 3.3% 3.0% 20.6% 5.6%
Total 2.9% 5.7% 4.8% 21.2% 8.0%
3-19%
Left side 13.9% 18.9% 10.1% 28.5% 15.1%
Right side 15.2% 19.4% 10.4% 31.1% 13.8%
Totalc
0.9% 28.3% 14.4% 41.5% 19.8%
>20%
Left side 1.2% 1.8% 1.1% 2.7% 1.6%
Right side 0.9% 2.0% 2.4% 3.2% 1.9%
Totalc
1.8% 3.2% 2.7% 4.7% 2.5%
Other Injuries
Bruise 1.2% 2.3% 1.7% 1.7% 0.5%
Cut 0.4% 0.5% 0.0% 0.0% 1.9%
Head Injury 12.4% 11.7% 14.5% 1.6% 0.0%
Head Burn 0.3% 0.2% 0.0% 0.0% 0.0%
Fin 14.1% 13.5% 16.4% 1.3% 0.0%
Fungus 2.4% 2.0% 2.0% 2.0% 0.4%
Gash 2.8% 1.1% 3.7% 3.7% 3.6%
Gas Bubble Trauma 0.0% 0.0% 0.0% 0.0% 0.0%
Gill Net 1.4% 1.7% 1.7% 0.5% 3.8%
Fish Hook 0.6% 1.4% 0.9% 0.9% 0.3%
Lamprey 0.4% 0.5% 0.0% 0.0% 0.1%
Parasite 2.8% 3.6% 3.3% 0.0% 1.0%
Totala
31.6% 29.9% 33.8% 6.3% 26.5% a Totals do not represent the sum of subcategories, they are the number of fish with at least one injury. Fish can display more
than one type of marine mammal or general injury. Occasionally injuries are recorded but not described.
b Data not collected in 2005.
c This total represents the percentage of fish with descaling on either side. Fish are recorded in the category of maximum
descaling. For example, a fish 3-19% descaled on one side, and !20% descaled on the other, would be recorded as !20%
descaled.
39
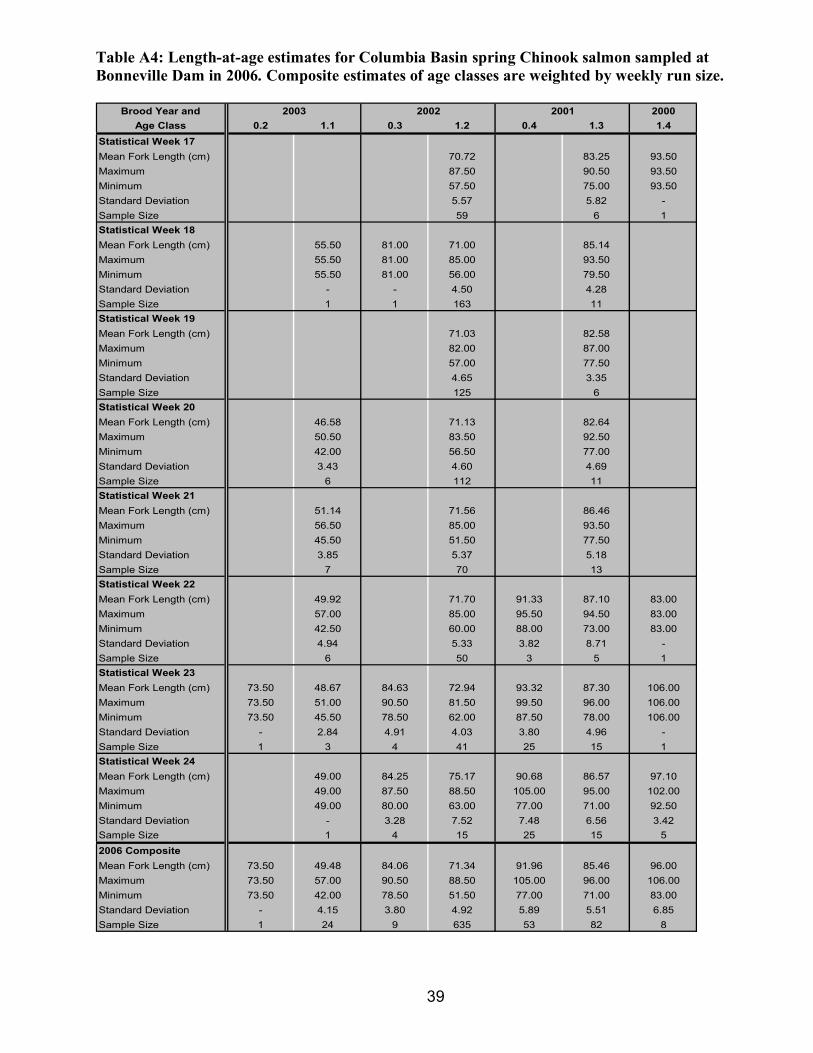
Table A4: Length-at-age estimates for Columbia Basin spring Chinook salmon sampled at
Bonneville Dam in 2006. Composite estimates of age classes are weighted by weekly run size.
Brood Year and 2000
Age Class 0.2 1.1 0.3 1.2 0.4 1.3 1.4
Statistical Week 17
Mean Fork Length (cm) 70.72 83.25 93.50
Maximum 87.50 90.50 93.50
Minimum 57.50 75.00 93.50
Standard Deviation 5.57 5.82 -
Sample Size 59 6 1
Statistical Week 18
Mean Fork Length (cm) 55.50 81.00 71.00 85.14
Maximum 55.50 81.00 85.00 93.50
Minimum 55.50 81.00 56.00 79.50
Standard Deviation - - 4.50 4.28
Sample Size 1 1 163 11
Statistical Week 19
Mean Fork Length (cm) 71.03 82.58
Maximum 82.00 87.00
Minimum 57.00 77.50
Standard Deviation 4.65 3.35
Sample Size 125 6
Statistical Week 20
Mean Fork Length (cm) 46.58 71.13 82.64
Maximum 50.50 83.50 92.50
Minimum 42.00 56.50 77.00
Standard Deviation 3.43 4.60 4.69
Sample Size 6 112 11
Statistical Week 21
Mean Fork Length (cm) 51.14 71.56 86.46
Maximum 56.50 85.00 93.50
Minimum 45.50 51.50 77.50
Standard Deviation 3.85 5.37 5.18
Sample Size 7 70 13
Statistical Week 22
Mean Fork Length (cm) 49.92 71.70 91.33 87.10 83.00
Maximum 57.00 85.00 95.50 94.50 83.00
Minimum 42.50 60.00 88.00 73.00 83.00
Standard Deviation 4.94 5.33 3.82 8.71 -
Sample Size 6 50 3 5 1
Statistical Week 23
Mean Fork Length (cm) 73.50 48.67 84.63 72.94 93.32 87.30 106.00
Maximum 73.50 51.00 90.50 81.50 99.50 96.00 106.00
Minimum 73.50 45.50 78.50 62.00 87.50 78.00 106.00
Standard Deviation - 2.84 4.91 4.03 3.80 4.96 -
Sample Size 1 3 4 41 25 15 1
Statistical Week 24
Mean Fork Length (cm) 49.00 84.25 75.17 90.68 86.57 97.10
Maximum 49.00 87.50 88.50 105.00 95.00 102.00
Minimum 49.00 80.00 63.00 77.00 71.00 92.50
Standard Deviation - 3.28 7.52 7.48 6.56 3.42
Sample Size 1 4 15 25 15 5
2006 Composite
Mean Fork Length (cm) 73.50 49.48 84.06 71.34 91.96 85.46 96.00
Maximum 73.50 57.00 90.50 88.50 105.00 96.00 106.00
Minimum 73.50 42.00 78.50 51.50 77.00 71.00 83.00
Standard Deviation - 4.15 3.80 4.92 5.89 5.51 6.85
Sample Size 1 24 9 635 53 82 8
2003 2002 2001

40
Table A5: Length-at-age estimates for Columbia Basin summer Chinook salmon sampled at
Bonneville Dam in 2006. Composite estimates of age classes are weighted by weekly run size.
Brood Year and 2004 2000
Age Class 0.1 0.2 1.1 0.3 1.2 0.4 1.3 1.4
Statistical Week 24
Mean Fork Length (cm) 83.75 75.75 93.09 87.50 88.50
Maximum 91.50 78.50 100.50 93.50 93.00
Minimum 75.50 73.00 85.00 76.00 84.00
Standard Deviation 6.55 3.89 5.02 8.13 4.50
Sample Size 4 2 11 4 3
Statistical Week 25
Mean Fork Length (cm) 43.83 51.20 84.84 72.25 91.65 87.90 94.50
Maximum 46.00 62.00 91.50 86.00 108.00 98.00 97.50
Minimum 42.00 41.50 78.00 52.00 81.00 80.00 89.00
Standard Deviation 2.02 8.50 3.75 8.50 5.12 5.95 4.77
Sample Size 3 5 22 20 56 20 3
Statistical Week 26
Mean Fork Length (cm) 37.00 59.33 53.64 80.68 72.45 90.61 85.84 85.15
Maximum 37.00 66.00 62.00 99.00 89.00 100.50 103.00 98.50
Minimum 37.00 56.00 44.50 69.00 53.50 80.00 63.50 71.50
Standard Deviation - 5.77 6.49 7.13 7.48 4.91 7.58 7.07
Sample Size 1 3 7 22 30 51 46 10
Statistical Week 27
Mean Fork Length (cm) 44.50 73.00 54.06 81.89 74.31 90.36 84.21 85.14
Maximum 45.00 73.00 62.00 94.50 86.00 108.00 98.00 96.50
Minimum 44.00 73.00 51.00 63.50 59.50 75.00 72.00 68.50
Standard Deviation 0.71 - 3.66 7.30 7.35 6.56 6.75 8.55
Sample Size 2 1 8 36 21 48 33 11
Statistical Week 28
Mean Fork Length (cm) 40.83 66.00 49.08 80.98 72.66 88.31 85.92 85.25
Maximum 47.00 66.00 57.00 92.50 82.00 98.50 91.00 92.00
Minimum 37.50 66.00 40.00 68.50 65.50 68.00 79.00 73.00
Standard Deviation 3.93 - 5.77 6.17 4.78 7.24 4.06 8.42
Sample Size 6 1 6 25 16 21 13 4
Statistical Week 29
Mean Fork Length (cm) 52.50 56.50 81.57 77.50 90.25 88.50
Maximum 52.50 60.50 91.00 77.50 96.50 93.00
Minimum 52.50 52.50 69.00 77.50 84.00 84.00
Standard Deviation - 5.66 7.23 - 6.17 6.36
Sample Size 1 2 7 1 4 2
Statistical Week 30
Mean Fork Length (cm) 47.00 52.00 85.00 65.50 86.50 86.67
Maximum 47.00 52.00 99.00 65.50 92.00 91.00
Minimum 47.00 52.00 71.00 65.50 76.00 82.50
Standard Deviation - - 19.80 - 7.33 4.25
Sample Size 1 1 2 1 4 3
2006 Composite
Mean Fork Length (cm) 43.00 63.40 52.53 82.12 72.92 90.65 85.86 86.39
Maximum 52.50 73.00 62.00 99.00 89.00 108.00 103.00 98.50
Minimum 37.00 56.00 40.00 63.50 52.00 68.00 63.50 68.50
Standard Deviation 4.50 7.33 5.90 6.70 7.13 5.81 6.70 7.59
Sample Size 14 5 29 118 91 195 121 31
2003 2002 2001

41
Table A6: Length-at-age estimates for Columbia Basin bright fall Chinook salmon sampled at
Bonneville Dam in 2006. Composite estimates of age classes are weighted by weekly run size.
Brood Year and 2003
Age Class 0.1 0.2 1.1 0.3 1.2 0.4 1.3 0.5 1.4
Statistical Week 36
Mean Fork Length (cm) 45.96 68.22 56.36 82.60 76.08 89.07 85.20 94.38 86.50
Maximum 54.50 74.50 63.00 99.00 80.00 102.00 93.50 97.50 94.00
Minimum 37.50 62.00 50.50 71.00 69.50 65.00 77.00 90.50 79.00
Standard Deviation 5.36 3.47 3.56 5.98 3.99 5.83 6.82 3.07 10.61
Sample Size 13 18 11 53 6 62 5 4 2
Statistical Week 37
Mean Fork Length (cm) 46.69 67.05 57.55 81.93 73.75 87.94 82.44 89.75 91.25
Maximum 56.00 75.00 67.00 95.00 80.00 100.00 96.00 98.50 95.50
Minimum 41.00 56.50 49.00 69.00 62.00 73.00 70.50 81.00 87.00
Standard Deviation 4.03 4.38 5.51 5.33 8.26 6.38 8.09 12.37 6.01
Sample Size 13 32 10 42 4 57 8 2 2
Statistical Week 38
Mean Fork Length (cm) 45.19 66.47 55.72 81.63 72.38 85.60 81.88 98.50 80.25
Maximum 52.00 74.00 64.00 102.50 77.00 94.50 87.50 100.00 83.50
Minimum 37.50 59.00 49.00 66.00 66.00 65.00 75.00 97.00 77.00
Standard Deviation 4.88 4.77 5.02 6.41 4.71 5.78 5.89 2.12 4.60
Sample Size 13 36 9 41 4 35 4 2 2
Statistical Week 39
Mean Fork Length (cm) 47.28 66.94 56.92 80.15 76.25 87.40 82.50 99.75 84.00
Maximum 57.00 82.00 64.50 95.00 80.50 100.50 87.00 106.00 84.00
Minimum 39.50 50.00 51.00 62.00 72.00 74.50 78.00 93.50 84.00
Standard Deviation 4.28 6.61 6.22 6.58 6.01 4.85 6.36 8.84 -
Sample Size 18 34 6 40 2 62 2 2 1
Statistical Week 40
Mean Fork Length (cm) 46.00 69.60 81.65 79.17 85.29 92.50
Maximum 54.50 79.00 96.00 87.00 94.00 92.50
Minimum 39.50 60.50 67.00 66.50 74.00 92.50
Standard Deviation 6.05 5.65 6.09 11.07 4.48 -
Sample Size 6 20 40 3 29 1
Statistical Week 41
Mean Fork Length (cm) 66.50 82.73 89.00 86.25
Maximum 71.00 90.00 98.00 86.50
Minimum 63.00 73.00 76.00 86.00
Standard Deviation 3.42 5.22 6.78 0.35
Sample Size 4 11 11 2
Statistical Week 42
Mean Fork Length (cm) 44.00 67.07 57.00 83.92 86.61 87.00
Maximum 45.50 71.00 57.00 97.00 99.00 87.00
Minimum 42.50 59.00 57.00 74.00 77.00 87.00
Standard Deviation 2.12 3.98 - 6.02 6.65 -
Sample Size 2 7 1 26 14 1
2006 Composite
Mean Fork Length (cm) 46.26 67.35 56.64 81.94 75.32 87.46 83.05 93.73 85.88
Maximum 57.00 82.00 67.00 102.50 87.00 102.00 96.00 106.00 95.50
Minimum 37.50 50.00 49.00 62.00 62.00 65.00 70.50 81.00 77.00
Standard Deviation 4.63 5.12 4.75 6.06 6.35 5.78 6.76 6.64 6.51
Sample Size 65 151 37 253 19 270 19 13 8
19992002 2001 2000

42
Table A7: Length-at-age estimates for Columbia Basin sockeye salmon sampled at Bonneville
Dam in 2006. Composite estimates of age classes are weighted by weekly run size.
Brood Year and 2003 2000
Age Class 1.1 1.2 2.1 1.3 2.2 3.1 2.3
Statistical Week 23
Mean Fork Length (cm) 48.50 48.33
Maximum 51.00 51.00
Minimum 47.00 46.50
Standard Deviation 1.36 2.36
Sample Size 8 3
Statistical Week 24
Mean Fork Length (cm) 49.36 43.38 55.14 50.50
Maximum 54.50 48.00 60.50 55.50
Minimum 45.00 40.50 51.00 47.50
Standard Deviation 2.11 3.25 2.22 2.61
Sample Size 44 4 14 12
Statistical Week 25
Mean Fork Length (cm) 50.27 55.50 50.91 51.00 54.00
Maximum 57.00 63.00 58.00 53.50 54.00
Minimum 46.00 50.00 45.50 48.50 54.00
Standard Deviation 2.59 3.19 4.17 3.54 -
Sample Size 54 17 16 2 1
Statistical Week 26
Mean Fork Length (cm) 49.76 41.33 54.69 49.83 49.33
Maximum 55.50 44.00 60.50 53.50 52.50
Minimum 45.00 38.00 46.00 45.00 46.50
Standard Deviation 2.26 3.06 3.11 2.13 3.01
Sample Size 112 3 29 18 3
Statistical Week 27
Mean Fork Length (cm) 39.50 49.47 41.67 55.12 48.50 43.50
Maximum 41.00 56.00 44.00 58.00 53.00 43.50
Minimum 37.00 45.00 39.50 51.50 41.50 43.50
Standard Deviation 2.18 2.35 2.25 1.57 3.34 -
Sample Size 3 78 3 29 13 1
Statistical Week 28
Mean Fork Length (cm) 36.00 49.08 40.25 54.11 49.67 53.00
Maximum 36.00 54.50 41.00 59.50 53.00 53.00
Minimum 36.00 45.00 39.50 49.00 46.00 53.00
Standard Deviation - 2.41 1.06 3.45 2.08 -
Sample Size 1 32 2 9 12 1
2006 Composite
Mean Fork Length (cm) 38.63 49.62 41.92 54.97 49.85 49.50 54.00
Maximum 41.00 57.00 48.00 63.00 58.00 53.50 54.00
Minimum 36.00 45.00 38.00 46.00 41.50 43.50 54.00
Standard Deviation 2.50 2.33 2.64 2.64 3.01 3.73 -
Sample Size 4 328 12 98 74 7 1
20012002

43
Table A8: Length-at-age estimates for Columbia Basin steelhead sampled at Bonneville Dam in 2006.
Brood Year and 2003 1999
Age Class 1.1 1.2 2.1 1.3 2.2 3.1 2.3 3.2 4.1 4.2
Statistical Week 16
Mean Fork Length (cm) 61.00 62.80
Maximum 61.00 69.00
Minimum 61.00 54.00
Standard Deviation - 7.80
Sample Size 1 3
Statistical Week 17
Mean Fork Length (cm) 59.50 70.00 50.50 70.50 63.30
Maximum 59.50 74.50 50.50 70.50 63.50
Minimum 59.50 65.00 50.50 70.50 63.00
Standard Deviation - 4.20 - - 0.40
Sample Size 1 6 1 1 2
Statistical Week 18
Mean Fork Length (cm) 58.20 63.50
Maximum 59.50 63.50
Minimum 57.00 63.50
Standard Deviation 1.30 -
Sample Size 3 1
Statistical Week 19
Mean Fork Length (cm) 58.80 76.50
Maximum 65.00 76.50
Minimum 52.50 76.50
Standard Deviation 8.80 -
Sample Size 2 1
Statistical Week 20
Mean Fork Length (cm) 70.50 71.20 60.00 63.00
Maximum 70.50 80.00 60.00 63.00
Minimum 70.50 66.00 60.00 63.00
Standard Deviation - 5.40 - -
Sample Size 1 5 1 1
Statistical Week 21
Mean Fork Length (cm) 65.50 71.10 70.80
Maximum 65.50 76.00 76.00
Minimum 65.50 63.50 66.00
Standard Deviation - 4.80 5.00
Sample Size 1 6 3
Statistical Week 22
Mean Fork Length (cm) 57.50 69.00 68.00 69.50
Maximum 69.00 69.00 68.00 69.50
Minimum 50.50 69.00 68.00 69.50
Standard Deviation 10.00 - - -
Sample Size 3 1 1 1
Statistical Week 23
Mean Fork Length (cm) 57.30 69.10 68.00 78.00 66.00
Maximum 70.00 71.00 68.00 78.00 68.50
Minimum 49.00 65.50 68.00 78.00 63.50
Standard Deviation 8.20 2.10 - - 3.50
Sample Size 5 5 1 1 2
2002 2001 2000

44
Brood Year and 2003 1999
Age Class 1.1 1.2 2.1 1.3 2.2 3.1 2.3 3.2 4.1 4.2
Statistical Week 24
Mean Fork Length (cm) 52.20 70.00 60.00
Maximum 55.00 74.50 60.00
Minimum 48.50 65.50 60.00
Standard Deviation 3.30 6.40 -
Sample Size 3 2 1
Statistical Week 25
Mean Fork Length (cm) 52.60 73.50 59.50 63.50
Maximum 56.00 77.50 59.50 63.50
Minimum 48.50 69.50 59.50 63.50
Standard Deviation 2.30 4.00 - -
Sample Size 7 3 1 1
Statistical Week 26
Mean Fork Length (cm) 56.60 68.80 59.70 68.30 68.20
Maximum 64.00 78.00 60.50 70.50 71.00
Minimum 50.00 60.50 59.00 65.00 64.00
Standard Deviation 3.70 5.30 0.80 1.70 3.70
Sample Size 29 21 3 10 3
Statistical Week 27
Mean Fork Length (cm) 59.40 69.90 59.40 69.30 52.80 66.70
Maximum 82.50 77.00 66.50 73.50 53.50 73.00
Minimum 52.00 62.00 54.00 65.00 52.00 62.00
Standard Deviation 6.90 4.20 5.20 2.70 1.10 5.70
Sample Size 33 14 4 7 2 3
Statistical Week 28
Mean Fork Length (cm) 57.80 67.70 60.70 70.50 59.80 67.90
Maximum 66.00 81.00 71.50 78.00 66.00 73.00
Minimum 52.00 54.50 55.00 63.00 56.00 65.00
Standard Deviation 3.20 5.60 4.60 4.20 4.30 3.50
Sample Size 39 32 11 11 4 4
Statistical Week 29
Mean Fork Length (cm) 57.50 68.50 61.40 76.50 59.00 74.50
Maximum 60.00 71.50 67.00 76.50 59.50 74.50
Minimum 53.00 65.50 59.50 76.50 58.50 74.50
Standard Deviation 3.20 4.20 3.20 - 0.70 -
Sample Size 4 2 5 1 2 1
Statistical Week 30
Mean Fork Length (cm) 58.80 69.00 68.90 61.00 64.30 69.50
Maximum 66.50 73.00 75.00 61.00 66.00 69.50
Minimum 54.50 63.50 63.00 61.00 62.50 69.50
Standard Deviation 4.10 3.40 4.10 - 2.50 -
Sample Size 10 6 7 1 2 1
Statistical Week 31
Mean Fork Length (cm) 60.40 70.10 58.70 69.40 56.00 70.80 81.50
Maximum 69.50 77.00 60.00 73.50 56.00 75.00 81.50
Minimum 55.00 61.00 56.00 60.00 56.00 66.50 81.50
Standard Deviation 4.00 4.20 1.60 3.90 - 6.00 -
Sample Size 20 16 5 10 1 2 1
2002 2001 2000

45
Brood Year and 2003 1999
Age Class 1.1 1.2 2.1 1.3 2.2 3.1 2.3 3.2 4.1 4.2
Statistical Week 32
Mean Fork Length (cm) 57.70 69.40 56.00 72.10 67.50
Maximum 61.50 74.50 56.00 79.50 67.50
Minimum 53.50 66.00 56.00 64.50 67.50
Standard Deviation 2.30 3.40 - 6.80 -
Sample Size 9 5 1 4 1
Statistical Week 33
Mean Fork Length (cm) 57.10 69.40 63.00 70.70 57.70 61.50
Maximum 63.50 79.00 63.00 78.50 61.00 61.50
Minimum 51.00 63.00 63.00 62.50 54.00 61.50
Standard Deviation 2.80 4.60 - 8.00 3.50 -
Sample Size 24 19 1 3 3 1
Statistical Week 34
Mean Fork Length (cm) 59.70 73.00 74.00
Maximum 68.00 73.00 74.00
Minimum 55.50 73.00 74.00
Standard Deviation 3.60 - -
Sample Size 9 1 1
Statistical Week 35
Mean Fork Length (cm) 59.30 74.50 56.00 71.00
Maximum 64.00 84.50 56.00 77.50
Minimum 53.00 64.50 56.00 64.50
Standard Deviation 3.40 7.20 - 9.20
Sample Size 11 12 1 2
Statistical Week 36
Mean Fork Length (cm) 58.50 77.70 59.80 84.80 72.50 66.00 81.90 76.50
Maximum 69.00 91.00 67.50 88.00 80.00 66.00 85.50 76.50
Minimum 51.50 59.50 52.00 80.50 65.00 66.00 75.50 76.50
Standard Deviation 3.30 8.00 11.00 2.30 10.60 - 3.50 -
Sample Size 62 71 2 11 2 1 6 1
Statistical Week 37
Mean Fork Length (cm) 47.50 80.00 60.00 86.30 75.70 60.50 85.50 79.30 82.00
Maximum 47.50 92.50 60.00 94.00 85.00 60.50 89.50 84.50 82.00
Minimum 47.50 61.00 60.00 81.50 69.50 60.50 81.50 64.00 82.00
Standard Deviation - 6.80 - 3.50 5.80 - 5.70 8.60 -
Sample Size 1 72 1 16 5 1 2 5 1
Statistical Week 38
Mean Fork Length (cm) 79.80 87.80 87.50
Maximum 92.50 94.50 87.50
Minimum 65.00 81.50 87.50
Standard Deviation 6.60 3.80 -
Sample Size 58 18 1
Statistical Week 39
Mean Fork Length (cm) 81.10 60.00 86.50 72.80 57.00 82.00
Maximum 93.50 60.00 97.00 78.50 57.00 82.00
Minimum 66.00 60.00 79.50 67.00 57.00 82.00
Standard Deviation 5.30 - 3.70 8.10 - -
Sample Size 65 1 25 2 1 1
2002 2001 2000

46
Brood Year and 2003 1999
Age Class 1.1 1.2 2.1 1.3 2.2 3.1 2.3 3.2 4.1 4.2
Statistical Week 40
Mean Fork Length (cm) 81.20 59.50 85.50 66.00 56.50 76.30
Maximum 92.00 62.50 92.00 66.00 56.50 82.00
Minimum 64.00 56.50 76.50 66.00 56.50 66.50
Standard Deviation 4.70 4.20 5.50 - - 8.53
Sample Size 40 2 6 1 1 3
Statistical Week 41
Mean Fork Length (cm) 79.00 63.30 95.00
Maximum 85.50 65.50 95.00
Minimum 68.50 61.00 95.00
Standard Deviation 5.90 3.20 -
Sample Size 17 2 1
Statistical Week 42
Mean Fork Length (cm) 73.80 53.50 88.80 55.00 75.00
Maximum 82.00 53.50 89.00 55.00 85.50
Minimum 60.50 53.50 88.50 55.00 64.50
Standard Deviation 7.50 - 0.40 - 14.80
Sample Size 10 1 2 1 2
Statistical Week 43
Mean Fork Length (cm) 77.80 81.50 71.00
Maximum 85.50 81.50 71.00
Minimum 70.00 81.50 71.00
Standard Deviation 11.00 - -
Sample Size 2 1 1
2006 Composite
Mean Fork Length (cm) 59.20 76.40 60.00 86.40 70.20 58.40 85.10 72.60 61.50 77.40
Maximum 82.50 93.50 71.50 97.00 85.00 66.00 89.50 85.50 61.50 82.00
Minimum 46.00 54.00 50.50 76.50 59.50 52.00 81.50 62.00 61.50 69.50
Standard Deviation 4.80 7.80 4.20 3.90 4.80 3.90 4.00 8.30 - 5.80
Sample Size 409 494 45 81 76 19 4 36 1 4
2002 2001 2000


