COMMISSION ON ACCREDITATION IN PHYSICAL THERAPY EDUCATION| 1111 N. FAIRFAX ST. ALEXANDRIA, VA [email protected]
AGGREGATE PROGRAM DATA 2017 – 2018 PHYSICAL THERAPIST ASSISTANT EDUCATION PROGRAMS FACT SHEETS
2017 – 18 Fact Sheets Physical Therapist Assistant Education Programs
1 Introduction
2017 – 18 Fact Sheet Physical Therapist Assistant Education Programs
This Fact Sheet is designed to provide the education community with current and historical information about physical therapist education programs, students and faculty. The data included in this Fact Sheet is taken from the following sources:
• THE 2017 ANNUAL ACCREDITATION REPORT SUBMITTED BY ACCREDITED PROGRAMS IN DECEMBER 2017 • THE 2016, 2015, 2014, 2012, 2010, 2008 ANNUAL ACCREDITATION REPORTS • THE 2006, 2005 ANNUAL ACCREDITATION REPORT • THE 2004, 2002 BIENNIAL ACCREDITATION REPORT • PREVIOUS SURVEYS OF THE PTA EDUCATIONAL PROGRAMS CONDUCTED BY THE EDUCATION DIVISION • DEPARTMENT OF ACCREDITATION RECORDS • LICENSURE PASS RATE INFORMATION PROVIDED BY THE FSBPT ON APRIL 2005, APRIL 2006, APRIL 2007, MARCH 2011, APRIL
2012, APRIL 2014, APRIL 2015, APRIL 2016, APRIL 2017 AND DECEMBER 2017. Unless otherwise indicated, the data reflects accredited and developing physical therapist assistant education programs in the United States for the academic year 2017 – 18. All uses of this data should reference the Commission on Accreditation in Physical Therapy Education (CAPTE) as the source of the data and acknowledge that CAPTE bears no responsibility for interpretations presented or conclusions reached based on analysis of the data. Symbols Many tables in this volume use a series of symbols to alert the reader to special statistical notes. These symbols, and their meanings, are as follows: — Not available. † Not applicable. # Rounds to zero. ‡ Reporting standards not met. Originally Published March 12, 2018 Last Updated October 23, 2018. Updates made after the date of original publication will be high-lighted in Yellow CAPTE’s Home Page address is www.capteonline.org CAPTE’s Resource Documents address is www.capteonline.org/resources This publication is only available online. To download, view, and print the report as a PDF file, go to CAPTE’s Resource Documents address shown above. CONTENT CONTACT TEJ CHANA – SR. DATABASE SPECIALIST [email protected]
2017 – 18 Fact Sheets Physical Therapist Assistant Education Programs
2 Glossary & Contents
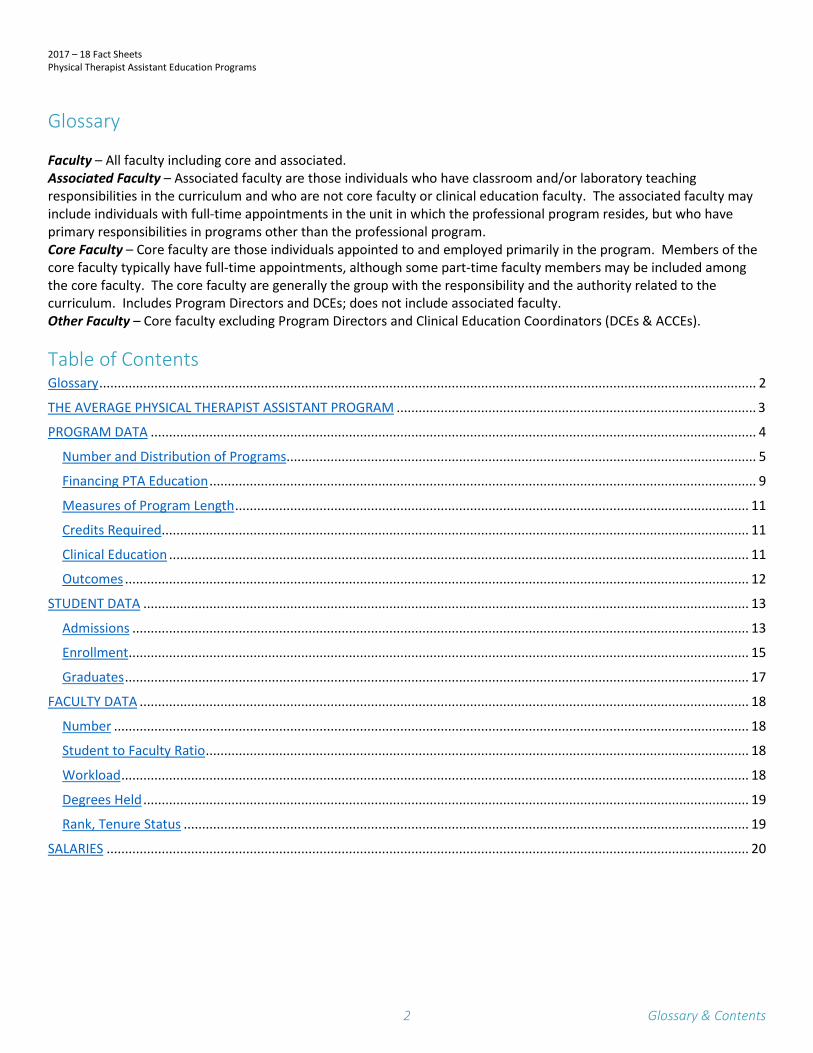
Glossary Faculty – All faculty including core and associated. Associated Faculty – Associated faculty are those individuals who have classroom and/or laboratory teaching responsibilities in the curriculum and who are not core faculty or clinical education faculty. The associated faculty may include individuals with full-time appointments in the unit in which the professional program resides, but who have primary responsibilities in programs other than the professional program. Core Faculty – Core faculty are those individuals appointed to and employed primarily in the program. Members of the core faculty typically have full-time appointments, although some part-time faculty members may be included among the core faculty. The core faculty are generally the group with the responsibility and the authority related to the curriculum. Includes Program Directors and DCEs; does not include associated faculty. Other Faculty – Core faculty excluding Program Directors and Clinical Education Coordinators (DCEs & ACCEs).
Table of Contents Glossary ................................................................................................................................................................................... 2
THE AVERAGE PHYSICAL THERAPIST ASSISTANT PROGRAM .................................................................................................. 3
PROGRAM DATA ..................................................................................................................................................................... 4
Number and Distribution of Programs ................................................................................................................................ 5
Financing PTA Education ..................................................................................................................................................... 9
Measures of Program Length ............................................................................................................................................ 11
Credits Required ................................................................................................................................................................ 11
Clinical Education .............................................................................................................................................................. 11
Outcomes .......................................................................................................................................................................... 12
STUDENT DATA ..................................................................................................................................................................... 13
Admissions ........................................................................................................................................................................ 13
Enrollment ......................................................................................................................................................................... 15
Graduates .......................................................................................................................................................................... 17
FACULTY DATA ...................................................................................................................................................................... 18
Number ............................................................................................................................................................................. 18
Student to Faculty Ratio .................................................................................................................................................... 18
Workload ........................................................................................................................................................................... 18
Degrees Held ..................................................................................................................................................................... 19
Rank, Tenure Status .......................................................................................................................................................... 19
SALARIES ............................................................................................................................................................................... 20
2017 – 18 Fact Sheets Physical Therapist Assistant Education Programs
3 Number and Distribution
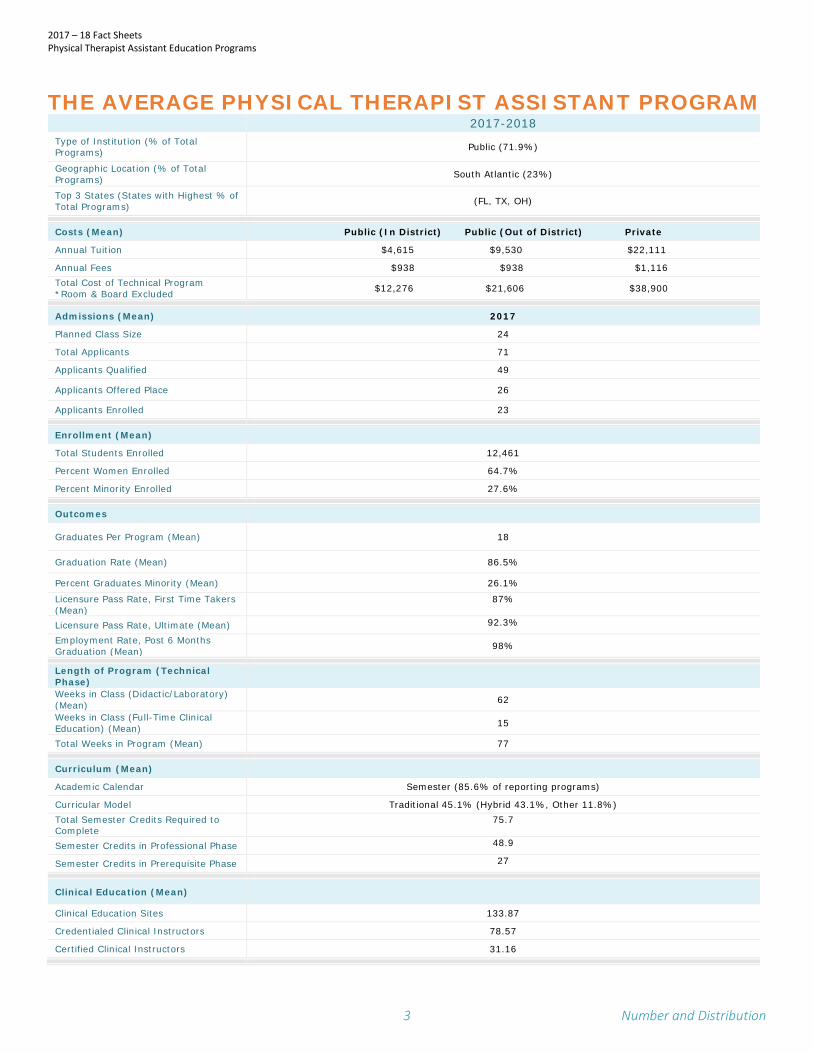
THE AVERAGE PHYSICAL THERAPIST ASSISTANT PROGRAM 2017-2018 Type of Institution (% of Total Programs) Public (71.9%)
Geographic Location (% of Total Programs) South Atlantic (23%)
Top 3 States (States with Highest % of Total Programs) (FL, TX, OH)
Costs (Mean) Public (In District) Public (Out of District) Private
Annual Tuition $4,615 $9,530 $22,111
Annual Fees $938 $938 $1,116 Total Cost of Technical Program *Room & Board Excluded $12,276 $21,606 $38,900
Admissions (Mean) 2017
Planned Class Size 24
Total Applicants 71
Applicants Qualified 49
Applicants Offered Place 26
Applicants Enrolled 23
Enrollment (Mean)
Total Students Enrolled 12,461
Percent Women Enrolled 64.7%
Percent Minority Enrolled 27.6%
Outcomes
Graduates Per Program (Mean) 18
Graduation Rate (Mean) 86.5%
Percent Graduates Minority (Mean) 26.1%
Licensure Pass Rate, First Time Takers (Mean)
87%
Licensure Pass Rate, Ultimate (Mean) 92.3%
Employment Rate, Post 6 Months Graduation (Mean) 98%
Length of Program (Technical Phase)
Weeks in Class (Didactic/Laboratory) (Mean) 62
Weeks in Class (Full-Time Clinical Education) (Mean) 15
Total Weeks in Program (Mean) 77
Curriculum (Mean)
Academic Calendar Semester (85.6% of reporting programs)
Curricular Model Traditional 45.1% (Hybrid 43.1%, Other 11.8%) Total Semester Credits Required to Complete
75.7
Semester Credits in Professional Phase 48.9
Semester Credits in Prerequisite Phase 27
Clinical Education (Mean)
Clinical Education Sites 133.87
Credentialed Clinical Instructors 78.57
Certified Clinical Instructors 31.16
2017 – 18 Fact Sheets Physical Therapist Assistant Education Programs
4 Number and Distribution
2017-2018
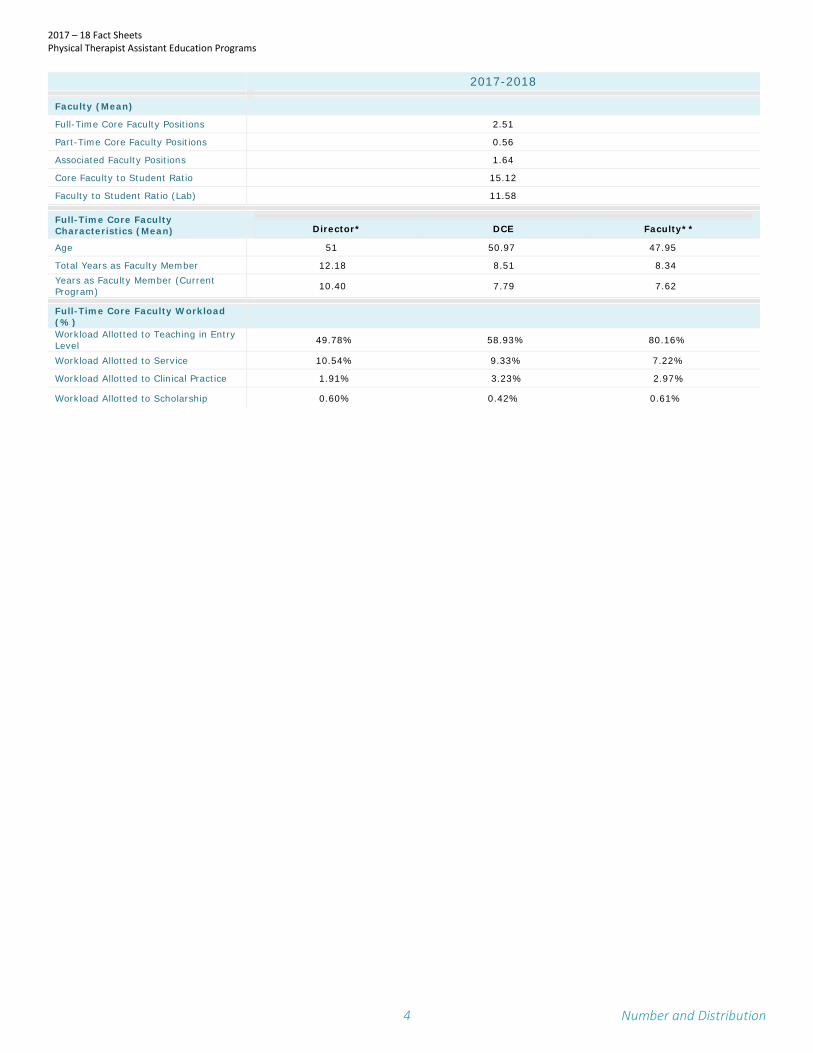
Faculty (Mean)
Full-Time Core Faculty Positions 2.51
Part-Time Core Faculty Positions 0.56
Associated Faculty Positions 1.64
Core Faculty to Student Ratio 15.12
Faculty to Student Ratio (Lab) 11.58
Full-Time Core Faculty Characteristics (Mean) Director* DCE Faculty**
Age 51 50.97 47.95
Total Years as Faculty Member 12.18 8.51 8.34 Years as Faculty Member (Current Program) 10.40 7.79 7.62
Full-Time Core Faculty Workload (%)
Workload Allotted to Teaching in Entry Level 49.78% 58.93% 80.16%
Workload Allotted to Service 10.54% 9.33% 7.22%
Workload Allotted to Clinical Practice 1.91% 3.23% 2.97%
Workload Allotted to Scholarship 0.60% 0.42% 0.61%
2017 – 18 Fact Sheets Physical Therapist Assistant Education Programs
5 Number and Distribution
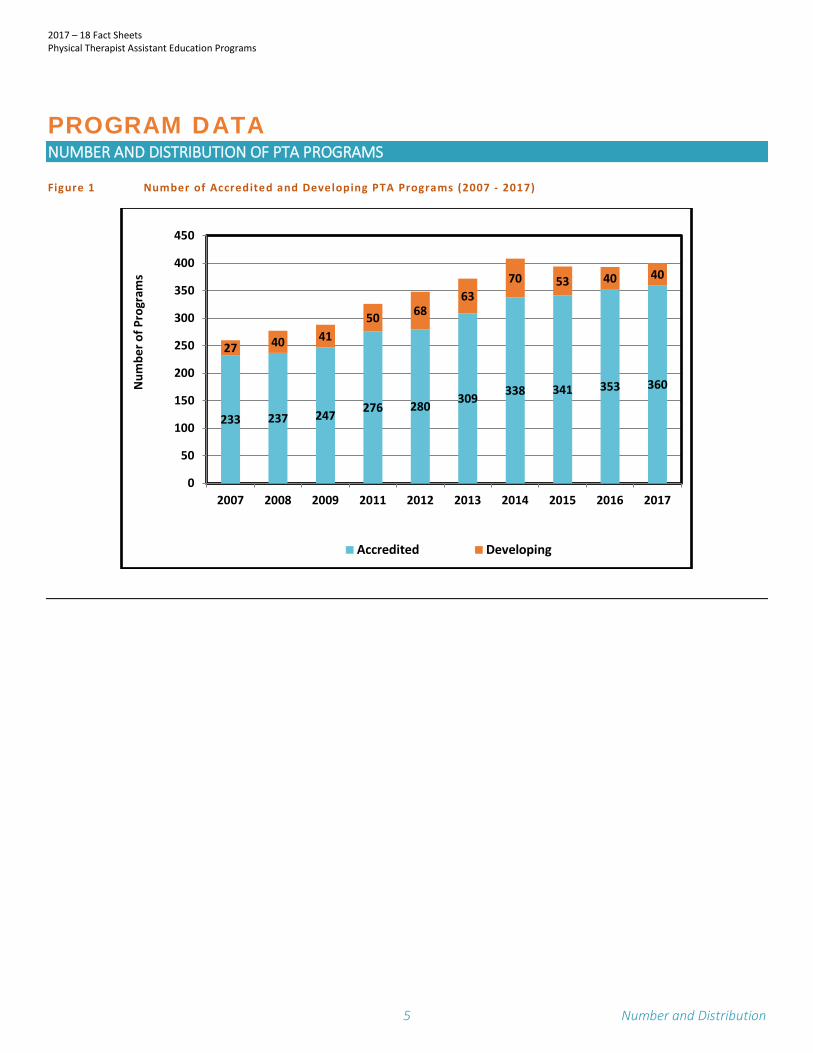
PROGRAM DATA NUMBER AND DISTRIBUTION OF PTA PROGRAMS Figure 1 Number of Accredited and Developing PTA Programs (2007 - 2017)
233 237 247 276 280 309 338 341 353 360
27 40 4150 68
6370 53 40 40
0
50
100
150
200
250
300
350
400
450
2007 2008 2009 2011 2012 2013 2014 2015 2016 2017
Num
ber o
f Pro
gram
s
Accredited Developing
2017 – 18 Fact Sheets Physical Therapist Assistant Education Programs
6 Number and Distribution
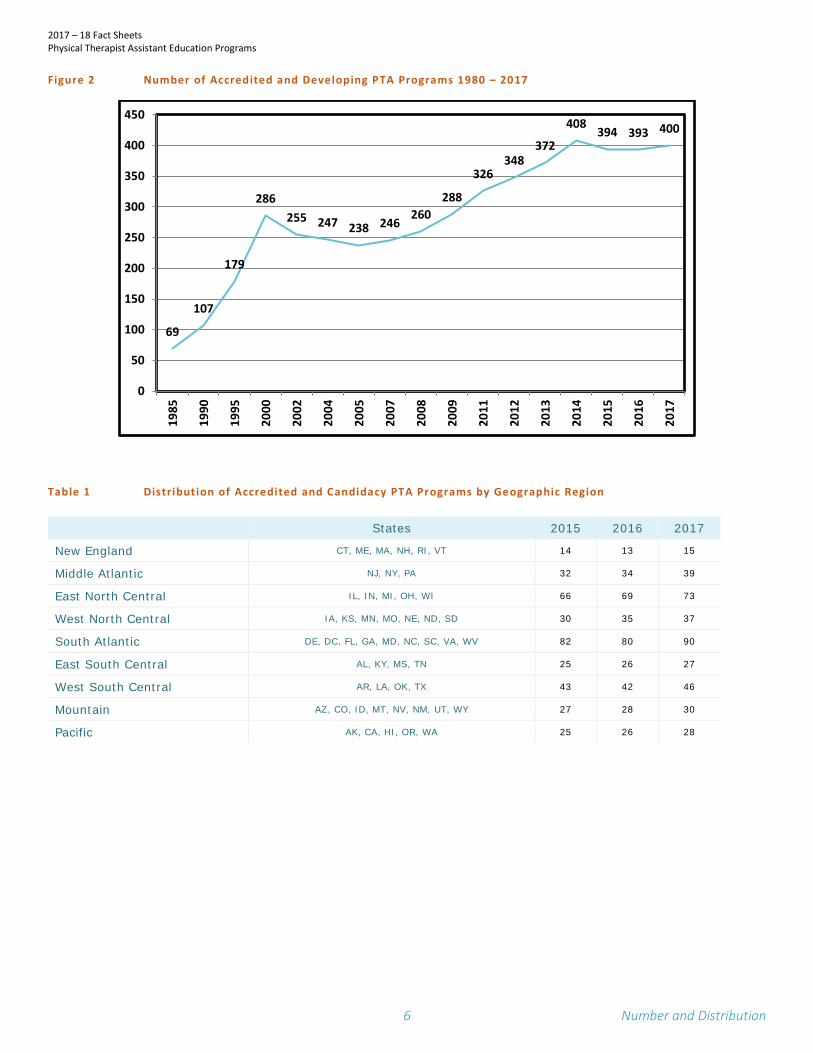
Figure 2 Number of Accredited and Developing PTA Programs 1980 – 2017
Table 1 Distribution of Accredited and Candidacy PTA Programs by Geographic Region States 2015 2016 2017
New England CT, ME, MA, NH, RI, VT 14 13 15
Middle Atlantic NJ, NY, PA 32 34 39
East North Central IL, IN, MI, OH, WI 66 69 73
West North Central IA, KS, MN, MO, NE, ND, SD 30 35 37
South Atlantic DE, DC, FL, GA, MD, NC, SC, VA, WV 82 80 90
East South Central AL, KY, MS, TN 25 26 27
West South Central AR, LA, OK, TX 43 42 46
Mountain AZ, CO, ID, MT, NV, NM, UT, WY 27 28 30
Pacific AK, CA, HI, OR, WA 25 26 28
69
107
179
286255 247 238 246
260288
326348
372
408394 393 400
0
50
100
150
200
250
300
350
400
450
1985
1990
1995
2000
2002
2004
2005
2007
2008
2009
2011
2012
2013
2014
2015
2016
2017
2017 – 18 Fact Sheets Physical Therapist Assistant Education Programs
7 Number and Distribution
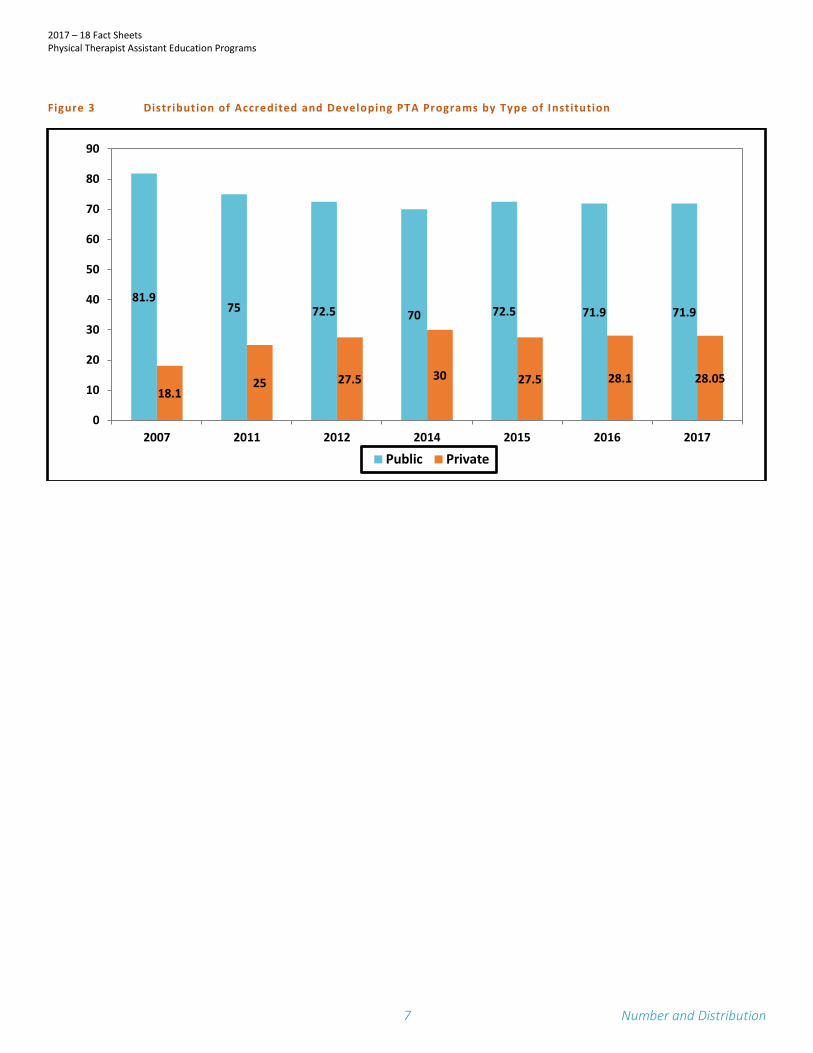
Figure 3 Distribution of Accredited and Developing PTA Programs by Type of Institution
81.975 72.5 70 72.5 71.9 71.9
18.125 27.5 30 27.5 28.1 28.05
0
10
20
30
40
50
60
70
80
90
2007 2011 2012 2014 2015 2016 2017
Public Private
2017 – 18 Fact Sheets Physical Therapist Assistant Education Programs
8 Number and Distribution
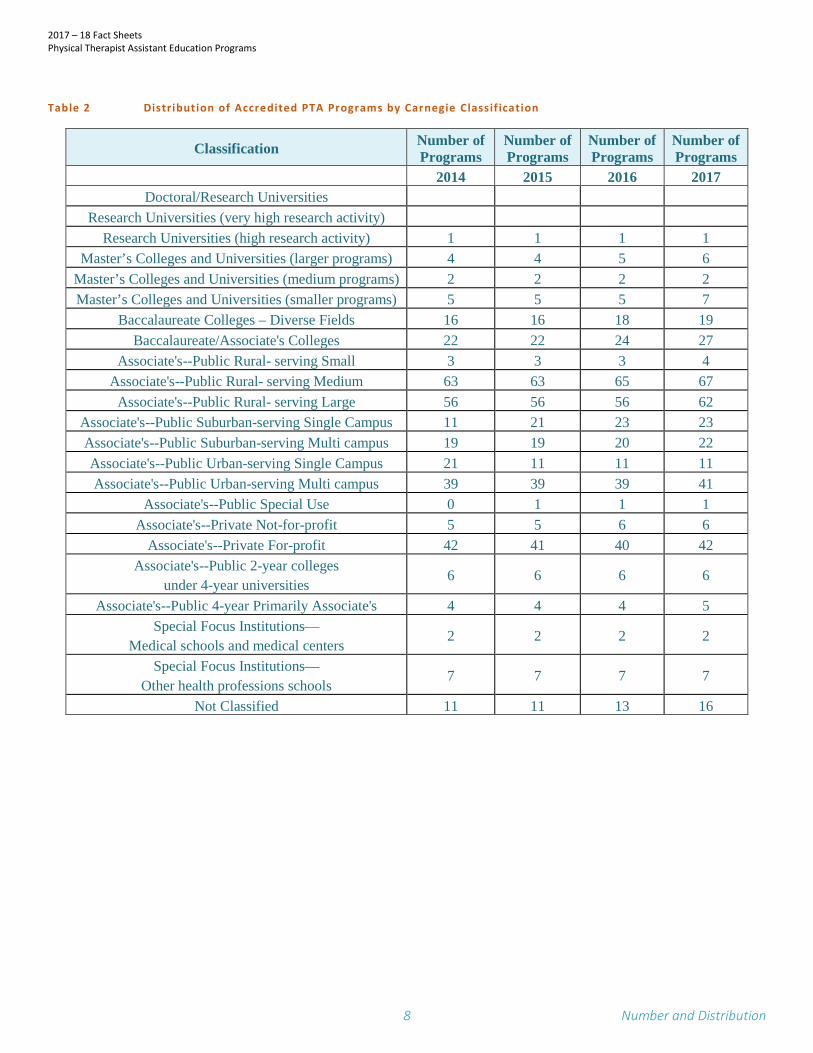
Table 2 Distribution of Accredited PTA Programs by Carnegie Classif ication
Classification Number of Programs
Number of Programs
Number of Programs
Number of Programs
2014 2015 2016 2017 Doctoral/Research Universities
Research Universities (very high research activity) Research Universities (high research activity) 1 1 1 1
Master’s Colleges and Universities (larger programs) 4 4 5 6 Master’s Colleges and Universities (medium programs) 2 2 2 2 Master’s Colleges and Universities (smaller programs) 5 5 5 7
Baccalaureate Colleges – Diverse Fields 16 16 18 19 Baccalaureate/Associate's Colleges 22 22 24 27
Associate's--Public Rural- serving Small 3 3 3 4 Associate's--Public Rural- serving Medium 63 63 65 67
Associate's--Public Rural- serving Large 56 56 56 62 Associate's--Public Suburban-serving Single Campus 11 21 23 23 Associate's--Public Suburban-serving Multi campus 19 19 20 22 Associate's--Public Urban-serving Single Campus 21 11 11 11 Associate's--Public Urban-serving Multi campus 39 39 39 41
Associate's--Public Special Use 0 1 1 1 Associate's--Private Not-for-profit 5 5 6 6
Associate's--Private For-profit 42 41 40 42 Associate's--Public 2-year colleges
under 4-year universities 6 6 6 6
Associate's--Public 4-year Primarily Associate's 4 4 4 5 Special Focus Institutions—
Medical schools and medical centers 2 2 2 2
Special Focus Institutions— Other health professions schools
7 7 7 7
Not Classified 11 11 13 16
2017 – 18 Fact Sheets Physical Therapist Assistant Education Programs
9 Financing PTA Education
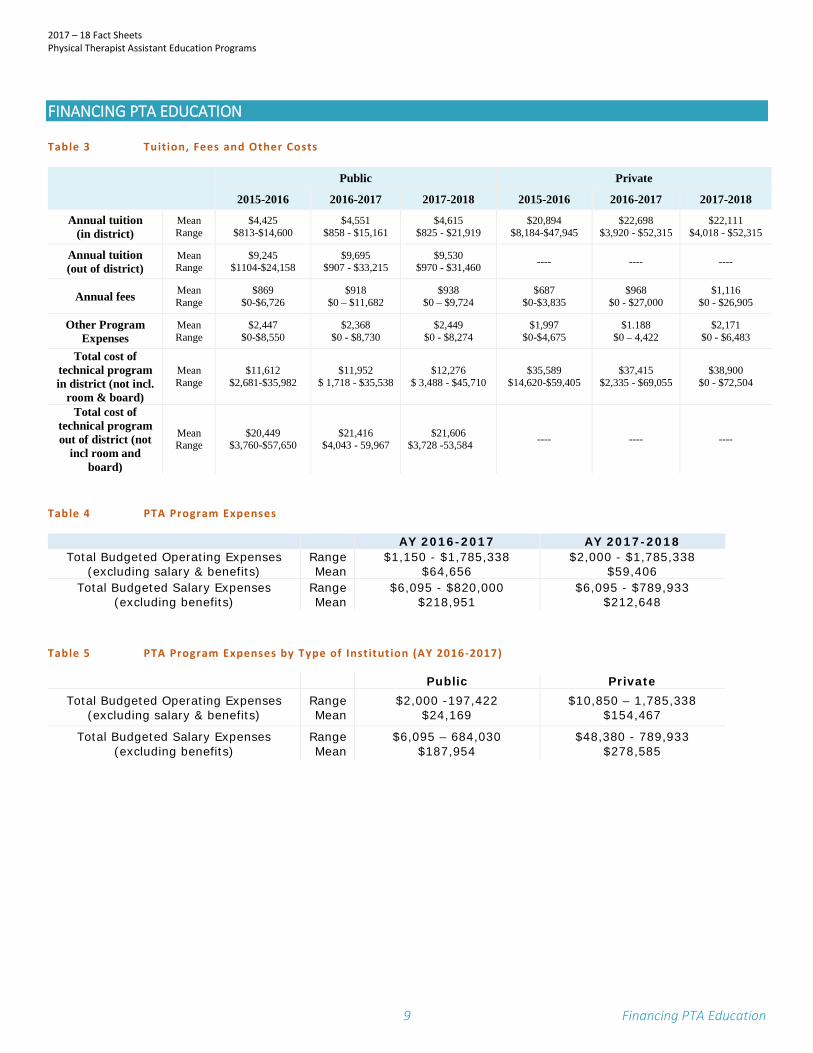
FINANCING PTA EDUCATION Table 3 Tuition, Fees and Other Costs
Public Private
2015-2016 2016-2017 2017-2018 2015-2016 2016-2017 2017-2018
Annual tuition (in district)
Mean Range
$4,425 $813-$14,600
$4,551 $858 - $15,161
$4,615 $825 - $21,919
$20,894 $8,184-$47,945
$22,698 $3,920 - $52,315
$22,111 $4,018 - $52,315
Annual tuition (out of district)
Mean Range
$9,245 $1104-$24,158
$9,695 $907 - $33,215
$9,530 $970 - $31,460 ---- ---- ----
Annual fees Mean Range
$869 $0-$6,726
$918 $0 – $11,682
$938 $0 – $9,724
$687 $0-$3,835
$968 $0 - $27,000
$1,116 $0 - $26,905
Other Program Expenses
Mean Range
$2,447 $0-$8,550
$2,368 $0 - $8,730
$2,449 $0 - $8,274
$1,997 $0-$4,675
$1.188 $0 – 4,422
$2,171 $0 - $6,483
Total cost of technical program in district (not incl.
room & board)
Mean Range
$11,612 $2,681-$35,982
$11,952 $ 1,718 - $35,538
$12,276 $ 3,488 - $45,710
$35,589 $14,620-$59,405
$37,415 $2,335 - $69,055
$38,900 $0 - $72,504
Total cost of technical program out of district (not
incl room and board)
Mean Range
$20,449 $3,760-$57,650
$21,416 $4,043 - 59,967
$21,606 $3,728 -53,584 ---- ---- ----
Table 4 PTA Program Expenses
AY 2016-2017 AY 2017-2018 Total Budgeted Operating Expenses
(excluding salary & benefits) Range Mean
$1,150 - $1,785,338 $64,656
$2,000 - $1,785,338 $59,406
Total Budgeted Salary Expenses (excluding benefits)
Range Mean
$6,095 - $820,000 $218,951
$6,095 - $789,933 $212,648
Table 5 PTA Program Expenses by Type of Institution (AY 2016-2017)
Public Private Total Budgeted Operating Expenses
(excluding salary & benefits) Range Mean
$2,000 -197,422 $24,169
$10,850 – 1,785,338 $154,467
Total Budgeted Salary Expenses (excluding benefits)
Range Mean
$6,095 – 684,030 $187,954
$48,380 - 789,933 $278,585

2017 – 18 Fact Sheets Physical Therapist Assistant Education Programs
10 Measures of PTA Program Length
MEASURES OF PTA PROGRAM LENGTH Table 6 Length ( in weeks) of Technical Curr iculum (all program types)
2016–17 2017–18
Number of weeks in didactic portion
Range 17-85 34-101
Mean 60 62
Number of weeks in full-time Clinical Education
Range 0-20 6-26
Mean 15 15
Total number of weeks in program
Range 16-115 34-101
Mean 77 77
2017 – 18 Fact Sheets Physical Therapist Assistant Education Programs
11 Measures of PTA Program Length
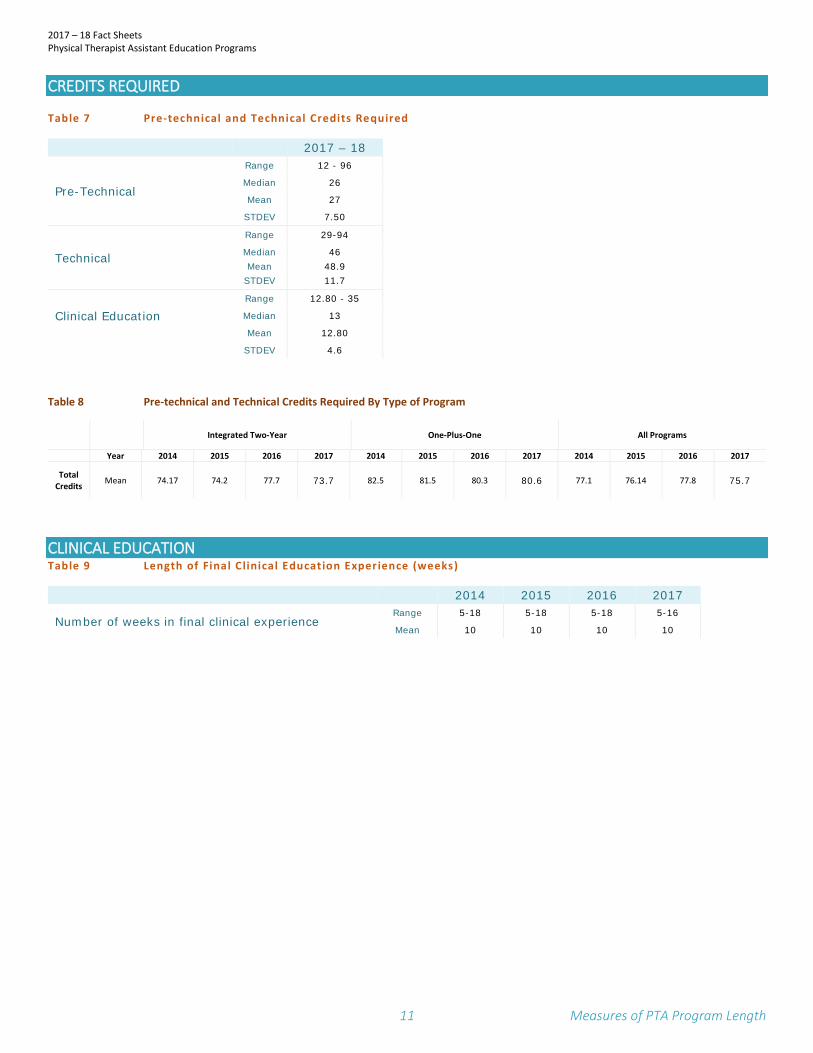
CREDITS REQUIRED Table 7 Pre-technical and Technical Credits Required
2017 – 18
Pre-Technical
Range 12 - 96
Median 26
Mean 27
STDEV 7.50
Technical
Range 29-94
Median 46 Mean 48.9
STDEV 11.7
Clinical Education Range 12.80 - 35
Median 13
Mean 12.80
STDEV 4.6
Table 8 Pre-technical and Technical Credits Required By Type of Program
Integrated Two-Year One-Plus-One All Programs
Year 2014 2015 2016 2017 2014 2015 2016 2017 2014 2015 2016 2017
Total Credits Mean 74.17 74.2 77.7 73.7 82.5 81.5 80.3 80.6 77.1 76.14 77.8 75.7
CLINICAL EDUCATION Table 9 Length of Final Clinical Education Experience (weeks)
2014 2015 2016 2017
Number of weeks in final clinical experience Range 5-18 5-18 5-18 5-16
Mean 10 10 10 10
2017 – 18 Fact Sheets Physical Therapist Assistant Education Programs
12 Outcomes
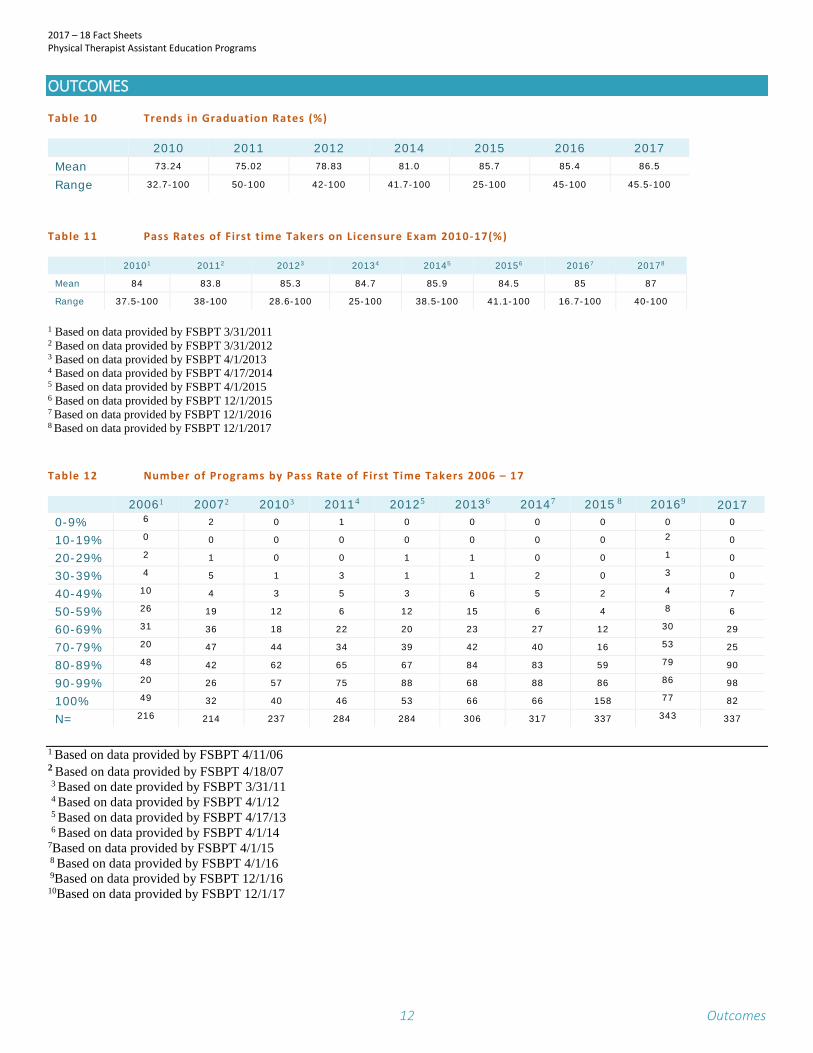
OUTCOMES Table 10 Trends in Graduation Rates (%)
2010 2011 2012 2014 2015 2016 2017 Mean 73.24 75.02 78.83 81.0 85.7 85.4 86.5
Range 32.7-100 50-100 42-100 41.7-100 25-100 45-100 45.5-100
Table 11 Pass Rates of First t ime Takers on Licensure Exam 2010-17(%)
20101 20112 20123 20134 20145 20156 20167 20178
Mean 84 83.8 85.3 84.7 85.9 84.5 85 87
Range 37.5-100 38-100 28.6-100 25-100 38.5-100 41.1-100 16.7-100 40-100
1 Based on data provided by FSBPT 3/31/2011 2 Based on data provided by FSBPT 3/31/2012 3 Based on data provided by FSBPT 4/1/2013 4 Based on data provided by FSBPT 4/17/2014 5 Based on data provided by FSBPT 4/1/2015 6 Based on data provided by FSBPT 12/1/2015 7 Based on data provided by FSBPT 12/1/2016 8 Based on data provided by FSBPT 12/1/2017 Table 12 Number of Programs by Pass Rate of First Time Takers 2006 – 17
20061 20072 20103 20114 20125 20136 20147 2015 8 20169 2017 0-9% 6 2 0 1 0 0 0 0 0 0
10-19% 0 0 0 0 0 0 0 0 2 0
20-29% 2 1 0 0 1 1 0 0 1 0
30-39% 4 5 1 3 1 1 2 0 3 0
40-49% 10 4 3 5 3 6 5 2 4 7
50-59% 26 19 12 6 12 15 6 4 8 6
60-69% 31 36 18 22 20 23 27 12 30 29
70-79% 20 47 44 34 39 42 40 16 53 25
80-89% 48 42 62 65 67 84 83 59 79 90
90-99% 20 26 57 75 88 68 88 86 86 98
100% 49 32 40 46 53 66 66 158 77 82
N= 216 214 237 284 284 306 317 337 343 337
1 Based on data provided by FSBPT 4/11/06 2 Based on data provided by FSBPT 4/18/07 3 Based on date provided by FSBPT 3/31/11 4 Based on data provided by FSBPT 4/1/12 5 Based on data provided by FSBPT 4/17/13 6 Based on data provided by FSBPT 4/1/14 7Based on data provided by FSBPT 4/1/15 8 Based on data provided by FSBPT 4/1/16 9Based on data provided by FSBPT 12/1/16 10Based on data provided by FSBPT 12/1/17
2017 – 18 Fact Sheets Physical Therapist Assistant Education Programs
13 Outcomes & Admissions
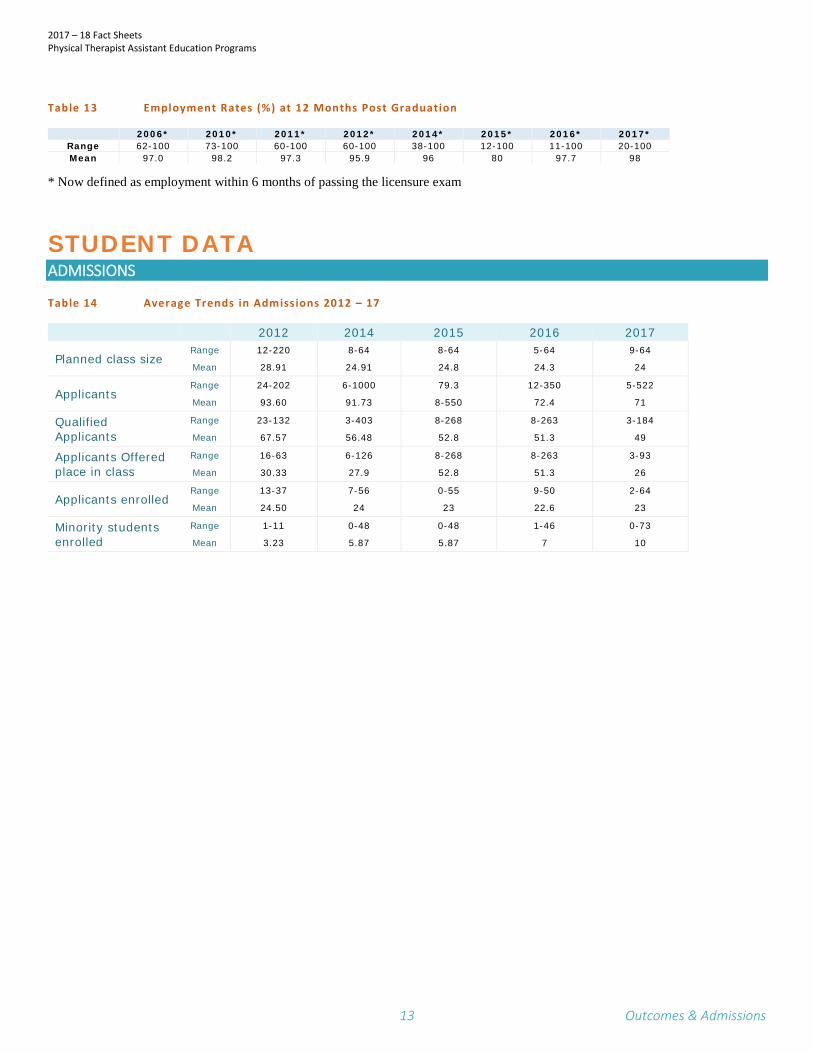
Table 13 Employment Rates (%) at 12 Months Post Graduation
2006* 2010* 2011* 2012* 2014* 2015* 2016* 2017* Range 62-100 73-100 60-100 60-100 38-100 12-100 11-100 20-100 Mean 97.0 98.2 97.3 95.9 96 80 97.7 98
* Now defined as employment within 6 months of passing the licensure exam
STUDENT DATA ADMISSIONS Table 14 Average Trends in Admissions 2012 – 17
2012 2014 2015 2016 2017
Planned class size Range 12-220 8-64 8-64 5-64 9-64
Mean 28.91 24.91 24.8 24.3 24
Applicants Range 24-202 6-1000 79.3 12-350 5-522
Mean 93.60 91.73 8-550 72.4 71
Qualified Applicants
Range 23-132 3-403 8-268 8-263 3-184
Mean 67.57 56.48 52.8 51.3 49
Applicants Offered place in class
Range 16-63 6-126 8-268 8-263 3-93
Mean 30.33 27.9 52.8 51.3 26
Applicants enrolled Range 13-37 7-56 0-55 9-50 2-64
Mean 24.50 24 23 22.6 23
Minority students enrolled
Range 1-11 0-48 0-48 1-46 0-73
Mean 3.23 5.87 5.87 7 10
2017 – 18 Fact Sheets Physical Therapist Assistant Education Programs
14 Outcomes & Admissions
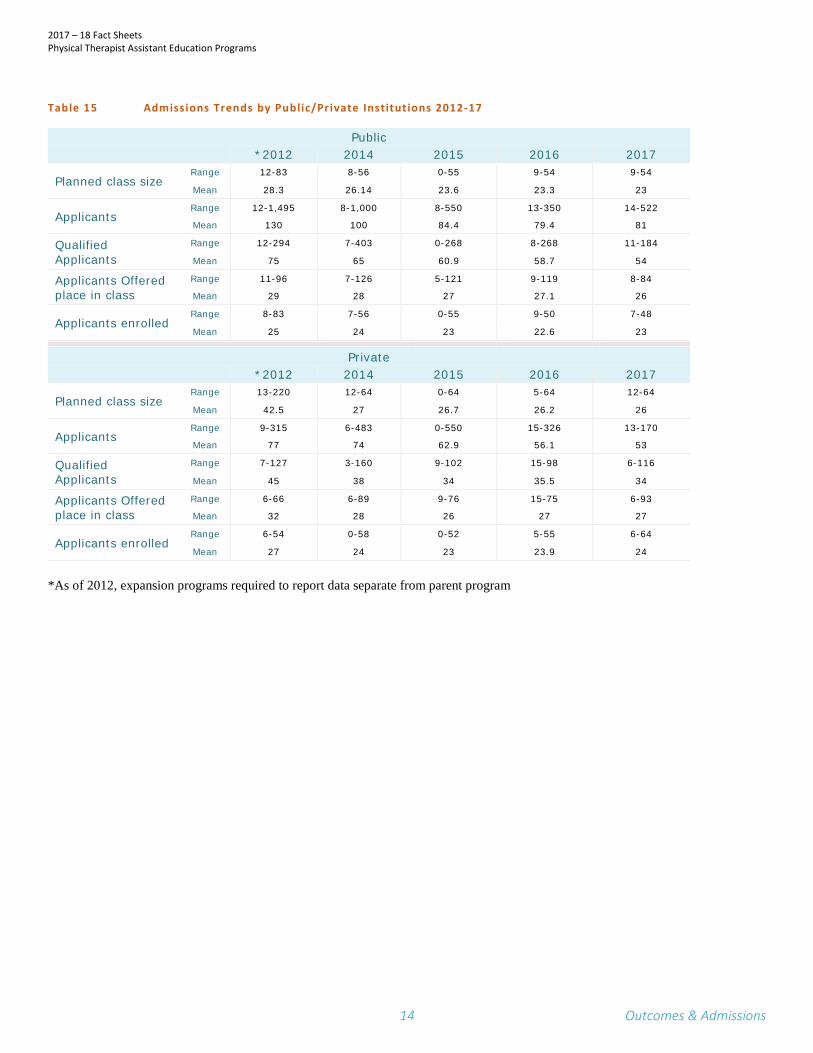
Table 15 Admissions Trends by Public/Private Institutions 2012-17
Public *2012 2014 2015 2016 2017
Planned class size Range 12-83 8-56 0-55 9-54 9-54
Mean 28.3 26.14 23.6 23.3 23
Applicants Range 12-1,495 8-1,000 8-550 13-350 14-522
Mean 130 100 84.4 79.4 81
Qualified Applicants
Range 12-294 7-403 0-268 8-268 11-184
Mean 75 65 60.9 58.7 54
Applicants Offered place in class
Range 11-96 7-126 5-121 9-119 8-84
Mean 29 28 27 27.1 26
Applicants enrolled Range 8-83 7-56 0-55 9-50 7-48
Mean 25 24 23 22.6 23
Private *2012 2014 2015 2016 2017
Planned class size Range 13-220 12-64 0-64 5-64 12-64
Mean 42.5 27 26.7 26.2 26
Applicants Range 9-315 6-483 0-550 15-326 13-170
Mean 77 74 62.9 56.1 53
Qualified Applicants
Range 7-127 3-160 9-102 15-98 6-116
Mean 45 38 34 35.5 34
Applicants Offered place in class
Range 6-66 6-89 9-76 15-75 6-93
Mean 32 28 26 27 27
Applicants enrolled Range 6-54 0-58 0-52 5-55 6-64
Mean 27 24 23 23.9 24
*As of 2012, expansion programs required to report data separate from parent program
2017 – 18 Fact Sheets Physical Therapist Assistant Education Programs
15 Enrollment
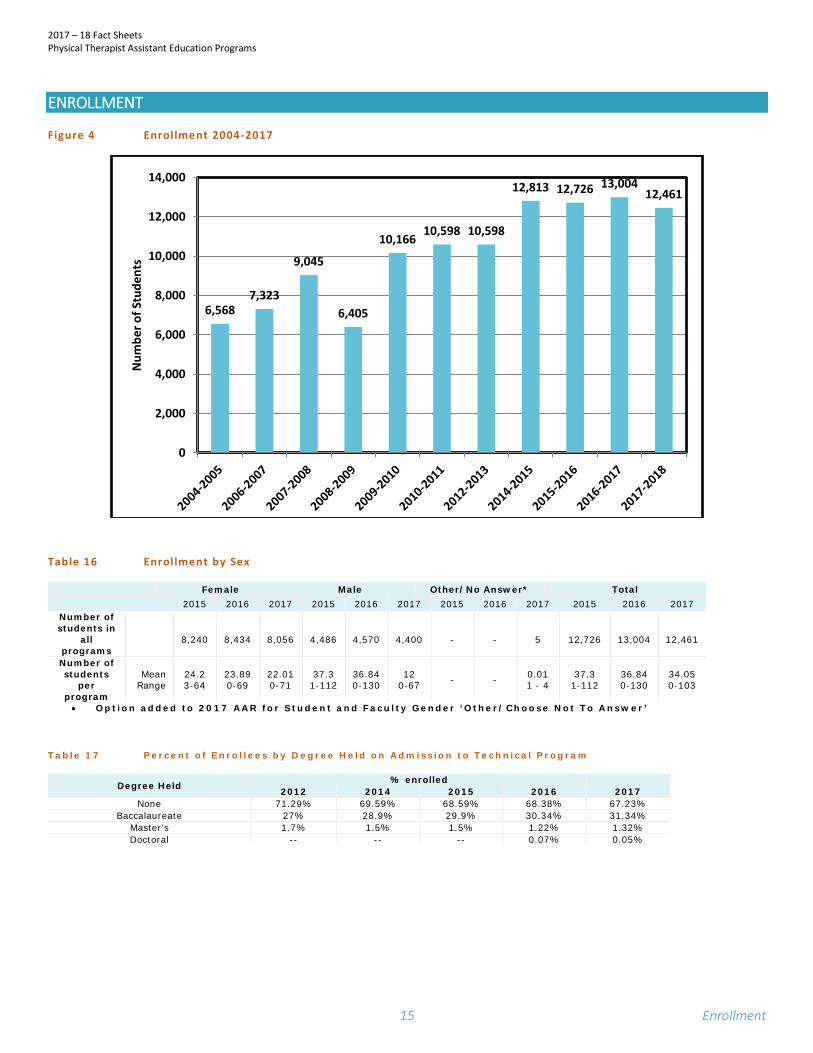
ENROLLMENT Figure 4 Enrollment 2004-2017
Table 16 Enrollment by Sex
Female Male Other/No Answer* Total 2015 2016 2017 2015 2016 2017 2015 2016 2017 2015 2016 2017
Number of students in
all programs
8,240
8,434
8,056
4,486
4,570
4,400
-
-
5
12,726
13,004
12,461
Number of students
per program
Mean Range
24.2 3-64
23.89 0-69
22.01 0-71
37.3 1-112
36.84 0-130
12 0-67 - - 0.01
1 - 4 37.3
1-112 36.84 0-130
34.05 0-103
• Option added to 2017 AAR for Student and Faculty Gender ‘Other/Choose Not To Answer’
Table 17 Percent of Enrollees by Degree Held on Admission to Technical Program
Degree Held % enrolled 2012 2014 2015 2016 2017
None 71.29% 69.59% 68.59% 68.38% 67.23% Baccalaureate 27% 28.9% 29.9% 30.34% 31.34%
Master’s 1.7% 1.5% 1.5% 1.22% 1.32% Doctoral -- -- -- 0.07% 0.05%
6,5687,323
9,045
6,405
10,16610,598 10,598
12,813 12,726 13,00412,461
0
2,000
4,000
6,000
8,000
10,000
12,000
14,000
Num
ber o
f Stu
dent
s
2017 – 18 Fact Sheets Physical Therapist Assistant Education Programs
16 Enrollment
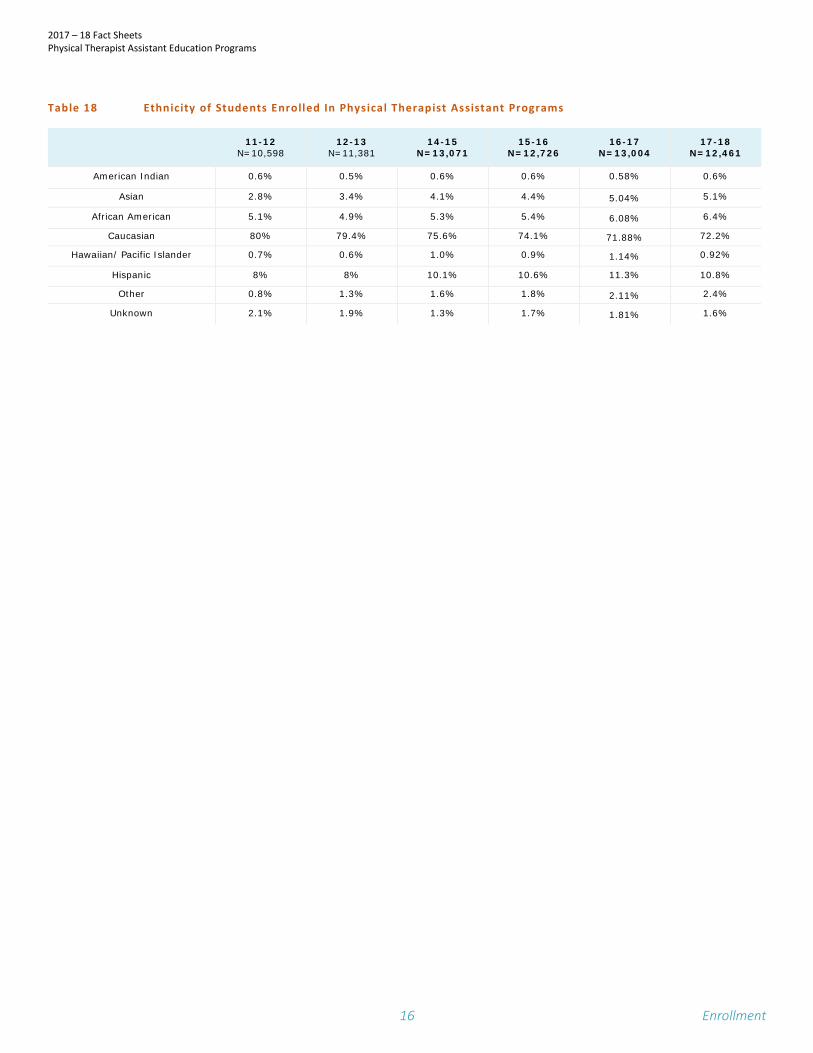
Table 18 Ethnicity of Students Enrolled In Physical Therapist Assistant Programs
11-12 N=10,598
12-13 N=11,381
14-15 N=13,071
15-16 N=12,726
16-17 N=13,004
17-18 N=12,461
American Indian 0.6% 0.5% 0.6% 0.6% 0.58% 0.6%
Asian 2.8% 3.4% 4.1% 4.4% 5.04% 5.1%
African American 5.1% 4.9% 5.3% 5.4% 6.08% 6.4%
Caucasian 80% 79.4% 75.6% 74.1% 71.88% 72.2%
Hawaiian/ Pacific Islander 0.7% 0.6% 1.0% 0.9% 1.14% 0.92%
Hispanic 8% 8% 10.1% 10.6% 11.3% 10.8%
Other 0.8% 1.3% 1.6% 1.8% 2.11% 2.4%
Unknown 2.1% 1.9% 1.3% 1.7% 1.81% 1.6%
2017 – 18 Fact Sheets Physical Therapist Assistant Education Programs
17 Student to Faculty Ratio & Workload
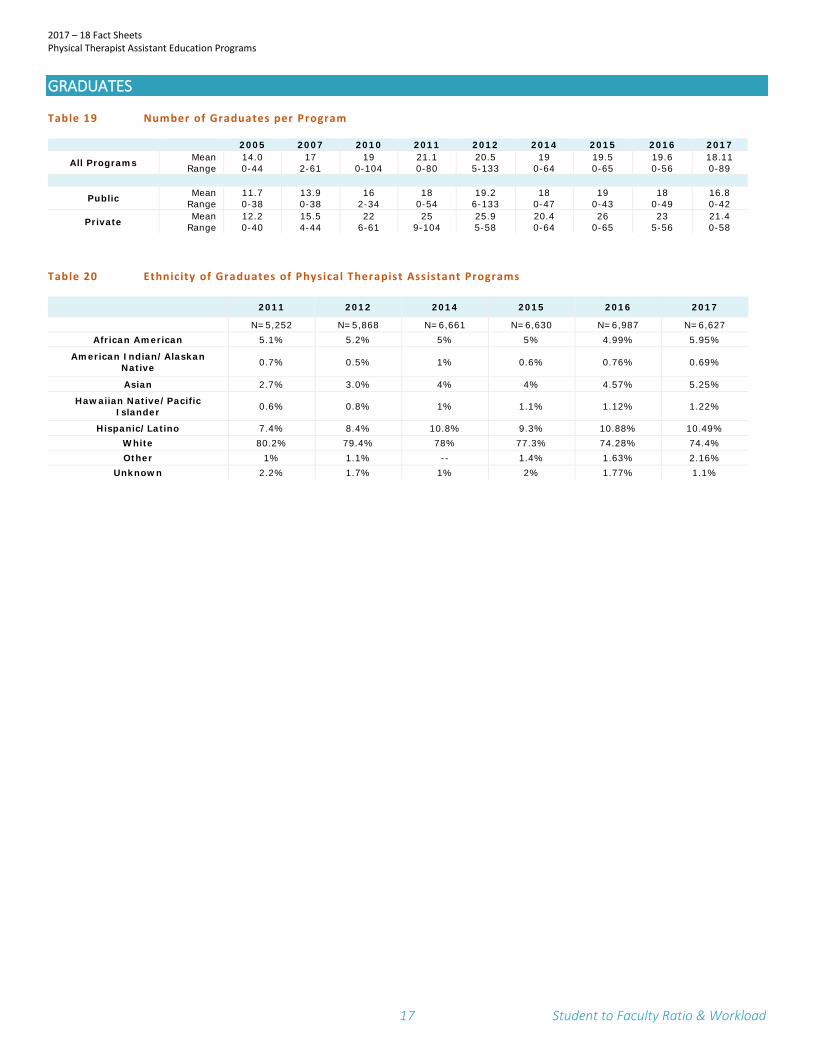
GRADUATES Table 19 Number of Graduates per Program
2005 2007 2010 2011 2012 2014 2015 2016 2017
All Programs Mean Range
14.0 0-44
17 2-61
19 0-104
21.1 0-80
20.5 5-133
19 0-64
19.5 0-65
19.6 0-56
18.11 0-89
Public Mean Range
11.7 0-38
13.9 0-38
16 2-34
18 0-54
19.2 6-133
18 0-47
19 0-43
18 0-49
16.8 0-42
Private Mean Range
12.2 0-40
15.5 4-44
22 6-61
25 9-104
25.9 5-58
20.4 0-64
26 0-65
23 5-56
21.4 0-58
Table 20 Ethnicity of Graduates of Physical Therapist Assistant Programs
2011 2012 2014 2015 2016 2017
N=5,252 N=5,868 N=6,661 N=6,630 N=6,987 N=6,627 African American 5.1% 5.2% 5% 5% 4.99% 5.95%
American Indian/Alaskan Native 0.7% 0.5% 1% 0.6% 0.76% 0.69%
Asian 2.7% 3.0% 4% 4% 4.57% 5.25%
Hawaiian Native/Pacific Islander 0.6% 0.8% 1% 1.1% 1.12% 1.22%
Hispanic/Latino 7.4% 8.4% 10.8% 9.3% 10.88% 10.49% White 80.2% 79.4% 78% 77.3% 74.28% 74.4% Other 1% 1.1% -- 1.4% 1.63% 2.16%
Unknown 2.2% 1.7% 1% 2% 1.77% 1.1%
2017 – 18 Fact Sheets Physical Therapist Assistant Education Programs
18 Student to Faculty Ratio & Workload
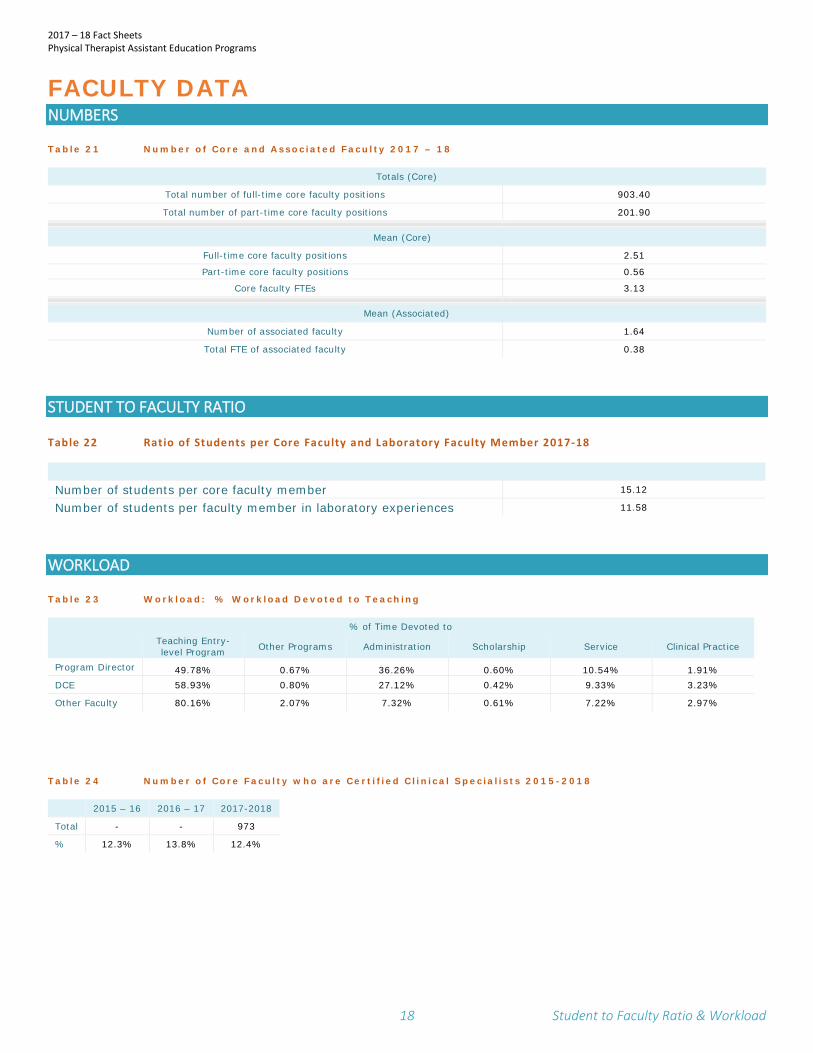
FACULTY DATA NUMBERS Table 21 Number of Core and Associated Faculty 2017 – 18
Totals (Core)
Total number of full-time core faculty positions 903.40
Total number of part-time core faculty positions 201.90
Mean (Core)
Full-time core faculty positions 2.51
Part-time core faculty positions 0.56
Core faculty FTEs 3.13
Mean (Associated)
Number of associated faculty 1.64
Total FTE of associated faculty 0.38
STUDENT TO FACULTY RATIO Table 22 Ratio of Students per Core Faculty and Laboratory Faculty Member 2017-18
Number of students per core faculty member 15.12
Number of students per faculty member in laboratory experiences 11.58
WORKLOAD Table 23 Workload: % Workload Devoted to Teaching
% of Time Devoted to
Teaching Entry-level Program Other Programs Administration Scholarship Service Clinical Practice
Program Director 49.78% 0.67% 36.26% 0.60% 10.54% 1.91% DCE 58.93% 0.80% 27.12% 0.42% 9.33% 3.23%
Other Faculty 80.16% 2.07% 7.32% 0.61% 7.22% 2.97%
Table 24 Number of Core Faculty who are Certified Clinical Specialists 2015-2018
2015 – 16 2016 – 17 2017-2018
Total - - 973
% 12.3% 13.8% 12.4%
2017 – 18 Fact Sheets Physical Therapist Assistant Education Programs
19 Salary
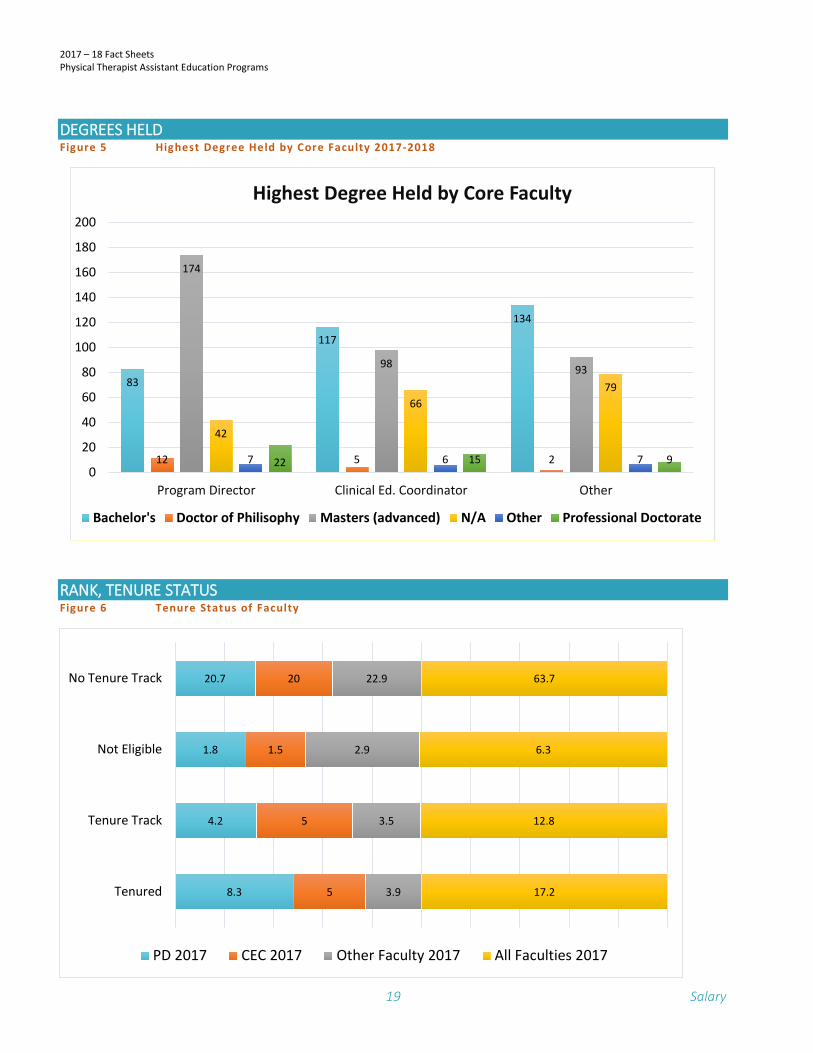
DEGREES HELD Figure 5 Highest Degree Held by Core Faculty 2017-2018
RANK, TENURE STATUS Figure 6 Tenure Status of Faculty
83
117
134
12 5 2
174
98 93
42
6679
7 6 722 15 90
20
40
60
80
100
120
140
160
180
200
Program Director Clinical Ed. Coordinator Other
Highest Degree Held by Core Faculty
Bachelor's Doctor of Philisophy Masters (advanced) N/A Other Professional Doctorate
8.3
4.2
1.8
20.7
5
5
1.5
20
3.9
3.5
2.9
22.9
17.2
12.8
6.3
63.7
Tenured
Tenure Track
Not Eligible
No Tenure Track
PD 2017 CEC 2017 Other Faculty 2017 All Faculties 2017
2017 – 18 Fact Sheets Physical Therapist Assistant Education Programs
20 Salary
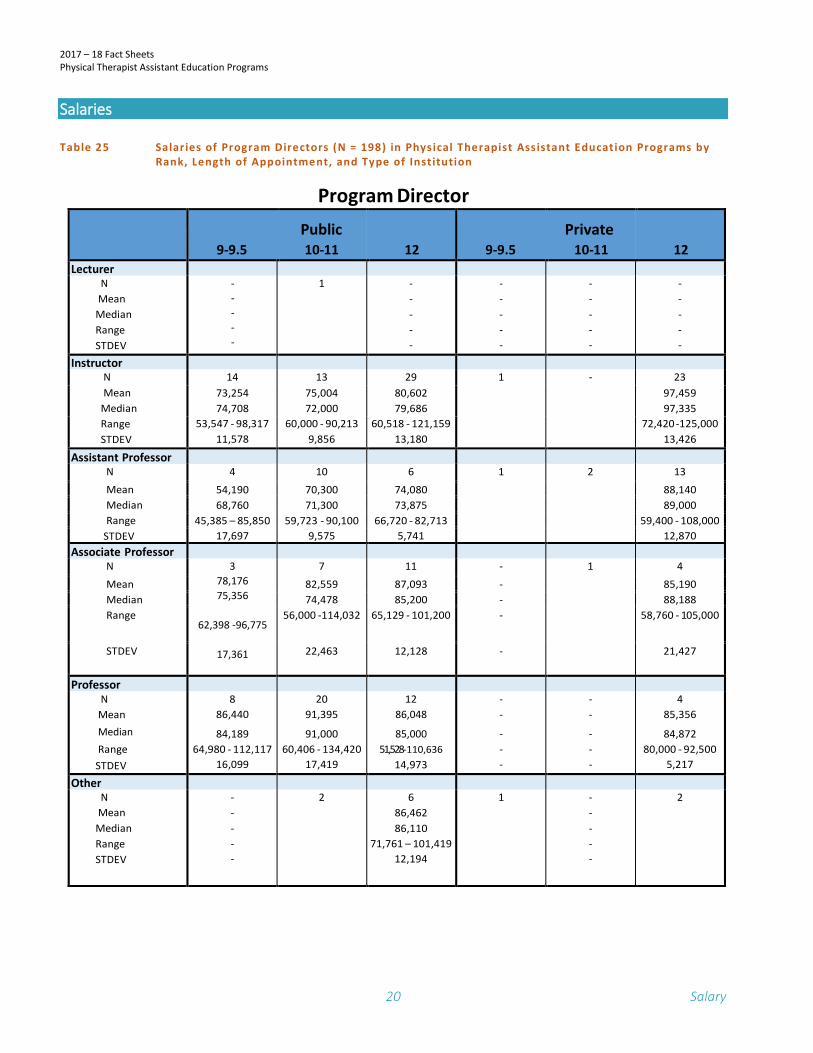
Salaries
Table 25 Salar ies of Program Directors (N = 198) in Physical Therapist Assistant Education Programs by Rank, Length of Appointment, and Type of Institution
Program Director
9-9.5
Public 10-11
12
9-9.5
Private 10-11
12 Lecturer
N Mean Median Range STDEV
- - - - -
1
- - - - -
- - - - -
- - - - -
- - - - -
Instructor N 14 13 29 1 -
23 Mean 73,254 75,004 80,602 97,459
Median 74,708 72,000 79,686 97,335 Range 53,547 - 98,317 60,000 - 90,213 60,518 - 121,159 72,420 -125,000 STDEV 11,578 9,856 13,180 13,426
Assistant Professor N 4 10 6 1 2 13 Mean 54,190 70,300 74,080 88,140 Median 68,760 71,300 73,875 89,000 Range 45,385 – 85,850 59,723 - 90,100 66,720 - 82,713 59,400 - 108,000
STDEV 17,697 9,575 5,741 12,870 Associate Professor
N 3 78,176 75,356
62,398 -96,775
17,361
7 11 - 1 4 Mean 82,559 87,093 - 85,190 Median 74,478 85,200 - 88,188 Range 56,000 -114,032 65,129 - 101,200 - 58,760 - 105,000
STDEV 22,463 12,128 - 21,427
Professor N
Mean Median Range STDEV
8 86,440
84,189 64,980 - 112,117
16,099
20 91,395
91,000 60,406 - 134,420
17,419
12 86,048
85,000 51,528-110,636
14,973
- -
- - -
- -
- - -
4 85,356
84,872 80,000 - 92,500
5,217 Other
N Mean Median Range STDEV
- - - - -
2 6 86,462 86,110
71,761 – 101,419 12,194
1 - - - - -
2
2017 – 18 Fact Sheets Physical Therapist Assistant Education Programs
21 Salary
Salaries
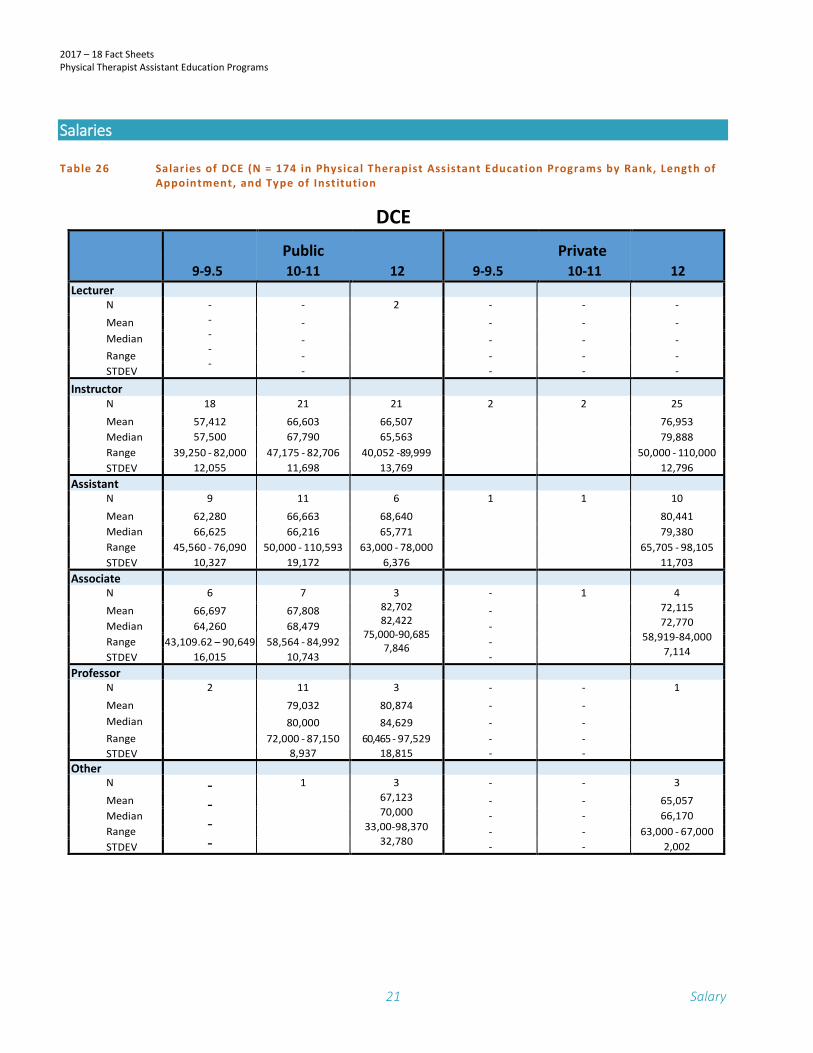
Table 26 Salar ies of DCE (N = 174 in Physical Therapist Assistant Education Programs by Rank, Length of Appointment, and Type of Institution
DCE
9-9.5
Public 10-11
12
9-9.5
Private 10-11
12 Lecturer
N - - - - -
- 2 - - - Mean - - - - Median - - - - Range - - - - STDEV - - - -
Instructor N 18 21 21 2 2 25 Mean 57,412 66,603 66,507 76,953 Median 57,500 67,790 65,563 79,888 Range 39,250 - 82,000 47,175 - 82,706 40,052 -89,999 50,000 - 110,000 STDEV 12,055 11,698 13,769 12,796
Assistant
N 9 11 6 1 1 10 Mean 62,280 66,663 68,640 80,441 Median 66,625 66,216 65,771 79,380 Range 45,560 - 76,090 50,000 - 110,593 63,000 - 78,000 65,705 - 98,105 STDEV 10,327 19,172 6,376 11,703
Associate
N 6 7 3
82,702 82,422
75,000-90,685 7,846
- 1 4 72,115 72,770
58,919-84,000 7,114
Mean 66,697 67,808 - Median 64,260 68,479 - Range 43,109.62 – 90,649 58,564 - 84,992 - STDEV 16,015 10,743 -
Professor N 2 11 3 - - 1 Mean 79,032 80,874 - - Median 80,000 84,629 - - Range 72,000 - 87,150 60,465 - 97,529 - - STDEV 8,937 18,815 - -
Other N -
- - -
1 3 67,123 70,000
33,00-98,370 32,780
- - 3 Mean - - 65,057 Median - - 66,170 Range - - 63,000 - 67,000 STDEV - - 2,002
2017 – 18 Fact Sheets Physical Therapist Assistant Education Programs
22 Salary
Salaries
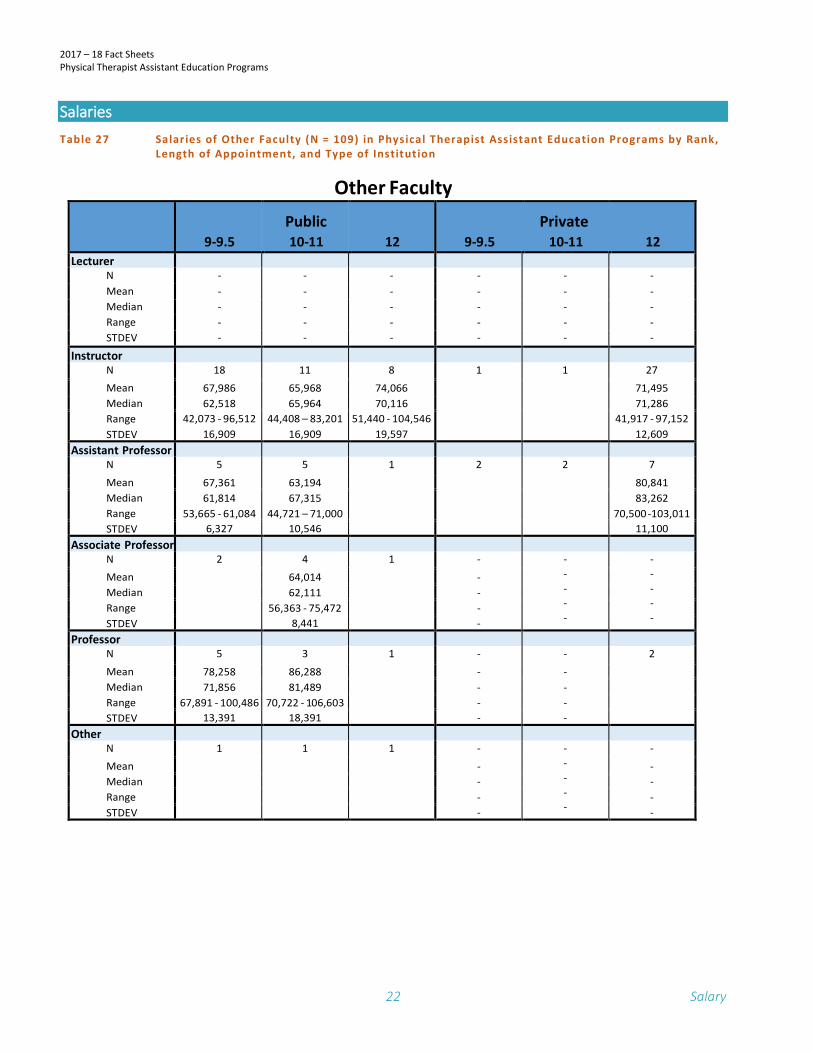
Table 27 Salar ies of Other Faculty (N = 109) in Physical Therapist Assistant Education Programs by Rank, Length of Appointment, and Type of Institution
Other Faculty
9-9.5
Public 10-11
12
9-9.5
Private 10-11
12 Lecturer
N - - - - - - Mean - - - - - - Median - - - - - - Range - - - - - - STDEV - - - - - -
Instructor N 18 11 8 1 1
27 Mean 67,986 65,968 74,066 71,495 Median 62,518 65,964 70,116 71,286 Range 42,073 - 96,512 44,408 – 83,201 51,440 - 104,546 41,917 - 97,152 STDEV 16,909 16,909 19,597 12,609
Assistant Professor N 5 5 1 2 2 7 Mean 67,361 63,194 80,841 Median 61,814 67,315 83,262 Range 53,665 - 61,084 44,721 – 71,000 70,500 -103,011 STDEV 6,327 10,546 11,100
Associate Professor N 2
4 1 - - - - - -
- - - - -
Mean 64,014 - Median 62,111 - Range 56,363 - 75,472 - STDEV 8,441 -
Professor N 5 3 1 - - 2 Mean 78,258 86,288 - - Median 71,856 81,489 - - Range 67,891 - 100,486 70,722 - 106,603 - - STDEV 13,391 18,391 - -
Other N 1 1 1 - -
- - - -
- Mean - - Median - - Range - - STDEV - -


