
Aggregation and UptakeKinetics of Gold Nanoparticles
in Biological Cells, UsingPlasmon Coupling and ImageCorrelation Spectroscopy
A thesis submitted for the degree of
Doctor of Philosophy
by
A S M Mohsin
Centre for Micro - Photonics
Faculty of Science, Engineering and Technology
Swinburne University of Technology
Melbourne, Australia
Supervisor: A/P James Chon
2015

For my parents, family and friends.
This would not have been possible without you.
2

“And your Lord has decreed that you not worship except Him, and to
parents, good treatment. Whether one or both of them reach old age [while]
with you, say not to them [so much as], ‘uff,’ [i.e., an expression of irritation
or disapproval] and do not repel them but speak to them a noble word. And
lower to them the wing of humility out of mercy and say, ‘My Lord, have
mercy upon them as they brought me up [when I was] small.’” [Qur’an:
Chapter 17, Verses 23 - 24]
3

Declaration
I, A S M Mohsin, declare that this thesis entitled :
“Aggregation and Uptake Kinetics of Gold Nanoparticles in Bio-
logical Cells, Using Plasmon Coupling and Image Correlation
Spectroscopy”
is my own work and has not been submitted previously, in whole or in part,
in respect of any other academic award.
A S M Mohsin
Centre for Micro - Photonics
Faculty of Science Engineering and Technology
Swinburne University of Technology
Australia
Dated this day, December 04, 2015
i

ii

Abstract
Just imagine the world is out of focus, with no option of putting on glasses.
That is precisely the frustrating situation for scientists wanting to observe
molecules and living cells under optical microscopes. Anything smaller than
200 nm (objects ~200 times smaller than the width of a single human hair)
looks blurry. Abbe’s (1873) theoretical limit of resolution is about half the
wavelength of the light used, which translates to about 200 nm for visible
light. Thus, the shape of bacteria (1 µm) and mitochondria (200 nm) can be
seen, but not the internal structures. But can resolution be improved?
Recently, gold nanoparticles (AuNPs) have gained enormous interest, partly
due to their distinctive optical properties. The anisotropic shape of AuNPs
offers longitudinal and transverse surface plasmon resonance (SPR) in infrared,
and strong light absorption and plasmon coupling properties make them great
candidates for use in sensing, labelling and imaging. Although considerable
work has been done on the functionalisation of plasmonic nanoparticles
(PNPs), PNPs uptake and cytotoxicity and the qualitative and quantitative
uptake of PNPs, molecular aggregation has still not been demonstrated.
Inductively coupled plasma atomic emission (ICP - AEP) and inductively
coupled plasma mass spectroscopy (ICP - MS), together with transmission
electron microscopy (TEM), can quantify AuNPs uptake, but are not suitable
for live cell imaging due to their destructive nature. Several microscopy
iii

techniques have been used to investigate molecular activity at sub - microscopic
resolution without destroying cells, but each method has limitations. For
example, image correlation microscopy (ICM) can characterise larger protein
assemblies, but is limited to sub - microscopic levels and is highly sensitive to
background interference. Similarly, nanoparticle plasmon coupling can provide
a microscopic but not macroscopic view of cellular interactions.
The aim of this PhD was to develop a technique to quantify the uptake and
aggregation of AuNPs using image correlation spectroscopy (ICS). We pro-
posed a non - destructive microscopic optical method using image correlation
spectroscopy (ICS) together with plasmon coupling. The combination of these
techniques provides an indication of what is happening within cells, both at
the microscopic and macroscopic level. After successful demonstrations of H
- ICS under experimental conditions (i.e. dielectric samples), we quantified
AuNPs uptake and aggregation of AuNPs inside human cervical carcinoma
(HeLa) cells. Hence, my original contribution to knowledge is developing a
technique that can detect PNPs uptake kinetics and aggregation dynamics in
a live cellular environment. This technique could be used in different biological
applications including cancer therapy, drug delivery, disease diagnosis and also
for probing membrane protein stoichiometry and dynamics. Although visual
resolution itself may not be improved, the ability to ‘see’ inside cells may be
enhanced by the use of the methods discovered here.
iv

Acknowledgements
I would like to express my gratitude to my supervisor, Assoc. Prof. James
Chon, for his valuable expertise, experience and guidance and giving me the
opportunity to tackle this challenging project, and the support to finish it.
I would like to thank my co - supervisor, Prof. Saulius Juodkazis, for his
guidance and support. I would also like to thank to Assoc. Prof. Andrew
Clayton for his suggestions, guidance and fruitful discussions.
I would like to thank Dr. Adam Taylor for his support with synthesising
AuNPs, how to deal with femtosecond laser and constructive criticism. Thanks
also to Tim Chow for his support with synthesis, lab induction and high order
image correlation spectroscopy (H - ICS) simulation code. Thanks Bio 21 and
Swinburne Nanolab for use of the transmission electron microscopy (TEM) and
scanning electron microscopy (SEM) facilities. I would also like to thank Ms.
Pierrette Michaux for electron beam microscopy (EBL) fabricating a custom -
made grid and helping me perform the tedious SEM for correlating the optical
images. Thanks also to Dr. Chiara Paviolo, Katharine Adcroft, De Ming
Zhu and Matthew Quinn for training me in various methods and equipment.
I would like to thank Barbara Gillespie, Swinburne Research and Swinburne
Information Technology service (ITS). Thanks Dr. Priyamvada Venugopalan
for encouragement, and for guiding me to write my thesis on Lyx. Thanks
also to Arif, Salman, Zubaidah, Ali, Ivylo, Amit and Yala for discussions and
sharing equipment, and to all the students and members of centre for micro
v

photonics (CMP) for providing such a wonderful research environment.
Finally, I would like to thank my parents for believing in me and supporting
me through this journey. I would like to thank my elder brother Dr. A. K. M
Momin and A. N. M Mamun, who have inspired and supported me. I would
like to thank my elder sister Parveen Akther, her husband Abdul Malek Sarkar,
my sister in law Shahana Rahman and my other brothers and sisters. I would
also like to thank my nieces especially Fatema and Tanzima and nephews
Riad and Rifat for their support, love and best wishes. Last but not the least,
I would like to thank Momel, Kazi, Dr. Imran, Sayem, Maruf, Dr. Ayaz,
Dr. Zia, Dr. Tanveer, Dr. Razib, Dr. Imrul, Wasim, Ifat, Nidi Apu, Dr.
Seemin, Shirin Apu, Dana Apu, Dr. Nazia and Dr. Urmi and the “Swinburne
Bangladeshi Community” for providing a friendly and homely environment in
Melbourne. My work would not have been possible without all of the support
that I received from those around me. This thesis is dedicated to all of you.
A S M Mohsin
Melbourne, Australia
4th December, 2015
vi

Contents
Declaration i
Abstract iii
Acknowledgements v
Contents vii
List of Tables xi
List of Figures xii
1 Introduction 1
1.1 Introduction of plasmonic nanoparticles in biological cell applic-
ations . . . . . . . . . . . . . . . . . . . . . . . . . . . . . . . . 1
1.2 Application of plasmonic nanoparticles in biology . . . . . . . . 3
1.2.1 Light - scattering imaging . . . . . . . . . . . . . . . . . 3
1.2.2 Refractive index sensing . . . . . . . . . . . . . . . . . . 4
1.2.3 Assembly based sensing . . . . . . . . . . . . . . . . . . 4
1.2.4 Inter - particle coupling effects . . . . . . . . . . . . . . . 5
1.2.5 Gold plasmonic nanoparticle - cell interaction . . . . . . 6
1.3 Gold nanoparticle preparation . . . . . . . . . . . . . . . . . . . 13
1.3.1 Wet chemical synthesis . . . . . . . . . . . . . . . . . . . 14
1.3.2 Gold nanoparticle surface modification . . . . . . . . . . 17
1.4 Aim and methodology of this thesis . . . . . . . . . . . . . . . 18
vii

1.4.1 Specific aim . . . . . . . . . . . . . . . . . . . . . . . . . 18
1.4.2 Methodologies . . . . . . . . . . . . . . . . . . . . . . . . 19
1.4.3 This thesis . . . . . . . . . . . . . . . . . . . . . . . . . . 21
2 Theory and simulations of surface plasmon resonance and
plasmon coupling 25
2.1 Abstract . . . . . . . . . . . . . . . . . . . . . . . . . . . . . . . 25
2.2 Introduction . . . . . . . . . . . . . . . . . . . . . . . . . . . . . 26
2.3 Theory of surface plasmon resonance . . . . . . . . . . . . . . . 26
2.4 Theory of surface plasmon resonance of metallic nanoparticles . 27
2.4.1 Extinction of light by a nanosphere . . . . . . . . . . . . 28
2.4.2 Extinction of light by a nanorod . . . . . . . . . . . . . 33
2.5 Basics mathematical and physical formalism behind finite dif-
ference time domain (FDTD) technique . . . . . . . . . . . . . . 36
2.5.1 Simulation setup . . . . . . . . . . . . . . . . . . . . . . 39
2.6 Finite difference time domain (FDTD) simulations of standalone
particles . . . . . . . . . . . . . . . . . . . . . . . . . . . . . . . 41
2.6.1 Finite difference time domain (FDTD) simulations of
gold nanospheres and nanorods . . . . . . . . . . . . . . 41
2.6.2 Quantum yield variation due to tip curvature . . . . . . 44
2.7 Finite difference time domain (FDTD) simulations of coupled
nanoparticles . . . . . . . . . . . . . . . . . . . . . . . . . . . . 46
2.7.1 Dipolar excitation coupling model and plasmon ruler
equation . . . . . . . . . . . . . . . . . . . . . . . . . . . 46
2.7.2 Numerical simulation of gold nanosphere dimer . . . . . 53
2.7.3 Numerical simulation of gold nanorod dimer . . . . . . . 55
2.7.4 Numerical simulation of gold nanosphere trimer . . . . . 57
2.7.5 Numerical simulation of gold heterodimer nanorod . . . . 57
2.8 Quantum yield of gold nanoparticles . . . . . . . . . . . . . . . 59
viii

2.9 Conclusion . . . . . . . . . . . . . . . . . . . . . . . . . . . . . . 60
3 Theory and simulations of image correlation spectroscopy 61
3.1 Abstract . . . . . . . . . . . . . . . . . . . . . . . . . . . . . . . 61
3.2 Introduction . . . . . . . . . . . . . . . . . . . . . . . . . . . . . 61
3.3 Image correlation spectroscopy (ICS) . . . . . . . . . . . . . . . 62
3.4 High order image correlation spectroscopy (H - ICS) . . . . . . . 64
3.4.1 Interpreting high order image correlation spectroscopy
(H - ICS) for plasmon coupled particles . . . . . . . . . . 67
3.5 Factors affecting precision of image correlation spectroscopy (ICS) 68
3.6 High order image correlation spectroscopy (H - ICS) simulations 69
3.7 Conclusion . . . . . . . . . . . . . . . . . . . . . . . . . . . . . . 74
4 Image correlation spectroscopy of plasmon coupled gold
nanoparticles into dielectric medium 75
4.1 Abstract . . . . . . . . . . . . . . . . . . . . . . . . . . . . . . . 75
4.2 Introduction . . . . . . . . . . . . . . . . . . . . . . . . . . . . 75
4.3 Nanoparticle plasmon coupling and simulations . . . . . . . . . 77
4.4 High order image correlation spectroscopy (H - ICS) of plasmon
coupled nanoparticles . . . . . . . . . . . . . . . . . . . . . . . 79
4.5 Experimental . . . . . . . . . . . . . . . . . . . . . . . . . . . . 80
4.5.1 Sample preparation . . . . . . . . . . . . . . . . . . . . . 80
4.5.2 Grid fabrication . . . . . . . . . . . . . . . . . . . . . . . 81
4.6 Results and discussion . . . . . . . . . . . . . . . . . . . . . . . 81
4.6.1 High order image correlation spectroscopy (H - ICS) for
plasmon coupled dielectric samples . . . . . . . . . . . . 82
4.6.2 Validating high order image correlation spectroscopy (H
- ICS) results using single particle spectroscopy . . . . . 89
4.7 Conclusion . . . . . . . . . . . . . . . . . . . . . . . . . . . . . . 91
ix

5 Gold nanoparticle uptake and aggregation dynamics in HeLa
cells using image correlation spectroscopy 93
5.1 Abstract . . . . . . . . . . . . . . . . . . . . . . . . . . . . . . . 93
5.2 Introduction . . . . . . . . . . . . . . . . . . . . . . . . . . . . 94
5.3 High order image correlation spectroscopy (H - ICS) of plasmon
coupled nanoparticles . . . . . . . . . . . . . . . . . . . . . . . . 95
5.4 Surface modified AuNPs - HeLa cell sample preparation . . . . . 97
5.5 Experimental results . . . . . . . . . . . . . . . . . . . . . . . . 101
5.5.1 High order image correlation spectroscopy (H - ICS) for
gold nanoparticle incubated HeLa cell images . . . . . . 101
5.5.2 Gold nanoparticle uptake due to surface modification . . 105
5.5.3 Gold nanoparticle oligomerisation due to surface modi-
fication . . . . . . . . . . . . . . . . . . . . . . . . . . . 109
5.5.4 Effect of size on gold nanoparticle uptake . . . . . . . . 110
5.5.5 Effect of size on gold nanoparticle oligomerisation . . . . 111
5.6 Discussion . . . . . . . . . . . . . . . . . . . . . . . . . . . . . . 112
5.7 Conclusion . . . . . . . . . . . . . . . . . . . . . . . . . . . . . . 117
6 Conclusions and future work 119
6.1 Thesis conclusions . . . . . . . . . . . . . . . . . . . . . . . . . . 119
6.2 Future research . . . . . . . . . . . . . . . . . . . . . . . . . . . 121
6.2.1 More than two emitter . . . . . . . . . . . . . . . . . . . 121
6.2.2 Validation by other techniques . . . . . . . . . . . . . . . 124
6.3 Conclusions . . . . . . . . . . . . . . . . . . . . . . . . . . . . . 126
Bibliography 127
x

List of Tables
1.1 Effect of size and shape of gold nanoparticles (AuNPs) on
endoctytosis.[76] . . . . . . . . . . . . . . . . . . . . . . . . . . 10
2.1 Comparison of longitudinal surface plasmon resonance (LSPR)
and scattering cross - sections (Scat.CS) of different particle
morphologies for aspect ratio (AR) 2, length 40 nm PNPs,
calculated via FDTD simulations. . . . . . . . . . . . . . . . . 43
5.1 UV - vis spectrum peak (nm), size distribution (nm) and pH
for bare, PEG and maleimide coated 50 nm, 80 nm and 100
nm diameter gold nanosphere (AuNS). Here, 1 represents the
measured value 2 and 3 represents company supplied values. . . 97
5.2 Zeta potential, mobility and pH for bare, PEG and maleimide
coated 100 nm diameter AuNSs. . . . . . . . . . . . . . . . . . . 98
xi

List of Figures
1.1 (A) Transmission electron microscope (TEM) images of wet
chemically synthesised gold nanospheres (AuNSs) (diameter
80 ± 6.5 nm) after drop - casting onto a TEM grid, (B)
corresponding histogram showing size distribution. . . . . . . . . 14
1.2 (A) Transmission electron microscope (TEM) images of wet
chemically synthesised gold nanorods (AuNRs) (aspect ratio
3.8) after drop - casting onto a TEM grid, (B) corresponding
histogram showing size distribution. . . . . . . . . . . . . . . . . 15
1.3 Chemical structure of citrate, polyethylene glycol (PEG) and
maleimide. (adopted from wikipedia) . . . . . . . . . . . . . . . 16
2.1 (A) Schematics for plasmon oscillation for a sphere, (B)surface
plasmon resonance (SPR) spectrum of 40 nm radius gold
nanospheres calculated using Mie theory [129], refractive index
1.33. . . . . . . . . . . . . . . . . . . . . . . . . . . . . . . . . . 27
xii

2.2 Surface plasmon resonance (SPR) spectrum of nanorods with
semi major axis 43 nm and semi minor axis 10 nm calculated
using Mie - Gans theory, [129] refractive index 1.33. While
gold nanospheres show one SPR band in the visible region, gold
nanorods show two bands: a strong longitudinal band in the
near infrared region corresponding to electron oscillation along
the long axis and a weak transverse band, similar to that of
gold nanospheres in the visible region corresponding to electron
oscillations along the short axis. . . . . . . . . . . . . . . . . . . 28
2.3 (A) Experimental measurement from Johnson and Christy for
the dielectric function of gold, showing real and imaginary parts
of the dielectric constant. [142] (B) Variation of extinction cross
- section spectra predicted by Mie theory [129] for 10 nm radius
gold nanospheres, immersed in a media with various refractive
indices (C) Variation in the extinction cross - section spectra
predicted by Mie theory [129] for gold nanospheres of various
radii immersed in a media with a refractive index n = 1.33. . . . 30
2.4 Standard Yee - cell. The electric field components are located
on the edges while the magnetic field components are located
on the face centres. Figure taken from Wikipedia. [156] . . . . . 38
2.5 Layout editor of finite difference time domain (FDTD) sim-
ulation for plasmonic nanoparticles (PNPs) structure. The
yellow rectangular box is the total field, the white rectangular
box is the total - field scattered field source and outer yellow
rectangular box is the scattered field. The pink arrow shows
the direction of propagation, k vector. The blue dot represents
the direction of the electric field . . . . . . . . . . . . . . . . . . 39
xiii

2.6 Extinction, absorption and scattering cross - sections calculated
via Mie theory [129] compared with finite difference time domain
(FDTD) simulations for, (A) 10 nm radius gold nanospheres and
(B) 20 nm radius gold nanospheres. . . . . . . . . . . . . . . . . 41
2.7 (A) Scattering cross - sections of 5 - 100 nm radius gold
nanospheres calculated via Mie theory compared with finite
difference time domain (FDTD) simulations, (B) longitudinal
surface plasmon resonance (LSPR) of 5 - 100 nm radius gold
nanospheres calculated via Mie theory compared with finite
difference time domain (FDTD) simulations. . . . . . . . . . . . 42
2.8 Schematics of different particle morphologies under considera-
tion including, (A) a prolate spheroid, (B) a spherically capped
cylinder, (C) an ellipsoidally capped cylinder and (D) a cylinder. 44
2.9 Scattering cross - sections of different morphology nanoparticles
for aspect ratio (AR) 2, length 40 nm refractive index 1.33 and
mesh size 1 nm using FDTD simulations. . . . . . . . . . . . . . 45
2.10 Finite difference time domain (FDTD) simulations of gold, (A)
dumbbell, (B) nanorods and (C) bipyramids. . . . . . . . . . . . 45
2.11 Scattering cross - sections (per unit volume) of spheres (SPs),
dumbbells (DBs), nanorods (NRs) and bipyramids (BPs) using
FDTD calculations. . . . . . . . . . . . . . . . . . . . . . . . . . 47
2.12 Schematic of the energy level splitting resulting from the dipolar
interaction of AuNR dimer, showing symmetric (ψ+) and anti
- symmetric coupling (ψ−) of excitons for (A) H aggregate geo-
metry and (B) J aggregate geometry. (C) Exciton theory picture
of the nature of the coupled longitudinal plasmon excitation in
AuNRs dimers: electromagnetic analogy to molecular orbital
theory. [160] . . . . . . . . . . . . . . . . . . . . . . . . . . . . 50
xiv

2.13 Plasmon coupling of nanoparticle at (A) weak and (B) strong
coupling regime, (C) the energy level splitting resulting from
the dipolar coupling of dimers, showing symmetric and anti -
symmetric coupling for AuNS dimer. [171] . . . . . . . . . . . . 51
2.14 Finite difference time domain (FDTD) simulation results of
20 nm radius gold nanosphere dimer plasmon coupling. (A)
scattering spectrum and (B) plasmon resonance peak shift as a
function of inter - particle separations. . . . . . . . . . . . . . . 52
2.15 Finite difference time domain (FDTD) simulation results of
40 nm radius gold nanosphere dimer plasmon coupling. (A)
Scattering spectrum and (B) Plasmon resonance peak shift as
a function of inter - particle separations. . . . . . . . . . . . . . 53
2.16 Finite difference time domain (FDTD) simulation results of gold
nanorod dimer plasmon coupling. (A) scattering spectrum of
rod for length 75 nm, width 20 nm, aspect ratio (AR) 3.8 and
(B) plasmon resonance peak shift as a function of inter - particle
separations. . . . . . . . . . . . . . . . . . . . . . . . . . . . . . 55
2.17 Finite difference time domain (FDTD) simulation results of gold
nanorod dimer plasmon coupling. (A) scattering spectrum of
rod for length 43 nm, width 10 nm, aspect ratio (AR) 4.3 and
(B) plasmon resonance peak shift as a function of inter - particle
separations. . . . . . . . . . . . . . . . . . . . . . . . . . . . . . 56
2.18 Finite difference time domain (FDTD) simulation results of gold
nano - sphere trimer plasmon coupling. (A) scattering spectrum
of a sphere - trimer with a diameter of 40 nm for different inter
- particle distances for weakly coupling regimes compared with
monomer and dimer and (B) plasmon resonance peak shift as a
function of inter - particle separations. . . . . . . . . . . . . . . 57
xv

2.19 Finite difference time domain (FDTD) simulation results of
gold nanorod hetero dimer plasmon coupling. (A) Scattering
of hetero dimer (spherically capped) rod having AR 4.3, length
43 nm, width 10 nm and AR 3.8, length 75 nm, width 20 nm
and (B) Au nanorod dimers peak wavelengths are shown for
different inter - particle distances. . . . . . . . . . . . . . . . . 58
2.20 Scattering quantum yield (QY) ratio of clusters and monomers
of gold nanospheres (AuNS ) (80 nm diameter) . . . . . . . . . . 60
3.1 Autocorrelation of an image. . . . . . . . . . . . . . . . . . . . 63
3.2 High order image correlation spectroscopy (H - ICS) correlation
functions. Autocorrelation of squared and cubed images and
corresponding high order correlation function. . . . . . . . . . . 65
3.3 Finite difference time domain simulations and quantum yield of
80 nm diameter gold nanosphere (AuNSs), (A) scattering cross
- sections of 80 nm diameter AuNS at different separation and
(B) quantum yield with respect to separation/diameter. . . . . 66
3.4 Simulated confocal laser scattering microscopy images (CLSM)
containing monomer and dimer mixture. . . . . . . . . . . . . . 68
3.5 Typical confocal laser scattering point spread function profile
from single particles (blue) and dimer (black). Red colour
spectrum indicate analytical point spread function using Vec-
torial Debye theory for objective 1.4 NA, at 715 nm wavelength
for circular polarisation. Debye theory [183] can be used
to calculate the diffraction pattern of an objective of high
numerical aperture. . . . . . . . . . . . . . . . . . . . . . . . . 70
3.6 High - order image correlation spectroscopy (H - ICS) simulation
results. The plots show the (A)N1, (B)N2 and (C) Alpha of the
simulated sample without background noise. Each data point
is averaged by analysis of 500 images. . . . . . . . . . . . . . . 72
xvi

3.7 High order image correlation spectroscopy (H - ICS) simulation
results. The plots show the (A) N1, (B)N2 and (C) Alpha of
the simulated sample with signal to noise ratio (SNR) = 3 0,
and the e - radius of the diameters is 1.2 times of that of the
monomers. Each data point is averaged by analysis of 500 images. 73
3.8 (A) Dark - field scattering images for AuNS incubated human
cervical carcinoma (HeLa) cell samples, (B) selected noise loca-
tion for high - order image correlation spectroscopy simulations,
(C) recorded noise images in high - order image correlation
spectroscopy (H - ICS) simulations and (D) recorded AuNS
attached HeLa cell images with noise correction in high order
image correlation spectroscopy (H - ICS) simulations. . . . . . . 73
4.1 (A) Transmission electron microscope (TEM) images of gold
nanoparticles (AuNSs) dropcasted onto a TEM grid, and (B)
dimer separation histogram, showing 75% of dimers are within
10% of separation of diameter. . . . . . . . . . . . . . . . . . . . 78
4.2 Gold nanoparticle (AuNP) characterisation: UV- vis spectra of
bare gold nanosphere (AuNS) of diameter 80 nm compared with
Mie theory and FDTD simulations. The UV- vis spectrum is
the ensemble spectra and red shifted compared with Mie theory
and FDTD calculated for single particle spectra. . . . . . . . . . 80
4.3 Grid fabrication: (A) scanning electron microscope (SEM)
images of magnified grid location, (B) SEM images of fabricated
full grid. . . . . . . . . . . . . . . . . . . . . . . . . . . . . . . . 82
4.4 Schematic diagram of laser scattering confocal set up. . . . . . . 83
xvii

4.5 Correlation of optical and SEM/TEM images of 80 nm gold
nano - sphere. (A) confocal scattering images for low concen-
tration samples and (B) corresponding correlated SEM images;
(C) confocal scattering images for high concentration samples,
and (D) corresponding un - correlated (same location) TEM
images. scale bar = 4µm. . . . . . . . . . . . . . . . . . . . . . 84
4.6 Low concentration sample :- The number of gold nanoparticles
in aggregated samples was calculated using H - ICS and the
real number. (A) calculated average monomer number <N1>
per beam area, (B) average dimer number per beam area (N2),
(C) quantum yield α2 and (D) percentage of oligomers for the
selected images (A - F represent six different locations). The
error bar represents standard error. Each data point is an
average from analysis of 20 images. . . . . . . . . . . . . . . . . 85
4.7 High concentration sample :- The number of gold nanoparticles
in aggregated samples was calculated using H - ICS and the
real number. (A) average monomer number per beam area, (B)
average dimer number per beam area N2, (C) quantum yield α2
and (D) percentage of oligomers for the selected images (A - G
represent seven different locations) and E) comparison of SEM
and H - ICS dimer numbers. Thye error bar represents standard
error. Each data point is an average from analysis of 20 images. 86
4.8 Error distributions for N1, N2 and α2 among 100 cases of
images considering the contribution of monomers and high -
order clusters (e.g. trimers and tetramers). The distribution of
error varied from 0% to - 30 % due to the presence of high -
order clusters. . . . . . . . . . . . . . . . . . . . . . . . . . . . 88
xviii

4.9 Error distributions for N1, N2 and α2 among 100 cases of images
considering monomer and dimer contribution. Discarding the
contribution of high order cluster (e.g. trimers, tetramers), only
considering the contribution of monomers and dimers, the error
can be reduced to 10 % , and the accuracy of the H - ICS analysis
can be improved. . . . . . . . . . . . . . . . . . . . . . . . . . . 88
4.10 (A) Intensity variation due to polarisation sensitivity (00-1800).
Experimental values for dimer one and two extracted from
polarisation dependent images for 00-1800, fit perfectly with
cosine, showing cos2 dependency and (B) dimer spectrum
extracted from wavelength dependent images from 700 - 900
nm wavelength matches with FDTD simulated AuNS dimer
spectrum of 2 nm separation. . . . . . . . . . . . . . . . . . . . 89
4.11 Dimer number calculated using polarization spectroscopy and H
- ICS technique and compared with the dimer number extracted
from SEM images. . . . . . . . . . . . . . . . . . . . . . . . . . 90
5.1 Gold nanoparticle characterisation: UV - vis spectra of bare,
PEG and maleimide coated AuNSs of diameter, (A) 50 nm (B)
80 nm and (C) 100 nm. . . . . . . . . . . . . . . . . . . . . . . . 96
5.2 Schematic diagram of dark field microscopy set up. . . . . . . . 99
5.3 Dark - field scattering images of 50 nm diameter bare gold nano
sphere for different incubation times. . . . . . . . . . . . . . . . 100
5.4 Dark - field scattering images of 80 nm diameter maleimide
coated gold nano - spheres for different incubation times. . . . 102
5.5 Dark - field scattering images of 100 nm diameters PEG coated
gold nano - spheres for different incubation times. . . . . . . . 103
5.6 Dark - field scattering images of 80 nm diameter bare, PEG and
maleimide coated gold nano - spheres for two days incubation. . 105
xix

5.7 Cellular uptake and aggregation kinetics of 50 nm diameter
gold nanoparticles (AuNPs) as a function of incubation time
for different surface modified gold nanospheres (AuNSs). (A) H
- ICS extracted monomer number per beam area, (B) H - ICS
extracted oligomer (mostly dimer) number per beam area, (C)
H - ICS extracted quantum yield, (D) cellular uptake of gold
nanoparticles (AuNPs) and ( E) percentage of oligomers. . . . . 106
5.8 Cellular uptake and aggregation kinetics of 80 nm diameter
gold nanoparticles (AuNPs) as a function of incubation time
for different surface modified gold nanospheres (AuNSs). (A) H
- ICS extracted monomer number per beam area, (B) H - ICS
extracted oligomer (mostly dimer) number per beam area, (C)
H - ICS extracted quantum yield, (D) cellular uptake of gold
nanoparticles (AuNPs) and ( E) percentage of oligomers. . . . . 107
5.9 Cellular uptake and aggregation kinetics of 100 nm diameter
gold nanoparticle (AuNPs) as a function of incubation time for
different surface modified gold nanospheres (AuNSs). (A) H -
ICS extracted monomer number per beam area, (B) H - ICS
extracted oligomer (mostly dimer) number per beam area, (C)
H - ICS extracted quantum yield, (D) cellular uptake of AuNPs
and ( E) percentage of oligomers. . . . . . . . . . . . . . . . . . 108
5.10 Effect of size on (different surface modified) gold nanoparticle
uptake for different incubation times. . . . . . . . . . . . . . . . 111
5.11 Effect of size on (different surface modified) gold nanoparticle
oligomerisation for different incubation times. . . . . . . . . . . 112
xx

6.1 (A) Wet chemically synthesised gold nanorods (AuNRs) drop-
casted onto a transmission electron microscope (TEM) grid.
Histograms displaying the distribution of (B) aspect ratio (red),
and (C) length (green) and width (red). Measurements were
taken from transmission electron microscope (TEM) images,
using the fit ellipse option in ImageJ, with hand fit ellipses,
to avoid threshold errors. . . . . . . . . . . . . . . . . . . . . . . 122
6.2 Confocal laser scattering, gold nanoparticle internalised cell
images. Cell membrane was stained by dye molecules, clearly
visible (red color borders) in the confocal images and inter-
nalised gold nanosphere was also clearly visible (green color
particles) while excited by laser source. Scale bar represents
15 µm. . . . . . . . . . . . . . . . . . . . . . . . . . . . . . . . 125
xxi

Chapter 1
Introduction
1.1 Introduction of plasmonic nanoparticles in
biological cell applications
Plasmonic nanoparticles (PNPs) exhibit excellent optical properties such as
remarkable absorption, scattering, tunability in the visible to near infrared
regions due to size, shape, orientation and tip geometry. Most importantly they
do not blink or bleach like quantum dot or dyes, offering unlimited lifetime.
These properties have enabled the use of PNPs in biological application
including biological imaging, [1–6] biolabelling and sensing [7], photothermal
cancer therapy, [8, 9] drug and gene delivery [7, 10] and probing membrane
protein. [11, 12]
However, PNP - cell interaction is poorly understood at single particle level.
Previous works were mostly focused on functionalisation of PNPs, PNPs
uptake and cytotoxicity. [13–20] Research on interactions of PNPs due to
functionalisation or different surface modification is also lacking. Qualitative
and quantitative study of PNP uptake, molecular aggregation and cellular
1

Chapter 1 2
movement with respect to size, shape, incubation time [14], surface effect
[15] and nanoparticle aggregation effects [16] have not been demonstrated
methodically.
To quantify the PNP uptake, several indirect measurements such as inductively
coupled plasma atomic emission (ICP - AEP) or inductively coupled plasma
mass spectroscopy (ICP - MS) have been performed along with destructive
transmission electron microscopy (TEM) analysis. The available method could
not quantify in - situ gold nanoparticle (AuNP) uptake and interaction due
to their destructive nature not being suited to live cell imaging. The non -
destructive techniques, such as image correlation spectroscopy combined with
dark - field scattering microscopy are ideal for characterisation purposes but
have not been introduced for plasmonic nanoparticles.
Recently, nanoparticle plasmon coupling has been introduced to investigate the
interparticle distance between two micromolecules utlising the plasmon ruler,
on the basis of spectral shift due to coupling of two gold nanospheres (AuNS).
[21–25] This tool has been used for probing membrane proteins on cell surface
receptors, [26] to follow receptor trafficking [3] and to detect aggregation of
PNPs inside cells through receptor trafficking. As a methodology, plasmon
coupling provides a microscopic view of the interaction in these applications,
but there is no macroscopic view of the interaction available at the cellular size
regime (~ 10 µm image scale). So it becomes a necessity to develop a tool that
can quantify PNP uptake and aggregation and provide the microscopic and
macroscopic view of interactions at the cellular size regime. To address this
challenging task, we combined the plasmon coupling technique with image
correlation spectroscopy. Plasmon coupling provide information on local
interactions of PNPs between two interacting molecules at the microscopic
level while the image correlation spectroscopy (ICS) tells us what is happening
at the cellular size regime providing a microscopic picture. In this work, we

Chapter 1 3
studied the feasibility of applying the combined methods (ICS and NP plasmon
coupling) to quantify PNPs uptake and aggregation dynamics for different
functionalised PNPs as a function of size and incubation time into human
cervical carcinoma (HeLa) cells.
1.2 Application of plasmonic nanoparticles in
biology
1.2.1 Light - scattering imaging
Plasmonic AuNPs scatter light strongly at the surface plasmon resonance
(SPR) frequency. [27] A 40 nm gold nanoparticle (AuNP) offers a scattering
cross - section five orders of magnitude larger than typical dye molecules. [28]
Most importantly, they are photostable and do not blink or bleach like dye
molecules. [27] Their sizes are comparable to biological systems, which is why
they are very promising for optical imaging, allowing biological labelling with
high spatial resolution. [29, 30] Furthermore, AuNPs can be conjugated with
specific targeting molecules such as proteins, antibodies, antigens and DNA
for providing molecular specific resolutions. Strong surface plasmon resonance
(SPR) scattering allows us to use much simpler and less expensive techniques
such as dark - field scattering, whereas most of the imaging techniques require
lasers and sophisticated experimental setups. [5, 31] On the other hand, in
a dark - field setup, the optical microscope is equipped with a dark - field
condenser and a microscope lense. The AuNPs are excited by white light
sources and broad spectrums are collected using a spectrogram and imaged
using a charge coupled device (CCD). Cancer cells can be identified by AuNPs
conjugated with anti - epidermal growth factor receptor (EGFR) antibodies to
target the cancer cells. [5] Depending on the disease, biomarkers of targeted

Chapter 1 4
molecules, the targeting ligand can be chosen and conjugated to a variety of
proteins, antibodies and small molecules. [32]
1.2.2 Refractive index sensing
Surface plasmons of AuNPs are heavily dependent on the refractive index of
the medium. This property becomes helpful for optical sensing of chemical
and bimolecular analytes. [33–37] The adsorption or bindings of molecules to
the AuNP surface induces refractive index change followed by a shift of surface
plasmon resonance. By following the shift of surface plasmon resonance either
red shift for increasing the refractive index or blue shift for decreasing refractive
index it is possible to sense the changes in the environment of PNPs.
In order to sense the presence of particular chemical or biological species,
AuNPs should be conjugated with recognition molecules which specifically
bind to the target molecules at the AuNP surface. The refractive index change
depends on number of molecules bound per particle, the molar mass of the
molecules, and their proximity to PNP surface and refractive index/dielectric
properties of molecules relative to the medium in which AuNPs are dispersed.
Mulvaney and co - workers reported a 40 nm shift for 0.1 refractive index
change in liquid media for gold nanorods (AuNRs) of aspect ratio 3, which is
six times higher than gold nanosphere (AuNS) sensitivity. [38, 39]
1.2.3 Assembly based sensing
The dependence of the nanoparticle plasmon resonance on the presence of
other PNPs in close proximity has been utilised for the sensing of biomolecules.
Mirkin and co - workers [21] first showed this by using a biomolecular event
where AuNPs were conjugated with DNA strands and by observing the spectral

Chapter 1 5
shift of the solution from 520 nm to 560 nm red shift, a colour change of red to
purple resulted from the assembly. This assembly - based sensing strategy has
been introduced for detection of antibody - antigen interactions and of specific
disease biomarkers (e.g. prostate cancer). [29]
1.2.4 Inter - particle coupling effects
When AuNPs come into close proximity, there is a dramatic change in surface
plasmon resonance due to the coupling of plasmon oscillations of interacting
particles. [40–47] When the light polarisation direction is parallel to the
inter - particle axis, the SPR is red shifted, due to strongly attractive inter -
particle interactions. Conversely, when the light is polarised orthogonal to the
inter - particle axis, the plasmon spectrum is blue shifted with respect to the
single particle case, due to repulsive inter - particle interactions. [48, 49] This
phenomenon has been used for probing receptor trafficking, where cell receptors
outside the cell interact with membrane proteins and being internalised can
be observed by attaching AuNPs. Indeed, that whole process can be observed
by attaching AuNPs, their aggregation state detected by a change of colour
or change of plasmon spectrum due to plasmon coupling. [3] A similar result
was reported by Reinhard [24] in 2011, in which they looked specifically at the
membrane proteins on the surface of the cells. The interaction of receptors on
the cell surface was probed by attaching PNPs and observing colour change
due to plasmon coupling. Considering that the field has become extremely
broad, specific attention is given to AuNS and cell interaction. Discussion
about the factors affecting AuNP uptake and interaction, and techniques to
investigate this uptake and interaction provides background to assist,critical
analysis of the results. A brief section about PNPs synthesis, specific research
aims and methodology to achieve the proposed aims follows afterwards.

Chapter 1 6
1.2.5 Gold plasmonic nanoparticle - cell interaction
Understanding of PNP - cell interaction at the single particle level is
poor. Previous studies mostly focused on AuNP uptake, cytotoxicity and
aggregation. Qualitative and quantitative study of PNP uptake, molecular
aggregation with respect to size, shape and incubation time has not been
demonstrated systematically.
A previous study [14] suggests that, AuNP uptake and interaction depends on
AuNP size and shape however PNP surface modification such as PEG (poly-
ethylene glycol), PAA (poly acrylic acid), PAH (poly allylamine hydrochloride)
and maleimide etc. or functionalisation (e.g.- protein, DNA) significantly
affects their interactions. [50]
In pioneering work on AuNP uptake due to size by Chan and co - workers
[14] for 14 nm , 50 nm and 74 nm diameter AuNSs, the most efficient uptake
was reported for 50 nm diameter AuNS. In addition, Jiang and co - workers
[51] reported minimal uptake for 25 - 50 nm (among 2, 10, 25, 40, 50, 70, 80
and 90 nm) transferrin coated AuNSs, attached to HeLa cells, quantified by
transmission electron microscope (TEM) and laser capture microdissection
(LCM). Wang and co - workers [52] reported maximal uptake for 45 nm
(among 45, 70 and 100 nm) AuNSs attached to HeLa cells using TEM and
dark - field microscopy. Chithrani and co - workers [53] suggested one possible
reason for minimal uptake for optimal size reporting that, 50 nm spherical
particles require minimal time to wrap around spheres, which increases AuNP
uptake compared with other diameters, in agreement with previously reported
thermodynamic calculations. [54]
Gold nanoparticle uptake due to shape was also reported by Chan and co
- workers [14] in 2006, for 14 nm , 50 nm and 74 nm diameter AuNSs and
40×14 nm and 74×14 nm AuNRs and most efficient uptake was reported

Chapter 1 7
for 50 nm diameter AuNSs. Hence, AuNR uptake was 3 and 6 fold less
for 40×14 nm and 74×14 nm AuNRs respectively. In both of these cases
AuNP uptake was quantitatively measured by ICP - AES. Another possible
reason could be, a difference in curvature of differently - shaped nanoparticles.
Rod - shaped nanoparticles can have larger contact area with cell membrane
receptors than the spherical nanoparticles when the longitudinal axis of
the rods interacts with the receptors. This could reduce the number of
available receptor sites for binding, hence reduce the uptake. The elongated
particles (AuNRs) requires greater membrane wrapping time compared with
spherical AuNSs. Another reason for AuNP uptake could be the amount of
cetyltrimethylammonium bromide (CTAB) surfactant molecules adsorbed onto
the rod - shaped nanoparticle surface during synthesis. Due to presence of
CTAB on the surface of AuNPs, the serum protein may not be able to bind
efficiently onto the gold nanoparticle surface. This would affect the uptake of
the nanoparticles. Size and shape effects of AuNPs on endocytosis are shown
in Table.1.1.
Surface charge influences PNP uptake and cytotoxicity. Since most cells (either
cancerous or normal) seem to have negative surface charge, they offer greater
permeability for cationic particles. Generally, we cannot say cationic charge
remains as such in vivo. As serum or other proteins/NH2 acids adsorb to the
PNP surface, the surface charge is altereds. On the other hand, positively
charged PNPs (CTAB coated NRs) have greater cytotoxicity than negatively
charged NPs (citrate coated NSs), but become nontoxic after being coated
with polymer biomolecules [55–57] such as PAA, PAH, maleimide or PEG. [15,
56–58] Also most negatively charged or neutral PNPs undergo non - specific
adsorption of the particles on the cell membrane.
Recently, uptake of mesoporous spherical silica particles was demonstrated by
Slowing and co - workers [59] and they observed highest uptake for positively

Chapter 1 8
charged particles. Similar trends are evident with nanorods. Alkilany and co -
workers [13] performed a systematic study of AuNRs (18× 40 nm) for varying
concentration with and without serum protein (medium). For both cases, they
observed that, negatively charged poly (4 - styrenesulfonic acid) (PSS) AuNRs
exhibited the lowest uptake at all concentrations, while nanorods coated in
PSS followed by a layer of positively charged poly - diallyldimethylammonium
chloride (PDADMAC) exhibited the highest uptake. A possible explanation
for the higher uptake could be electrostatic interactions between positively
charged nanorods and negatively charged cell membranes of HeLa cells. [59]
Arnida and co - workers [60, 61] compared the uptake of bare and PEG coated
NSs (30, 50, 90 nm diameter) with PEG coated NRs (3×10nm, 45×10 nm)
for PC-3 and RAW 2647 cells. Through TEM and ICP - MS analysis they
reported most efficient uptake for 50 nm non - PEGlated NSs. PEGlated NR
uptake was worse than for nanospheres.
Several studies suggest there is a general trend for cellular uptake relating to
surface charge, but absolute quantification of uptake mostly depends on the
chemistry of the molecule (functional group) adsorbed onto the AuNP surfaces.
Alkilany and co - workers [13] reported molecules containing quaternary
amine (e.g. CTAB and PDADMAC) exhibit high uptake, whereas molecules
containing primary amine (e.g. PAH) exhibit lower uptake. On the other
hand, a negatively charged sulfate group (PSS), shows very low uptake. These
results indicate that functional group can influence uptake, although further
evaluation is needed on a whole array of functional groups (e.g., alcohols,
carboxylic acids) before a definitive answer is obtained.
Generally, serum proteins (bovine serum) from biological media (DMEM)
adsorb to the AuNR surface slightly increasing the size of AuNPs and
altering the surface charge of AuNPs of negative BSA (bovine serum albumin)
regardless of initial AuNR surface charge. A previous study suggested that,

Chapter 1 9
[14] AuNP uptake is receptor mediated due to the presence of serum protein in
the medium. Citrate - stabilised AuNPs contains a variety of serum proteins,
hence transferrin contains two corresponding receptors [62]. Therefore citrate
- stabilised AuNPs show three times greater uptake than transferrin - coated
nanoparticles. We can conclude that, initial surface charge of PNPs is not a
simple predictor of PNP uptake and cytotoxicity; however, PNP uptake and
cytotoxicity are governed by type of adsorbed protein and their orientation on
the PNPs surface via receptor mediated endocytosis. [63, 64]
Uptake of PNPs due to different functionalisation has been also reported in
the literature. Villanueva and co - workers [65] studied the uptake of iron
oxide nanoparticles functionalised with differently charged carbohydrates in
human cervical carcinoma (HeLa) cells and observed no uptake for neutral
NPs; however, they also observed uptake of negatively charged PNPs through
nonspecific binding. In another study, the negatively charged NPs had
most efficient uptake than positively charged NPs for cerium oxide NPs, in
adenocarcinoma lung cells [66]. Ryman - Rasmussen and co - workers [50]
reported the internalisation of different surface coated quantum dot (QD)
ellipsoid NPs into skin cells in the following order: QD- COOH > QD-NH2 >
QD - PEG.
In another study, cell membrane barrier breaches were dependent on both the
type of ligand and the arrangement of the ligand. More efficient breaching
has been observed for ribbon - like arrangements than random arrangements
on the surface. [77] Plasmonic nanoparticle interactions with oligonucleotide
(peptide or protein coated) have been studied for negatively charged PNPs
on endothelial cells and the most efficient PNP uptake has been observed
despite the negatively charged PNPs for larger density of oligonucleotides on
the PNP surfaces. In addition to oligonucleotides, synthesised PNPs could be
conjugated with positively charged biological motifs for efficient internalisation

Chapter 1 10
AuN
Ptype
andsiz
eObservedeff
ects
NSs
of14
,30,50
,74an
d10
0nm
NRsof
40×
14an
d74×
14nm
[14]
Max
imal
uptake
occu
rsfor50
nmNSs
NSs
of14
,30,50
,74an
d10
0nm
NRsof
40×
14an
d74×
14nm
[53]
Uptak
ede
pend
son
sizean
dshap
eNSs
of2,
10,2
5,40
,50,
70,8
0an
d90
nm[51]
Max
imal
uptake
occu
rsfor25
-50nm
NSs
NSs
of13
and45
nm[67]
Max
imal
uptake
occu
rsfor45
nmNSs
NSs
of45
,70an
d11
0nm
[52]
Max
imal
uptake
for45
nmNSs
NSs
of10
,20,
30an
d45
nm[68]
Max
imal
uptake
occu
rsfor30
nmNSs
NSs
of5,10
,20,
30,4
0an
d50
nm[69]
Max
imal
uptake
occu
rsfor20
nmNSs
NSs
of4,
12an
d17
nm[70]
Endo
cytosis
increase
with
increasin
gdiam
eter
NSs
of10
,25an
d50
nm[71]
Endo
cytosis
increase
with
increasin
gdiam
eter
NSs
of7,
21an
d31
nm[72]
Endo
cytosis
increase
with
increasin
gdiam
eter
NSs
of25
and50
nm[73]
Endo
cytosis
increase
with
increasin
gdiam
eter
NSs
of2,
6,an
d15
nm[74]
Max
imal
uptake
occu
rsfor2nm
NSs
NSs
of50
and51
00nm
[75]
Max
imal
uptake
occu
rsfor50
nmNSs
Table 1.1 Effect of size and shape of gold nanoparticles (AuNPs) on endoctytosis.[76]

Chapter 1 11
similar to positively charged functionalised PNPs. [78–85]
Nevertheless, it has been reported that most other nanoscale macromolecules
and molecular assemblies are internalised through the process called endo-
cytosis. [63] Endocytosis is a process by which PNPs are engulfed by a cell,
which forms vesicles of invaginated portions of plasma membrane. Endocytosis
can be classified as phagocytosis, pinocytosis or clathrin - dependent and
independent receptor mediated endocytosis. Among these, receptor mediated
endocytosis is considered to be the most effective mechanism for PNPs uptake.
Banjeri and Hayes [86] suggested an endocytic pathway for cellular AuNP
uptake through the lipid bilayer, although Xia [87] and Taylor [88] have shown
that nonendosomal AuNP uptake is possible in principle. Endocytic fate and
intracellular uptake mechanisms of PNPs have been shown before. [89] After
being taken up, PNP - protein complexes are transported to lysosomes by
vesicles where CTAB is released and proteins are digested. After that, the PNP
(e.g. nanorod) aggregates are delivered to the mitochondria which are damaged
by the release of CTAB, inducing cell apoptosis and death. Cytotoxicity effect
could be minimised by coating the PNPs with an inert polymer, which would
enable lysosomal enzyme digestion.
Gao and co - workers [54] proposed a theoretical model for understanding the
receptor mediated endocytosis for spherical and cylindrical PNPs based on
energetic analysis, which was originally developed by Freund and Lin. [90]
Their study suggested that, PNPs can enter the cell via wrapping even in
the absence of clathrin or caveolin coats and the shortest wrapping time is
observed for optimal particle size. They also deduced a threshold particle
radius of about 15 and 30 nm respectively for a cylindrical and spherical
particle below which endocytosis would never happen, which is in agreement
with experimental observations by Aoyama and co - workers. [91] Decuzzi and
Ferrari [92] modified the original formula proposed by Gao and co - workers

Chapter 1 12
[54] including the contribution of non - specific interactions.
In another study, it has been shown theoretically that, depending on particle
size and membrane - particle interaction (either attractive or repulsive),
curves towards larger particles or curves away from adsorption layers of
small particles. [93] A similar study showed that, attractive interaction and
aggregation of small PNPs on the cell membrane will decrease the minimal
size of particles whereas nonspecific repulsive interactions will increase the
minimal size for effective uptake. [94] Yuan and co - workers [95] presented
a thermodynamic model providing a phase diagram in which they elucidate
uptake efficiency with particle size and density of ligands expressed on the
particle surface. From their model, they predicted the most efficient uptake
for high ligand density for PNPs of radius 25 - 30 nm. Recently, Li [96]
developed a thermodynamic theoretical model to explain the size and shape
effect of cigarlike and spherical NPs on endocytosis which suggests a minimal
NP radius exists that would overcome the thermodynamic energy barrier for
endocytosis. More recently, Dobay and co - workers [97] proposed stochastic
pi calculus, a widely - used process algebra, to simulate PNP uptake and
intracellular distributions.
Gold nanoparticle uptake quantification methods are still in their infancy,
with destructive electron microscopy together with inductively coupled plasma
atomic emission (ICP - AEP) or inductively coupled plasma mass spectroscopy
(ICP - MS). These two methods estimate the number of particles in a sample
measuring the mass of particles per unit volume without the aid of any
labels, by relying only on the properties of the particles themselves. [98] The
drawback of ICP - AEP and ICP - MS is that they require sophisticated sample
preparation procedures that are strongly dependent on instrument calibration
and show as large scatter of data within one set of samples. [99] TEM analysis
could provide high resolution images (nm scale) visualising the inner structures

Chapter 1 13
but could not be used for live cell imaging as it destroys cells. [100]
Plasmon coupling between pairs of nanospheres, nanorods, nanodiscs, and
nanoshells has been used to detect DNA - DNA, [101–103] DNA - protein, [104]
and protein - protein binary interactions. [105] Numerous researchers [21–25]
have utilised a plasmon ruler on the basis of spectral shift due to the coupling
of two AuNPs. Reinhard’s [26] group attached EGFR antibody conjugated
PNPs to EGFR protein expressing cells and probe the membrane protein onto
the cell surface utilising plasmon coupling properties of aggregations at the cell
surfaces. In a similar study, Sokolov’s group [3], attached PNPs to receptors
and specifically looked at cell signalling and follow the receptor trafficking
inside the cell using plasmon coupling.
As a methodology, plasmon coupling provides a microscopic view of the
interactions in these applications, but no macroscopic view of the interaction
is available at the cellular size regime (~ 10 µm image scale). To address
this issue, we proposed a non - destructive microscopic optical method, image
correlation spectroscopy, together with plasmon coupling. This combined
technique can provide both microscopic and macroscopic images, elucidating
local interactions and providing an idea of what is happening at the cellular
level.
1.3 Gold nanoparticle preparation
In order to attach AuNPs to HeLa cells, AuNP preparation technique must be
discussed. There are two techniques available; wet chemical synthesis and nano
- fabrication. Wet chemically prepared AuNPs are suitable for attachment
to different cells. For simplicity of preparation, functionalisation and optical
properties, we will mostly focus on AuNSs and their attachment to HeLa cells.
Chapter 1 14
(A) (B)
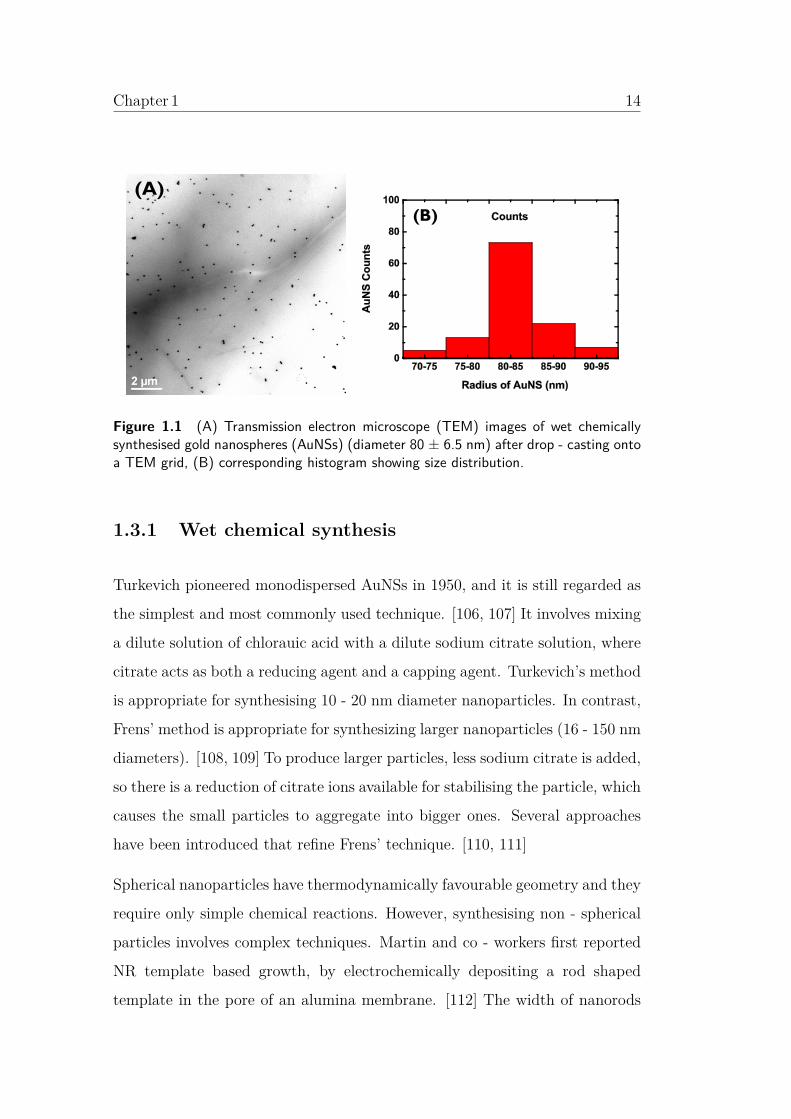
Figure 1.1 (A) Transmission electron microscope (TEM) images of wet chemicallysynthesised gold nanospheres (AuNSs) (diameter 80 ± 6.5 nm) after drop - casting ontoa TEM grid, (B) corresponding histogram showing size distribution.
1.3.1 Wet chemical synthesis
Turkevich pioneered monodispersed AuNSs in 1950, and it is still regarded as
the simplest and most commonly used technique. [106, 107] It involves mixing
a dilute solution of chlorauic acid with a dilute sodium citrate solution, where
citrate acts as both a reducing agent and a capping agent. Turkevich’s method
is appropriate for synthesising 10 - 20 nm diameter nanoparticles. In contrast,
Frens’ method is appropriate for synthesizing larger nanoparticles (16 - 150 nm
diameters). [108, 109] To produce larger particles, less sodium citrate is added,
so there is a reduction of citrate ions available for stabilising the particle, which
causes the small particles to aggregate into bigger ones. Several approaches
have been introduced that refine Frens’ technique. [110, 111]
Spherical nanoparticles have thermodynamically favourable geometry and they
require only simple chemical reactions. However, synthesising non - spherical
particles involves complex techniques. Martin and co - workers first reported
NR template based growth, by electrochemically depositing a rod shaped
template in the pore of an alumina membrane. [112] The width of nanorods

Chapter 1 15
(A) (B)
Figure 1.2 (A) Transmission electron microscope (TEM) images of wet chemicallysynthesised gold nanorods (AuNRs) (aspect ratio 3.8) after drop - casting onto a TEMgrid, (B) corresponding histogram showing size distribution.
can be controlled by the pore diameter of the aluminum membrane template
(e.g. 5 - 200 nm) and length can be controlled by varying the amount of
gold deposited thus the aspect ratio can be tuned. Rods of materials such as,
copper, silver and gold can be prepared offering only monolayers of rods. A
transmission electron microscope (TEM) image of synthesised AuNSs of 80 nm
diameter using this technique is shown in Figure.1.1.
Electrochemical growth of nanorods was first explored by Wang and co -
workers. [113, 114] The synthesis was conducted on a two electrode electro-
chemical cell, where a gold metal plate anode and platinum plate cathode were
immersed in an electrolytic solution consisting of cetyltrimethylammonium
bromide (CTAB) surfactant and tetradodecylammonium bromide (TOAB)
co - surfactant. Gold ions in the form of AuBr4+ produced from the gold
metal anode, then form complexes with the CTAB micelle and migrate to
the cathode, where gold ions are reduced to gold atoms. Then, to control
the aspect ratio of the nanorods a silver plate is gradually inserted into the
solution by the concentration and release rate of silver ions is produced from

Chapter 1 16
C6H5O73−
Citrate Polyethylene glycol
C2nH4n+2On+1
Maleimide H N o o
C4H3NO2
Figure 1.3 Chemical structure of citrate, polyethylene glycol (PEG) and maleimide.(adopted from wikipedia)
the redox reaction between the gold ion and the silver plate. To facilitate the
mixing of CTAB and TOAB and to assist the formation of rod - like CTAB
micelles, acetone and cyclohexane are added before electrolysis respectively.
CTAB forms a bilayer structure on the longitudinal surface of gold nanorods.
[115]
The method was further improved by Nikoobakht and co - workers, [116]
and Jana and co - workers, [114, 117, 118] who found an aqueous growth
solution containing dilute concentration of chloauric acid, ascorbic acid, silver
nitrate and a surfactant cetlytributly ammonium bromide (CTAB) formed
rod shaped micelles. Ascorbic acid is a weak reducing agent that can only
reduce Au (III) to Au (I) in the presence of high concentration of CTAB
at low pH (2.5) producing a single crystal seed structure. [114, 117, 118]
CTAB preferentially binds to {110} facets of Au crystals producing anisotropic
nanorods until reduction of all Au (I) in the solution resulting in non - Au
spherical nanorods. Addition of AgNO3 facilitates Au deposition in the correct
lattice sites, which leads to a wider distribution of geometries. [114, 119] By
varying the chloauric acid and silver nitrate concentration, the longitudinal
surface plasmon resonance (LSPR) wavelength of nanorods can be tuned
between 600 and 850 nm. Further, introducing a binary surfactant mixture
composed of CTAB and benzyldimethyl - hexadecyl - ammonium chloride
(BDAC) nanorods with an aspect ratio upto ~ 10 (LSPR :- 1300 nm) can
be produced. A TEM image of AuNRs synthesised using this technique with

Chapter 1 17
average aspect ratio 3.8 is shown in Figure.1.2
However, other shaped PNPs such as nanostars, [120, 121] bipyramids, [121,
122] dumbbells, [123] nanoplates [122] and nanotubes [124] can be produced
by changing the reaction conditions. To produce dumbbell, penta-twinned
[125] and bipyramid shape particles are produced respectively adding acetone
to their growth solution, citrate stabilised penta - twinned seeds instead of
single crystalline CTAB, or using cetyltributal ammonium bromide (CTBAB)
instead of CTAB.
1.3.2 Gold nanoparticle surface modification
The presence of surfactants (e.g. citrate for AuNSs and CTAB for AuNRs),
enhances the stability of AuNPs under aggressive conditions such as centri-
fugation and high ionic strength. Unfortunately, the strong binding of the
molecules to the gold surface makes surface hydrophobation difficult. [126]
Additionally, they induce cytotoxicity both in vitro and in vivo. To reduce
the cytotoxicity effect of AuNPs due to surfactance, AuNP surfaces can be
modified with additional coating (e.g. PEG, PAA, PAH, maleimide). The
coating material should be stable and chemically and physically inert. They
should be easily deposited on AuNP surfaces and coating thickness should
be controllable. Also, they should be nontoxic, bio - compatible and easily
modifiable with functional groups for further conjugation purposes. [127]
For example, PEG coating of AuNSs provides enhanced colloidal stability,
biocompatibility (due to the highly hydrophilic nature of PEG) and offers
reduced non - specific adsorption of molecules to particle surfaces. The
chemical structures of citrate, polyethylene glycol (PEG) and maleimide are
shown in Figure.1.3
After functionalisation AuNPs can be functionalised with biomolecules (e.g.

Chapter 1 18
DNA, proteins, antigens) by electrostatic adsorption, surface coating with
charged polymers, biofunctional ligand attachment or ligand exchange. [128]
These surface modifications can change the dielectric properties of the external
surface resulting in a shift of plasmon peak. These also influence the AuNP
uptake kinetics and aggregation dynamics. In this study, the focus is limited
to surface modified PNPs (e.g. bare, PEG and maleimide coated AuNSs) and
their consequences on aggregation and uptake, while incubated in HeLa cells.
1.4 Aim and methodology of this thesis
In this section, the specific aims of this thesis, potential research problems and
proposed techniques to achieve the intended goals will be discussed.
1.4.1 Specific aim
The aim of this PhD was study cell uptake and aggregation of gold nano-
particles (AuNPs) using image correlation spectroscopy (ICS). To accomplish
the proposed aim we divided the task into two major sections:- (1) in a
dielectric environment and (2) in a cellular environment.
The specific aim in the dielectric medium section was validating the use
of ICS on plasmon coupled AuNPs, cross - checking the number of AuNP,
with scanning electron microscope (SEM) images. In order to apply ICS for
plasmon coupled AuNPs, the quantum yield (QY) of AuNPs was extracted
using a numerical simulation called the finite - difference time - domain method
(FDTD), which can provide the scattering cross - section for different sizes and
shapes of AuNPs at particular separations for a specific excitation wavelength.
Integrating the whole spectrum over the visible to near - infrared regions, we
extracted the scattering of QY of AuNPs. This number was then used in high

Chapter 1 19
order image correlation spectroscopy (H - ICS) simulations to extract the total
particle number and to investigate aggregation details of coupled AuNPs. The
H - ICS simulated number was then compared with the number extracted
from correlated SEM images for the same location to verify the accuracy of
our method. This number was also compared with polarisation and wavelength
spectroscopy results.
After successful demonstrations of H - ICS in experimental condition, (i.e.
dielectric samples), we extended our tool to a cellular environment to explore
PNP cell interaction at the 10 - 100 µm cellular size regime. We investigated
the following for AuNPs incubated in HeLa cell samples:
• PNP uptake kinetics as a function of size, surface charge and incubation
time.
• PNP aggregation dynamics as a function of size, surface charge and
incubation time.
• The effect of PNP size on uptake and oligomerisation.
• The effect of PNP surface charge (e.g. PEG, maleimide coating) on PNP
uptake and oligomerisation.
To explore PNP aggregation and uptake kinetics, we proposed image correl-
ation spectroscopy (ICS) in conjunction with plasmon coupling. These two
proposed techniques will be discussed in the following sections.
1.4.2 Methodologies
Plasmon coupling of nanoparticles: The optical properties of AuNPs have
fascinated many scientists since ancient times. More recently, the topic has
continued to interest researchers, beginning with the developments of classical

Chapter 1 20
electromagnetic theory. Gustav Mie [129] deduced Maxwell’s equation to
explain the strong absorption of AuNS while illuminated under plane wave,
offering a rigorous scientific foundation for understanding these phenomena.
Recently, it was discovered that collective electronic oscillations, known as
surface plasmons, give rise to strong optical properties which has created
a considerable amount of interest in the scientific community. A more
dramatic optical property is the change in colour due to size, shape and
aggregation. Generally when gold (Au) or silver (Ag) NPs begin to aggregate,
they show shifts in the plasmon resonance compared with isolated particles.
To understand this phenomenon, sufficient knowledge of the electromagnetic
properties of interacting metallic nanoparticles at close proximity is required.
One of the simplest descriptions of this interaction is that of two nearby dipoles.
To deduce the interaction of two interacting molecules the magnitude of dipole
moments and inter - particle distance need to be defined, which is given by
V∝ P1P2r3 where P 1 and P 2 are the magnitude of dipole moments and r is the
inter - particle distance. For the case of AuNSs, the lower - energy resonance
corresponds to two longitudinally aligned dipoles, giving rise to red shifts in
the optical spectrum, whereas for the higher energy resonance, the coupled
dipoles cancel each other out resulting in a zero dipole moment. While for
the case of elongated and other shape or disordered nanoparticles, the dipole
- dipole interaction and red shift of spectrum are also visible but offer more
complexity. This property has been introduced in detection of nucleotides,
proteins and cells which leads to a wide range of assays and tests for medical
applications. [3, 21, 22, 26]
Exploring the plasmon coupling of different size, shape and orientation AuNPs
using FDTD simulation we can quantify the QY, which will be used in high
order image correlation spectroscopy (H - ICS) for studying the feasibility of
H - ICS for weakly coupled AuNPs.

Chapter 1 21
Image correlation spectroscopy (ICS) of plasmon coupled nano-
particles: Image correlation spectroscopy (ICS) is a characterisation method
for emitting species in random configuration which can provide the average
number of particles within a focal volume and aggregations details within an
image, by correlating the image with itself or its squared or cubed images. It is
a well known technique in cell biology and widely used to measure the transport
properties and cell membrane protein distribution in living cells. [22–24] It
has been used to investigate the organisation of supramolecular complexes
but has not been used for macromolecular complexes ofcoupled plasmonic
nanoparticles. [11, 22–24] There are a few issues that need to be resolved
for application of ICS for plasmon coupled samples embedded in a dielectric
medium. The quantum yield of PNPs drastically changes due to its size, shape,
orientation and distribution. Image correlation spectroscopy intrinsically does
not account for the distribution of quantum yield and orientation anisotropy
of the material. Therefore, we need to know the emission quantum yield
variation of plasmon coupled AuNPs. We explored the plasmon coupling effect
of AuNS dimers, trimers using numerical simulation, FDTD. Integrating the
whole spectrum over a range of 400 -100 nm, we extracted the quantum yield
for the plasmon coupled particles. This value will be used as an input to
investigate the feasibility of H - ICS for plasmon coupled AuNPs dispersed
in a polyvinyl alcohol (PVA) matrix. We will extract the total number of
particles and dimers within an image for weakly coupled AuNPs embedded in
a PVA matrix or incubated in HeLa cells.
1.4.3 This thesis
The presentation of this work has been divided into chapters - each of which
focuses on a specific portion of our aims of investigating oligomerisation in a
dielectric medium and cellular environment. The current chapter has focuseds

Chapter 1 22
on reviewing the factors affecting PNP uptake and aggregation, existing
techniques, identifying potential research problems, and finally suggesting
methodologies to address any issue and achieve intended goals.
In Chapter 2, we review the theoretical concepts of surface plasmon resonance
(SPR) and plasmon coupling. We perform the numerical simulation FDTD to
investigate the plasmon coupling effect of single AuNPs and dimers of several
sizes and shapes. These simulation results enable calculation of quantum
yield (QY) values, which can be used as an input for H - ICS to explore
the oligomerisation of plasmon coupled AuNPs in plasmonic random medium
(PRM) and cell samples.
In Chapter 3, we explore the H - ICS theory and simulation results. We
discuss important issues that need to be resolved to apply H - ICS for plasmon
coupled AuNPs. We present the simulation results of H - ICS which provide the
boundary conditions regarding concentration of emitters, quantum yield and
noise level, thus inferring when we can and cannot apply these techniques. We
finish this chapter explaining; how to interpret the quantum yield of plasmon
coupled AuNPs for this technique.
In Chapter 4, the feasibility of H - ICS for plasmon coupled nanoparticles
will be examined. We perform confocal laser scattering microscopy of the
PVA embedded plasmonic nanoparticle samples and perform H - ICS for the
acquired confocal laser scattering microscopy (CLSM) images. We extract
the total number of plasmonic nanoparticles and clusters for the acquired
images performing H - ICS simulations, and comparing these numbers with
the reference number extracted from correlated SEM images. These results
reveal, how accurately our proposed H - ICS tool performs under experimental
conditions. This technique will be then extended into a cellular environment
to explore AuNPs uptake and oligomerisation .

Chapter 1 23
In Chapter 5, we perform dark - field scattering microscopy and acquire the
PNPs internalised cell images. H - ICS is performed on acquired images to
extract the total number of particles and dimers. The simulated H - ICS results
are used to explore PNPs uptake and oligomerisation kinetics as a function of
size, surface charge and incubation time for different surface modified PNP
incubated HeLa cell images.
In Chapter 6, a conclusion to the study will be presented, including a summary
of the major achievements along with suggestions for future extensions of this
work.

Chapter 1 24

Chapter 2
Theory and simulations of
surface plasmon resonance and
plasmon coupling
2.1 Abstract
In this chapter, we present the analytical theory for metallic nanoparticles,
specifically for spherical and ellipsoidal AuNPs. Existing analytical models
- Mie theory and Mie Gans theory can only provide the analytical solution
for spherical and ellipsoidal AuNPs, but not other shapes. Due to a lack of
analytical models it becomes necessary to use available numerical simulation
techniques to gain further insight into their near field properties, particularly
quantum yield of PNPs of different sizes and shapes. To address this issue,
FDTD simulation has been introduced for standalone and coupled AuNPs,
describing basic mathematical and physics formalism behind the FDTD
algorithm and simulation setup. In addition, excitation coupling theory will be
presented to describe dipole - dipole interactions between two molecules. The
25

Chapter 2 26
FDTD simulation results will be helpful for extracting the quantum yield (QY)
of coupled AuNPs, to determine the aggregation state of AuNPs dispersed in
a PVA matrix or cellular environment.
2.2 Introduction
In this chapter, we discussed the underlying theory of surface plasmon reson-
ance, plasmon coupling and the plasmon ruler equation. FDTD simulation
results of standalone particles (e.g nanospheres, nanorods, bipyramids and
dumbbells) and coupled particles (e.g. AuNS dimers, AuNS trimers) are
presented. This simulation result will be utlised in ICS simulations discussed
in chapter 3, to investigate the oligomerisation of AuNPs in dielectric and
cellular environments.
2.3 Theory of surface plasmon resonance
Plasmonic nanoparticles are mediated by surface plasmons by localised surface
plasmon resonance (SPR), which is a charge density oscillations confined
to metallic nanoparticles embedded in dielectric media. [130–135] When
metal nanoparticles are much smaller than the wavelength of incident light,
the electromagnetic field can induce a resonance of free electrons across
the particle, known as surface plasmon resonance (SPR) (Figure.2.1.A).
The resonance wavelength strongly depends on the size, shape, and surface
composition of the particle, and the dielectric properties of the surrounding
medium.
Surface plasmons can have multiple energy bands depending on their geometry.
For a metallic nanosphere there is single energy band (Figure.2.1.B) but for

Chapter 2 27
(A) (B)
Figure 2.1 (A) Schematics for plasmon oscillation for a sphere, (B)surface plasmonresonance (SPR) spectrum of 40 nm radius gold nanospheres calculated using Mie theory[129], refractive index 1.33.
nanorods there are multiple energy bands (Figure.2.2) due to band splitting
into low and high energy bands. The high energy or transverse absorption
band (short axis) corresponds to electron oscillation perpendicular to the major
axis, while the low energy or longitudinal absorption band (long axis) results
from the oscillation of the electrons along the major axis (Figure.2.2). By
varying the aspect ratio, the longitudinal absorption can be made tunable in
the near infrared region (NIR), making the gold nanorods suitable for in vivo
applications. In the next section, we will review the underlying theory and
concepts of SPR.
2.4 Theory of surface plasmon resonance of
metallic nanoparticles
The spectrum of metallic nanoparticles depends on the size, shape and
environment of the surrounding particles. [130–135] Mie theory can give the
exact analytical solution of a sphere with an arbitrary shape, given that the
dielectric constants of the environments are known. [129, 136, 137] Gans theory
can give the analytic expression to calculate the spectra approximately for

Chapter 2 28
Figure 2.2 Surface plasmon resonance (SPR) spectrum of nanorods with semi majoraxis 43 nm and semi minor axis 10 nm calculated using Mie - Gans theory, [129]refractive index 1.33. While gold nanospheres show one SPR band in the visibleregion, gold nanorods show two bands: a strong longitudinal band in the near infraredregion corresponding to electron oscillation along the long axis and a weak transverseband, similar to that of gold nanospheres in the visible region corresponding to electronoscillations along the short axis.
rod shaped particles much smaller than the wavelength of light. [138–140]
Numerical approaches such as discrete dipole approximation (DDA), [141]
finite - difference time - domain (FDTD), or finite element calculations can
be used for other shapes. In this section, we will introduce the underlying
theories that govern SPR in spherical or rod shaped nanoparticles.
2.4.1 Extinction of light by a nanosphere
In 1908 Gustav Mie proposed a theory for an arbitrary shaped spherical particle
to solve Maxwell’s equation with the correct boundary conditions. This
solution can be used to determine the absorption, scattering and extinction
cross - section of arbitrary shaped nanoparticles. The cross - section depends
on the radius of the nanosphere R, vacuum number of the incident light k

Chapter 2 29
and dielectric function of the nanosphere where εp and its surrounding εm, are
expressed as
σscat = 2πk2
∞∑n=1
(2n+ 1)(| an |2 + | bn |2) (2.1)
σext = 2πk2 Re(an + bn) (2.2)
The coefficient an and bn can be calculated from Eq2.3 and Eq2.4
an = mψn(mx)ψn(x)− ψn(mx)ψ′n(x)
mψ′n(mx)ξn(x)− ψn(mx)ξ′
n(x) (2.3)
bn = ψ′n(mx)ψn(x)−mψn(mx)ψ′
n(x)ψ′n(mx)ξn(x)−mψn(mx)ξ′
n(x) (2.4)
Here, x = (√εm ) kR is a size parameter where R is the radius of the sphere and
m =√
εpεm
, whereεp and εm are the dielectric functions of sphere and medium
respectively. [129, 137] Also, ψ and ξ are the Ricatti - Bessel cylindrical
function of order n and ψ and ξ prime indicate differentiation with respect
to argument x. Ricatti - Bessel cylindrical function, ξn can be written as
ξn(r) = r [Jn(r)− iyn(r)]
where, spherical - Bassel function Jn(r) and yn(r) are expressed as
Jn(r) =√
π2rJn+ 1
2(r) , yn(r) =
√π2rYn+ 1
2(r)
where, ψn(r) = rJn(r) = r ×√
π2rJn+ 1
2(r) ,
and ξn(r) = r [Jn(r)− iyn(r)] = r [√
π2rJn+ 1
2(r) -i
√π2rYn+ 1
2(r)]
Also, n is the summation index of partial waves, n = 1 corresponds to the
dipole, n = 2 quadrupole and n = 3 hexapole oscillation. Only the dipole and

Chapter 2 30
(A) (B)
(C)
Figure 2.3 (A) Experimental measurement from Johnson and Christy for the dielectricfunction of gold, showing real and imaginary parts of the dielectric constant. [142] (B)Variation of extinction cross - section spectra predicted by Mie theory [129] for 10nm radius gold nanospheres, immersed in a media with various refractive indices (C)Variation in the extinction cross - section spectra predicted by Mie theory [129] for goldnanospheres of various radii immersed in a media with a refractive index n = 1.33.
quadrupole terms are included in these calculations, as the higher order terms
are negligible for this size regime.
The summation of absorbed and scattered energy is known as extinction
energy. This phenomenon can be expressed as
σabs = σext − σscat (2.5)
Therefore, to calculate the absorption and scattering cross - section the
dielectric function of the particle is required. Drude and Lorentz’s free electron
models may be used to calculate the dielectric functions, where electrons
and ions were treated as simple harmonic oscillations, considering only the
contribution of free electrons. However, for the noble metals, we have to
consider the effect of interband transitions and free electrons. The interband

Chapter 2 31
transitions are 3d->4sp, 4d->5sp, and 5d->6sp and free electrons are 4s, 5s
and 6s for copper, silver and gold respectively. For alkali metals, such as
sodium and potassium which are unstable in air, the energy of the band gap
is large, so the interband transitions do not affect the dielectric functions in
the visible range. Therefore, the dielectric constant of metal is given by the
sum of contribution from the free electron (εf ), given by Drude’s free electron
model of metal and a contribution from the interband transitions (εib). This
yields the following expressions for the dielectric constant.
ε(ω) = εf (ω) + εib(ω) (2.6)
εf (ω) = 1−ω2p
(ω2 + iγb)(2.7)
εf (ω) = 1−ω2p
(ω2 + γ2b )
+ iω2pγb
ω(ω2 + γ2b )
(2.8)
ε(ω) = 1−ω2p
ω2 + iγb+ εib(ω) (2.9)
where ωp is the plasma frequency and γb is the bulk damping constant related
to the mean free path of the electron by γb = vF/ l, where vF is the Fermi
velocity. The Fermi velocity and damping constant for bulk Au are vF =
1.4×10⁶ ms−1 and γb = (15fs)−1. The plasma frequency is given by ωp =√ne2
ε0me(ωp for Au 13.8×10¹⁵), where n is the electron density, ε0 is the vacuum
permittivity and me is the effective mass of the electron.
Plasmon dephasing mechanisms
For small particle radius (less than 5 nm, that is dimensions less than the bulk
mean free path), the electrons collide with the surface of the particle and the
dielectric constant deviates from bulk metal broadening the line width. For
large particles, radiation damping causes broadening. [130, 143] Considering

Chapter 2 32
the electron surface scattering for small particles the damping constant is given
by
(leff ) = γb + (AvF )/leff (2.10)
where, leff is the effective path length of electrons (the average distance they
travel before scattering off a surface) and A is a constant that depends on the
electron - surface interactions. [144, 145] The effective path length depends
on the size and shape of the particles and can be calculated consistently for
arbitrary shaped particles by leff = 4VS
, where V is the volume and S is the
surface area of the particle. [144, 146] For spherically capped cylinders yields
leff = w(1− w3l), where w is the width and l is the total length ( l
wis the aspect
ratio). For spheres leff = 43R where R is the radius of the sphere and A = 0.33.
In the case of large particles with a radius above 50 nm, if the radiation
damping effect is considered, the line width is given by
Γ = γb + AvF/leff = 2hκv (2.11)
where V is the volume and k is a constant that characterises the efficiency of
radiation damping.
For noble metal nanoparticles, radiative decay occurs via transformation of the
particle plasmon into photons and nonradiative decay occurs via excitation of
the electron hole pair either within the conduction band (intraband excitation)
or between the d band and the conduction band (interband excitation). In
particular, it is advantageous to minimise the nonradiative decay (e.g. to
avoid sample heating or quenching of fluorescence from adsorbed molecules).
In other words, it is useful to maximise the quantum efficiency for resonance
light scattering. Sonnicsen and co - workers [31] found drastic reduction of

Chapter 2 33
the plasmon dephasing rate in nanorods (dephasing time 6 fs) compared
with small nanospheres (dephasing time 1.4 fs) due to suppression of the
decay into interband excitation. In contrast, the dephasing rate of nanorods
decreases dramatically with increasing red shifts, i.e.; for higher aspect ratios
such as 4.1 AuNRs, the dephasing time is lowest and reported as 18 fs. The
reduced nonradiative decay in nanorods is explained by the fact that interband
excitation requires a threshold energy of about 1.8 eV in Au, thus the process
of plasmon decay into such interband excitations is precluded for plasmons
with energy below 1.8 eV (above 688 nm). However, the increase of radiation
damping apparently outweighs this effect by far, resulting in much larger line
widths in spheres. In the near infrared region NRs have much narrower line
widths for a given resonance frequency. This is because of reduced radiation
damping and is simply a volume effect. For a sphere, the red shift arises from
retardation effects, which are only significant for large sizes. In contrast, for
nanorods the red shift arises from the shape and not the overall size of particles.
Radiation damping and electron surface scattering are negligible for NR with
widths 15 - 20 nm. However, increasing the width beyond 20 nm leads to
significant broadening. Experimental measurements of dielectric function for
Au on metal films under high vacuum by Johnson and Christy are most reliable
and widely accepted. [142] Their values are plotted in Figure.2.3.A and will
be used in the simulations performed in this thesis considering the interband
transitions and surface scattering for smaller particles and radiation damping
effect for larger particles.
2.4.2 Extinction of light by a nanorod
An advance of chemical synthesis, electron and ion beam lithography tech-
niques has allowed us to prepare anisotropic geometries from rods [116] to
bipyramids, [125, 147] dumbbells, [148] and stars [120, 121]. In 1912, Gans

Chapter 2 34
developed an extension of Mies work to calculate the absorption and scattering
cross - section of anisotropic particles, where particles much smaller than
the wavelength of incident light are approximated as ideal dipoles. The field
outside the particles is superposition of ideal dipole and incident field. If an
elongated particle is treated as ellipsoid then its polarisability in an incident
field is parallel to one of its principal axes which can be expressed as
αp = 4πabc (ε1 − εm)(3εm + 3Lp(ε1 − εm) (2.12)
where Lp is a depolarisation factor
Lp =∫∞
0ds
(s+c)2f(s) = [√
(s+ a2)(s+ b2)(s+ c2)]
For prolate spheroids, if light is polarised along the long axis of the spheroids
Lp now changes to
L1 = 1−e2
e2 (−1+12 ln
1+e1−e), L2 = L3=1−L1
2
Where e is the eccentricity of the particle given by,
e2 = 1 − ( ba)2 and Lp= (L1,L2,L3) denotes the polarisation of the incoming
field, aligned to one of the axes of the particle.
For oblate spheroids the Lp depolarisation factor is expressed as
L1 = L2 = g(e)2e2 [π2 − tan
−1g(e)]g2
2
g(e) = 1−e2
e2 , e2 = 1− c2
a2 ,L3 = 1− 2L1
The optical cross - section can be expressed as
σext = kIm(α) (2.13)

Chapter 2 35
σscat = k4
6π | α |2 (2.14)
Gans theory suggests that, anisotropic particles will split into two resonant
modes, the longitudinal mode at a higher wavelength along the long axis
and a transverse mode at lower wavelength along the short axis due to
independent polarisability. The aspect ratio of the particle determines the
position of the longitudinal peak, and has no impact on the transverse
peak which is close to the resonance wavelength of a sphere. In the
Mie - Gans theory elongated nanoparticles are approximated as spheroids;
however, TEM studies revealed that wet chemically synthesized nanorods have
hemispherically capped geometry. To account for this issue, Prescott and co -
workers [140] approximated nanorods as prolate spheroids, spherically capped
cylinders, an ellipsoidally capped cylinders and cylinders to simulate the
extinction spectra using the direct dipole approximation (DDA) method and
modifying the geometrical factor (L). Considering the above approximation,
the AuNR absorption, scattering and extinction spectra are presented in
Figure.2.2. These calculations are for a nanorod 43 nm long and 10 nm wide,
immersed in water of refractive index 1.33 (Figure.2.2). The resultant SPR
wavelength of AuNRs is far from the interband transition, giving narrower
and symmetric peak shape than for nanospheres. The absorption of nanorods
is proportional to volume and scattering, and follows V 2 relationship. Hence,
due to its dipole nature, the nanorod shows cosine square dependency on the
angle between nanorod long axis and incident direction, but the nanosphere
does not show any polarisation dependency.

Chapter 2 36
2.5 Basics mathematical and physical formal-
ism behind finite difference time domain
(FDTD) technique
Recently, different size and shape PNPs including prisms, [149] shells, [150]
cubes, [151] bipyramids, [146] and nanorods [131–135] have been synthesised
and studied optically. This exhibits promising optical properties tuning their
plasmon mode across whole visible to near infrared ranges which have been
used in different biological applications.
To study the plasmon coupling effect and employ that into ICS to investigate
the oligomerisation of PNPs into dielectric medium and cellular environments,
we are required to extrapolate the quantum yield of PNPs. Existing analytical
models - Mie theory and Mie Gans theory can provide the analytical solution
of PNP’s and infinite long cylinders as special cases [152], but for many shapes
analytical solutions are not available.
The lack of an analytical model has set a barrier to understand their plasmon
spectra, as well as to gain further insight into their near field properties
particularly, the quantum yield of PNPs. Several state of the art methods
have been developed to solve Maxwell’s equation numerically, including the
T - matrix, [153, 154] discrete dipole approximation (DDA), [155] and finite
difference time domain (FDTD). [156, 157] The T - matrix method emphasises
more far field properties (i.e. the scattered field) and it is a better developed
systems for revolution symmetry. The DDA and FDTD, however, can give
both near and far field properties due to their finite element nature. We used
finite difference time domain (FDTD) to explore the quantum yield of different
size and shape NS, NR, bipyramid and dumbbell structures and their coupling
effects.

Chapter 2 37
Finite difference time domain method is a state of the art method for solving
Maxwell’s equations in complex geometries. It can provide a direct solution
performing Fourier transformations in time and space offering a unique insight
into electromagnetic and photonics problems (e.g. complex Poynting vector
and transmission or reflection of light). The basic mathematical and physics
formalism behind the FDTD algorithm is that, it solves Maxwells curl equation
2.15 in non - magnetic materials.∂D
∂t= ∇× H (2.15)
¯D(ω) = ε0εr(ω)E(ω)
∂H∂t
= − 1µ0∇× E
where, H,E and D are the magnetic, electric and displacement fields respect-
ively. While εr(ω) is the complex relative dielectric constant.
In three dimensions, Maxwell’s equation has six electromagnetic components:
Ex, Ey, Ez and Hx, Hy and Hz. Considering the structure infinite in z
dimensions and fields independent of z we can write,
εr(ω, x, y, z) = εr(ω, x, y, z) and
∂E∂z
= ∂H∂z
=0
In this situation, Maxwell’s equation is split into two independent equations
composed of three vector quantities each of which can be solved in x - y
plane only. These are termed the TE (transverse electric) and TM (transverse
magnetic) equations where TE has Ex, Ey, and Ez components and TM has
Hx, Hy and Hz components.
For example in the case of TM, Maxwell’s equations can be reduced to:
∂Dz
∂t=∂Hy
∂x− ∂Hx
∂y, where Dz(ω) = ε0εr(ω)Ez(ω)
∂Hx
∂t= − 1
µ0∂Ez
∂y

Chapter 2 38
Figure 2.4 Standard Yee - cell. The electric field components are located on the edgeswhile the magnetic field components are located on the face centres. Figure taken fromWikipedia. [156]
∂Hy
∂t= − 1
µ0∂Ez
∂x
Therefore, the FDTD method solves these equations on a discrete spatial and
temporal grid. Each field component is solved at a slightly different location
within the grid cell, which is known as Yee cell [158] (as shown in Figure.2.4).
In our study, finite difference time domain (FDTD) solution has been used to
simulate the nanostructures of wavelength and subwavelength scale geometries
in the presence of incident illumination. To explore the optical property
of PNPs such as nanospheres(NSs), nanorods (NRs), dumbbells (DBs) and
bipyramids (BPs), single particle response and plasmon coupling property, we
employed commercial FDTD software (Lumerical Solutions 7.5). Simulation
methodology can vary whether one is interested in exploring the light scattering
from standalone particle, particles on substrates, or from a surface with
nanoscale structures. However, in this experimental case, our major focus was

Chapter 2 39
Figure 2.5 Layout editor of finite difference time domain (FDTD) simulation forplasmonic nanoparticles (PNPs) structure. The yellow rectangular box is the total field,the white rectangular box is the total - field scattered field source and outer yellowrectangular box is the scattered field. The pink arrow shows the direction of propagation,k vector. The blue dot represents the direction of the electric field
AuNS dimers and its consequences when incubated with HeLa cells. However,
in this section, we explore the plasmon coupling effect, of different size and
shape AuNPs for further investigation.
2.5.1 Simulation setup
The layout editor shows the simulation of objects, total field, scattered field and
polarisation direction. The AuNSs are simulated in the middle, a position that
can be moved easily with a mouse. Surrounding that, the yellow rectangular
box is the total field, followed by the total - field scattered field source (white
rectangular box) and scattered field (outer yellow rectangular box). The pink
arrow shows the direction of propagation, k vector. The blue dot represents
the direction of the electric field (Figure.2.5).
To simulate the AuNPs a total - field scattered field source (TFSF) was
used which surrounds the AuNPs. Two analysis groups one in the total field

Chapter 2 40
region and one in the scattered field region were used. These analysis groups
provide absorption and scattering cross - sections and angular distribution of
scattered radiation. To calculate the electric field an enhancement frequency
profile monitor can be included. Johnson and Christy’s dielectric function for
AuNPs was used considering the size effect (surface scattering and radiation
damping). [142] The mesh override region intentionally was kept large enough
to accurately resolve the location of AuNS interfaces, especially for a curved
surface and for TFSF sources which works best in uniform meshed regions. In
addition, sources require a certain amount of space (~2 mesh cells) to inject
the fields, because the fields are not physically meaningful within this region.
Hence, the monitor should not be placed in this restricted region. The rate at
which energy is removed from the incident plane wave hence, the net power
flow into the particle is considered as an absorption cross - section which can
be calculated by the analysis group located inside the TFSF source using
optical theorem. On the contrary, the net power scattered from the particle
hence, the scattering cross - section can be calculated by another analysis
group located outside the TFSF source. This group measures the net power
scattered from the particle. Afterwards, the absorption or scattering cross -
section can be calculated considering the geometrical area π×r2 and the size
parameter 2×π× rλ. For higher accuracy, simulation mesh refinement was set to
“conformal variant 1” to achieve sub - cell resolution followed by convergence
testing. Mesh override mesh size was set to 0.25 - 0.5 nm considering the
size of the PNPs structure. Simulation span was set to 2 µ m to avoid the
interaction of evanescent tails of the resonant surface plasmon modes with
perfectly matched layer (PML boundary) conditions. To reduce the light
reflections by PML layers, more PML layers were considered. Setting the
X min boundary condition to symmetric and Z min boundary condition to
anti - symmetric simulation memory and time were improved by a factor of
4 (Figure.2.6), shows the better agreement between FDTD and theoretical

Chapter 2 41
(A) (B)
Figure 2.6 Extinction, absorption and scattering cross - sections calculated via Mietheory [129] compared with finite difference time domain (FDTD) simulations for, (A)10 nm radius gold nanospheres and (B) 20 nm radius gold nanospheres.
results (Mie theory) considering higher accuracy simulation for 10 and 20 nm
radius AuNSs for a refractive index of water of 1.33.
2.6 Finite difference time domain (FDTD)
simulations of standalone particles
In this section, we will discuss a standalone particle’s response (e.g. AuNS
or AuNR) and coupling effect of dimer (e.g. AuNS and AuNR dimer) and
tetramer (e.g. AuNS tetramer) structure. We will finish the section by
presenting the quantum yield variation due to tip curvature.
2.6.1 Finite difference time domain (FDTD) simula-
tions of gold nanospheres and nanorods
A.Nanospheres
We performed finite difference time domain (FDTD) simulation (Lumerical
Solutions 7.5, Canada) to investigate the absorption and scattering cross -

Chapter 2 42
(A) (B)
Figure 2.7 (A) Scattering cross - sections of 5 - 100 nm radius gold nanospherescalculated via Mie theory compared with finite difference time domain (FDTD)simulations, (B) longitudinal surface plasmon resonance (LSPR) of 5 - 100 nm radiusgold nanospheres calculated via Mie theory compared with finite difference time domain(FDTD) simulations.
section of AuNSs with 5 - 100 nm radii. To simulate the AuNSs, a total - field
scattered field source (TFSF) was used and grid resolution 0.5 was chosen
nm for better accuracy of results (Figure.2.6 and 2.7). The FDTD simulation
reproduced the analytical results very well, both on line shapes and cross -
section at the plasmon resonance. The FDTD plasmon resonance of 10 nm
radius AuNSs (2.38 eV) agreeds very well with quasistatic approximation (Mie
theory) (2.39 eV). However, plasmon redshifts and broadens as the AuNP
grows larger due to the phase retardation effect and increasing contribution
from higher order modes. The peaks are located at 2.35 eV for 25 nm radius
AuNSs and 2.29 eV for 50 nm radius AuNSs. In the quasistatic approximation
absorption cross - section is proportional to the volume of particles, Qabs =Cabsπr2 . The relation holds roughly for smaller particles such as 10 and 25 nm
particles. However, retardation effect becomes so significant for the 50 nm
radius AuNPs that, its absorption efficiency at resonance is lower than 25 nm
radius AuNSs.
The absorption, scattering cross - section (Figure.2.7A) and In Figure2.7B
LSPR of 5 - 100 nm radius AuNSs were compared. The result shows that,

Chapter 2 43
Nanoparticles LSPR (nm) Scat. CSProlate spheroid 731 1.11×10⁻¹³
Spherically capped cylinder 769 1.26×10⁻¹³
Cylinder 878 1.66×10⁻¹³
Table 2.1 Comparison of longitudinal surface plasmon resonance (LSPR) andscattering cross - sections (Scat.CS) of different particle morphologies for aspect ratio(AR) 2, length 40 nm PNPs, calculated via FDTD simulations.
for the largest particles (above 25 nm radius) the absorption and scattering
intensities deviate from simple scaling laws of d3and d6 respectively. The
scattering peak increases with increase of NP size and dramatically increases
above 60 nm radius.
B.Prolate spheroid
FDTD calculations were performed using FDTD software (Lumerical Solutions
7.5, Canada). The Dielectric function of gold was formulated from Johnson and
Christy and corrected for size effect (surface scattering and radiation damping)
[142]. A TFSF source with its wavelength ranging from 100 - 400 nm was used
and a grid resolution of 0.5 nm was chosen for better accuracy of results. The
source direction was set along the axis of NPs. The surrounding medium was
taken as water with a refractive index of 1.33. An FDTD solution of gold
prolate spheroid (ellipsoid) with minor axis 20 nm and aspect ratio (AR) 2.1
shows LSPR at 1.696 eV (731 nm) and scattering cross - section 1.11×10⁻¹³
for refractive index 1.33 and 0.5 nm mesh size (Figure.2.9).
C.Rod shaped simulations (spherically capped)
For FDTD simulations the nanorod is modelled as a finite cylinder with both
ends capped by hemispheres (Figure.2.10B). The aspect ratio of a nanorod is
defined as the ratios between its total length and diameter. The simulations
are performed for two aspect ratios 3.8, and 4.3 for 75 nm and 40 nm major

Chapter 2 44
Figure 2.8 Schematics of different particle morphologies under consideration including,(A) a prolate spheroid, (B) a spherically capped cylinder, (C) an ellipsoidally cappedcylinder and (D) a cylinder.
axis length, and given resonance energies are 1.50 eV (827 nm) and 1.46 eV
(851 nm) respectively (Figures.2.16 and 2.17). The polarisation was set along
the major axis, mesh size was taken as 0.5 nm and refractive index as 1.33.
2.6.2 Quantum yield variation due to tip curvature
Elongated nanoparticles, especially nanorods and bipyramids are promising
for optical studies as their spectra are easily tunable by varying the aspect
ratio (Figure.2.10). Compared with nanospheres, nanorod structures of the
same volume give a larger curvature at the tips. Therefore, to investigate
the significant field enhancement due to tip curvature, we performed FDTD
simulation for NS, DB and BP. Gold nanospheres of 80 nm diameter gave
a longitudinal plasmon resonance at at 2.21 eV (560 nm). An example of
simulation for a AuBP with R (radius at equator) = 15 nm, h (total length)
= 162 nm and r (radius at the poles) = 10 nm is shown in Figure.2.10C.

Chapter 2 45
Figure 2.9 Scattering cross - sections of different morphology nanoparticles for aspectratio (AR) 2, length 40 nm refractive index 1.33 and mesh size 1 nm using FDTDsimulations.
(A)
(B)
(C)
Figure 2.10 Finite difference time domain (FDTD) simulations of gold, (A) dumbbell,(B) nanorods and (C) bipyramids.
Chapter 2 46
Dog - bone - like AuNRs (dumbbells) were also modelled as a cylinder at
the middle waist and two larger spheres at both ends, considering a total
length of 84 nm and sphere radius of 15 nm (Figure.2.10A). The FDTD
calculations were performed with 0.5 nm grid resolution and gave a longitudinal
plasmon resonance at 1.39 eV (890 nm) and 1.54 eV (805 nm) for BP and DB
respectively.
Therefore, we calculated the scattering spectrum of the above mentioned
diameter and normalised per unit volume, which shows the following sequence
NS<DB<NR<BP (Figure.2.11). A significant field enhancement is observed
as AuNRs and bipyramids show around one to three orders of magnitude higher
in cross - section than nanospheres (Figure.2.11).
2.7 Finite difference time domain (FDTD)
simulations of coupled nanoparticles
In this section we will discuss the dipolar excitation coupling model and
plasmon ruler equation. We conclude the section by presenting FDTD
simulations results of AuNS dimers, AuNR dimers, AuNS trimers and
heterodimer AuNRs.
2.7.1 Dipolar excitation coupling model and plasmon
ruler equation
When two metallic nanoparticles approach each other their plasmonic near
field couple strongly gives rise to a distance dependent wavelength shift of the
plasmon mode. Quantitative study on near field coupling between pairs of
elliptical metal particles and spheroidal nanoparticles as a function of inter
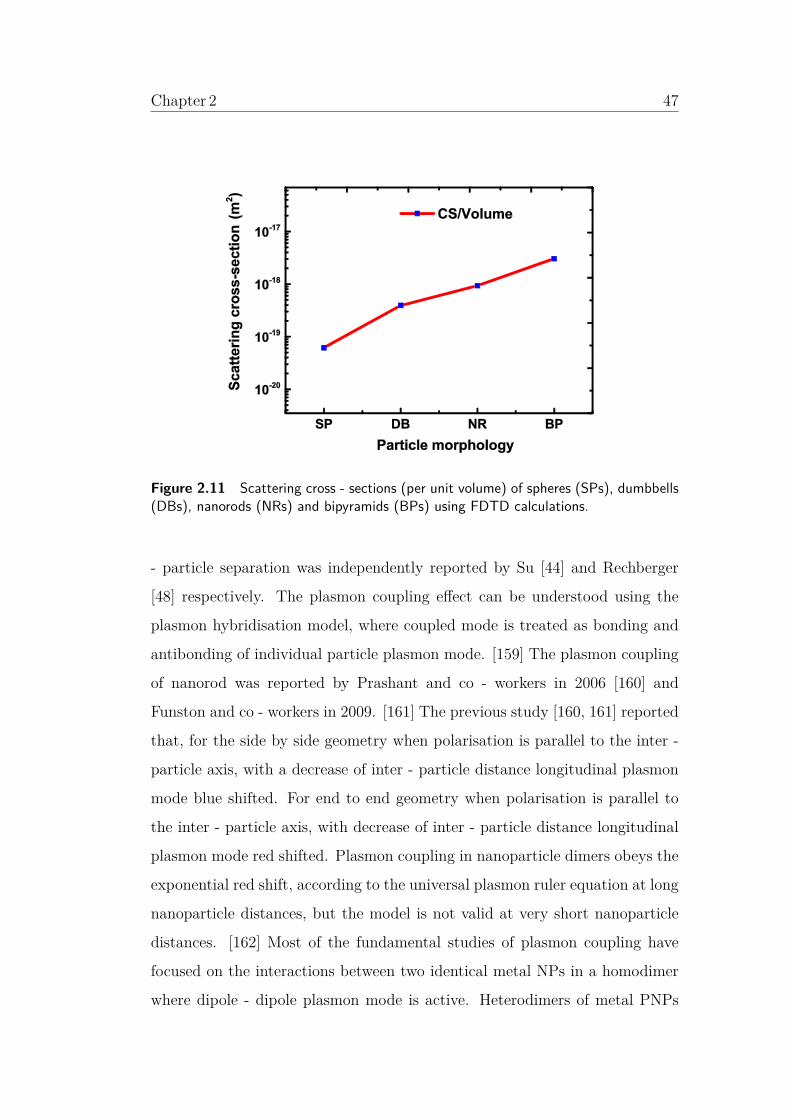
Chapter 2 47
Figure 2.11 Scattering cross - sections (per unit volume) of spheres (SPs), dumbbells(DBs), nanorods (NRs) and bipyramids (BPs) using FDTD calculations.
- particle separation was independently reported by Su [44] and Rechberger
[48] respectively. The plasmon coupling effect can be understood using the
plasmon hybridisation model, where coupled mode is treated as bonding and
antibonding of individual particle plasmon mode. [159] The plasmon coupling
of nanorod was reported by Prashant and co - workers in 2006 [160] and
Funston and co - workers in 2009. [161] The previous study [160, 161] reported
that, for the side by side geometry when polarisation is parallel to the inter -
particle axis, with a decrease of inter - particle distance longitudinal plasmon
mode blue shifted. For end to end geometry when polarisation is parallel to
the inter - particle axis, with decrease of inter - particle distance longitudinal
plasmon mode red shifted. Plasmon coupling in nanoparticle dimers obeys the
exponential red shift, according to the universal plasmon ruler equation at long
nanoparticle distances, but the model is not valid at very short nanoparticle
distances. [162] Most of the fundamental studies of plasmon coupling have
focused on the interactions between two identical metal NPs in a homodimer
where dipole - dipole plasmon mode is active. Heterodimers of metal PNPs

Chapter 2 48
exhibit much more complex plasmon coupling behaviour than homodimers
because of the symmetry breaking of heterodimers [163] which leads to the
formation of new plasmon modes (bright and dark mode) giving rise to
Fano resonance in asymmetric plasmonic nanostructures. Recently, plasmon
coupling for rod - sphere pairs, [164] trimers [165, 166] and nanoparticle cluster
arrays [167] (n<7) has also been reported.
Previous studies [25, 44, 45] have shown that plasmon coupling between two
identical metal NPs can be described using an empirical universal scaling law
using Eq.2.16
∆λλ
= Aexp[−dD
τ] (2.16)
where A is the maximum fractional plasma resonance shift, τ is the decay
constant, d is the inter - particle separation, D is the diameter of sphere/rod
length. The decay constant τ has been found to be within 0.2−0.3, irrespective
of the metal type, nanoparticle shape and the surrounding medium. Funston
and co - workers [161] showed that the fitting parameter is not good enough
for predicting the coupled plasmon wavelengths of various AuNR dimers in
Eq.2.16. Fore more universal equation, Jain and co - workers [25] reported
that, coupled plasmon energy is determined by competition between the inter
- particle coulombic restoring forces on the displaced electron cloud. The
d/D term in Eq.2.16 was replaced by Jiang fang [163] group as ( V gapV nanorod
) 13 ,
where Vgap and Vnanorod denotes the volume of the gap region and nanorod
respectively. The exponential expression can be expressed∆λλ
= Aexp[−( dD
) 1c
τ] (2.17)
where c = 3, 5, 7 are for dipole, quadrupole and octupole respectively. Using
the results of previous studies, we can define two regimes of plasmon coupling,
strong and weak coupling. When particle separation is greater than 0.1 D,

Chapter 2 49
where plasmon ruler governs, we call it weak coupling and when particle
separation is less than 0.1 D, where the plasmon mode hybridisation occurs
(band splitting), we call it strong coupling (Figure.2.13). In the weak
coupling regime, plasmon coupling obeys an exponential relationship with the
separation, known as the universal plasmon ruler equation. In the strong
coupling regime, hybridization of the plasmon energies occurs similar to
molecular bonding and anti - bonding orbitals.
The dipole – dipole interactions between two interacting molecules are
generally described in the framework of excitation coupling theory. [168, 169].
As predicted by excitation theory, excited – state levels of monomer split
into two levels e.g. lower energy level and a higher energy level relative
to the monomer excited state, upon dimerisation. In that process it forms
two possible arrangements of the transition dipoles of the dimer, e.g. in
- phase or symmetric and out of phase or antisymmetric (see Figure.2.12).
The interaction energy 2U between the molecules could be approximated by
coulombic interaction between the transition dipole moments of the monomers,
the angle and the distance between the transition dipoles 1 and 2. [170]
U = 14πε0
| µ |2
n2R3 ξ (2.18)
where ξ = cosθ12 − 3cosθ1Rcosθ2R is the orientation factor, nmis the refractive
index of the medium, | µ |2 is the squared modulus of the transition dipole
moment and R is the distance between dipole centres.
For parallel or H - type dimers (Figure.2.12.A), the interaction between two
transition dipoles of dimer is repulsive, because of the cancellation of the two
dipole moments, transition to the lower energy excited state is forbidden,
therefore it contains a single band at higher energy with respect to the
monomer (because θ12 =00,θ1R = θ1R =900 and so ξH = 1). For head to

Chapter 2 50
Monomer MonomerDimer
Monomer Dimer Monomer
𝛙𝛙+ = 𝟏𝟏
√𝟐𝟐 [𝛗𝛗𝟏𝟏 + 𝛗𝛗𝟐𝟐]
𝛙𝛙− = 𝟏𝟏
√𝟐𝟐 [𝛗𝛗𝟏𝟏 − 𝛗𝛗𝟐𝟐]
𝛙𝛙− = 𝟏𝟏
√𝟐𝟐[𝛗𝛗𝟏𝟏 − 𝛗𝛗𝟐𝟐]
𝛙𝛙+ = 𝟏𝟏
√𝟐𝟐 [𝛗𝛗𝟏𝟏 + 𝛗𝛗𝟐𝟐]
2U
2U
Excited State
Ground State
Excited State
Ground State
(A)
(B)
(C)
π*
σ*
σ
π
+ + --
H aggregate
J aggregate
++
---
-
--- ++
+
+
+-
+
Figure 2.12 Schematic of the energy level splitting resulting from the dipolarinteraction of AuNR dimer, showing symmetric (ψ+) and anti - symmetric coupling(ψ−) of excitons for (A) H aggregate geometry and (B) J aggregate geometry. (C)Exciton theory picture of the nature of the coupled longitudinal plasmon excitation inAuNRs dimers: electromagnetic analogy to molecular orbital theory. [160]

Chapter 2 51
+ -
- +
+ -
+ -
+ -
+ -
+ -
+ -
+ -
+ -
(A) (B)
(C)
Sep d > 0.1 D Sep d < 0.1 D
Figure 2.13 Plasmon coupling of nanoparticle at (A) weak and (B) strong couplingregime, (C) the energy level splitting resulting from the dipolar coupling of dimers,showing symmetric and anti - symmetric coupling for AuNS dimer. [171]
tail or J – type dimers(Figure.2.12.B), the interaction between two transition
dipoles of the dimer is attractive, and because of the two dipole moments,
transition to a higher energy state is forbidden, and therefore the spectrum
shows a single band at lower energy with respect to the monomer (because
θ12 = θ1R =00 and so ξJ = −2).
However, the excitation coupling theory could be used to elucidate the optical
spectra of AuNR dimers. For side - by - side AuNR arrangements (J aggregate)
when polarisation direction is along the inter - particle axis, transverse
polarisation, leads to a red – shift and end - by - end AuNR arrangements
(H aggregate), leads to a too small blue – shift. That’s because, transverse
plasmon dipoles are far apart even when the rods touch each other. As a
consequence, the optical properties of the AuNR dimers and their dependence
on dimer orientation appear to be qualitatively steady with the excitation -
coupling model.

Chapter 2 52
\
4x10⁻⁷ 5x10⁻⁷ 6x10⁻⁷ 7x10⁻⁷
0
1x10-15
2x10-15
3x10-15
4x10-15
Scat
terin
g cr
oss-
sect
ion
(m2 )
Wavelength (m)
1 4 8 16 24 40 80 Monomer
0.0 0.5 1.0 1.5 2.0 2.50.00
0.05
0.10
0.15
0.20
0.25
a) FDTD b) Modified PR c) Universal PR
b) A = 1.09107, t = 0.19005c) A = 0.30115, t = 0.09033
Sep/Dia(40nm)
(A) (B)
Figure 2.14 Finite difference time domain (FDTD) simulation results of 20 nm radiusgold nanosphere dimer plasmon coupling. (A) scattering spectrum and (B) plasmonresonance peak shift as a function of inter - particle separations.
Similar reasoning could be used to describe the polarisation dependence of the
optical resonance shift in AuNS dimers. [48] In AuNSs, polarisation along the
inter - particle axis (p - pol) produces red - shift with respect to the single
AuNS resonance and polarisation along perpendicular (s - pol) axis produces
a blue - shift (Figure.2.14 and 2.15).
Recently, nanoparticle plasmon coupling has been introduced to investigate
inter - particle distance between two micromolecules utlising the plasmon ruler
concept, on the basis of spectral shift due to coupling of two AuNSs. [21–
25] This tool has been used for probing membrane proteins on cell surface
receptors, [26] following receptor trafficking [3] and detecting aggregation of
PNPs inside the cell through receptor trafficking.
Therefore, plasmon coupling provides a microscopic view of the interaction
in these applications, but there is no macroscopic view of the interaction at
the cellular size regime. In our study, we proposed to use plasmon coupling
techniques together with image correlation spectroscopy, to quantify the AuNP
uptake and oligomerisation when AuNPs were incubated in HeLa cells. By
exploring the plasmon coupling of different size, shape, and orientation AuNPs
using FDTD simulation we can quantify the QY, which will be used in H - ICS

Chapter 2 53
4.0x10⁻⁷ 6.0x10⁻⁷ 8.0x10⁻⁷ 1.0x10-60
2x10-14
4x10-14
6x10-14
8x10-14
1x10-13
1x10-13
Wavelength (m)
Scat
terin
g cr
oss-
sect
ion
(m2 )
0.5 1 4 8 16 24 40 80 200 Monomer
0.0 0.5 1.0 1.5 2.0 2.50.0
0.1
0.2
0.3
0.4
0.5
a) FDTD b) Modified PR c) Universal PR
Sep/Dia(80nm)
b) A = 1.13252, t = 0.22513c) A = 0.42349, t = 0.09639
(A) (B)
Figure 2.15 Finite difference time domain (FDTD) simulation results of 40 nm radiusgold nanosphere dimer plasmon coupling. (A) Scattering spectrum and (B) Plasmonresonance peak shift as a function of inter - particle separations.
for studying the feasibility of the H - ICS tool, for weakly coupled AuNPs.
To acquire an understanding of quantum yield (QY) and introduce it for
image correlation spectroscopy (ICS), we need to know the plasmon coupling
effect of PNPs. In this study, we explored the plasmon coupling of AuNSs
and AuNRs dimer and investigated the QY for coupled AuNSs and AuNRs.
Hence, in experimental observation, for simplicity, we dealt only with the gold
sphere. We investigated the plasmon coupling of two symmetric dimer using
FDTD simulation. Integrating the FDTD simulated scattering intensity of
coupled gold nanosphere, we extracted the values of QY (cluster by monomer
scattering strength ratio) and introduced that number for H - ICS simulation
for determining oligomerisation.
2.7.2 Numerical simulation of gold nanosphere dimer
To explore plasmon coupling commercial FDTD software (Lumerical Solu-
tions7.5, Canada) was used. The dielectric function of gold was formulated
from Johnson and Christy and corrected for size effect (surface scattering and
radiation damping). [142] A total - field scattered field source (TFSF) with its

Chapter 2 54
wavelength ranging from 100 - 400 nm was used and a grid resolution of 0.5
nm was choosen for better accuracy of results. The source direction was set
along the axis of AuNPs. The surrounding medium was taken as water with
refractive index 1.33. We investigated the plasmon coupling of 40 nm and 80
nm diameter gold plasmonic nanoparticle dimer using FDTD simulation and
found red - shift in surface plasmon resonance (SPR) peak with decreasing
inter - particle distance (weak coupling regime), in line with previous results.
[25, 44, 45, 161] The red shift is due to coupling of plasmonic near field when
two spheres approache each other and form bonding and antibonding plasmon
modes. Additionally, the amount of red - shift is modelled with a modified
universal plasmon ruler equation, A = 1.09107, τ = 0.19005 with A = 1.13252,
τ = 0.22513 for 40 nm and 80 nm diameter AuNSs respectively (Figure.2.14
and 2.15). This value is comparable to published results. [161, 163]
We found that there are multiple peaks at strong coupling regimes for 1 nm
and 0.5 nm separations for 40 nm and 80 nm diameter NSs in Figure.2.14
and Figure.2.15 due to hybridisation of plasmon energy. At weak coupling
regimes (as an example 80 nm and 200 nm separation respectively), the
peak is almost the same position as the monomer peak (around 541 nm and
558 nm respectively for 40 nm and 80 nm diameter AuNS) and intensity
becomes double than monomer. Intensity of monomers at 541 nm and 558
nm peak wavelengths for 40 and 80 nm diameter AuNS are 2.724×10⁻¹⁴ m2
and 1.656×10⁻¹⁴ m2 respectively. Intensity of 1 nm dimer for 40 and 80 nm
diameter AuNSs at 666 nm and 785 nm peak wavelengths are 8.434×10⁻¹⁴
m2 and 4.66×10⁻¹⁵ m2 respectively. At monomer peak wavelength 558 nm
the intensity of the dimer (8.41×10⁻¹⁴ m2) becomes five times greater than
monomer (1.66×10⁻¹⁴ m2) intensity. As an example for 80 nm diameter
AuNSs, at 700 nm and 715 nm wavelength intensity of the dimer becomes
3.5 (7.70×10⁻¹⁴ m2) and 2 (5.16×10⁻¹⁴ m2) times greater than monomer
(1.66×10⁻¹⁴ m2) intensity.

Chapter 2 55
6x10⁻⁷ 7x10⁻⁷ 8x10⁻⁷ 9x10⁻⁷ 1x10⁻⁶ 1x10⁻⁶ 1x10-60
1x10-14
2x10-14
3x10-14
4x10-14
5x10-14
Sc
atte
ring
cros
s-se
ctio
n (m
2 )
Wavelength (m)
1 nm 2 nm 4 nm 10 nm 48 nm 87.5 nm 128 nm Monomer
0.0 0.5 1.0 1.50.00
0.05
0.10
0.15
Seperation/NR Length
(b) A = 0.47171, t = 0.23292(c) A = 0.18369, t = 0.08976
FDTD (b) Universal PR (c) Modified PR
(A) (B)
Figure 2.16 Finite difference time domain (FDTD) simulation results of gold nanoroddimer plasmon coupling. (A) scattering spectrum of rod for length 75 nm, width 20nm, aspect ratio (AR) 3.8 and (B) plasmon resonance peak shift as a function of inter- particle separations.
2.7.3 Numerical simulation of gold nanorod dimer
To explore the plasmon coupling of AuNR we used the same simulation setup
as discussed in section 2.5.1. A total - field scattered field source (TFSF)
of 400 - 1000 nm with its wavelength was set along the long axis of AuNRs.
Therefore, we investigated the plasmon coupling of spherically capped nanorod
dimer for nanorod length 75 nm width 20 nm and aspect ratio 3.8 and nanorod
length 43 nm width 10 nm and aspect ratio 4.3 for side - side geometry with
polarisation parallel to the long axis.
The calculated scattering spectra corresponding to longitudinal plasmon
excitation of a pair of AuNRs, appraching each other along their long axis
(i.e., end - to - end assembly) for aspect ratio (AR) 3.8 and 4.3 are shown
in Figures.2.16 and 2.17 respectively. The calculated longitudinal bands of
isolated single AuNR are shown for comparison as a black curve in Figures.2.16
and 2.17. The optical response maximum does not seem to shift its position
from that of the isolated AuNR case for larger inter- AuNR distance (D
= 117 nm and D = 128 nm of Figures.2.16 and 2.17 ). As the distance

Chapter 2 56
8x10⁻⁷ 9x10⁻⁷ 1x10⁻⁶ 1x10⁻⁶
0
5x10-16
1x10-15
2x10-15
2x10-15
Scat
terin
g cr
oss-
sect
ion
(m2 )
Wavelength (m)
1.2 nm 2.6 nm 6.3 nm 28.5 nm 56.5 nm 117 nm Monomer
0.0 0.5 1.0 1.5 2.0 2.50.00
0.05
0.10
0.15
(b) A = 0.18083,t = 0.11068(c) A = 0.50052, t= 0.24458
FDTD (b) Universal PR (c) Modified PR
Seperation/NR Length
(A) (B)
Figure 2.17 Finite difference time domain (FDTD) simulation results of gold nanoroddimer plasmon coupling. (A) scattering spectrum of rod for length 43 nm, width 10nm, aspect ratio (AR) 4.3 and (B) plasmon resonance peak shift as a function of inter- particle separations.
decreases, the longitudinal plasmon band progressively red - shits due to
coupling of the longitudinal plasmons. The amount of red - shift is modelled
with modified universal plasmon ruler equation, with A = 0.18396, τ =
0.08976 and A = 0.50052, τ = 0.24458 for aspect ratio (AR) 3.8 and 4.3
respectively (Figures.2.16 and 2.17). This value is comparable to published
results. [161, 163]
To elucidate the nature of plasmon excitation in the coupled system, an
excitation model could be employed. [160] For the side - by – side dimer
arrangement longitudinal plasmon bonding in nature is analogous to the
formation of σv bond from two Pz orbitals. This produces maximum electric
field in the junction between the interacting AuNR. On the other hand
for the side - by - side dimer the coupled longitudinal plasmon has anti -
bonding in nature analogous to the formation of a π* bond from Px/y orbitals,
concentrating electric field on either side of the inter - particle junction. For
the case of end - to – end configuration, a new band emerges at higher energies
as the inter - AuNR distance becomes very small or the number of AuNRs
interacting in an assembly increases. [160]

Chapter 2 57
4x10⁻⁷ 5x10⁻⁷ 6x10⁻⁷ 7x10⁻⁷ 8x10⁻⁷ 9x10⁻⁷
0
5x10-16
1x10-15
2x10-15
Monomer Dimer Sep 140 nm Trimer Sep 110 nm Trimer Sep 140 nm
Scat
terin
g Cr
oss-
sect
ion
(m2 )
Wavelength (m)
0 1 2 30.00
0.08
0.16
0.24
0.32
Sep/Dia
b) A=0.21836,t=0.192c) A=0.3123,t=0.46134
(a) FDTD (b) Plasmon Ruler (c) Modified Plasmon Ruler
(A) (B)
Figure 2.18 Finite difference time domain (FDTD) simulation results of gold nano -sphere trimer plasmon coupling. (A) scattering spectrum of a sphere - trimer with adiameter of 40 nm for different inter - particle distances for weakly coupling regimescompared with monomer and dimer and (B) plasmon resonance peak shift as a functionof inter - particle separations.
2.7.4 Numerical simulation of gold nanosphere trimer
We investigated the plasmon coupling of a nanosphere trimer with diameter 40
nm, as a function of inter - particle separations (Figure.2.18). We compared
the monomer and dimer with the same diameter with the trimer and found
that, peak position remains the same for weakly coupled trimers, dimers
and monomers but intensity becomes double and triple for dimer and trimer
respectively due to formation of bonding and antibonding plasmon modes. The
intensity and peak are 1.89×10⁻¹⁶ m2 and 543 nm, 6.01×10⁻¹⁶ m2 and 543 nm,
1.01×10⁻¹⁵ m2 and 543 nm for monomers, dimers and trimers respectively. We
used the same simulation setup as discussed in section 2.5.1. The simulation
results are shown in Figure.2.18.
2.7.5 Numerical simulation of gold heterodimer nanorod
The calculated longitudinal plasmon spectrum using FDTD simulation for
a dimer with two spherically capped nanorods with dissimilar aspect ratios
(spherically capped nanorod 1: length 75 nm width 20 nm aspect ratio 3.8

Chapter 2 58
6x10⁻⁷ 8x10⁻⁷ 1x10⁻⁶ 1x10⁻⁶ 1x10-60
3x10-15
6x10-15
9x10-15
1x10-14
2x10-14
2x10-14
Scat
terin
g cr
oss-
sect
ion
(m2 )
Wavelength (m)
1 nm 3 nm 13 nm 25 nm 55 nm 135 nm AuNR AR 3.8 AuNR AR 4.3
0 40 80 120 160880
920
960
1000
1040
1080
1120
(a) Peak Wavelength(b) Fitting Curve
Peak
wav
elen
gth
(nm
)
Seperation (nm)
(b) y = y0 + A exp (-x/t)yo = 895.4748, A = 194.345, t = 11.1824
(A) (B)
Figure 2.19 Finite difference time domain (FDTD) simulation results of gold nanorodhetero dimer plasmon coupling. (A) Scattering of hetero dimer (spherically capped) rodhaving AR 4.3, length 43 nm, width 10 nm and AR 3.8, length 75 nm, width 20 nmand (B) Au nanorod dimers peak wavelengths are shown for different inter - particledistances.
and nanorod 2 : length 43 nm width 10 nm aspect ratio 4.3) for side -by -
side geometry, polarisation parallel to the long axis is shown in Figure.2.19.
As seen in Figure.2.19, the longitudinal plasmon maximum and intensity is
around 695 nm and scattering cross - sections is 2.43×10⁻¹⁵ m2 nm for an
aspect ratio 3.8 and around 852 nm and 4.78×10⁻¹⁶ m2 for an isolated AuNR
of aspect ratio 4.3.
For a side - by – side assembly of same length rods, the anti – symmetric
coupling mode with lower energy would have a zero dipole moment, therefore
absorption would not be observed optically. However, for the case of
dissimilar rod length, red shifted absorption would be observed, due to
the lower net dipole moment, even though it possesses a lower spectral
intensity. Correspondingly, for an end - to – end assembly, the higher energy
component becomes allowed analogous to the anti – symmetric coupling due
to symmetry breaking, even though it has a relatively lower spectral intensity
(Figure.2.19.A).
Therefore, heterodimers of AuNRs exhibit much more complex plasmon
coupling behaviour than homodimers because of the symmetry breaking of

Chapter 2 59
heterodimers that leads to the formation of bright and dark plasmon modes
giving rise to Fano resonance. A single peak was observed, when asymmetric
nanorod dimers were weakly coupled, and multiple peaks were observed when
asymmetric nanorod dimers were strongly coupled due to band splitting
(Figure.2.19A). At weakly coupled regimes, an asymmetric nanorod dimer
peak is almost at the same position as monomer peak. We also found that,
with a decrease in separation between two asymmetric AuNR dimers plasmon
resonance red shifted and intensity increaseds exponentially (Figure.2.19B).
The quantum yield for asymmetric dimer could be also explored and the
quantum yield number could be used in H - ICS simulations for investigating
aggregation details due to asymmetric AuNS or AuNR dimer.
2.8 Quantum yield of gold nanoparticles
We investigated the plasmon coupling effect of different sized nanospheres and
nanorods using FDTD simulation as discussed in the previous section. From
the FDTD simulation it was observed that, for 80 nm diameter Au monomers,
dimers (1 nm separation) and trimer (1 nm separation) peak and intensity were
558 nm and 1.65571×10⁻¹⁴ m2, (1 nm separation) 7.85 nm and 8.43×10⁻¹⁴
m2 and 8.77 nm and 1.42×10⁻¹³ m2 respectively. For aspect ratio 3.8 nm, and
length 75 nm AuNR peak and intensity for monomers and dimers was 827 nm
and 2.02×10⁻¹⁴ m2 and 965 nm and 5.08×10⁻¹⁴ m2 respectively. Integrating
the total spectrum, we extracted the dimer to monomer ratio for 40 nm and
80 nm diameter AuNSs and 3.8 and 4.3 aspect ratio nanorods. The ratio of
dimer to monomer varies from 2 ~ 4, and ratio of the trimer to monomer varies
from 4 ~ 9 for different separations. Figure.2.20 shows the scattering quantum
yield (QY) ratio of clusters to monomers of AuNSs (80 nm diameter).

Chapter 2 60
Figure 2.20 Scattering quantum yield (QY) ratio of clusters and monomers of goldnanospheres (AuNS ) (80 nm diameter)
2.9 Conclusion
The use of the FDTD technique enabled us to extract the QY (ratio of clusters
to monomers), which will be required to perform H - ICS for plasmon coupled
PNPs. In the next chapter, we will discuss how we interpreted QY for plasmon
coupled AuNPs to perform the H - ICS simulations.

Chapter 3
Theory and simulations of
image correlation spectroscopy
3.1 Abstract
In this chapter we present the theory and simulation results of high order image
correlation spectroscopy (H - ICS) and the concept of interpreting the H - ICS
technique for coupled AuNPs, including how to determine the experimental
boundary conditions (e.g. dielectric medium or cellular environments) for
investigating aggregation dynamics.
3.2 Introduction
Image correlation spectroscopy (ICS) is a well - known technique in cell
biology that has been used for investigating the organisation of supramolecular
complexes (at a sub - micron scale), but has not been used for macromolecular
complexes (at nanometre scales) for coupled PNPs. Plasmon coupling is
61

Chapter 3 62
infact one of the methods used to look at 10-100 nm size regime utilising
PNPs as a ruler to measure the distance between two interacting molecules.
However, variation in scattering quantum yield (QY) becomes problematic
when introducing ICS in this size regime. These issues need to be resolved
before using ICS for AuNPs.
In this chapter, we will discuss the theory of image correlation spectroscopy
(ICS), high order image correlation spectroscopy (H -ICS) and boundary
conditions to perform H - ICS simulations. We will finish the chapter by
discussing the concept of interpreting H - ICS for coupled AuNPs utlising QY
of coupled AuNP dimer.
3.3 Image correlation spectroscopy (ICS)
Image correlation spectroscopy is a characterisation method for emitting
species in random configurations. [25] In recent decades, it has been
widely used to measure the transport properties and cell membrane protein
distribution of living cells. [22–24] The main use of ICS is to obtain information
of emitting species from confocal laser scanning microscopy (CLSM) or dark -
field scattering images by correlating the image with itself (Figure.3.1).
If the random intensity variable i, is a function of two independent variables x
and y, it is possible to define a corresponding two - dimensional autocorrelation
function
g(ζ, η) =< δi(x, y)δi(x+ ζ, y + η) >=1
NM
∑Nk=1
∑Mk=1 i(k, l)i(k + ζ, l + η)
1NM
∑Nk=1
∑Mk=1 i(k, l)
− 1,
(3.1)
Now the variance of the random function is equal to the value of the correlation
function in the limit where both ζ and η vanish. Thus we conclude that the

Chapter 3 63
⊗ =
Figure 3.1 Autocorrelation of an image.
density of the fluorescent particles can be measured by a magnitude of g (0,
0) that is
g(0, 0) = limζ→0limη→0g(ζ, η) = 1< N >
(3.2)
where, g(0, 0) is the autocorrelation function and < N > is the average number
of particles in a focal volume. The peak of the autocorrelation function g(0, 0)
indicates the average expected number of particles in a focal volume and
aggregation details of emitter species in an entire image.
In order to use ICS, the following conditions need to be understood. Image
correlation spectroscopy intrinsically does not account for the interaction
of emitters such as plasmon coupling. It also does not account for heavy
distribution in quantum yield, such as is observed in scattering images of
AuNPs. In addition, ICS does not account for orientation of anisotropic
material. Generally, when the quantum yield (QY) of the emitter is fixed,
and there is no interaction between the emitters, ICS is very accurate.
But since the QY of coupled plasmonic particles greatly depends on their
degree of aggregations, the simulated results of ICS on coupled samples
cannot be validated. Nevertheless, for polydispersed samples, higher order
autocorrelation analysis needed to be addressed as it cannot resolve the number

Chapter 3 64
density together with quantum yield, with only one correlation function. The
approach has been applied for studies of molecular aggregation, [172, 173]
analysis of ion channel kinetics, [174] image recognition, [175] and no -
equilibrium thermodynamics. [176, 177] High - order ICS has been introduced
for quantitative measurement of the number densities of different cluster sizes
present in multicomponent samples, [178, 179] but has not been introduced
for plasmonic nanoparticles. In the next section we will discuss about the
conceptual background of H - ICS and how to interpret it for plasmon coupled
particles.
3.4 High order image correlation spectroscopy
(H - ICS)
The methodology of H - ICS is analogous to ICS, except it is the autocorrela-
tion of squared or cubed intensity of the scattering images. [180] The beauty
of this technique is that, the peak value of the high order autocorrelation
function is highly dependent on the aggregates and therefore is able to provide
information about aggregates, such as dimer, concentration [181] (Figure.3.2).
Through already available analytical expressions of peak values, H - ICS
allows us to extract the concentration of emitters of different species and their
emitting quantum yield ratio simultaneously.
When a focused laser beam is scanning across the sample, the intensity
fluctuation at each pixel can be expressed as
δi(x, y) = i(x, y)− < i > (3.3)
Where i (x, y) is the intensity of the emitter measured at the pixel located at

Chapter 3 65
Figure 3.2 High order image correlation spectroscopy (H - ICS) correlation functions.Autocorrelation of squared and cubed images and corresponding high order correlationfunction.
(x, y), and < i > is the average intensity of the entire image. The spatial high
order autocorrelation function, Gm,n(0, 0), is defined as
Gm,n(ζ, η),= < δi(x, y)m >< δi(x+ ζ, y + η)n > − < δi >m< δi >n
< i >m+n (3.4)
where (m,n)εN are positive integer, (m ≤ n).
Considering three different species of aggregate present in the system, peak
values of the high order mode can be expressed following the equation
suggested by Palmer and co - workers [178]
G1,1(0, 0) =B2,
G1,2(0, 0) =4B33 ,
G2,2(0, 0) = 2B4 + 2B22 ,
G1,3(0, 0) = 2B4 + 3B22 ,

Chapter 3 66
4.0x10² 6.0x10² 8.0x10² 1.0x1030
3x10-14
6x10-14
9x10-14
1x10-13
Strongly coupled dimer
Weakly coupled dimer
σ sca
t (m
2 )
Wavelength (m)
Two monomers
0.1 11
2
3
4
5
6
Dim
er σ
scat
/ M
onom
er σ
scat
Sep / Diameter
(A) (B)
d
d
Figure 3.3 Finite difference time domain simulations and quantum yield of 80 nmdiameter gold nanosphere (AuNSs), (A) scattering cross - sections of 80 nm diameterAuNS at different separation and (B) quantum yield with respect to separation/diameter.
G2,3(0, 0) = 16B55 + 12B2B3,
G3,3(0, 0) = 16B63 + 30B2B4 + 15B3
2+15B23 ,
where,
Bk =∑Ri=1 α
ki < Ni >
[∑Ri=1 α
ki < Ni >]k
(3.5)
where, α2 is the emitting quantum yield ratio of the aggregate to the monomer
< N1 > is the concentration of the monomer and
<N2 > is the concentration of the dimer.
Theoretically, we can extract information of samples containing emitting
particles of infinite species by putting the values of m and n with 1, 2,
3....∞. Therefore, if more species are included in one image, simultaneous
equations of higher order will have to be solved to extract information about
the samples. For simplicity, in the following we will only deal with samples
with two populations. In this case, only the first three higher order normalised
moments need to be considered. The real solutions of the above equations
represent the population densities of the two species, N1 andN2, as well as their

Chapter 3 67
quantum yield ratio α2. Likewise, by solving the six higher order normalised
moments of the above equations we can solve for three emitting species.
In order to eliminate the contribution from the noise, the noise corrected spatial
high order autocorrelation was derived as follows
Gm.n(0, 0) |NS= Gm,n(0, 0) |Image< iimage >m+n −Gm,n(0, 0) |Noise< iNoise >
m+n
(< iImage>− < iNoise >)m+n
(3.6)
Here, main idea of the noise correction equation is to subtract the noise signal
from the original measured signals Gm,n (0,0) of the acquired images. [182]
3.4.1 Interpreting high order image correlation spectro-
scopy (H - ICS) for plasmon coupled particles
Quantum yield of AuNPs drastically varies for plasmon coupling. By
simulating PNP plasmon coupling we can extract the quantum yield ratio of
the aggregate to the monomer to interpret H - ICS for plasmon - coupled NPs
(Figure.3.3). Whenever two particles are brought close together the plasmon
resonance red shifts. If they are brought much closer together multiple peaks
will form due to higher order mode and band splitting.
From the FDTD simulation (Figure.3.3A), the total scattering strength of two
interacting AuNSs can be calculated integrating the entire spectrum regime
(400 - 1000 nm wavelength). By observing the total scattering strength with
respect to separation distance, it can be concluded that, whenever two particles
are further apart, there is no plasmon coupling, and total scattering strength
becomes doubled as they act as identical monomers (Figure.3.3B). From there
we can safely assume for 80 nm diameter AuNS dimers at 10% separation
that the quantum yield ratio of the aggregate to the monomer is ~ 4, which

Chapter 3 68
Monomer
Dimer
Figure 3.4 Simulated confocal laser scattering microscopy images (CLSM) containingmonomer and dimer mixture.
is the square of the dimer. Quantum yield is the same for 40 nm and 100
nm diameter AuNSs. Conversely, QY for AuNS trimers can be computed as
9, which is the cube of the trimer. Hence, using a QY value of 4 for dimers
simultaneous Eq.3.4 can be solved, for the first three higher orders normalised
moment, to extract the values of monomer and dimer concentration and QY.
3.5 Factors affecting precision of image correl-
ation spectroscopy (ICS)
Several factors are responsible for the accuracy of ICS. Quantum yield of
PNPs might change according to size, shape, orientation, material and coupling
effect, which subsequently affects the precision of ICS. For randomly oriented
rod, such as EBL fabricated randomly distributed PNPs, precision is at
its maximum, but this is reduced for oriented rods, such as electron beam

Chapter 3 69
microscopy (EBL) fabricated rods. Spatial distribution is also responsible
for the accuracy of ICS. Precision is highest for fixed quantum yield random
position samples, and decreases for fixed quantum yield fixed position samples.
Point spread functions of PNPs also vary from monomers to clusters which
may affect the precision of ICS. Several kinds of noise (e.g. background,
mechanical, electrical or shot noise) also impact on the accuracy of ICS. For our
study, we dealt with wet chemically synthesised AuNPs which are completely
random and determined the boundary condition simulating a similar condition
as the experimental condition. Later, we report on H - ICS simulations that
determined the concentration of monomers, dimers and QY for different noise
levels to determine the accuracy of the tool (Figures.3.6 and 3.7).
3.6 High order image correlation spectroscopy
(H - ICS) simulations
In order to validate the accuracy of H - ICS on two populations of plasmonic
random media analysis, we have simulated confocal laser scanning images of
samples containing monomers and dimers (α = 4) of gold nanospheres of 80
nm diameter (Figure.3.4). In the simulation, (Figure.3.4) the two species
had different intensities: one higher, lower. The higher intensity emitter was
designated as dimer with concentration per beam area N2. The lower intensity
emitters were considered to be monomer with concentration per beam area N1.
We spincoated a dilute solution of AuNS onto a co - ordinate marked EBL
fabricated grid (details of grid fabrication are illustrated in Section 4.4.2) with
the concentration adjusted to produce isolated particles and dimers. The
scattering spectrum produces a convolution of the focal spot and AuNSs in
the sample, which acts as a point source. Exploiting the convolution between

Chapter 3 70
1100 nm
1320 nm
FWHM = 465 nm
Figure 3.5 Typical confocal laser scattering point spread function profile from singleparticles (blue) and dimer (black). Red colour spectrum indicate analytical point spreadfunction using Vectorial Debye theory for objective 1.4 NA, at 715 nm wavelength forcircular polarisation. Debye theory [183] can be used to calculate the diffraction patternof an objective of high numerical aperture.
Gaussian beam and a point scatterer, Gaussian spot profile of the focusing
objective can be deduced. Figure.3.5, shows the cross - section of one of the
spot of scattered intensity, collected at the photomultiplier tube (PMT), when
the laser is scanned across the sample, producing a focal spot profile. The
full width half maxima (FWHM) and airy disk diameter of monomers were
465 nm and 1100 nm respectively, which is close to the theoretically expected
results for 1.4 NA focusing objective for circular polarisation. Similarly, airy
disk diameter of dimer is found at 1320 nm (1.2 times that of monomers).
Therefore, the e - radius of dimer was considered to be 1.2 times that of
monomer for H - ICS simulations presented in this thesis.
An FDTD simulation was conducted to explore the effect of plasmon coupling
(Figure.3.3). Integrating the whole scattering spectrum over the visible to near

Chapter 3 71
- infrared wavelength region, we estimated the intensity of dimers to be four
times that of monomers. In the electrostatic limit, the scattering intensity
increases with volume squared. Therefore, alpha can be estimated to be 4 for
dimers of gold nanospheres of small (80 nm) diameter. Applying a similar
hypothesis, intensity of trimer was estimated to be 9 times greater than of
monomers and so on for more than three emitter species or higher orders (as
illustrated in section 2.6).
We performed H - ICS of the simulated confocal laser scanning images and
extracted the input and output N1, N2 and α of 500 simulated CLSM images
(Figure.3.6). The result shows that, input and output monomer, dimer and
quantum yield follows a similar trend for certain monomer concentrations
(between 0.1 and 1 of input N1 concentration), but deviates for other
concentrations. The results show that the background noise correction is vital
in producing accurate results. In order to eliminate the contribution of noise,
we derived the noise corrected spatial high order autocorrelation function as
discussed in Eq.3.6 where, we subtracted the noise signal from the original
measured signals Gm,n (0,0). Therefore, we conducted H - ICS simulations to
extract the outputs N1, N2 and α.
Figure.3.8A shows the dark - field scattering images for AuNS incubated HeLa
cells sample. The green square in the acquired images shows the location
of noise Figure.3.8B, and inset Figure.3.8C shows recorded noise images in
the H - ICS simulations, which were subtracted from the measured signal for
better accuracy. Cell images with noise correction were recorded in H - ICS
simulations (Figure.3.8D).
In addition, the results of H - ICS simulations are shown with and without
noise correction for images with signal to noise ratio = 30 (Figures. 3.6 and

Chapter 3 72
(A) (B)
(C)
Figure 3.6 High - order image correlation spectroscopy (H - ICS) simulation results.The plots show the (A) N1, (B) N2 and (C) Alpha of the simulated sample withoutbackground noise. Each data point is averaged by analysis of 500 images.
3.7). H - ICS analysis shows good agreement with both input N1 and α when
input N1 is larger than input N2 , i.e.; when the density of monomers is higher
than that of dimers. Output N2 is also accurate when it is close to input N1.
Furthermore, output N1, N2 and α are more accurate for input concentration
N1>0.01. This result provides a better understanding of which concentration
we can and cannot use in H - ICS simulations. For the best performance of H
- ICS, it is important to operate under the aforementioned limits.
High - order ICS can provide average monomer concentration, average dimer
concentration and quantum yield. To calculate the total number of particles,
total number of oligomers (especially dimer number) and percentage of
oligomers, the following formula was used:
• Total number of AuNPs per beam area = average number of monomers
per beam area, N1 × 1 + average number of oligomers (e.g. dimer) per

Chapter 3 73
(A) (B)
(C)
Figure 3.7 High order image correlation spectroscopy (H - ICS) simulation results.The plots show the (A) N1, (B)N2 and (C) Alpha of the simulated sample with signalto noise ratio (SNR) = 3 0, and the e - radius of the diameters is 1.2 times of that ofthe monomers. Each data point is averaged by analysis of 500 images.
(A) (A)
(B)
(C)
(D)
Figure 3.8 (A) Dark - field scattering images for AuNS incubated human cervicalcarcinoma (HeLa) cell samples, (B) selected noise location for high - order imagecorrelation spectroscopy simulations, (C) recorded noise images in high - order imagecorrelation spectroscopy (H - ICS) simulations and (D) recorded AuNS attached HeLacell images with noise correction in high order image correlation spectroscopy (H - ICS)simulations.

Chapter 3 74
beam area, N2 ×√α.
• Total number of AuNPs in that total imaging area = (total number of
AuNPs per beam area × total imaging area (pixel base)) / (π (e - radius
)2 (pixel base))
• % Oligomers = (N2) ×√α) / (total number of AuNPs per beam area)
× 100%
• % Error = (|H - ICS dimer number| - |SEM dimer number|) / |SEM
dimer number| × 100%
After, acquiring the total number of monomers and dimers for the simulated
images, these can be compared with the real number of particles extracted from
correlated SEM or TEM images to determine the accuracy of the simulations.
3.7 Conclusion
In this chapter, we discussed the underlying theory of H - ICS and concept
of interpreting H - ICS for coupled AuNPs utlising QY of AuNP dimer as
discussed in Chapter 2. From the simulation results, we can conclude that,
high - order ICS can be used for plasmon - coupled AuNP dimers. However,
the accuracy of these tools under experimental conditions, is investigated in
Chapter 4, wherein AuNPs are embedded in a PVA matrix.

Chapter 4
Image correlation spectroscopy
of plasmon coupled gold
nanoparticles into dielectric
medium
4.1 Abstract
In this chapter we present a feasibility study of Image correlation spectroscopy
of weakly coupled gold nanoparticles to understand aggregation dynamics of
plasmonic nanoparticles embedded in a dielectric medium.
4.2 Introduction
Recently, plasmonic NPs have been utlised to investigate inter - particle
distances between two macromolecules. Plasmon coupling between pairs of
75

Chapter 4 76
nanospheres (NSs), nanorods (NRs), nanodiscs and nanoshells has been used
to detect the DNA - DNA, [101–103] DNA - protein, [104] and protein - protein
binary interactions. [105] Numerous research groups [21–25] have utilised the
plasmon ruler on the basis of spectral shift due to the coupling of two AuNPs.
The technique of measuring and monitoring the dynamic distance between
biological macromolecules on a nanoscale regime has proven useful. More
recently, plasmonic NPs have been considered a promising tool for probing
membrane proteins on cell surfaces. Reinhard and co - workers [26] attached
anti - EGFR antibody conjugated PNPs to EGFR protein expressing cells and
probed the membrane protein onto cell surfaces utilising the plasmon coupling
properties of aggregations at cell surfaces. A similar study was carried out by
Sokolov and co - workers [3], in which they attached PNPs to receptors and
identified cell signalling by looking at receptor trafficking inside the cell using
plasmon coupling. They were able to detect aggregations of PNPs inside the
cell through receptor trafficking.
Over the past few decades different microscopy based techniques such as
fluorescence resonance energy transfer (FRET), [184–187] image correlation
microscopy (ICM), [188, 189] fluorescence correlation spectroscopy (FCS),
[89, 172–175, 177–179, 190–199] and image correlation spectroscopy (ICS)
[198, 199] have been used to investigate molecular activities at sub-microscopic
resolution without destroying cells. FRET is limited to detecting two closely
separated (<5nm) molecules of different types. [184–187] ICM has been used
to characterise larger protein assemblies, but is limited to sub - microscopic
level and is highly sensitive to background interference. Furthermore, FRET
and ICM are critically limited by photo bleaching. Fluorescence correlation
microscopy (FCM) has been used for describing molecular events, molecular
activities and measuring transport properties of cell macromolecules on a fast
time scale (from microseconds to seconds), but it becomes more problematic
for measurements of slower protein transport. In order to overcome these

Chapter 4 77
difficulties, ICS was developed, to measure transport properties and cell
membrane protein distribution in living cells, but this still can not provide
aggregation details at the nanometre scale. [198, 199] For poly - dispersed
samples, higher order autocorrelation analysis has been applied to studies of
molecular aggregation, [172, 173] analysis of ion channel kinetics, [174] image
recognition, [175], and no - equilibrium thermodynamics. [176, 177] Higher -
order ICS has been used for quantitative measurements of number densities
of different cluster sizes present in multicomponent samples, [178, 179] but
has not been introduced for plasmonic NPs. In these circumstances, plasmon
coupling together with image correlation spectroscopy could be a promising
tool for sensitive detection of cell biology in the 10- 100 µm regime. ICS is a
well - established technique that can provide information regarding molecular
aggregation within focal volume, but is yet to be applied to plasmonic NPs
for characterisation of aggregation at the nanometre scale regime. Here, we
proposed the use of image correlation spectroscopy together with nanoparticle
plasmon coupling to investigate PNP aggregation dynamics, when PNPs are
embedded in a PVA matrix (e.g. dielectric medium).
4.3 Nanoparticle plasmon coupling and simu-
lations
We explored the plasmon coupling of 80 nm diameter AuNP dimers using
commercial FDTD software (Lumerical Solutions 7.5, Canada) (Figure.3.3A).
The red - shift in surface plasmon resonance (SPR) was found to peak with
decreasing inter - particle distance (weak coupling regime), and the amount
of red - shift is modelled with a modified universal plasmon ruler equation,
(Eq.2.17 with A = 1.13252, τ= 0.22513). This value is comparable to published

Chapter 4 78
Sep
(A) (B)
Figure 4.1 (A) Transmission electron microscope (TEM) images of gold nanoparticles(AuNSs) dropcasted onto a TEM grid, and (B) dimer separation histogram, showing75% of dimers are within 10% of separation of diameter.
results [25, 161] as discussed in section 2.5.1.
From the FDTD simulation (Figure.3.3A), we found that, there are multiple
peaks at strong coupling regimes due to hybridisation of plasmon energy,
and at weak coupling regimes (for example, 200 nm separation) the peak
is almost in the same position as the monomer peak (around 558 nm) and
intensity is doubled (Figure.3.3A). Therefore, total scattering strength of two
interacting AuNSs can be calculated integrating the whole spectrum. By
observing the total scattering strength with respect to separation distance it
can be concluded that, whenever two particles are at further distances, there
is no plasmon coupling, and total scattering strength is doubled as they act as
identical monomers (Figure.3.3B).
We determined the inter - particle separations for around 150 dimer particles
from TEM images, where 80 nm diameter AuNSs were randomly oriented onto
a TEM grid and the number of particles of specific separations was plotted as
a function of separation (Figure.4.1). From the histogram of PNP separations,
extracted from TEM images we found that, 75% of dimers are separated

Chapter 4 79
by less than 10% of their diameter. At separation of 10% of the diameter,
scattering strength reaches upto 4, from the initial value (Figure.3.3B), which
is actually squared (four times) for dimers. This is in line with electrostatic
approximation, where σscat∼| α2 |2∼ V 2. For 80 nm or smaller particles, it is
therefore valid to use V 2 as the QY for dimer. Similarly QY for trimers will
be cubed (nine times). These results are helpful for interpreting H - ICS for
coupled PNP’s (especially in the dimeric case).
4.4 High order image correlation spectroscopy
(H - ICS) of plasmon coupled nanoparticles
Before performing H - ICS simulation of the experimentally acquired images,
we simulated confocal laser scanning images of samples that contained
monomers and dimers (α = 4) of gold nanospheres of 80 nm diameter. From
section 4.2, the QY of AuNS dimer was estimated to be four times that of
monomers. To produce more accurate results, we subtracted the noise signal
from the measured signals as discussed in Eq. 3.6. We extracted the average
monomer number per beam area (N1), the average dimer/cluster number per
beam area (N2), and quantum yield (α2) for the selected scattered images.
Hence, to determine the total number of particles of the scattered images,
total imaging area and e - radius of the point spread function of scattered
particles were required.
Thus, we calculated the total area of the acquired images, taking the average of
80 images, which was 20 ± 2 µm2 (Figure.4.5A and C). Exploiting the values
of N1, N2, total imaging area and e - radius of the particles in the formula
(as illustrated in section 3.5), we calculated the total number of monomers
and percentage of oligomers in the total imaging area. Thus, we inspected the

Chapter 4 80
Figure 4.2 Gold nanoparticle (AuNP) characterisation: UV- vis spectra of bare goldnanosphere (AuNS) of diameter 80 nm compared with Mie theory and FDTD simulations.The UV- vis spectrum is the ensemble spectra and red shifted compared with Mie theoryand FDTD calculated for single particle spectra.
aggregation details of AuNPs interaction in the acquired images. Outcomes of
these analyses are presented in the experimental section.
4.5 Experimental
In this section we discusse sample preparation, grid fabrication and experi-
mental results.
4.5.1 Sample preparation
The 80 nm diameter Au nanospheres used in this study were purchased from
NanoSeedz Ltd (Hong Kong). To prepare different concentration samples,
nanosphere solution was dispersed 1:1 into an aqueous solution of 2% PVA
(molecular weight 36 kDa). This solution was then spin - coated onto a co
- ordinate marked fabricated (5 nm Ti layer) grid attached to a glass slide,

Chapter 4 81
with the spin parameters adjusted to produce an approximately 150 nm thick
nanorod/PVA film. The use of a PVA layer ensured that, the nanosphere
remained attached to the grid during multiple SEM sessions and due to the
co - ordinate marked grid, we could correlate the optical and SEM images
accurately. UV-vis spectra, of bare AuNS of diameter 80 nm compared with
Mie theory and FDTD simulations are shown in Figure.4.2.
4.5.2 Grid fabrication
To correlate optical images, we used an electron beam lithography (EBL)
fabricated grid (Figure.4.3). The EBL fabricated grid, contained three different
sized blocks (57 µm , 97µm , 137 µm). Each block contained 16 sub - blocks
of 13 µm , 23 µm and 33 µm respectively for imaging flexibility. Glass surface
were cleaned with acetone/ethanol/methanol/H2O and a 5 nm Ti adhesion
layer was added. Later, a 100 nm poly methyl methacrylate (PMMA) layer
was introduced, followed by e - beam exposure, Au sputtering and lift - off.
Each individual block contained five rows and five columns in total 25 sub
- blocks that could be traced by corresponding row and column values. For
example, in the magnified (red marked) grid in Figure.4.3A (marked as A to
- D in a vertical direction and 1 to - 4 in a horizontal direction), the first row
first column value is A1, and the last row last column value is D4.
4.6 Results and discussion
In this section, we will present the experimental results of investigation into
oligomerisation using H - ICS simulations, which will be followed by discussion
and conclusion, validating the H - ICS results using single particle spectroscopy.

Chapter 4 82
Figure 4.3 Grid fabrication: (A) scanning electron microscope (SEM) images ofmagnified grid location, (B) SEM images of fabricated full grid.
4.6.1 High order image correlation spectroscopy (H -
ICS) for plasmon coupled dielectric samples
We prepared samples of different concentrations (e.g. optical density 0 - 10, NP
concentration 2.75× 10⁹ to - 5.5× 10¹⁰ NPmL
). From the TEM images of different
concentrations we found, 2 - 4 ± 2, NP/µm2(from the average of 100 images)
for optical density 0 - 0.5, which we defined as the low concentration samples
and 20 - 30 ± 8, NP/µm2(value taken from average of 150 images) for optical
density 1 - 10 which we considered the high concentration sample. Prepared
samples were irradiated with Ti - sapphire femtosecond tunable (700 - 1100
nm) laser (Tsunami, Spectra - Physics) and then focused using a 1.4 numerical
aperture, an oil immersion objective lens (Olympus) and a 50 µm pinhole
(Figure.4.4). The sample was mounted onto a Piezo stage (PI) for scanning
and controlled using the program Labview. An oil immersion medium was used
to match the refractive index. The immersion oil ensured that there was no
background signal coming from the interface, and only the PNPs scatters and
scattering signals were collected using a photomultiplier tube (PMT, Oriel)
using a circular polariser. Figure.4.4 shows the schematic diagram of confocal

Chapter 4 83
Figure 4.4 Schematic diagram of laser scattering confocal set up.
laser scattering microscopy (CLSM) setup showing the major equipment.
We captured CLSM images of low (2 - 4 ± 2, NP/µm2) and high concentration
(20 - 30) ± 8, NP/µm2) samples for two mixed populations of species (e.g.
monomers and clusters). To investigate the ability of the method, the first
three higher order moments, upto G2(0, 0) of Eq.3.4 were calculated, to resolve
the monomer - dimer distributions of the captured images. We extracted the
average monomer number (N1), average dimer number (N2) and quantum
yield (α2) for six and seven different sets of 100 images each, for low and
high concentration samples respectively. To produce more accurate results,
we subtracted the noise signal from the measured signals as discussed in
Eq. 3.6. The mean values of the parameters measured from each set of
images were plotted as a function of concentration of population N1, N2 ,
and α2 (Figs.4.6A - 4.6C and Figs.4.7A - 4.7C). Examples of optical and SEM
correlated (low concentration) and uncorrelated (high concentration) samples
are shown in Figure.4.5. Acquired optical images (CLSM) of low concentration
samples matched perfectly with correlated SEM images (Figure.4.5A and B).

Chapter 4 84
(A) (B)
(C) (D)
Figure 4.5 Correlation of optical and SEM/TEM images of 80 nm gold nano - sphere.(A) confocal scattering images for low concentration samples and (B) correspondingcorrelated SEM images; (C) confocal scattering images for high concentration samples,and (D) corresponding un - correlated (same location) TEM images. scale bar = 4µm.
For high concentration samples, particles scattering overlapped due to the inter
- particle coupling effect. This coupling effect makes correlating optical and
SEM images difficult; however by tracing the EBL fabricated co - ordinate
grid, we confirmed that the optical images and SEM images were acquired
from the same location (Figs.4.5C and D).
From the noise corrected H - ICS simulated results (as discussed in section
3.5), we found that, H - ICS works convincingly, when monomer, dimer
and quantum yield concentration per beam area is above 0.1, 0.01 and 0.5
respectively, otherwise it deviates from the real values. In experimental
observations, of low and high concentration samples we found, monomer
particle density varied from 0.1 to - 0.40 particles per BA, dimer particle

Chapter 4 85
(A) (B)
(C) (D)
Figure 4.6 Low concentration sample :- The number of gold nanoparticles inaggregated samples was calculated using H - ICS and the real number. (A) calculatedaverage monomer number <N1> per beam area, (B) average dimer number per beamarea (N2), (C) quantum yield α2 and (D) percentage of oligomers for the selectedimages (A - F represent six different locations). The error bar represents standard error.Each data point is an average from analysis of 20 images.
density varied from 0.01 to - 0.05 particles per BA and quantum yield density
varied from 2∼4 (Figs.4.6A - 4.6C and Figs.4.7A - 4.7C), which are all within
the accuracy limit of H - ICS (as discussed in section 3.5). To retrieve accurate
values using the moment method, the density of monomeric particles must be
equal to or greater than the density of the dimer population otherwise the
results obtained can deviate from expected values. Additionally, numerous
kinds of background noise such as interference from surface, and detector dark
count affects the accuracy and precision of the results. The existence of noise
reduces the mean relative intensity fluctuations resulting in overestimation of
number densities and underestimation of the relative intensity yield. From the
simulated results (illustrated in Figure.3.7), an S/B ratio of 30 or higher would
be required to precisely resolve monomer - dimer distribution which perfectly
matches our experimental observations for varying concentrations.

Chapter 4 86
(A) (B)
(C) (D)
Figure 4.7 High concentration sample :- The number of gold nanoparticles inaggregated samples was calculated using H - ICS and the real number. (A) averagemonomer number per beam area, (B) average dimer number per beam area N2, (C)quantum yield α2 and (D) percentage of oligomers for the selected images (A - Grepresent seven different locations) and E) comparison of SEM and H - ICS dimernumbers. Thye error bar represents standard error. Each data point is an average fromanalysis of 20 images.

Chapter 4 87
Subtracting the noise signal from the original signal, we determined the total
number of particles and dimers in the selected regions, exploiting average
monomer number per beam area (N1), average dimer number per beam area
(N2), and e - radius of the particles. As illustrated in section 3.5 we considered,
the dimer e - radius 1.2 times that of the monomer. Additionally, with the help
of EBL fabricated co - ordinate grids, the total monomer and dimer numbers
were also determined from the correlated samples (low and high concentration
samples).
For both of the cases, (low and high concentration), we considered that,
our sample contained two emitters :- monomers and high order clusters (e.g.
dimers, trimers, tetramers). So the total number of particles was determined by
taking the sum of monomer and cluster numbers. H - ICS calculated monomer
and dimer numbers were compared with correlated real numbers of monomers
and dimers extracted from SEM. In our H - ICS simulation, we only considered
two emitter systems (monomers and dimers), and thus could not resolve the
contribution of high - order clusters (e.g. trimers, tetramers etc) as they were
considered to be dimers. An error (calculated using the formula discussed
in section 3.5) was produced when real monomer and dimer numbers were
compared with SEM images. The comparison between H - ICS and SEM
numbers showed a Gaussian distribution, concentrated at zero indicating that
the distributions frequency matches many time do they distribute (Figure.4.8).
The standard deviation of the distribution gives the error to be around 30 %
for N1, N2 and α2, which is quite acceptable for a large number of data sets.
Several factors are responsible for the error distribution and accuracy of H
- ICS. Point spread function distribution, due to the presence of trimers or
high order oligomers in the low and high concentration samples, significantly
affected the H - ICS results. Experimentally, e - radius of dimers is found

Chapter 4 88
(A) (B)
(C)
Figure 4.8 Error distributions for N1, N2 and α2 among 100 cases of imagesconsidering the contribution of monomers and high - order clusters (e.g. trimers andtetramers). The distribution of error varied from 0% to - 30 % due to the presence ofhigh - order clusters.
(A) (B)
(C)
Figure 4.9 Error distributions for N1, N2 and α2 among 100 cases of imagesconsidering monomer and dimer contribution. Discarding the contribution of high ordercluster (e.g. trimers, tetramers), only considering the contribution of monomers anddimers, the error can be reduced to 10 % , and the accuracy of the H - ICS analysis canbe improved.
.

Chapter 4 89
(A) (B)
Figure 4.10 (A) Intensity variation due to polarisation sensitivity (00-1800).Experimental values for dimer one and two extracted from polarisation dependent imagesfor 00-1800, fit perfectly with cosine, showing cos2 dependency and (B) dimer spectrumextracted from wavelength dependent images from 700 - 900 nm wavelength matcheswith FDTD simulated AuNS dimer spectrum of 2 nm separation.
to be about 1.1~2 times greater than monomers (0.46 µm) (see section 3.5).
If, focal size increases, the number of particles in the given region decreases,
therefore number of particles per focus volume increases. Discarding the high
order clusters, only considering the contribution of dimers and monomers and
carefully adjusting the e - radius of dimers (0.55 µm) the accuracy of H - ICS
was improved. In this case, standard deviation of the distribution gave an
the error around 10 % for N1, N2 and α2, significantly improving H - ICS
performance (Figure.4.9). Figure.4.8 shows the error distribution among 100
cases of images. The distribution of error varies from 0% to - 30 % due to the
presence of high order clusters. This would reduce the error by upto 10% (see
Figure.4.9).
4.6.2 Validating high order image correlation spectro-
scopy (H - ICS) results using single particle
spectroscopy
We acquired polarisation dependent images, by using a linear polariser and
varying the incident angle from 00 to - 1800 at 150 intervals. From the

Chapter 4 90
Figure 4.11 Dimer number calculated using polarization spectroscopy and H - ICStechnique and compared with the dimer number extracted from SEM images.
polarisation dependent images, we found that, some of the particles show
cosine squared dependency (Figure.4.10A), due to their dipolar characteristic.
However, with a change of polarisation the remaining particles (monomers) do
not show dependency (e.g. linear dependency).
We also performed the wavelength dependent imaging for 700 - 900 nm
wavelengths using a circular polariser at 10 nm intervals. Particle intensity
decreases with an increase in wavelength in the 700 - 900 nm spectral range
(Figure.4.10B). Experimentally acquired spectra were compared with FDTD
simulated dimers for several separations, which fit nicely with 2 nm separations,
confirming that they are dimers, in line with the polarisation dependency
results for the correlated images (Figure.4.5). Therefore, we extracted the
monomer and dimer number for the correlated images and compared these
with the H - ICS simulated results.
Figure.4.11 shows the comparison of dimer numbers at six different locations
(A - F) using H - ICS, SEM and polarisation spectroscopy techniques. As an
example, for location C the extracted dimer number is 5 which is similar to the

Chapter 4 91
polarisation and SEM extracted dimer numbers. The situation is almost the
same for the other locations, except for a few deviations due to the presence
of high - order clusters (e.g. - trimers, tetramers).
4.7 Conclusion
In this chapter, through extensive simulations and experiments, for the first
time, aggregation of randomly distributed AuNP inside a polymer matrix has
been demonstrated using ICS for plasmon - coupled nanoparticles. Monomer
and dimer numbers were calculated by performing ICS together with plasmon
coupling, and these number corresponded closely with the real number
of monomers and dimers determined by SEM/TEM images for low and
high concentration samples. This technique could be extended to cellular
environments to investigate PNP uptake and oligomerisation inside cells. This
finding paves the way for cell biologists to utlise plasmonic PNPs for labelling
and investigating PNP - cell interactions, aggregation and uptake kinetics to
understand the signaling pathways of intact cells in the unexplored regime (10
- 100 nm).

Chapter 4 92

Chapter 5
Gold nanoparticle uptake and
aggregation dynamics in HeLa
cells using image correlation
spectroscopy
5.1 Abstract
In this chapter we present a feasibility study of image correlation spectroscopy
of three different surface modified (e.g. bare, PEG and maleimide coated)
gold nanoparticles (AuNPs) of 50 nm, 80 nm and 100 nm diameter. We
bridge an existing probing technique, image correlation spectroscopy with
plasmon coupling for understanding aggregation dynamics and nanoparticle
uptake kinetics in HeLa cells. Optimum AuNP size for maximum uptake and
highest oligomerisation will be identified as a function of surface charge and
incubation time. The findings will pave the way for cell biologist to utlise this
tool to understand PNP uptake and aggregation dynamics of in - vitro cellular
93

Chapter 5 94
studies.
5.2 Introduction
Plasmonic nanoparticles exhibit excellent optical properties due to their size,
shape and tip geometry. Thus they have been extensively used in biological
applications including biological imaging, [1–6] bio labelling and sensing, [7]
photothermal cancer therapy, [8, 9] drug and gene delivery, [7, 10] and probing
membrane proteins. [11, 12] Understanding of PNP - cell interactions at the
single particle level is poor. However, previous work to understand PNP - cell
interactions has focused on cellular uptake and cytotoxicity, [13–20] in relation
to PNP size, shape, [14] surface effects [15] and aggregation effects. [16, 200]
Factors that have not been demonstrated methodically and which therefore
require further study, include quantitative and qualitative cellular uptake of
PNP, molecular aggregation and cellular movement with respect to PNPs size,
shape, concentration and incubation time.
Indeed, PNP uptake quantification methods are still in their infancy, including
destructive electron microscopy, inductively coupled plasma atomic emission
(ICP - AES) or inductively coupled plasma mass spectroscopy (ICP - MS).
TEM analysis could provide high resolution images (nm scale length) of
inner structures but cannot be used for live - cell imaging as it destroys
cells. Non - destructive microscopic optical methods such as image correlation
spectroscopy combined with dark - field scattering microscopy are ideal for
characterisation but until now have not been used for plasmonic nanoparticles.
Image correlation spectroscopy (ICS) was introduced as an imaging extension
of fluorescent correlation spectroscopy (FCS) to measure molecular transport
and aggregation in fixed cells. [190, 199, 201]
So far, no systematic study on cell uptake of AuNPs and aggregation has

Chapter 5 95
been conducted. A good characterisation method is needed to accurately
quantify AuNP aggregation behaviour. Image correlation spectroscopy (ICS)
is a powerful image analysis tool, but has not been extended to plasmonic
nanoparticle applications yet. [199] To address this challenging task, we bridge
an existing probing technique, image correlation spectroscopy with plasmon
coupling to quantify the PNP uptake and aggregation dynamics of in - vitro
cellular studies.
In chapter 4, we studied the feasibility of the H - ICS technique to investigate
AuNPs aggregation in a dielectric medium, where spherical AuNPs were
embedded in polyvinyl alcohol (PVA) at varying concentration to induce
aggregation. In the present study, we extended our technique into a cellular
environment, where different surface modified plasmonic nanoparticles were
incubated with human cervical carcinoma (HeLa) cells, to study PNP uptake
kinetics and aggregation dynamics.
For our study, we selected the bare, PEG and maleimide coated AuNSs of
50, 80 and 100 nm diameter. We acquired dark - field scattering images
and performed H - ICS utilising nanoparticle plasmon coupling. From the
simulated results, we explored the AuNP uptake and aggregation kinetics as a
function of size, surface charge and incubation time.
5.3 High order image correlation spectroscopy
(H - ICS) of plasmon coupled nanoparticles
To calculate AuNP uptake and aggregation, we performed H - ICS on the
acquired images and solved simultaneous equation 3.4, extracting N1 average
monomer number per beam area, N2 average dimer/cluster number per beam
area and α2 quantum yield for the selected dark - field scattered images. To

Chapter 5 96
(A) (B)
(C)
Figure 5.1 Gold nanoparticle characterisation: UV - vis spectra of bare, PEG andmaleimide coated AuNSs of diameter, (A) 50 nm (B) 80 nm and (C) 100 nm.
determine the total number of particles of the scattered images, we needed to
know the total cell area and e - radius of the scattered particles.
Thus, we calculated the total area of cells taking the average of 100 cells
which is 30 ± 8 µm2. Inserting the values of N1, N2, α2, total imaging area
and e - radius of the particles, we calculated the total number of monomer
and percentage of oligomers in the total imaging area, following the formula
discussed in section 3.5. Therefore, we extracted AuNP uptake and percentage
of oligomerisation for bare, PEG and maleimide coated AuNS samples of 50,
80 and 100 nm incubated with HeLa cells as a function of incubation time.
Outcomes of these analyses are presented in the experimental section.

Chapter 5 97
Samples UV - vis(nm) (Exp)1 Size(nm)2 pH3
Bare NS - 50 532 50±4 6~8PEG - NS - 50 527 50±4 7
Maleimide - NS - 50 538 - -Bare NS - 80 553 80 ± 6 6~8PEG - NS - 80 553 80 ± 6 7
Maleimide - NS - 80 552 - -Bare NS - 100 567 100±8 6~8PEG - NS - 100 563 100±8 7
Maleimide - NS - 100 566 - -
Table 5.1 UV - vis spectrum peak (nm), size distribution (nm) and pH for bare, PEGand maleimide coated 50 nm, 80 nm and 100 nm diameter gold nanosphere (AuNS).Here, 1 represents the measured value 2 and 3 represents company supplied values.
5.4 Surface modified AuNPs - HeLa cell sample
preparation
In this section, we will discuss AuNP sample preparation, HeLa cell culture
and incubation of AuNPs with HeLa cells. We will conclude this section by
presenting the experimental set up and characterisation.
AuNP sample preparation
The 50, 80 and 100 nm diameter bare and PEG AuNSs used in this study were
purchased from NanoSeedz Ltd (Hong Kong) and 50, 80 and 100 nm diameter
maleimide AuNSs were purchased from Nanopartz (USA). The solution was
diluted to prepare optical density one , (1.1 ×10¹⁰ AuNPmL
) and spectrum was
recorded using UV - vis spectrometer (Figure.5.1). Gold nanosphere solution
was then centrifuged for 15 min at 6000 rpm and the supernatant was discarded
adding a similar amount of distilled water to AuNP pellets. Then AuNPs
were sonicated for 10 min to minimise the aggregation followed by 30 min
of UV light exposure (inside a bio - safety cabinet) for sterilisation purposes.
Figure.5.1 shows the UV - vis spectrum of 50, 80 and 100 nm diameter AuNS.

Chapter 5 98
Samples Zeta (mv) Mobility pH CoatingBare NS - 100 -17.82± 2.85 -0.81± 0.62 8.2 CTABPEG - NS - 100 -22.03± 2.70 -1.15± 0.14 8.5 PEG
Maleimide - NS - 100 -26.48± 1.70 1.41 ± 0.07 8.3 Maleimide
Table 5.2 Zeta potential, mobility and pH for bare, PEG and maleimide coated 100nm diameter AuNSs.
Additionally, Table.5.1 shows the UV - vis spectrum, size distribution and pH
of 50, 80 and 100 nm diameter AuNSs.
HeLa cell culture
Dulbecco’s Modified Eagle Medium (DMEM) was purchased from Sigma
Aldrich, (AU). Foetal bovine serum (FBS), glutamine, penicillin/streptomycin
and amphotericin B were obtained from Life Technologies, (AU) and used as
received. HeLa cells were maintained in DMEM supplemented with 10% (v/v)
FBS, 1% (v/v) glutamine and 0.5% (v/v) amphotericin B in a humidified
atmosphere (95% (v/v) air, 5% (v/v) carbon dioxide) at 37 °C. Cells (1.5 x
104 cellscm2 ) were trypsinised and seeded under serum - free conditions in a µ -
slide chamber (Dksh, AU) containing a coverslip. Samples were incubated for
one day at 37°C / 5% CO2 to allow cell attachment.
Incubation of AuNPs with HeLa cells
Therefore, 100 µL of different functionalised AuNSs was added to the cultured
HeLa cells and PNP cell complexes incubated for fixed incubation times (e.g.
30 min, 1 hr, 6hrs, 12 hr, 18 hrs, 24 hrs, 48 hrs and 72 hrs). Finally, cells were
fixed with 3.7% (v/v) formalin for 10 min, followed by three rounds of washing
with phosphate buffered saline (PBS) for 5 min.
Characterisation
Absorption spectra of different functionalised (bare, PEG and maleimide
coated) AuNSs of 50, 80 and 100 nm diameters were taken on a UV - vis

Chapter 5 99
CCD
AuNP-Cell Sample l
Mirror
Halogen Lamp
Objective
Dark Field Condenser
Ti/S -100
Microscope
Figure 5.2 Schematic diagram of dark field microscopy set up.
spectrometer (Figure.5.1). To determine the surface charge of our surface
modified AuNP samples, we calculated the zeta potential using the Huckel
model on a 90 Plus particle analyzer, Brookhaven Instruments Corporation
(USA). To do so, firstly we conditioned the electrode using 0.15 M KCl . We
proceeded to the next step, whenever the conductance value exceeded 3 x 10⁴
µS. For dilution purposes, bare, PEG and maleimide samples were mixed into
1 : 100 distilled water. Finally, we ran the program to calculate zeta potential
and mobility for three sets of measurements of individual samples for around
15 trials and took average values. The results are presented in Table.5.2.
Cell cultures on coverslip were mounted in microscopy mounting media
(Aquatex, Merck Millipore, AU). Three different diameters (50, 80 and 100
nm) of surface modified (bare, PEG and maleimide) AuNS samples of several
incubation times (30 min, 1 hr, 6 hrs, 12 hrs, 18 hrs, 24 hrs, 48 hrs and 7 2hrs)

Chapter 5 100
6hr 12hr
18hr 24hr
48hr 72hr
Figure 5.3 Dark - field scattering images of 50 nm diameter bare gold nano sphere fordifferent incubation times.
were imaged with a dark - field inverted microscope (Eclipse Ti - S, Nikon,
AU), using a 1.2 - 1.3NA (Nikon, AU) dark - field condenser and a 0.6 - 1.3NA,
100x oil immersion objective lens. White light was used for excitation, and
scattering images were acquired with a Nikon DS - Fi1c - U3 5Mb coloured
cooled digital camera.
Figure. 5.2 shows the dark - field scattering setup showing the major
components used :- a Nikon Ti - s/L100 microscope, a 100W white light as an
excitation source, focusing lenses, a 0.8 - 95NA dark - field condenser, a 0.75
NA 40x objective lense, and a Nikon colour CCD DS - Fi1c to capture the
scattering images.

Chapter 5 101
5.5 Experimental results
In this section, we discuss the experimental results of investigating the AuNP
uptake and oligomerisation for three different surface modified AuNP attached
HeLa cell samples. H - ICS simulation results will be presented to investigate
the AuNP uptake and oligomerisation as a function of AuNP size, surface
chemistry and incubation time.
5.5.1 High order image correlation spectroscopy (H -
ICS) for gold nanoparticle incubated HeLa cell
images
We captured the dark - field scattering (DFS) images of different surface
modified AuNPs (e.g. bare, maleimide and PEG) attached to HeLa cells
(Figs.5.3 - 5.6). To investigate the efficacy of the method, H - ICS simulations
were performed to resolve the distributions of the captured images (in total
1500 images). We performed the H - ICS exclusively for three surface modified
AuNPs (e.g. bare, maleimide and PEG) of 50, 80 and 100 nm diameter
attached to HeLa cells. We captured 20 dark - field scattering (DFS) images for
each incubation time for three different diameter (e.g. 50 nm, 80 nm and 100
nm) and three surface modified AuNPs samples. Dark - field scattering images
comprise two emitters (monomers and dimers only due to low optical density of
AuNPs) and H - ICS simulations were performed for the captured DFS images
for the first three higher order moments, upto G2,2 (0, 0) of equation 3.4, to
extract the values of average monomer number <N1>, average dimer number
<N2> and quantum yield α2. The mean value of the parameter was measured
from each set of images, and plotted as a function of incubation time to extract
the concentration of emitters <N1>, <N2> and their quantum yield ratio α2.

Chapter 5 102
6hr 12hr
18hr 24hr
48hr 72hr
Figure 5.4 Dark - field scattering images of 80 nm diameter maleimide coated goldnano - spheres for different incubation times.
For the case of surface modified AuNPs of 50 nm, 80 nm and 100 nm diameters,
attached to HeLa cell samples the monomer particle density varied from 0 to -
1.5, 0 to - 3.0 and 0 to - 1.5 particles per beam area (BA), dimer particle density
varied from 0 to - 0.5, 0 to - 1.2 and 0 to - 0.5 particles per BA for 50 nm, 80
nm and 100 nm diameter AuNSs respectively (Figuress.5.7 - 5.9). Quantum
yield ratio varied from 2 to ~ 4 confirming that, most of the NP attached to
HeLa cells are in dimeric form and there might be very few chances of getting
higher order clusters (e.g. trimers, tetramers or higher) and the variation is
due to the separation distance of dimers.

Chapter 5 103
6hr 12hr
18hr 24hr
48hr 72hr
Figure 5.5 Dark - field scattering images of 100 nm diameters PEG coated gold nano- spheres for different incubation times.
From the simulated results in section 3.5, it was observed, ICS performed well
when the density of monomeric particles was equal to or greater than the
density of the dimer population. As discussed in chapter 3, several kinds of
background noise such as interference from surface, detector dark counts affect
the precision of ICS. We confirmed with the simulation, an S/B ratio of 30 or
higher would be required to precisely resolve monomer - dimer distribution.
In our experimental observations, monomer density was greater than dimer
density (Figs.5.7 - 5.9). In order to eliminate the contribution of noise,
we derived the noise corrected spatial high order autocorrelation function

Chapter 5 104
as discussed in equation 3.6 where, we subtracted the noise signal from the
original measured signals. Therefore, exploiting average monomer number per
beam area <N1>, cluster number <N2> per beam area and multiplying the
N1 and N2 values with total area, total numbers of clusters in the selected
region of interest were determined.
As we used lower concentrations of AuNS (one optical density, 1.1 ×10¹⁰
AuNPmL
), we presumed our DFS images contained two emitters (monomer
and dimer), which was mimicked in our experimental observation as our
quantum yield varied between 2 - 4 (Figures.5.7C, 5.8C and 5.9C). From
our previous experimental observation illustrated in section 3.5 we have seen
dimer point spread function is larger than monomer and e - radius is 1.2
times greater than monomers (section 3.5). With the increase of point spread
functions, the numbers of particles in the given region decreases, as does
the number of particles per focus volume which significantly affects the H
- ICS results. Though, we anticipated error for our H - ICS results due to
different background noise level, point spread functions, which are minimized
considering greater number of images. In addition, the error bar was calculated
taking the average over 20 images per incubation times and placed in all
calculations (Figures.5.7 - 5.9). H - ICS simulated results of 50, 80 and
100 nm diameter surface modified (e.g. bare, PEG and maleimide) AuNSs
oligomerisation and uptake by HeLa cells are presented in (Figures.5.7D, 5.7E,
5.8D, 5.8E and 5.9D, 5.9E). From the H - ICS simulated results, an increasing
trend was observed for plasmonic nanoparticle internalisation and aggregation
with increasing incubation time.

Chapter 5 105
Maleimide
PEG Bare
Figure 5.6 Dark - field scattering images of 80 nm diameter bare, PEG and maleimidecoated gold nano - spheres for two days incubation.
5.5.2 Gold nanoparticle uptake due to surface modific-
ation
When surface modified (e.g. bare, PEG and maleimide) AuNPs attached to
HeLa cells they responded differently in accordance with surface chemistry. H
- ICS simulation was performed on different surface modified AuNPs incubated
HeLa cell images, (Figs.5.7E, 5.8E and 5.9E). For 50 nm diameter AuNSs we
can speculate that, bare, PEG and maleimide AuNPs follows an increasing
trend and become saturated after 48 hrs of incubation except for bare at 24
hrs (Figure.5.7E). Bare AuNP uptake is faster than PEG or maleimide AuNPs.
At 80 nm diameter we can presume that, PEG and maleimide AuNSs show a
similar increasing trend except maleimide AuNP uptake, is slowest (upto 24 hr)
compared with PEG AuNPs and becomes saturated after 48 hrs incubation

Chapter 5 106
(A) (B)
(C) (D)
(E)
Figure 5.7 Cellular uptake and aggregation kinetics of 50 nm diameter goldnanoparticles (AuNPs) as a function of incubation time for different surface modifiedgold nanospheres (AuNSs). (A) H - ICS extracted monomer number per beam area, (B)H - ICS extracted oligomer (mostly dimer) number per beam area, (C) H - ICS extractedquantum yield, (D) cellular uptake of gold nanoparticles (AuNPs) and ( E) percentageof oligomers.

Chapter 5 107
(A) (B)
(C) (D)
(E)
Figure 5.8 Cellular uptake and aggregation kinetics of 80 nm diameter goldnanoparticles (AuNPs) as a function of incubation time for different surface modifiedgold nanospheres (AuNSs). (A) H - ICS extracted monomer number per beam area, (B)H - ICS extracted oligomer (mostly dimer) number per beam area, (C) H - ICS extractedquantum yield, (D) cellular uptake of gold nanoparticles (AuNPs) and ( E) percentageof oligomers.

Chapter 5 108
(A) (B)
(C) (D)
(E)
Figure 5.9 Cellular uptake and aggregation kinetics of 100 nm diameter goldnanoparticle (AuNPs) as a function of incubation time for different surface modifiedgold nanospheres (AuNSs). (A) H - ICS extracted monomer number per beam area, (B)H - ICS extracted oligomer (mostly dimer) number per beam area, (C) H - ICS extractedquantum yield, (D) cellular uptake of AuNPs and ( E) percentage of oligomers.

Chapter 5 109
time (Figure.5.8E). PNP uptake of bare AuNSs dramatically increases with
shorter incubation time compared with PEG and maleimide AuNSs showing
highest uptake at 18 hrs incubation time, then reducing significantly and
becoming saturated after 48 hrs incubation. For 100 nm diameter AuNSs
we can conclude that, PNP uptake for maleimide and PEG coated AuNSs
shows an increasing trend upto 24 hrs incubation, and becomes saturated after
48 hrs incubation (Figure.5.9E). Interestingly, PNP uptakes for bare AuNSs
was higher at shorter incubation times compared with PEG and maleimide
AuNSs but became saturated after 48 hrs incubation. In general, PNP uptake
for maleimide coated AuNSs was higher for 50 nm diameter AuNPs, lower
for 80 nm diameter AuNPs and in between for 100 nm diameter AuNPs
(Figures.5.7 - 5.9). In contrast, PNP uptake was higher for 50 nm diameter
AuNPs, lower for 100 nm diameter AuNPs and in between for 80 nm diameter
AuNPs (Figures.5.7 - 5.9) for both PEG - coated and bare AuNSs. HeLa cells
responded impeccably to PEG and maleimide coated PNP. A good number
of cells were visible after 24 hrs incubation but few cells were visible for bare
PNPs after 24 hrs incubation due to the toxicity effect.
5.5.3 Gold nanoparticle oligomerisation due to surface
modification
For 50 nm diameter AuNSs we can conclude that, bare AuNSs oligomerise
faster at shorter incubation times than PEG and maleimide AuNPs (Fig-
ure.5.7D), which shows similar oligomerisation kinetics. For 80 nm diameter
AuNSs, bare AuNSs oligomerise faster (reaching maximum value of 55 % at
shorter incubation time of 24 hrs) than PEG and maleimide NPs (Figure.5.8D).
PEG AuNS oligomerisation was slower and maleimide was slowest at shorter
incubation times. For 100 nm diameter AuNSs there was similar increasing
trend for PEG, bare and maleimide AuNS, oligomerisation reached maximum

Chapter 5 110
for PEG coated AuNPs (50%) at 24 hrs and becames saturated after 24hrs
(Figure.5.9). Interestingly, oligomerisation was faster (reaching maximum at
24hrs) for 100 nm diameter PEG - coated AuNSs, but slower for maleimide
and bare AuNSs. On the basis of our results, we can speculate that,
different surface modification mediates plasmonic nanoparticle uptake and
oligomerisation differently as a function of different incubation time.
5.5.4 Effect of size on gold nanoparticle uptake
Gold nanoparticle uptake varies for different size nanoparticles and different
incubation times (Figure.5.10). Bare nanoparticle uptake rate is faster for 50
nm diameter gold nanoparticles and reaches its maximum at 18 hrs incubation
time; uptake rate is slower for 80 nm diameter and slowest for 100 nm diameter
AuNSs (Figure.5.10A). PEG nanoparticle uptake rate is faster for 50 nm
diameter gold nanoparticles slower for 80 nm diameter nanoparticles, and
in between for 100 nm diameter nanoparticles (Figure.5.10B). Surprisingly,
maleimide nanoparticle uptake rate is faster for 100 nm diameter gold
nanoparticles slower for 80 nm diameter, and in between for 100 nm diameter
(Figure.5.10C). For bare, PEG and melaimide coated AuNSs, uptake reaches
its maximum (e.g. around 400 AuNPs) after longer incubation time (e.g. 3
days). One of the possible reasons may be that, there are no unbounded
protein sites available on the surface of gold nanoparticles for further binding.
This result suggests that, different diameter AuNPs respond differently with
different surface modified particles, due to the different membrane wrapping
time required by HeLa cells. These results are in line with published results
[13, 14], which suggest, surface charge influences AuNPs uptake. Different
functional group are also responsible for distinct uptake kinetics suggesting
that, there might be an optimal size for which specific surface modified gold
nanoparticle uptake will be highest.

Chapter 5 111
(A) (B)
(C)
Figure 5.10 Effect of size on (different surface modified) gold nanoparticle uptake fordifferent incubation times.
5.5.5 Effect of size on gold nanoparticle oligomerisation
Gold nanoparticle oligomerisation varies for different size nanoparticles and
different incubation times (Figure.5.11). Bare - coated 50 nm diameter
nanoparticle show fastest oligomerisation, 80 nm diameters nanoparticles
are slower and 100 nm diameter nanoparticles are slowest (Figure.5.11A).
Interestingly, for PEG coated gold nanoparticle oligomerisation is fastest for
80 nm diamter. Therefore, 100 nm diameters PEG coated nanoparticles
show highest oligomerisation (e.g. 45%) at the shorter incubation time 24
hrs, compared with other diameters (Figure.5.11B). In maleimide coated
nanoparticles of 50 nm, 80 nm and 100 nm diameter uptake is similar at shorter
incubation times. Though similar to PEG coated AuNSs, maleimide coated
100 nm diameter AuNSs shows highest oligomerisation (e.g. 40%) after shorter

Chapter 5 112
(A) (B)
(C)
Figure 5.11 Effect of size on (different surface modified) gold nanoparticleoligomerisation for different incubation times.
incubation times (e.g. 24 hrs). For all cases, AuNP uptake becomes saturated
for longer incubation times. This result suggests that, different diameter
gold nanoparticles respond differently with different surface modified AuNSs
and there might be an optimal size for surface modified gold nanoparticles
oligomerisation.
5.6 Discussion
Plasmonic nanoparticle - cell interaction and uptake depends on PNP size
and shape. However PNP surface modification (e.g. PEG, PAA, PAH and
maleimide) or functionalisation with different biomolecules (e.g. protein,
DNA) notably affects their interaction. [50]
In 2006, PNP uptake was carried out by Chan and co - workers [14] for 14,

Chapter 5 113
50 and 74 nm diameter of AuNSs and 40×14 and 74×14 nm AuNRs. Among
these 50 nm diameter AuNSs showed most efficient uptake using ICP - AES.
Jiang and co - workers [51] reported minimal uptake for 25 - 50 nm (among 2,
10, 25, 40, 50, 70, 80 and 90 nm) transferrin coated AuNSs, attached to HeLa
cells, quantified by TEM and laser capture microdissection (LCM). Wang and
co - workers [52] reported maximal uptake for 45 nm AuNSs (among 45, 70 and
100 nm) attached to HeLa cells using TEM and dark - field microscopy. In our
study, we observed maximal uptake for 50 nm AuNS (among 50, 80 and 100
nm) for three surface modified AuNS. A possible reason for minimal uptake
due to optimal size (e.g. 50 nm diameter) could be that, 50 nm diameter
spherical particle require minimal time to wrap around spheres compared with
other diameter particles, which therefore increases AuNP uptake, which is in
agreement with previously reported experimental observation [14, 51–53] and
thermodynamic calculations. [54]
Previously, Chan and co - workers studied the AuNPs cellular uptake kinetics
of gold nanoparticles as a function of incubation time (upto 10 hr) for three
different size gold nanoparticles (diameters of 14 nm, 50 nm, and 74 nm) and
found AuNP uptake increases with an increase of incubation time. However,
AuNPs show an increasing trend upto a certain incubation time and become
saturated at longer incubation times.
Recently Sheng and co - workers [202] reported the endocytosis of AuNPs (e.g.
45 nm, 70 nm and 110 nm diameter), in various cells (the human cancer cell
lines, CL1 - 0 and HeLa). They identified 3D distribution of AuNPs in living
cells using a dark - field optical sectioning microscope. Their statistical results
showed maximum uptake for 45 nm AuNPs for both cell types. They found
the total number of AuNPs (in and on HeLa cells) were 2167 , 564 and 108 for
45 nm, 70 nm and 110 nm respectively when AuNPs were functionalised with
single - stranded DNA (ssDNA) and attached to HeLa cells for 2 hours.

Chapter 5 114
In our study using the combined technique, considering all incubation times
(30 min to 3 days), maximal AuNPs uptake by 50 nm diameter AuNS was 560
± 35, 512 ± 17 and 482 ± 16 for bare, PEG and maleimide coated AuNSs
respectively. Maximal AuNP uptake by 80 nm, diameter AuNS was 450 ±
32, 345 ± 28, 370 and ± 40 for bare, PEG and maleimide coated AuNSs
respectively. Similarly, maximal AuNPs uptake by 100 nm, diameter AuNS
was 398 ± 31, 375 ± 12 and 405 ± 10 for bare, PEG and maleimide coated
AuNSs respectively.
During these experimental analyses it was observed that, initially AuNP
uptake by cells appeared to be dependent on the geometry and surface charge of
nanoparticle, however, at later incubation time uptake became saturated and
equilibrated to a level irrespective of geometry and surface chemistry. These
slight variations in uptake rate and oligomerisation may be due to difference
in the internalisation mechanisms, whereas saturation of AuNS uptake and
oligomerisation at longer incubation times may be due to inadequate protein
site availability on AuNPs surfaces for binding, [14]
PNP uptake could be either endocytosis (or other energy - dependent
mechanisms) or membrane association. A previous study suggested that a,
greater degree of uptake is energy dependent or due to endocytic mechanisms
and some amount of nanoparticle uptake could be independent of energy
activitye (membrane association), suggesting PNPs could interact with the
membrane of the cell and facilitate uptake. [203]
Endocytosis is not always the only mechanism of internalisation, as membrane
association of nanoparticles can induce physical interactions that allow particle
internalisation. However, all geometries show very different uptake and
aggregation profiles as a function of incubation time, in line with previous
results. [13, 14, 53] These observations suggest that the mechanisms by which
the particles enter the cells vary and are dependent on their relative size and

Chapter 5 115
surface chemistry.
Size dependent AuNP uptake can be explained by thermodynamic model
of the many PNP - cell system [54, 90, 92, 95, 96] for receptor - mediated
endocytosis. [204, 205] For AuNPs uptake there are two competing energies -
one is the binding energy between ligands and receptors and the other is the
thermodynamic driving force for wrapping. Binding energy depends on degree
of ligand - receptor interaction and the diffusion kinetics for the recruitment of
receptors to the binding site. On the other hand, thermodynamic driving force
refers to the amount of free energy required to drive PNPs into the cell. These
two factors determine how fast and how many PNPs are taken up by the cell.
PNPs smaller than 40 nm diameter produces an inadequate amount of free
energy to completely wrap the PNP surfaces of the membrane due to docking.
PNPs larger than 80 nm diameter require more time to wrap the larger surfaces
area hence AuNPs uptake is reduced. The reduction of free receptors also limits
the ligand - receptor binding energy forming large membrane curvature, which
affects AuNP uptake. Considering membrane bending rigidity and ligand -
receptor binding energy, an optimal AuNPs diameter has been identified at
which the cellular uptake of PNPs is maximised. [91, 206, 207] The optimal
diameter for AuNPs uptake falls in the range of 40 - 60 nm for reasonable
values of membrane bending rigidity and ligand - receptor binding energy. In
our study we found maximal uptake for 50 nm diameter AuNSs and reduced
uptake for larger diameter AuNSs (80 nm and 100nm), which is in line with
previous findings. [14, 202]
Surface charge influence the PNP uptake and cytotoxicity. Since most cells
(either cancerous or normal) seem to have negative surface charge, they offer
greater permeability for cationic particles. On the other hand, positively
charged PNPs (e.g.CTAB coated NRs) has greater cytotoxicity than negatively
charged PNPs (e.g.Citrate coated NSs). [13] Also most of the negatively

Chapter 5 116
charged or neutral PNPs undergo non - specific adsorption of the particles on
the cell membrane. AuNP uptake due to surface chemistry has been reported
by Arnida and co - workers. [60, 61] They compared the uptake of bare and
PEG coated NSs (30, 50 and 90 nm diameter) with PEG NR (3×10nm, 45×10
nm) for PC-3 and RAW 2647 cells. They reported most efficient uptake for
50 nm non - PEGlated NSs, which was quantified by ICP - MS and TEM
analysis. PEGlated NR uptakes was worse than NSs.
In another study, Alkilany and co - workers [13] reported that, uptake
mostly depends on functional group adsorbed onto the AuNPs surface rather
than surface charge. They reported higher uptake for molecules containing
quaternary amines (e.g. CTAB and PDADMAC), lower uptake for negatively
charged sulfate groups (PSS) and intermediate uptake for molecules containing
primary amines (e.g. PAH).
In our study, we observed the AuNP uptake due to three different functional
groups such as, bare AuNSs coated with CTAB (contains quaternary amines),
PEG (contains alcohol groups) and maleimide (contains secondary amines).
Due to variation between these functional group, functional group kinetics.
We observed the maximal uptake for bare AuNS (CTAB coated), lowest
uptake for maleimide coated AuNS and intermediate uptake for PEG coated
AuNSs, which are in line with the previous study. [13, 59] One of the possible
reason could be that, CTAB coated (positively charged) AuNSs penetrate the
negatively charged cell membrane more effectively than PEG or maleimde
coated AuNPs at lower concentration. As CTAB is detrimental to cells, with
increasing incubation time, number of viable cells decreases and effectively
decreases the AuNPs uptake for bare AuNS at longer incubation times. Due to
the presence of secondary amines, maleimide coated AuNSs showed less uptake,
and consequently lower aggregation than bare and PEG AuNSs, whereas PEG
coated AuNSs showed intermediate uptake.

Chapter 5 117
In another study, Cathrine and co - workers observed that sedimentation
increases with the increase of AuNPs aggregation in cell media for 90 nm
AuNPs and 300 nm × 20 nm AuNR. [200] Oligomerisation is expected to
increase with increase of AuNP uptake.
In our study, considering all incubation times (30 min to 3 day) for all
three surface modified AuNSs (e.g. 50 nm, 80 nm and 100 nm diameter
AuNS samples) we observed highest uptake for 50 nm diameter nanoparticles
and distinct kinetics at different incubation times. In addition, AuNP
oligomerisation was different for different diameter AuNSs as a function of
surface chemistry due to variation of functional group. Interestingly, for bare
coated AuNSs, highest oligomerisation (48%) was observed for 80 nm diameter
AuNSs, lowest for 100 nm and intermediate for 50 nm diameter. Conversely,
we observed highest oligomerisation for 80 nm diameter AuNSs, lowest for 50
nm and intermediate for 100 nm diameter PEG and maleimide coated AuNSs,
hence the percentage of oligomerisation was different. These results suggest
that, due to different surface chemistry there might be an optimal size such as
80 nm diameter AuNSs, for which highest oligomerisation could be observed.
In future experiments, we would like to determine, the AuNPs uptake and
oligomerisation and effect of surface charge of different shape AuNPs (e.g.
AuNRs, dumbbells or bipyramids).
5.7 Conclusion
Understanding PNP - cell interaction is a challenging task. Previously,
various techniques have been used to determine plasmonic nanoparticles
uptake and aggregation of PNPs embedded in cell samples but no systematic
study has been performed. Here, with extensive H - ICS simulations
and experimentation, for the first time, we have demonstrated a technique
Chapter 5 118
to determine the plasmonic nanoparticles uptake kinetics and aggregation
dynamics at a previously unexplored region (10 - 100 µm) which has not been
reported yet for a cellular environment. The findings of these studies will
be helpful for probing membrane protein interactions, drug delivery, disease
diagnosis, and also in cancer therapy. These results will also provide new
insight to understanding the aggregation dynamics of PNPs inside cells and
studying the consequence of oligomerisation, cell activation and signaling
pathways, for living cells.

Chapter 6
Conclusions and future work
6.1 Thesis conclusions
This thesis has detailed my research into the feasibility of H - ICS for coupled
AuNPs, and how this tool can be exploited for quantifying AuNPs uptake
and oligomerisation kinetics. Towards this achievement several major research
areas have been explored :
1. Observations of plasmon coupling of different diameter (50, 80 and 80 nm)
AuNS dimers using numerical simulations of FDTD. These simulation results
deduce QY for AuNS dimers.
2. Simulating images of monomer - dimer mixture (the same as in experi-
mental AuNS scattering images) and utilising the QY extracted from FDTD
simulations to solve simultaneous equations, we extrapolated the boundary
conditions of precise application of H - ICS for coupled AuNPs.
3. Experimental demonstration of H - ICS for coupled AuNPs embedded in a
dielectric medium. The total monomer and dimer numbers extrapolated from
H - ICS simulations perfectly matched the total monomer and dimer numbers
119

Chapter 6 120
extracted from correlated SEM images.
4. Demonstration of polarisation and wavelength spectroscopy combined with
plasmon coupling for investigating single particles and dimers. The total
monomer and dimer numbers extrapolated from single particle spectroscopy
analyses were in line with previous H - ICS results and the number extracted
from correlated SEM images.
5. Experimental demonstration of a technique combining H - ICS, with
plasmon coupling, for cells incubated with AuNSs. AuNP uptake and
oligomerisation were successfully demonstrated - as a function of AuNS size,
surface charge and incubation time.
The SPR effect and plasmon coupling properties present in plasmonic nano-
particles enable numerous biological applications. However, there is still much
to understand about PNP - cell interactions. The majority of the research
thus far has focused on, PNP cytotoxicity and uptake. PNP uptake has been
investigated through ICP - MS and ICP - AEP along with TEM or, SEM.
Recently plasmon coupling has been used to explore molecular interactions;
although techniques used, each have limitations, most importantly they are
not suitable for live cell imaging. Thus, it was necessary to explore a
technique, that could be suitable for live cell imaging. To address this issue,
a combined technique utilising nanoparticle plasmon coupling together with
image correlation spectroscopy, has been demonstrated here for the first time.
This technique can quantify not only AuNP uptake but also AuNP aggregation
inside biological cells. The beauty of this technique is that, it is non -
destructive and thus can be used for live cell imaging purposes.
Before introducing this technique in a cellular environment, we successfully
demonstrated the combined technique in a dielectric medium. AuNPs were
embedded in PVA matrix, and a confocal laser scattering microscopy setup

Chapter 6 121
was used to acquire the scattering images. To determine the feasibility and
precision of H - ICS simulation in experimental conditions, we performed
numerical simulations of AuNS dimers to extrapolate QY. This value was then
used in H - ICS simulations to extract the monomer and dimer numbers. The
total particle and dimer numbers extracted from the H - ICS simulation were
compared with a reference number extracted from correlated SEM images,
which matched perfectly.
After successful use of H - ICS for coupled particles in a dielectric medium, the
tool was next traialled in a cellular environment. AuNSs were incubated into
HeLa cells, to investigate AuNS uptake and oligomerisation. We performed H -
ICS on dark - field scattered images, carefully interpreting the QY for coupled
AuNPs, utilising FDTD simulation results. Finally, we explored NP uptake
kinetics and aggregation dynamics as a function of size, surface chemistry and
incubation time.
6.2 Future research
The research conducted for this thesis could be further extended for anisotropic
materials and aggregation of more than two emitters on different types of
cells, considering refractive index change due to cellular environment, and
how these properties may affect AuNP uptake and oligomerisation. The
AuNP uptake and oligomerisation dynamics studied here were demonstrated
using a combination of extensive H -I CS, plasmon coupling simulations and
experimentation.
6.2.1 More than two emitter
In these H - ICS simulations, high order autocorrelation function was solved
only for two emitters, assuming that our images consisted of a monomer -
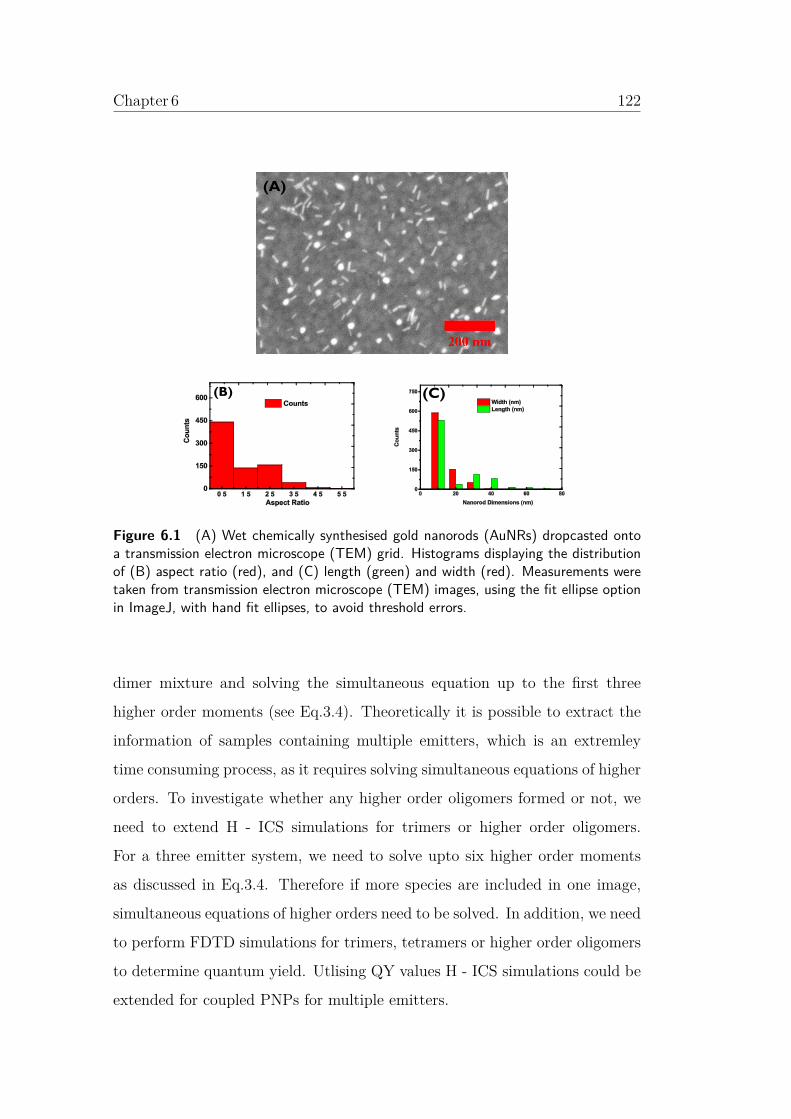
Chapter 6 122
(A)
(B) (C)
Figure 6.1 (A) Wet chemically synthesised gold nanorods (AuNRs) dropcasted ontoa transmission electron microscope (TEM) grid. Histograms displaying the distributionof (B) aspect ratio (red), and (C) length (green) and width (red). Measurements weretaken from transmission electron microscope (TEM) images, using the fit ellipse optionin ImageJ, with hand fit ellipses, to avoid threshold errors.
dimer mixture and solving the simultaneous equation up to the first three
higher order moments (see Eq.3.4). Theoretically it is possible to extract the
information of samples containing multiple emitters, which is an extremley
time consuming process, as it requires solving simultaneous equations of higher
orders. To investigate whether any higher order oligomers formed or not, we
need to extend H - ICS simulations for trimers or higher order oligomers.
For a three emitter system, we need to solve upto six higher order moments
as discussed in Eq.3.4. Therefore if more species are included in one image,
simultaneous equations of higher orders need to be solved. In addition, we need
to perform FDTD simulations for trimers, tetramers or higher order oligomers
to determine quantum yield. Utlising QY values H - ICS simulations could be
extended for coupled PNPs for multiple emitters.
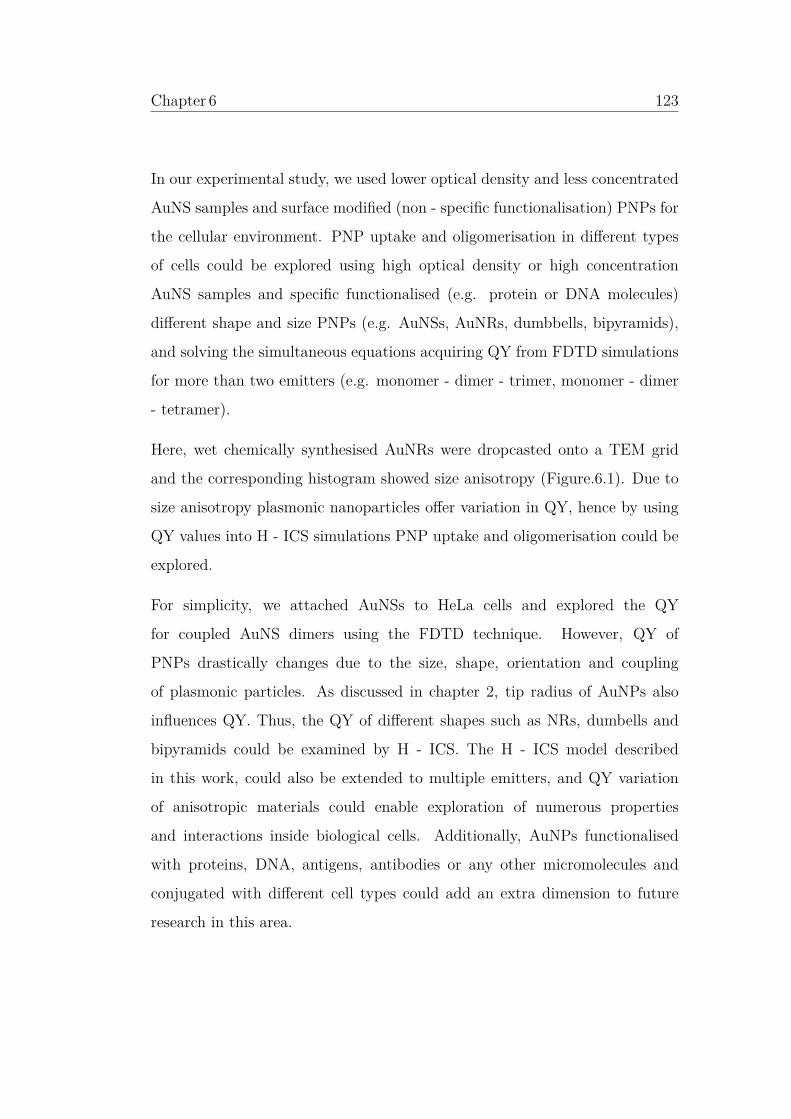
Chapter 6 123
In our experimental study, we used lower optical density and less concentrated
AuNS samples and surface modified (non - specific functionalisation) PNPs for
the cellular environment. PNP uptake and oligomerisation in different types
of cells could be explored using high optical density or high concentration
AuNS samples and specific functionalised (e.g. protein or DNA molecules)
different shape and size PNPs (e.g. AuNSs, AuNRs, dumbbells, bipyramids),
and solving the simultaneous equations acquiring QY from FDTD simulations
for more than two emitters (e.g. monomer - dimer - trimer, monomer - dimer
- tetramer).
Here, wet chemically synthesised AuNRs were dropcasted onto a TEM grid
and the corresponding histogram showed size anisotropy (Figure.6.1). Due to
size anisotropy plasmonic nanoparticles offer variation in QY, hence by using
QY values into H - ICS simulations PNP uptake and oligomerisation could be
explored.
For simplicity, we attached AuNSs to HeLa cells and explored the QY
for coupled AuNS dimers using the FDTD technique. However, QY of
PNPs drastically changes due to the size, shape, orientation and coupling
of plasmonic particles. As discussed in chapter 2, tip radius of AuNPs also
influences QY. Thus, the QY of different shapes such as NRs, dumbells and
bipyramids could be examined by H - ICS. The H - ICS model described
in this work, could also be extended to multiple emitters, and QY variation
of anisotropic materials could enable exploration of numerous properties
and interactions inside biological cells. Additionally, AuNPs functionalised
with proteins, DNA, antigens, antibodies or any other micromolecules and
conjugated with different cell types could add an extra dimension to future
research in this area.

Chapter 6 124
6.2.2 Validation by other techniques
Plasmon resonance is sensitive to the environment surrounding the AuNP. If
the AuNP surroundings change, refractive index (RI) can changes significantly.
Previously, the RI of cellular components were investigated in ensembles of NPs
with significantly lower spatial resolution (µm scale). The RI values have been
reported for cell membrane (1.46 - 1.6), cytoplasm (1.35 - 1.39) and protein
(1.36 - 1.55). [208–213]
In our study, we performed the confocal laser scattering microscopy and
confirmed the internalisation of AuNPs. Staining the cell membrane by
dye molecules we captured the confocal laser scattering images (Figure.6.2).
Cell membrane were clearly visible (red color border) in the confocal images
along with internalised AuNSs (green color), when excited by la aser source.
Therefore, we used the refractive index, (n) close to water, which was the
assumed media. Analysing the results we found that, after a change of
refractive index Δn = 0.2 ~ 0.6, SPR peak changed minimally therefore would
not affect the measurement critically.
As a preliminary study, we examined the feasibility of our H - ICS technique
confirming the internalisation of AuNPs in HeLa cells, however we did not
look specifically at, whether aggregation and uptake was happening in the
nucleus or the cytoplasm. The position of the AuNPs could be helpful for
analysing AuNP uptake and aggregation, which could be achieved by confocal
laser scattering microscopy, dark field scattering microscopy or, transmission
electron microscopy. AuNP uptake and aggregation kinetics at particular
locations (e.g. cell membrane, nucleus, cytoplasm or proteins) could be
explored by, integrating live cell imaging with confocal laser scattering or dark
- field scattering, attaching the dye molecules to HeLa cells and following the
trajectory of AuNPs over a long period of time. The position could be useful
Chapter 6 125
Figure 6.2 Confocal laser scattering, gold nanoparticle internalised cell images. Cellmembrane was stained by dye molecules, clearly visible (red color borders) in the confocalimages and internalised gold nanosphere was also clearly visible (green color particles)while excited by laser source. Scale bar represents 15 µm.
to investigate cell signalling and other cellular activities.
We performed the extensive H – ICS simulations together with plasmon
coupling to investigate AuNP uptake and aggregation kinetics. We did not
perform any other experimental methods or techniques to confirm the ICS
results for cells. However, in chapters 3 and 4, match between simulation and
experimental data to confirm the validity of H – ICS. .
Nevertheless, additional confirmation of ICS results could be achieved by

Chapter 6 126
performing live cell scattering microscopy, transmission electron microscopy,
inductively coupled plasma atomic spectroscopy (ICP - AES) or inductively
coupled plasma mass spectroscopy or combining any two of these techniques.
6.3 Conclusions
To conclude, the beauty of the tool outlined in this thesis is, that it does not
require any pre or post image analysis software, sophisticated experimental
setup or expensive equipment such as lasers or detector. All it requires is, a
microscope equipped with a white light source, an objective lens and a CCD
to record the images. In addition, the image acquisition time is faster (1
~ 5 msec to acquire a single image) than other methods. Using this tool,
insights into AuNP uptake and aggregation could be found in many membrane
protein interactions responsible for cell signalling and other cellular activities.
Thus, the tool could eventually be useful for cancer cell therapy, drug delivery,
disease diagnosis and numerous other biological applications. Although visual
resolution itself may not be improved, the ability to ‘see’ inside cells may be
enhanced by the use of the methods discovered here.

Bibliography
[1] Z. Peter, W. M. C. James, and G. Min, “Five dimensional optical
recording mediated by surface plasmons in gold nanorods,” Nature 459,
pp. 410–413, 2005.
[2] K. Sokolov, M. Follen, J. Aaron, I. Pavlova, A. Malpica, R. Lotan, and
K. R. Richards, “Real time vital optical imaging of precancer using
anti-epidermal growth factor receptor antibodies conjugated to gold
nanoparticles,” Cancer Research 63(9), pp. 1999–2004, 2003.
[3] J. Aaron, K. Travis, N. Harrison, and K. Sokolov, “Dynamic imaging
of molecular assemblies in live cells based on nanoparticle plasmon
resonance coupling,” Nano letters 9(10), pp. 3612–3618, 2009.
[4] J. Aaron, N. Nitin, K. Travis, S. Kumar, T. Collier, S. Y. Park,
M. Jose Yacaman, L. Coghlan, M. Follen, R. Richards Kortum, and
K. Sokolov, “Plasmon resonance coupling of metal nanoparticles for
molecular imaging of carcinogenesis in vivo,” Journal of Biomedical
Optics 12(3), pp. 034007–034011, 2007.
[5] E. Sayed, H. Ivan, X. Huang, and M. A. El Sayed, “Surface plasmon
resonance scattering and absorption of anti egfr antibody conjugated
gold nanoparticles in cancer diagnostics applications in oral cancer,”
Nano Letters 5(5), pp. 829–834, 2005.
127
Chapter 6 128
[6] R. Mercatelli, G. Romano, F. Ratto, P. Matteini, S. Centi, F. Cialda,
M. Monici, R. Pini, and F. Fusi, “Quantitative measurement of scattering
and extinction spectra of nanoparticles by darkfield microscopy,” Applied
Physics Letters 99(13), pp. 1–3, 2011.
[7] C. J. Murphy, A. M. Gole, S. E. Hunyadi, J. W. Stone, P. N. Sisco,
A. Alkilany, E. Kinard Brian, and P. Hankins, “Chemical sensing and
imaging with metallic nanorods,” Chemical Communication , pp. 544–
557, 2008.
[8] X. Huang, I. El Sayed, W. Qian, and M. A. El Sayed, “Cancer cell
imaging and photothermal therapy in the near-infrared region by using
gold nanorods,” Journal of the American Chemical Society 128(6),
pp. 2115–2120, 2006.
[9] A. Wijaya, S. B. Schaffer, I. G. Pallares, and K. Hamad Schifferli,
“Selective release of multiple dna oligonucleotides from gold nanorods,”
ACS Nano 3(1), pp. 80–86, 2009.
[10] C. C. Chen, Y. P. Lin, C. W. Wang, g. H. C. Tzen, C. H. Wu, Y. C. Chen,
C. P. Chen, L. C. Chen, and Y. C. Wu, “Dna gold nanorod conjugates for
remote control of localized gene expression by near infrared irradiation,”
Journal of the American Chemical Society 128(11), pp. 3709–3715, 2006.
[11] H. A. Clayton Andrew, F. Walker, S. Orchard, C. Henderson, D. Fuchs,
J. Rothacker, E. C. Nice, and B. A. W, “Ligand-induced dimer-tetramer
transition during the activation of the cell surface epidermal growth
factor receptor-a multidimensional microscopy analysis,” Journal of
Biological Chemistry 280(34), pp. 30392–30399, 2005.
[12] C. Sonnichsen, M. L. ReinhardBjorn, and A. P. Jan Alivisatos, “A
molecular ruler based on plasmon coupling of single gold and silver
nanoparticles,” Nat Biotechl 23(6), pp. 741–745, 2005.

Chapter 6 129
[13] A. M. Alkilany, k. K. Nagaria Prati, l. C. R. Hexe, T. J. Shaw,
C. J. Murphy, and M. D. Wyatt, “Cellular uptake and cytotoxicity
of gold nanorods: Molecular origin of cytotoxicity and surface effects,”
Small 5(6), pp. 701–708, 2009.
[14] B. D. Chithrani, A. A. Ghazani, and n. W. C. W. Cha, “Determining the
size and shape dependence of gold nanoparticle uptake into mammalian
cells,” Nano Letters 6(4), pp. 662–668, 2006.
[15] C. Grabinski, N. Schaeublin, A. Wijaya, H. D Couto, S. H. Baxamusa,
K. Hamad Schifferli, and S. M. Hussain, “Effect of gold nanorod surface
chemistry on cellular response,” ACS Nano 5(4), pp. 2870–2879, 2011.
[16] A. Albanese and C. W. Chan Warren, “Effect of gold nanoparticle
aggregation on cell uptake and toxicity,” ACS Nano 5(7), pp. 5478–5489,
2011.
[17] T. Hauck, A. Ghazani, and W. W. Chan, “Assessing the effect of surface
chemistry on gold nanorod uptake, toxicity, and gene expression in
mammalian cells,” Small 4(1), pp. 153–159, 2008.
[18] C. J. Murphy, A. M. Gole, J. W. Stone, P. N. Sisco, A. M. Alkilany, E. C.
Goldsmith, and S. C. Baxter, “Gold nanoparticles in biology: Beyond
toxicity to cellular imaging,” Accounts of Chemical Research 41(12),
pp. 1721–1730, 2008.
[19] L. Raphael, S. Umbreen, C. Yann, and S. Violaine, “Gold nanoparticles
delivery in mammalian live cells: a critical review,” Nano Reviews 1(0),
2010.
[20] A. Wei, Q. Wei, and A. P. Leonov, “Gold nanorods as theranostic
agents,” pp. 659–681, 2011.

Chapter 6 130
[21] R. Elghanian, J. J. Storhoff, R. C. Mucic, R. Letsinger, and C. A. Mirkin,
“Selective colorimetric detection of polynucleotides based on the distance
dependent optical properties of gold nanoparticles,” Science 277(5329),
pp. 1078–1081, 1997.
[22] A. P. Alivisatos, K. Johnsson, P. P, W. Xiaogang, E. L. Troy, J. B.
Colin, P. S. , Marcel, and P. G, “Organization of nanocrystal using
dna,” Nature 382, pp. 609–611, 1996.
[23] C. Sonnichsen, B. L. Reinhard, and A. A. P. Jan, “A molecular ruler
based on plasmon coupling of single gold and silver nanoparticles,”
Nature biotechnology 23(6), pp. 741–745, 2005.
[24] B. M. Reinhard, M. Siu, l. H. Agarwa, A. P. Alivisatos, and L. Jan,
“Calibration of dynamic molecular rulers based on plasmon coupling
between gold nanoparticles,” Nano Letters 5(11), pp. 2246–2252, 2005.
[25] P. K. Jain, W. Huang, and M. A. El Sayed, “On the universal scaling
behavior of the distance decay of plasmon coupling in metal nanoparticle
pairs a plasmon ruler equation,” Nano Letters 7(7), pp. 2080–2088, 2007.
[26] H. Wang, g. G. Ron, B. Yan, L. Yang, and B. M. Reinhard, “Optical
sizing of immunolabel clusters through multispectral plasmon coupling
microscopy,” Nano Letters 11(2), pp. 498–504, 2011.
[27] J. Yguerabide and E. E. Yguerabide Analytical Biochemistry 262(0),
p. 137.
[28] P. K. Jain, K. S. Lee, I. H. El Sayed, and M. A. El Sayed Journal of
Physical Chemistry B 110(0), p. 7238, 2006.
[29] N. L. Rosi and C. A. Mirkin Chemical Review 105(0), p. 1547, 2005.
[30] A. P. Alivisatos Nature Biotechnology 22(0), p. 47, 2004.

Chapter 6 131
[31] C. Sonnichsen, T. Franzl, T. Wilk, G. von Plessen, J. Feldmann,
O. Wilson, and P. Mulvaney, “Drastic reduction of plasmon damping
in gold nanorods,” Physical Review Letters 88(0), p. 077402, 2002.
[32] E. Katz and I. A. Willner Chem Int Ed 43(0), p. 6042, 2004.
[33] J. Haes A and D. R. P. Van Journal of American Chemical
Society 124(0), p. 10596, 2002.
[34] A. J. Haes, l. W. P. Hal, L. Chang, W. L. Klein, and D. Van Nano
Letters 4(0), p. 1029, 2004.
[35] I. Yu C Journal of Analytical Chemistry 79(0), p. 572, 2007.
[36] Y. Sun and Y. Xia Analytical Chemistry 74(0), p. 5297, 2002.
[37] A. D. McFarland and D. R. P. Van Nano Letters 3(0), p. 1057, 2003.
[38] J. J. Perez, S. I. Pastoriza, L. M. Liz Marzan, and M. P Coord Chemical
Review 249(0), p. 1870, 2005.
[39] K. S. Lee and M. A. El Sayed Journal of Physical Chemistry B 110(0),
p. 19220, 2006.
[40] E. Hao and G. C. Schatz Journal of Chemical Physics 120(0), p. 357,
2004.
[41] J. J. Storhoff, R. C. Lazarides, A A Mucic, C. A. Mirkin, R. L. Letsinge,
and G. C. Schatz Journal of American Chemical Society 122(0), p. 4640,
2000.
[42] J. J. Storhoff, R. Elghanian, R. C. Mucic, C. A. Mirkin, and R. L.
Letsinger Journal of American Chemical Society 120(0), p. 1959, 1998.
[43] J. Aizpurua, G. W. Bryant, L. J. Richter, d. A. F. J. Garcia, and
T. Kelley, B Kand Mallouk Physical Review B 71(0), p. 235420/1, 2005.

Chapter 6 132
[44] K. H. Su, i. Wei, Q H, X. Zhang, J. J. Mock, D. R. Smith, and Schultz
Nanoletters 3(8), pp. 1087–1090, 2003.
[45] L. Gunnarsson, T. Rindzevicius, J. Prikulis, B. Kasemo, M. Kall, Z. S,
and G. C. Schatz Journal of Physical Chemistry B 109(0), p. 1079, 2005.
[46] L. A. Sweatlock, S. A. Maier, H. A. Atwater, J. J. Penninkhof, and
Polman Applied Physics Review B 71(0), p. 235408/1, 2005.
[47] J. J. Xiao, J. P. Huang, and K. W. Yu Applied Physics Review B 71(0),
p. 045404/1, 2005.
[48] W. Rechberger, A. Hohenau, A. Leitner, J. R. Krenn, B. Lamprecht,
and F. R. Aussenegg Optics communications 220(0), pp. 137–141, 2003.
[49] J. P. Kottmann and O. J. F. Martin Optics Letter 26(0), p. 1096, 2001.
[50] R. Ryma, R. Jessica P, E. M. R. Jim, and A. Nancy, “Surface
coatings determine cytotoxicity and irritation potential of quantum dot
nanoparticles in epidermal keratinocytes,” J Invest Dermatol 127(1),
pp. 143–153., 2006.
[51] W. Jiang, B. Y. S. Kim, J. T. Rutka, and W. C. W. Chan Nature
Nanotechnology 3, p. 145, 2008.
[52] S. H. Wang, C. W. Lee, A. Chiou, and P. K. Wei Journal of
Nanobiotechnology 8, p. 33, 2010.
[53] B. D. Chithrani and W. C. W. Chan Nano Letters 7, p. 15427, 2007.
[54] H. Gao, W. Shii, and L. Freund, “Mechanics of receptor mediated
endocytosis.,” Proceedings of the National Academy of Sciences of the
United States of America 102(27), pp. 9469–9474, 2005.

Chapter 6 133
[55] Q. Yang, L. Ying, W. Liming, X. Ligeng, B. Ru, J. Yinglu, W. Xiaochun,
Z. Yuliang, L. Yufeng, and C. Chunying, “Surface chemistry and aspect
ratio mediated cellular uptake of au nanorods,” Biomaterials 31(30),
pp. 7606 – 7619, 2010.
[56] W. Shuguang, L. Wentong, T. Oleg, S. R. Uma, Y. Hongtao, and C. R.
Paresh, “Challenge in understanding size and shape dependent toxicity
of gold nanomaterials in human skin keratinocytes,” Chemical Physics
Letters 463(1-3), pp. 145–149, 2008.
[57] N. Takuro, Y. Masato, O. Yuri, A. Yasuyuki, T. Hironobu, K. Takahito,
K. Yoshiki, and N. Yasuro, “Peg-modified gold nanorods with a stealth
character for in vivo applications,” Journal of Controlled Release 114(3),
pp. 343 – 347, 2006.
[58] C. B. Sanda and A. Simion, “Detoxification of gold nanorods by
conjugation with thiolated poly(ethylene glycol) and their assessment as
sers-active carriers of raman tags,” Nanotechnology 21(23), p. 235601,
2010.
[59] E. E. Connor, J. Mwamuka, A. Gole, C. J. Murphy, and M. D. Wyatt
Small2005 1, pp. 325–327, 2005.
[60] Arnida, A. Malugin, and H. Ghandehari, “Cellular uptake and toxicity of
gold nanoparticles in prostate cancer cells: a comparative study of rods
and spheres,” Journal of Applied Toxicology 30(3), pp. 212–217, 2010.
[61] M. M. Arnida, A. Janat, R. A, P. C M, and G. H, “Geometry and surface
characteristics of gold nanoparticles influence their biodistribution and
uptake by macrophages,” European Journal of Pharmaceutics and
Biopharmaceutics 77(3), pp. 417 – 423, 2011. Biological Barriers A
Need for Novel Tools in Nanotoxicology and Nanomedicine The 8th

Chapter 6 134
International Conference and Workshop - Biological Barriers - in vitro
Tools in Nanotoxicology and Nanomedicine.
[62] X. M. Qing, H. Li, H. Sun, and K. Ho Pharmacology Review 54, pp. 561–
587, 2002.
[63] S. Conner, S. D, and L. Sandra, “Regulated portals of entry into the
cell.,” 10.1038/nature01451 7(7), pp. 37–44, 2003.
[64] K. J. Kim and A. B. Malik, “Protein transport across the lung epithelial
barrier,” American Journal of Physiology Lung Cellular and Molecular
Physiology .
[65] V. Angeles, a. C. Magdalen, G. R. Alejandro, C. Macarena, V. V.
Sabino, J. S. Carlos, d. P. M. Maria, and M. Rodolfo, “The influence
of surface functionalization on the enhanced internalization of magnetic
nanoparticles in cancer cells,” Nanotechnology 20(11), p. 115103, 2009.
[66] P. Swanand, S. Amanda, H. Eric, S. William, and S. Sudipta, “Protein
adsorption and cellular uptake of cerium oxide nanoparticles as a
function of zeta potential,” Biomaterials 28(31), pp. 4600 – 4607, 2007.
[67] T. Mironava, M. Hadjiargyrou, M. Simon, V. Jurukovski, and M. H.
Rafailovich Nanotoxicology 4, p. 120, 2010.
[68] L. S. Rieznichenko, S. I. Shpyleva, T. G. Gruzina, S. N. Dybkova,
Z. R. Ulberg, and V. F. Chekhun Republic National Academy Science
Ukraine 2, p. 170, 2010.
[69] J. D. Trono, K. Mizuno, N. Yusa, T. Matsukawa, K. Yokoyama, and
M. Uesaka Journal Radiation Research 52, p. 103, 2011.
[70] Y. Shan, S. Ma, L. Nie, X. Shang, X. Hao, Z. Tang, and H. Wang
Chemical Communication 47, p. 8091, 2011.

Chapter 6 135
[71] X. Ma, Y. Wu, S. Jin, Y. Tian, X. Zhang, Y. Zhao, L. Yu, and X. J.
Liang ACS Nano 5, p. 8629, 2011.
[72] M. A. Sobhan, V. K. A. Sreenivasan, M. J. Withford, and E. M. Goldys
Colloids and Surfaces B Biointerfaces 92, p. 190, 2012.
[73] A. C. Sabuncu, J. Grubbs, S. Qian, T. M. Abdel Fattah, M. W. Stacey,
and A. Beskok Colloids and Surfaces B Biointerfaces 95, p. 96, 2012.
[74] K. Huang, H. Ma, J. Liu, S. Huo, A. Kumar, T. Wei, X. Zhang, S. Jin,
Y. Gan, P. C. Wang, S. He, X. Zhang, and X. J. Liang ACS Nano 6,
p. 4483, 2012.
[75] S. Huo, H. Ma, K. Huang, J. Liu, T. Wei, S. Jin, J. Zhang, S. He, and
X. J. Liang Cancer Research 73, p. 319, 2013.
[76] L. A. Dykman and N. G. Khlebtsov, “Uptake of engineered gold
nanoparticles into mammalian cells,” Chemical Reviews 114(2),
pp. 1258–1288, 2014.
[77] A. Verma, O. Uzun, Y. Hu, Y. Hu, Y. Hu, H. s. Han, n. N. Watso,
S. Chen, D. J Irvine, and F. Stellacci, “Surface structure regulated cell
membrane penetration by monolayer protected nanoparticles,” Nature
materials 422(6), pp. 588–595, 2008.
[78] Z. Matjaz and L. Ulo, “Cell-penetrating peptides: mechanism and
kinetics of cargo delivery,” Advanced Drug Delivery Reviews 57(4),
pp. 529 – 545, 2005. Protein- and Peptide-Mediated Transduction:
Mechanisms and Implications for Drug Delivery.
[79] B. Chen, Q. Liu, Y. Zhang, L. Xu, and X. Fang, “Transmembrane
delivery of the cell-penetrating peptide conjugated semiconductor
quantum dots,” Langmuir 24(20), pp. 11866–11871, 2008.

Chapter 6 136
[80] P. C. Patel, D. A. Giljohann, D. S. Seferos, and C. A. Mirkin,
“Peptide antisense nanoparticles,” Proceedings of the National Academy
of Sciences 105(45), pp. 17222–17226, 2008.
[81] J. J. Green, E. Chiu, E. S. Leshchiner, i. J. Sh, R. Langer, and
D. G. Anderson, “Electrostatic ligand coatings of nanoparticles enable
ligand-specific gene delivery to human primary cells,” Nano Letters 7(4),
pp. 874–879, 2007.
[82] V. Biju, D. Muraleedharan, K. i. Nakayama, Y. Shinohara, T. Itoh,
Y. Baba, and M. Ishikawa, “Quantum dot-insect neuropeptide
conjugates for fluorescence imaging, transfection, and nucleus targeting
of living cells,” Langmuir 23(20), pp. 10254–10261, 2007.
[83] H. Mok, J. W. Park, and T. G. Park, “Enhanced intracellular delivery
of quantum dot and adenovirus nanoparticles triggered by acidic ph via
surface charge reversal,” Bioconjugate Chemistry 19(4), pp. 797–801,
2008.
[84] L. Sun, D. Liu, and Z. Wang, “Functional gold nanoparticle peptide
complexes as cell targeting agents,” Langmuir 24(18), pp. 10293–10297,
2008.
[85] M. Thomas and A. Klibanov, “Enhancing polyethylenimine delivery of
plasmid dna into mammalian cells,” Proceedings of the National Academy
of Sciences of the United States of America 99(23), pp. 14640–14645,
2002.
[86] S. Banerji, H. K, and A. Mark, “Examination of nonendocytotic
bulk transport of nanoparticles across phospholipid membranes,”
Langmuir 23(6), pp. 3305–3313, 2007.

Chapter 6 137
[87] T. Xia, L. Rome, and A. Nel, “Nanobiology: Particles slip cell security,”
Nature Publishing Group 7(7), pp. 519–520.
[88] U. Taylor, S. Klein, S. Petersen, W. Kues, S. Barcikowski, and D. Rath,
“Nonendosomal cellular uptake of ligand free, positively charged gold
nanoparticles,” Cytometry Part A 77A(5), pp. 439–446, 2010.
[89] S. Konstantin, B. Jacques, and E. Perez, “Applications of fluorescence
correlation spectroscopy: Polydispersity measurements,” Journal of
Colloid and Interface Science 213(2), pp. 479–487, 1999.
[90] F. L B and L. Yuan, “The role of binder mobility in spontaneous adhesive
contact and implications for cell adhesion,” Journal of the Mechanics and
Physics of Solids 52(11), pp. 2455 – 2472, 2004.
[91] F. Osaki, T. Kanamori, S. Sando, T. Sera, and Y. Aoyama, “A quantum
dot conjugated sugar ball and its cellular uptake on the size effects
of endocytosis in the subviral region,” Jounal of American Chemical
Society 126, pp. 6520–6251, 2004.
[92] P. Decuzzi and M. Ferrari, “The role of specific and non specific
interactions in receptor mediated endocytosis of nanoparticles,”
Biomaterials 28(18), pp. 2915 – 2922, 2007.
[93] R. Lipowsky and H. G. Dobereiner, “Vesicles in contact with
nanoparticles and colloids,” Europhysical Letter 43(2), pp. 219–225,
1998.
[94] I. Canton and G. Battaglia, “Endocytosis at the nanoscale,” Chemecial
Society Review 41, pp. 2718–2739, 2012.
[95] H. Yuan, J. Li, G. Bao, and S. Zhang, “Variable nanoparticle
cell adhesion strength regulates cellular uptake,” Physical Review
Letters 105, p. 138101, Sep 2010.

Chapter 6 138
[96] X. Li, “Size and shape effects on receptor mediated endocytosis of
nanoparticles,” Journal of Applied Physics 111(2), p. 024702, 2012.
[97] M. P. D. Dobay, P. Alberola A, a. E. R. Mendoz, and J. O. Radler,
“Modeling nanoparticle uptake and intracellular distribution using
stochastic process algebras,” Journal of Nanoparticle Research 14(4),
2012.
[98] S. H. Tan and G. Horlick Applied Spectroscopy 40, p. 445, 1986.
[99] S. D. Tanner and V. I. Baranov Journal of American Society Mass
Spectrometry 10, p. 1083, 1999.
[100] T. M. Mayhew, C. Muhlfeld, D. Vanhecke, and M. Ochs Analytica
Analyte 191, p. 153, 2009.
[101] C. L. Pai, C. W. Wei, C. K. Liao, C. D. Chen, K. C. W. Pao, W. C R C,
and S. D. B. Y N, “Photoacoustic Imaging of Multiple Targets Using
Gold Nanorods, journal = Proceding SPIE , year = 2006, pages = 6086„”
[102] G. Decher, “Fuzzy nanoassemblies toward layered polymeric multicom-
posites,” Science 277(5330), pp. 1232–1237, 1997.
[103] K. Caruso, D. N. Niikura, Y. Furlong, and Okahata Langmuir 13,
p. 3427, 1997.
[104] D. I. Gittins and F. Caruso, “Tailoring the polyelectrolyte coating of
metal nanoparticles,” The Journal of Physical Chemistry B 105(29),
pp. 6846–6852, 2001.
[105] H. Ai, M. Fang, S. A. Jones, and Y. M. Lvov, “Electrostatic
layer by layer nanoassembly on biological microtemplates platelets,”
Biomacromolecules 3(3), pp. 560–564, 2002.

Chapter 6 139
[106] J. Turkevich, P. C. Stevenson, and J. Hillie, “A study of the nucleation
and growth processes in the synthesis of colloidal gold,” Discussions of
Faraday Society 11(0), pp. 55–75, 1951.
[107] J. Kimling, M. M, B. Okenve, B. Kotaidis, H. Ballot, and A. Plech,
“Turkevich method for gold nanoparticle synthesis revisited,” Journal of
Physical Chemistry B 110(0), pp. 15700–15707, 2006.
[108] G. Frens, “Particle size and sol stability in metal colloids,” Colloid and
Polymer Science 250(0), pp. 736–741, 1972.
[109] G. Frerns, “Controlled nucleation for the regulation of the particle size
in monodisperse gold suspensions,” Nature (London), Phys. Sci. 241(0),
pp. 20–22, 1973.
[110] B. J. Spence, “Colloidal solutions, and the refractive indices of gold,
platinum and silver,” Physical Review (Series I), 28(4), pp. 233–263,
1909.
[111] F. J. Burger and K. Sallner, “The action of ultrasonic waves in
suspensions,” Transactions of the Faraday Society 32(7), pp. 1598–1603,
1936.
[112] A. F. J. Colby, L. H. Gabor, S. Jon A, and M. Charles R, “Template-
synthesized nanoscopic gold particles optical spectra and the effects of
particle size and shape,” The Journal of Physical Chemistry 98(11),
pp. 2963–2971, 1994.
[113] S. D. Stookey and R. J. Araujo, “Selective polarization of light due
to absorption by small elongated silver particles in glass,” Applied
Optics 7(0), pp. 777–779, 1968.
[114] N. R. Jana, L. Gearheart, and C. J. Murphy, “Wet chemical synthesis

Chapter 6 140
of high aspect ratio cylindrical gold nanorods,” Journal of Physical
Chemistry B 105(0), pp. 4065–4067, 2001.
[115] B. Nikoobakht and M. A. El-Sayed, “Selective polarization of light due to
absorption by small elongated silver particles in glass,” Langmuir 17(0),
p. 6368, 2001.
[116] B. Nikoobakht and M. A. El Sayed, “Preparation and growth mechanism
of gold nanorods (nrs) using seed-mediated growth method,” Chemistry
of Materials 15(10), pp. 1957–1962, 2003.
[117] N. R. Jana, L. Gearheart, and C. J. Murphy, “Evidence for seedmediated
nucleation in the chemical reduction of gold salts to gold nanoparticles,”
Chemistry of Materials 13(7), pp. 2313–2322, 2001.
[118] N. R. Jana, “Gram-scale synthesis of soluble, near-monodisperse gold
nanorods and other anisotropic nanoparticles,” Small 1(8), pp. 875–882,
2005.
[119] D. B. Brantley, O. O. Sherine, and J. M. Catherine, “An improved
synthesis of high aspect ratio gold nanorods,” Advanced Materials 15(5),
pp. 414–416, 2003.
[120] F. Hao, C. L. Nehl, J. H. Hafner, and P. Nordlander, “Plasmon
resonances of a gold nanostar,” Nano Letters 7(3), pp. 729–732, 2007.
[121] O. Krichevski and G. Markovich, “Growth of colloidal gold nanostars
and nanowires induced by palladium doping,” Langmuir 23(3), pp. 1496–
1499, 2007.
[122] Z. Li, Z. Liu, J. Zhang, B. Han, J. Du, Y. Gao, and T. Jiang, “Synthesis
of single-crystal gold nanosheets of large size in ionic liquids,” Journal
of Physical Chemistry B 109(30), pp. 14445–14448, 2005.

Chapter 6 141
[123] C. J. Huang, P. H. Chiu, Y. H. Wang, T. H. Meen, and C. F. Yang,
“Synthesis and characterization of gold nanodogbones by the seeded
mediated growth method,” Nanotechnology 18(39), p. 0, 2007.
[124] Y. Sun, B. Mayers, and Y. Xia, “Metal nanostructures with hollow
interiors,” Advanced Materials 15(7), pp. 641–646, 2003.
[125] X. Kou, S. Zhan, C. K. Tsung, M. H. Yeung, Q. Shi, G. D. Stucky,
L. Sun, J. Wang, and C. Yan, “Growth of gold nanorods and bipyramids
using cteab surfactant,” The Journal of Physical Chemistry B 110(33),
pp. 16377–16383, 2006.
[126] S. I Pastoriza, J. J Perez, and M. L M Liz, “Silica coating
and hydrophobation of ctab stabilized gold nanorods,” Chemical
Mater 18(10), pp. 2465–2467, 2006.
[127] Q. Zhan, J. Qian, X. Li, and S. He, “A study of mesoporous silica
encapsulated gold nanorods as enhanced light scattering probes for
cancer cell imaging,” Nanotechnology 21(5), p. 055704, 2005.
[128] X. Huang, S. Neretina, and M. A. El Sayed, “Gold nanorods from
synthesis and properties to biological and biomedical applications,”
Advanced Mater 21, pp. 4880–4910, 2009.
[129] G. Mie, “Beitrage zur optik truber medien, speziell kolloidaler
metallosungen,” Annalen der Physik 330(3), pp. 377–445, 1908.
[130] U. V. Kreibig, “Optical sizing of immunolabel clusters through
multispectral plasmon coupling microscopy,” Optical Properties of Metal
Clusters; Springer-Verlag: Berlin , 1995.
[131] M. Paul, “Surface plasmon spectroscopy of nanosized metal particles,”
Langmuir 12(3), pp. 788–800, 1996.
Chapter 6 142
[132] K. L. Kelly, E. Coronado, L. L. Zhao, and G. C. Schatz, “The optical
properties of metal nanoparticles the influence of size shape and dielectric
environment,” The Journal of Physical Chemistry B 107(3), pp. 668–
677, 2003.
[133] X. Lu, M. Rycenga, S. E. Skrabalak, B. Wiley, and Y. Xia, “Chemical
synthesis of novel plasmonic nanoparticles,” Annual Review of Physical
Chemistry 60(1), pp. 167–192, 2009.
[134] M. Grzelczak, J. J. Perez, P. Mulvaney, and L. M. Liz Marzan, “Shape
control in gold nanoparticle synthesis,” Chemical Social Review 37,
pp. 1783–1791, 2008.
[135] S. Link, M. B. Mohamed, and M. A. El Sayed, “Simulation of the optical
absorption spectra of gold nanorods as a function of their aspect ratio and
the effect of the medium dielectric constant,” The Journal of Physical
Chemistry B 103(16), pp. 3073–3077, 1999.
[136] H. M, “Light scattering by small particles. von h. c. vande hulst. new
york: Dover publications, inc. 1981.,” Acta Polymerica 35(4), pp. 338–
338, 1984.
[137] C. F. Bohren and D. R. Huffman, “Absorption and scattering of light
by small particles,” Research supported by the University of Arizona and
Institute of Occupational and Environmental Health. New York, Wiley-
Interscience , pp. 1–541, 1983.
[138] R. Gans, “Uber die form ultramikroskopischer silberteilchen,” Annalen
der Physik 352(10), pp. 270–284, 1915.
[139] Y. Binghai, Yang, and Y. Wang, “Comment on simulation of the optical
absorption spectra of gold nanorods as a function of their aspect ratio and

Chapter 6 143
the effect of the medium dielectric constant,” The Journal of Physical
Chemistry B 107(34), pp. 9159–9159, 2003.
[140] S. W. Prescott and P. Mulvaney, “Gold nanorod extinction spectra,”
Journal of Applied Physics 99(12), p. 123504, 2006.
[141] B. T. Draine and P. J. Flatau, “Discrete dipole approximation for
periodic targets theory and tests,” Journal of Optical Society America
A 25, pp. 2693–2703, 2008.
[142] J. Peter B and C. R W, “Optical constants of the noblemetals,” Physical
Review B 6(12), p. 4370, 1972.
[143] M. N. C. Hu and A. Funston, “Dark-field microscopy studies of
single metal nanoparticles: understanding the factors that influence
the linewidth of the localized surface plasmon resonance.,” Journal of
materials chemistry 18(17), pp. 1949–1960, 2008.
[144] E. A. Coronad and G. C. Schatz, “Surface plasmon broadening for
arbitrary shape nanoparticles: A geometrical probability approach,” The
Journal of Chemical Physics 119(7), pp. 3926–3934, 2003.
[145] U. Kreibig and L. Genzel, “Optical absorption of small metallic
particles,” Surface Science 156, pp. 678 – 700, 1985.
[146] Liu, S. Guyot, and Philippe, “Mechanism of silver(i)-assisted growth
of gold nanorods and bipyramids,” The Journal of Physical Chemistry
B 109(47), pp. 22192–22200, 2005.
[147] Liu, S. Guyot, and Philippe, “Synthesis and optical characterization
of au/ag core/shell nanorods,” The Journal of Physical Chemistry
B 108(19).
Chapter 6 144
[148] C. J. Huang, P. H. Chiu, Y. H. Wang, T. H. Mee, and C. F. Yang,
“Growth of gold nanorods and bipyramids using cteab surfactant,” The
Journal of Physical Chemistry B 18(39), 2007.
[149] R. Jin, Y. Cao, C. A. Mirkin, K. L. Kelly, G. C. Schatz, and J. G.
Zheng, “Photoinduced conversion of silver nanospheres to nanoprisms,”
Science 294(5548), pp. 1901–1903, 2001.
[150] D. Averitt, D. Sarkar, and N. J. Halas, “Plasmon resonance shifts of
au-coated au 2 s nanoshells: Insight into multicomponent nanoparticle
growth,” Physical Review Letters 78(0), p. 4217, 1997.
[151] Y. G. Sun and Y. N. Xia, “Shape controlled synthesis of gold and silver
nanoparticles,” Science 298(0), p. 2176, 2002.
[152] F. Bohren and D. R. Huffman, “Absorption and scattering of light by
small particles,” Wiley, New York , 1983.
[153] M. I. Mishchenko, “Light scattering by randomly oriented axially
symmetric particles,” Journal of Optical Society America A 8(0),
pp. 871–882, 1991.
[154] M. I. Mishchenko, L. D. Travis, and D. W. Mackowski, “T-matrix
computations of light scattering by nonspherical particles: A review.,” J
Quant Spectrosc Radiat Transf 55(0), pp. 535–575, 1996.
[155] C. R. Purce, E M land Pennypacker, “Scattering and absorption of light
by nonspherical dielectric grains,” Astrophys Journal 186(0), pp. 705–
714, 1973.
[156] K. S. Ye, “Numerical solution of initial boundary value problems
involving maxwell s equations in isotropic media,” IEEE Trans.
Antennas Propag. 14(0), pp. 302–307, 1966.

Chapter 6 145
[157] A. Taflove and S. C. Hagness, “Computational electrodynamics the finite
difference time domain method,” Artech House, Boston , 2000.
[158] K. Yee, “Ieee transactions on antennas and propagation,” pp. 302–307,
1966.
[159] P. Nordlander, Coubre, E. Prodan, K. Li, and M. I. Stockman
Nanoletters 4(5), pp. ,899–903, 2004.
[160] K. J. Prashant, e. E. Susi, and A. E. s. Mostafa Journal of Physical
Chemistry B 110(37), pp. 18243–18253, 2006.
[161] A. M. Funston, C. Novo, T. J. Davis, and P. Mulvaney Nano Letter 9(0),
p. 1651, 2009.
[162] P. H. Cheng, G. Y. Xiao, B. K. Ling, and Y. Z. Yong Journal of Physical
Chemistry C 114(49), pp. 21123–21131, 2010.
[163] C. W. Kat, S. Lei, C. Huanjun, L. yao, w. Jiangfang, and Q. L. Hai ACS
NANO 5(7), pp. 5976–5986, 2011.
[164] S. Lei, F. Caihong, C. Huanjun, C. M. Yat, W. Jianfang, and Q. L. Hai
Nano Letter 12(3), pp. 1424–1430, 2012.
[165] A. Funston, D. TJ, C. Novo, and P. Mulvaney Phil Trans Royal Society
A 369(0), pp. 3472–3482, 2011.
[166] L. Chuntonov and G. Haran Nano Letter 11(6), pp. 2440–2445, 2011.
[167] Y. Bo and B. M. R. Svetlana, V Boriskinaand Journal of Physical
Chemistry C 115(11), pp. 4578–4583, 2011.
[168] M. Kasha, H. R. Rawls, and M. A. El-Bayoumi, “Pure applies chemistry,”
11, p. 371, 1965.
[169] M. Kasha, “Radiation research,” 20, p. 55, 1963.

Chapter 6 146
[170] B. Z. Packard, D. D. Toptygin, A. Komoriya, and L. Brand, “Physical
chemistry b,” 102, p. 752, 1998.
[171] M. Viktor, R. F. Jessica, P. S. Isabel, M. F. Alison, N. Carolina, M. Paul,
M. M. Luis, and A. F J G, “Modelling the optical response of gold
nanoparticles,” Chemical Social Review 37, pp. 1792–1805, 2008.
[172] P. W. Wiseman, J. A. E. M. H. Squier, and K. R. Wilson, “Two
photon image correlation spectroscopy and image cross correlation
spectroscopy,” Journal of Microscopy 200(1), 2000.
[173] P. W. Wiseman, “Image correlation spectroscopy development and
application to studies of pdgf receptor distributions,” PhD thesis, The
University of Western Ontario, London, ON , 1995.
[174] P. W. Wiseman, F. Capani, J. A. Squier, and M. E. Martone, “Counting
dendritic spines in brain tissue slices by image correlation spectroscopy
analysis,” Journal of Microscopy 205(2), 2002.
[175] N. O. Peterson, “Scanning fluorescence correlcation spectroscopy.
i. theory and simulation of aggregation measuremets.,” Biophysical
Journal 49, pp. 809–815, 1986.
[176] P. Wiseman and N. Petersen, “Image correlation spectroscopy. 2.
optimization for ultrasensitive detection of preexisting platelet-derived
growth factor-beta receptor oligomers on intact cells.,” Biophysical
Journal 76(2), pp. 963–977., 1999.
[177] T. Meyer and H. Schindler, “Particle counting by fluorescence correlation
spectroscopy. simultaneous measurement of aggregation and diffusion of
molecules in solutions and in membranes.,” Biophysical Journal 54(6),
pp. 983–993., 1988.

Chapter 6 147
[178] A. Palmer and N. Thompson, “Molecular aggregation characterized
by high order autocorrelation in fluorescence correlation spectroscopy,”
Biophysical Journal 52(2), pp. 257–270, 1987.
[179] H. Qian, “On the statistics of fluorescence correlation hong qian
spectroscopy,” Biophysical Chemistry 38, pp. 49–57, 1990.
[180] M. Sergeev, “High order autocorrelation analysis in image correlation
spectroscopy,” PhD Thesis, McGill University, Canada A, Montreal,
Quebec , 2004.
[181] M. Sergeev, S. Costantino, and P. Wiseman, “Measurement of monomer
oligomer distributions via fluorescence moment image analysis,”
Biophysical Journal 91(10), pp. 3884–3896, 2006.
[182] N. Peterson, C. Brown, A. Kaminski, J. Rocheleau, M. Srivastava, and
P. Wiseman, “Analysis of membrane protein cluster densities and sizes
in situ by image correlation spectroscopy,” Faraday Discuss 111(0),
pp. 289–305, 1998.
[183] G. Min, “Advanced optical imaging theory,” Springer Series in Optical
Sciences , p. 143, 1999.
[184] A. J. E. Elizabeth and M. J. Thomas, “Imaging molecular interactions
in living cells by fret microscopy,” Current Opinion in Chemical
Biology 10(5), pp. 409 – 416, 2006.
[185] S. S. Vogel, C. Thaler, and S. V. Koushik, “Fanciful fret,” Science
Signaling 2006(331), pp. re2–re2, 2006.
[186] M. Janos and E. Michael, “Energy transfer methods for detecting
molecular clusters on cell surfaces,” 278, pp. 444– 462, 1997.
[187] T. C. Tisone and J. Drobek, “Diffusion in thin film ti au, ti pd, and ti
pt couples.,” J Vac Sci Technol .

Chapter 6 148
[188] R. B. Ian, W. W. Paul, and W. H. John, “Investigating membrane
protein dynamics in living cellsthis paper is one of a selection of papers
published in this special issue, entitled csbmcb - membrane proteins in
health and disease.,” Biochemistry and Cell Biology 84(6), pp. 825–831,
2006.
[189] A. H. A. Clayton, F. Walker, S. G. Orchard, C. Henderson, D. Fuchs,
J. Rothacker, E. C. Nice, and A. W. Burgess, “Ligand-induced dimer-
tetramer transition during the activation of the cell surface epidermal
growth factor receptor-a multidimensional microscopy analysis,” Journal
of Biological Chemistry 280(34), pp. 30392–30399, 2005.
[190] G. P. Arthur and L. T. Nancy, “Fluorescence correlation spectroscopy
for detecting submicroscopic clusters of fluorescent molecules in
membranes,” Chemistry and Physics of Lipids 50(3-4), pp. 253 –270,
1989.
[191] H. Qian and E. L. Elson, “Distribution of molecular aggregation by
analysis of fluctuation moments.,” Proceedings of the National Academy
of Sciences 87(14), pp. 5479–5483, 1990.
[192] P. Sengupta, K. Garai, J. Balaji, N. Periasamy, and S. Maiti, “Measuring
size distribution in highly heterogeneous systems with fluorescence
correlation spectroscopy.,” Biophysical Journal 84(3), pp. 1977–1984,
2003.
[193] D. Magde, E. Elson, and W. W. Webb, “Thermodynamic fluctuations
in a reacting system—measurement by fluorescence correlation spectro-
scopy,” Physical Review Letters 29, pp. 705–708, Sep 1972.
[194] S. Hess, S. Huang, A. Heikal, and W. Webb, “Biological and chemical
applications of fluorescence correlation spectroscopy: a review.,”
Biochemistryl 41(3), pp. 697–705, 2002.

Chapter 6 149
[195] M. A. Medina and P. Schwille, “Fluorescence correlation spectroscopy for
the detection and study of single molecules in biology,” BioEssays 24(8),
pp. 758–764, 2002.
[196] F. K. Dennis, E. Elliot L, and P. S. Michael, “Weak dependence of
mobility of membrane protein aggregates on aggregate size supports a
viscous model of retardation of diffusion,” Biophysical Journal 76(1),
pp. 314 –322, 1999.
[197] N. Thompson, “Fluorescence correlation spectroscopy. in j. r. lakowicz,
editor, topics in fluorescence spectroscopy,” Techniques. Plenum
Press,New York 1, 1991.
[198] R. Kask, Pand Gunter and P. Axhausen, “Statistical accuracy in
fluorescence fluctuation experiments.,” European Biophysical Journal 25,
pp. 163–169, 1997.
[199] N. Petersen, P. Hoddelius, P. Wiseman, O. Seger, and K. Magnusson,
“Quantitation of membrane receptor distributions by image correlation
spectroscopy concept and application,” Biophysical Journal 65(3),
pp. 1135–1146, 1993.
[200] J. A. Yang, H. T. Phan, S. Vaidya, and C. J. Murphy, “Nanovacuums:
Nanoparticle uptake and differential cellular migration on a carpet of
nanoparticles,” Nano Letters 13(5), pp. 2295–2302, 2013.
[201] P. Wiseman and N. Petersen, “Image correlation spectroscopy
optimization for ultrasensitive detection of preexisting platelet derived
growth factor beta receptor oligomers on intact cells,” Biophysical
Journal 76(2), pp. 963–977, 1999.
[202] H. W. Sheng, L. Chia Wei, C. Arthur, and W. Pei Kuen, “Size dependent
endocytosis of gold nanoparticles studied by three dimensional mapping

Chapter 6 150
of plasmonic scattering images,” Journal of Nanobiotechnology 8(33),
2010.
[203] H. Heather, D. Nicole, T. J. Arwyn, H. Hanno, G. Hamidreza, and
L. Claus Michael, “Nanoparticle geometry and surface orientation
influence mode of cellular uptakeshape and orientation matter for the
cellular uptake of nonspherical particles,” Nano Letters 7(3), pp. 1961–
1973, 2013.
[204] P. Yang, X. Sun, J. Chiu, H. Sun, and He, “Transferrin mediated gold
nanoparticle cellular uptake,” Bioconjugate Chemistry 16, pp. 494–496,
2005.
[205] F. O. Harush, N. Debotton, S. Benita, and Y. Altschuler, “Targeting of
nanoparticles to the clathrin mediated endocytic pathway,” biochemical
Biophysical Research Communications 353, pp. 26–32, 2007.
[206] Y. Aoyama, T. Kanamori, T. Nakai, T. Sasaki, S. Horiuchi, S. Sando,
and T. Niidome, “Artificial viruses and their application to gene delivery
size controlled gene coating with glycocluster nanoparticles,” Jounal of
American Chemical Society 125, pp. 3455–3457, 2003.
[207] P. Lawrence, Fernando, K. Kandel, J. Yu, J. McNeill, P. Ackroyd,
and A. Christensen, “Artificial viruses and their application to gene
delivery size controlled gene coating with glycocluster nanoparticles,”
Biomacromolecules 11, pp. 2675–2682, 2010.
[208] C. Tregidgo, J. A. Levitt, and S. K, “Effect of refractive index on the
fluorescence lifetime of green fluorescent protein,” Journal of Biomedical
Optics 13, pp. 031218–8, 2008.
[209] J. M. Beuthan, J. H. Helfmann, and G. M Mller, “The spatial variation

Chapter 6 151
of the refractive index in biological cells,” Physical Medical Biology 41,
p. 369, 1996.
[210] R. Meyer, “Light scattering from biological cells dependence of
backscatter radiation on membrane thickness and refractive index,”
Applied Optics 18, pp. 585–588, 1979.
[211] S. Johnsen and E. Widde, “The physical basis of transparency in
biological tissue ultrastructure and the minimization of light scattering,”
Journal of Theor otical Biology 199, pp. 181–198, 1999.
[212] A. C. Curry and W. A. M, “Molecular imaging of epidermal growth
factor receptor in live cells with refractive index sensitivity using dark
field microspectroscopy and immunotargeted nanoparticles,” Journal of
Biomedical Optics 13, p. 014022, 2008.
[213] M. J. Crow, K. Seekell, J. H. Ostrander, and A. Wax, “Monitoring of
receptor dimerization using plasmonic coupling of gold nanoparticles,”
ACS Nano 5(11), pp. 8532–8540, 2011.

Chapter 6 152

Author publications
Journals
• Timothy TY Chow, Abu S. M. Mohsin and James W.M. Chon, “Im-
age Correlation Spectroscopy of Plasmon Coupled Gold Nanoparticles
for Probing Oligomerisation into Dielectric Medium”, (manuscript in
preparation expected to submit ACS Nano).
• Abu S. M. Mohsin, Timothy TY Chow, Chiara Paviolo and James
W.M. Chon, “Nanoparticle Uptake Kinetics and Aggregation Dynamics
of Different Functionalized Nanoparticles into HeLa Cells Using - High
Order Image Correlation Spectroscopy”, (manuscript in preparation
expected to submit ACS Nano).
• Adam B. Taylor, Pierrette Michaux, Abu S. M. Mohsin, and James
W. M. Chon, “Electron - beam lithography of plasmonic nanorod arrays
for multilayered optical storage”, Optics Express, March, 2014.
• Reda Kubiliute, Ksenia A Maximova, Alireza Lajevardipour, Jiawey
Yong, Jennifer S Hartley, Abu S. M. Mohsin, Pierre Blandin, James
W. M. Chon, Marc Sentis, Paul R Stoddart, Andrei Kabashin, Ricardas
Rotomskis, Andrew H.A. Clayton and Saulius Juodkazis, “Ultra -
pure, water - dispersed Au nanoparticles produced by femtosecond laser
ablation and fragmentation”, International Journal of Nanomedicine, 8,
153

Chapter 6 154
2601-2611(2013); doi; 10.2147/IJN.S44163.
Conferences
• Abu S. M. Mohsin*, Timothy T. Y. Chow, Chiara Paviolo, Andrew
H.A. Clayton and James W. M. Chon, “Cell uptake and aggregation
dynamics study of gold nanoparticles using image correlation spectro-
scopy”, Australian Institute of Physics Congress, Australian National
University, Canberra, Australia, 7th -11th December 2014.
• Arif Siddique, Timothy TY Chow, Abu S. M. Mohsin* and James
W.M. Chon, “The effect of Ti adhesion layers on the plasmonic properties
of gold nanorod arrays”, IONS - KOALA, 2014, Adelaide, Australia.
• Abu S. M. Mohsin, Timothy TY Chow, Chiara Paviolo and James
W.M. Chon, “Plasmonic gold nanoparticle aggregation characterisation
using high - order image correlation spectroscopy for cellular uptake
study”, 5th International Nano Medicine Conference, 30 June – 2 July
2014, Coogee Beach, Sydney, Australia.
• Adam B.Taylor , Abu S. M. Mohsin, Pierrette Michaux and James
W.M. Chon, “Electron - beam lithography of plasmonic nanorod arrays
for multilayered optical storage”, ANN Early Career Workshop, July
2014.
• Abu S. M. Mohsin*, Andrew H.A. Clayton and James W. M.
Chon, “Plasmon Coupling of Gold Nanoparticles and Investigating
Dimerization through Single Particle Spectroscopy of Weakly Coupled
Nanoparticle into Random Medium”, The international OSA Network of
Students (IONS), NA# 7, Charlotte, North Carolina, USA, 2nd - 4th
October 2013.

Chapter 6 155
• Timothy T. Y. Chow, Abu S. M. Mohsin *, Andrew H.A. Clayton
and James W. M. Chon, “Image Correlation Spectroscopy of Weakly
Coupled Plasmonic Gold Nanoparticles”, The International Conferences
on Surface Plasmon Photonics SPP6, Ottawa, Canada, 26th - 31st May,
2013.
• Abu S. M. Mohsin*, Timothy T. Y. Chow, Andrew H.A. Clayton
and James W. M. Chon, “Plasmon Coupling of Gold Nanoparticles for
Probing Membrane Proteins - Image Correlation Spectroscopy Study”,
20th Australian Institute of Physics Congress, University of New South
Wales, Sydney, Australia, 9th - 13th December 2012.

![CURICULLUM VITAE - updated › mprc › files › 2017 › 03 › 5330-CV-Dr.-Rahmat.pdf · [February, 08] [ASSOC. PROF. DR. RAHMAT MOHSIN] [Dr. Rahmat Mohsin] | CURICULLUM VITAE](https://cdn.vdocuments.net/doc/165x107/5f0304647e708231d407208b/curicullum-vitae-updated-a-mprc-a-files-a-2017-a-03-a-5330-cv-dr-.jpg)


