
%
page 1
Agriculture
and Rural
Development
M
on
ito
rin
g A
gri-
trad
e P
olic
y
MA
P 2
01
8–
1
Contents
Foreword 1
Summary 2
1. International setting 3
2. World trade in agri-food 4
3. EU performance in agri-food trade 4
3.1 EU agri-food trade development 5
3.2. EU agri-food export products 7
3.3. EU agri-food import products 9
4. Agri-food trade with key partners 11
4.1. United States 11
4.2. China 14
4.3. Brazil 16
4.4. Japan 17
4.5. Russia 19
4.6. Least Developed Countries (LDCs) 20
Annex 23
Agri-food trade in 2017: another record year for EU agri-food trade
2017 has been another bumper year for EU agri-food trade. Trade reached a new record value of 255 billion in 2017: 138 billion of exports and 117 billion of imports. This means that we confirm for yet another year our position as the largest global exporter as well as importer of agri-food products.
The success of agricultural trade is clearly linked to reforms of the CAP that allow EU producers to be competitive on international markets. But it is also thanks to the worldwide reputation of EU products as being safe, sustainably produced, nutritious and of high quality.
Our ambitious trade agenda - with recent successes in negotiations with Canada, Japan and Mexico - helps EU farmers and food producers make full use of the opportunities of international markets while recognising the need to provide sufficient safeguards for more sensitive sectors.
This report provides an overview of the development of EU and worldwide agricultural trade in 2017. Enjoy, it's from Europe!
Phil Hogan, Commissioner for Agriculture and Rural Development
%
page 2
Agriculture
and Rural
Development
Summary
World economic performance picked up again in 2017 after a lacklustre 2016 regarding trade development and general economic climate. World GDP growth has been reported as at least 3% and is expected to remain steady in the coming years. The growth of world merchandise trade volume is estimated at a rate of 3.6%, much stronger than in 2016, where the ratio of trade growth to GDP growth had fallen the first time in 15 years below 1:1.
Agri-trade worldwide has been expanding in line with these overall trends. All top 5 exporters (EU, US, Brazil, China, Canada) recorded rising agri-food export values in 2017 compared to 2016, with overall exports of the 5 increasing by 4.3%. The agri-food imports of the top 5 importers (EU, US, China, Japan, Canada) likewise increased by 5.3%.
The EU, which had already largely resisted the sluggish overall trend in the previous year, reached a new record agri-food trade value of 255 billion in 2017 – 138 billion of exports and 117 billion of imports. This means that the EU confirms for yet another year its position as largest global exporter and importer of agri-foods products.
EU exports to all main partners increased. Exports to Russia, after a steep fall in recent years due to the Russian embargo for several agricultural products, recovered for the first time since 2013 due to rising exports of products not subject to the embargo. Exports of EU flagship products such as wines, spirits and infant food further increased from already very high levels. The major CAP reforms in the dairy and sugar sectors in the last three years have positioned EU producers in these sectors to better compete on international markets. Exports of wheat, in contrast, declined substantially due to lower production in the EU combined with ample supply on the world market, which made some important importers source from other destinations.
The EU has been able to diversify its sourcing of agri-food imports over the last years. In particular, the shares for the two main import origins (Brazil and US) have decreased while shares for the other main suppliers have remained relatively stable – with the exception of Ukraine, from where the EU imported a remarkable 34% more in 2017 than in the previous year. Tropical fruits, already topping the ranking of EU import products, saw a further increase of import values due to strong demand in particular for bananas.
The EU has managed to make further progress on its ambitious bilateral agenda of trade negotiations in 2017, including in particular the entry into force of CETA with Canada and the finalisation of the Economic Partnership Agreement with Japan. An agreement in principle with Mexico was reached in April 2018. However, on the multilateral side, the 11th Ministerial Conference of the WTO in December 2017 in Buenos Aires failed to reach any outcome on agriculture.
Despite the overall positive assessment of the agri-food trade climate in 2017, there remain substantial future risks to trade developments. Among the most serious threats are likely to be increasingly protectionist policy approaches in some important economies, more frequent trade disputes as well as trade disturbances linked to the decision of the United Kingdom to leave the EU. On the positive side however, global demand for food is likely to increase with population growth and changes in consumer preferences. Europe's agri-food sector, with its reputation for safe, sustainably produced, nutritious and quality products, stands to gain from this demand growth.

page 3
Agriculture
and Rural
Development
1. International setting
In 2017, according to the first data, global economic growth has reached between 3% (UN1) and 3.7% (IMF2), a significant acceleration compared to growth of 2.4% in 2016 - and the highest growth recorded since 2011. According to the UN, growth is expected to remain steady for the coming years (2018, 2019) but economic prospects remain vulnerable to changes in trade policy, a sudden deterioration in global financial conditions and rising geopolitical tensions.
The growth of the world merchandise trade volume is estimated at a rate of 3.6%3, which represents a substantial increase compared to the 1.3% increase in 2016. The WTO expects that the ratio of trade growth to GDP growth should rise again to 1.3 in 2017, after it has fallen the first time in 15 years below 1:1 in 2016.
World trade is also affected by exchange rates and commodity prices. Crude oil price have risen by about 20% in 2017. The EU's main trade partners' currencies (US, China, Japan, Brazil) have weakened compared to the euro in 2017. Emerging market currencies have generally appreciated. An exception is the Mexican peso associated with uncertainty regarding NAFTA4 negotiations.5
The EU has made progress on multiple bilateral trade negotiations in 2017. In September 2017, the Comprehensive Economic and Trade Agreement (CETA) with Canada was provisionally applied. The EU and Japan have reached an agreement on an Economic Partnership Agreement in December 2017, which is currently in the process of ratification. After its conclusion in 2012, the Free Trade Agreement (FTA) with Singapore is now also back in the active process of ratification and could enter into force in late 2018 or early 2019. The FTA with Vietnam, another promising market for many EU agri-food products, could also enter into force in 2019. Still in South-East Asia, the EU
1 World economic situation and prospects 2018, United Nations report
2World Economic Outlook Update, January 2018, International Monetary Fund 3 WTO upgrades forecast for 2017 as trade rebounds strongly, WTO, Press release, 21 September 2017 4 The North American Free Trade Agreement (NAFTA) is an agreement signed by Canada, Mexico, and the United States. 5 World Economic Outlook Update, January 2018, International Monetary Fund
is currently in negotiations with Indonesia and is assessing a possible re-launch of the negotiation with Malaysia. An agreement in principle with Mexico on the modernisation of the current trade agreement was reached in April 2018 and negotiations with the Mercosur bloc6 are advancing. Negotiations with Australia and New Zealand are expected to begin in 2018. Closer to home, negotiations in the agri-food sector were concluded with Norway and Iceland.
The transatlantic Trade and Investment Partnership (TTIP) negotiations between the EU and the US continue to be on hold as both sides need to clarify if there is a sufficient level of shared ambition and common ground before deciding whether and how to proceed with negotiations.
Regarding world trade policy, multi-nation regional trade deals have been advancing. For example, the African Continental Free Trade Area7 (CFTA) was signed by 44 of the 55 members of the African Union (AU) in March 2018 and will enter into force after ratification of 22 of the signatory states. In the Asian Pacific area, negotiations on the Free Trade Area of Asia Pacific8 (FTAAP) and the Regional Comprehensive Economic Partnership9 (RCEP) are ongoing. While the United States withdrew from the Trans-Pacific Partnership (TPP)10 in early 2017, the remaining 11 TPP members signed the CPTPP11 in March 2018.
The 11th biannual ministerial conference of the World Trade Organisation (WTO) in Buenos Aires in December 2017 failed to achieve any outcome on agriculture.
6 Brazil, Argentina, Paraguay and Uruguay 7 The CFTA will bring together 55 African countries. 8 Envisaged trade agreement among the APEC countries (Australia, Brunei,
Canada, Indonesia, Japan, South Korea, Malaysia, New Zealand, Philippines, Singapore, Thailand, US, Taiwan, Hong Kong, China, Mexico, Papua New Guinea, Chile, Peru, Russia and Vietnam)
9 ASEAN plus Australia, China, India, Japan, South Korea and New Zealand. 10 Trans-Pacific Partnership – a trade agreement initially concluded between
the US, Japan, Canada, Mexico, Australia, New Zealand, Singapore, Vietnam, Malaysia, Peru, Chile and Brunei
11 Comprehensive and Progressive Agreement for Trans-Pacific Partnership

page 4
Agriculture
and Rural
Development
2. World trade in agri-food
In line with the strong performance in overall world economic and trade growth, agri-food trade picked up in 2017 after a slow 2016.
All 5 top exporters could expand their agri-food export value in 2017 (graph 1) - altogether, the export value of top 5 world players increased by very solid 4.3 % with a somewhat smaller increase in the US and China (respectively 1% and 1.9%) compared to the others. The ranking of the top world agri-food exporters remained unchanged in 2017, after the EU took over the leading position from the US in 2013.
After a record export performance already in 2016 – resisting the slow overall trend – the agri-food exports of the EU reached a new record value of EUR 138 billion in 2017, corresponding to an increase by 5.1% year-on-year. Even though US exports also rose, the gap between the EU and US widened due to this development. However, the US remains clearly the second strongest worldwide exporter12 with a large gap to third placed Brazil, which ships out approximately half of the value of EU exports. Remarkably, Brazil has clearly the strongest annual increase of all top exporters with a solid plus of 12%.
Graph 1: Top world agri-food exporters (billion EUR)
As graph 2 shows, imports likewise picked up, by altogether 5.3%, for the top 5 importers compared to 2016. While all of the main importing countries saw an increase in their imports, the strongest increase by far was recorded in China with imports up by EUR 10
12 The definition of agri-food products in US export statistics is different
from the definition used for this publication (GTA), which is why US publications will not show the same values.
billion (+10.3%) to a total of EUR 103 billion. This tops the level of imports in the already strong year 2015 (EUR 98 billion), which had dropped to EUR 93 billion in 2016. The EU maintains the lead amongst agri-food importers closely followed by the US (respectively EUR 117 billion and EUR 115 billion). Japan increased its import significantly (+4.2%) while Canada recorded a smaller import plus (+1.4%) clearly below the average in the top 5.
Graph 2: Top world agri-food importers (billion EUR)
The profile of the main players among world agri-food traders varies: the EU, US, China and Canada have a strong domestic production of agri-food but feature at the same time among top exporters and importers. Brazil and Argentina are primarily suppliers - just like Australia and New Zealand, who however operate at a lower aggregate level, ranking 6th and 9th exporters worldwide respectively. Japan and Russia (the 6th biggest importer), in contrast, are net purchasers on world agricultural markets.
After a significant increase during 2016, the Food and Agriculture Organisation (FAO) food price index remained stable during the first half of 2017. Since summer 2017, the index dropped slightly mainly driven by lower dairy product and sugar prices.
3. EU performance in agri-food trade
Agriculture and the food related industries and services together provide almost 44 million jobs in the EU, including regular work for 22 million people within the agricultural sector itself13. The food production and
13 Food and Framing – Focus on Jobs and Growth, DG Agriculture and Rural Development, December 2015
page 5
Agriculture
and Rural
Development
processing chain accounts for 7.5% of employment and 3.7% of total value added in the EU. The output of the EU agricultural sector was estimated at EUR 427 billion in 201714, which is a strong increase compared to the 2016 value of EUR 406 billion.
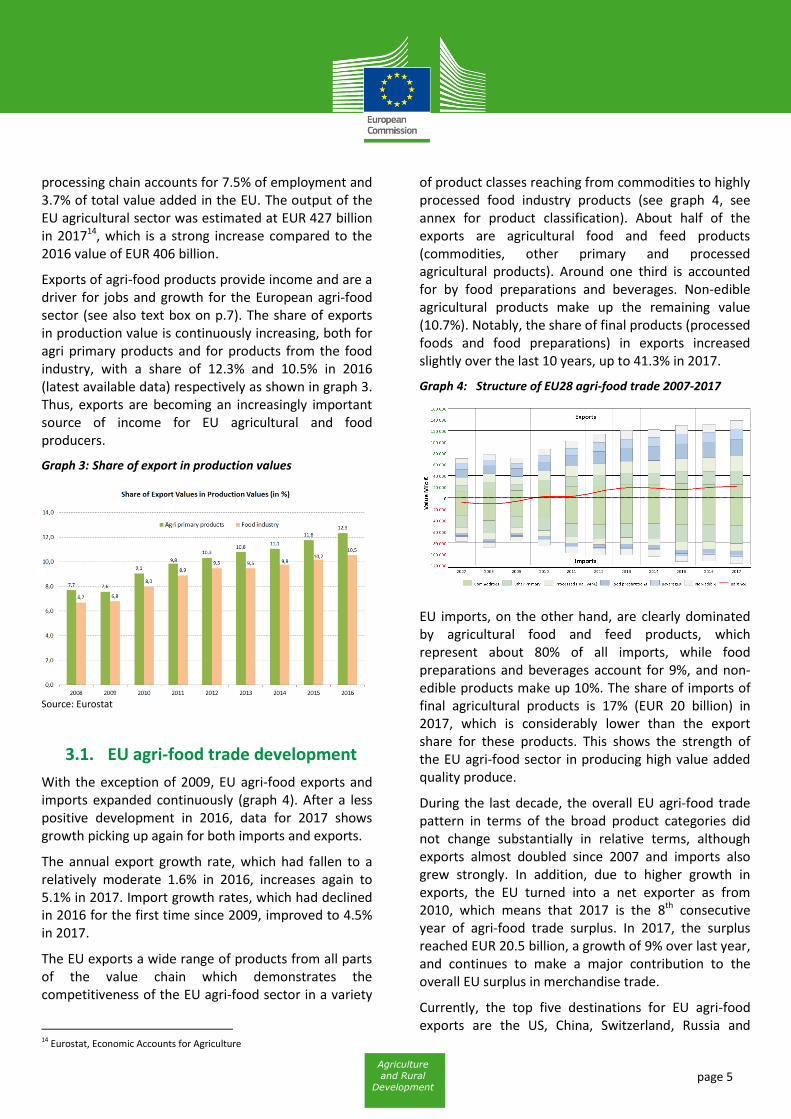
Exports of agri-food products provide income and are a driver for jobs and growth for the European agri-food sector (see also text box on p.7). The share of exports in production value is continuously increasing, both for agri primary products and for products from the food industry, with a share of 12.3% and 10.5% in 2016 (latest available data) respectively as shown in graph 3. Thus, exports are becoming an increasingly important source of income for EU agricultural and food producers.
Graph 3: Share of export in production values
Source: Eurostat
3.1. EU agri-food trade development
With the exception of 2009, EU agri-food exports and imports expanded continuously (graph 4). After a less positive development in 2016, data for 2017 shows growth picking up again for both imports and exports.
The annual export growth rate, which had fallen to a relatively moderate 1.6% in 2016, increases again to 5.1% in 2017. Import growth rates, which had declined in 2016 for the first time since 2009, improved to 4.5% in 2017.
The EU exports a wide range of products from all parts of the value chain which demonstrates the competitiveness of the EU agri-food sector in a variety
14 Eurostat, Economic Accounts for Agriculture
of product classes reaching from commodities to highly processed food industry products (see graph 4, see annex for product classification). About half of the exports are agricultural food and feed products (commodities, other primary and processed agricultural products). Around one third is accounted for by food preparations and beverages. Non-edible agricultural products make up the remaining value (10.7%). Notably, the share of final products (processed foods and food preparations) in exports increased slightly over the last 10 years, up to 41.3% in 2017.
Graph 4: Structure of EU28 agri-food trade 2007-2017
EU imports, on the other hand, are clearly dominated by agricultural food and feed products, which represent about 80% of all imports, while food preparations and beverages account for 9%, and non-edible products make up 10%. The share of imports of final agricultural products is 17% (EUR 20 billion) in 2017, which is considerably lower than the export share for these products. This shows the strength of the EU agri-food sector in producing high value added quality produce.
During the last decade, the overall EU agri-food trade pattern in terms of the broad product categories did not change substantially in relative terms, although exports almost doubled since 2007 and imports also grew strongly. In addition, due to higher growth in exports, the EU turned into a net exporter as from 2010, which means that 2017 is the 8th consecutive year of agri-food trade surplus. In 2017, the surplus reached EUR 20.5 billion, a growth of 9% over last year, and continues to make a major contribution to the overall EU surplus in merchandise trade.
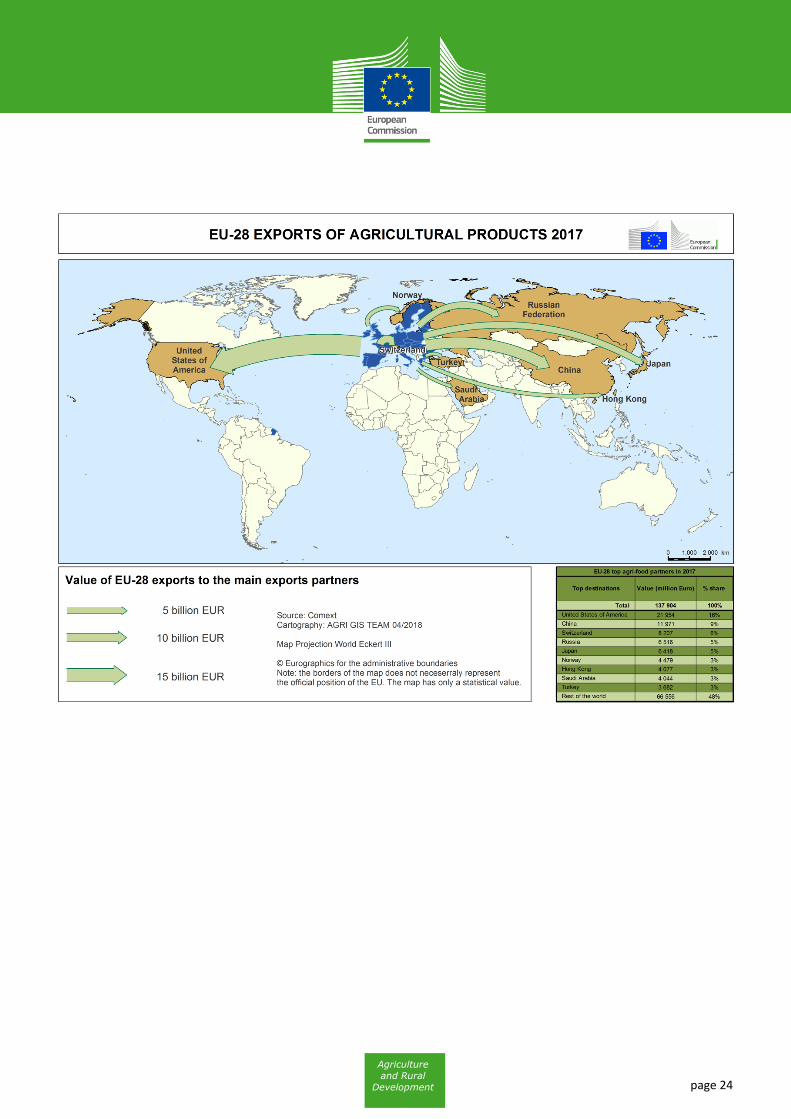
Currently, the top five destinations for EU agri-food exports are the US, China, Switzerland, Russia and
page 6
Agriculture
and Rural
Development
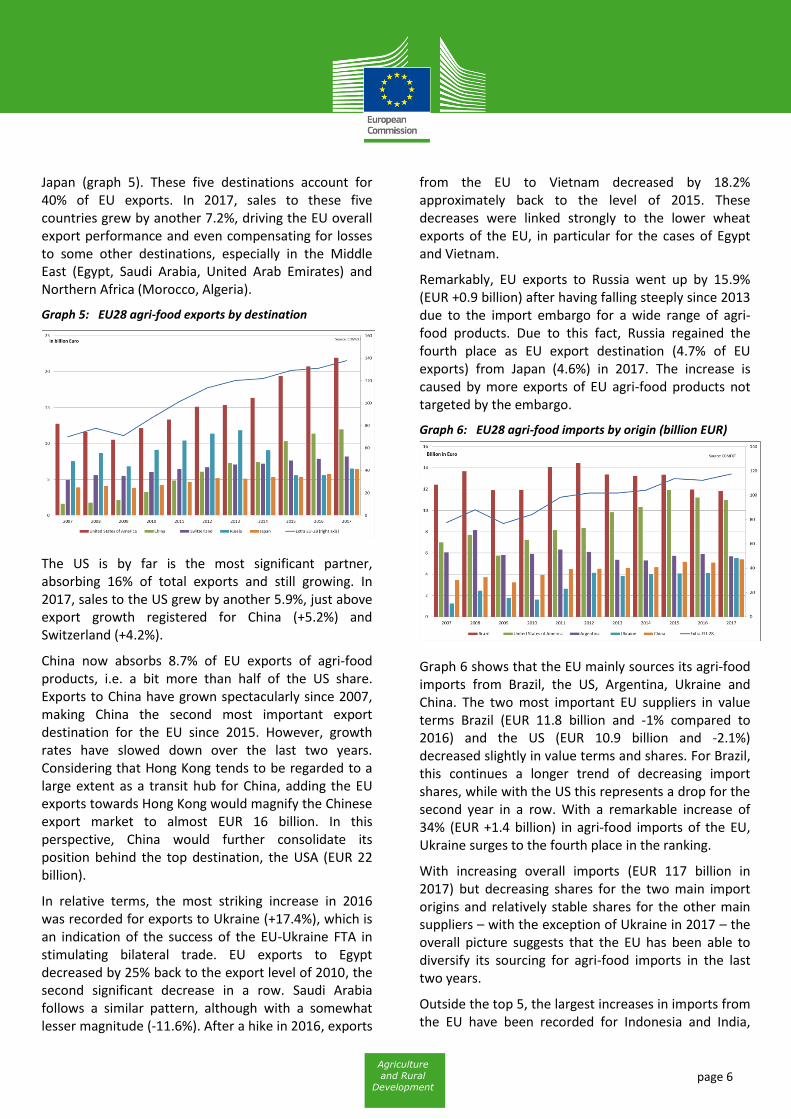
Japan (graph 5). These five destinations account for 40% of EU exports. In 2017, sales to these five countries grew by another 7.2%, driving the EU overall export performance and even compensating for losses to some other destinations, especially in the Middle East (Egypt, Saudi Arabia, United Arab Emirates) and Northern Africa (Morocco, Algeria).
Graph 5: EU28 agri-food exports by destination
The US is by far is the most significant partner, absorbing 16% of total exports and still growing. In 2017, sales to the US grew by another 5.9%, just above export growth registered for China (+5.2%) and Switzerland (+4.2%).
China now absorbs 8.7% of EU exports of agri-food products, i.e. a bit more than half of the US share. Exports to China have grown spectacularly since 2007, making China the second most important export destination for the EU since 2015. However, growth rates have slowed down over the last two years. Considering that Hong Kong tends to be regarded to a large extent as a transit hub for China, adding the EU exports towards Hong Kong would magnify the Chinese export market to almost EUR 16 billion. In this perspective, China would further consolidate its position behind the top destination, the USA (EUR 22 billion).
In relative terms, the most striking increase in 2016 was recorded for exports to Ukraine (+17.4%), which is an indication of the success of the EU-Ukraine FTA in stimulating bilateral trade. EU exports to Egypt decreased by 25% back to the export level of 2010, the second significant decrease in a row. Saudi Arabia follows a similar pattern, although with a somewhat lesser magnitude (-11.6%). After a hike in 2016, exports
from the EU to Vietnam decreased by 18.2% approximately back to the level of 2015. These decreases were linked strongly to the lower wheat exports of the EU, in particular for the cases of Egypt and Vietnam.
Remarkably, EU exports to Russia went up by 15.9% (EUR +0.9 billion) after having falling steeply since 2013 due to the import embargo for a wide range of agri-food products. Due to this fact, Russia regained the fourth place as EU export destination (4.7% of EU exports) from Japan (4.6%) in 2017. The increase is caused by more exports of EU agri-food products not targeted by the embargo.
Graph 6: EU28 agri-food imports by origin (billion EUR)
Graph 6 shows that the EU mainly sources its agri-food imports from Brazil, the US, Argentina, Ukraine and China. The two most important EU suppliers in value terms Brazil (EUR 11.8 billion and -1% compared to 2016) and the US (EUR 10.9 billion and -2.1%) decreased slightly in value terms and shares. For Brazil, this continues a longer trend of decreasing import shares, while with the US this represents a drop for the second year in a row. With a remarkable increase of 34% (EUR +1.4 billion) in agri-food imports of the EU, Ukraine surges to the fourth place in the ranking.
With increasing overall imports (EUR 117 billion in 2017) but decreasing shares for the two main import origins and relatively stable shares for the other main suppliers – with the exception of Ukraine in 2017 – the overall picture suggests that the EU has been able to diversify its sourcing for agri-food imports in the last two years.
Outside the top 5, the largest increases in imports from the EU have been recorded for Indonesia and India,

page 7
Agriculture
and Rural
Development
with a surge of 28% (EUR +1.1 billion) and 22.9% (EUR +0.6 billion) respectively.
15
3.2. EU agri-food export products
Wine and spirits dominate the basket of exported products (respectively 9% and 8% of total EU agri-food exports - graph 7). They are followed by infant food, and various food preparations. Chocolate, and pig meat complete the overview of products with more than EUR 5 billion of exports (4% of total export value). Notably, exports of wine (+11.7%) and infant food (+10.8%) increased above the average increase of agri-food exports (+5.1%).
Compared to the previous year, there was one remarkable change among the top export product categories: Wheat slipped from the fifth to the 11th place in export value (-27.5%) due to lower EU production.
As graph 8 indicates, in the top three main product categories exported by the EU (wine, spirits and infant food), the top 5 destination are absorbing more than 50% of EU exports. Additionally, in each of the three groups, one partner is clearly dominant: the US for
15 Study on the impact of trade agreements: https://ec.europa.eu/agriculture/external-studies/2016-bilateral-trade-agreements_en
wines and spirits and China for infant food16. For chocolate and other food preparations, the concentration on the top export destinations is less pronounced (the top 5 absorbing 40% or less of the total exports) and exports are more evenly spread between the main trade partners.
Graph 7: Composition of EU agri-food exports in 2017
Outside the top 5 products, the concentration of pig meat exports is particularly high with 75% going to the main 5 destinations in 2017. The top two destinations - China and Japan - are absorbing 49% of all EU exports for pig meat, each of them about 25%.
Graph 8: Distribution of exports in main product categories by top destinations
16 China's share of 33% (up from 28% in 2016) for infant food and other cereals, flour, starch or milk preparations even rises to 39% if exports to Hong Kong (entry point to the Chinese market) are added.
Impact of trade agreements on the agricultural sector
Trade agreements can help EU farmers and food producers make full use of their export potential. The study on the impact of EU trade agreements on the agricultural sector, published in February 2017
15, finds
that the trade agreements with Mexico, South Korea and Switzerland have increased EU agri-food exports to these countries by more than EUR 1 billion and raised value added in the agri-food sector by EUR 600 million. The increased exports have supported almost 20 000 jobs in the agri-food sector, of which 13 700 jobs are in primary agriculture.
The findings stress the importance of activities that allow EU exporters to expand trade within the existing agreements, such as promotion and information actions and resolving Sanitary and Phytosanitary (SPS) barriers.

page 8
Agriculture
and Rural
Development
The product categories with the highest annual increase in export values in 2017 are shown in graph 9. In particular the category of wine, vermouth, cider and vinegar – which already leads the ranking of main exported products by the EU – saw a remarkable increase of exports by EUR 1.2 billion (+12%). Infant food and spirits likewise show further increases of EUR 0.7 and EUR 0.5 billion respectively. Outside the top 5 export product categories, it is noteworthy that beet and cane sugar exports shot up by 43% (EUR +0.3 billion), mostly as an effect of increased EU production following the abolition of the sugar quota. This is a tangible reflection of the way the increased market orientation of the CAP positions EU producers to compete on international markets.
Graph 9: Product categories with the largest absolute annual export value increase in 2017 (million EUR)
The drivers for these export increases were mainly higher exported volumes (while prices stayed roughly similar) with the exception of milk powders and pet foods where prices also increased (graph 10). The main driver for beet and sugar cane export value increases was an increase of volume by 59%, while prices declined by 10%.
Graph 10: Annual percentage change in volume and unit price for the product categories with the largest EU total export increases in 2017
17
In terms of export value losses in 2017, the most notable product is wheat, where exports declined by EUR -1.5 billion (-27%) as shown in graph 11.
Graph 11: Product categories with the largest absolute annual export value decrease in 2017 (million EUR
The reason for this development in wheat was lower production (-20 million tons) in the EU combined with ample supply on the world market, which made importers such as Egypt source from other destinations. A slightly higher unit price could not counterbalance this sharp drop in volumes (graph 12). In other cases, such as pork and to some extent cereals other than wheat and rice, losses in value were
17 Unit prices here and in the rest of the document are calculated by division of traded value with traded volume of the product categories. The result may include effects of proportional changes between higher and lower valued items within the product category aggregate.

page 9
Agriculture
and Rural
Development
moderated by the fact that the decrease in exported volumes was counteracted by higher unit prices.
Graph 12: Annual percentage change in volume and unit price for the product categories with the largest EU total export decreases in 2017
The European Commission helps EU exporters to identify export opportunities and secure business deals through promotion activities18, including high level missions of Commissioner Hogan to non-EU countries with strong potential for EU agricultural exports (see text box).
18
Cf. also: Enjoy it's from Europe - Promoting EU food and farming abroad:
https://www.youtube.com/watch?v=_IyceHSCYoI&t=12s
3.3. EU agri-food import products
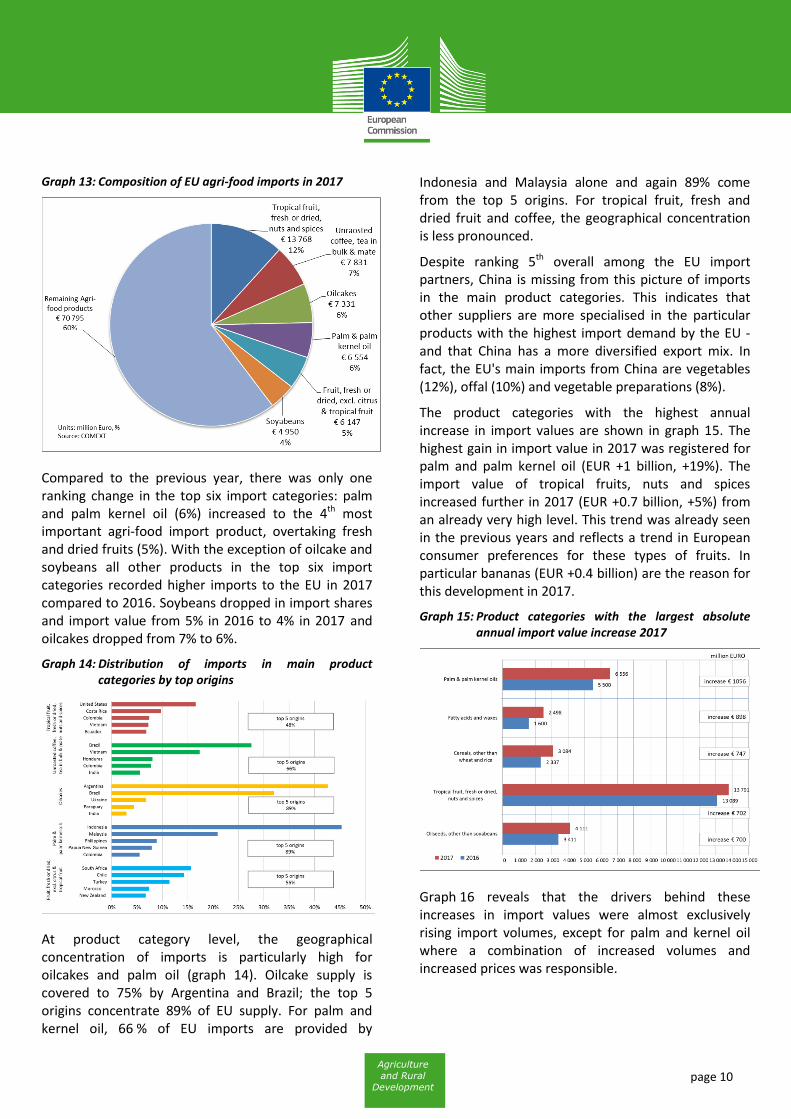
Graph 13 shows the composition of EU agri-food imports by product category. In essence, the EU is sourcing three main types of products from third countries: products that are not (or only to a small extent) produced in the EU itself due to natural conditions (such as tropical fruit, coffee and fresh or dried fruits – together 24%), products that are mostly used for animal feed (oilcakes and soybeans – together 10%) and products that are used as ingredient in further processing (palm oil – 6%).
Promotion of agricultural products
As part of its own initiative actions for the promotion of agricultural products in 2017, the European Commission organised two high level missions with business delegations: to Canada (30 April to 3 May) and to Saudi Arabia and Iran (7 to 13 November).
59 companies and sectorial organisations from 22 Member States participated in the mission to Canada, organised in conjunction with the SIAL food and beverage fair in Toronto where the EU featured as the region of honour.
54 different companies and organisations formed Commissioner Hogan’s business delegation to Saudi Arabia and Iran, representing in total 19 Member States. Over 300 B2B (business-to-business) meetings, 10 retail visits and over 15 specific site visits were organised for EU business delegates in both countries.
As a follow up to the business delegation visit in the Middle East, the Commission organised an EU pavilion at the SIAL food and beverage fair in Abu Dhabi on 12 to 14 December, focusing on showcasing EU food safety and quality policy by means of expert presentations, cooking shows and product display targeting major buyers as well as the general public.
Further promotion efforts by the Commission implemented or planned for 2018 include a business delegation visit with Commissioner Hogan to China on 14 to 19 May 2018, an EU pavilion at the SIAL fair in Shanghai (16 to 18 May), an agri-food products promotion seminar focused on EU SPS standards and quality policy in Seoul, Korea (20 to 21 March), as well as communications campaigns for EU agri-food and beverage products in Canada, the Middle East, China and Japan, due to commence in the final quarter of 2018.
Facts and figures:
77% of the delegates going to Kingdom of Saudi Arabia and 98% of the delegates going to Iran were 'satisfied' or 'very satisfied' with the overall organisation of the mission.
More than half of the business delegation to Canada answered that they feel confident on seeing their business growing as a result of the visit (56%) and 15% of the business had already closed business deals only 3 weeks after the end of the mission.
EU funding for promotion policy, including promotion programmes and Commission's own initiative actions, will rise from EUR 142.5 million in 2017 to EUR 188.5 million in 2018 and EUR 200 million in 2020.
page 10
Agriculture
and Rural
Development
Graph 13: Composition of EU agri-food imports in 2017
Compared to the previous year, there was only one ranking change in the top six import categories: palm and palm kernel oil (6%) increased to the 4th most important agri-food import product, overtaking fresh and dried fruits (5%). With the exception of oilcake and soybeans all other products in the top six import categories recorded higher imports to the EU in 2017 compared to 2016. Soybeans dropped in import shares and import value from 5% in 2016 to 4% in 2017 and oilcakes dropped from 7% to 6%.
Graph 14: Distribution of imports in main product categories by top origins
At product category level, the geographical concentration of imports is particularly high for oilcakes and palm oil (graph 14). Oilcake supply is covered to 75% by Argentina and Brazil; the top 5 origins concentrate 89% of EU supply. For palm and kernel oil, 66 % of EU imports are provided by
Indonesia and Malaysia alone and again 89% come from the top 5 origins. For tropical fruit, fresh and dried fruit and coffee, the geographical concentration is less pronounced.
Despite ranking 5th overall among the EU import partners, China is missing from this picture of imports in the main product categories. This indicates that other suppliers are more specialised in the particular products with the highest import demand by the EU -and that China has a more diversified export mix. In fact, the EU's main imports from China are vegetables (12%), offal (10%) and vegetable preparations (8%).
The product categories with the highest annual increase in import values are shown in graph 15. The highest gain in import value in 2017 was registered for palm and palm kernel oil (EUR +1 billion, +19%). The import value of tropical fruits, nuts and spices increased further in 2017 (EUR +0.7 billion, +5%) from an already very high level. This trend was already seen in the previous years and reflects a trend in European consumer preferences for these types of fruits. In particular bananas (EUR +0.4 billion) are the reason for this development in 2017.
Graph 15: Product categories with the largest absolute annual import value increase 2017
Graph 16 reveals that the drivers behind these increases in import values were almost exclusively rising import volumes, except for palm and kernel oil where a combination of increased volumes and increased prices was responsible.

page 11
Agriculture
and Rural
Development
Graph 16: Annual percentage change in volume and unit price for selected product categories with EU total import increases in 2017
The most noteworthy import value losses in 2017 were registered for cocoa beans (EUR -0.7 billion, -16%) as well as soybeans (EUR -0.4 billion, -7%) as shown in figure 17.
Graph 17: Product categories with the largest absolute annual import value decrease in 2017
Graph 18 shows a mixed picture for the drivers of these developments. Lower import volumes explain the observations for wheat, soybeans and meat preparations while for cocoa beans a sharp drop in prices (-23%) more than cancelled out the effect of higher import volumes. The decrease in beet and cane sugar import values was caused by substantially lower volumes (-17%) but moderated by higher unit prices (+13%).
Graph 18: Annual percentage change in volume and unit price for the product categories with the largest EU total import decreases in 2017
4. Agri-food trade with key partners
This chapter provides a general overview of the trade performance of the EU's key partners19 and a description of their trade flows with the EU20. The United States and China are the partners depicting the strongest reciprocal trade relationship with the EU. Agri-food trade with Brazil and Japan is more of a one-way flow: Brazil is the most important origin for EU agri-food imports, while Japan is a major export destination for the EU. In addition, the trade development with Russia is analysed, following drastic changes after the embargo for certain agricultural products was enforced in August 2014. Finally, given that the trade policy of the EU incentivises trade with Least Developed Countries (LDCs), this group of countries is also covered in the analysis.
4.1. United States
Increasing exports and imports - but losses for soybeans and corn
US ranks second in world exports and imports of agri-food. Its agri-food trade surplus stood at EUR 17 billion in 2017 (-9% compared to 2016). The value of US agri-
19 Based on Global Trade Atlas (GTA) 20 Based on Eurostat (Comext), cf. also Factsheets on EU28 agri-food trade with the world, individual countries and selected regions: https://ec.europa.eu/agriculture/trade-analysis/statistics_en
page 12
Agriculture
and Rural
Development
food exports rose to EUR 132 billion (+1%)21, that of imports to EUR 115 billion (+3.5%).
Canada remains the top US agri-food export destination (absorbing 17.2%) while China only narrowly remains in second place with 13.2% - experiencing a 12.6% drop in US exports in 2017. Considering Hong Kong together with China adds another 2.9% to US exports to the region. This is followed by Mexico (13%) and the EU (8.6%, stable from 2016) just before Japan (8.2% with an increase of 5.5% to the previous year).
The wide range of export products of the US prominently features animal feed (soybeans and oilcakes), field crops (maize, wheat, and cotton), nuts and meat (in particular pork, poultry and beef). Imports are dominated by beverages (spirits, wine, beer, soft drinks), coffee, fruit and vegetables, meat and prepared foods.
The most striking increases in US export values in 2017 were in cotton (+46%), the 5th most valuable export product, and wheat (+11%) in 4th place. For cotton, this increase was driven by higher quantities as well as prices while for wheat, higher quantities more than compensated a small drop in unit prices. In terms of decreasing export values, both the main export products, soybeans (14.4% of US exports, -8,7% from 2016), and the second largest, corn (6.5% of exports, -7.6%) recoded significant decreases driven by both lower quantities and lower unit values.
US agri-food imports are quite scattered, no product representing more than 6% of total imports. In 2017, significant increases in absolute terms could be observed for coffee, bread and pastry and fruits. Prime suppliers of the US with agri-food are the EU (21.6%) and its NAFTA partners, Mexico (20.2%) and Canada (17.7%).
US - agri-food trade with the EU
The United States are the top export market for the EU and the second most important origin for EU imports of agri-food products. 16% of EU agri-food exports (EUR 22 billion) are directed towards the US, and 9.5% of all EU imports (EUR 11 billion) are sourced from there. On the one hand, EU exports to the US increased further in
21 Based on the definition of agricultural products used for this newsletter. Source: Global Trade Atlas
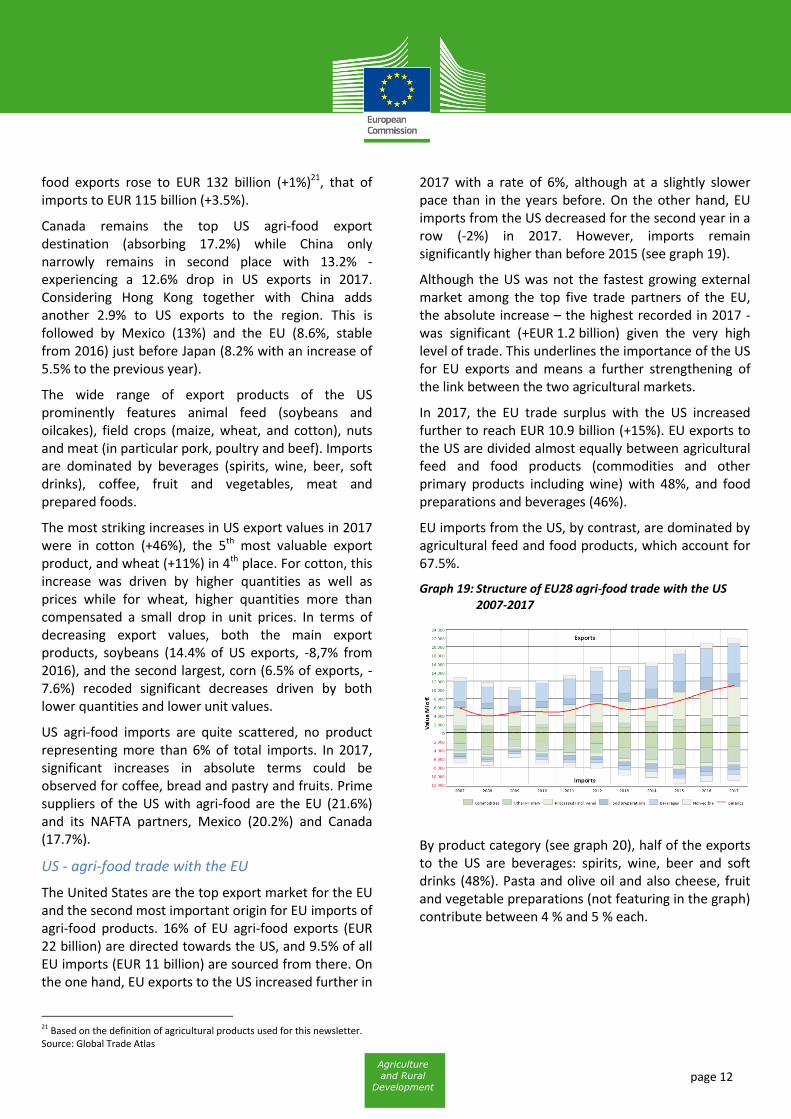
2017 with a rate of 6%, although at a slightly slower pace than in the years before. On the other hand, EU imports from the US decreased for the second year in a row (-2%) in 2017. However, imports remain significantly higher than before 2015 (see graph 19).
Although the US was not the fastest growing external market among the top five trade partners of the EU, the absolute increase – the highest recorded in 2017 - was significant (+EUR 1.2 billion) given the very high level of trade. This underlines the importance of the US for EU exports and means a further strengthening of the link between the two agricultural markets.
In 2017, the EU trade surplus with the US increased further to reach EUR 10.9 billion (+15%). EU exports to the US are divided almost equally between agricultural feed and food products (commodities and other primary products including wine) with 48%, and food preparations and beverages (46%).
EU imports from the US, by contrast, are dominated by agricultural feed and food products, which account for 67.5%.
Graph 19: Structure of EU28 agri-food trade with the US 2007-2017
By product category (see graph 20), half of the exports to the US are beverages: spirits, wine, beer and soft drinks (48%). Pasta and olive oil and also cheese, fruit and vegetable preparations (not featuring in the graph) contribute between 4 % and 5 % each.

page 13
Agriculture
and Rural
Development
Graph 20: Composition of EU agri-food exports to the US in 2017
Compared to the export structure of 2016, the situation in 2017 changed only marginally. Among flagship export products, only beer and cheese decreased in value, while water and soft drinks increased their export share by 20% compared to 2016.
The US is a particularly important market for EU exports in coffee (re-exports), essential oils, beer, spirits, and water and soft drinks. As table 1 indicates, the US represents a crucial destination for these product categories, absorbing major (and increasing - except for slight decreases in value for beer and coffee) shares of total EU exports in these products. The US is also the number 1 export destination for other key European agri-food products as olive oil (37%), wine (32%) and cheese (22%).
Table 1: US as important destination for EU exports by product category, in 2017
Concerning EU imports from the US, as shown in graph 21, tropical fruit and nuts (21%) and soybeans (16%) dominate, with spirits (8%), food preparations (5%) and wine (4%) completing the top five.
The ranking of most important product categories in 2017 remained unchanged compared to 2016, while changes were noted in import values and thus in the respective shares. Notably, the share of soybeans was down from 18 % to 16 % after a hike in 2016 (-13% in import value), while the share of spirits and liqueurs was up from 8% to 9% (+9.7% in import value) compared to 2016.
Graph 21: Composition of EU agri-food imports from the US in 2017
As shown in table 2 the US share and value in EU imports is particularly high for spirits (51%), soybeans (35%) and food preparations (30%). The US is, together with Brazil, the EU's top origin for soybeans. The highest US share in EU imports are coming from odoriferous substances (60%) and live animals (56%). However, imports of these products are relatively limited.
Table 1: US as important origin for EU imports by product category, in 2016
Rankproduct
category
EU export to
world
EU export
to the US
US share
in total
1
Unroasted
coffee, tea in
bulk & mate
524 290 55%
2 Essential oils 739 314 42%
3 Beer 3,467 1,356 39%
4Spirits and
liqueurs10,741 4,128 38%
5Waters and
soft drinks3,738 1,375 37%
in million EURRank
product
category
EU imports
to world
EU imports
to the US
US share
in total
1Odoriferous
substances10 6 60%
2 Live animals 233 130 56%
3Spirits and
liqueurs1,654 840 51%
4 Soyabeans 4,931 1,732 35%
5
Food
preparations,
not specified
1,900 564 30%
in million EUR
page 14
Agriculture
and Rural
Development
4.2. China
Agri-food imports increase again – but the EU is not among the biggest winners
In 2017, China's demand for agri-food imports soared again to EUR 103 billion, which means an increase of EUR 10 billion (+10.3%) compared to 2016, when imports had dropped significantly. Many import origins profited from this surge in demand, among the top suppliers mostly Brazil (+24.5%), Australia (+27.6%), Canada (+21.8%) and New Zealand (+35.1%). The increase of Chinese imports from the EU remains thus moderate in comparison (+2.1%). However, the EU remains in third place of all suppliers (12.5% of imports) behind Brazil (20.7%) and the US (19.7%) - and does better than the US, which sees a decrease of 2% in Chinese imports. The moderate EU increase may be partly due to the fact that the EU managed to resist the overall slump in Chinese demand in 2016, which left less opportunity for a rebound in 2017.
In terms of products, soybeans are the dominant Chinese import product with over one third of total import value (34.1%) and a further increase of 14.2% from 2016 to 2017. Soybeans are sourced mainly from the Brazil (source of 52.5% of Chinese soybean imports) and the US (35.7%). The next five important products, infant food preparations, palm oil, bovine meat, wine and wool, all saw double-digit increases (between 15% and 25%) but remain at a total import share of only between 2% and 4% each. Pork imports, in contrast, have decreased steeply in value terms (-31.2%) due to a drop in quantities as well as unit prices. This breaks the pattern of strong increases in imports of the product for the two previous years (2015 and 2016). Pork offal, likewise, went down significantly. One reason for this development is likely to be the restructuring of the Chinese pig sector with a focus on achieving higher self-sufficiency.
On the export side, China moderately increased its capacity in 2017 (+1.9%). However, due to the stronger increase of imports, the country's trade deficit in agri-food products rose to EUR 54 billion. Fresh and processed fruit and vegetables continue to be the flagship export products for China's agri-food sector with a share of more than 40% in total exports. In 2017, these product categories also recorded the
biggest absolute gains in export value. The main market for Chinese agri-food exports is Hong Kong (15.3% of total value) with vegetables, soft drinks, wine, live pigs and poultry meat figuring as main products. It is likely that some of these products are further exported to other destinations from Hong Kong. Exports to Japan have slightly dropped (-1.6%) but the country remains in second place of export destinations with 11.8% of total exports, just before the EU (11.6% of exports, +5.2% in 2017) and with some distance from the US (8.2% of exports, stable from previous year).
China – agri-food trade with the EU
With total agri-food exports valued at EUR 12 billion and imports valued at EUR 5.4 billion, China is the second most important destination for EU agri-food exports (8.7% of all EU agri-exports) and the fifth most important origin (4.6%) for EU agri-food imports.
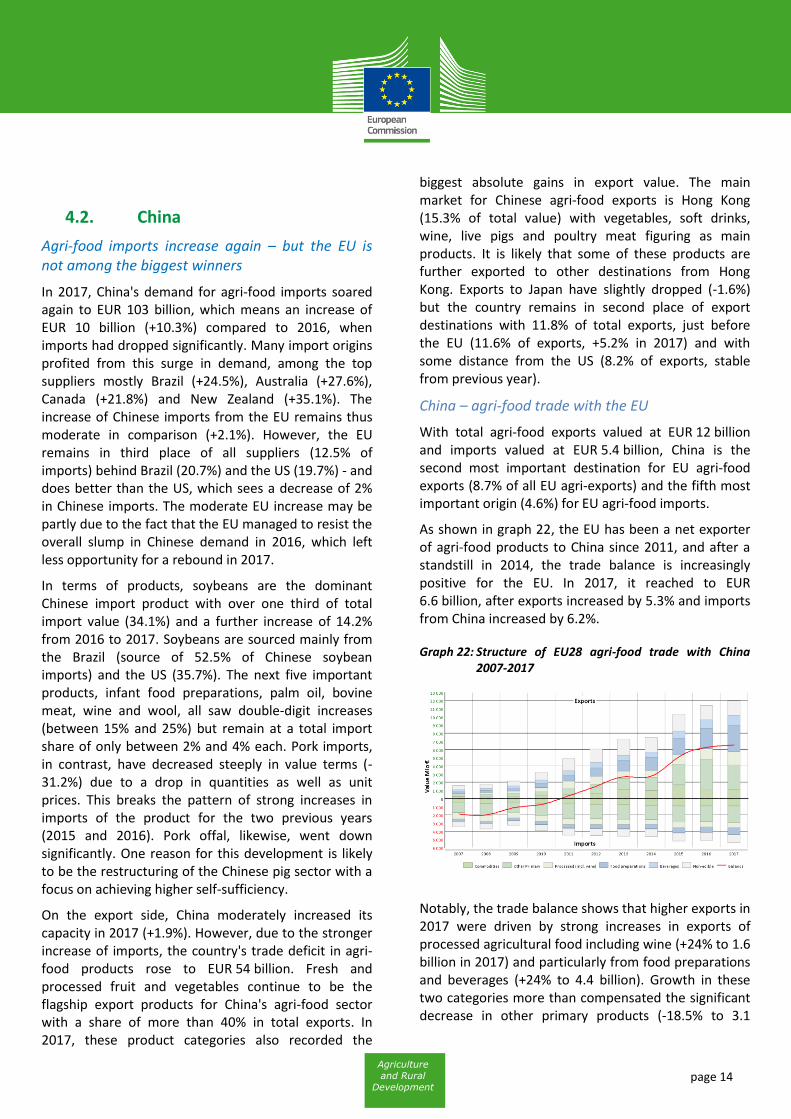
As shown in graph 22, the EU has been a net exporter of agri-food products to China since 2011, and after a standstill in 2014, the trade balance is increasingly positive for the EU. In 2017, it reached to EUR 6.6 billion, after exports increased by 5.3% and imports from China increased by 6.2%.
Graph 22: Structure of EU28 agri-food trade with China 2007-2017
Notably, the trade balance shows that higher exports in 2017 were driven by strong increases in exports of processed agricultural food including wine (+24% to 1.6 billion in 2017) and particularly from food preparations and beverages (+24% to 4.4 billion). Growth in these two categories more than compensated the significant decrease in other primary products (-18.5% to 3.1

page 15
Agriculture
and Rural
Development
billion) which went back to a more moderate level after a hike in 2016.
On the import side the changes since 2016 were less significant, ranging from -7% for processed agricultural products to +5% for other primary. An exception is the strong increase of food preparation and beverages with +29% compared to 2016, mainly driven by a +84% increase in pet food imports to Europe. The previous structure of imports is maintained with other primary products covering the main share of imports (38%), followed by non-edible products (19%) and commodities (17%).
Breaking down the agri food exports by product category, as shown in Graph 23, some changes appear compared to 2016. The top six categories comprise 62% of total EU agri-exports to China. This reflects the fact that China is mainly absorbing a selected range of products from the EU. Infant food and other cereals clearly remain the most important export category, increasing the share to 20%, up from 16% in 2016 (+30%). A similar increase can be seen in the wine, vermouth, cider and vinegar category (+25% to 1.1 billion) holding a share of 10% and coming in in third place.
Graph 23: Composition of EU agri-food exports to China in 2016
On the other hand, pork meat decreased significantly in export value (-29% to 1.2 billion) and the share is back to more normal levels, after the enormous hike in 2016. A similar pattern can be seen for offal (-18% to 1.1 billion). Pork meat (10%) and offal and other meats (9%) – the latter mainly comprised of products originating from pigs – account together for almost a fifth of EU exports to China in 2016, demonstrating the
importance of pig meat for this destination. Raw hides and skins (share of 7%) and milk powders and whey (5%) complete the top six.
China is a particularly important market for EU exports: on the one hand, raw agricultural material used in the garment industry (wool and silk, raw hides and skins, cotton) and on the other hand, pork products (pig meat and offal). As table 3 indicates, China represents a crucial destination for these product categories, absorbing from one third to more than 60% of EU exports – even more so when adding exports to Hong Kong. China is the number one destination not only for EU offal (38%) and pork meat (25%, together with Japan), but also for many dairy products (infant food - 33 %, fresh dairy products - 33 % and milk powders and whey - 15 %).
Table 3: China as important destination for EU exports by product category, in 2017
As regards EU imports, the overall structure in 2017 (graph 24) looks similar to previous years. Vegetables dominate, whether fresh and dried (12%) or prepared (8%, together with fruit preparations), followed by offal (9%), tropical fruit (7%), pet food (6%), wool and silk (6%).
Rank product
category
EU export
to world
EU export
to China
China share
in total
1 Wool and silk 138 88 64%
2
Raw hides,
skins and
furskins
1,865 789 42%
3
Cotton, flax
and hemp, and
plaiting
materials
830 328 40%
4
Offal, animal
fats and other
meats, fresh,
chilled and
frozen
3,010 1,130 38%
5
Fresh milk and
cream,
buttermilk and
yoghurt
1,265 419 33%
in million EUR

page 16
Agriculture
and Rural
Development
Graph 24: Composition of EU agri-food imports from China in 2017
Quite remarkably, offal and wool and silk feature as well among the list of products for which China is an important origin for EU imports (see table 4), providing more than one third of EU supply. This indicates a strong reciprocal trade between the EU and China for both of these products, although the offal traded is of different types. For other products, the share of China in EU imports is less important.
Table 4: China as important origin for EU imports by product category, in 2017
4.3. Brazil
Exports increase strongly, especially to China
After a decrease in export values in 2016, Brazil experiences a solid 12% growth of agri-food exports in 2017 to EUR 72 billion. With only EUR 9 billion of imports, Brazil thus accumulates a EUR 63 billion agri-food trade surplus.
China further increased its dominant position as destination for Brazil's exports: the country absorbs 28.8% of all exports, an increase of 30% compared to 2016. Hong Kong – usually considered as an export hub to China – sees a 20.8% increase (to 2.9% of overall exports). The EU (16.5% of exports) stays with almost stable share in second place while the US remains third with a substantial distance (4.6% of exports).
Soybeans are the dominant agricultural export of Brazil, making up 32% of overall export value. 2017 saw an increase by 33.4% in this product compared to the previous year, due to higher quantities (while the unit price remained stable) exported mainly to China.
Sugar, the second placed export with a 14% share in total, also experienced further export growth (+6.8%). Behind this overall growth are very divergent trade developments with different countries: Substantial increases were recorded to some major destinations, in particular Bangladesh (+58.6%), Algeria (+21.8%), United Arab Emirates (+39.5%), Malaysia (+27%) and Egypt (+58.8%). In contrast, exports to China plummeted (-83.7%), making the country drop from first to 21st place of destinations for Brazilian sugar. Exports of sugar to the EU - only featuring in 15th place of the destinations for Brazil's sugar - decreased by 5.1%.
Other important export products, such as corn (+17.2%), bovine meat (+19.2%) and poultry (+5.4%) also increased, while the export value of soybean oilcakes (-5.5%) and coffee (-7%) went down.
The cross-trade of ethanol between Brazil and the US, i.e. export of cane ethanol to the US and import of maize ethanol from the US, continued with increasing trade values in both directions.
Brazil's most relevant agri-food import products are wheat (11.2% of imports), ethanol (8.9%) and malt (4%)
Rank product
category
EU imports
to world
EU
imports to
China
China
share in
total
1
Offal, animal
fats and other
meats, fresh,
chilled and
frozen
1,160 565 49%
2 Wool and silk 909 303 33%
3
Non-edible
animal
products
489 147 30%
4Eggs and
honey516 127 25%
5 Pet food 1,277 313 25%
in million EUR

page 17
Agriculture
and Rural
Development
with Argentina (28.6%), the EU (18.8%) and the US (15.1%) as the largest partners.
Brazil – agri-food trade with the EU
Brazil remains as the most important source for European imports of agri-food products (10% of total in 2017), but the declining trend of its share since 2012 continues (graph 25). The EU trade deficit with Brazil agri-food decreased slightly in 2017 and now amounts to EUR 10.1 billion, due to a slight decrease in EU imports in 2017 (-1.2%, EUR -0.1 billion) as well as a moderate increase in EU exports (+8.4%, EUR +0.1 billion).
Graph 25: Structure of EU28 agri-food trade with Brazil 2007-2017
62% of the products imported from Brazil are commodities, including in particular oilcakes and soybeans that provide protein and fat for animal feed, and coffee. The exports to Brazil, in contrast, represent only 1.2% of total EU agri-food exports. Brazil essentially buys European olive oil, vegetables or fruit preparations, citrus fruit, wine, food preparations and pet food.
Graph 26 shows a more detailed structure of the top import products from Brazil. The structure of imports remains almost unchanged compared to 2016: out of the top five product categories which represent 70% of all agri-food imports from Brazil, around half of the import value is associated with feed products (oilcakes and soybeans), and the other half with food products (coffee, fruit juice and meat preparations). Following the general trend, these product categories all decreased in import value compared to 2016 (ranging between 2% and 3%). Notably, the biggest decrease in imports compared to 2016 is registered for meat preparations (-16%), while imports of cereals other
than wheat and rice shoot up by 233% and are newly featuring in sixth place in 2017.
Graph 26: Composition of EU agri-food imports from Brazil in 2017
Table 5 lists the product categories for which Brazil is a particularly important origin for EU sourcing. Apart from the products already mentioned as top EU imports, Brazil also provides the EU with 41 % of its poultry meat imports.
Table 5: Brazil as important origin for EU imports by product category, in 2017
4.4. Japan
Stable importer with further perspectives for the EU
Japan is one of the most densely populated countries in the world with limited resources to fully cover its own demand for agricultural products with domestic production. While imports of agri-food products had decreased in 2013-2014, they picked up again in 2015,
Rankproduct
category
EU imports
to world
EU imports
to Brazil
Brazil share
in total
1 Fruit juices 2,235 1,141 51%
2Meat
preparations1,902 863 45%
3
Poultry
meat, fresh,
chilled and
frozen
323 133 41%
4 Soyabeans 4,931 1,796 36%
5 Oilcakes 7,321 2,346 32%
in million EUR
page 18
Agriculture
and Rural
Development
remained stable in 2016 and saw a 4.2% increase in 2017 to reach EUR 50.5 billion. Given the modest level of exports at EUR 4.1 billion, Japan's agri-food trade balance shows a significant deficit of EUR 46.4 billion.
The US is the first supplier of agri-food products to Japan, representing almost one quarter of Japanese imports (23%). The EU remains the second largest import origin for agri-food products in 2017 representing 17.5% of imports (an increase of 13.9% compared to the previous year). China is third with 11.2%.
In total, various meats and meat products account for more than 20% of the value of Japan's agri-food imports. Pig meat alone has a share of 7.7% and is sourced mainly from the EU (35.9%), the US (28.7%) and Canada (23.2%). Beef is imported from the US (50%) and Australia (45.5%). Cigarettes and tobacco (7.7% of imports) come mainly from the EU while for cereals (10% of imports, mainly corn and wheat), the US, Canada and Australia are main partners. Wine (2.8%) is imported mainly from the EU, which has an import share of 73% in 2017, followed by Chile (13.3%) and the US (7.6%).
Japan's agri-food exports are marginal at world scale and concentrated on processed products such as food preparations, sauces, and products from the bread, pastry and cakes category.
Japan – agri-food trade with the EU
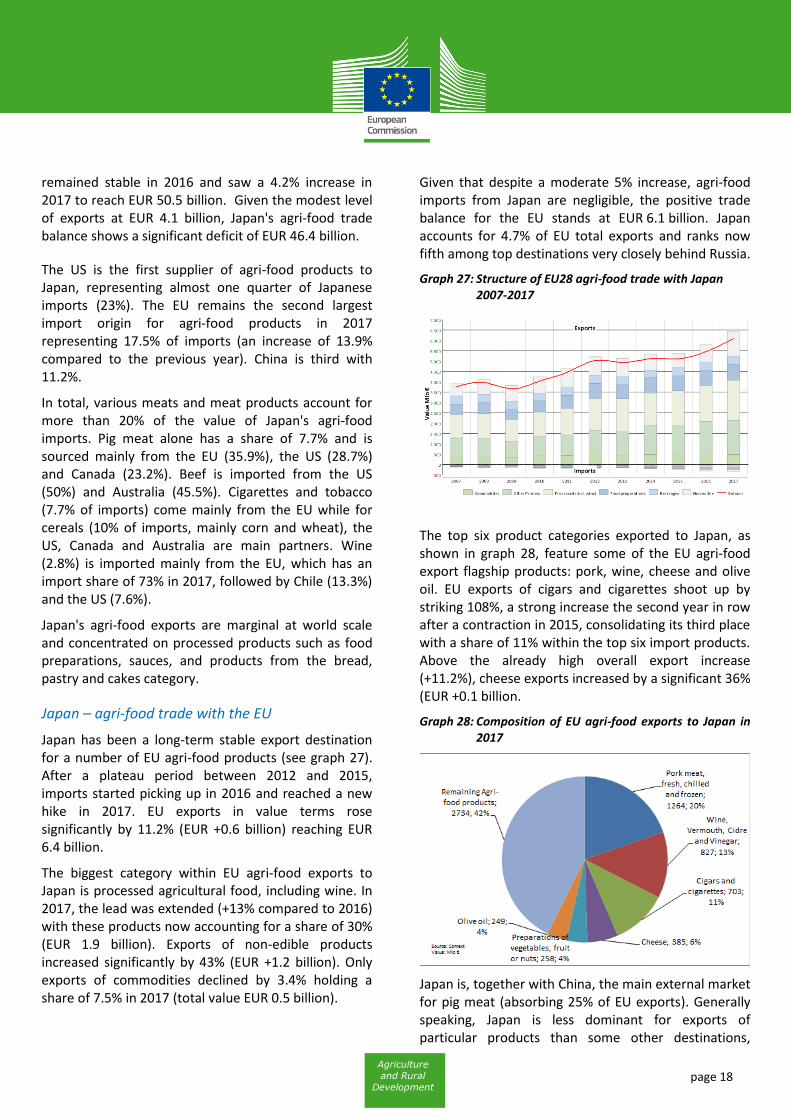
Japan has been a long-term stable export destination for a number of EU agri-food products (see graph 27). After a plateau period between 2012 and 2015, imports started picking up in 2016 and reached a new hike in 2017. EU exports in value terms rose significantly by 11.2% (EUR +0.6 billion) reaching EUR 6.4 billion.
The biggest category within EU agri-food exports to Japan is processed agricultural food, including wine. In 2017, the lead was extended (+13% compared to 2016) with these products now accounting for a share of 30% (EUR 1.9 billion). Exports of non-edible products increased significantly by 43% (EUR +1.2 billion). Only exports of commodities declined by 3.4% holding a share of 7.5% in 2017 (total value EUR 0.5 billion).
Given that despite a moderate 5% increase, agri-food imports from Japan are negligible, the positive trade balance for the EU stands at EUR 6.1 billion. Japan accounts for 4.7% of EU total exports and ranks now fifth among top destinations very closely behind Russia.
Graph 27: Structure of EU28 agri-food trade with Japan 2007-2017
The top six product categories exported to Japan, as shown in graph 28, feature some of the EU agri-food export flagship products: pork, wine, cheese and olive oil. EU exports of cigars and cigarettes shoot up by striking 108%, a strong increase the second year in row after a contraction in 2015, consolidating its third place with a share of 11% within the top six import products. Above the already high overall export increase (+11.2%), cheese exports increased by a significant 36% (EUR +0.1 billion.
Graph 28: Composition of EU agri-food exports to Japan in 2017
Japan is, together with China, the main external market for pig meat (absorbing 25% of EU exports). Generally speaking, Japan is less dominant for exports of particular products than some other destinations,

page 19
Agriculture
and Rural
Development
never accounting for more than 25% in value (see table 6). Japan is the first export destination for cigars and cigarettes and malt (20% and 11%, respectively, of EU exports). 10% of EU cheese exports are absorbed by Japan.
The expected entry into force of the EU-Japan Economic Partnership Agreement (EPA) will further increase market opportunities for EU products. The agreement will provide better opportunities and greater access for EU agricultural exporters to a market of 127 million consumers, currently worth more than EUR 6 billion per year of EU agri-food exports. It is in fact the most successful agreement ever achieved for EU agriculture and the biggest concession Japan ever granted to a trade partner.
Table 6: Japan as important destination for EU exports by product category, in 2017
4.5. Russia
Imports recover, exports continue to increase
After a low point in 2016, Russian agri-food imports recovered in 2017 to EUR 24.7 billion (+12.3%). Exports continued an upward trend with an impressive 19.4% increase year-on-year. This development may be linked to Russia's recovery from recession with economic
growth in 2017 for the first time in three years22. With this development, the trade deficit of Russia stands at EUR 9.4 billion in 2017.
Around one quarter of agri-food imports (26.2%) is sourced from the EU, with a recovery of 15.8% for the first time since the Russian import embargo for a range of agricultural products was implemented. Imports from other important partners - Belarus (13.3% of imports), Brazil (9%) and China (5.5%) - also increased.
Russia's top import products include fresh fruit and vegetables, meat and dairy products, wines and spirits and soybeans without being dominated by any particular product category. With the exception of soybeans and citrus fruits, all of these products recorded import increases in 2017.
On the export side, cereals (wheat and corn, together almost 40%) and sunflower oil (10.4%) dominate. Egypt established itself as first Russian export destination in 2017 (10.4% of exports, +40%), overtaking Turkey (10%) and Kazakhstan (8.4%).
Russia – agri-food trade with the EU
The development of agri-food trade between the EU and Russia over the past four years is obviously characterised by a complete reshuffling of the trade profile following the import embargo Russia imposed for certain EU agricultural products in August 2014. On top of the embargo, an unfavourable exchange rate between the euro and the Russian rouble together with a worsening of the economic conditions in Russia affecting non-banned products led to a another drop in EU total agri-food exports in value to Russia in 2015 from the already low level of 2014. In 2016, the situation stabilised, while 2017 is the first year after the ban with a clear increase of EU agri-food exports to Russia by almost 16%, representing EUR +0.9 billion (graph 29).
The increase is driven by all agri-food product groups with the exception of non-edibles (-2.7%) and, of course, stems from exports of the products not targeted by the embargo. The biggest export increase was accounted for food preparations and beverages (+22%) holding a share of 41% (EUR 2.7 billion) in 2017.
22 Financial Times, Russian economy grows in 2017 for first time in three years, 1 February 2018
Rankproduct
category
EU export
to world
EU export
to Japan
Japan share
in total
1
Pork meat,
fresh,
chilled and
frozen
5,092 1,264 25%
2Cigars and
cigarettes3,492 703 20%
3 Malt 993 109 11%
4
Casein,
other
albuminoida
l substances
and
modified
starches
1,977 194 10%
5 Cheese 3,991 385 10%
in million EUR

page 20
Agriculture
and Rural
Development
Absorbing 4.7% of EU exports, Russia features again in fourth place among top destinations for EU agri-food exports, just ahead of Japan.
Graph 29: Structure of EU28 agri-food trade with Russia 2007-2017
Imports from Russia into the EU – marginal compared to exports – are dominated by commodities with a share of 64.7%.
Graph 30: Composition of EU agri-food exports to Russia in 2017
The structure of EU exports to Russia prior to the embargo was characterised by fresh fruit and vegetables (EUR 2.1 billion in 2013), cheese (EUR 983 million in 2013) and pork (EUR 959 million in 2013) accounting for more than one third of the total value of exports. By 2015, none of these products could be found in the (top) export product categories. In 2017, the structure of exports to Russia remained almost the same compared to 2015 and 2016, with wine, pet food, spirits and chocolate among the top categories (graph 30). For the mentioned product categories exports increased by a significant rate
between 23% and 32% compared to 2016. However, exports of banned products remained virtually zero.
Russia is the most important customer for EU cut flowers (30% share of total EU exports) and eggs and honey (21%). Other products in table 7 below are mainly EU re-exports and are less significant.
Table 7: Russia as important destination for EU exports by product category, in 2017
4.6. Least Developed Countries (LDCs)
EU remains the dominant importer
LDCs benefit from duty-free, quota-free access to the EU market under the "Everything But Arms" scheme and many of them have concluded Economic Partnership Agreements (EPAs) with the EU, encouraging regional cooperation and trade. Concerning agriculture, provided that the products comply with the EU sanitary and phyto-sanitary requirements, the EU trade preferences for LDCs incentivise European businesses to buy products from these countries against other suppliers which have to pay regular (Most Favoured Nations) duties.
As a direct result of this policy, the EU remains by far the top importer of agri-food products from least developed countries. In 2017, EU imports of agri-food products from LDCs reached a value of EUR 3.5 billion, an increase of 3.3% from 2016. The other top world importers US, China, Japan, Russia and Canada ("Big 5") together reach only EUR 3 billion (graph 31), making the EU the dominant importer in absolute as well as
Rankproduct
category
EU export
to world
EU export
to Russia
Russia share
in total
1
Palm &
palm kernel
oils
177 68 38%
2 Soyabeans 144 53 37%
3Cut flowers
and plants722 217 30%
4
Oilseeds,
other than
soyabeans
779 208 27%
5Eggs and
honey667 143 21%
in million EUR
page 21
Agriculture
and Rural
Development
relative terms. While the EU sources 3% of its total imports in agri-food products from LDCs, the average of the individual countries of the Big 5 is around 1%.
Graph 31: EU28 and "Big 5" imports from LDCs, 2008-2017
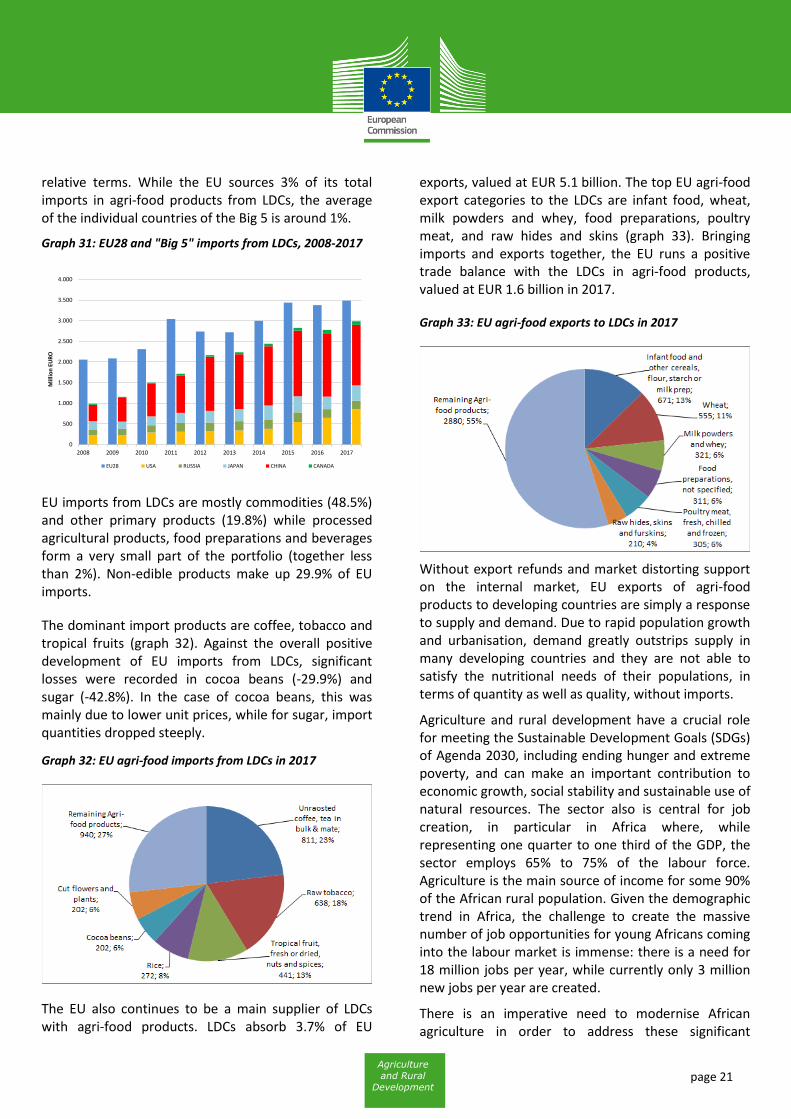
EU imports from LDCs are mostly commodities (48.5%) and other primary products (19.8%) while processed agricultural products, food preparations and beverages form a very small part of the portfolio (together less than 2%). Non-edible products make up 29.9% of EU imports.
The dominant import products are coffee, tobacco and tropical fruits (graph 32). Against the overall positive development of EU imports from LDCs, significant losses were recorded in cocoa beans (-29.9%) and sugar (-42.8%). In the case of cocoa beans, this was mainly due to lower unit prices, while for sugar, import quantities dropped steeply.
Graph 32: EU agri-food imports from LDCs in 2017
The EU also continues to be a main supplier of LDCs with agri-food products. LDCs absorb 3.7% of EU
exports, valued at EUR 5.1 billion. The top EU agri-food export categories to the LDCs are infant food, wheat, milk powders and whey, food preparations, poultry meat, and raw hides and skins (graph 33). Bringing imports and exports together, the EU runs a positive trade balance with the LDCs in agri-food products, valued at EUR 1.6 billion in 2017.
Graph 33: EU agri-food exports to LDCs in 2017
Without export refunds and market distorting support on the internal market, EU exports of agri-food products to developing countries are simply a response to supply and demand. Due to rapid population growth and urbanisation, demand greatly outstrips supply in many developing countries and they are not able to satisfy the nutritional needs of their populations, in terms of quantity as well as quality, without imports.
Agriculture and rural development have a crucial role for meeting the Sustainable Development Goals (SDGs) of Agenda 2030, including ending hunger and extreme poverty, and can make an important contribution to economic growth, social stability and sustainable use of natural resources. The sector also is central for job creation, in particular in Africa where, while representing one quarter to one third of the GDP, the sector employs 65% to 75% of the labour force. Agriculture is the main source of income for some 90% of the African rural population. Given the demographic trend in Africa, the challenge to create the massive number of job opportunities for young Africans coming into the labour market is immense: there is a need for 18 million jobs per year, while currently only 3 million new jobs per year are created.
There is an imperative need to modernise African agriculture in order to address these significant
0
500
1.000
1.500
2.000
2.500
3.000
3.500
4.000
2008 2009 2010 2011 2012 2013 2014 2015 2016 2017
Mill
ion
EU
RO
EU28 USA RUSSIA JAPAN CHINA CANADA
page 22
Agriculture
and Rural
Development
structural issues, making it easier for local companies to grow and develop. This could help to reduce the region’s reliance on imports of certain products as well as to absorb the rapidly increasing workforce. The EU is therefore strongly invested in fostering relationships with developing countries, in particular in Africa, in conducting a policy dialogue that assists them in advancing their agriculture and rural potential, and in encouraging responsible private investment in African markets. Furthermore, the EU is ready to take a leading role in global initiatives that aim at fostering development and sustainable agricultural production - for example in the context of the UN, the G20 and the G7. The EU and its Member States also remain the largest provider of development assistance (EUR 75.5 billion 2016) which is primordial to boost our partners' economies.

page 23
Agriculture
and Rural
Development
Annex Product classification
Product groups Product classes Product categories
Agricultural food and feed products
Commodities
Wheat
Cereals, other than wheat and rice
Rice
Flours and other products of the milling industry
Malt
Starches, inulin & gluten
Soyabeans
Oilseeds, other than soy beans
Palm & palm kernel oils
Vegetable oils other than palm & olive oils
Oilcakes
Other feed and feed ingredients
Beet and cane sugar
Sugar, other than beet & cane
Milk powders and whey
Butter
Gums, resins and plant extracts
Unroasted coffee, tea in bulk & mate
Cocoa beans
Cocoa paste and powder
Agricultural commodities, not specified
Other primary
Live animals
Bovine meat, fresh, chilled and frozen
Pork meat, fresh, chilled and frozen
Poultry meat, fresh, chilled and frozen
Sheep and goat meat, fresh, chilled and frozen
Offal, animal fats and other meats, fresh, chilled and frozen
Fresh milk and cream, buttermilk and yoghurt
Eggs and honey
Vegetables, fresh, chilled and dried
Fruit, fresh or dried, excl. citrus & tropical fruit
Citrus fruit
Tropical fruit, fresh or dried, nuts and spices
Miscellaneous seeds and hop cones
Agricultural primary food products, not specified
Processed (incl. wine)
Meat preparations
Cheese
Olive oil
Preparations of vegetables, fruit or nuts
Fruit juices
Wine, vermouth, cider and vinegar
Roasted coffee and tea
Food preparations and beverages
Food preparations
Chocolate, confectionery and ice cream
Infant food and other cereals, flour, starch or milk preparations
Pasta, pastry, biscuits and bread
Soups and sauces
Coffee and tea extracts
Food preparations, not specified
Pet food
Beverages
Waters and soft drinks
Beer
Spirits and liqueurs
Odoriferous substances
Non-edible Non-edible
Raw hides, skins and furskins
Non-edible animal products
Wool and silk
Cotton, flax and hemp, and plaiting materials
Cut flowers and plants
Bulbs, roots and live plants
Raw tobacco
Cigars and cigarettes
Fatty acids and waxes
Sugar alcohols
Essential oils
Ethanol
Casein, other albuminoidal substances and modified starches
Non-edible, not specified
Products non-attributable
page 24
Agriculture
and Rural
Development

page 25
Agriculture
and Rural
Development
page 26
Agriculture
and Rural
Development
Contact: DG Agriculture & Rural Development: Unit for Global issues and relations with ACP Tel: +32-2-2991111/ email: [email protected]
http://ec.europa.eu/agriculture/publi/map/index_en.htm
© European Union, 2018 Reproduction authorized provided the source is acknowledged.


