AIHR SHARK
SGS EHS Passive Directional
Sampler
2© SGS SA 2016 ALL RIGHTS RESERVED
AIR QUALITY MONITORING
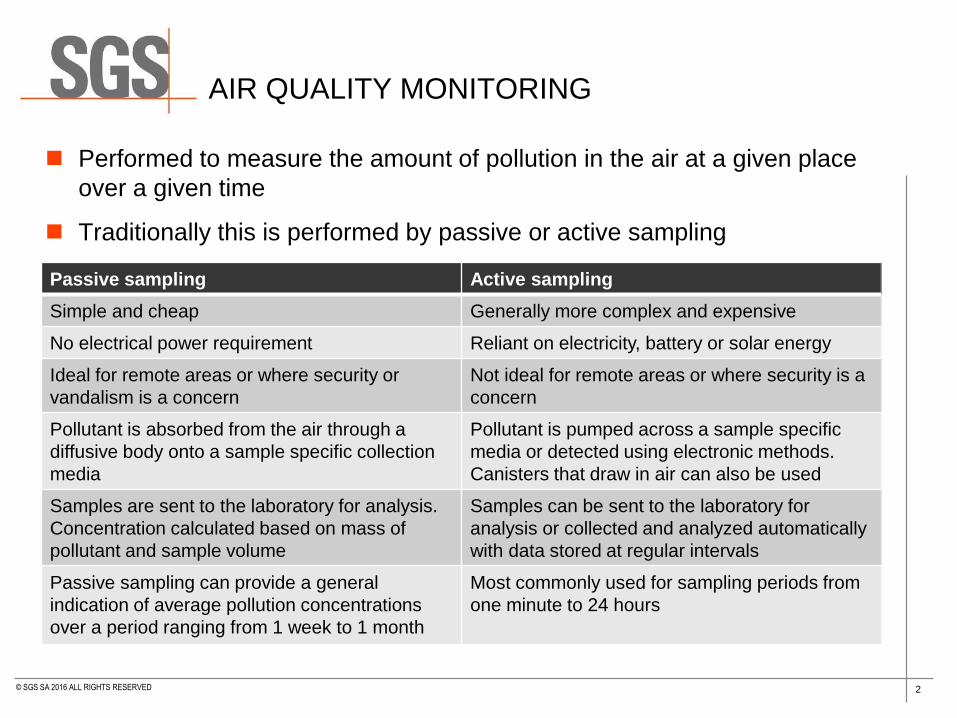
Performed to measure the amount of pollution in the air at a given place
over a given time
Traditionally this is performed by passive or active sampling
Passive sampling Active sampling
Simple and cheap Generally more complex and expensive
No electrical power requirement Reliant on electricity, battery or solar energy
Ideal for remote areas or where security or
vandalism is a concern
Not ideal for remote areas or where security is a
concern
Pollutant is absorbed from the air through a
diffusive body onto a sample specific collection
media
Pollutant is pumped across a sample specific
media or detected using electronic methods.
Canisters that draw in air can also be used
Samples are sent to the laboratory for analysis.
Concentration calculated based on mass of
pollutant and sample volume
Samples can be sent to the laboratory for
analysis or collected and analyzed automatically
with data stored at regular intervals
Passive sampling can provide a general
indication of average pollution concentrations
over a period ranging from 1 week to 1 month
Most commonly used for sampling periods from
one minute to 24 hours
3© SGS SA 2016 ALL RIGHTS RESERVED
4© SGS SA 2016 ALL RIGHTS RESERVED
AIHR SHARK
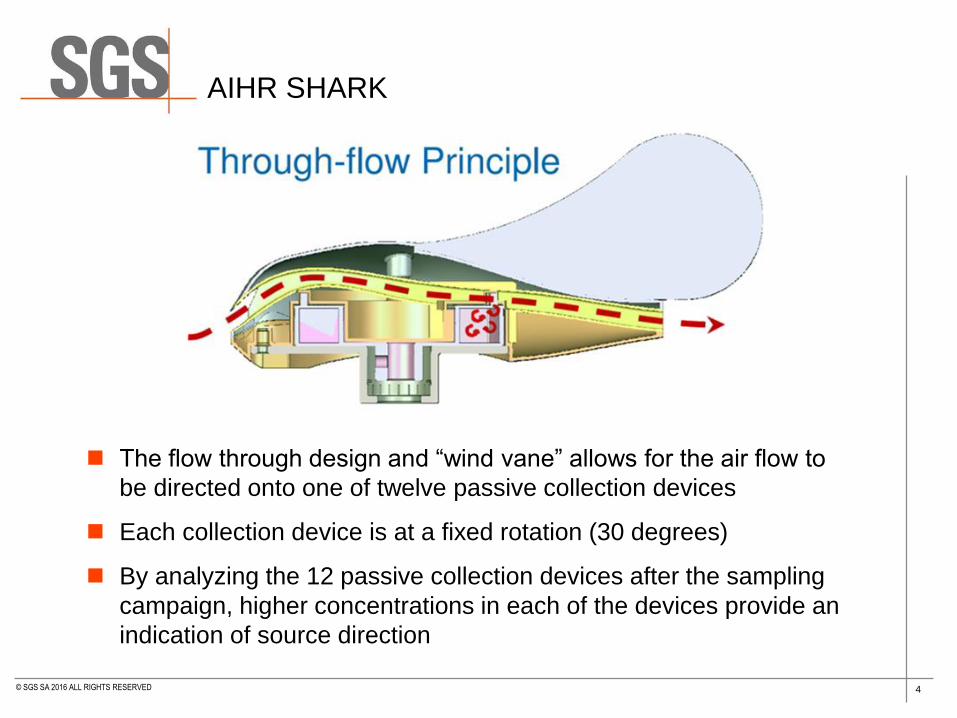
The flow through design and “wind vane” allows for the air flow to
be directed onto one of twelve passive collection devices
Each collection device is at a fixed rotation (30 degrees)
By analyzing the 12 passive collection devices after the sampling
campaign, higher concentrations in each of the devices provide an
indication of source direction

5© SGS SA 2016 ALL RIGHTS RESERVED
SGS EHS AIHR SHARK COMPONENTS
WIND VANE
BEARING
SYSTEM
FLOW
CHANNELPASSIVE SAMPLES
CAROUSEL
FLOW DEPOSIT
SLOT
BODY
STAND/TRIPOD/
POLE MOUNT
6© SGS SA 2016 ALL RIGHTS RESERVED
WIND SPEED AND WIND GUST IMPACT ON
DIRECTIONAL AIHR SHARK ROTATION
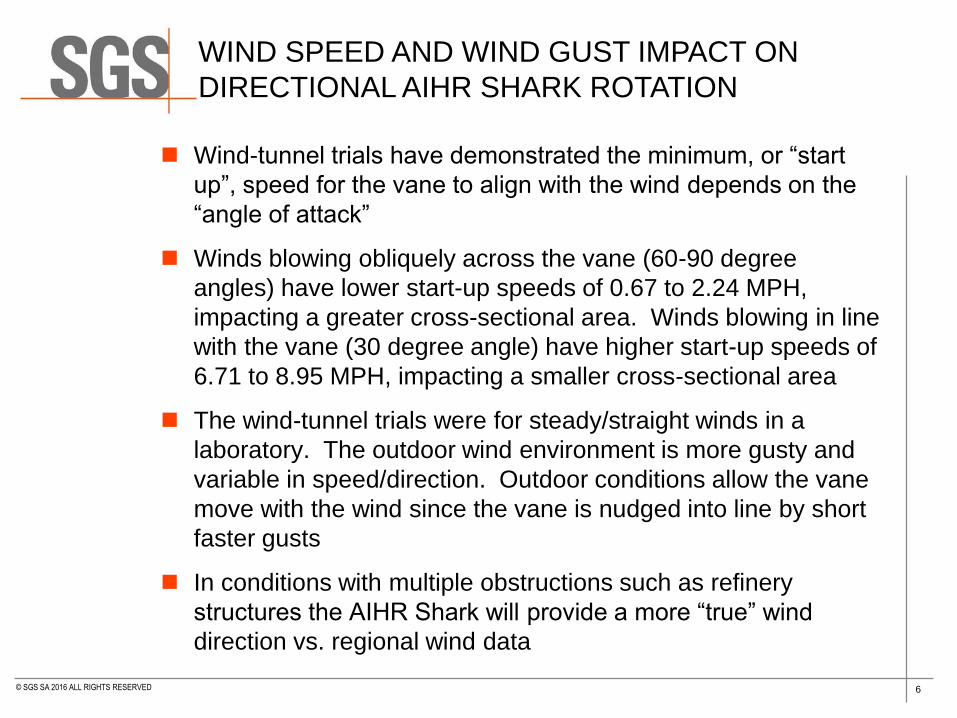
Wind-tunnel trials have demonstrated the minimum, or “start
up”, speed for the vane to align with the wind depends on the
“angle of attack”
Winds blowing obliquely across the vane (60-90 degree
angles) have lower start-up speeds of 0.67 to 2.24 MPH,
impacting a greater cross-sectional area. Winds blowing in line
with the vane (30 degree angle) have higher start-up speeds of
6.71 to 8.95 MPH, impacting a smaller cross-sectional area
The wind-tunnel trials were for steady/straight winds in a
laboratory. The outdoor wind environment is more gusty and
variable in speed/direction. Outdoor conditions allow the vane
move with the wind since the vane is nudged into line by short
faster gusts
In conditions with multiple obstructions such as refinery
structures the AIHR Shark will provide a more “true” wind
direction vs. regional wind data

7© SGS SA 2016 ALL RIGHTS RESERVED
WIND GUST VS. WIND SPEED
Even at low wind speeds gusts are sufficient to orientate
the AIHR Shark into the correct directional sample position
based on changing wind directions
8© SGS SA 2016 ALL RIGHTS RESERVED
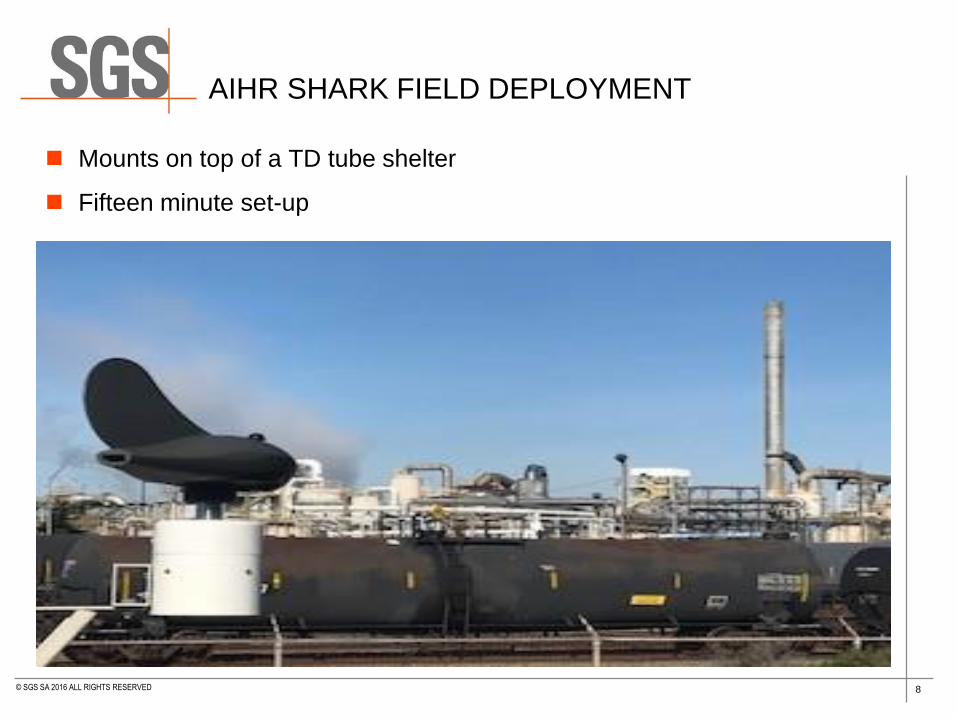
AIHR SHARK FIELD DEPLOYMENT
Mounts on top of a TD tube shelter
Fifteen minute set-up

9© SGS SA 2016 ALL RIGHTS RESERVED
AIHR SHARK ADVANTAGES
▪ Cost effective
▪ Ideal for any location within a refinery
▪ No requirement for electricity or sample pumps
▪ Limited technical experience required and maintenance free
▪ Low level directional indicator
▪ Preventative, post exceedance, or tiered investigative approach
▪ Forensic fingerprinting with additional analytes
▪ One week deployment for troubleshooting or two weeks in-line
with TD tubes
▪ Custom electronic deliverables uploaded into any mapping
software for triangulation and “pinpointing” of emission sources
▪ Avoid expensive theoretical modelling
▪ Discount provided in conjunction with annual EPA 325 analytical
program

10© SGS SA 2016 ALL RIGHTS RESERVED
SOFTWARE SOLUTION
A hands-free tool to assist with data interpretation in determining the
direction from where a benzene source may have originated
Solution utilizes a “compass” for each sample point that represents the
12 sample cartridges and their relative location
Map provides geocoded locations. The location of benzene sources can
be approximated by vectors
11© SGS SA 2016 ALL RIGHTS RESERVED
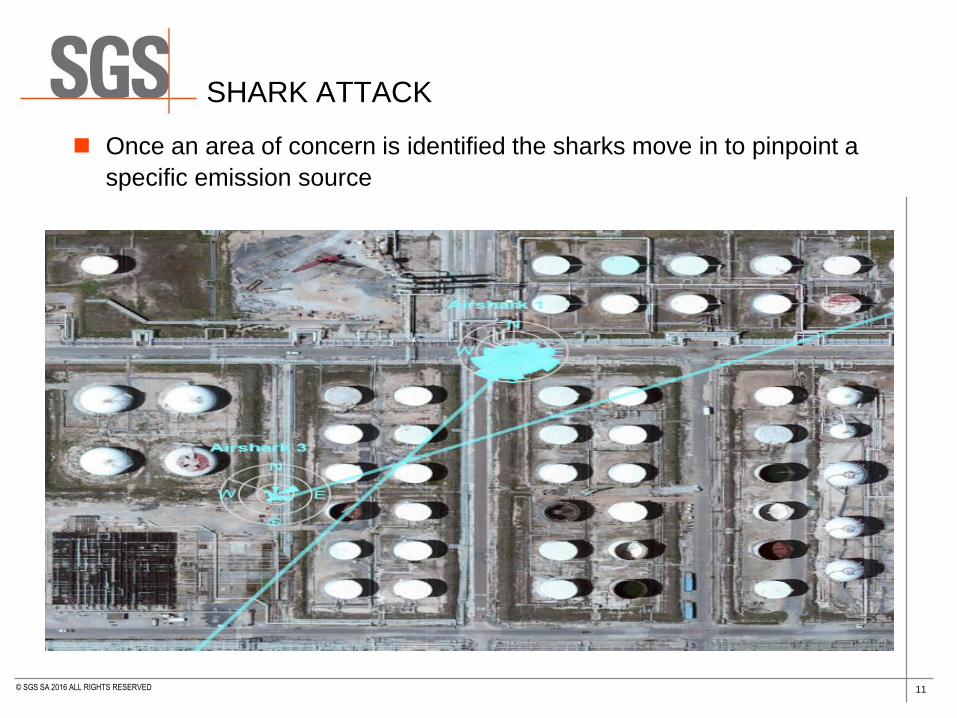
SHARK ATTACK
Once an area of concern is identified the sharks move in to pinpoint a
specific emission source

12© SGS SA 2016 ALL RIGHTS RESERVED
CLIENT FEEDBACK
An environmental engineering consultant/professional
engineer (PE), calls the AIHR Shark: “A simply genius
technology.”
An environmental engineer at a large Gulf Coast refinery
says: The Shark is by far the best, most cost-effective
tool we have used to date.”

13© SGS SA 2016 ALL RIGHTS RESERVED
AIHR SHARK SOLUTION SET
THE FLOW OF UTILIZING THE AIHR SHARK
▪ ORDERING• DETERMINE COMPOUNDS OF INTEREST
• DETERMINE LOCATIONS FOR DEPLOYMENT
• SAMPLING PLAN WITH MEDIA REPLACEMENT
• DESIGN MOUTING NEEDS (FIXED OR TRIPOD)
• DETERMINE DATA REQUIRMENTS – EDD
▪ DEPLOYMENT• AIHR SHARKS DEPLOYED WITH MEDIA
• AIHR SHARKS ARE INSTALLED (LAT & LONG NOTED)
• MEDIA REMOVED AT END OF SAMPLING PERIOD
▪ LAB PROCESSING• MEDIA ARRIVES, SAMPLE CONFIRMATION EMAILED
• RESULTS IN 5 BD OR FREE
• PDF REPORT AND EDD EMAILED

14© SGS SA 2016 ALL RIGHTS RESERVED
CONTACT
For further information please contact:
Chris Schepcoff
832.585.9376
Ron McMahan
512.897.5230


