Download - Al Anwar Ceramics Tiles Co. SAOG Ayisha Zia

Page 1 of 19
Al Anwar Ceramic Tiles (AACT) is Oman’s largest ceramic tiles manufacturer. AACT is expanding capacity to hold its
market leading position in Oman and benefit from the boom in the GCC’s construction sector. We initiate coverage on
the company with a ACCUMULATE rating and a target price of RO 0.637 per share, a 12% upside to the last closing
price with a dividend yield of 5 % for 2013 implying a total return of 17% over the next 12 months. The company pays
out its full year dividends at the end of March each year. Further, our Target price implies a P/E(x)’13 of 17.9 and a
P/B(x) ’13 of 4.2.
At a present P/E of 17.12x, and P/B of 3.8x, AACTs near term earnings growth driven by the ramp up of its fifth production
line (c26% of present capacity) expected in 1Q’14 seems well appreciated by investors. However, a possible
announcement for the establishment of a sixth production line that will further grow capacity over YE 2013 capacity could
serve as a trigger for the stock coupled with a low probability of downside risks to near term earnings us to rate the stock
as a buy.
Market leader in Oman; scaling up through further capacity expansion; Low cost advantage to reflect in margins as scale enlarges AACT is the leading player in Oman’s ceramic tiles market. The company has four production lines with a total capacity
of 13.5 million square meters (mn.Sqm) and is adding another line with a capacity of 3.5 mn.Sqm, expected to commence
trial production in 1Q 2014, bringing total production capacity to 17 mn.Sqm and present average utilization rate at 107%
is healthy. The company has also requested the Government of Oman for allocation of natural gas for a sixth production
line which we do not factor into our estimates. The company is in a position to commence work on this immediately on
receiving the gas allocation. Based on our assessment of five listed leading ceramic tile manufacturers in the MENA
region, Al Anwar is amongst the lowest cost producers in the industry. We believe this advantage emanates from its low
cost of raw materials as well as gas and electricity which it shall sustain even though gas prices to industrial users are
set to increase over the next 2 years. The management also corroborates the company’s low-cost advantage in its Board
of Directors’ reports.
Improving Construction market in the GCC to spur growth Over the last five years, the construction sector in the GCC has witnessed a revival with the United Arab Emirates
(especially Dubai) being the most recent beneficiary of a recovery in underlying trends. An improvement in the UAEs’
sovereign credit perception coupled with enhanced credit quality at banks have resulted in a restoration of credit appetite
which has trickled through to the real estate sector. Both Dubai and Abu Dhabi have announced a slew of major real
estate initiatives over the last 12 months, which are expected to play out over the next few years. Further, Saudi Arabia’s
new impetus on Social housing and Qatar’s successful bid for the World Cup in 2018 will serve to generate demand for
activities AACT is involved in. Historically, Oman’s revenue contribution has remained less volatile than that from other
GCC states and AACT maintains a commanding presence in the home market with a c69% market share, as per our
estimates, and AACT’s new capacity is coming on-stream at a time when demand is improving. Consequently, we expect
revenue of the company to expand at a CAGR of 10.1% to RO 40.0mn in 2018 from RO 22.5mn in 2012.
Risks to earnings a low near term probability
Key risks to earnings include slower-than-expected growth in the construction, especially the real-estate sector, of Oman
as well as the GCC, low-priced imports from China leading to increased competition, volatility in raw material prices, and
regulatory issues to address growing environmental concerns.
Year FY11 FY12 FY13E FY14E FY15E FY16E
Year-end Capacity, mn. Sqm 10.0 13.5 13.5 17.0 17.0 17.0
Revenues, RO mn. 18.6 22.5 27.3 29.9 33.1 35.2
EBIT, RO mn. 6.5 7.4 9.5 10.6 11.9 13.8
Net Income, RO mn. 5.7 6.5 8.3 9.3 10.4 12.1
Net Income Growth, % 8% 13% 28% 11% 12% 16%
EBITDA Margin, % 42% 40% 42% 42% 43% 46%
ROA, % 19% 19% 21% 20% 20% 21%
ROE, % 22% 21% 24% 24% 24% 25%
P/E(x) 9.2 11.3 16.1 15.2 14.3 13.3
P/B(x) 1.8 2.3 3.6 3.4 3.3 3.2
Dividend Yield, % 7% 8% 5% 5% 6% 6% Source: Company Financials, OABInvest
Al Anwar Ceramics Tiles Co. SAOG 18 December 2013 Purpose of Report Initiation Recommendation Accumulate Code (AACT) Last Closing Price RO 0.570/share Fair Value RO 0.637/share 12-Month Low-High RO 0.385 – 0.566 Market Capitalization RO 134.0mn Market Weighting (MSM 30) 2.19% Annualized P/E (x) 16.09 P/E TTM (x) 17.12 Price to Book (P/B) (x) 3.80
Ayisha Zia Research Analyst [email protected]
+968 24 754 673
Al Anwar Ceramic Tiles SAOG December 18, 2013
Disclaimer: This report has been prepared and issued by the IMG‐Oman Arab Bank SAOC on the basis of publicly available information and other sources considered reliable.
While the utmost care has been taken to ensure that the facts stated are accurate and the opinions given are reasonable, neither Oman Arab Bank SAOC nor any of its employees shall be in any way responsible for the contents. It is published solely for information purposes, it does not constitute an advertisement and is not to be construed as an offer to buy or sell any securities.
Oman Arab Bank (Investment Management Group) P.O Box 2010 P.C 112 Ruwi Sultanate of Oman
E-mail: [email protected]. Web-site: WWW.OABINVEST.COM
2
Company Profile
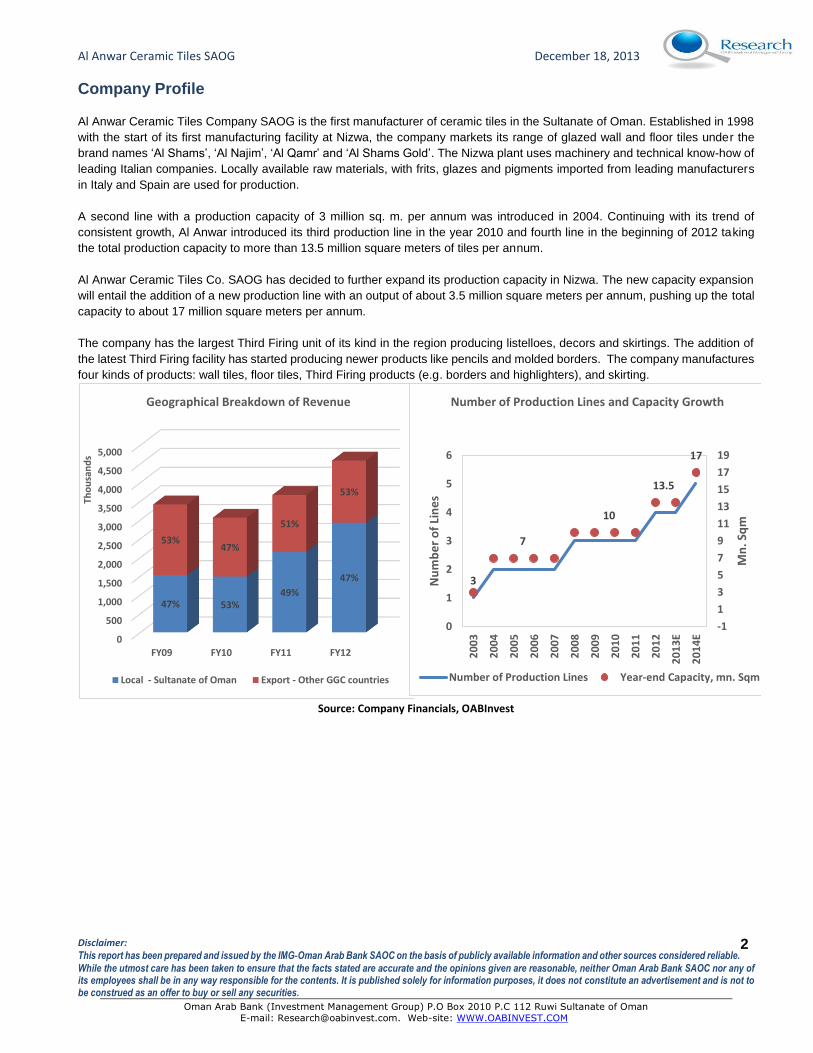
Al Anwar Ceramic Tiles Company SAOG is the first manufacturer of ceramic tiles in the Sultanate of Oman. Established in 1998
with the start of its first manufacturing facility at Nizwa, the company markets its range of glazed wall and floor tiles under the
brand names ‘Al Shams’, ‘Al Najim’, ‘Al Qamr’ and ‘Al Shams Gold’. The Nizwa plant uses machinery and technical know-how of
leading Italian companies. Locally available raw materials, with frits, glazes and pigments imported from leading manufacturers
in Italy and Spain are used for production.
A second line with a production capacity of 3 million sq. m. per annum was introduced in 2004. Continuing with its trend of
consistent growth, Al Anwar introduced its third production line in the year 2010 and fourth line in the beginning of 2012 taking
the total production capacity to more than 13.5 million square meters of tiles per annum.
Al Anwar Ceramic Tiles Co. SAOG has decided to further expand its production capacity in Nizwa. The new capacity expansion
will entail the addition of a new production line with an output of about 3.5 million square meters per annum, pushing up the total
capacity to about 17 million square meters per annum.
The company has the largest Third Firing unit of its kind in the region producing listelloes, decors and skirtings. The addition of
the latest Third Firing facility has started producing newer products like pencils and molded borders. The company manufactures
four kinds of products: wall tiles, floor tiles, Third Firing products (e.g. borders and highlighters), and skirting.
Source: Company Financials, OABInvest
0
500
1,000
1,500
2,000
2,500
3,000
3,500
4,000
4,500
5,000
FY09 FY10 FY11 FY12
47% 53%49%
47%
53%47%
51%
53%
Tho
usa
nd
s
Geographical Breakdown of Revenue
Local - Sultanate of Oman Export - Other GGC countries
3
7
10
13.5
17
-1
1
3
5
7
9
11
13
15
17
19
0
1
2
3
4
5
6
20
03
20
04
20
05
20
06
20
07
20
08
20
09
20
10
20
11
20
12
20
13
E
20
14
E
Mn
. Sq
m
Nu
mb
er
of
Lin
es
Number of Production Lines and Capacity Growth
Number of Production Lines Year-end Capacity, mn. Sqm
Al Anwar Ceramic Tiles SAOG December 18, 2013
Disclaimer: This report has been prepared and issued by the IMG‐Oman Arab Bank SAOC on the basis of publicly available information and other sources considered reliable.
While the utmost care has been taken to ensure that the facts stated are accurate and the opinions given are reasonable, neither Oman Arab Bank SAOC nor any of its employees shall be in any way responsible for the contents. It is published solely for information purposes, it does not constitute an advertisement and is not to be construed as an offer to buy or sell any securities.
Oman Arab Bank (Investment Management Group) P.O Box 2010 P.C 112 Ruwi Sultanate of Oman
E-mail: [email protected]. Web-site: WWW.OABINVEST.COM
3
Earnings Forecasts
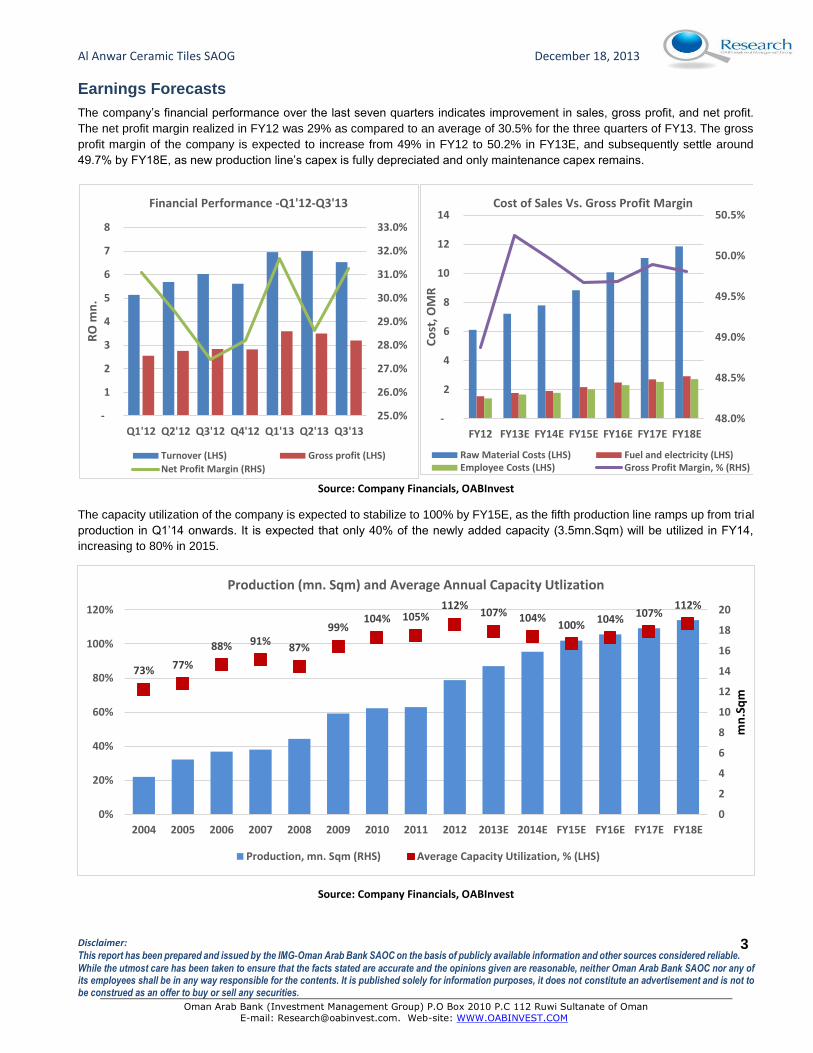
The company’s financial performance over the last seven quarters indicates improvement in sales, gross profit, and net profit.
The net profit margin realized in FY12 was 29% as compared to an average of 30.5% for the three quarters of FY13. The gross
profit margin of the company is expected to increase from 49% in FY12 to 50.2% in FY13E, and subsequently settle around
49.7% by FY18E, as new production line’s capex is fully depreciated and only maintenance capex remains.
Source: Company Financials, OABInvest
The capacity utilization of the company is expected to stabilize to 100% by FY15E, as the fifth production line ramps up from trial
production in Q1’14 onwards. It is expected that only 40% of the newly added capacity (3.5mn.Sqm) will be utilized in FY14,
increasing to 80% in 2015.
Source: Company Financials, OABInvest
25.0%
26.0%
27.0%
28.0%
29.0%
30.0%
31.0%
32.0%
33.0%
-
1
2
3
4
5
6
7
8
Q1'12 Q2'12 Q3'12 Q4'12 Q1'13 Q2'13 Q3'13
RO
mn
.
Financial Performance -Q1'12-Q3'13
Turnover (LHS) Gross profit (LHS)
Net Profit Margin (RHS)
48.0%
48.5%
49.0%
49.5%
50.0%
50.5%
-
2
4
6
8
10
12
14
FY12 FY13E FY14E FY15E FY16E FY17E FY18EC
ost
, OM
R
Cost of Sales Vs. Gross Profit Margin
Raw Material Costs (LHS) Fuel and electricity (LHS)Employee Costs (LHS) Gross Profit Margin, % (RHS)
73% 77%
88% 91%87%
99%104% 105%
112%107% 104%
100%104%
107%112%
0
2
4
6
8
10
12
14
16
18
20
0%
20%
40%
60%
80%
100%
120%
2004 2005 2006 2007 2008 2009 2010 2011 2012 2013E 2014E FY15E FY16E FY17E FY18E
mn
.Sq
m
Production (mn. Sqm) and Average Annual Capacity Utlization
Production, mn. Sqm (RHS) Average Capacity Utilization, % (LHS)
Al Anwar Ceramic Tiles SAOG December 18, 2013
Disclaimer: This report has been prepared and issued by the IMG‐Oman Arab Bank SAOC on the basis of publicly available information and other sources considered reliable.
While the utmost care has been taken to ensure that the facts stated are accurate and the opinions given are reasonable, neither Oman Arab Bank SAOC nor any of its employees shall be in any way responsible for the contents. It is published solely for information purposes, it does not constitute an advertisement and is not to be construed as an offer to buy or sell any securities.
Oman Arab Bank (Investment Management Group) P.O Box 2010 P.C 112 Ruwi Sultanate of Oman
E-mail: [email protected]. Web-site: WWW.OABINVEST.COM
4
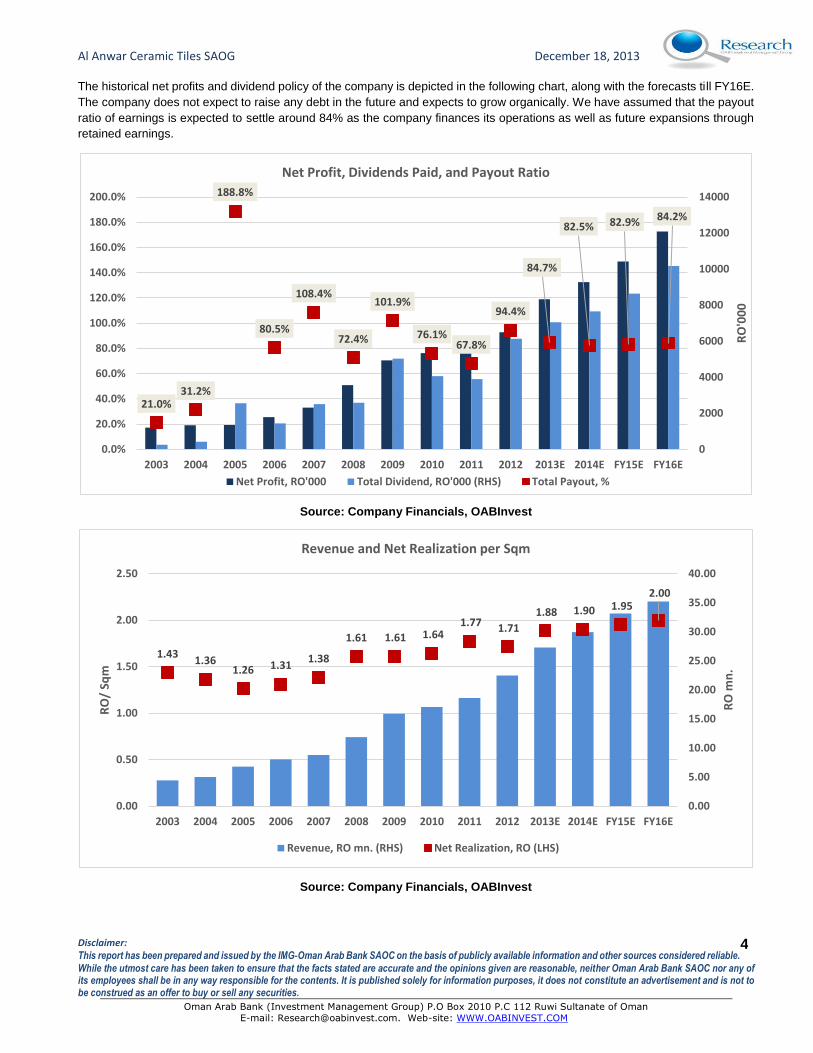
The historical net profits and dividend policy of the company is depicted in the following chart, along with the forecasts till FY16E.
The company does not expect to raise any debt in the future and expects to grow organically. We have assumed that the payout
ratio of earnings is expected to settle around 84% as the company finances its operations as well as future expansions through
retained earnings.
Source: Company Financials, OABInvest
Source: Company Financials, OABInvest
21.0%31.2%
188.8%
80.5%
108.4%
72.4%
101.9%
76.1%67.8%
94.4%
84.7%
82.5% 82.9% 84.2%
0
2000
4000
6000
8000
10000
12000
14000
0.0%
20.0%
40.0%
60.0%
80.0%
100.0%
120.0%
140.0%
160.0%
180.0%
200.0%
2003 2004 2005 2006 2007 2008 2009 2010 2011 2012 2013E 2014E FY15E FY16E
RO
'00
0
Net Profit, Dividends Paid, and Payout Ratio
Net Profit, RO'000 Total Dividend, RO'000 (RHS) Total Payout, %
1.431.36
1.26 1.311.38
1.61 1.61 1.64 1.77 1.71
1.88 1.90 1.95 2.00
0.00
5.00
10.00
15.00
20.00
25.00
30.00
35.00
40.00
0.00
0.50
1.00
1.50
2.00
2.50
2003 2004 2005 2006 2007 2008 2009 2010 2011 2012 2013E 2014E FY15E FY16E
RO
mn
.
RO
/ Sq
m
Revenue and Net Realization per Sqm
Revenue, RO mn. (RHS) Net Realization, RO (LHS)
Al Anwar Ceramic Tiles SAOG December 18, 2013
Disclaimer: This report has been prepared and issued by the IMG‐Oman Arab Bank SAOC on the basis of publicly available information and other sources considered reliable.
While the utmost care has been taken to ensure that the facts stated are accurate and the opinions given are reasonable, neither Oman Arab Bank SAOC nor any of its employees shall be in any way responsible for the contents. It is published solely for information purposes, it does not constitute an advertisement and is not to be construed as an offer to buy or sell any securities.
Oman Arab Bank (Investment Management Group) P.O Box 2010 P.C 112 Ruwi Sultanate of Oman
E-mail: [email protected]. Web-site: WWW.OABINVEST.COM
5
Industry Background
The growing construction and infrastructure industry, mainly in emerging economies of Asia Pacific such as China, India and
Indonesia, is the main driver of demand in the ceramic tiles industry. Shift towards replacing paints, metal slabs, marble floors,
and other home decorative products with ceramic tiles is also expected to boost the market over the forecast period. However,
volatility in raw material prices and regulatory issues to address growing environmental concerns are acting as major factors
contributing towards the increasing production costs of ceramic tiles.
Floor tiles emerged as the leading type of ceramic tiles used globally and accounted for over 50% of the total market in 2011.
Floor tiles are also expected to be the fastest growing ceramic tiles at an estimated CAGR of 9.4% from 2012 to 2018. Wall tiles,
the second largest market are expected to lose market share to floor tiles by 2018. Ceramic tiles are majorly consumed in
residential replacement market globally. Residential replacement accounted for approximately 54% of the total market in 2011.
Along with the biggest market, residential replacement is also expected to be the fastest growing market for ceramic tiles at an
estimated CAGR of 8.6% from 2012 to 2018. Commercial application of ceramic tiles followed residential replacement and has a
share of over 30% of the market in 20111.
Significant rise in construction activities in the Gulf Cooperation Council (GCC) countries has led to substantial expansion of the
ceramic and porcelain tiles market. Amongst the GCC countries, the Kingdom of Saudi Arabia (KSA), Dubai and Qatar are
experiencing an increase in demand from the Building Materials industry due to their long term growth plans. This growth has
witnessed increased participation of foreign players who in-turn have contributed to the overall market maturity.
As per Frost & Sullivan estimates, Chinese and European brands supply to more than 50 per cent of the ceramic tiles demand
in the GCC, followed by local manufacturers along with small portions from other countries such as Malaysia, India and Egypt.
More than 25 per cent of the total production in the GCC is currently being exported to non-GCC countries. It has been observed
that demand for ceramic tiles is as high 70 per cent compared to a much lower 30 per cent demand for porcelain tiles.2
The major challenges for tiles market in the GCC markets are high degree of price sensitivity and emphasis on high quality.
Additionally, availability of alternate products such as vitrified tiles is the key threat challenging the growth of ceramic and porcelain
tiles market in the GCC. According to Frost & Sullivan estimates, as high as 60 per cent of new buildings in the UAE opt for
vitrified tiles as these are more durable and long lasting compared to ceramic tiles. However, the influx of Chinese products has
forced many GCC manufacturers to target only the high-end market, as Chinese products dominate the low-end market. Hence,
the Tiles market in the GCC is expected to witness a positive trend and manufacturers are expected to give equal attention to
exports and local market.
Oman’s Construction & Real-Estate Industry Outlook
Positive Outlook for Construction and Real-Estate Services in Oman According to the National Centre for Statistics and Information of Oman, the current estimate for population (As of
September 2013) stands at 3.93mn, showing a growth rate of 8.5% compared to 3.62mn in 2012, with almost 50% under
25 years of age, combined with increasing influx of expatriate population in the region (mainly due to shortage of skills
among local nationals), is likely to drive demand for housing, energy and the necessary infrastructure. Announcement
of expenditures on commercial and residential developments in Oman (RO 2.5mn in 2012) indicates a strengthening
construction market.
1 Transparency Market Research, World Ceramic Report 2 Transparency Market Research, World Ceramic Report
Al Anwar Ceramic Tiles SAOG December 18, 2013
Disclaimer: This report has been prepared and issued by the IMG‐Oman Arab Bank SAOC on the basis of publicly available information and other sources considered reliable.
While the utmost care has been taken to ensure that the facts stated are accurate and the opinions given are reasonable, neither Oman Arab Bank SAOC nor any of its employees shall be in any way responsible for the contents. It is published solely for information purposes, it does not constitute an advertisement and is not to be construed as an offer to buy or sell any securities.
Oman Arab Bank (Investment Management Group) P.O Box 2010 P.C 112 Ruwi Sultanate of Oman
E-mail: [email protected]. Web-site: WWW.OABINVEST.COM
6
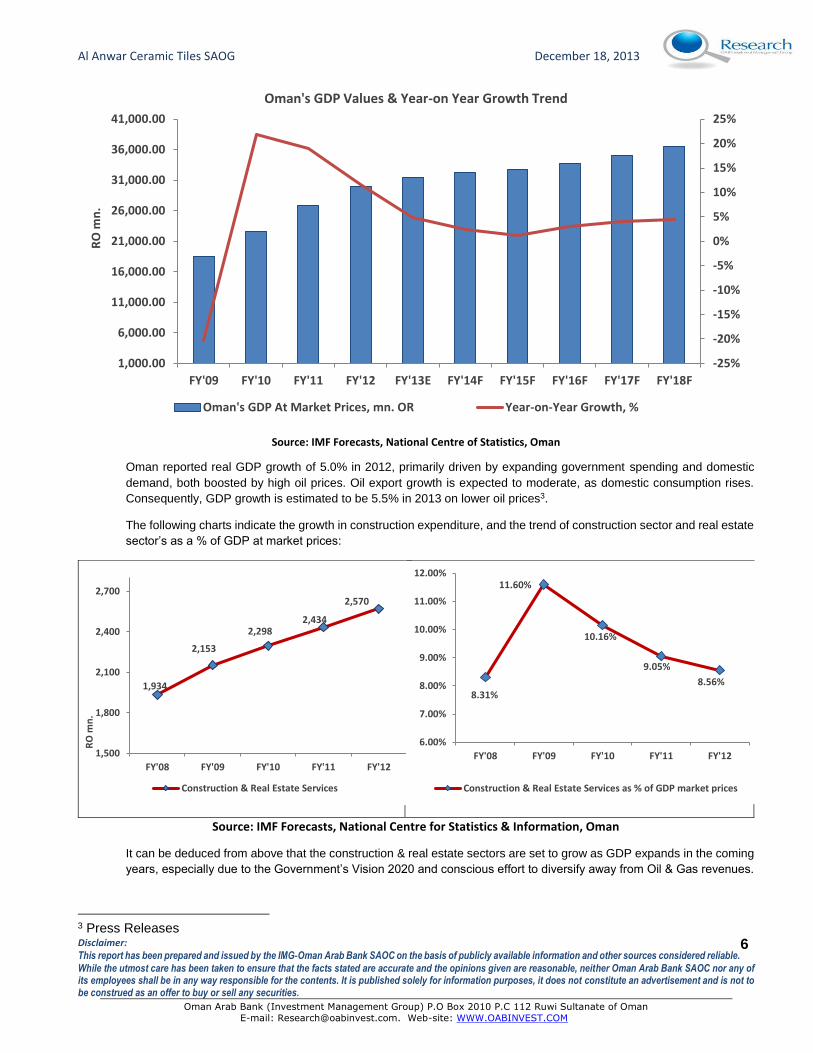
Source: IMF Forecasts, National Centre of Statistics, Oman
Oman reported real GDP growth of 5.0% in 2012, primarily driven by expanding government spending and domestic
demand, both boosted by high oil prices. Oil export growth is expected to moderate, as domestic consumption rises.
Consequently, GDP growth is estimated to be 5.5% in 2013 on lower oil prices3.
The following charts indicate the growth in construction expenditure, and the trend of construction sector and real estate
sector’s as a % of GDP at market prices:
Source: IMF Forecasts, National Centre for Statistics & Information, Oman
It can be deduced from above that the construction & real estate sectors are set to grow as GDP expands in the coming
years, especially due to the Government’s Vision 2020 and conscious effort to diversify away from Oil & Gas revenues.
3 Press Releases
-25%
-20%
-15%
-10%
-5%
0%
5%
10%
15%
20%
25%
1,000.00
6,000.00
11,000.00
16,000.00
21,000.00
26,000.00
31,000.00
36,000.00
41,000.00
FY'09 FY'10 FY'11 FY'12 FY'13E FY'14F FY'15F FY'16F FY'17F FY'18F
RO
mn
.Oman's GDP Values & Year-on Year Growth Trend
Oman's GDP At Market Prices, mn. OR Year-on-Year Growth, %
1,934
2,153
2,2982,434
2,570
1,500
1,800
2,100
2,400
2,700
FY'08 FY'09 FY'10 FY'11 FY'12
RO
mn
.
Construction & Real Estate Services
8.31%
11.60%
10.16%
9.05%
8.56%
6.00%
7.00%
8.00%
9.00%
10.00%
11.00%
12.00%
FY'08 FY'09 FY'10 FY'11 FY'12
Construction & Real Estate Services as % of GDP market prices
Al Anwar Ceramic Tiles SAOG December 18, 2013
Disclaimer: This report has been prepared and issued by the IMG‐Oman Arab Bank SAOC on the basis of publicly available information and other sources considered reliable.
While the utmost care has been taken to ensure that the facts stated are accurate and the opinions given are reasonable, neither Oman Arab Bank SAOC nor any of its employees shall be in any way responsible for the contents. It is published solely for information purposes, it does not constitute an advertisement and is not to be construed as an offer to buy or sell any securities.
Oman Arab Bank (Investment Management Group) P.O Box 2010 P.C 112 Ruwi Sultanate of Oman
E-mail: [email protected]. Web-site: WWW.OABINVEST.COM
7
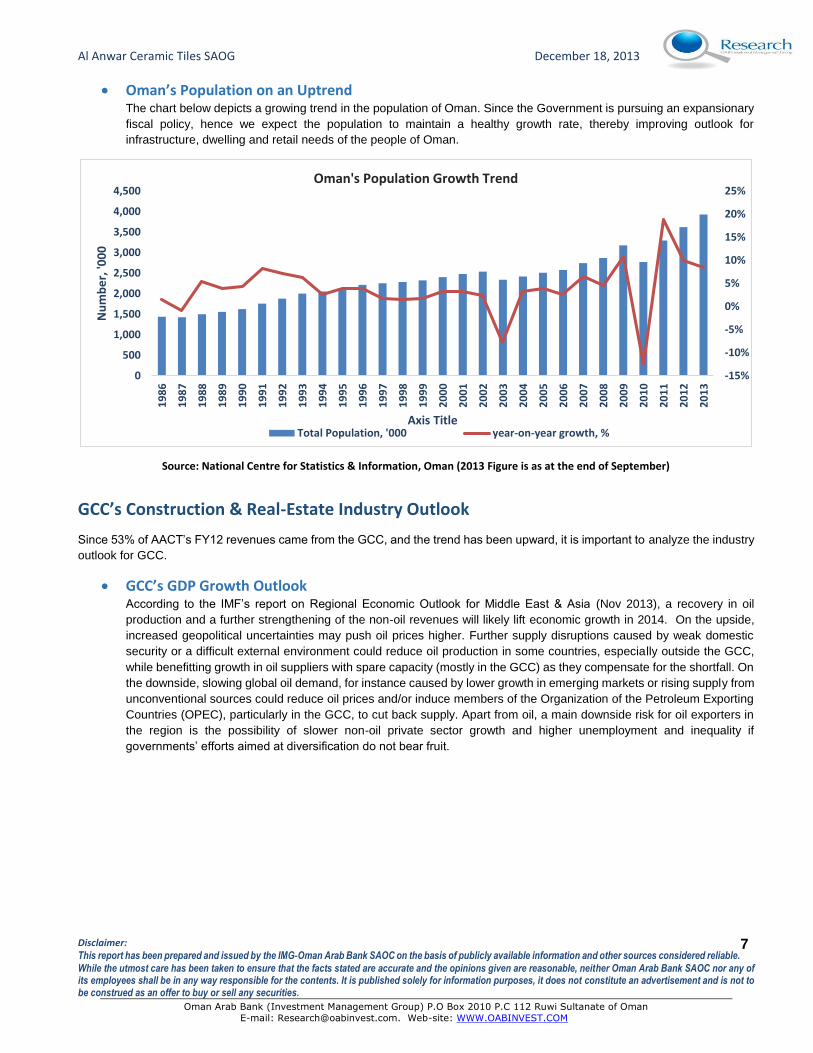
Oman’s Population on an Uptrend The chart below depicts a growing trend in the population of Oman. Since the Government is pursuing an expansionary
fiscal policy, hence we expect the population to maintain a healthy growth rate, thereby improving outlook for
infrastructure, dwelling and retail needs of the people of Oman.
Source: National Centre for Statistics & Information, Oman (2013 Figure is as at the end of September)
GCC’s Construction & Real-Estate Industry Outlook
Since 53% of AACT’s FY12 revenues came from the GCC, and the trend has been upward, it is important to analyze the industry
outlook for GCC.
GCC’s GDP Growth Outlook According to the IMF’s report on Regional Economic Outlook for Middle East & Asia (Nov 2013), a recovery in oil
production and a further strengthening of the non-oil revenues will likely lift economic growth in 2014. On the upside,
increased geopolitical uncertainties may push oil prices higher. Further supply disruptions caused by weak domestic
security or a difficult external environment could reduce oil production in some countries, especially outside the GCC,
while benefitting growth in oil suppliers with spare capacity (mostly in the GCC) as they compensate for the shortfall. On
the downside, slowing global oil demand, for instance caused by lower growth in emerging markets or rising supply from
unconventional sources could reduce oil prices and/or induce members of the Organization of the Petroleum Exporting
Countries (OPEC), particularly in the GCC, to cut back supply. Apart from oil, a main downside risk for oil exporters in
the region is the possibility of slower non-oil private sector growth and higher unemployment and inequality if
governments’ efforts aimed at diversification do not bear fruit.
-15%
-10%
-5%
0%
5%
10%
15%
20%
25%
0
500
1,000
1,500
2,000
2,500
3,000
3,500
4,000
4,500
19
86
19
87
19
88
19
89
19
90
19
91
19
92
19
93
19
94
19
95
19
96
19
97
19
98
19
99
20
00
20
01
20
02
20
03
20
04
20
05
20
06
20
07
20
08
20
09
20
10
20
11
20
12
20
13
Nu
mb
er,
'00
0
Axis Title
Oman's Population Growth Trend
Total Population, '000 year-on-year growth, %
Al Anwar Ceramic Tiles SAOG December 18, 2013
Disclaimer: This report has been prepared and issued by the IMG‐Oman Arab Bank SAOC on the basis of publicly available information and other sources considered reliable.
While the utmost care has been taken to ensure that the facts stated are accurate and the opinions given are reasonable, neither Oman Arab Bank SAOC nor any of its employees shall be in any way responsible for the contents. It is published solely for information purposes, it does not constitute an advertisement and is not to be construed as an offer to buy or sell any securities.
Oman Arab Bank (Investment Management Group) P.O Box 2010 P.C 112 Ruwi Sultanate of Oman
E-mail: [email protected]. Web-site: WWW.OABINVEST.COM
8
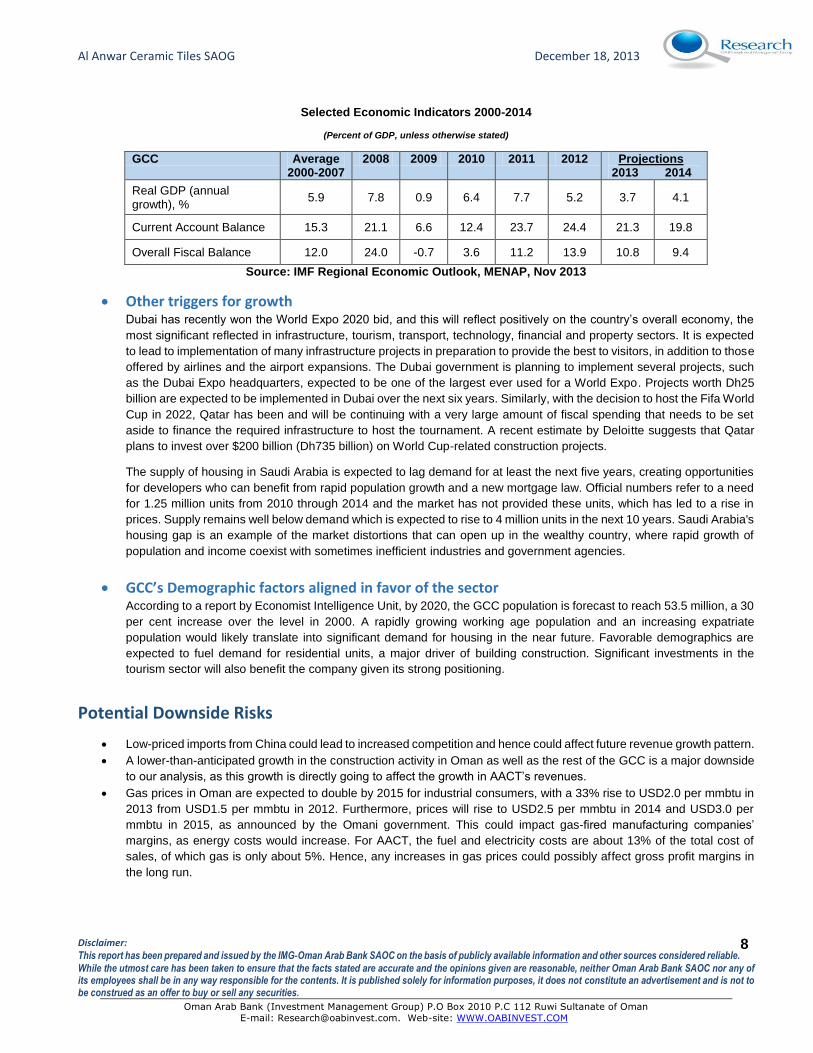
Selected Economic Indicators 2000-2014
(Percent of GDP, unless otherwise stated)
GCC Average 2000-2007
2008 2009 2010 2011 2012 Projections 2013 2014
Real GDP (annual growth), %
5.9 7.8 0.9 6.4 7.7 5.2 3.7 4.1
Current Account Balance 15.3 21.1 6.6 12.4 23.7 24.4 21.3 19.8
Overall Fiscal Balance 12.0 24.0 -0.7 3.6 11.2 13.9 10.8 9.4
Source: IMF Regional Economic Outlook, MENAP, Nov 2013
Other triggers for growth Dubai has recently won the World Expo 2020 bid, and this will reflect positively on the country’s overall economy, the
most significant reflected in infrastructure, tourism, transport, technology, financial and property sectors. It is expected
to lead to implementation of many infrastructure projects in preparation to provide the best to visitors, in addition to those
offered by airlines and the airport expansions. The Dubai government is planning to implement several projects, such
as the Dubai Expo headquarters, expected to be one of the largest ever used for a World Expo. Projects worth Dh25
billion are expected to be implemented in Dubai over the next six years. Similarly, with the decision to host the Fifa World
Cup in 2022, Qatar has been and will be continuing with a very large amount of fiscal spending that needs to be set
aside to finance the required infrastructure to host the tournament. A recent estimate by Deloitte suggests that Qatar
plans to invest over $200 billion (Dh735 billion) on World Cup-related construction projects.
The supply of housing in Saudi Arabia is expected to lag demand for at least the next five years, creating opportunities
for developers who can benefit from rapid population growth and a new mortgage law. Official numbers refer to a need
for 1.25 million units from 2010 through 2014 and the market has not provided these units, which has led to a rise in
prices. Supply remains well below demand which is expected to rise to 4 million units in the next 10 years. Saudi Arabia's
housing gap is an example of the market distortions that can open up in the wealthy country, where rapid growth of
population and income coexist with sometimes inefficient industries and government agencies.
GCC’s Demographic factors aligned in favor of the sector According to a report by Economist Intelligence Unit, by 2020, the GCC population is forecast to reach 53.5 million, a 30
per cent increase over the level in 2000. A rapidly growing working age population and an increasing expatriate
population would likely translate into significant demand for housing in the near future. Favorable demographics are
expected to fuel demand for residential units, a major driver of building construction. Significant investments in the
tourism sector will also benefit the company given its strong positioning.
Potential Downside Risks
Low-priced imports from China could lead to increased competition and hence could affect future revenue growth pattern.
A lower-than-anticipated growth in the construction activity in Oman as well as the rest of the GCC is a major downside
to our analysis, as this growth is directly going to affect the growth in AACT’s revenues.
Gas prices in Oman are expected to double by 2015 for industrial consumers, with a 33% rise to USD2.0 per mmbtu in
2013 from USD1.5 per mmbtu in 2012. Furthermore, prices will rise to USD2.5 per mmbtu in 2014 and USD3.0 per
mmbtu in 2015, as announced by the Omani government. This could impact gas-fired manufacturing companies’
margins, as energy costs would increase. For AACT, the fuel and electricity costs are about 13% of the total cost of
sales, of which gas is only about 5%. Hence, any increases in gas prices could possibly affect gross profit margins in
the long run.
Al Anwar Ceramic Tiles SAOG December 18, 2013
Disclaimer: This report has been prepared and issued by the IMG‐Oman Arab Bank SAOC on the basis of publicly available information and other sources considered reliable.
While the utmost care has been taken to ensure that the facts stated are accurate and the opinions given are reasonable, neither Oman Arab Bank SAOC nor any of its employees shall be in any way responsible for the contents. It is published solely for information purposes, it does not constitute an advertisement and is not to be construed as an offer to buy or sell any securities.
Oman Arab Bank (Investment Management Group) P.O Box 2010 P.C 112 Ruwi Sultanate of Oman
E-mail: [email protected]. Web-site: WWW.OABINVEST.COM
9
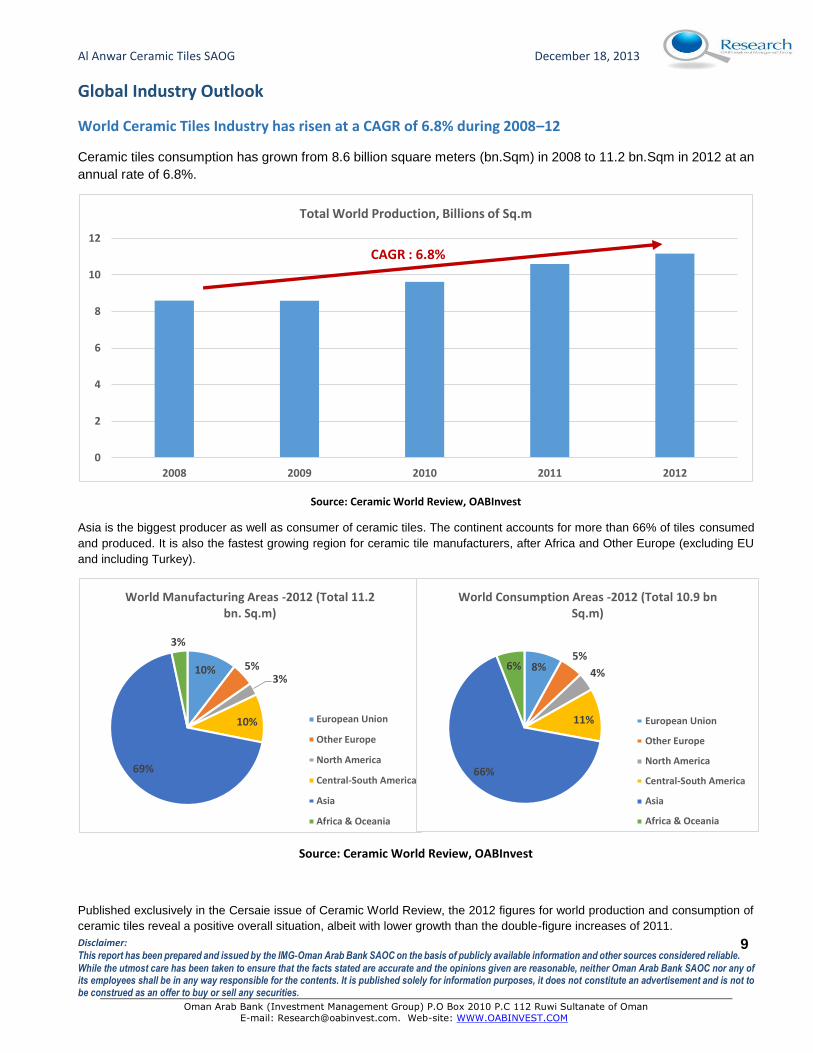
Global Industry Outlook
World Ceramic Tiles Industry has risen at a CAGR of 6.8% during 2008–12
Ceramic tiles consumption has grown from 8.6 billion square meters (bn.Sqm) in 2008 to 11.2 bn.Sqm in 2012 at an
annual rate of 6.8%.
Source: Ceramic World Review, OABInvest
Asia is the biggest producer as well as consumer of ceramic tiles. The continent accounts for more than 66% of tiles consumed
and produced. It is also the fastest growing region for ceramic tile manufacturers, after Africa and Other Europe (excluding EU
and including Turkey).
Source: Ceramic World Review, OABInvest
Published exclusively in the Cersaie issue of Ceramic World Review, the 2012 figures for world production and consumption of
ceramic tiles reveal a positive overall situation, albeit with lower growth than the double-figure increases of 2011.
0
2
4
6
8
10
12
2008 2009 2010 2011 2012
Total World Production, Billions of Sq.m
CAGR : 6.8%
10% 5%3%
10%
69%
3%
World Manufacturing Areas -2012 (Total 11.2 bn. Sq.m)
European Union
Other Europe
North America
Central-South America
Asia
Africa & Oceania
8%5%
4%
11%
66%
6%
World Consumption Areas -2012 (Total 10.9 bn Sq.m)
European Union
Other Europe
North America
Central-South America
Asia
Africa & Oceania
Al Anwar Ceramic Tiles SAOG December 18, 2013
Disclaimer: This report has been prepared and issued by the IMG‐Oman Arab Bank SAOC on the basis of publicly available information and other sources considered reliable.
While the utmost care has been taken to ensure that the facts stated are accurate and the opinions given are reasonable, neither Oman Arab Bank SAOC nor any of its employees shall be in any way responsible for the contents. It is published solely for information purposes, it does not constitute an advertisement and is not to be construed as an offer to buy or sell any securities.
Oman Arab Bank (Investment Management Group) P.O Box 2010 P.C 112 Ruwi Sultanate of Oman
E-mail: [email protected]. Web-site: WWW.OABINVEST.COM
10
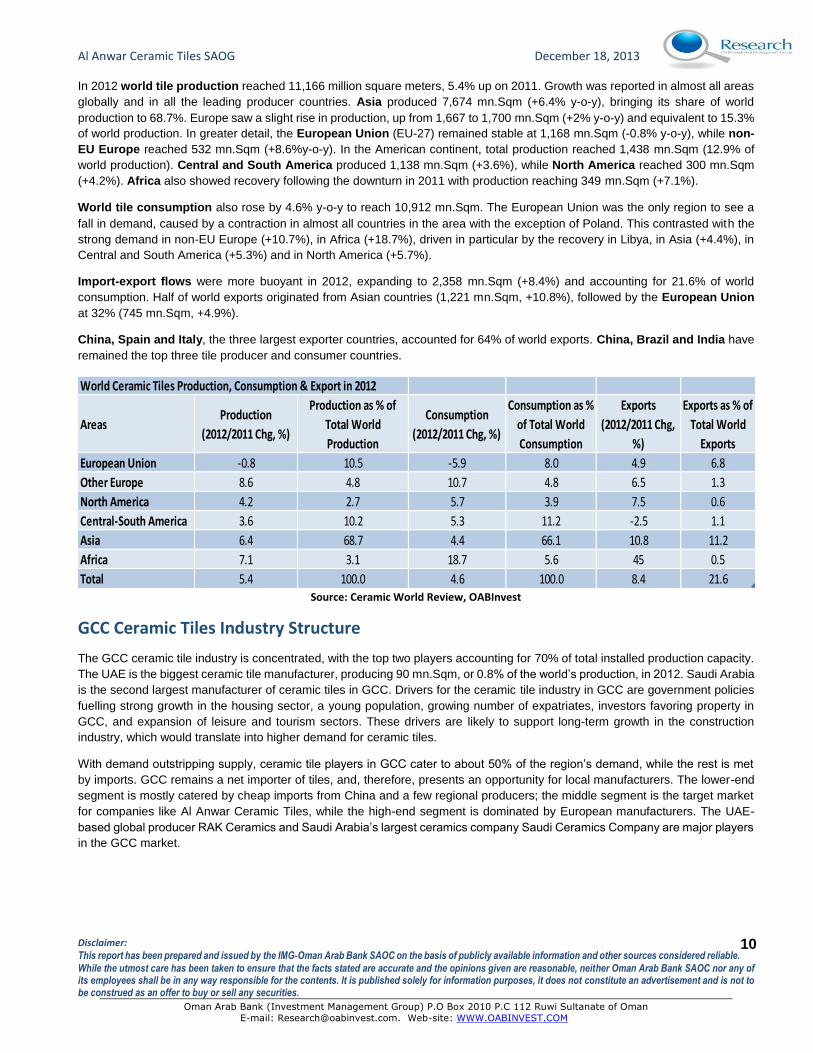
In 2012 world tile production reached 11,166 million square meters, 5.4% up on 2011. Growth was reported in almost all areas
globally and in all the leading producer countries. Asia produced 7,674 mn.Sqm (+6.4% y-o-y), bringing its share of world
production to 68.7%. Europe saw a slight rise in production, up from 1,667 to 1,700 mn.Sqm (+2% y-o-y) and equivalent to 15.3%
of world production. In greater detail, the European Union (EU-27) remained stable at 1,168 mn.Sqm (-0.8% y-o-y), while non-
EU Europe reached 532 mn.Sqm (+8.6%y-o-y). In the American continent, total production reached 1,438 mn.Sqm (12.9% of
world production). Central and South America produced 1,138 mn.Sqm (+3.6%), while North America reached 300 mn.Sqm
(+4.2%). Africa also showed recovery following the downturn in 2011 with production reaching 349 mn.Sqm (+7.1%).
World tile consumption also rose by 4.6% y-o-y to reach 10,912 mn.Sqm. The European Union was the only region to see a
fall in demand, caused by a contraction in almost all countries in the area with the exception of Poland. This contrasted with the
strong demand in non-EU Europe (+10.7%), in Africa (+18.7%), driven in particular by the recovery in Libya, in Asia (+4.4%), in
Central and South America (+5.3%) and in North America (+5.7%).
Import-export flows were more buoyant in 2012, expanding to 2,358 mn.Sqm (+8.4%) and accounting for 21.6% of world
consumption. Half of world exports originated from Asian countries (1,221 mn.Sqm, +10.8%), followed by the European Union
at 32% (745 mn.Sqm, +4.9%).
China, Spain and Italy, the three largest exporter countries, accounted for 64% of world exports. China, Brazil and India have
remained the top three tile producer and consumer countries.
World Ceramic Tiles Production, Consumption & Export in 2012
AreasProduction
(2012/2011 Chg, %)
Production as % of
Total World
Production
Consumption
(2012/2011 Chg, %)
Consumption as %
of Total World
Consumption
Exports
(2012/2011 Chg,
%)
Exports as % of
Total World
Exports
European Union -0.8 10.5 -5.9 8.0 4.9 6.8
Other Europe 8.6 4.8 10.7 4.8 6.5 1.3
North America 4.2 2.7 5.7 3.9 7.5 0.6
Central-South America 3.6 10.2 5.3 11.2 -2.5 1.1
Asia 6.4 68.7 4.4 66.1 10.8 11.2
Africa 7.1 3.1 18.7 5.6 45 0.5
Total 5.4 100.0 4.6 100.0 8.4 21.6Source: Ceramic World Review, OABInvest
GCC Ceramic Tiles Industry Structure
The GCC ceramic tile industry is concentrated, with the top two players accounting for 70% of total installed production capacity.
The UAE is the biggest ceramic tile manufacturer, producing 90 mn.Sqm, or 0.8% of the world’s production, in 2012. Saudi Arabia
is the second largest manufacturer of ceramic tiles in GCC. Drivers for the ceramic tile industry in GCC are government policies
fuelling strong growth in the housing sector, a young population, growing number of expatriates, investors favoring property in
GCC, and expansion of leisure and tourism sectors. These drivers are likely to support long-term growth in the construction
industry, which would translate into higher demand for ceramic tiles.
With demand outstripping supply, ceramic tile players in GCC cater to about 50% of the region’s demand, while the rest is met
by imports. GCC remains a net importer of tiles, and, therefore, presents an opportunity for local manufacturers. The lower-end
segment is mostly catered by cheap imports from China and a few regional producers; the middle segment is the target market
for companies like Al Anwar Ceramic Tiles, while the high-end segment is dominated by European manufacturers. The UAE-
based global producer RAK Ceramics and Saudi Arabia’s largest ceramics company Saudi Ceramics Company are major players
in the GCC market.
Al Anwar Ceramic Tiles SAOG December 18, 2013
Disclaimer: This report has been prepared and issued by the IMG‐Oman Arab Bank SAOC on the basis of publicly available information and other sources considered reliable.
While the utmost care has been taken to ensure that the facts stated are accurate and the opinions given are reasonable, neither Oman Arab Bank SAOC nor any of its employees shall be in any way responsible for the contents. It is published solely for information purposes, it does not constitute an advertisement and is not to be construed as an offer to buy or sell any securities.
Oman Arab Bank (Investment Management Group) P.O Box 2010 P.C 112 Ruwi Sultanate of Oman
E-mail: [email protected]. Web-site: WWW.OABINVEST.COM
11
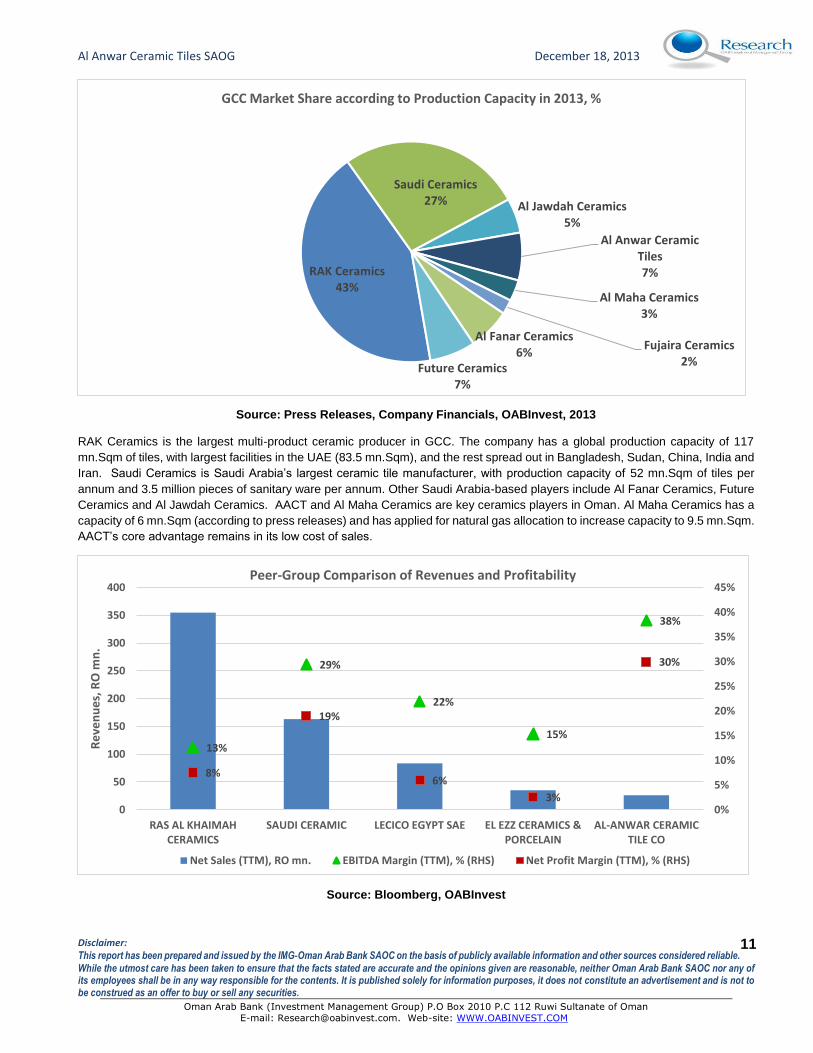
Source: Press Releases, Company Financials, OABInvest, 2013
RAK Ceramics is the largest multi-product ceramic producer in GCC. The company has a global production capacity of 117
mn.Sqm of tiles, with largest facilities in the UAE (83.5 mn.Sqm), and the rest spread out in Bangladesh, Sudan, China, India and
Iran. Saudi Ceramics is Saudi Arabia’s largest ceramic tile manufacturer, with production capacity of 52 mn.Sqm of tiles per
annum and 3.5 million pieces of sanitary ware per annum. Other Saudi Arabia-based players include Al Fanar Ceramics, Future
Ceramics and Al Jawdah Ceramics. AACT and Al Maha Ceramics are key ceramics players in Oman. Al Maha Ceramics has a
capacity of 6 mn.Sqm (according to press releases) and has applied for natural gas allocation to increase capacity to 9.5 mn.Sqm.
AACT’s core advantage remains in its low cost of sales.
Source: Bloomberg, OABInvest
RAK Ceramics43%
Saudi Ceramics27% Al Jawdah Ceramics
5%
Al Anwar Ceramic Tiles7%
Al Maha Ceramics3%
Fujaira Ceramics2%
Al Fanar Ceramics6%
Future Ceramics7%
GCC Market Share according to Production Capacity in 2013, %
13%
29%
22%
15%
38%
8%
19%
6%
3%
30%
0%
5%
10%
15%
20%
25%
30%
35%
40%
45%
0
50
100
150
200
250
300
350
400
RAS AL KHAIMAHCERAMICS
SAUDI CERAMIC LECICO EGYPT SAE EL EZZ CERAMICS &PORCELAIN
AL-ANWAR CERAMICTILE CO
Re
ven
ue
s, R
O m
n.
Peer-Group Comparison of Revenues and Profitability
Net Sales (TTM), RO mn. EBITDA Margin (TTM), % (RHS) Net Profit Margin (TTM), % (RHS)
Al Anwar Ceramic Tiles SAOG December 18, 2013
Disclaimer: This report has been prepared and issued by the IMG‐Oman Arab Bank SAOC on the basis of publicly available information and other sources considered reliable.
While the utmost care has been taken to ensure that the facts stated are accurate and the opinions given are reasonable, neither Oman Arab Bank SAOC nor any of its employees shall be in any way responsible for the contents. It is published solely for information purposes, it does not constitute an advertisement and is not to be construed as an offer to buy or sell any securities.
Oman Arab Bank (Investment Management Group) P.O Box 2010 P.C 112 Ruwi Sultanate of Oman
E-mail: [email protected]. Web-site: WWW.OABINVEST.COM
12
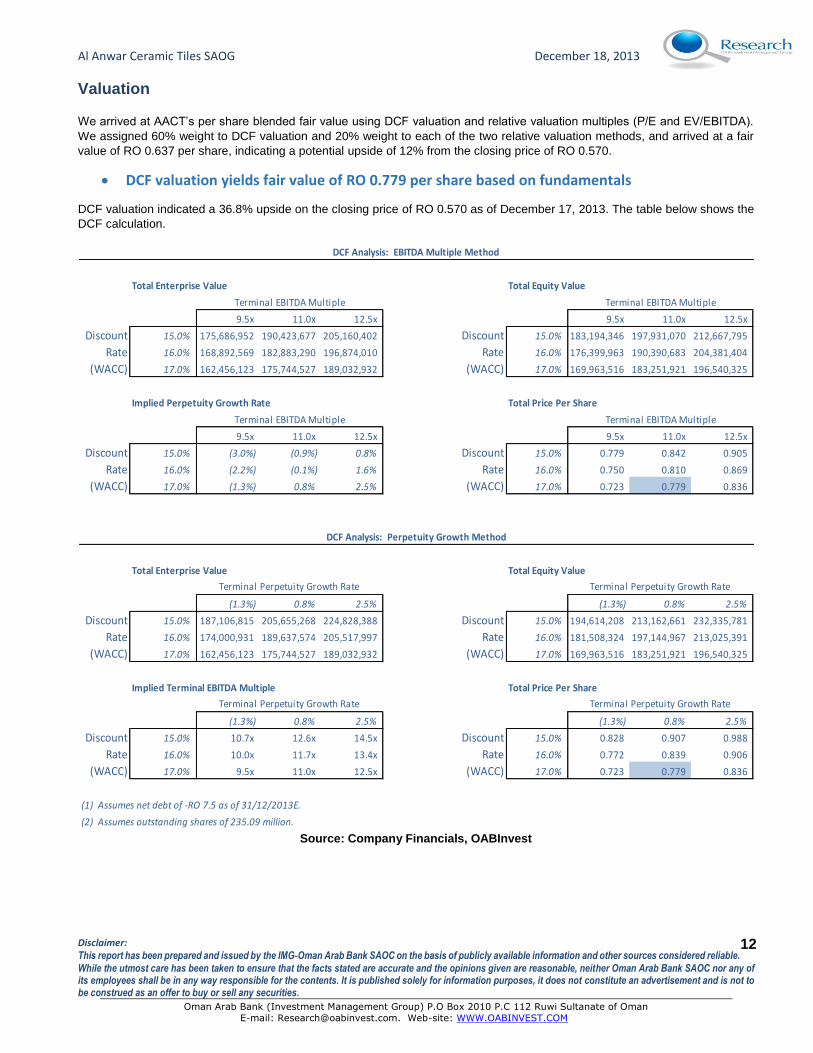
Valuation
We arrived at AACT’s per share blended fair value using DCF valuation and relative valuation multiples (P/E and EV/EBITDA).
We assigned 60% weight to DCF valuation and 20% weight to each of the two relative valuation methods, and arrived at a fair
value of RO 0.637 per share, indicating a potential upside of 12% from the closing price of RO 0.570.
DCF valuation yields fair value of RO 0.779 per share based on fundamentals
DCF valuation indicated a 36.8% upside on the closing price of RO 0.570 as of December 17, 2013. The table below shows the
DCF calculation.
Total Enterprise Value Total Equity Value
9.5x 11.0x 12.5x 9.5x 11.0x 12.5x
Discount 15.0% 175,686,952 190,423,677 205,160,402 Discount 15.0% 183,194,346 197,931,070 212,667,795
Rate 16.0% 168,892,569 182,883,290 196,874,010 Rate 16.0% 176,399,963 190,390,683 204,381,404
(WACC) 17.0% 162,456,123 175,744,527 189,032,932 (WACC) 17.0% 169,963,516 183,251,921 196,540,325
Implied Perpetuity Growth Rate Total Price Per Share
9.5x 11.0x 12.5x 9.5x 11.0x 12.5x
Discount 15.0% (3.0%) (0.9%) 0.8% Discount 15.0% 0.779 0.842 0.905
Rate 16.0% (2.2%) (0.1%) 1.6% Rate 16.0% 0.750 0.810 0.869
(WACC) 17.0% (1.3%) 0.8% 2.5% (WACC) 17.0% 0.723 0.779 0.836
Total Enterprise Value Total Equity Value
(1.3%) 0.8% 2.5% (1.3%) 0.8% 2.5%
Discount 15.0% 187,106,815 205,655,268 224,828,388 Discount 15.0% 194,614,208 213,162,661 232,335,781
Rate 16.0% 174,000,931 189,637,574 205,517,997 Rate 16.0% 181,508,324 197,144,967 213,025,391
(WACC) 17.0% 162,456,123 175,744,527 189,032,932 (WACC) 17.0% 169,963,516 183,251,921 196,540,325
Implied Terminal EBITDA Multiple Total Price Per Share
(1.3%) 0.8% 2.5% (1.3%) 0.8% 2.5%
Discount 15.0% 10.7x 12.6x 14.5x Discount 15.0% 0.828 0.907 0.988
Rate 16.0% 10.0x 11.7x 13.4x Rate 16.0% 0.772 0.839 0.906
(WACC) 17.0% 9.5x 11.0x 12.5x (WACC) 17.0% 0.723 0.779 0.836
(1) Assumes net debt of -RO 7.5 as of 31/12/2013E.
(2) Assumes outstanding shares of 235.09 million.
DCF Analysis: EBITDA Multiple Method
Terminal EBITDA Multiple
DCF Analysis: Perpetuity Growth Method
Terminal Perpetuity Growth Rate Terminal Perpetuity Growth Rate
Terminal Perpetuity Growth Rate Terminal Perpetuity Growth Rate
Terminal EBITDA MultipleTerminal EBITDA Multiple
Terminal EBITDA Multiple
Source: Company Financials, OABInvest
Al Anwar Ceramic Tiles SAOG December 18, 2013
Disclaimer: This report has been prepared and issued by the IMG‐Oman Arab Bank SAOC on the basis of publicly available information and other sources considered reliable.
While the utmost care has been taken to ensure that the facts stated are accurate and the opinions given are reasonable, neither Oman Arab Bank SAOC nor any of its employees shall be in any way responsible for the contents. It is published solely for information purposes, it does not constitute an advertisement and is not to be construed as an offer to buy or sell any securities.
Oman Arab Bank (Investment Management Group) P.O Box 2010 P.C 112 Ruwi Sultanate of Oman
E-mail: [email protected]. Web-site: WWW.OABINVEST.COM
13
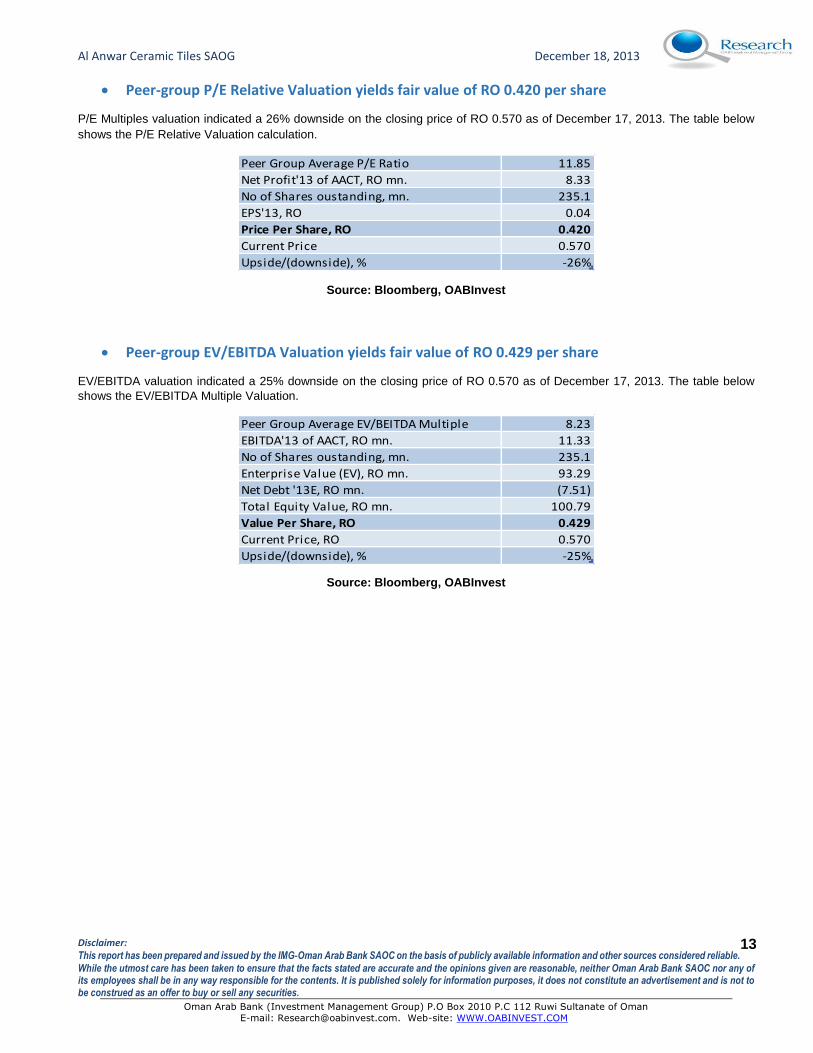
Peer-group P/E Relative Valuation yields fair value of RO 0.420 per share
P/E Multiples valuation indicated a 26% downside on the closing price of RO 0.570 as of December 17, 2013. The table below
shows the P/E Relative Valuation calculation.
Peer Group Average P/E Ratio 11.85
Net Profit'13 of AACT, RO mn. 8.33
No of Shares oustanding, mn. 235.1
EPS'13, RO 0.04
Price Per Share, RO 0.420
Current Price 0.570
Upside/(downside), % -26%
Source: Bloomberg, OABInvest
Peer-group EV/EBITDA Valuation yields fair value of RO 0.429 per share
EV/EBITDA valuation indicated a 25% downside on the closing price of RO 0.570 as of December 17, 2013. The table below
shows the EV/EBITDA Multiple Valuation.
Peer Group Average EV/BEITDA Multiple 8.23
EBITDA'13 of AACT, RO mn. 11.33
No of Shares oustanding, mn. 235.1
Enterprise Value (EV), RO mn. 93.29
Net Debt '13E, RO mn. (7.51)
Total Equity Value, RO mn. 100.79
Value Per Share, RO 0.429
Current Price, RO 0.570
Upside/(downside), % -25%
Source: Bloomberg, OABInvest
Al Anwar Ceramic Tiles SAOG December 18, 2013
Disclaimer: This report has been prepared and issued by the IMG‐Oman Arab Bank SAOC on the basis of publicly available information and other sources considered reliable.
While the utmost care has been taken to ensure that the facts stated are accurate and the opinions given are reasonable, neither Oman Arab Bank SAOC nor any of its employees shall be in any way responsible for the contents. It is published solely for information purposes, it does not constitute an advertisement and is not to be construed as an offer to buy or sell any securities.
Oman Arab Bank (Investment Management Group) P.O Box 2010 P.C 112 Ruwi Sultanate of Oman
E-mail: [email protected]. Web-site: WWW.OABINVEST.COM
14
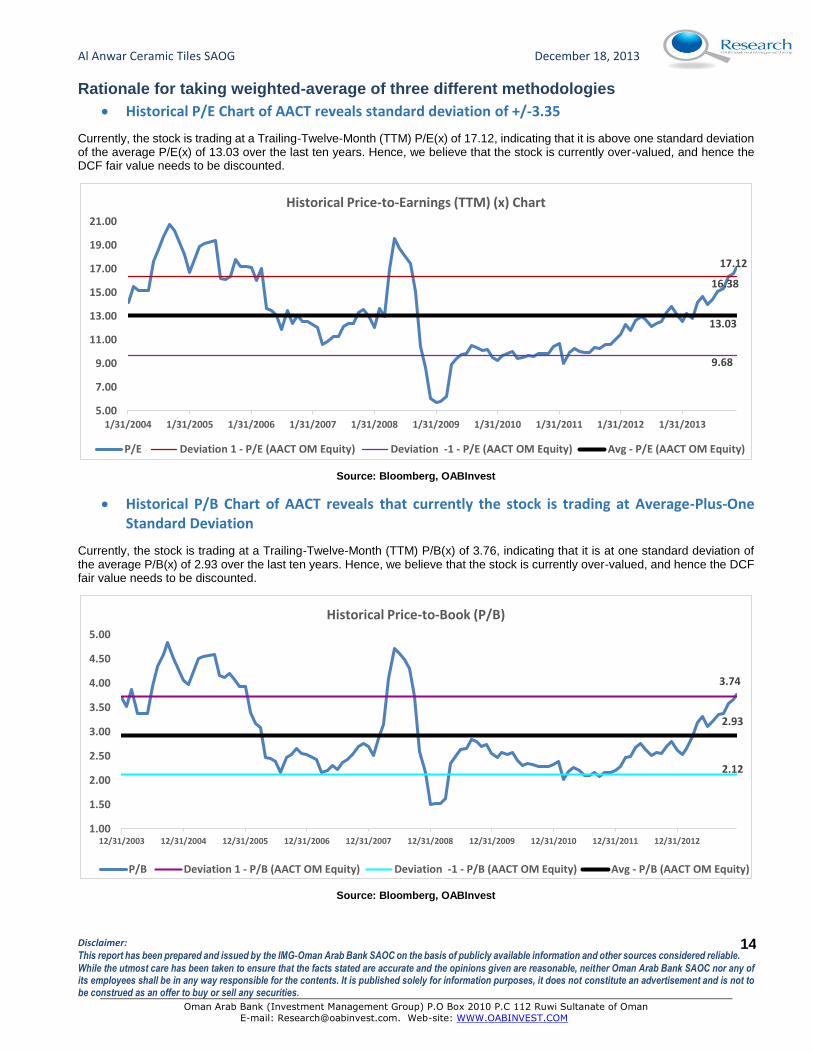
Rationale for taking weighted-average of three different methodologies
Historical P/E Chart of AACT reveals standard deviation of +/-3.35
Currently, the stock is trading at a Trailing-Twelve-Month (TTM) P/E(x) of 17.12, indicating that it is above one standard deviation of the average P/E(x) of 13.03 over the last ten years. Hence, we believe that the stock is currently over-valued, and hence the DCF fair value needs to be discounted.
Source: Bloomberg, OABInvest
Historical P/B Chart of AACT reveals that currently the stock is trading at Average-Plus-One Standard Deviation
Currently, the stock is trading at a Trailing-Twelve-Month (TTM) P/B(x) of 3.76, indicating that it is at one standard deviation of the average P/B(x) of 2.93 over the last ten years. Hence, we believe that the stock is currently over-valued, and hence the DCF fair value needs to be discounted.
Source: Bloomberg, OABInvest
17.12
16.38
9.68
13.03
5.00
7.00
9.00
11.00
13.00
15.00
17.00
19.00
21.00
1/31/2004 1/31/2005 1/31/2006 1/31/2007 1/31/2008 1/31/2009 1/31/2010 1/31/2011 1/31/2012 1/31/2013
Historical Price-to-Earnings (TTM) (x) Chart
P/E Deviation 1 - P/E (AACT OM Equity) Deviation -1 - P/E (AACT OM Equity) Avg - P/E (AACT OM Equity)
3.74
2.12
2.93
1.00
1.50
2.00
2.50
3.00
3.50
4.00
4.50
5.00
12/31/2003 12/31/2004 12/31/2005 12/31/2006 12/31/2007 12/31/2008 12/31/2009 12/31/2010 12/31/2011 12/31/2012
Historical Price-to-Book (P/B)
P/B Deviation 1 - P/B (AACT OM Equity) Deviation -1 - P/B (AACT OM Equity) Avg - P/B (AACT OM Equity)
Al Anwar Ceramic Tiles SAOG December 18, 2013
Disclaimer: This report has been prepared and issued by the IMG‐Oman Arab Bank SAOC on the basis of publicly available information and other sources considered reliable.
While the utmost care has been taken to ensure that the facts stated are accurate and the opinions given are reasonable, neither Oman Arab Bank SAOC nor any of its employees shall be in any way responsible for the contents. It is published solely for information purposes, it does not constitute an advertisement and is not to be construed as an offer to buy or sell any securities.
Oman Arab Bank (Investment Management Group) P.O Box 2010 P.C 112 Ruwi Sultanate of Oman
E-mail: [email protected]. Web-site: WWW.OABINVEST.COM
15
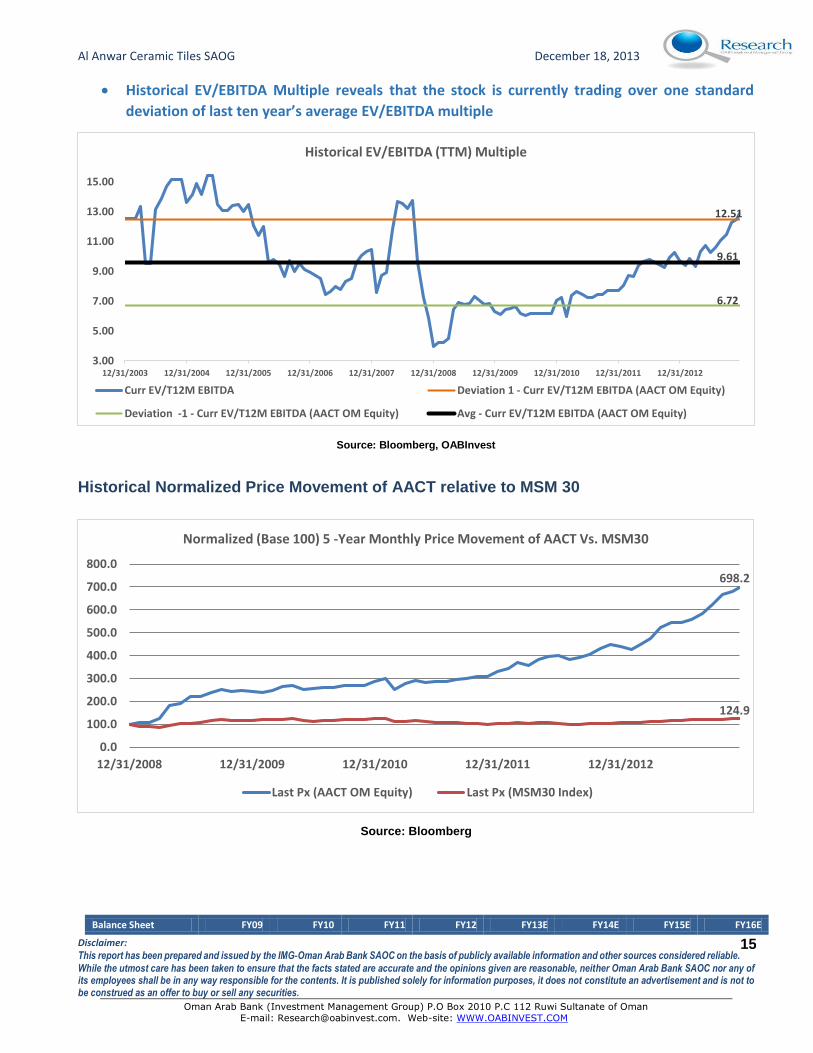
Historical EV/EBITDA Multiple reveals that the stock is currently trading over one standard
deviation of last ten year’s average EV/EBITDA multiple
Source: Bloomberg, OABInvest
Historical Normalized Price Movement of AACT relative to MSM 30
Source: Bloomberg
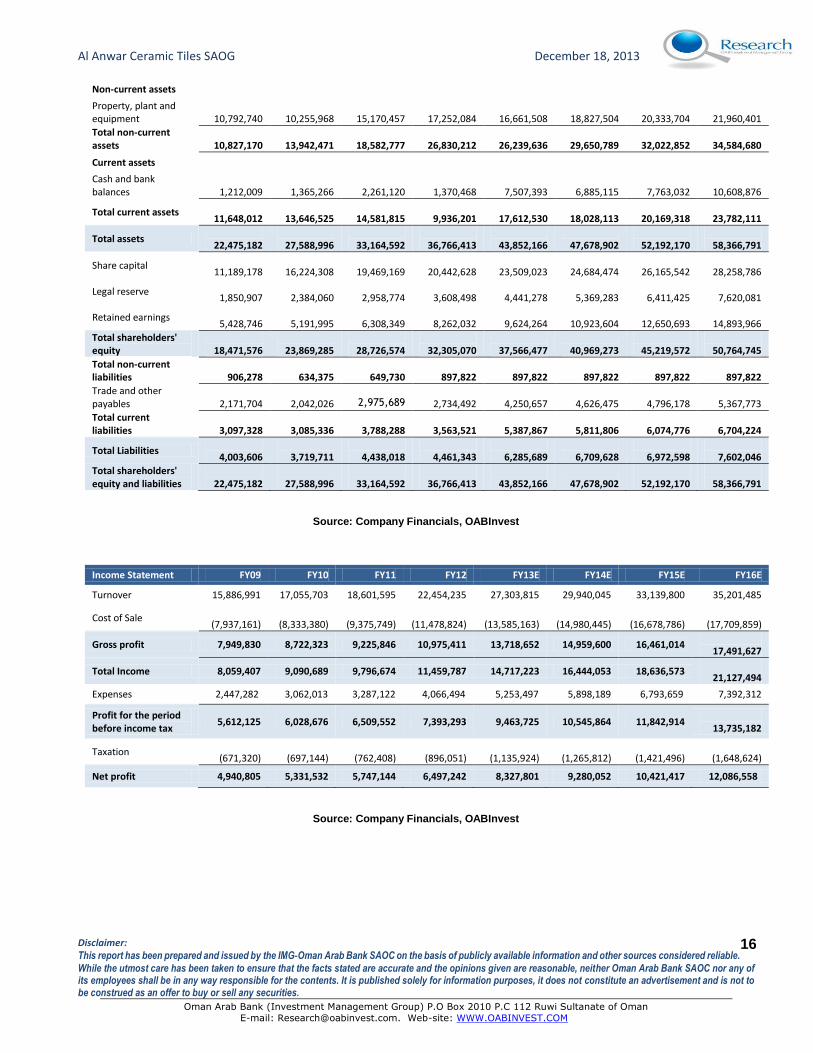
Balance Sheet FY09 FY10 FY11 FY12 FY13E FY14E FY15E FY16E
12.51
6.72
9.61
3.00
5.00
7.00
9.00
11.00
13.00
15.00
12/31/2003 12/31/2004 12/31/2005 12/31/2006 12/31/2007 12/31/2008 12/31/2009 12/31/2010 12/31/2011 12/31/2012
Historical EV/EBITDA (TTM) Multiple
Curr EV/T12M EBITDA Deviation 1 - Curr EV/T12M EBITDA (AACT OM Equity)
Deviation -1 - Curr EV/T12M EBITDA (AACT OM Equity) Avg - Curr EV/T12M EBITDA (AACT OM Equity)
698.2
124.9
0.0
100.0
200.0
300.0
400.0
500.0
600.0
700.0
800.0
12/31/2008 12/31/2009 12/31/2010 12/31/2011 12/31/2012
Normalized (Base 100) 5 -Year Monthly Price Movement of AACT Vs. MSM30
Last Px (AACT OM Equity) Last Px (MSM30 Index)
Al Anwar Ceramic Tiles SAOG December 18, 2013
Disclaimer: This report has been prepared and issued by the IMG‐Oman Arab Bank SAOC on the basis of publicly available information and other sources considered reliable.
While the utmost care has been taken to ensure that the facts stated are accurate and the opinions given are reasonable, neither Oman Arab Bank SAOC nor any of its employees shall be in any way responsible for the contents. It is published solely for information purposes, it does not constitute an advertisement and is not to be construed as an offer to buy or sell any securities.
Oman Arab Bank (Investment Management Group) P.O Box 2010 P.C 112 Ruwi Sultanate of Oman
E-mail: [email protected]. Web-site: WWW.OABINVEST.COM
16
Non-current assets
Property, plant and equipment
10,792,740 10,255,968
15,170,457
17,252,084
16,661,508
18,827,504
20,333,704
21,960,401
Total non-current assets
10,827,170
13,942,471
18,582,777
26,830,212
26,239,636
29,650,789
32,022,852
34,584,680
Current assets
Cash and bank balances
1,212,009
1,365,266
2,261,120
1,370,468
7,507,393
6,885,115
7,763,032
10,608,876
Total current assets
11,648,012
13,646,525
14,581,815
9,936,201
17,612,530
18,028,113
20,169,318
23,782,111
Total assets
22,475,182
27,588,996
33,164,592
36,766,413
43,852,166
47,678,902
52,192,170
58,366,791
Share capital
11,189,178
16,224,308
19,469,169
20,442,628
23,509,023
24,684,474
26,165,542
28,258,786
Legal reserve
1,850,907
2,384,060
2,958,774
3,608,498
4,441,278
5,369,283
6,411,425
7,620,081
Retained earnings
5,428,746
5,191,995
6,308,349
8,262,032
9,624,264
10,923,604
12,650,693
14,893,966
Total shareholders' equity
18,471,576
23,869,285
28,726,574
32,305,070
37,566,477
40,969,273
45,219,572
50,764,745
Total non-current liabilities
906,278
634,375
649,730
897,822
897,822
897,822
897,822
897,822
Trade and other payables
2,171,704
2,042,026
2,975,689
2,734,492
4,250,657
4,626,475
4,796,178
5,367,773
Total current liabilities
3,097,328
3,085,336
3,788,288
3,563,521
5,387,867
5,811,806
6,074,776
6,704,224
Total Liabilities
4,003,606
3,719,711
4,438,018
4,461,343
6,285,689
6,709,628
6,972,598
7,602,046
Total shareholders' equity and liabilities
22,475,182
27,588,996
33,164,592
36,766,413
43,852,166
47,678,902
52,192,170
58,366,791
Source: Company Financials, OABInvest
Income Statement FY09 FY10 FY11 FY12 FY13E FY14E FY15E FY16E
Turnover 15,886,991 17,055,703 18,601,595 22,454,235 27,303,815 29,940,045 33,139,800 35,201,485
Cost of Sale
(7,937,161)
(8,333,380)
(9,375,749)
(11,478,824)
(13,585,163)
(14,980,445)
(16,678,786)
(17,709,859)
Gross profit 7,949,830 8,722,323 9,225,846 10,975,411 13,718,652 14,959,600 16,461,014
17,491,627
Total Income 8,059,407 9,090,689 9,796,674 11,459,787 14,717,223 16,444,053 18,636,573
21,127,494
Expenses 2,447,282 3,062,013 3,287,122 4,066,494 5,253,497 5,898,189 6,793,659 7,392,312
Profit for the period before income tax
5,612,125 6,028,676 6,509,552 7,393,293 9,463,725 10,545,864 11,842,914
13,735,182
Taxation
(671,320)
(697,144)
(762,408)
(896,051)
(1,135,924)
(1,265,812)
(1,421,496)
(1,648,624)
Net profit 4,940,805 5,331,532 5,747,144 6,497,242 8,327,801 9,280,052 10,421,417 12,086,558
Source: Company Financials, OABInvest
Al Anwar Ceramic Tiles SAOG December 18, 2013
Disclaimer: This report has been prepared and issued by the IMG‐Oman Arab Bank SAOC on the basis of publicly available information and other sources considered reliable.
While the utmost care has been taken to ensure that the facts stated are accurate and the opinions given are reasonable, neither Oman Arab Bank SAOC nor any of its employees shall be in any way responsible for the contents. It is published solely for information purposes, it does not constitute an advertisement and is not to be construed as an offer to buy or sell any securities.
Oman Arab Bank (Investment Management Group) P.O Box 2010 P.C 112 Ruwi Sultanate of Oman
E-mail: [email protected]. Web-site: WWW.OABINVEST.COM
17
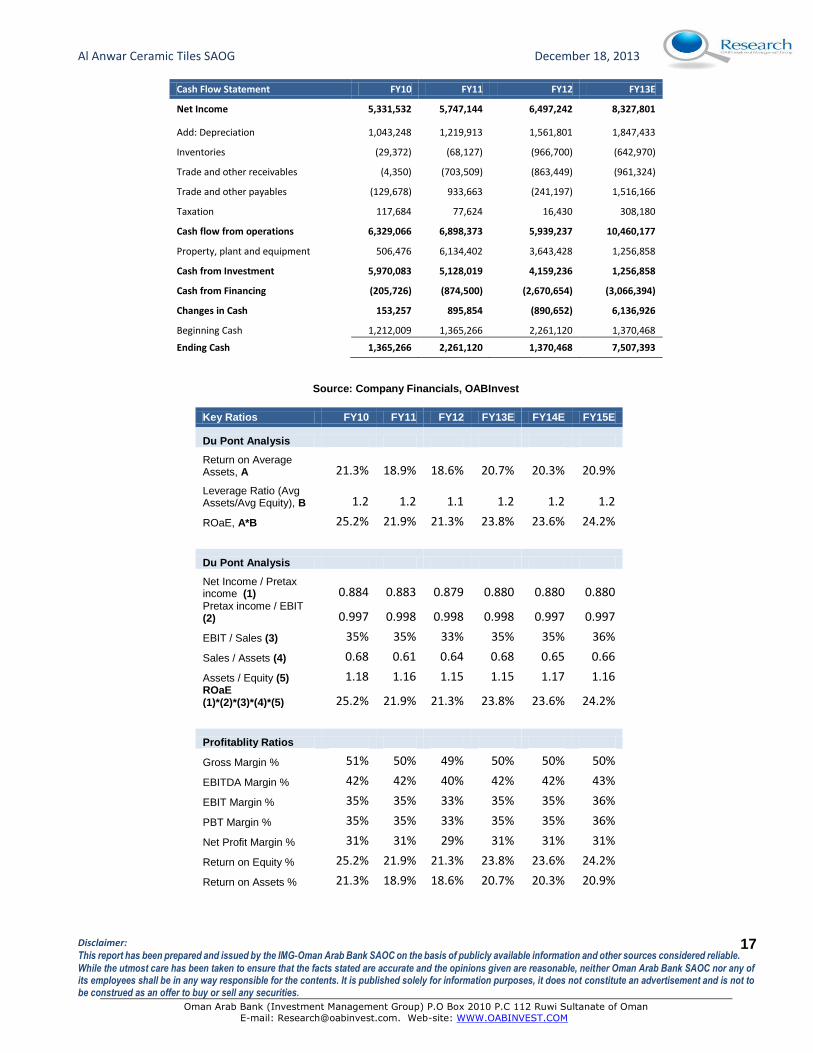
Cash Flow Statement FY10 FY11 FY12 FY13E
Net Income 5,331,532 5,747,144 6,497,242 8,327,801
Add: Depreciation 1,043,248 1,219,913 1,561,801 1,847,433
Inventories (29,372) (68,127) (966,700) (642,970)
Trade and other receivables (4,350) (703,509) (863,449) (961,324)
Trade and other payables (129,678) 933,663 (241,197) 1,516,166
Taxation 117,684 77,624 16,430 308,180
Cash flow from operations 6,329,066 6,898,373 5,939,237 10,460,177
Property, plant and equipment 506,476 6,134,402 3,643,428 1,256,858
Cash from Investment 5,970,083 5,128,019 4,159,236 1,256,858
Cash from Financing (205,726) (874,500) (2,670,654) (3,066,394)
Changes in Cash 153,257 895,854 (890,652) 6,136,926
Beginning Cash 1,212,009 1,365,266 2,261,120 1,370,468
Ending Cash 1,365,266 2,261,120 1,370,468 7,507,393
Source: Company Financials, OABInvest
Key Ratios FY10 FY11 FY12 FY13E FY14E FY15E
Du Pont Analysis
Return on Average Assets, A 21.3% 18.9% 18.6% 20.7% 20.3% 20.9%
Leverage Ratio (Avg Assets/Avg Equity), B 1.2 1.2 1.1 1.2 1.2 1.2
ROaE, A*B 25.2% 21.9% 21.3% 23.8% 23.6% 24.2%
Du Pont Analysis
Net Income / Pretax income (1) 0.884 0.883 0.879 0.880 0.880 0.880 Pretax income / EBIT (2) 0.997 0.998 0.998 0.998 0.997 0.997
EBIT / Sales (3) 35% 35% 33% 35% 35% 36%
Sales / Assets (4) 0.68 0.61 0.64 0.68 0.65 0.66
Assets / Equity (5) 1.18 1.16 1.15 1.15 1.17 1.16 ROaE (1)*(2)*(3)*(4)*(5) 25.2% 21.9% 21.3% 23.8% 23.6% 24.2%
Profitablity Ratios
Gross Margin % 51% 50% 49% 50% 50% 50%
EBITDA Margin % 42% 42% 40% 42% 42% 43%
EBIT Margin % 35% 35% 33% 35% 35% 36%
PBT Margin % 35% 35% 33% 35% 35% 36%
Net Profit Margin % 31% 31% 29% 31% 31% 31%
Return on Equity % 25.2% 21.9% 21.3% 23.8% 23.6% 24.2%
Return on Assets % 21.3% 18.9% 18.6% 20.7% 20.3% 20.9%
Al Anwar Ceramic Tiles SAOG December 18, 2013
Disclaimer: This report has been prepared and issued by the IMG‐Oman Arab Bank SAOC on the basis of publicly available information and other sources considered reliable.
While the utmost care has been taken to ensure that the facts stated are accurate and the opinions given are reasonable, neither Oman Arab Bank SAOC nor any of its employees shall be in any way responsible for the contents. It is published solely for information purposes, it does not constitute an advertisement and is not to be construed as an offer to buy or sell any securities.
Oman Arab Bank (Investment Management Group) P.O Box 2010 P.C 112 Ruwi Sultanate of Oman
E-mail: [email protected]. Web-site: WWW.OABINVEST.COM
18
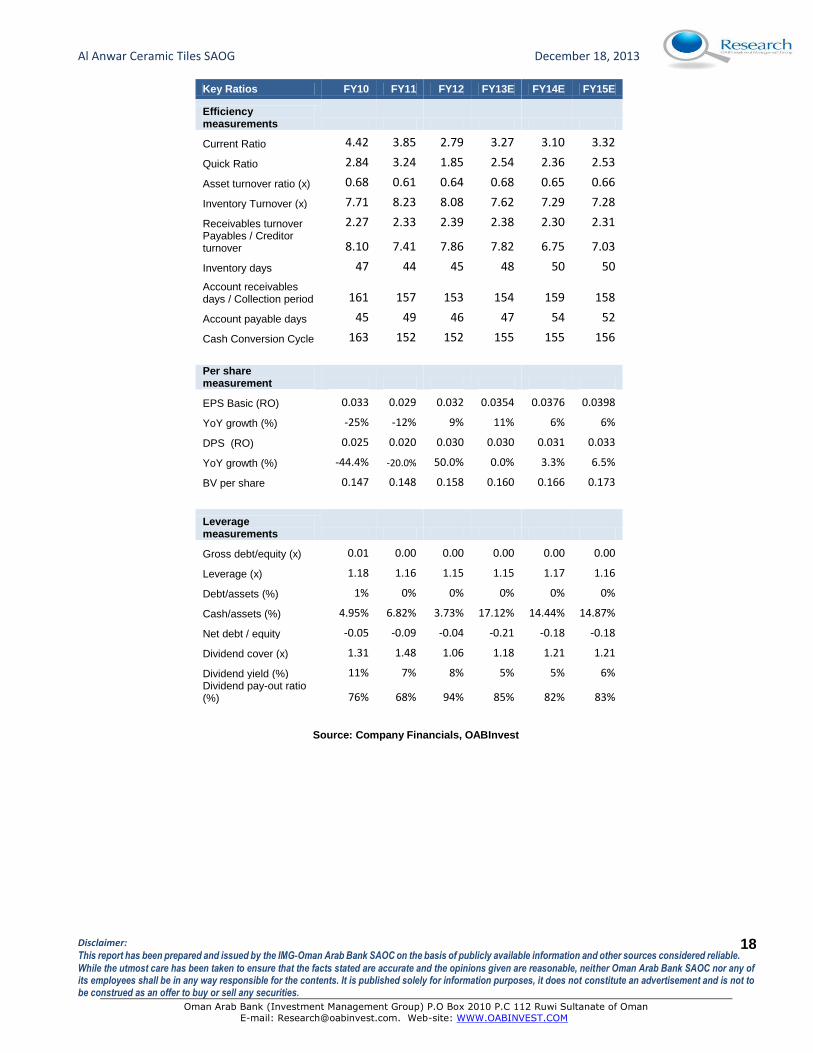
Key Ratios FY10 FY11 FY12 FY13E FY14E FY15E
Efficiency measurements
Current Ratio 4.42 3.85 2.79 3.27 3.10 3.32
Quick Ratio 2.84 3.24 1.85 2.54 2.36 2.53
Asset turnover ratio (x) 0.68 0.61 0.64 0.68 0.65 0.66
Inventory Turnover (x) 7.71 8.23 8.08 7.62 7.29 7.28
Receivables turnover 2.27 2.33 2.39 2.38 2.30 2.31 Payables / Creditor turnover 8.10 7.41 7.86 7.82 6.75 7.03
Inventory days 47 44 45 48 50 50
Account receivables days / Collection period 161 157 153 154 159 158
Account payable days 45 49 46 47 54 52
Cash Conversion Cycle 163 152 152 155 155 156
Per share measurement
EPS Basic (RO) 0.033 0.029 0.032 0.0354 0.0376 0.0398
YoY growth (%) -25% -12% 9% 11% 6% 6%
DPS (RO) 0.025 0.020 0.030 0.030 0.031 0.033
YoY growth (%) -44.4% -20.0% 50.0% 0.0% 3.3% 6.5%
BV per share 0.147 0.148 0.158 0.160 0.166 0.173
Leverage measurements
Gross debt/equity (x) 0.01 0.00 0.00 0.00 0.00 0.00
Leverage (x) 1.18 1.16 1.15 1.15 1.17 1.16
Debt/assets (%) 1% 0% 0% 0% 0% 0%
Cash/assets (%) 4.95% 6.82% 3.73% 17.12% 14.44% 14.87%
Net debt / equity -0.05 -0.09 -0.04 -0.21 -0.18 -0.18
Dividend cover (x) 1.31 1.48 1.06 1.18 1.21 1.21
Dividend yield (%) 11% 7% 8% 5% 5% 6% Dividend pay-out ratio (%) 76% 68% 94% 85% 82% 83%
Source: Company Financials, OABInvest
Al Anwar Ceramic Tiles SAOG December 18, 2013
Disclaimer: This report has been prepared and issued by the IMG‐Oman Arab Bank SAOC on the basis of publicly available information and other sources considered reliable.
While the utmost care has been taken to ensure that the facts stated are accurate and the opinions given are reasonable, neither Oman Arab Bank SAOC nor any of its employees shall be in any way responsible for the contents. It is published solely for information purposes, it does not constitute an advertisement and is not to be construed as an offer to buy or sell any securities.
Oman Arab Bank (Investment Management Group) P.O Box 2010 P.C 112 Ruwi Sultanate of Oman
E-mail: [email protected]. Web-site: WWW.OABINVEST.COM
19
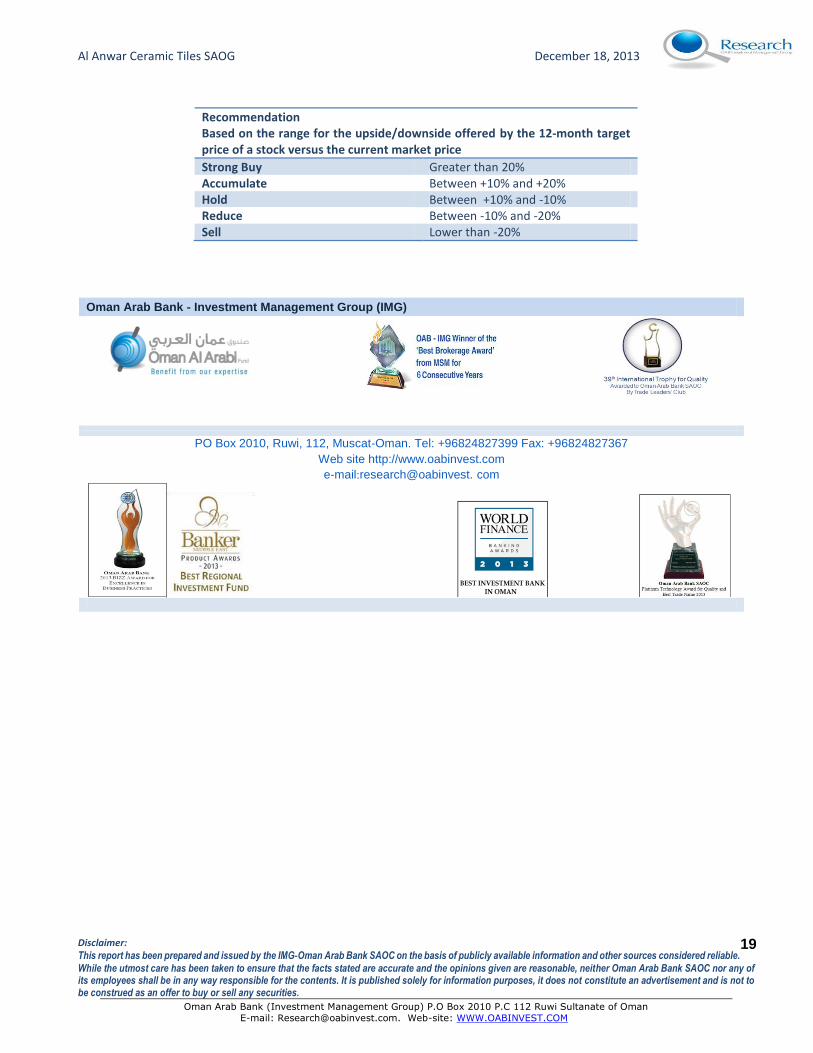
Recommendation Based on the range for the upside/downside offered by the 12-month target price of a stock versus the current market price
Strong Buy Greater than 20% Accumulate Between +10% and +20% Hold Between +10% and -10% Reduce Between -10% and -20% Sell Lower than -20%
Oman Arab Bank - Investment Management Group (IMG)
PO Box 2010, Ruwi, 112, Muscat-Oman. Tel: +96824827399 Fax: +96824827367
Web site http://www.oabinvest.com
e-mail:research@oabinvest. com


