
ALL INDIA SURVEY ON
HIGHER EDUCATION (AISHE)
5th January 2018
1
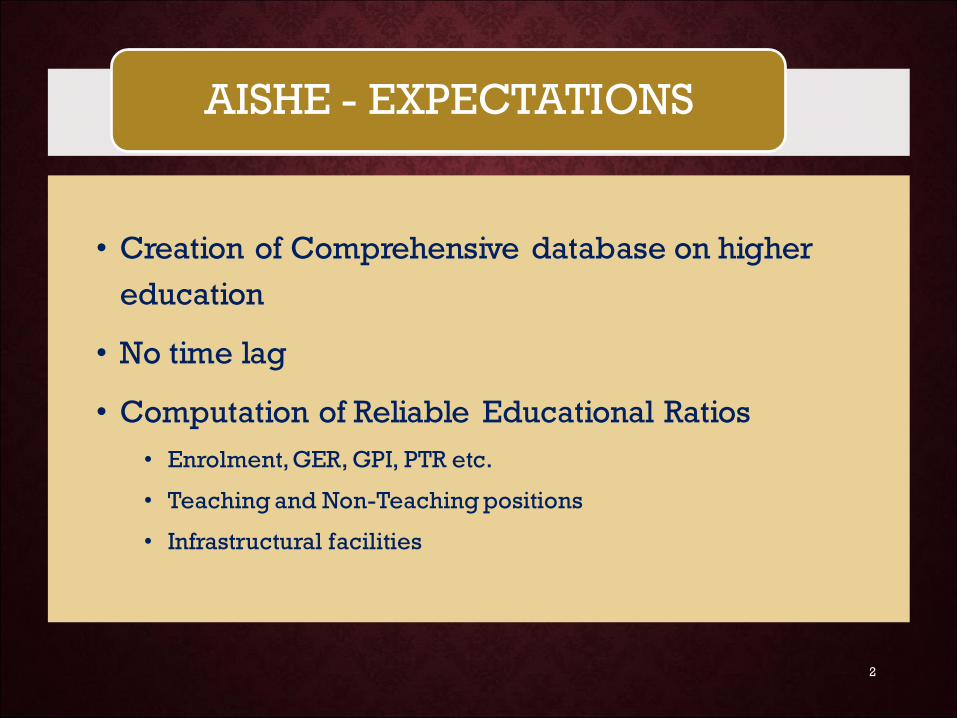
AISHE - EXPECTATIONS
• Creation of Comprehensive database on higher
education
• No time lag
• Computation of Reliable Educational Ratios
• Enrolment, GER, GPI, PTR etc.
• Teaching and Non-Teaching positions
• Infrastructural facilities
2

• Complete data uploading in a reasonable time by all the
institutions
• State Higher Education Departments to play a proactive role
Regular Progress Monitoring
Sensitization-cum-training workshop at State/University
levels
• Data for 2017-18 to be uploaded within 2 - 3 months of the
launching of the survey
Expectations from Institutions/State
3
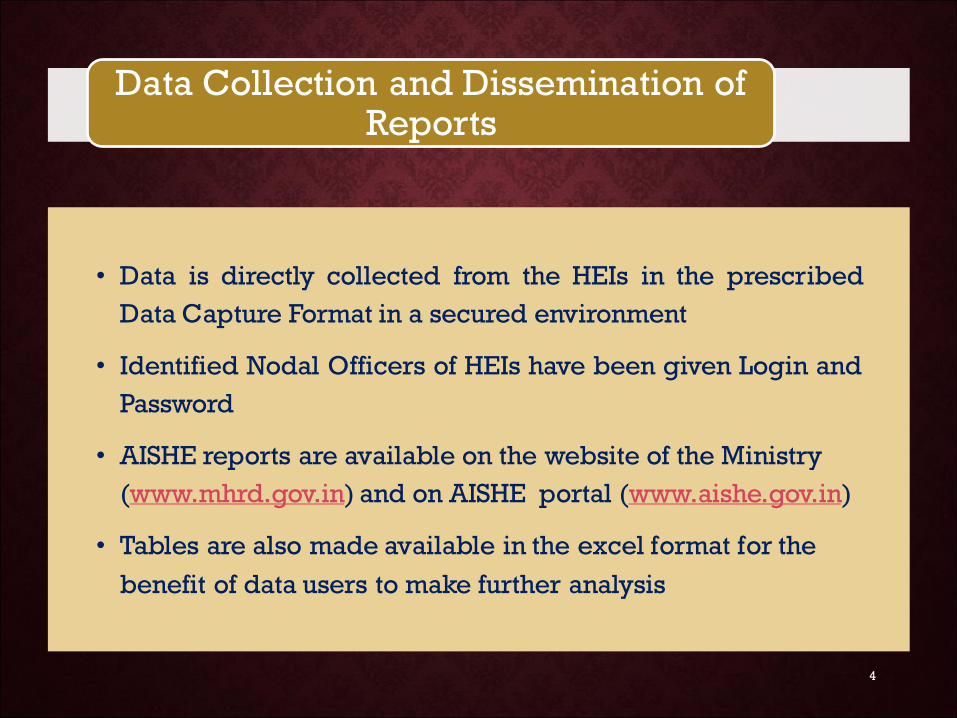
• Data is directly collected from the HEIs in the prescribed
Data Capture Format in a secured environment
• Identified Nodal Officers of HEIs have been given Login and
Password
• AISHE reports are available on the website of the Ministry
(www.mhrd.gov.in) and on AISHE portal (www.aishe.gov.in)
• Tables are also made available in the excel format for the
benefit of data users to make further analysis
Data Collection and Dissemination of Reports
4

NEW FEATURE OF AISHE 2016-17
• Data on profile of teachers were collected in a well
designed Teacher Information Format (TIF) as a
separate module
• Details of 12.68 lakh teachers have been uploaded
on the portal.
• Data collected on teachers will be used in the
‘Gurujan’ portal.
• Gurujan – useful in ascertaining the quality of faculty
in an institution.
5
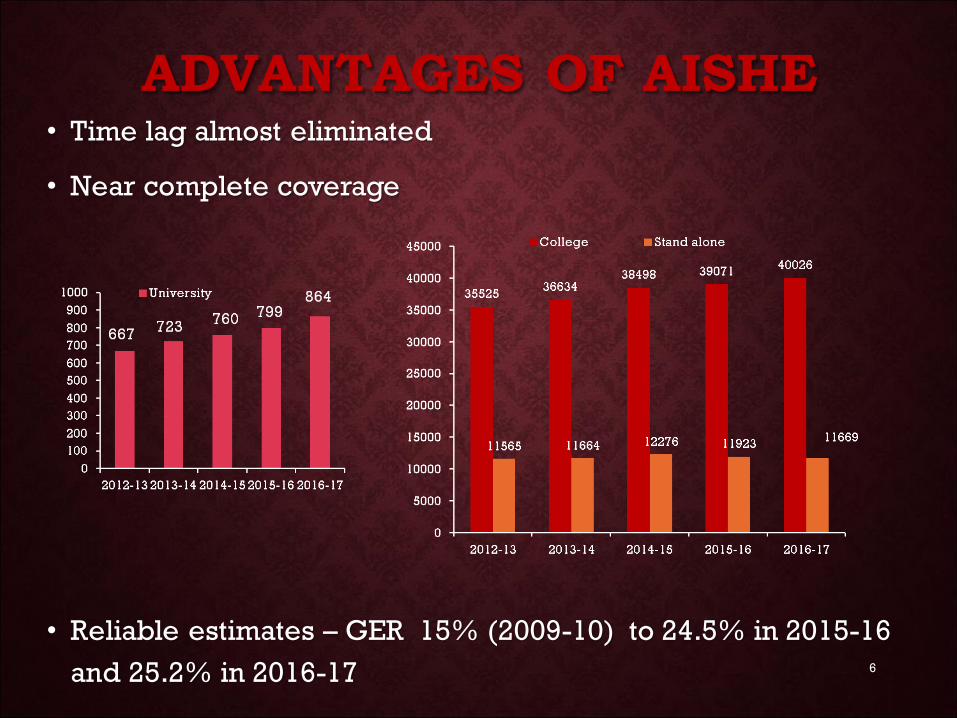
ADVANTAGES OF AISHE • Time lag almost eliminated
• Near complete coverage
• Reliable estimates – GER 15% (2009-10) to 24.5% in 2015-16
and 25.2% in 2016-17
6
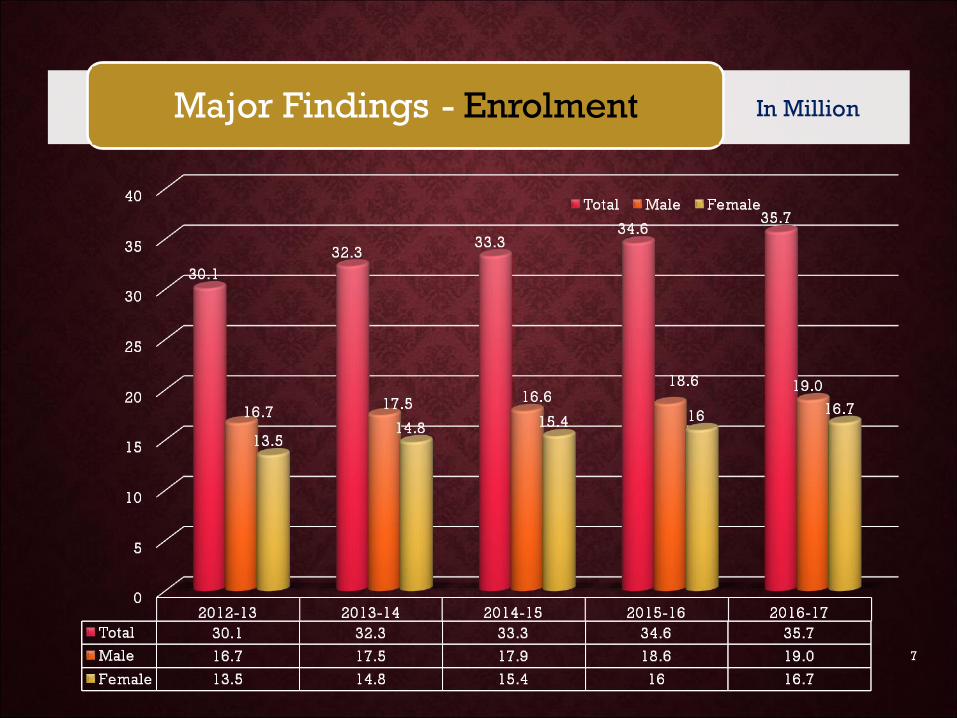
Major Findings - Enrolment In Million
7
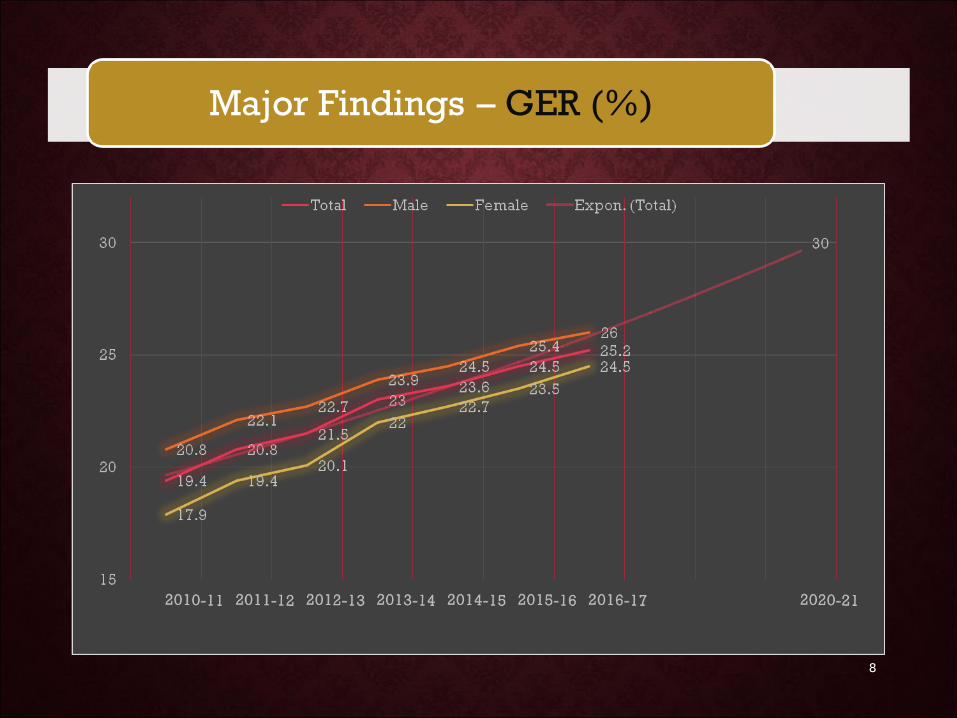
Major Findings – GER (%)
8

GER (%) – SELECTED STATES
States
2012-13 2013-14 2014 -15 2015-16 2016-17
Bihar 13.1 13.0 12.9 14.3 14.4
Odisha 16.3 16.4 17.5 19.6 21.0
Tamil Nadu 42.0 43.0 44.8 44.3 46.9
Maharshtra 22.9 26.3 27.9 29.9 30.2
U.P 19.5 21.6 22.1 24.5 24.9
All India 21.5 23.0 23.6 24.5 25.2
9
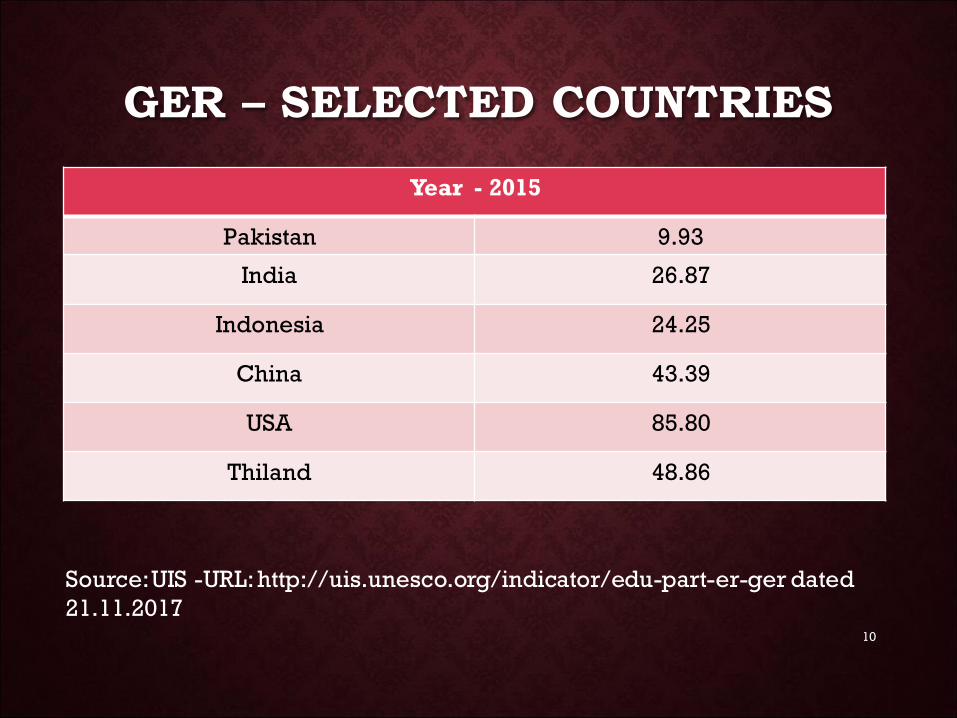
GER – SELECTED COUNTRIES
Year - 2015
Pakistan 9.93
India 26.87
Indonesia 24.25
China 43.39
USA 85.80
Thiland 48.86
10
Source: UIS -URL: http://uis.unesco.org/indicator/edu-part-er-ger dated
21.11.2017

Major Findings - GPI
11
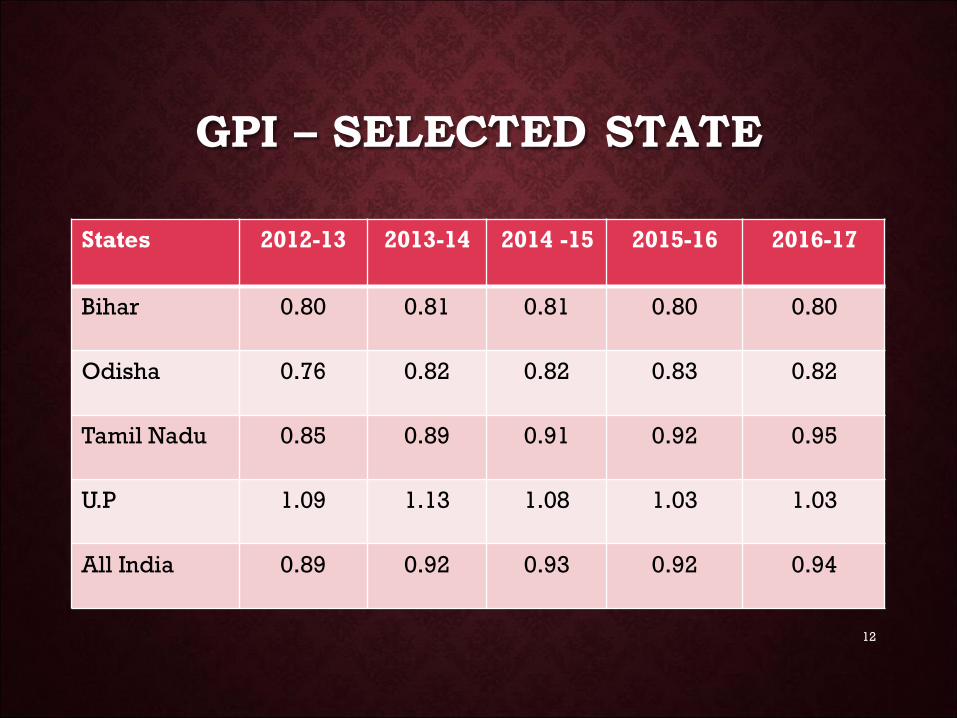
GPI – SELECTED STATE
States
2012-13 2013-14 2014 -15 2015-16 2016-17
Bihar 0.80 0.81 0.81 0.80 0.80
Odisha 0.76 0.82 0.82 0.83 0.82
Tamil Nadu 0.85 0.89 0.91 0.92 0.95
U.P 1.09 1.13 1.08 1.03 1.03
All India 0.89 0.92 0.93 0.92 0.94
12
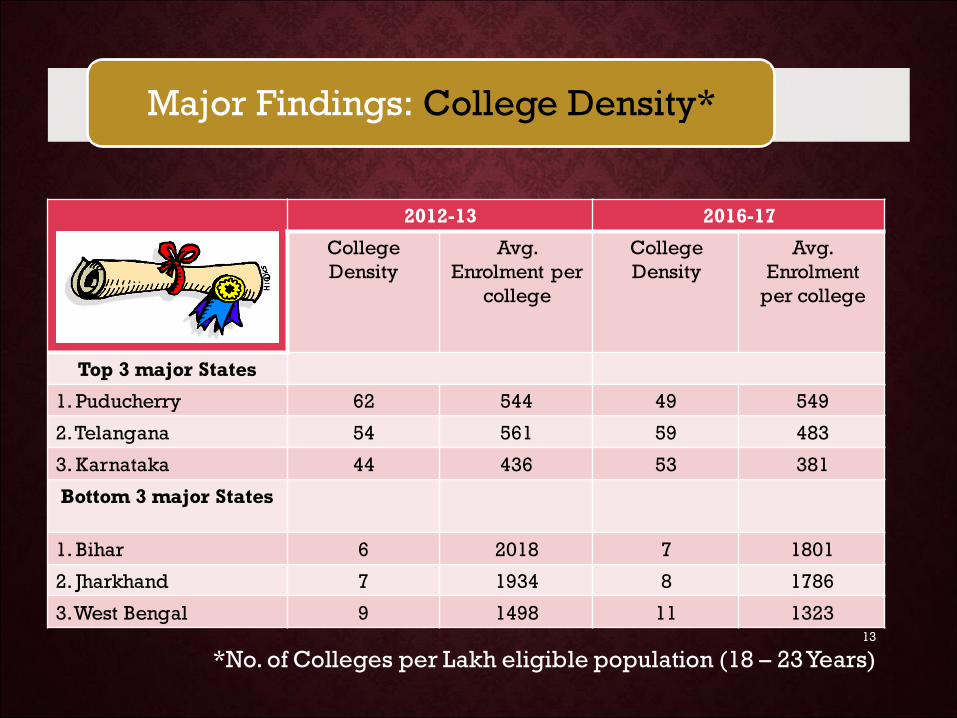
2012-13 2016-17
College
Density
Avg.
Enrolment per
college
College
Density
Avg.
Enrolment
per college
Top 3 major States
1. Puducherry 62 544 49 549
2. Telangana 54 561 59 483
3. Karnataka 44 436 53 381
Bottom 3 major States
1. Bihar 6 2018 7 1801
2. Jharkhand 7 1934 8 1786
3. West Bengal 9 1498 11 1323
*No. of Colleges per Lakh eligible population (18 – 23 Years)
Major Findings: College Density*
13

Results of AISHE 2016-17
Number
14

FOREIGN STUDENTS ENROLMENT
15
• Being used for Know Your College Portal
• Quoted extensively in answering Parliament
Questions
• Researchers / States to make use of AISHE data
• Extensive data use help in improving its quality
USE OF AISHE - Data
16

Thank You
17


