
Allocation of deceased donor kidneys
Phil ClaytonNSW Renal Group
14 June 2012
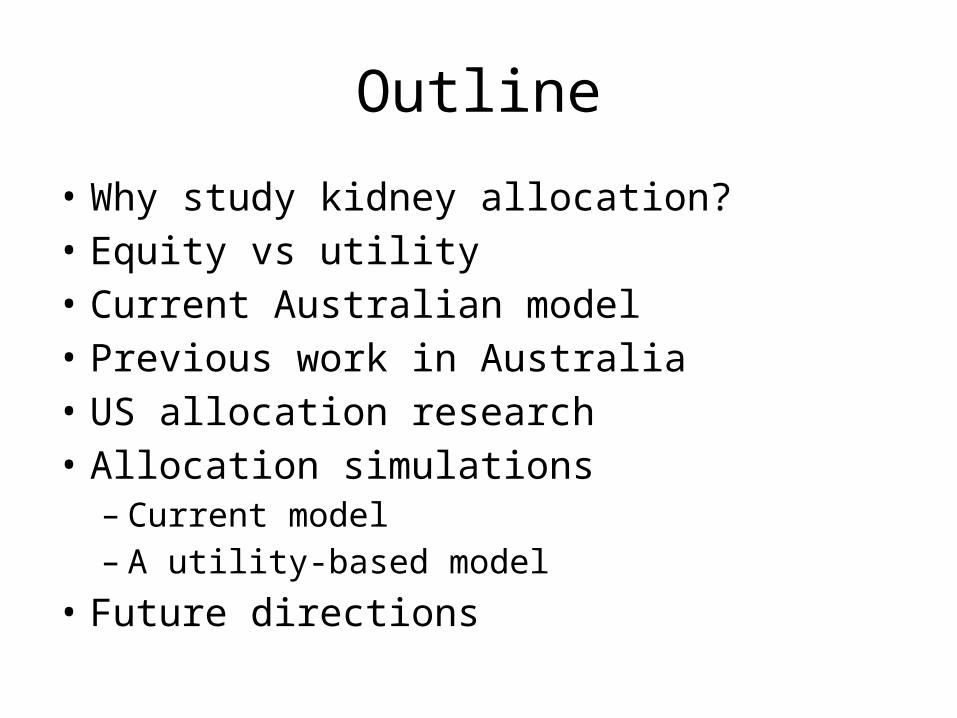
Outline
• Why study kidney allocation?• Equity vs utility• Current Australian model• Previous work in Australia• US allocation research• Allocation simulations
– Current model– A utility-based model
• Future directions

Dialys is patients
Transplants performed
020
0040
0060
0080
0010
000
Cou
nt
1995 2000 2005 2010Year
Australian dialysis patients vs transplants performedDemand vs supply
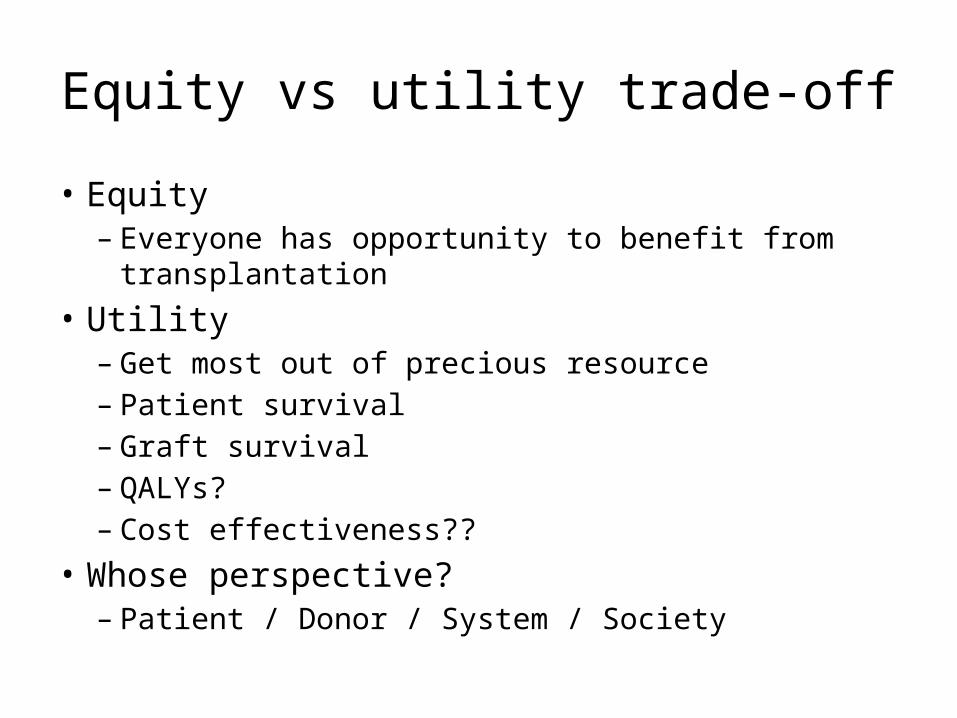
Equity vs utility trade-off
• Equity– Everyone has opportunity to benefit from
transplantation• Utility
– Get most out of precious resource– Patient survival– Graft survival– QALYs?– Cost effectiveness??
• Whose perspective?– Patient / Donor / System / Society
Current Australian model

Current Australian model
• Major listing criteria:– ESKD on dialysis– 80% likelihood of surviving for at least 5 years after
transplantation• Major allocation criteria:
– Blood group Equity/Utility– Waiting time Equity– HLA match Utility– Highly sensitised Equity/Utility– Childhood Utility


NSW formula

Other states
• VIC – HLA-B, -DR, waiting time• SA – HLA-A, -B, -DR, waiting time• QLD – HLA-A, -B, -DR, waiting time, paediatric
status• WA – HLA-A, -B, -DR; HLA-DR homozygous;
waiting time

ABO rulesDonor Recipient Australia NSW VIC SA QLD WA
A A ✔ ✔ ✔ ✔ ✔ ✔A AB ✔ ✔ ✔ ✔ ✔ ✔AB AB ✔ ✔ ✔ ✔ ✔ ✔B AB ✔ ✔ ✔ ✔ ✔ ✔B B ✔ ✔ ✔ ✔ ✔ ✔O A ✖ ✖ ✖ ✔ ✖ ✖O AB ✖ ✖ ✖ ✔ ✖ ✔O B ✖ ✖ ✖ ✔ ✔ ✔O O ✔ ✔ ✔ ✔ ✔ ✔

ABO rulesDonor Recipient Australia NSW VIC SA QLD WA
A A ✔ ✔ ✔ ✔ ✔ ✔A AB ✔ ✔ ✔ ✔ ✔ ✔AB AB ✔ ✔ ✔ ✔ ✔ ✔B AB ✔ ✔ ✔ ✔ ✔ ✔B B ✔ ✔ ✔ ✔ ✔ ✔O A ✖ ✖ ✖ ✔ ✖ ✖O AB ✖ ✖ ✖ ✔ ✖ ✔O B ✖ ✖ ✖ ✔ ✔ ✔O O ✔ ✔ ✔ ✔ ✔ ✔

0.00
0.25
0.50
0.75
1.00
0 5 10 15Years
012
345
6
HLA mismatch
Australian DD grafts 1995-2009Patient survival

0.00
0.25
0.50
0.75
1.00
0 5 10 15Years
012
345
6
HLA mismatch
Australian DD grafts 1995-2009Death-censored graft survival

0.00
0.25
0.50
0.75
1.00
0 5 10 15Years
0-1920-3940-5960-7980-100
Peak PRA
Australian DD grafts 1995-2009Death-censored graft survival

0.00
0.25
0.50
0.75
1.00
0 5 10 15Years
0-2425-34
35-4445-5455-64
65+
Age
Australian DD grafts 1995-2009Patient survival

0.00
0.25
0.50
0.75
1.00
0 5 10 15Years
0-2425-34
35-4445-5455-64
65+
Donor age
Australian DD grafts 1995-2009Death-censored graft survival

010
020
030
040
0Fr
eque
ncy
-100 -50 0 50
Australian DD grafts 1995-2009Age difference (donor minus recipient age)
Old donorsYoung patients
Young donorsOld patients

More benefit from age matching if higher proportion of older donors
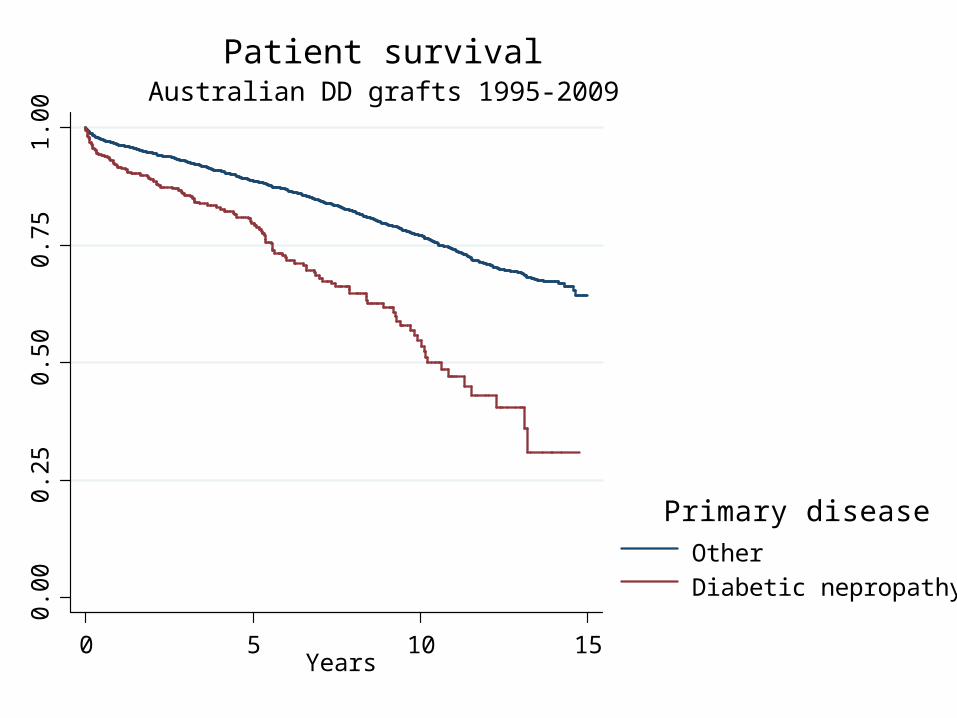
0.00
0.25
0.50
0.75
1.00
0 5 10 15Years
Other
Diabetic nepropathy
Primary disease
Australian DD grafts 1995-2009Patient survival

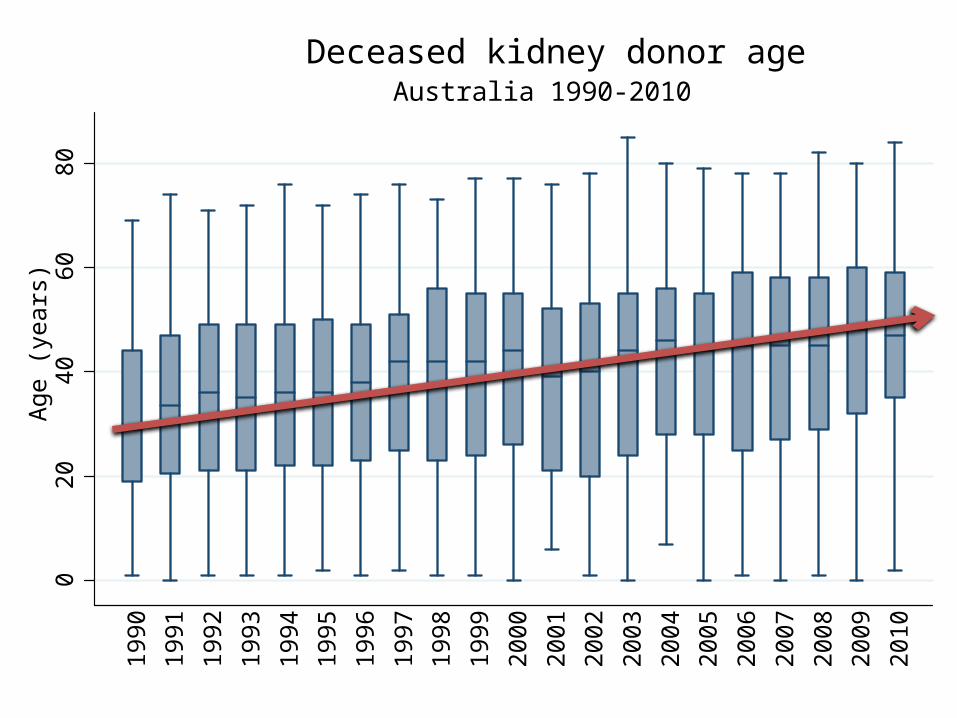
020
4060
80A
ge (y
ears
)
1990
1991
1992
1993
1994
1995
1996
1997
1998
1999
2000
2001
2002
2003
2004
2005
2006
2007
2008
2009
2010
Australia 1990-2010Deceased kidney donor age
020
4060
80A
ge (y
ears
)
1990
1991
1992
1993
1994
1995
1996
1997
1998
1999
2000
2001
2002
2003
2004
2005
2006
2007
2008
2009
2010
Australia 1990-2010Deceased kidney donor age

0
10
20
30
40
50
60
%
1995 2000 2005 2010Ye a r
History of smokingHypertension
Diabetes
3- year m oving aver age
Au s tra l i a n d e c e a s e d k id n e y d o n o rs 1 9 9 3 -2 0 1 0
Donor co-morbidities

0
20
40
60
80
100
%
1995 2000 2005 2010
Ye a r
Brain death, standard criteriaBrain death, expanded criteria
Cardiac death
Au s tra l i a 1 9 9 3 -2 0 1 0
Deceased kidney donor profile

US allocation research
• Extensive modelling and simulations• Proposed algorithm:
– Scores for kidney donors and wait-listed patients– Top 20% kidneys -> top 20% recipients– Other 80% kidneys -> recipients aged within 15
years of donor

Allocation simulations
Waiting list
Donor poolAllocation algorithms
Outcomes• Equity of access• Utility
• Patient survival• Graft survival• ? others
Simulation software

NOMS-ANZDATA link
• NOMS– National database of kidney allocation– Since 2000 (Y2K)– Detailed waiting list data since 28 June 2006– Data extract 2001-2010– Demographics, serology, antibodies, crossmatch
results, organ match results– Probabilistic linkage with ANZDATA

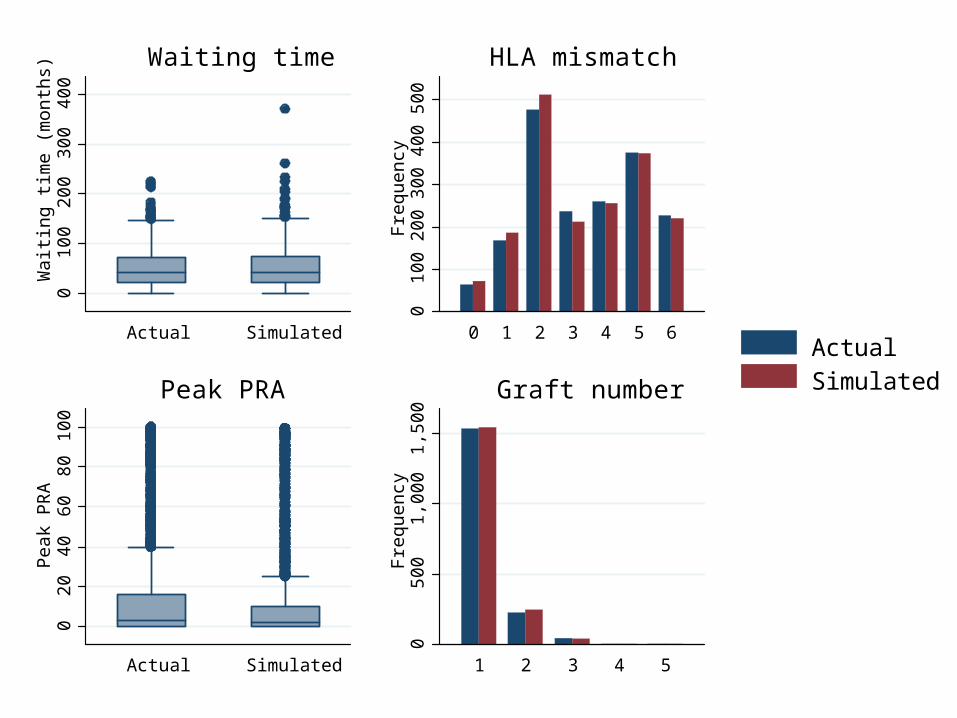
Simulation modelling
• Visit to Ann Arbor, Michigan– Great people– Spring snow (new jacket)– Bad coffee
• Simulation software– Developed for US– Adapted for ANZDATA/ANZOD/NOMS data– Australia allocation rules– Validation against actual allocation

02
04
06
08
0A
ge
(y
ea
rs)
Ac tua l Simulated
Age
05
00
1,0
00
1,5
00
Fre
qu
en
cy
Female Male
Sex0
50
01
,00
01
,50
0F
req
ue
nc
y
Wh i te ATSI As ian Other
Race0
20
040
060
080
01,0
00
Fre
qu
en
cy
GN
Analges ic
Po lyc y s tic
Reflux
Hy pertens io
n
Diabete
s
Other
Uncertain
Primary disease
ActualSimulated
01
00
20
03
00
40
0W
ait
ing
tim
e (
mo
nth
s)
Ac tua l Simulated
Waiting time
01
00
20
03
00
40
05
00
Fre
qu
en
cy
0 1 2 3 4 5 6
HLA mismatch0
20
40
60
80
10
0P
ea
k P
RA
Ac tua l Simulated
Peak PRA0
50
01
,00
01
,50
0F
req
ue
nc
y
1 2 3 4 5
Graft number
ActualSimulated

Actual
State Out In Balance
NSW 92 78 14
VIC 55 58 -3
QLD 44 47 -3
SA 34 44 -10
WA 32 30 2
State balance
Simulated
State Out In Balance
NSW 69 62 7
VIC 68 45 23
QLD 34 54 -20
SA 38 47 -9
WA 27 28 -1
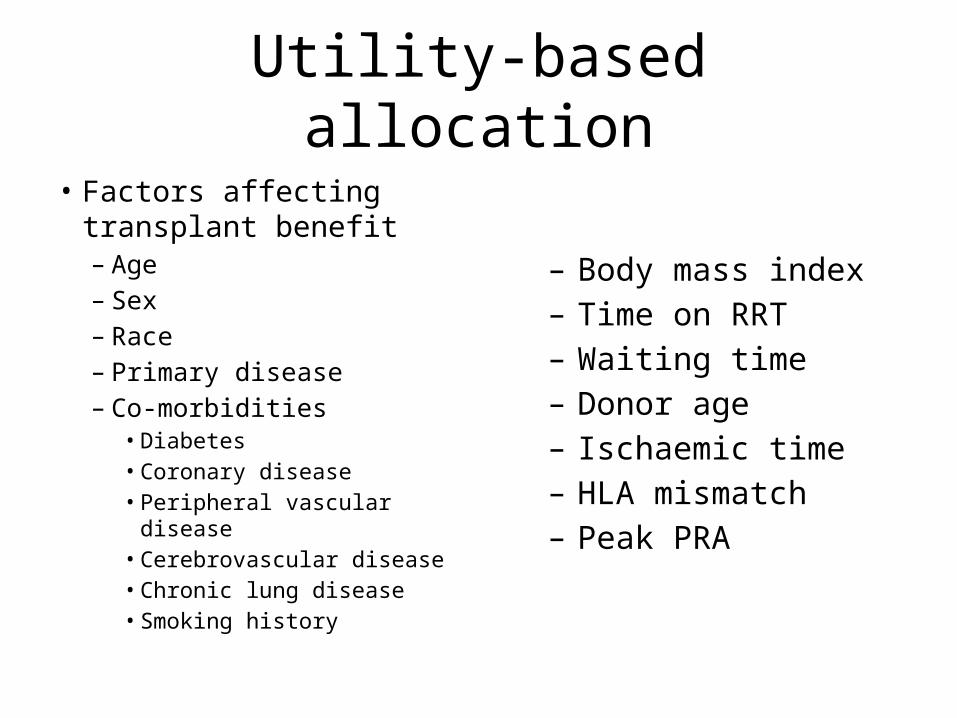
Utility-based allocation
• Factors affecting transplant benefit– Age– Sex– Race– Primary disease– Co-morbidities
• Diabetes• Coronary disease• Peripheral vascular disease• Cerebrovascular disease• Chronic lung disease• Smoking history
– Body mass index– Time on RRT– Waiting time– Donor age– Ischaemic time– HLA mismatch– Peak PRA

Median 12.0 years
0.2
5.5
.75
1P
atie
nt s
urvi
val
0 5 10 15Years
Deceased donor transplant
Age 65, male, white, diabetic nephropathy, overweightProjected survival after deceased donor transplant

Median 5.5 years
0.2
5.5
.75
1P
atie
nt s
urvi
val
0 5 10 15Years
Waiting list
Age 65, male, white, diabetic nephropathy, overweightProjected survival on waiting list

Median benefit 6.5 years
0.2
5.5
.75
1P
atie
nt s
urvi
val
0 5 10 15Years
Deceased donor transplant
Waiting list
Age 65, male, white, diabetic nephropathy, overweightProjected benefit from deceased donor transplant

Median benefit 21.0 years
0.2
5.5
.75
1P
atie
nt s
urvi
val
0 5 10 15 20 25 30 35 40Years
Deceased donor transplant
Waiting list
Age 20, male, white, GN, normal weightProjected benefit from deceased donor transplant

Median benefit 17.6 years
0.2
5.5
.75
1P
atie
nt s
urvi
val
0 5 10 15 20 25 30 35 40Years
Deceased donor transplant
Waiting list
Age 30, male, white, GN, normal weightProjected benefit from deceased donor transplant

Median benefit 14.3 years
0.2
5.5
.75
1P
atie
nt s
urvi
val
0 5 10 15 20 25 30 35 40Years
Deceased donor transplant
Waiting list
Age 40, male, white, GN, normal weightProjected benefit from deceased donor transplant

Median benefit 11.2 years
0.2
5.5
.75
1P
atie
nt s
urvi
val
0 5 10 15 20 25 30 35 40Years
Deceased donor transplant
Waiting list
Age 50, male, white, GN, normal weightProjected benefit from deceased donor transplant

Median benefit 8.4 years
0.2
5.5
.75
1P
atie
nt s
urvi
val
0 5 10 15 20 25 30 35 40Years
Deceased donor transplant
Waiting list
Age 60, male, white, GN, normal weightProjected benefit from deceased donor transplant
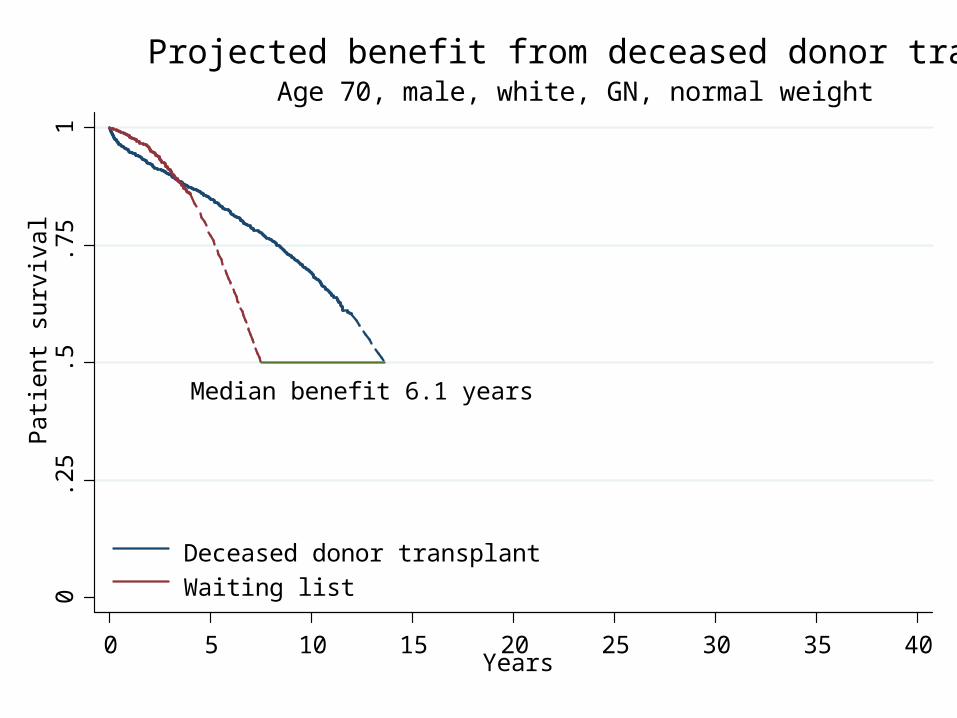
Median benefit 6.1 years
0.2
5.5
.75
1P
atie
nt s
urvi
val
0 5 10 15 20 25 30 35 40Years
Deceased donor transplant
Waiting list
Age 70, male, white, GN, normal weightProjected benefit from deceased donor transplant

Median benefit 3.9 years
0.2
5.5
.75
1P
atie
nt s
urvi
val
0 5 10 15 20 25 30 35 40Years
Deceased donor transplant
Waiting list
Age 80, male, white, GN, normal weightProjected benefit from deceased donor transplant

Utility-based allocation
• Factors affecting transplant benefit– Age– Sex– Race– Primary disease– Co-morbidities
• Diabetes• Coronary disease• Peripheral vascular disease• Cerebrovascular disease• Chronic lung disease• Smoking history
– Body mass index– Time on RRT– Waiting time– Donor age– Ischaemic time– HLA mismatch– Peak PRA
Benefit = 26 – (age/4) - (donor age/20) - (HLA mismatch/3) - (peak PRA/20)

02
04
06
08
0A
ge
(y
ea
rs)
Current Uti l i ty -bas ed
Age
05
00
1,0
00
1,5
00
Fre
qu
en
cy
Female Male
Sex0
50
01
,00
01
,50
0F
req
ue
nc
y
Wh i te ATSI As ian Other
Race0
20
040
060
080
01,0
00
Fre
qu
en
cy
GN
Analges ic
Po lyc y s tic
Reflux
Hy pertens io
n
Diabete
s
Other
Uncertain
Primary disease
CurrentUtility-based

01
00
20
03
00
40
0W
ait
ing
tim
e (
mo
nth
s)
Current Uti l i ty -bas ed
Waiting time
02
00
40
06
00
Fre
qu
en
cy
0 1 2 3 4 5 6
HLA mismatch0
20
40
60
80
10
0P
ea
k P
RA
Current Uti l i ty -bas ed
Peak PRA0
50
01
,00
01
,50
0F
req
ue
nc
y
1 2 3 4 5
Graft number
CurrentUtility-based

Current
Utility -based
010
2030
40Li
fe e
xpec
tanc
y
0 20 40 60 80Age
Current vs utility-based DD allocationLife expectancy by age

Current
Utility -based
Waiting lis t age dis tribution
010
2030
40Li
fe e
xpec
tanc
y
0 20 40 60 80Age
Current vs utility-based DD allocationLife expectancy by age

Obs erv ed Simulated
Current deceased donor kidney allocat ion system
Ut ilit y-based deceased donor kidney allocat ion system
0
100
200
300
400
Liv
ing
do
no
r tr
an
sp
lan
ts
2002 2004 2006 2008 2010
Ye a r
Au s tra l i a 2 0 0 2 -2 0 1 0
Living donor transplantation rate

Current
State Out In Balance
NSW 69 62 7
VIC 68 45 23
QLD 34 54 -20
SA 38 47 -9
WA 27 28 -1
State balance
Utility-based
State Out In Balance
NSW 282 474 -192
Vic 366 340 26
QLD 286 272 14
SA 250 112 138
WA 141 127 14

Future directions
• More sophisticated allocation models• Sensitivity analyses
– Changes in waiting list– Changes in donor pool
• QALYs• Economic analyses

Acknowledgements• ANZDATA
– Blair Grace– Stephen McDonald– Steve Chadban
• NOMS– Jeremy Chapman– Jenni Wright– Paul Slater
• Arbor Research Collaborative for Health– Keith McCullough– Bob Merion– Alan Leichtman
• Australian and New Zealand patients and staff for their cooperation and contributions to ANZDATA and ANZOD


