i
An Empirical Study of IFRS Convergence Effecton Earning Manipulation in Indonesian Companies
UNDERGRADUATE THESIS
Submitted as Partial Requirement to Complete Undergraduate DegreeFaculty of Economics and Business
University of Diponegoro
Submitted by:
ATHUR TEDO BASUNDARA
12030110120111
FACULTY OF ECONOMICS AND BUSINESS
UNIVERSITY OF DIPONEGORO
SEMARANG
2014
ii
THESIS APPROVAL
Author Name : Athur Tedo Basundara
Student Number : 12030110120111
Faculty/ Department : Economics and Business/Accounting
Thesis Title : An Empirical Study of IFRS Convergence Effect
on Earning Manipulation in Indonesian
Companies
Thesis Supervisor : Anis Chariri, SE, MCom, PhD, Akt.
Semarang, 13th March 2014
Supervisor
(Anis Chariri, SE, MCom, PhD, Akt.)
NIP. 196708091992031001
iii
SUBMISSION
Author Name : Athur Tedo Basundara
Student Number : 12030110120111
Faculty/ Department : Economics and Business/Accounting
Thesis Title : An Empirical Study of IFRS Convergence Effect
on Earning Manipulation in Indonesian
Companies
Has been retained and declared in front of the Board of Reviewers on 20th March ,2014 for fulfilling the requirement to be accepted.
Reviews Board :
1. Anis Chariri, S.E., MCom, PhD, Akt. ( )
2. Dr. Darsono, S.E., MBA., Akt. ( )
3. Shiddiq Nur Rahardjo, S.E., M.Si., Akt. ( )
iv
Certificate of Originality
I, Athur Tedo Basundara, hereby certify that this assignment is true and accurate
to be my own work specially written for partial requirement to complete
Undergraduate Program of Accounting and has not initially been presented in any
other occasion. I bear full responsibility for my undergraduate thesis.
March 3rd, 2014
Athur Tedo Basundara
v
PREFACE
First of all, I would like to express my gratefulness to Allah SWT forgiving me health, strength and ability to complete my bachelor thesis. Praise andsalutation are precisely also upon the beloved of Prophet Muhammad SAW hisfamily, his companions, and his followers until the end of the day.
After struggling in a few months full of immense effort, I finallycompleted this thesis entitled: An Empirical Study of IFRS Convergence Effecton Earning Manipulation in Indonesian Companies. However, I realize that allthese process will not running smoothly without help from all related parties.Therefore, with humility and high admiration I would like to thank to:
1. Prof. Drs. Mohammad Nasir, Ph.D., Akt. and all of teachers and staffsfor their knowledge, encouragement and support.
2. Prof. Dr. H. Muchamad Syafruddin., M.Si, Akt. as Chairman of theAccounting Department, Faculty of Economics and Business,University of Diponegoro.
3. Aditya Septiani, SE, M.Si, Akt as author’s trustee in AccountingDepartment, Faculty of Economics and Business, University ofDiponegoro.
4. Anis Chariri, SE., M.Com., Ph.D., Akt as great supervisor whichconstantly encourage, support, guide and giving valuable suggestionsnot only for this thesis but also the life guidance.
5. My beloved parents for the enormous support for everything that I’vedone, encouragement, suggestions and life guidance which makes memotivated to go beyond the limit and gain high bravery to catch all mydreams.
6. My amazing brothers for the priceless time, support, inspiration andmotivation. Without your wise guidance I may ended up nothing.
7. The one and only my precious Benita Ariyani Putri who alwaysaccompany, help, giving advices and fully support in everything that Ido.
8. My best friend Bob, thanks for the brotherhood, house, meal, drinks,bed and everything.
9. My best friend Bangkit for the spirit of competition and motivation.10. All my friends and classmates in Accounting class of 2010, thanks for
the togetherness, kindness, brotherhood and memories.11. All EECC Rangers for all the memories and togetherness.

vi
12. All of my KKN Kedungwuni friends, I hope someday we can realizedwhat we have promised in farewell party. Thanks for the cooperation,memories and experience.
13. My best friends from EDISON Little Project: Cemal, Kandil, Mariana,Maja, Tayna, Lalita, Diego and Jordy. Thanks for the unbelievablejourney, I hope we will meet again someday
14. My superb awesome friends in LIMUN batch 4: Irfan, Godvin, Temi,Vicky, Fafa, Chika, Adis, Wildan and Fadhil. Thanks for togetherness,memories and best experience.
15. All of people who help me in completing this thesis which I cannotmention it one by one. Thank you very much.
I realize that this thesis yet far from perfect. Therefore, I will happilyreceive constructive critics and suggestions. I do hope that this thesis canbe beneficial and useful for everybody who reads.
When you are inspired you get determined, when you aredetermined you’ll going further…….
(Random Advertisement in London, UK)
Semarang, 3rd March 2014
Athur Tedo Basundara
12030110120111
vii
ABSTRACT
This study aimed to obtain empirical evidence about the influence of IFRSConvergence effect towards earning manipulation practices in Indonesia. Todetect earning manipulation this study used Beneish M-Score that was developedby Messod D. Beneish in 1999. This analysis tool used eight variables todetermine the score.
The population of this study was all companies listed in Indonesian StockExchange (IDX) in two periods. Before IFRS period is determined by year 2006and 2007, while the period after IFRS is determined by year 2011 and 2012.Sample consists of all companies which its data is available to be analyzed usingBeneish M-Score. The total sample was 51 companies therefore the total reports is102 reports. Data analysis was performed with normality test and hypothesistesting used Wilcoxon Sign-Rank test. Statistic program in this study used SPSS21.
The results of this study indicated that IFRS Convergence has nosignificant effect to earning manipulation practices in Indonesia in period beforeIFRS and after IFRS in accordance with Beneish M-Score. Implication of thisstudy shows that regulator needs to review IFRS Convergence since there is nosignificant different to previous PSAK in dealing earning manipulation.
Keywords: fraud detection, earning manipulation, IFRS convergence
viii
ABSTRAK
Penelitian ini bertujuan untuk mendapatkan bukti empiris tentang efekkonvergensi IFRS terhadap praktik manipulasi laba di Indonesia . Untukmendeteksi manipulasi laba penelitian ini menggunakan Beneish M - Score yangdikembangkan oleh Messod D. Beneish pada tahun 1999 . Alat analisis ini menggunakan delapan variabel untuk menentukan skor.
Populasi penelitian ini adalah semua perusahaan yang terdaftar di BursaEfek Indonesia ( BEI ) dalam dua periode . Periode sebelum IFRS adalah tahun2006 dan 2007, sedangkan periode setelah IFRS adalah tahun 2011 dan 2012.Sampel terdiri dari semua perusahaan yang datanya tersedia untuk dianalisismenggunakan Beneish M - Score . Jumlah sampel adalah 51 perusahaansehingga jumlah laporan adalah 102 laporan . Analisis data dilakukan dengan ujinormalitas dan pengujian hipotesis digunakan uji statistik Wilcoxon Sign - Rank.Program yang dalam penelitian ini menggunakan SPSS 21 .
Hasil penelitian ini menunjukkan bahwa konvergensi IFRS tidak memilikipengaruh signifikan terhadap praktik manipulasi laba di Indonesia baik diperiode sebelum IFRS manupun sesudah IFRS jika diukur menggunakan BeneishM - Score . Implikasi studi ini menunjukan bahwa regulator harus mereviewKonvergensi IFRS karena tidak ada perbedaan yang signifikan dengan PSAKterdahulu dalam hal penanggulangan manipulasi laba.
Kata kunci : manipulasi laba , konvergensi IFRS , deteksi kecurangan
vii
ix
TABLE OF CONTENTS
Page
TITLE PAGE .................................................................................................................... i
THESIS APPROVAL ........................................................................................................ ii
SUBMISSION ................................................................................................................... iii
CERTIFICATE OF ORIGINALITY ................................................................................. iv
PREFACE .......................................................................................................................... v
ABSTRACT....................................................................................................................... vii
ABSTRAK .......................................................................................................................... viii
TABLE OF CONTENTS................................................................................................... ix
LIST OF TABLES ............................................................................................................. xii
LIST OF FIGURES .......................................................................................................... xiii
LIST OF APPENDIX ........................................................................................................ xiv
CHAPTER I INTRODUCTION
1.1 Background......................................................................................... 1
1.2 Problem Formulation.......................................................................... 7
1.3 Research Objectives .......................................................................... 7
1.4 Contributions of Study........................................................................ 7
1.5 Structure of Study......................................................................................... 8
CHAPTER II LITERATURE REVIEW
2.1 Underlying Theories ..................................................................................... 10
2.1.1 Fraud Triangle Theory ................................................................... 10
2.1.2 Compliance Theory........................................................................ 13
2.1.3 Earning Manipulation .................................................................... 16
x
2.1.4 IFRS Convergence in Indonesia..................................................... 19
2.1.4.1 IFRS ............................................................................. 19
2.1.4.2 The Development of Indonesian GAAP(PSAK) ......... 24
2.1.5 Beneish M-Score............................................................................ 26
2.2 Prior Researches ........................................................................................... 30
2.3 Theoretical Framework................................................................................. 32
2.4 Hypothesis Development.............................................................................. 33
CHAPTER III RESEARCH METHODS
3.1 Research Variables and Operational Definition ........................................... 35
3.1.1 Paired Variable............................................................................... 35
3.1.2 Control Variable............................................................................. 37
3.2 Population and Sample Determination ......................................................... 38
3.2.1 Population ...................................................................................... 38
3.2.2 Sample............................................................................................ 38
3.3 Type and Source of Data .............................................................................. 38
3.4 Data Collection Methods .............................................................................. 39
3.5 Analysis Method........................................................................................... 39
3.5.1 Descriptive Analysis ...................................................................... 39
3.5.2 Normality ....................................................................................... 39
3.5.3 Wilcoxon Signed Rank Test .......................................................... 40
xi
CHAPTER IV RESULT AND ANALYSIS
4.1 Research Object ............................................................................................ 41
4.2 Data Analysis................................................................................................ 42
4.2.1 Descriptive Statistics...................................................................... 42
4.2.2 Normality Test ............................................................................... 52
4.2.3 Wilcoxon Signed Rank Test .......................................................... 53
4.3 Discussion..................................................................................................... 55
CHAPTER V CONCLUSION
5.1 Conclusion .................................................................................................... 58
5.2 Limitations of Study ..................................................................................... 59
5.3 Suggestion for Future Studies....................................................................... 59
5.4 Research Implications................................................................................... 60
BIBLIOGRAPHY
APPENDIX
xii
LIST OF TABLES
Page
Table 2.1 List of Prior Researches .......................................................................... 31
Table 4.1 Population and Sample Research ............................................................ 42
Table 4.2 Beneish M-Score Descriptive Statistics.................................................. 43
Table 4.3 Eight Indexes Descriptive Statistics........................................................ 44
Table 4.4 Indicated Earning Manipulator Companies Before IFRS (2006-2007) .. 46
Table 4.5 Indicated Earning Manipulator Companies After IFRS (2011-2012) .... 47
Table 4.6 Persistent Manipulator Descriptive Statistics ......................................... 49
Table 4.7 Non-manipulator to Manipulator Descriptive Statistics ......................... 49
Table 4.8 Manipulator to Non-manipulator Descriptive Statistics ......................... 50
Table 4.9 Persistent Non-manipulator Descriptive Statistics.................................. 51
Table 4.10 Test of Normality .................................................................................. 52
Table 4.11 Beneish M-Score Ranks........................................................................ 53
Table 4.12 Wilcoxon Sign Rank Test Statistics on Beneish M-Score.................... 54
Table 4.13 Wilcoxon Sign Rank Test Statistics on Eight Indexes.......................... 54
Table 4.14 Benchmarking to the Beneish M-Score Model..................................... 57
xiii
LIST OF FIGURES
Page
Figure 2.1 The Fraud Triangle ................................................................................ 11
Figure 2.2 IFRS Convergence Roadmap in Indonesia............................................ 26
Figure 2.3 Theoretical Framework.......................................................................... 33
xiv
LIST OF APPENDIX
Appendix A Converged PSAK from 2007-2012
Appendix B List of Sample Companies
Appendix C Data of Research Variables
Appendix D Result of SPSS 21 Output
CHAPTER I
INTRODUCTION
1.1 Background
Earning manipulation issue has been seen as a popular issue for the past
20 years. According to Financial Times in 2008 there were three huge cases
related with corporate earning manipulation such as Tyco International whose it’s
CEO Dennis Kozlowski was convicted in 2005 of misappropriating more than
US$400 million, WorldComm whose it’s co-founder and CEO Bernie Ebbers was
convicted in 2005 of the company's false financial reporting caused a subsequent
loss to investors amounting to US$11 billion, and Kenneth Lay as CEO of Enron
cooperation was indicted in 2004 of doing off-balance sheet and financial
reporting earning manipulation that made it’s company coming to downfall with
$3 billion undisclosed loss. Thus phenomenon shows that earning manipulation
issues can be a critical problem or even tear down a company.
In Indonesia, earning manipulation cases are also enormously big. For
instance, in 2001 PT. Kimia Farma (one of the big pharmaceutical companies in
Indonesia) overstated their raw material sales that made their income lower 24.7
% or 32.6 billion rupiah, and then in 2008 Century Bank CEO has manipulated
their financial statement and make the state have to bailout them with total loss
has reached around 9,15trilions rupiah (Cornila, 2009). This example showed that
1
2
the prevention and detection of financial earning manipulation have not been
going well in Indonesia.
Earning manipulation is the part of fraudulent financial statement fraud
that conducted by managers or preparers (Beest, 2009). Managers or preparer
have an intention to provide misleading information to enrich or give benefit for
some particular groups (Blue, 2002). They conducted this unlawful behavior by
searching the cheating loopholes within accounting standard (Blue, 2002).
Accounting standard supposed to be the guidance for the managers to prepare
faithful financial statement for stakeholders. Therefore, in this case accounting
standard is basically important to deter and detect earning manipulation.
From 1973, international community has developed international
accounting standard as international guidelines for companies. International
Financial Reporting Standard (IFRS) through its standard-setting body, the
International Accounting Standards Board (IASB) want to be a single set of high
quality, understandable, enforceable and globally accepted accounting standard
(IFRS Foundation, 2013). In other word, IASB want to develop international
accounting standards which guide companies to give faithful representation in
preparing financial statement.
The adoption of IFRS (International Financial Reporting Standards) has
been widely accepted and adopted by many countries. According to KPMG
progress report in 2008 IFRS has been adopted in 120 countries of the world such
as the European Union, India, Hong Kong, Australia, Malaysia, Pakistan, Russia,
Chile, South Africa, Singapore and Turkey. Furthermore, United States as the
3
country who have high influence in setting the accounting standard (which is U.S
GAAP) also accommodate IFRS in convergence status by resulting convergence
project in 2012 due to the market needs (KPMG, 2012).
Indonesia as one of emerging economy in South-East Asia started to
follow IAS (accounting standard made by IASC) since 1995 but it was accelerated
after G-20 forum. As G-20 member, Indonesia has made agreement in G-20
forum in Washington D.C, November 15th 2008 to converge IFRS and national
accounting standard (SAK). In 2006 IAI (Indonesia Institute of Accountants) has
made a roadmap to accelerate the convergence project. IAI plans to have
convergence project from 2008 to 2012. Recently, according the Head of DSAK-
IAI (Indonesian Financial Accounting Standard Board) on IFRS Regional Policy
Forum, June 5th 2013, IFRS has been completely converged even though the
commitment to enforce is still low.
There are many reasons why IFRS can be widely accepted. According to
IASB the main reason is to enforce comparability in the financial report around
the world and boost the quality of the information. In addition, The Institute of
Chartered Accountants of Scotland in 2006 find that IFRS can also boost
professional judgment, reduce complexity, more represent economic reality and
prevent earning manipulation or dishonest practice.
Some prior researches found optimistic evidence that IFRS can actually
deter earning manipulation. For instance, IFRS proved successfully deter the
earning manipulation in European Union (Aubert & Grudnitski,2012) (Ballas,
Skoutela, & Tzovas, 2010) (Verriest, Gaeremynck, & Thornton, 2010). In other
4
word, IFRS has potentials to deter earning manipulation not only in theoretical
side but also in practical way.
On the other hand, there are some researchers who oppose the use of
IFRS regarding to earning manipulation. First is from professional judgment
element. This element will be present to vary degrees in all of possible types of
financial statement earning manipulation schemes, which are aimed at deceiving
parties that rely on financial statements (Cancino, 2010). Second, from the
practical side there are a different of results regarding to the IFRS and earning
manipulation. Earning manipulation has intensified since the adoption of IFRS in
Europe with sample of non-financial firms listed on 11 EU stock markets (Calao
& Jarne, 2010). Furthermore, on his research Beest (2010) said that:
“These results suggest that changing the discretion in accounting standards mayaffect the nature of earnings manipulation, but is unlikely to prevent earningsmanipulation applications.”
On the other word, Beest (2010) found that actually IFRS is not preventing
earning manipulation but only the natures.
Thus pros and cons about the connection between IFRS and earning
manipulation are inconclusive. First, thus researches did not compare same
industries which make significant deviance in results. Second, there are still
limited empirical studies about the connection between IFRS and earning
manipulation in developing countries. Whereas, accounting standards in
developing markets are typically different from those of developed markets,
which make it harder for investors to judge the true performance of a firm in a
5
developing financial market and thus make rational investment decision ( Ismail et
al, 2013) .
This research is focused on providing an empirical study between IFRS
and earning manipulation with sample from all companies both from financial
institution or non-financial institution that listed in Indonesian Stock Exchange
(IDX) Indonesia using Beneish financial ratio or well-known as Benesih M-Score.
Beneish M-Score was introduced by Messod D. Beneish back in 1999.
Beneish M-Score represents the model’s variables to capture either the effects of
manipulation or precondition that may prompt firms to engage in earning
manipulation (Beneish, 1999). This model consist of the combination of eight
ratios that capture either financial statement distortions that can result from
earning manipulation which are DSRI ( Day Sales in Receivables Index), AQI
(Asset Quality Index), DEPI (Depreciation Index) and TATA (Total Accruals to
Total Assets) or indicate a predisposition to engage in earning manipulation which
are GMI (Gross Margin Index), SGI ( Sales Growth Index), SGAI (Sales General
and Administrative Expenses Index) and LEVI (Leverage Index) (Voisin, 2012).
The ratios which are capture financial statement distortions have the
specific explanation. The predictive ratios focusing on financial distortions
capture unusual accumulations in receivables (DSR, indicative of revenue
inflation), unusual expense capitalization and declines in depreciation can be seen
from AQI and DEPI which indicate expense deflation (Beneish, 1999). TATA can
show the cash profit which is the extent of accounting profits (Beneish, 1999).
6
Furthermore, the other indexes that can indicate a predisposition to
engage in earning manipulation is also have certain explanation. GMI and SGAI,
both are signals of declining prospects which are suggest propitious condition for
manipulation deteriorating gross margins and increasing administration costs
(Beneish, 1999). While the increasing firm’s financial risk and likelihood of
earning manipulation related to debt agreement constraints can be seen from SGI
and LEVI. SGI shows the high sales growth indicates incentive to manipulate
earnings to make it possible to raise capital and LEVI which shows reliance of
debt financing (Beneish, 1999).
Based on number of researches, Beneish M-Score most likely can predict
and identify earning manipulation in promising probability whether from
researchers (Voisin, 2012) (Warshavsky, 2012) (Fridson, 2002) or professionals
(Ciesielski, 1998) (Merril Lynch, 2000) (Wells, 2001). The M-Score has been
shown to correctly identify 76% of manipulators on an out of sample basis
(Voisin, 2012). For instance, there is a report that this ratio was used by Cornell
University student to identify Enron as an earning manipulator back in 1998,
before the firm’s shenanigans were exposed (Voisin, 2012). In other word,
Beneish M-Score has the capacity to designate and envisage earning manipulation
which may work in Indonesian companies. In brief, this study aims to test the
effect of IFRS adoption to Indonesian companies using indexes from Beneish M-
Score which are DSRI,AQI,DEPI,TATA, GMI, SGI, SGAI and LEVI as single
index or as formula.
7
1.2 Problem Formulation
Previous researches have shown evidences of adopting IFRS in a
developed country comes vary but when it comes to developing country there are
still few studies to investigate the use of IFRS in dealing with earning
manipulation.
The adoption of IFRS may provide different results between developing
countries and developed countries. The differences in culture and business
environment are so vast that cause different understanding, usefulness and
enforcement (Prather-Kinsey, 2006). Therefore researcher want to provide an
empirical study of IFRS related with earning manipulation in developing country
through question:
- Does IFRS Convergence have impact on earning manipulation in Indonesia?
1.3 Research Objectives
This research is intended to provide an empirical study about relation
between IFRS and earning manipulation in Indonesia.
1.4 Contributions of Study
Contribution of this study is based on background, problem formulation
and research objectives. There are several contributions, such as:
1. For researchers, the result of this study is expected to give contribution on
IFRS study and forensic accounting study especially in earning manipulation.
8
2. For the management of the companies, the result of this study is expected to
give prevention and warning when prepares financial statement.
3. For the standard setter, the result of this study is expected to give empirical
evidence and consideration when prepare and converge IFRS with national
accounting standard.
4. For investors, the result of this study is expected to give a warning and
consideration when they do investment.
5. For society, the result of this study is expected to give knowledge in order to
control the corporate behavior in doing dishonest practice.
1.5 Structure of the Study
CHAPTER I : INTRODUCTION
This chapter consists of background, problem formulation, research objectives and
purposes, and the structure of this research.
CHAPTER II : LITERATURE REVIEW
This chapter consists of theories that formed from the basic of this study such as
fraud triangle theory, compliance theory, and other concepts that relevance with
this research. In addition to explain the theory and the relevant concepts, this
chapter also explains the previous researches and the hypothesis development.
9
CHAPTER III : RESEARCH METHODS
This chapter describes about research design, type and source of data, data collect
method, research object and data analysis. This research is quantitative approach
with regression analysis using SPSS 21.
CHAPTER IV : RESULT AND ANALYSIS
This chapter explains about the research object, data analysis that consists of
descriptive statistic, the goodness fit of the model, hypothesis test result and
interpretation of results.
CHAPTER V : CONCLUSION
This chapter consists of conclusion that can be drawn from the analysis result,
research implications, the limitations of the study and suggestions for future
research.
10
CHAPTER TWO :
LITERATURE REVIEW
2.1 Underlying Theories
2.1.1 Fraud Triangle Theory
Many researchers use fraud triangle theory to identify the factors that
cause someone to commit occupational fraud (Dorminey et al, 2010) (Cancino,
2010) (Blue, 2002) (Auditor of Public Accounts, 2011). Moreover, identifying
factors is really important to evaluate which part of company’s element that
needed attention in order to create prevention and detection of fraud (Dorminey,
2010).
The concept of the Fraud Triangle was originally developed by American
criminologist and sociologist Donald R Cressey. This theory identify there are
three elements why fraud happened which are pressures, rationalization and
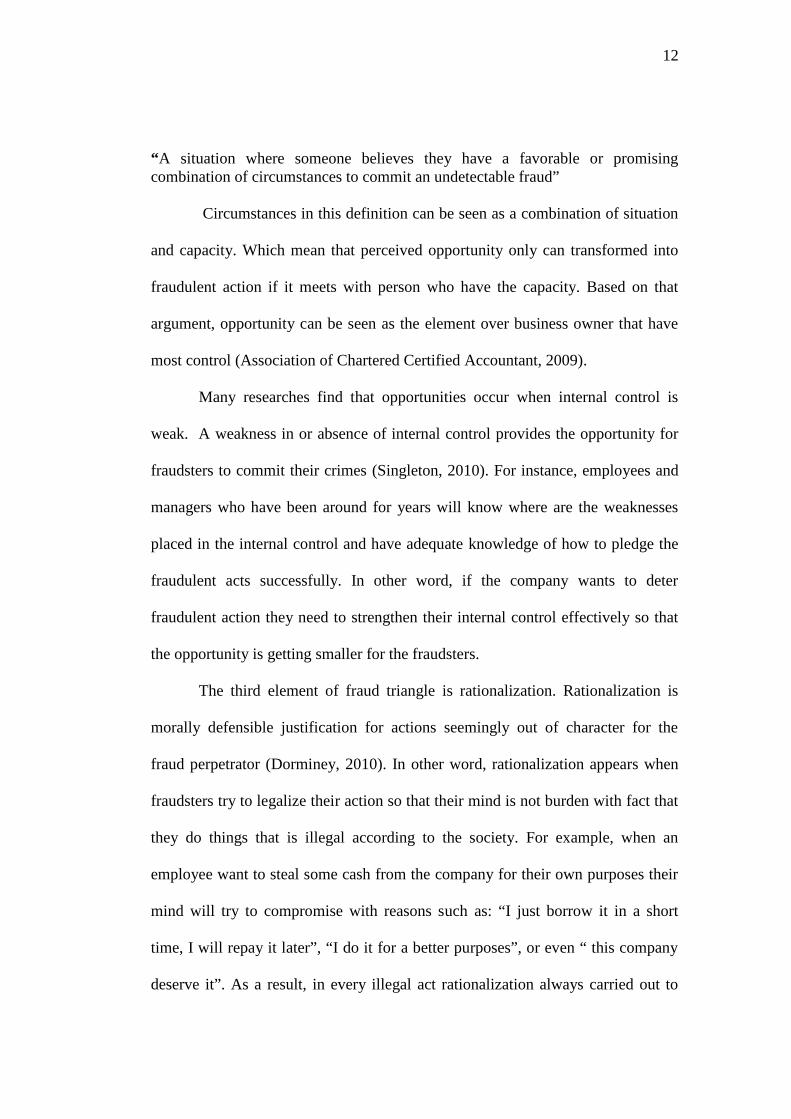
opportunities (Singleton, 2010). While Fridson (2002) defined fraud triangle as
follow:
“Fraud triangle is convergence of perceived pressure, perceived opportunity, andrationalization to facilitate fraud.”
In other word, fraud triangle has three elements which are pressure, opportunity
and rationalization.
11
Opportunity
Pressure
Rationalization
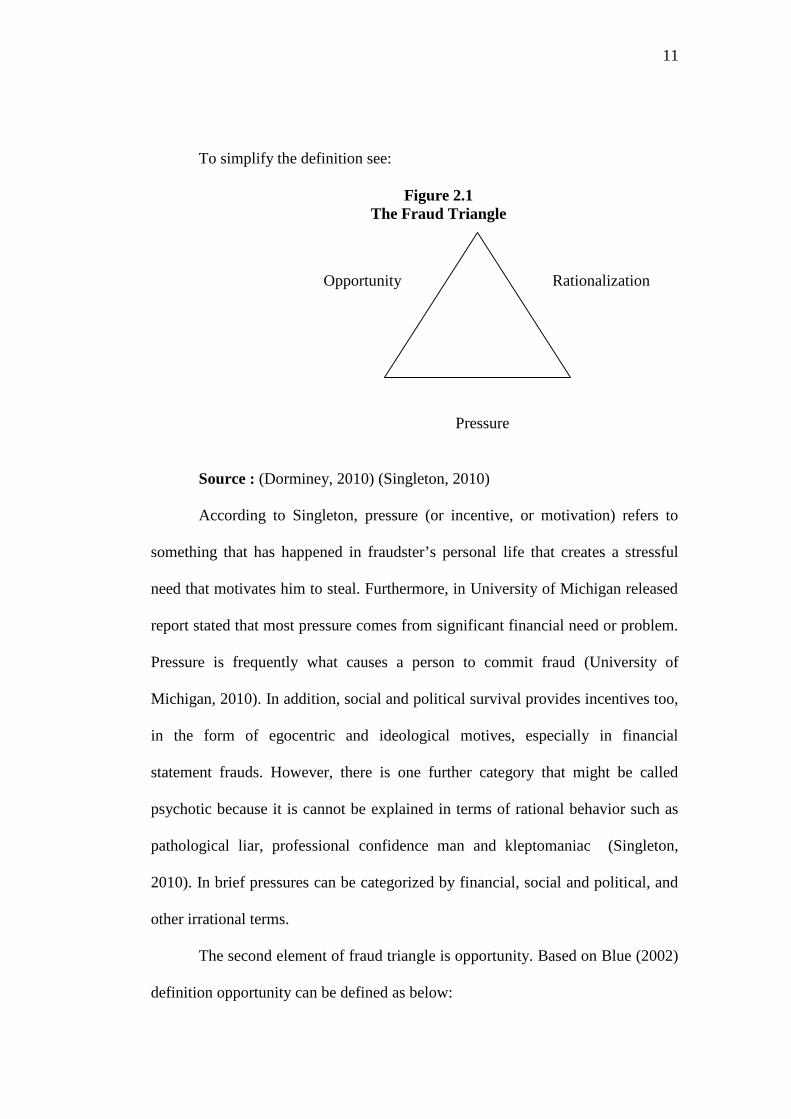
To simplify the definition see:
Figure 2.1The Fraud Triangle
Source : (Dorminey, 2010) (Singleton, 2010)
According to Singleton, pressure (or incentive, or motivation) refers to
something that has happened in fraudster’s personal life that creates a stressful
need that motivates him to steal. Furthermore, in University of Michigan released
report stated that most pressure comes from significant financial need or problem.
Pressure is frequently what causes a person to commit fraud (University of
Michigan, 2010). In addition, social and political survival provides incentives too,
in the form of egocentric and ideological motives, especially in financial
statement frauds. However, there is one further category that might be called
psychotic because it is cannot be explained in terms of rational behavior such as
pathological liar, professional confidence man and kleptomaniac (Singleton,
2010). In brief pressures can be categorized by financial, social and political, and
other irrational terms.
The second element of fraud triangle is opportunity. Based on Blue (2002)
definition opportunity can be defined as below:
12
“A situation where someone believes they have a favorable or promisingcombination of circumstances to commit an undetectable fraud”
Circumstances in this definition can be seen as a combination of situation
and capacity. Which mean that perceived opportunity only can transformed into
fraudulent action if it meets with person who have the capacity. Based on that
argument, opportunity can be seen as the element over business owner that have
most control (Association of Chartered Certified Accountant, 2009).
Many researches find that opportunities occur when internal control is
weak. A weakness in or absence of internal control provides the opportunity for
fraudsters to commit their crimes (Singleton, 2010). For instance, employees and
managers who have been around for years will know where are the weaknesses
placed in the internal control and have adequate knowledge of how to pledge the
fraudulent acts successfully. In other word, if the company wants to deter
fraudulent action they need to strengthen their internal control effectively so that
the opportunity is getting smaller for the fraudsters.
The third element of fraud triangle is rationalization. Rationalization is
morally defensible justification for actions seemingly out of character for the
fraud perpetrator (Dorminey, 2010). In other word, rationalization appears when
fraudsters try to legalize their action so that their mind is not burden with fact that
they do things that is illegal according to the society. For example, when an
employee want to steal some cash from the company for their own purposes their
mind will try to compromise with reasons such as: “I just borrow it in a short
time, I will repay it later”, “I do it for a better purposes”, or even “ this company
deserve it”. As a result, in every illegal act rationalization always carried out to
13
make a view of illegal act as acceptable, thus preserving his self-image as
trustworthy person (Auditor of Public Accounts : Commonwelath of Virginia,
2011).
From those three elements, there is only one element that can be easily
controlled by company which is opportunity element. Rationalization and pressure
are not readily observable characteristic, because it’s impossible to see what
someone may be thinking (Dorminey, 2010). On the contrary, opportunity can be
easily to observe based on the performance of internal auditor (Dorminey, 2010).
The fraud triangle theory is relevant to this research. IFRS as new
accounting standard provide guidelines for the company to prepare financial
statement. This standard will affect three elements of fraud triangle because it is
related with company behavior, specifically management behavior, how they
prepare financial statement according to IFRS.
2.1.2 Compliance Theory
Compliance has a various definitions according to terms that supported by
number of researchers. In psychology, compliance refers to a response
specifically, a submission made in reaction to a request (Cialdini & Goldstein,
2003). The influence resulted from its reaction mostly centered on social behavior
which defined as the effect that the words, actions, or mere presence of other
people have on our thoughts, feelings, attitudes, or behavior, social influence is
the driving force behind compliance (Cialdini & Goldstein, 2003). Where in terms
of regulatory compliance, compliance defines as conforming to a rule, such as a
specification, policy, standard or law (Silveira et al, 2012). Moreover, regulatory
14
compliance describes the goal that corporations or public agencies aspire to
achieve in their efforts to ensure that personnel are aware of and take steps to
comply with relevant laws and regulations (Silveira et al, 2012). Accordingly, this
scope of compliance is focusing more on organizational/ corporation rather than
individual behavior. Therefore compliance definition in terms of regulation is
more relevant to be discussed since this research identifies company’s behavior.
The relation between compliance with company’s behavior has a
significant linkage. According to Lunenburg (2012) organizations can be
classified by the type of power they use to direct behavior of their members and
the type of involvement of the participants. In most organizations, types of power
and involvement are related in three predictable combinations: coercive-
alienative, ulitarian-calculative, and normative-moral but a few organizations may
combine two or even all three types (Etzioni, 1975).
According to Etzioni (1975), when an organization employs coercive
power, participants usually react to the organization with hostility, which is
alienative involvement. Utilitarian power usually results in calculative
involvement; that is, participants desire to maximize personal gain. Finally,
normative power frequently creates moral involvement; for instance, participants
are committed to the socially beneficial features of their organizations.
Some organizations employ all three types of power, but mostly tend to
emphasize only one, relying less on the other two (Etzioni, 1975). Power
specialization occurs because when two types of power are emphasized
15
simultaneously with the same participant group, they tend to neutralize each other
(Lunenburg, 2012).
In order to achieve expected compliance, an organization must identify
their power and involvement. However, if they are not identifies their power and
its involvement it may cause disobedience. For instance, some teachers’ unions
use both utilitarian and normative power to gain compliance from their members.
Nevertheless, school officials who attempt to use types of power that are not
appropriate for the environment can reduce compliance. Schools tend to be
normative organizations. According to this logic, oppressive use of coercive and
utilitarian power with teachers and students can be dysfunctional (Lunenburg,
2012).
As explained above, company can be identified as ulitarian-calculative
combination. In this term, calculative involvement refers to the orientation of a
company to an object, characterized in terms of intensity and direction shaped as
desire to maximize corporate objectives.
Nowadays, the relation between compliance and corporate objectives has
been realized as important points. According to Nordea (2002) in PwC (2002):
“The compliance function strengthens the principles of conducting business inaccordance with all applicable law, rules, codes and standards required byregulators, respecting the principles of integrity and fair dealing at all times,which is essential for the Group.”
Furthermore, good compliance can enhance reputation through improved
services and efficient implementation of new business initiatives (Nordea, 2002).
In other word, reputation and trustworthiness are points that concerned by
16
management to enhance corporate value, whereas higher corporate value will
maximize profit and others corporate goals. There are many countries, mostly in
Europe, which already realized that compliance as a key component of successful
business proved by availability of specific regulatory requirement for investment
firm and banking such as: Belgium, Germany, France, Italy, Poland, Sweden,
United Kingdom (Pricewaterhouse Coopers, 2002). In addition, compliance has
also been seen to enhance the practice of good corporate governance
(Pricewaterhouse Coopers, 2002). In short, by comply regulations, corporate can
maximize its objectives.
The relevance of theory regarding to this research is to explain the result of
corporate behavior when they comply new accounting standard IFRS. IFRS
demand full compliance of the corporate to ensure high quality accounting in
delivering accounting information for stakeholders. As global accounting
standard, the development of IFRS adoption has been widespread across the world
due to its advantages, mainly to ensure comparability. This phenomenon may
calculated by corporate and the react to this rule which consequently change its
behavior. In short, IFRS may affect corporate behavior towards the need of
compliance.
2.1.3 Earning Manipulation
Earning manipulation may be categorized as part of fraud action. This
definition supported by Shah (2006) classification of fraud. This classification
classifies fraud into three categories, which are corruption, asset misappropriation
and fraudulent financial statement. Further, Warzhavsky (2010) stated that
17
fraudulent reporting can result from distorted records, falsified transactions, or
misused accounting principles. Therefore earning manipulation is part of
fraudulent financial statement which is categorized as fraud.
However there are mixed definition between earning manipulation and
earning management among researchers. Strobl (2012) defines earning
management as earning manipulation because there is similar act of management
which produces financial statement which is not correspond economic reality. On
the contrary, Chen (2006) proposes earning management as prevalent act in
certain level of flexibility that permit by GAAP. Since GAAP-compliant earning
management is acceptable and lawful, most executives manage their companies’
earnings to achieve specific objectives such as sustaining firm value while earning
manipulation is excessively aggressive approaches to inflating profitability and
firm value in the form of channel stuffing, premature revenue recognition and
measurement abuse that becomes unlawful behavior. This definition is supported
by Thomson (2005) that stated there are 12 popular techniques to manage earning
which is considerably legal by GAAP. In other word, earning manipulation is the
excessive unlawful approaches from earning management or illegal earning
management. Therefore, in order to observe how the work of earning
manipulation in company, we can identify the methods of earning management
initially.
Based on Scott (2011), there are two methods how earning management
works in a company either changes on the accrual process or the deviation from
18
normal business activity. Those methods often called by AEM (Accrual-based
Earnings Management) and latter REM (Real Earnings Management).
Roychowdhury (2006) defines REM as departures from normal
operational practices, motivated by managers’ desire to mislead at least some
stakeholders into believing certain financial reporting goals which have been met
in normal course of operations. Level of REM methods, such as reduction of
discretionary expenditures and price discounts, can still considerably legal and can
be called optimal actions as long as it is represent economic circumstances.
Nevertheless, if manager put these activities more extensively than is normal
given their economic circumstances, with the objective of meeting an earning
target, they are engaging in real activities manipulation (Roychowdhury, 2006). In
brief, when REM aggressively conducted more than economic circumstances it
will be considered as earning manipulation.
AEM can be defined as the selection of accounting policies to achieve
desire financial reporting result (Li et al, 2011). They are the amount of income
and expenses that were created in a specific period due to the economic activities
of a firm and are accrued and depicted in specific accounts. Total accruals are
equal to the difference between net income and operating cash flows (De Fond &
Jiambalvo 1992).
Total accruals are divided in two parts; discretionary and non-discretionary
accruals. Discretionary are the normal accruals that are used to show the economic
effects of the business activity a firm is involved in. Non-discretionary is the
abnormal accruals and is used as a replacement for earnings management; it is
19
often managers use discretionary accruals to manipulate earnings. Cancino (2010)
describes discretionary accruals as adjustments to cash flows selected by the
manager; he has the option to choose from generally accepted procedures that are
rationalized to the GAAP requirements such as methods of depreciation for long-
lived assets. Accruals modify the timing of reported earnings; consequently
discretionary accruals give the ability to managers to transfer earnings between
periods (Strobl, 2012). This leads to a form of earnings management, which is
called income smoothing. Income smoothing is the reduction of fluctuations in the
series of reported earnings (Dorminey, 2010).
These manipulations are considered legal as long as it is not violating
GAAP even if it is unethical for being opportunistic. On the other hand the
manipulation will be considered as illegal if it is violates GAAP and make the
stakeholder take the wrong decision.
2.1.4 IFRS Convergence in Indonesia
2.1.4.1 IFRS
IFRS stands for International Financial Reporting Standards. IFRS is a
guideline of an international accounting in which to manage and report financial
information that developed by IASB (International Accounting Standard Board)
and its predecessor IASC (International Accounting Standard Committee).
Its forerunner the International Accounting Standards Committee (IASC)
was shaped in 1973 and developed International Accounting Standards (IAS) for
27 years; its argumentative statement was that the new international standards that
released must be capable of rapid acceptance and implementation world-wide
20
(IFRS Foundation, 2013). The IASC was reorganized and swap the International
Accounting Standards Board (IASB) in 2001. The new accounting standards
released by the new organization are named IFRS, with the first one being
available on June 2003 (IFRS 1: First-time Adoption of International Financial
Reporting Standards). IASB has important focus on developing a single set of
high quality standards to promote global accounting harmonization (KPMG,
2012).
New conceptual framework is design by IASB which is IFRS. The
framework is used as guidelines, based on which new IFRS are developed and
current is revised. Furthermore, it helps management extend and apply a proper
accounting policy using judgment, in the case that an existing Standard or an
Interpretation does not resolve a specific transaction (Calao & Jarne, 2010). The
conceptual framework contain the objective of financial statements, the qualitative
characteristics of useful financial information, the definition, recognition and
measurement of the elements from which financial statements are constructed,
concepts of capital and capital maintenance. (IFRS Foundation, 2013) According
to the framework, the purpose of financial statements is to provide information
about the financial position, performance and changes in financial position of the
reporting entity. Its main users are existing or potential investors and creditors of
the firm. The financial statements published under IFRS are the balance sheet,
income statement, statement of recognized income and expense or a statement of
all changes in equity, statement of cash flows and notes including accounting
policies (KPMG, 2012)
21
The basic qualitative characteristics of useful financial information are:
(IFRS Foundation, 2013)
1) Relevance when it can make a divergence in the decisions made by users
and faithful representation which means that it must have predictive or
confirmatory value, or both.
2) Faithful representation when it represents the economic circumstances it
purports to represent; this leads to completeness, neutrality and freedom from
error.
Financial information must have also some characteristics that improve its quality
(IFRS Foundation, 2013):
1) Comparability, means that the information can be compared with similar
information from other economic entities or the same entity but from
another period
2) Verifiability, which means that different observers can reach harmony that
an economic phenomena is faithfully portrayed through IFRS
3) Timeliness, which means in time availability of information for decision-
making
4) Understandability which means that certain knowledge of business and
economics is easy to absorb by users.
Financial statements are assembled by particular elements relating to the
financial position of an entity which is represent in the balance sheet such as
assets, liabilities and equity of the company, and income and expenses are related
to the performance of the firm and are represented in the income statement. These
22
elements are identified in the financial statements when they satisfy two criteria; it
is probable that future economic benefit related to the item will flow to the
enterprise; and the item's cost or value can be measured reliably. For measurement
tools, IFRS are using historical cost, current cost and the net realizable value
method (The Institute of Chartered Accountants of Scotland, 2006)
In the globalized economic environment of today use widespread
accounting language is also the most efficient method of communicating business
information (Calao & Jarne, 2010). Currently, IFRS are adopted by almost 120
countries around the world. Furthermore, some countries will adopt them such as
EU, UK and Hong Kong and others have plans to converge their local accounting
principles with IFRS in the future such as Indonesia, United States and Brazil
(PwC, 2011). Moreover, all of the listed enterprises and in some cases unlisted
enterprises are obliged to prepare and distribute their financial statements
according to IFRS in these countries. Consequently, IFRS have hugely
contributed to uniformity in financial reporting in a global scale. This can be
useful for investors who seek information in financial statements in order to make
investment decisions. Comparison between companies is also easier when they
use the same accounting rules. Furthermore, multinational enterprises with
subsidiaries in countries that use IFRS can use one accounting language which
lowers the cost of information (Ballas et al, 2010). Reporting under common
accounting rules puts pressure to managers to report reliable information and use
less earnings manipulation, since supervising and comparing financial reports
across borders is now easier (Chen, 2006).
23
IFRS are considered principle based accounting standards differ to US
GAAP that is rule based. This means that for similar transactions under IFRS,
different interpretations may be given (KPMG, 2012). Principles-based
accounting standards refer to fundamental understandings that inform transactions
and economic events (Ballas et al, 2010)
Rules based accounting standards is a system of financial reporting that
has very extensive and precise elaborations concerning what is or is not allowed
(The Institute of Chartered Accountants of Scotland, 2006). After the accounting
fraud scandals of Enron and WorldCom, a change is made in the direction of the
use of principle accounting standards in the USA. The Sarbanes-Oxley act
imposes that the SEC should redesign US GAAP according to accounting
principles rather than rules.
The important difference between the two types of standards is the degree
of professional judgment needed to determine how a transaction will be recorded;
principles based standards involve a bigger use of judgment. (The Institute of
Chartered Accountants of Scotland, 2006). For instance, the fair value was
introduced by IFRS initially. According to IAS 16, fair value is the amount for
which an asset could be exchanged or a liability settled between knowledgeable,
willing parties in an arm’s length transaction (KPMG, 2012). IAS 36 Impairment
of assets imposes a review of assets including intangible assets with an indefinite
useful life for impairment and measurement of recoverable amounts on an annual
basis. Impairment losses are recorded as expense in income statement. (IFRS
Foundation, 2013) IAS 38 Intangible assets, requires the recognition of an
24
intangible asset like goodwill in the balance sheet, if its cost can be determined
accurately and future advantages are expected from it by the company. (KPMG,
2012). IFRS 3 Business combinations, allows only the purchase method for
business combinations. (IFRS Foundation, 2013) All particular assets and
liabilities are valued at fair value. These changes are probable to increase the level
of information of IFRS earnings and book values. It decreases the possibility of
earnings management through sales of assets, which can be executed with
historical cost accounting since with this method the market value of the asset is
usually bigger than the historical price with which is recorded in the balance sheet
(The Institute of Chartered Accountants of Scotland, 2006).Moreover, IAS/IFRS
have greater disclosure requirements which reduces the ability of managers to
manage earnings (Calao & Jarne, 2010).
2.1.4.2 The Development of Indonesian GAAP (PSAK)
Indonesia Institute of Accountant (IAI) was established in December 23rd
1957 and legitimate by ministry of justice in February 11th 1959 (No.
J.A.5/13/16). Initially the objectives of IAI are guiding the development of
accounting as well as enhance the quality of accounting education and enhance
the work quality of accountants. Moreover, this organization starts to develop
Indonesian Generally Accepted Accountant Principle (PSAK). There are three
milestones in the development of accounting standard in Indonesia.
The first milestone is before the reactivation of the capital market in
Indonesia in 1973. At that time was the first time IAI codified principles and
25
applicable accounting standards in Indonesia in a book "Principles of Accounting
Indonesia (PAI).
Then, the second milestone occurred in 1984. At that time, the committee
revised fundamentally PAI and codified it in 1973 in the book "Indonesian
Accounting Principles 1984" with a view to adjusting the accounting provisions of
the business development. The interesting point at this time is Indonesia still
inspired by U.S GAAP.
Next in 1994, IAI revised PAI totally in 1984 and codified in the book
Indonesian Accounting Standard (SAK) as of October 1, 1994." Since 1994, IAI
has also decided to harmonize with international accounting standards in the
development of the standard.
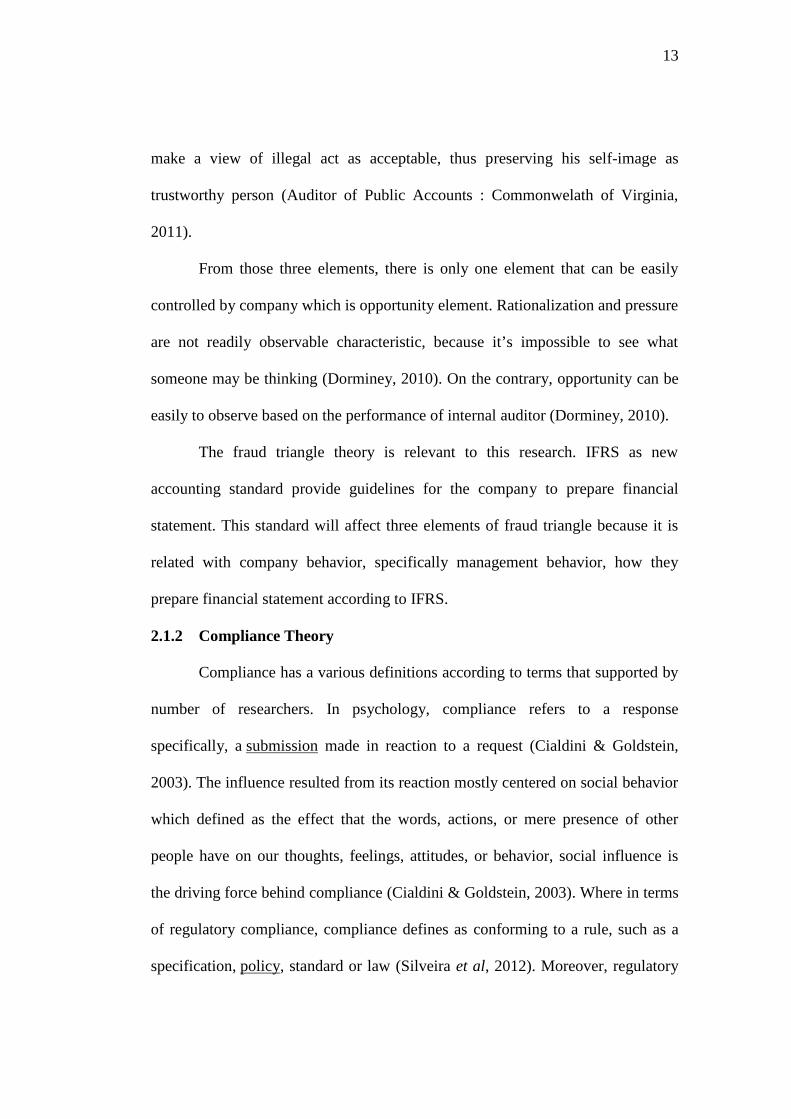
In 2006, DSAK (Indonesian Financial Accounting Standard Board) take a
visionary step which is a roadmap in order to convergence International Financial
Reporting Standard (IFRS) into Indonesian Accounting Standard Principle
(PSAK). The road map can be illustrated as follow:
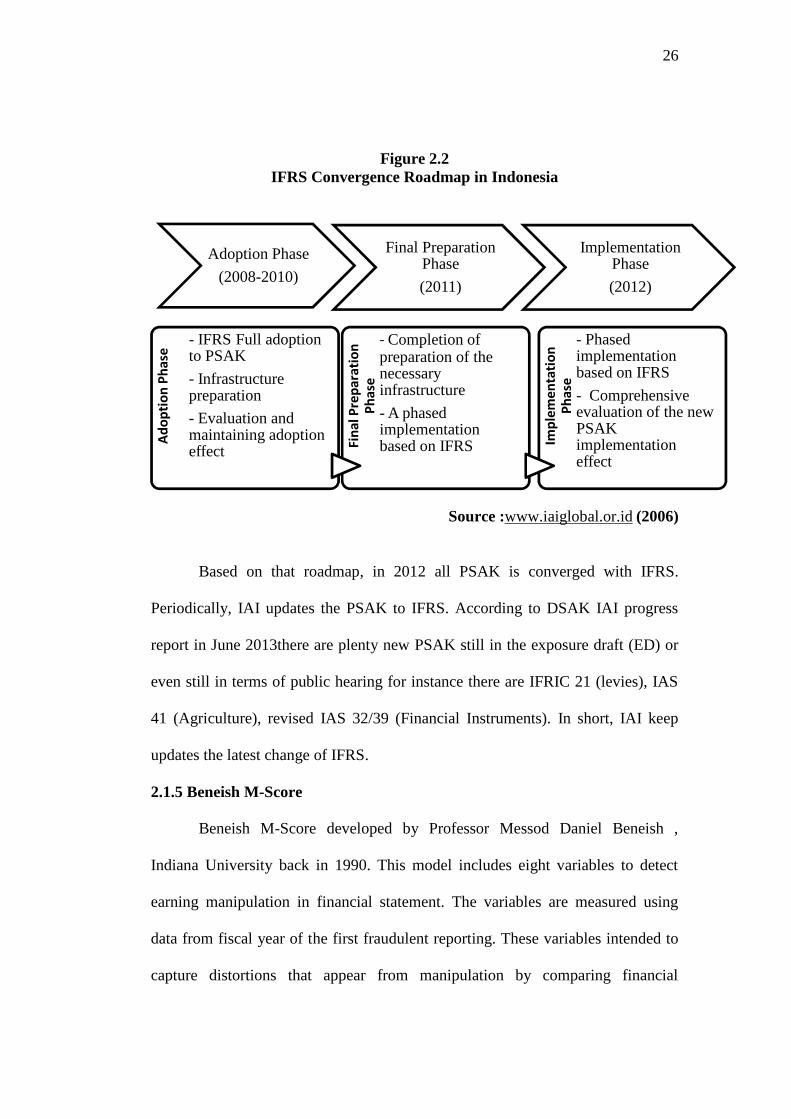
26
Figure 2.2IFRS Convergence Roadmap in Indonesia
Source :www.iaiglobal.or.id (2006)
Based on that roadmap, in 2012 all PSAK is converged with IFRS.
Periodically, IAI updates the PSAK to IFRS. According to DSAK IAI progress
report in June 2013there are plenty new PSAK still in the exposure draft (ED) or
even still in terms of public hearing for instance there are IFRIC 21 (levies), IAS
41 (Agriculture), revised IAS 32/39 (Financial Instruments). In short, IAI keep
updates the latest change of IFRS.
2.1.5 Beneish M-Score
Beneish M-Score developed by Professor Messod Daniel Beneish ,
Indiana University back in 1990. This model includes eight variables to detect
earning manipulation in financial statement. The variables are measured using
data from fiscal year of the first fraudulent reporting. These variables intended to
capture distortions that appear from manipulation by comparing financial
Adoption Phase
(2008-2010)
Final PreparationPhase
(2011)
ImplementationPhase
(2012)
Adop
tion
Phas
e
- IFRS Full adoptionto PSAK
- Infrastructurepreparation
- Evaluation andmaintaining adoptioneffect Fi
nal P
repa
ratio
nPh
ase
- Completion ofpreparation of thenecessaryinfrastructure
- A phasedimplementationbased on IFRS Im
plem
enta
tion
Phas
e
- Phasedimplementationbased on IFRS
- Comprehensiveevaluation of the newPSAKimplementationeffect
27
statement measures in the year of first reporting violation to the year prior. The
variables are not measured contemporaneously with manipulation discovery since
manipulation becomes public on average 19 months after the end of the fiscal year
of the first reporting violation (Beneish, 1999). The interesting fact is this method
was used by student of Cornell University to detect Enron’ fraudulent financial
statement before it’s exposed in 1998.
Here is the explanation regarding eight variables to detect earning
manipulation based on Beneish (1999) research:
1. Days Sales in Receivables Index (DSRI):
DSRI is the ratio of days sales in receivable in the first year in which
earnings manipulation is uncovered (year t) to the corresponding measure in year
t-1. This variable gauges whether receivables and revenues are in or out-of-
balance in two consecutive years. A large increase in day sales in receivables
could be the result of a change in credit policy to spur sales in the face of
increased competition, but disproportionate increases in receivables relative to
sales may also be suggestive of revenue inflation. It is expected as a large increase
in day sales in receivables to be associated with a higher likelihood that revenues
and earnings are overstated.
2. Gross Margin Index (GMI):
GMI is ratio of the gross margin in year t-1 to the gross margin in year t.
When GMI is greater than 1, it indicates that gross margins have deteriorated.
Gross margin deterioration is a negative signal about firms' prospects. If firms
with poorer prospects are more likely to engage in earnings manipulation, it is
28
expected as a positive relation between GMI and the probability of earnings
manipulation.
3. Asset Quality Index (AQI):
Asset quality in a given year is the ratio of non-current assets other than
property plant and equipment (PPE) to total assets and measures the proportion of
total assets for which future benefits are potentially less certain. AQI is the ratio of
asset quality in year t, relative to asset quality in year t-1. AQI is an aggregate
measure of the change in the asset realization risk analysis. If AQI is greater than
1 it indicates that the firm between AQI and the probability of earnings
manipulation. An increase in asset realization risk indicates an increased
propensity to capitalize and thus defer costs.
4. Sales Growth Index (SGI):
SGI is the ratio of sales in year t to sales in year t-1. Growth does not
imply manipulation, but growth firms are viewed by professionals as more likely
to commit financial statement fraud because their financial position and capital
needs put pressure on managers to achieve earnings targets (National Commission
on Fraudulent Financial Reporting (1987), National Association of Certified
Fraud Examiners (1993)). In addition, concerns about controls and reporting tend
to lag behind operations in periods of high growth (National Commission on
Fraudulent Financial Reporting (1987). If growth firms face large stock prices
losses at the first indication of a slowdown, they may have greater incentives to
manipulate earnings. To this effect, almost invariably, companies try to dispel the
impression that their growth is decelerating, since that perception can be so costly
29
to them. In brief, it is expected as a positive relation between SGI and the
probability of earnings manipulation.
5. Depreciation Index (DEPI):
DEPI is the ratio of the rate of depreciation in year t-1 versus the
corresponding rate in year t. The depreciation rate in a given year equals is equal
to depreciation/(depreciation+net PPE). A DEPI greater than 1 it indicates that the
rate at which assets are depreciated has slowed down--raising the possibility that
the firm has revised upwards the estimates of assets useful lives or adopted a new
method that is income increasing. It is expected as a positive relation between
DEPI and the probability of manipulation.
6. Sales General and Administrative Expenses Index (SGAI):
SGAI is calculated as the ratio of SGA to sales in year t relative to the
corresponding measure in year t-1. The variable would interpret a disproportionate
increase in sales as a negative signal about firm future prospects. It is expected as
a positive relation between SGAI and the probability of manipulation.
7. Leverage Index (LVGI):
LVGI is the ratio of total debt to total assets in year t relative to the
corresponding ratio in year t-1. A LVGI greater than 1 indicates an increase in
leverage. The variable is included to capture debt covenants incentives for
earnings manipulation. Assuming that leverage follows a random walk, LVGI
implicitly measures the leverage forecast error. It uses the change in leverage in
the firms' capital structure given evidence in Beneish and Press (1993) that such
changes are associated with the stock market effect of default.
30
8. Total Accruals to Total Assets (TATA):
Total accruals are calculated as the change in working capital accounts
other than cash less depreciation. Either total accruals or a partition thereof has
been used in prior work to assess the extent to which managers make discretionary
accounting choices to alter earnings (see for example Healy (1985), Jones (1991).
It uses total accruals to total assets to proxy for the extent to which cash underlies
reported earnings, and expect higher positive accruals (less cash) to be associated
with a higher likelihood of earnings manipulation.
Those variables are categorized into two categories of signal in order to
detect earning manipulation (Beneish, 1999) .First category is financial statement
distortions signal which are consist of DSRI, AQI, DEPI and TATA. Second
category is indication of a predisposition to engage in earning manipulation which
consists: GMI, SGI, SGAI and LEVI. In brief those variables are formulated and
becomes Beneish M-Score, Swhich for some researchers this model has been
shown to correctly identify 76% of manipulators on an out of sample basis
(Voisin, 2012).
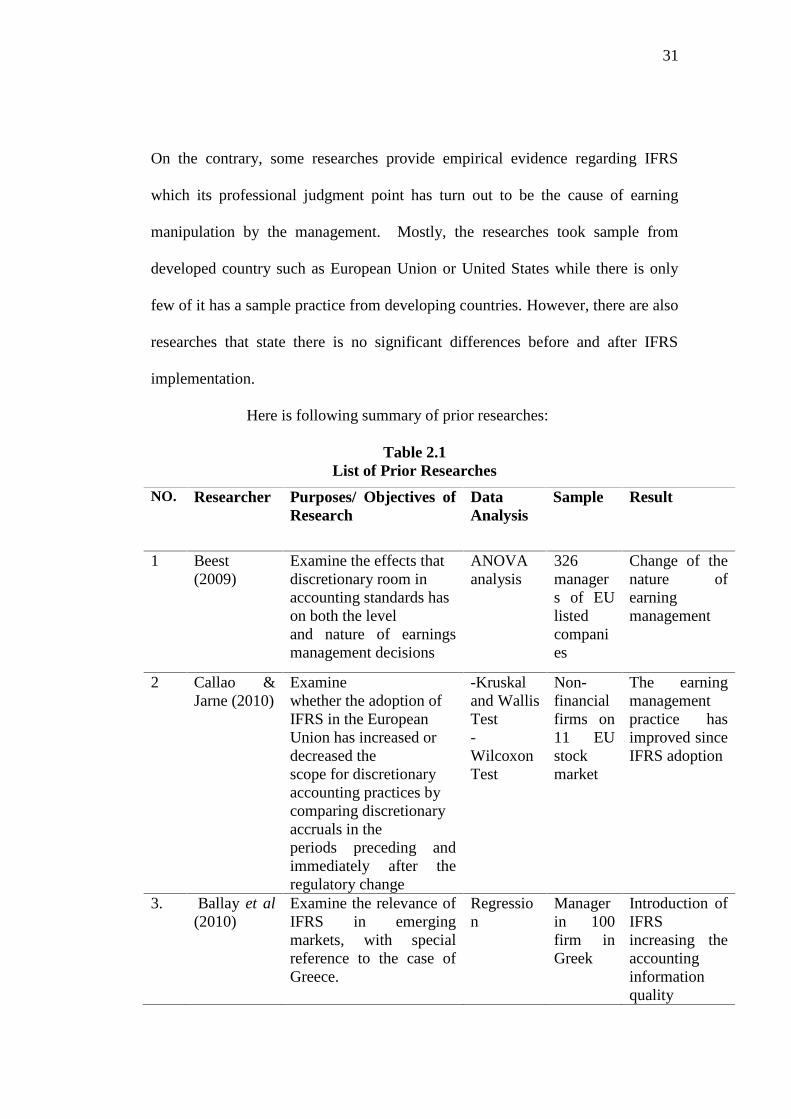
2.1 Prior Researches
The prior researches show inconclusive result. There are various results
regarding the effect of IFRS in earning manipulation between researchers. For
those who in favor, have an opinion that IFRS can deter the earning manipulation
through better professional judgment, better rules, and interpretation which will
boost the quality of financial statement. Furthermore, the comparability aspect has
made IFRS repelled earning manipulation practices (Aubert & Grudnitski , 2011).
31
On the contrary, some researches provide empirical evidence regarding IFRS
which its professional judgment point has turn out to be the cause of earning
manipulation by the management. Mostly, the researches took sample from
developed country such as European Union or United States while there is only
few of it has a sample practice from developing countries. However, there are also
researches that state there is no significant differences before and after IFRS
implementation.
Here is following summary of prior researches:
Table 2.1List of Prior Researches
NO. Researcher Purposes/ Objectives ofResearch
DataAnalysis
Sample Result
1 Beest(2009)
Examine the effects thatdiscretionary room inaccounting standards hason both the leveland nature of earningsmanagement decisions
ANOVAanalysis
326managers of EUlistedcompanies
Change of thenature ofearningmanagement
2 Callao &Jarne (2010)
Examinewhether the adoption ofIFRS in the EuropeanUnion has increased ordecreased thescope for discretionaryaccounting practices bycomparing discretionaryaccruals in theperiods preceding andimmediately after theregulatory change
-Kruskaland WallisTest-WilcoxonTest
Non-financialfirms on11 EUstockmarket
The earningmanagementpractice hasimproved sinceIFRS adoption
3. Ballay et al(2010)
Examine the relevance ofIFRS in emergingmarkets, with specialreference to the case ofGreece.
Regression
Managerin 100firm inGreek
Introduction ofIFRSincreasing theaccountinginformationquality
32
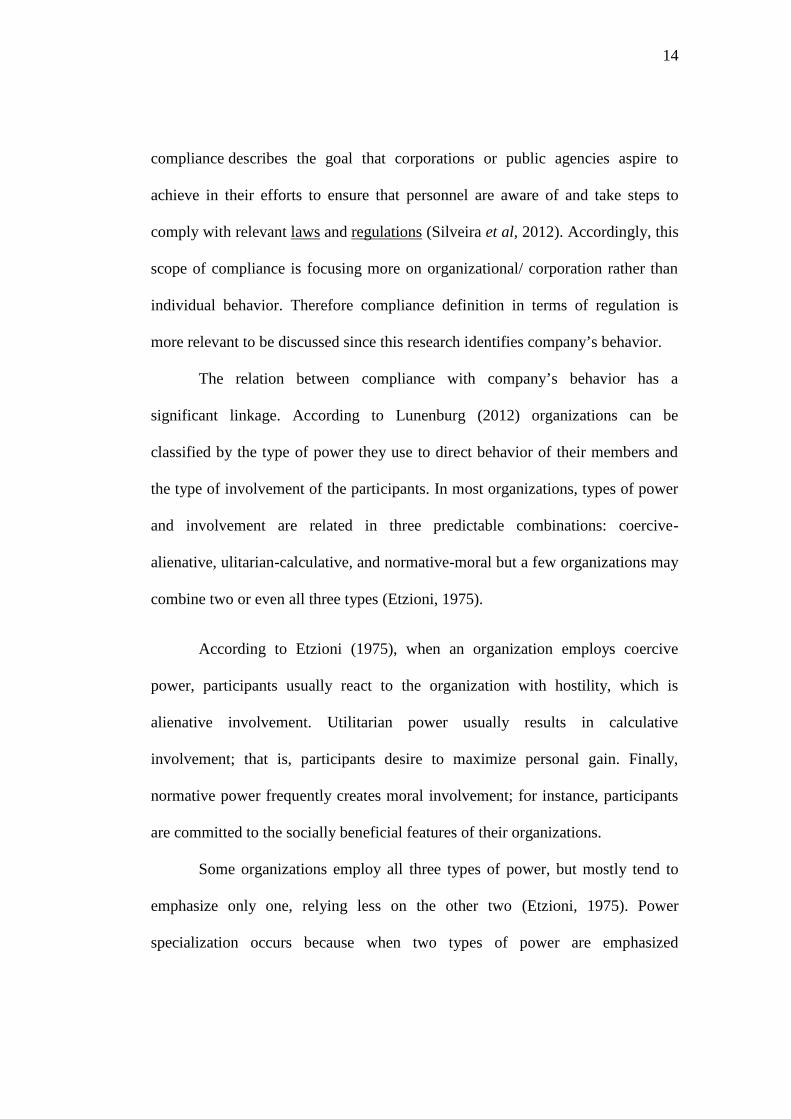
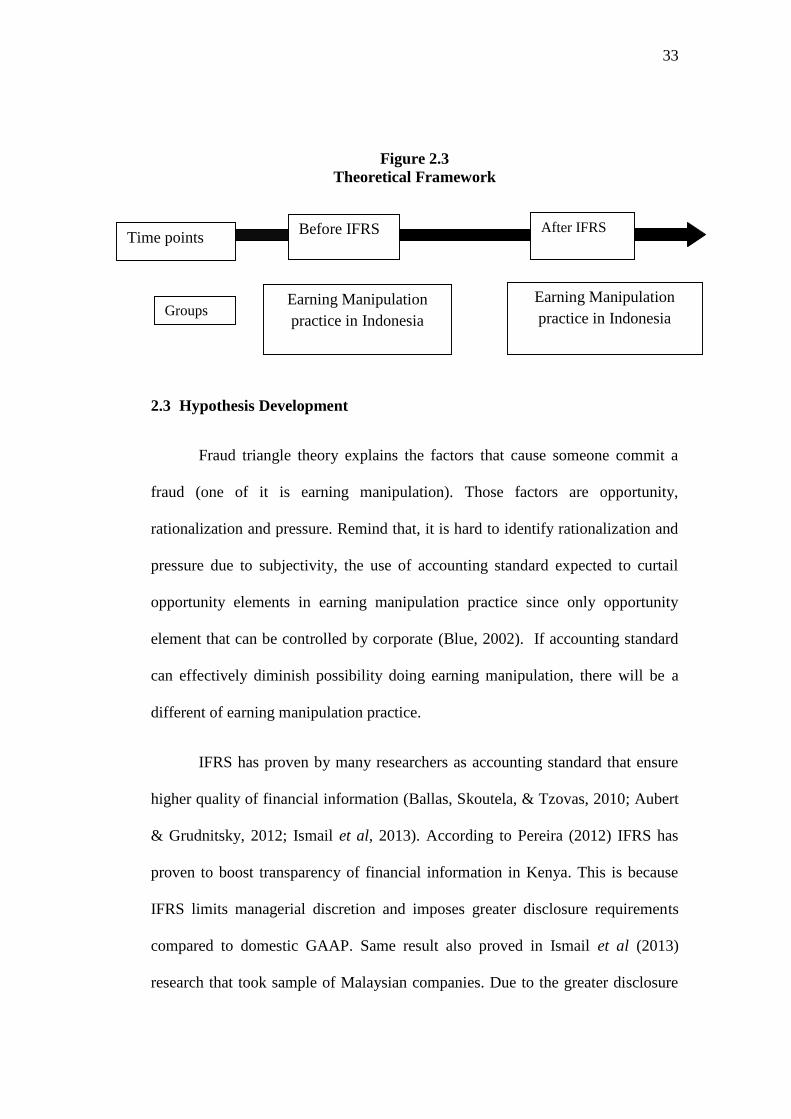
2.2 Theoretical Framework
In this study, in order to know the effect of IFRS towards earning
manipulation practice in Indonesia this research is comparison of data.Earning
manipulation practice as paired variable. IFRS has a role as control variable which
is the time point, while earning manipulation practice has a role as a group who
exposed by it. Those group are the same sample but different in times of
measurement which is measured before IFRS and after IFRS.
Based on that explanation, theoretical framework is arranged to describe
the relation between variables.
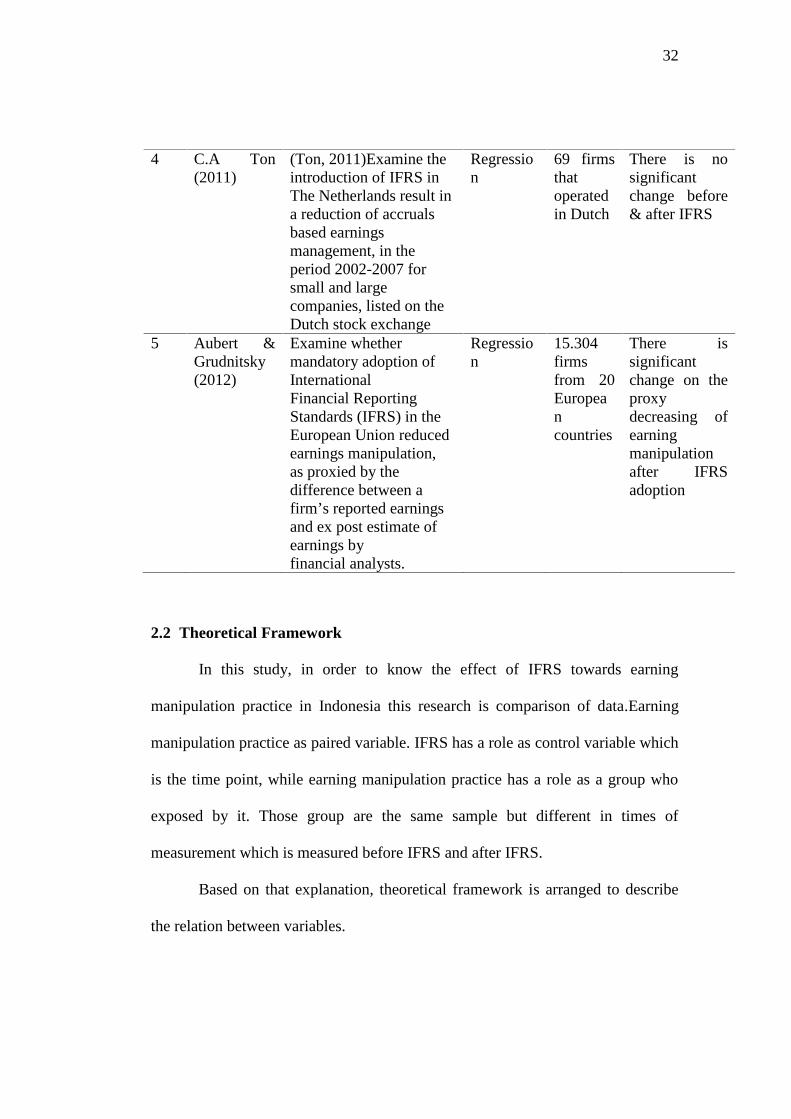
4 C.A Ton(2011)
(Ton, 2011)Examine theintroduction of IFRS inThe Netherlands result ina reduction of accrualsbased earningsmanagement, in theperiod 2002-2007 forsmall and largecompanies, listed on theDutch stock exchange
Regression
69 firmsthatoperatedin Dutch
There is nosignificantchange before& after IFRS
5 Aubert &Grudnitsky(2012)
Examine whethermandatory adoption ofInternationalFinancial ReportingStandards (IFRS) in theEuropean Union reducedearnings manipulation,as proxied by thedifference between afirm’s reported earningsand ex post estimate ofearnings byfinancial analysts.
Regression
15.304firmsfrom 20Europeancountries
There issignificantchange on theproxydecreasing ofearningmanipulationafter IFRSadoption
33
Figure 2.3Theoretical Framework
2.3 Hypothesis Development
Fraud triangle theory explains the factors that cause someone commit a
fraud (one of it is earning manipulation). Those factors are opportunity,
rationalization and pressure. Remind that, it is hard to identify rationalization and
pressure due to subjectivity, the use of accounting standard expected to curtail
opportunity elements in earning manipulation practice since only opportunity
element that can be controlled by corporate (Blue, 2002). If accounting standard
can effectively diminish possibility doing earning manipulation, there will be a
different of earning manipulation practice.
IFRS has proven by many researchers as accounting standard that ensure
higher quality of financial information (Ballas, Skoutela, & Tzovas, 2010; Aubert
& Grudnitsky, 2012; Ismail et al, 2013). According to Pereira (2012) IFRS has
proven to boost transparency of financial information in Kenya. This is because
IFRS limits managerial discretion and imposes greater disclosure requirements
compared to domestic GAAP. Same result also proved in Ismail et al (2013)
research that took sample of Malaysian companies. Due to the greater disclosure
Earning Manipulationpractice in Indonesia
Earning Manipulationpractice in Indonesia
Time points
Groups
Before IFRS After IFRS
34
requirements and greater emphasis on the use of fair value, earning quality has
significant positive association with the adoption of IFRS-based accounting
standard in Malaysia (Ismail et al, 2013). Moreover, Barth et al (2008) also
confirm that firms which adopted IAS, exhibit less earnings management than
those which continue to report under domestic standards. In short, IFRS has the
ability to ensure high quality financial information and accordingly, deter earning
manipulation.
Moreover, based on compliance theory, company is grouped as utilitarian-
calculative organization which means they most likely do calculative involvement
refers to the orientation of a company to an object, characterized in terms of
intensity and direction shaped as desire to maximize corporate objectives. As
discussed before, complying IFRS might result of high quality financial
information and boost comparability that will increase the company’s
trustworthiness and reputation which in the end will maximize corporate
objectives. In short, compliance theory, explain the reason why the company
wants complies IFRS.
Based on the description, this study proposes hypothesis as follows:
HA: There is a different in earning manipulation practice between period
before IFRS convergence and after IFRS convergence in Indonesian
companies.
35
CHAPTER III
RESEARCH METHODS
3.1 Research Variables and Operational Definition
3.1.1 Paired Variable
Earning manipulation practice is the paired variable of this research. This
variable is measured using Beneish M-Score. Beneish M-Score gives information
whether company manipulated its earning. According to Beneish (1999) Beneish
M-Score consist of eight indexes which are calculated from data in company
financial reports issued in two consecutive years (except for Total Accruals to
Total Assets(TATA)), as follow:
1. Day’s Sales Receivables Index (DSRI)
DSRI = [(Net Receivables t / Sales t)] / [(Net Receivablest-1 / Salest-1)]
This measures the ratio of days’ sales in receivables versus prior year as an
indicator of revenue inflation.
2. Gross Margin (GMI)
GMI = [(Salest-1 - COGSt-1) / Salest-1] / [(Salest - COGSt) / Salest]
This is measured as the ratio of gross margin versus prior year. A firm with poorer
prospects is more likely to manipulate earnings.
3. Asset Quality Index (AQI)
AQI = [1 – ((Current Assetst + PP&Et) / Total Assetst)] / [1 - ((Current Assetst-1 +
PP&Et-1) / Total Assetst-1)]
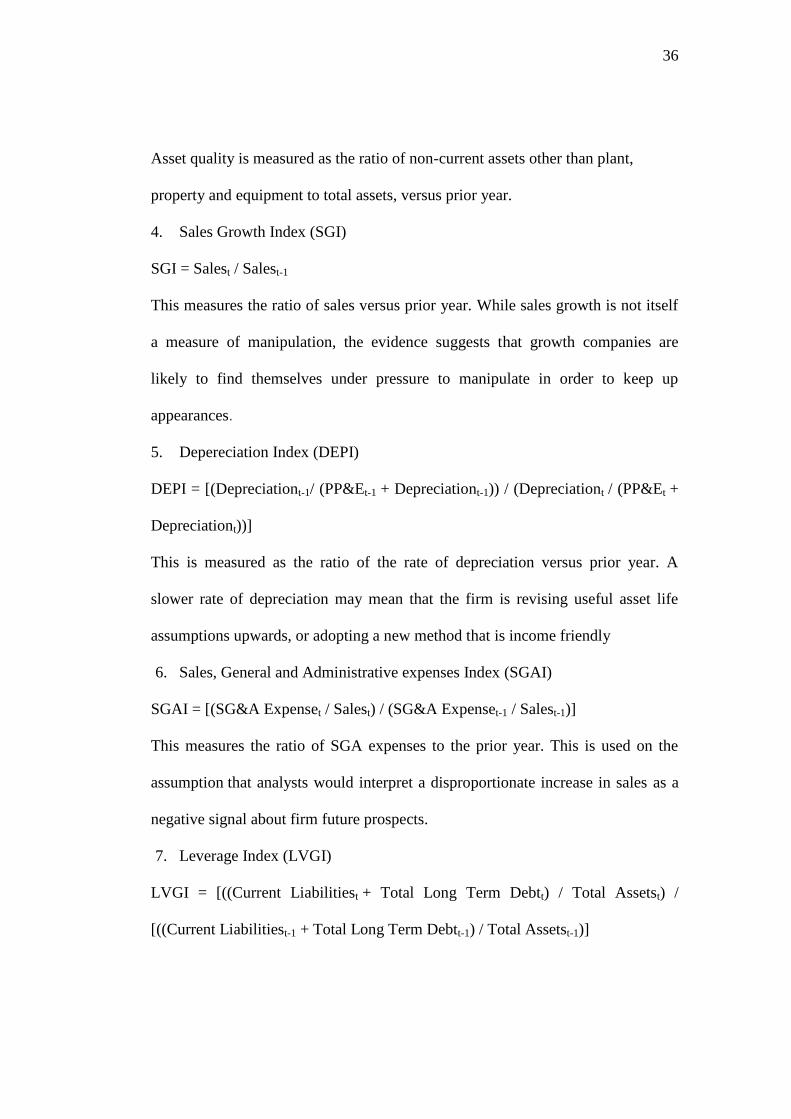
36
Asset quality is measured as the ratio of non-current assets other than plant,
property and equipment to total assets, versus prior year.
4. Sales Growth Index (SGI)
SGI = Salest / Salest-1
This measures the ratio of sales versus prior year. While sales growth is not itself
a measure of manipulation, the evidence suggests that growth companies are
likely to find themselves under pressure to manipulate in order to keep up
appearances.
5. Depereciation Index (DEPI)
DEPI = [(Depreciationt-1/ (PP&Et-1 + Depreciationt-1)) / (Depreciationt / (PP&Et +
Depreciationt))]
This is measured as the ratio of the rate of depreciation versus prior year. A
slower rate of depreciation may mean that the firm is revising useful asset life
assumptions upwards, or adopting a new method that is income friendly
6. Sales, General and Administrative expenses Index (SGAI)
SGAI = [(SG&A Expenset / Salest) / (SG&A Expenset-1 / Salest-1)]
This measures the ratio of SGA expenses to the prior year. This is used on the
assumption that analysts would interpret a disproportionate increase in sales as a
negative signal about firm future prospects.
7. Leverage Index (LVGI)
LVGI = [((Current Liabilitiest + Total Long Term Debtt) / Total Assetst) /
[((Current Liabilitiest-1 + Total Long Term Debtt-1) / Total Assetst-1)]
37
This measures the ratio of total debt to total assets versus prior year. It is
intended to capture debt covenants incentives for earnings manipulation.
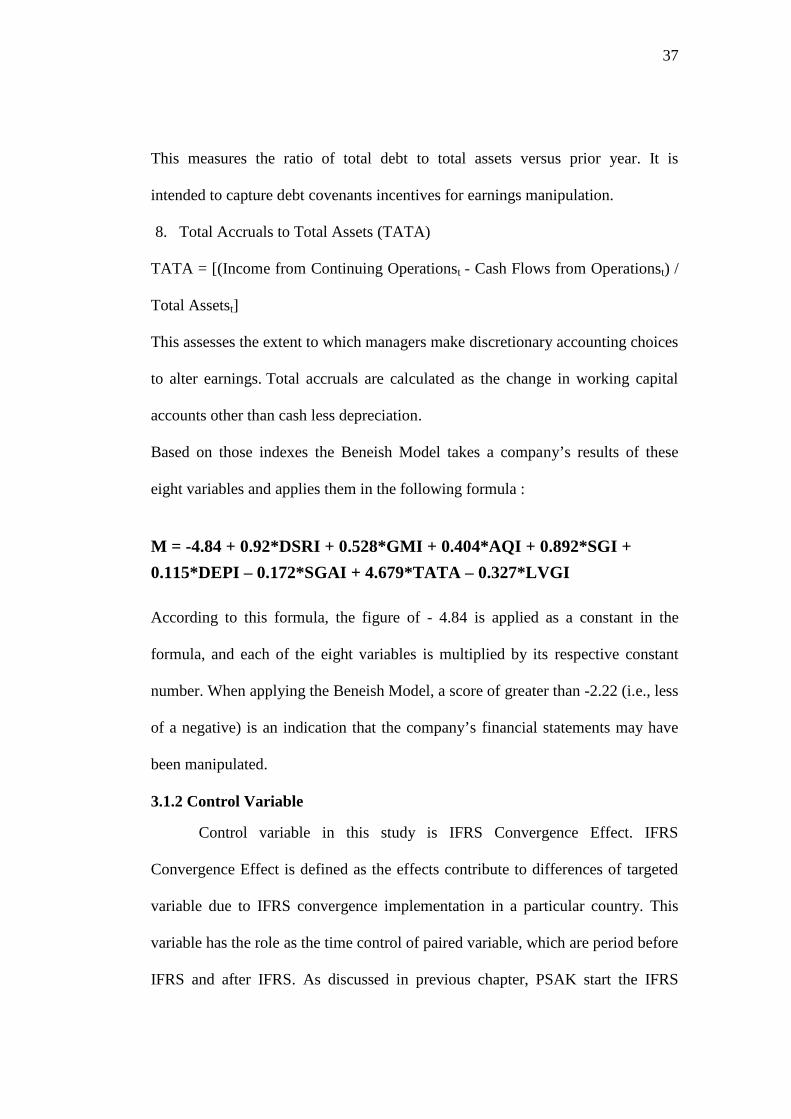
8. Total Accruals to Total Assets (TATA)
TATA = [(Income from Continuing Operationst - Cash Flows from Operationst) /
Total Assetst]
This assesses the extent to which managers make discretionary accounting choices
to alter earnings. Total accruals are calculated as the change in working capital
accounts other than cash less depreciation.
Based on those indexes the Beneish Model takes a company’s results of these
eight variables and applies them in the following formula :
M = -4.84 + 0.92*DSRI + 0.528*GMI + 0.404*AQI + 0.892*SGI +
0.115*DEPI – 0.172*SGAI + 4.679*TATA – 0.327*LVGI
According to this formula, the figure of - 4.84 is applied as a constant in the
formula, and each of the eight variables is multiplied by its respective constant
number. When applying the Beneish Model, a score of greater than -2.22 (i.e., less
of a negative) is an indication that the company’s financial statements may have
been manipulated.
3.1.2 Control Variable
Control variable in this study is IFRS Convergence Effect. IFRS
Convergence Effect is defined as the effects contribute to differences of targeted
variable due to IFRS convergence implementation in a particular country. This
variable has the role as the time control of paired variable, which are period before
IFRS and after IFRS. As discussed in previous chapter, PSAK start the IFRS
38
convergence from 2007 and will be converged in 2012, as a result the IFRS
convergence effect will be appears once the score is compared.
3.2 Population and Sample Determination
3.2.1 Population
The population of this research consists of all companies listed in the
Indonesia Stock Exchange (IDX) for the period before IFRS and after IFRS.
Considering that Beneish M-score needs two consecutive years therefore this
research uses 2006 and 2007 as the period before IFRS, 2011 and 2012 as the
period after IFRS.
3.2.2 Sample
In this study, sample selection was conducted by purposive sampling by
following criteria:
1. Company publishes financial reporting in the IDX website
2. Company has a complete financial reporting
3. Company used Indonesian Rupiahs (IDR) in their financial reporting
4. Company declared using IFRS/ not using historical cost in 2012
3.3 Type and Source of Data
This study used secondary data. They were obtained from another party in
publication form. This study used secondary data which are companies annual
financial reporting 2006, 2007, 2011 and 2012; IAI authorized report; books and
journals that related to this topic. The sources of data are taken from IDX website,
Indonesian Capital Market Directory (ICMD) and other research website.
39
3.4 Data Collection Method
Data in this study are collected by:
1. Literature study
Data and theory in this study were obtained from the literature, articles, journals
and previous researches which are relevant to this research and anvil theory.
2. Documentation study
This study uses secondary data which is the financial information of listed
companies in Indonesia Stock Market in 2006,2007,2011 and 2012.
3.5 Analysis Method
3.5.1 Descriptive Analysis
Descriptive statistical analysis is used to provide a statistical description of
the variables. Descriptive statistic in this study consisted of average (mean),
median, maximum, minimum and standard deviation of each variable. The
variables consist of two groups: Beneish M-Score of companies in the period
before IFRS and after IFRS convergence.
3.5.2.1 Normality
Normality aims to test whether disturber or residual variable in the model
has normal distribution. There are two methods to detect residual which has
normally distributed, namely graph analysis and statistical test (Ghozali, 2011).
This study uses both of analysis.
The graph analysis that is used in this study is Q-Q plot analysis. Q-Q plot
shows observed value and expected value are plotted on a graph. Expected values
are expressed by diagonal straight line, while the observed values are the dots. If
40
the value varies more from a straight line, then the data is not normally
distributed. Otherwise data will be normally distributed. (Ghozali, 2011).
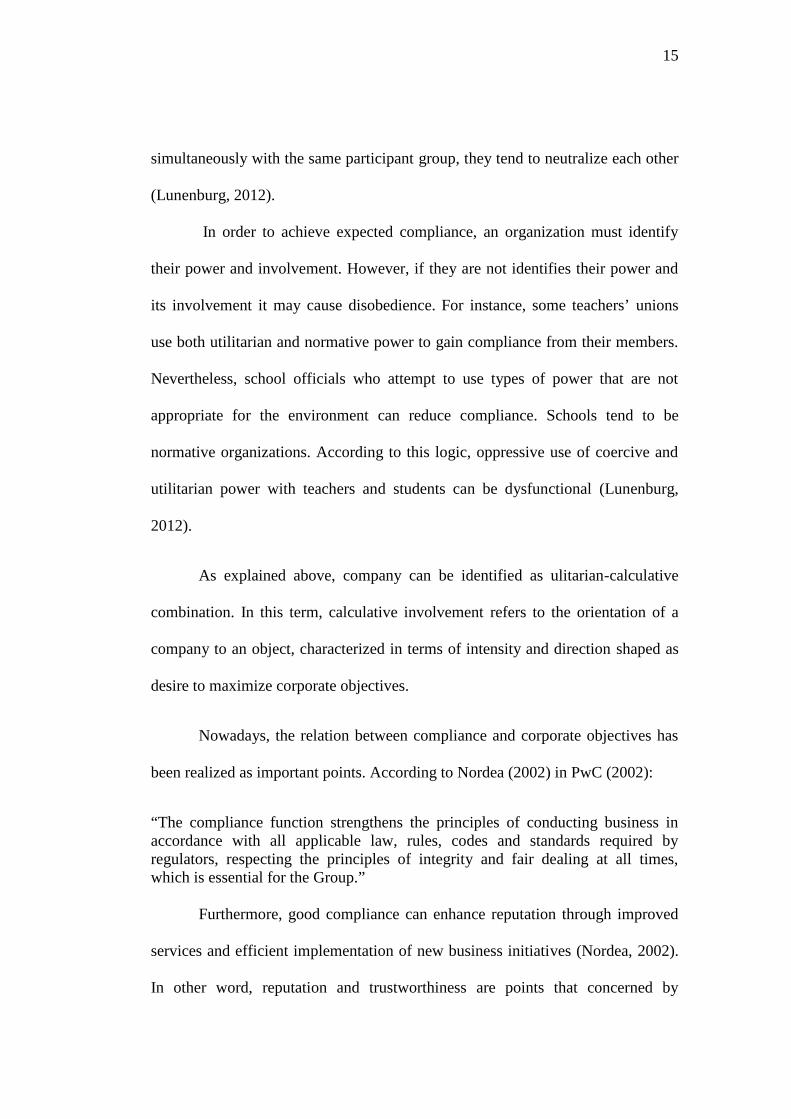
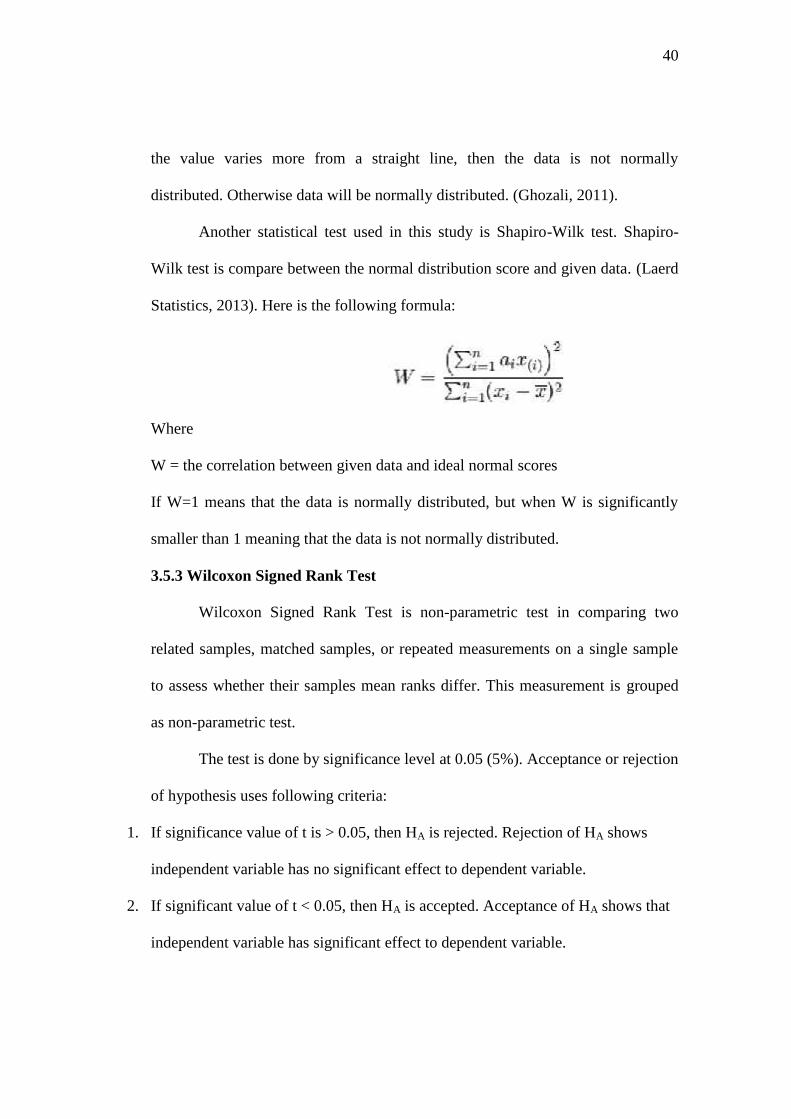
Another statistical test used in this study is Shapiro-Wilk test. Shapiro-
Wilk test is compare between the normal distribution score and given data. (Laerd
Statistics, 2013). Here is the following formula:
Where
W = the correlation between given data and ideal normal scores
If W=1 means that the data is normally distributed, but when W is significantly
smaller than 1 meaning that the data is not normally distributed.
3.5.3 Wilcoxon Signed Rank Test
Wilcoxon Signed Rank Test is non-parametric test in comparing two
related samples, matched samples, or repeated measurements on a single sample
to assess whether their samples mean ranks differ. This measurement is grouped
as non-parametric test.
The test is done by significance level at 0.05 (5%). Acceptance or rejection
of hypothesis uses following criteria:
1. If significance value of t is > 0.05, then HA is rejected. Rejection of HA shows
independent variable has no significant effect to dependent variable.
2. If significant value of t < 0.05, then HA is accepted. Acceptance of HA shows that
independent variable has significant effect to dependent variable.


