
Syracuse University Syracuse University
SURFACE SURFACE
Theses - ALL
1-1-2017
AN EVALUATION OF CAPILLARY FLOW TEST FOR DETERMINING AN EVALUATION OF CAPILLARY FLOW TEST FOR DETERMINING
THE PORE SIZE DISTRIBUTION OF GEOTEXTILES AND THE PORE SIZE DISTRIBUTION OF GEOTEXTILES AND
ESTABLISHING CORRELATIONS ESTABLISHING CORRELATIONS
Nuzhath Fatema Syracuse University
Follow this and additional works at: https://surface.syr.edu/thesis
Part of the Engineering Commons
Recommended Citation Recommended Citation Fatema, Nuzhath, "AN EVALUATION OF CAPILLARY FLOW TEST FOR DETERMINING THE PORE SIZE DISTRIBUTION OF GEOTEXTILES AND ESTABLISHING CORRELATIONS" (2017). Theses - ALL. 155. https://surface.syr.edu/thesis/155
This Thesis is brought to you for free and open access by SURFACE. It has been accepted for inclusion in Theses - ALL by an authorized administrator of SURFACE. For more information, please contact [email protected].

Abstract
For the last four decades, geotextiles have been used extensively for the purpose of separation,
filtration, drainage and soil reinforcement. The basic criteria that impact the behavior of a
geotextile filter are soil retention, permeability, and clogging potential. The ability of a
geotextile filter to fulfill these requirements depends on the pore sizes and pore size distribution.
There are numerous techniques to measure the pore sizes of a geotextile, but not all of them are
widely accepted. In the USA, two standard methods of measuring the largest pore size of a
geotextile have been accepted, the Dry sieving test (ASTM D4751) and the Capillary flow test
(ASTM D6767). Despite of the several drawbacks of the dry sieving test, including trapping of
glass beads inside the geotextiles and electrostatic effects, many filtration criteria are designed
based on the apparent opening size (AOS, O95). On the other hand, the capillary flow test
provides a complete pore size distribution along with the largest pore size (bubble point, O98) of
a geotextile, but this method is not typically used in design.
The main objectives of this study are to: 1) perform calibration of the Capillary flow test device
(Geo Pore Pro, GPP-1001A) to access the accuracy of the test; 2) establish correlations between
bubble point (O98) and AOS (O95) for woven and non-woven geotextiles; and 3) evaluate the role
of pore size distribution in the performance of geotextiles using 1-D filtration tests (Falling-head
test) and Pressurized 2-D tests.
To achieve these objectives, more than 700 capillary flow tests were performed using Geo Pore
Pro (GPP-1001A) manufactured by Porous Materials, Inc. 20 woven geotextiles, 29 non-woven,
and 2 composite geotextiles were used in the study. From Capillary flow test, O10, O15, O50, O85,
O90, O95 and O98 were measured. From the calibration test, it was found that the for some thin
metallic plates and membranes Capillary flow test provides 16% - 23% larger pore size than the

actual pore size. To establish a correlation between Bubble point (O98) and AOS (O95), the
outliers were removed and a good correlation (R2 = 78%) was established for all geotextiles. A
decreasing trend of Bubble point (O98) was found with the increasing mass per unit area for both
needle punched and heat bonded non-woven geotextiles. However, no such trend was found for
woven geotextiles. 1-D filtration tests were performed with 3 different water contents (232.56%,
400% and 882.35%) and it was found that piping rate increases with the decreasing water content
in slurry (232.56% - 882.35%) and degree of clogging decreases with the increasing pore sizes
(both O50 and O98). In the Pressurized 2-D tests, since flocculated slurry was used, instead of soil
retention and piping rate, flow rate was the main issue. Therefore, flow ratio (a ratio of radial
flow and axial flow) was calculated for all geotextiles and it was found that needle punched non-
woven geotextiles showed some decreasing trend of flow ratio with the increasing permeability
of clean geotextiles.

AN EVALUATION OF CAPILLARY FLOW TEST FOR DETERMINING THE PORE
SIZE DISTRIBUTION OF GEOTEXTILES AND ESTABLISHING CORRELATIONS
By
Nuzhath Fatema
BSc., Bangladesh University of Engineering and Technology, Bangladesh, 2013
Thesis
Submitted in partial fulfillment of the requirements for the degree of
Master of Science in Civil Engineering
Syracuse University
June 2017

Copyright © Nuzhath Fatema 2017
All Rights Reserved
v
Acknowledgement
I would like to convey my sincere gratefulness to several people who helped me throughout the
journey of this research to be accomplished successfully.
First and foremost, I would like to extend my wholehearted gratitude to my advisor, Dr. Shobha
K. Bhatia. Without her continuous support, inspiration, and precious suggestions, it was
undoubtedly impossible to complete this thesis successfully.
I would like to thank my committee members: Dr. Shobha K. Bhatia, Dr. Dawit Negussey, Dr.
Ashok S. Sangani and Dr. Jennifer Smith, for their encouragement and support.
I would like to express my gratitude to Mr. Dick Chave, who helped me fix the pressure and
leakage problem of the Capillary flow test device. Special thanks are to Ms. Elizabeth Buchanan,
Ms. Heather Flaherty and Ms. Morgan Narkiewicz for their constant help and kindness. I would
like to express thankfulness to the Department of Civil and Environmental Engineering for
providing me with teaching assistantship.
My sincere appreciation goes to Dr. Krishna Gupta of Porous Materials, Inc. for providing the
equipment to perform Capillary flow test.
I would like to express my gratitude to Mr. Robert Smith and Mr. Michael Richard Norman to
help me with SEM pictures in SUNY ESF.
There are some people who supported and encouraged me in every feasible way throughout my
Masters. I would like to convey my special thanks to Mr. Ratnayesuraj C.R for his endless
inspiration and assistance, during his stay. I would like to thank Mr. Zeru Kiffle, Mr. Prabesh
Rupakheti, and Mr. Mahmoud Khachan for their help and valuable suggestions.

vi
My immense gratefulness goes to my parents who encouraged and guided me every single day
throughout my life. The credit of my any accomplishment throughout my entire life goes to my
parents indeed. I am very much grateful to my lovely siblings, Kaniz and Shafkat for their
understanding and advice.
I cannot extend my enough gratefulness to my dearest friend Ms. Mahmuda Rahman, who, in the
absensce of my parents and family, being an elder sister, gave me a shelter of love and care. I am
very much thankful to my friends, Tamanna, Samia and Engda for their persistent motivation.
Finally, all praises and gratefulness are to the Almighty Allah, who gave me enough patience and
courage to face all difficulties and surrounded me with wonderful people.
vii
Contents
Abstract ............................................................................................................................................ i
Table of Figures .............................................................................................................................. x
List of Tables ............................................................................................................................... xiv
Chapter 1 Introduction .................................................................................................................... 1
Chapter 2 Literature Review and Calibration ................................................................................. 4
2.1 Introduction: ..................................................................................................................... 4
2.2 Capillary Flow Test: Principles ........................................................................................ 7
2.3 Wetting liquid: .................................................................................................................. 8
2.3.1 Contact Angle and Viscosity of Wetting Liquid ..................................................... 10
2.4 Shape Factor ................................................................................................................... 11
2.5 Previous Studies ............................................................................................................. 13
2.6 Calibration Performed in the Previous Studies: ............................................................. 18
2.7 Capillary Flow Test Apparatus ...................................................................................... 19
2.8 Calibration ...................................................................................................................... 23
2.8.1 Method .................................................................................................................... 27
2.8.1.2 Wetting Liquid ........................................................................................................ 27
2.8.1.3 Contact Angle Test Results ..................................................................................... 27
2.9 Summary ........................................................................................................................ 37
2.10 References ...................................................................................................................... 37

viii
Chapter 3 Capillary Flow Test Results ......................................................................................... 41
3.1 Introduction: ................................................................................................................... 41
3.2 Test Procedures .............................................................................................................. 50
3.2.1 Specimens’ Preparation .......................................................................................... 50
3.2.2 Wetting Liquid ........................................................................................................ 51
3.2.3 Shape Factor............................................................................................................ 51
3.2.4 Testing Procedure ................................................................................................... 51
3.2.5 Factors Influencing the Results ............................................................................... 53
3.3 Test Results .................................................................................................................... 54
3.3.1 Box Plot and Whisker Diagram .............................................................................. 64
3.4 Relationships between O98, O50 and O10, and Mass per Unit Area of Geotextiles ......... 72
3.5 Dry Sieving Test ............................................................................................................. 76
3.6 Previous studies .............................................................................................................. 83
3.7 Summary ........................................................................................................................ 86
3.8 References ...................................................................................................................... 87
Chapter 4 Bubble Point Results: Correlations .............................................................................. 93
4.1 Introduction .................................................................................................................... 93
4.2 Correlation between Capillary Flow and Dry Sieving Test ........................................... 94
4.2.1 Current study ........................................................................................................... 94
4.2.2 Previous studies .................................................................................................... 100

ix
4.3 Comparison of Filtration Opening Size and Bubble Point ........................................... 103
4.4 Performance Tests ........................................................................................................ 107
4.4.1 1-D Filtration Test (Falling Head Test) ................................................................ 109
4.4.2 Pressurized 2-D Test ............................................................................................. 122
4.5 Summary: ..................................................................................................................... 131
4.6 References: ................................................................................................................... 132
Chapter 5 Conclusion .................................................................................................................. 138
5.1 Major Conclusion ......................................................................................................... 138
5.2 Future Work ................................................................................................................. 142

x
Table of Figures
Figure 2.1: Contact Angle (Jena et al. 1999) ................................................................................ 10
Figure 2.2: Elliptical Cross-Section of Pore (Cap.Fl.5-12- 09) .................................................... 12
Figure 2.3: Schematic of the Capillary Flow Device Used in University of Maryland by Aydielk,
et al. (2006) ................................................................................................................................... 14
Figure 2.4: Schematic of the Capillary Flow Device used in Auburn University by Elton, et al.
(2007) ............................................................................................................................................ 14
Figure 2.5: Geo Pore Pro GPP-1001A at Syracuse University ..................................................... 20
Figure 2.6: Schematic of the Capillary Flow Device Geo Pore Pro (GPP 1001A), used in
Syracuse University (2017) ........................................................................................................... 22
Figure 2.7: Accessories of Geo Pore Pro; (a) Adapter Plate; (b) Adapter Plate Built-in Screen,
Support Screen, and O-Ring; (c) Wedge Plate;(d) Sample Chamber and Cap ............................. 23
Figure 2.8: SEM Images of Calibration Materials: Thin Metal Plate (A1, A2, A3, and A4); and
Membrane (C1, C2) ...................................................................................................................... 26
Figure 2.9: Test Setup for Calibrating Materials with Mineral Oil .............................................. 29
Figure 2.10: Pore Size Distribution of Thin Metal Plate, A1 (a) before Cleaning and (b) after
Cleaning the Equipment ................................................................................................................ 31
Figure 2.11: Pore Size Distribution of Thin Metal Plate, A3 (a) before Cleaning and (b) after
Cleaning the Equipment ................................................................................................................ 32
Figure 2.12: Measured O100 vs. SEM Measurements for Thin Metallic Plates and Membranes . 35
Figure 2.13: Measured O100 vs. Manufacturing Pore Sizes for Thin Metallic Plates and
Membranes .................................................................................................................................... 36

xi
Figure 3.1: SEM Images of Woven Geotextiles (a) Monofilament, (b) Monofilament (Slit Film in
Cross Direction), (c) Slit Film, (d) Multifilament ......................................................................... 42
Figure 3.2: SEM Images of Needle Punched Non-Woven Geotextiles ........................................ 44
Figure 3.3: SEM Image of Heat Bonded Non-Woven Geotextile (Smith, 1996) ......................... 45
Figure 3.4: SEM Image of a Geo-Composite ............................................................................... 45
Figure 3.5: Step by Step Procedure of Placing a Geotextile (a) Placing Gasket, (b) Placing
Geotextile Over Gasket, (c) Adapter Plate Over the Geotextile, (d) Placing Chamber Cap ........ 52
Figure 3.6: Typical Pore Size Distribution Results of a Non-Woven Geotextile ......................... 53
Figure 3.7: Pore Size Distribution of a Monofilament Woven Geotextile (A-7) ......................... 55
Figure 3.8: Pore Size Distribution of a Slit Film Woven Geotextile (B-2) .................................. 56
Figure 3.9: Pore Size Distribution of a Multifilament Woven Geotextile (C-2) .......................... 57
Figure 3.10: Pore Size Distribution of a Heat Bonded Non-Woven Geotextile (D-3) ................. 58
Figure 3.11: Pore Size Distribution of a Needle Punched Non-Woven Geotextile (E-2) ............ 59
Figure 3.12: Pore Size Distribution of a Geo-Composite (F-1) .................................................... 60
Figure 3.13: Pore Size Distribution of a Monofilament Woven Geotextile (A-4) ....................... 62
Figure 3.14: Pore Size Distribution of a Needle Punched Non-Woven Geotextile (E-10) .......... 63
Figure 3.15: Pore Size Distribution of a Needle Punched Non-Woven Geotextile (E-1) ............ 63
Figure 3.16: Box Plot and Whisker Diagram ................................................................................ 65
Figure 3.17: Box Plot and Whisker Diagram for a Set Of 7 Monofilament Woven Geotextiles . 66
Figure 3.18: Box Plot and Whisker Diagram for a Set Of 11 Slit Film Woven Geotextiles ........ 67
Figure 3.19: Box Plot and Whisker Diagram for a Set Of 2 Multifilament Woven Geotextiles .. 68
Figure 3.20: Box Plot and Whisker Diagram for a Set Of 8 Heat Bonded Non- Woven
Geotextiles .................................................................................................................................... 69

xii
Figure 3.21: Box Plot and Whisker Diagram for a Set Of 21 Needle Punched Non- Woven
Geotextiles .................................................................................................................................... 70
Figure 3.22: Box Plot and Whisker Diagram for a Set of 2 Geo-Composites .............................. 71
Figure 3.23: Bubble Point vs. Mass per Unit Area of Monofilament and Slit-film Woven
Geotextiles .................................................................................................................................... 73
Figure 3.24: O10, O50, and O98 vs. Mass per Unit Area of Needle Punched Non-Woven
Geotextiles .................................................................................................................................... 74
Figure 3.25: Bubble Point vs. Mass per Unit Area of Heat Bonded Non-Woven Geotextiles ..... 75
Figure 3.26: Dry sieving equipment and sieve shaker .................................................................. 77
Figure 3.27: Geotextile with glass beads secured in the frame ..................................................... 77
Figure 3.28: AOS vs. Mass per Unit Area for Needle Punched Non-Woven Geotextiles ........... 78
Figure 3.29: AOS vs. Mass per Unit Area for Heat Bonded Non-Woven Geotextiles ................ 79
Figure 3.30: Bubble point vs. mass/unit area (a) needle-punched, (b) heat-bonded nonwoven
geotextiles ..................................................................................................................................... 84
Figure 4.1: Correlation between Bubble Point and AOS of Woven Geotextiles .......................... 96
Figure 4.2: Correlation between Bubble Point and AOS of Non- Woven Geotextiles ................ 98
Figure 4.3: Correlation between Bubble Point, O98 and AOS, O95 of All Geotextiles ................. 99
Figure 4.4: Correlation between Bubble Point, O98 and AOS, O95 of All Geotextiles (Bhatia et al.
(1996), Aydilek et al. (2006), Elton eta al. (2007) and TENCATE (2014)) ............................... 102
Figure 4.5: Theoretical and Measured Pore Openings vs. Mass Per Unit Area of Needle Punched
Non-Woven Geotextiles.............................................................................................................. 106
Figure 4.6: Bubble Point vs. Theoretical Pore Openings of Needle Punched Non-Woven
Geotextiles .................................................................................................................................. 107
xiii
Figure 4.7: Pore Size Distribution of Six Pairs of Geotextiles used for 1-D Filtration Test ...... 113
Figure 4.8: 1-D Filtration Test Setup .......................................................................................... 115
Figure 4.9: Filter Cake Obtained from the Test with E-19 ......................................................... 115
Figure 4.10: 1-D Filtration Test Piping Rate Results Against O98/d85 for the Soil-Geotextile
Systems ....................................................................................................................................... 118
Figure 4.11: Clogged and Wet Non-Woven Geotextiles (E-19) after 1-D Filtration Test ......... 120
Figure 4.12: Relationship of Clogging to O95/d85 and O50/d50 .................................................... 121
Figure 4.13: Pore Size Distribution of Geotextiles used in the P2DT ........................................ 124
Figure 4.14:Pressurized 2-D Test Setup (Ratnayesuraj (2017)) ................................................. 125
Figure 4.15: Filter Cake Formed for GC-1 (Ratnayesuraj (2017)) ............................................. 127
Figure 4.16: Pressurized 2-D Test Results of Geotextiles (a) Woven Geotextiles and Geo-
composites (b) Non-Woven Geotextiles ..................................................................................... 128
Figure 4.17: Flow ratio vs. Permeability .................................................................................... 130

xiv
List of Tables
Table 2.1: Summary of Results with Dynamic Contact Angles (Elton et al. (2007)) .................. 11
Table 2.2: Pore Cross-Section and Shape Factors, Jena et al., 2003 ............................................ 12
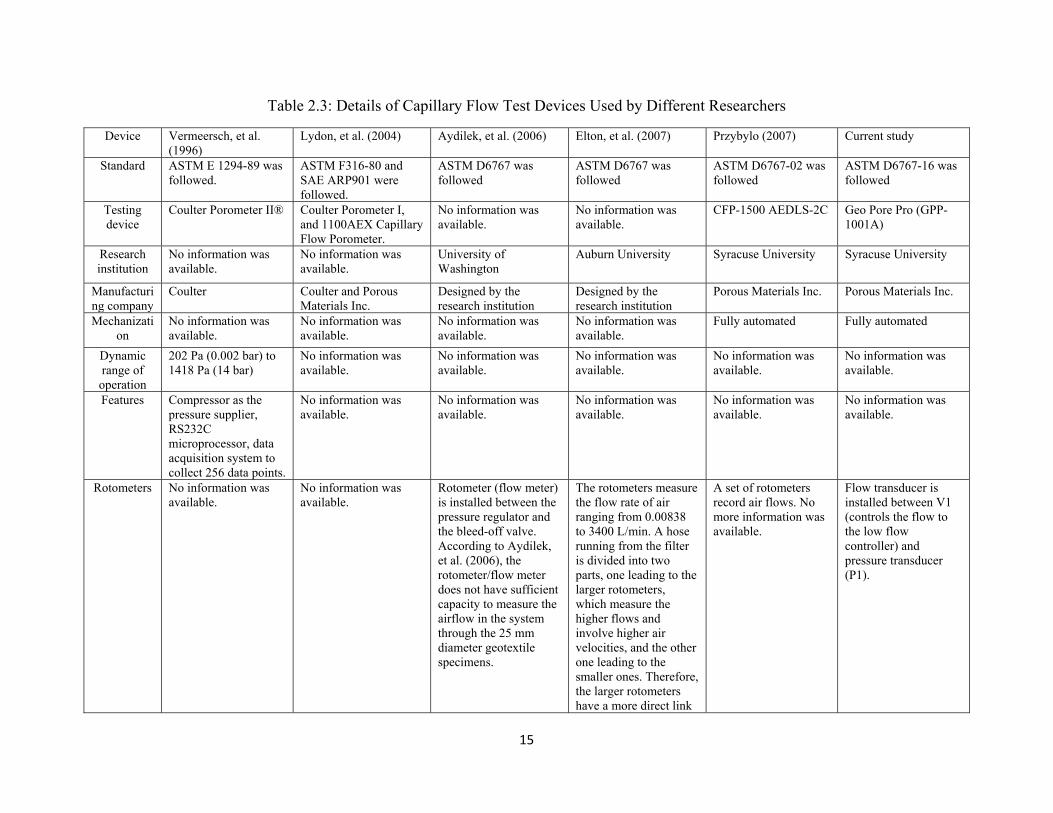
Table 2.3: Details of Capillary Flow Test Devices Used by Different Researchers ..................... 15
Table 2.4: Calibration Results by Previous Studies ...................................................................... 18
Table 2.5: Physical Properties of Calibration Materials ............................................................... 23
Table 2.6: Capillary Flow Test Results for Thin Metallic Plates and Membranes ....................... 33
Table 3.1: Physical and Hydraulic Properties of Geotextiles ....................................................... 47
Table 3.2: Minimum and Maximum Outliers of Monofilament Woven Geotextiles. .................. 67
Table 3.3: Minimum and Maximum Outliers of Slit Film Woven Geotextiles ............................ 67
Table 3.4: Minimum and Maximum Outliers of Multifilament Woven Geotextiles. ................... 68
Table 3.5: Minimum and Maximum Outliers of Needle Punched Non-Woven Geotextiles. ....... 70
Table 3.6: Capillary Flow and Dry Sieving Test Results of Geotextiles ...................................... 80
Table 4.1: Previous Studies (Bhatia and Smith (1996), Elton et al. (2006), Aydilek et al. (2006),
TENCATE (2015)) ..................................................................................................................... 100
Table 4.2: Physical Properties of Non-Woven Geotextiles ........................................................ 105
Table 4.3: Geotextile Filter Selection Criteria with High-Water Content Slurry ....................... 111
Table 4.4: Physical properties of geotextiles used in the test ..................................................... 112
Table 4.5: Properties of Slurry (50% Standard Silica and 50% Tully Silt) ................................ 114
Table 4.6: 1-D Filtration (Falling-Head Test) Test Results ........................................................ 116
Table 4.7: Applicability of the Existing Criteria ........................................................................ 119
Table 4.8: Impregnation Level of Clogged Geotextiles Obtained from the Test ....................... 121
Table 4.9: Properties of Tully Sand Used in the Test, Ratnayesuraj (2017) .............................. 123

xv
Table 4.10: Physical Properties of Geotextiles Used in the Pressurized 2-D Test ..................... 124
Table 4.11: Pressurized 2-D Test Results (Ratnayesuraj (2017)) ............................................... 129

1
Chapter 1 Introduction
For the last four decades, geotextiles have been used extensively for the purpose of soil retention,
filtration, and reinforcement. Both woven and non-woven geotextiles have been used as filters in
many civil and environmental applications, such as geotextile tube dewatering technology. Over
the past two decades, geotextile tube dewatering has been predominantly used for dewatering
high water content slurries. A variety of methods are available to successfully assess the
geotextile tube dewatering technology. A properly designed geotextile tube should have the
following properties: ability to support a steady flow without clogging, a high dewatering rate,
and retention of soil. In order to ensure good retention for erodible materials and provide
adequate discharge capacity for the safety of a structure, there are several factors that need to be
addressed. The three basic criteria that impact the behavior of a geotextile filter are soil retention,
permeability, and clogging potential. Numerous criteria have been developed for geotextile
retention and to clogging prevention, which depend on the pore openings of geotextiles (On: O98,
O95, O90, O85, O50, and O15) and diameter of soil particles (dn). Despite of the importance of pore
openings and pore size distribution of geotextiles, these properties are difficult to measure and
the results might be different for different methods. In the USA, two standards are used to
measure the pore size of geotextiles, including, the dry sieving test (ASTM D 4751) and the
capillary flow test (ASTM D 6767). There are other standards available in other countries, such
as: Hydrodynamic sieving (standard in Canada), and Wet sieving (used in Europe).
In the USA, most of the filtration and soil retention criteria are based on the apparent opening
size (AOS, O95) obtained by the dry sieving test. The dry sieving test is based on the concept that
glass beads of a specific diameter are sieved through a geotextile to determine whether the
percentage of beads passing through the geotextile equals 5% or less. Based on this percentage,

2
the immediate larger beads would be selected and the same technique is followed to measure the
percentage of glass beads that pass through the pores. The repetition of the process provides
apparent opening size (AOS, O95) of a geotextile. The details of the Dry sieving test are
explained in Chapter 3. However, the dry sieving test has several disadvantages, including
electrostatic effects, trapping of glass beads, etc., which make it difficult to obtain accurate pore
size of a geotextile (Bhatia and Smith 1996, Giroud 1996, Koerner 1990).
Another method for measuring the pore sizes of geotextiles is the capillary flow test (ASTM D
6767). In contrast to the dry sieving test, the capillary flow test has the advantage of not only
providing the largest pore (bubble point, O98) of a geotextile, but also providing a complete pore
size distribution. Therefore, O85, O50, and O15 can be calculated. Previous studies established that,
along with the largest pore sizes (O90 and O95), smaller pores including O50 and O15 significantly
control the soil retention (Giroud 1982, Christopher and Holtz 1985). Therefore, the capillary
flow test establishes a common method that can provide both the largest pore size of a geotextile
along with a complete pore size distribution. There are other techniques, such as Image Analysis
(Rollin et al. 1977) and Mercury Intrusion Porosimetry (Prapaharan et al. 1989), but these have
not been widely adopted. Researchers and practitioners have been trying for the last 20 years to
develop the capillary flow test, rather than the dry sieving test, as a common standard to measure
the pore sizes of a geotextile.
Since 1996, very few capillary flow test studies (Vermeersch, et al. (1996), Bhatia et al. (1996),
Lydon, et al. (2004), Aydilek, et al. (2006), Elton, et al. (2007), Przybylo (2007), and TENCATE
(2015)) have used a capillary flow porometer in their analysis, in contradiction to the current
ASTM standard. The first goal of this study is to use the capillary flow test ASTM D6767 to
produce results on a range of geotextiles (woven, non-woven and composite geotextiles) and

3
evaluate the quality of the results (including calibration). The second goal is to compare data
from the capillary flow test in regard to applications such as soil retention, filtration and soil
reinforcement, to those produced by the dry sieving test. The capillary flow test was conducted
with 51 geotextiles for this study following the ASTM D6767 and using the latest version of
capillary flow porometry, Geo Pore Pro (GPP-1001A) manufactured by the Porous Materials,
Inc. (PMI).
The main objectives of this study are to:
1) Perform calibration of the Geo Pore Pro (GPP-1001A) with several materials of known
sizes and compare the capillary flow test devices used by others with different ASTM
standards and limitations.
2) Compare the results obtained by the capillary flow test with the dry sieving test results.
3) Establish correlations between bubble point, O98 and AOS, O95 for woven and non-woven
geotextiles. Evaluate the influence of pore size distribution on the performance of
geotextiles using 1-D filtration test and Pressurized 2-D test.
The thesis is divided into 4 chapters;
Chapter 2: The calibration of Geo Pore Pro (GPP-1001A) was performed using four thin metallic
plates with uniform holes and two membranes with irregular holes.
Chapter 3: Capillary flow tests were conducted for 51 geotextiles following ASTM D6767. Geo
Pore Pro (GPP-1001A) was used to perform all the tests.
Chapter 4: A correlation between bubble point, O98 obtained by capillary flow test and AOS, O95
obtained by the dry sieving test, was established for all geotextiles. The role of pore size
distribution in the performance of geotextiles were evaluated.
Chapter 5: Conclusion and Future work.

4
Chapter 2 Literature Review and Calibration
2.1 Introduction:
In terms of the performance of geotextiles as a filter, pore size distribution is an important
property of geotextiles. The geotextile filter design criteria include permeability, soil retention
and resistance to clogging. During the last 25 years, extensive research has been conducted to
establish two of the primary design criteria, permeability and soil retention criteria. Many of the
soil retention criteria require the largest pore openings (O98 and O95) and some criteria need O50
and O15 (Rankilor 1981, Giroud 1982, Christopher and Holtz 1985, Fannin, J., 2006). Filtration
within soil/ geotextile system includes soil and geotextile interaction with each other. The
continuous rearrangement of soil particles at the geotextile interface zone influence the long-term
performance of the filtration system. The largest pore openings and the pore size distribution of
geotextile filters are directly related to the degree of rearrangement of soil particles. When the
opening of the geotextile filter is too small or too large, the geotextile filter is ineffective.
Although larger pore openings and pore size distribution are the key property of a geotextile,
these properties are very difficult to measure. The commonly used techniques to evaluate the
largest pore openings and pore size distribution of geotextiles are: Dry Sieving (ASTM D 4751),
Hydrodynamic Sieving (CGSB 148.1 n°10), Wet Sieving (SW-640550-83), and Capillary flow
test (ASTM D 6767). Dry sieving, Hydrodynamic sieving, and Wet sieving tests are used to
measure the largest pore opening only. Dry sieving test is used in US, Hydrodynamic test is used
in Canada and Wet sieving in Europe. Only Capillary flow test provides the largest pore opening
as well as O50 and O15. There are other techniques such as Image analysis (Rollin et al. 1977) and
Mercury Intrusion Porosimetry (Prapaharan et al. 1989, and Bhatia and Smith, 1994) have been
used to measure pore size distribution but not widely adopted. It is possible to achieve different

5
pore size distribution results of a geotextile within and between different test methods (Rollin
1986, Bhatia et al. 1994). The larger pore openings of a geotextile that predominantly influence
soil retention includes O95, O90, and O50. Many of the established soil retention criteria of
geotextiles depend upon the larger O95, O90, O50 and O15 pore openings of geotextiles (Giroud
1982, Christopher and Holtz 1985, Fannin, J., 2006); and it is believed that the finer pore
openings of a geotextile, O15 also controls soil retention (Rankilor 1981).
In the USA, Dry sieving (ASTM D 4751), an approved and commonly used method to measure
the apparent opening size, O95 (AOS) of geotextiles, is used for many soil retention criteria. The
Canadian standard, Hydrodynamic Sieving is a method where a mixture of glass beads is sieved
through geotextiles by altering water to determine the O95 of a geotextile. Wet sieving is
standardized in Europe to measure the O95 of a geotextile, where a particle mixture is used
instead of fractions and a continuous water spray is used in the method to reduce the electrostatic
effect occupied with the glass beads. Due to several disadvantages of dry sieving test such as
electrostatic effects and clogging of glass beads within the geotextiles, this method does not
provide the accurate AOS values (Bhatia and Smith 1996, Giroud 1996, Koerner 1990).
Capillary flow test (ASTM D 6767) was approved in 2002 which can provide the largest pore
size (O98) and a complete pore size distribution. However, there is no standard device to perform
capillary flow test. For this test, mineral oil is recommended as a wetting liquid, however in
ASTM standard it is also mentioned that other liquids could be used with proper judgement. Due
to variation in the test devices and wetting liquids, different capillary flow devices and wetting
liquids have been used by researchers and geosynthetic industries.
In the summer of May 4th, 2015, a meeting was held at Syracuse University to discuss round
robin test results of ASTM D 6767. The meeting participants include the executive director of

6
North American Geosynthetics Society (L. David Suits); representatives from Ten Cate
(geosynthetic manufacturing company), representatives from two testing labs: Texas Research
International, Inc. (TRI) and State-of-the-art Geosynthetics Laboratory (SAGEOS);
representatives from Porous Materials, Inc. (PMI); Dr. Shobha Bhatia and her few graduate
students. TRI uses their own Capillary flow device, PMI makes several versions of Capillary
flow devices, SAGEOS and Ten Cate use different versions of PMI devices. The group discussed
a need to come up with a correlation factor between O95 (AOS) obtained by dry sieving test and
O98 obtained by capillary flow test. This would encourage more manufacturers, researchers and
practitioners to use Capillary flow test to measure O98 of geotextiles. Moreover, since most of the
geotextile filter design criteria use results (O95) from dry sieving test, a correlation factor is
needed to use O98 from Capillary flow test. It was concluded that the practitioners and
manufacturers need a correlation factor between dry sieving (O95) and capillary flow (O98) test
results. These relationships have not been established till now due to the limited number of
geotextiles used for studies and lack of proper calibration of the Capillary flow test.
Hence, a study has been taken to perform the capillary flow test using ASTM D 6767 to calibrate
the test equipment with a wide range of materials including thin (0.003-inch thickness) metal
plate with circular holes (made of 300 series Alloy stainless steel), and membranes with irregular
holes. A state of the art capillary flow porometer Geo Pore Pro (GPP 1001A) is used to evaluate
pore opening of these calibrating materials and ASTM D6767 is used to conduct the tests.

7
2.2 Capillary Flow Test: Principles
Capillary flow test is a standardized test which is used to determine pore size distribution of both
woven and non-woven geotextiles with pore sizes ranging from 1 to 1000 microns. This test is
delineated in ASTM D 6767-16, “Standardized Test Method for Pore Size Characteristics of
Geotextiles by Capillary Flow Test”. The capillary flow test is based on the principle that the
continuous pores in a geotextile hold a wetting liquid by capillary attraction and surface tension,
and they will only allow the liquid to pass when the pressure applied exceeds the capillary
attraction of the liquid in the largest pore. Consequently, smaller pores demand higher pressure
to discharge liquid, since they have larger solid-liquid attraction. In order to originate the air flow
through a saturated sample, it needs a gateway pressure or minimum pressure, which is related to
the largest pore size, or bubble point, and the type of wetting liquid being used. The ASTM
D6767 uses the following equation based on the equilibrium of forces:
Π*d*τ*cosθ = *d2*P
2.1
Where,
d = pore diameter, microns (microns),
τ = surface tension of the liquid saturating the porous material, mN/m, (dynes/cm),
θ = contact angle in degrees between the wetting liquid and the porous material (cosθ = 1 for a
wetted sample with θ = 0̊), and
P = Pressure measured, Pa (N/m2).
If the test liquid used in testing is assumed to be “wetting”, or contact angle, θ = 0, the equation is
simplified even further:

8
d = 2.2
The capillary flow test can be used to measure the complete pore size distribution of a porous
material by gradually increasing the pressure and approving steadily smaller pores to be vacant
of liquid. The extended method is based on: (a) air is passed through the pores of a dry specimen
during the period when any amount of air pressure will be imposed to one side of the specimen;
and (b) air will be passed through the pores of a saturated specimen when the capillary attraction
of the fluid is exceeded by the air pressure, (c) smaller and smaller pores will pass the air with
the increase in air pressure. A complete pore size distribution of a geotextile can be determined
using the following equation (ASTM D 6767).
%Finer = [1 -
x 100% 2.3
2.3 Wetting liquid:
Wetting liquid is a liquid which is used to saturate the geotextile specimen for the “wet” portion
of the capillary flow test. The word “wet” stands for saturating the specimen completely
throughout its entire thickness without entrapping any air bubble. According to ASTM D 6767,
mineral oil, with surface tension of 34.7 dynes/cm at 25̊ C (USP liquid petrolatum heavy), is a
standard wetting liquid recommended for the capillary flow test. However, according to ASTM
D6767-16, other liquids can be used with a proper verification of consistency of the resulting
pore size distribution of geotextiles with the results obtained with mineral oil as a wetting liquid.
In the past twenty years, researchers have used different types of wetting liquids in the capillary
flow test. Vermeersch and Mlynarek (1996) used Coulter Porometer II® in the capillary flow test
to determine the pore size distribution of needle punched and heat bonded, polypropylene
continuous filament non-woven geotextiles with Porofil as a wetting liquid (16 dynes/cm).

9
Lydon, et al. (2004) tested several multi-layered woven filter media using Coulter Porometer I,
with 1100AEX Capillary Flow Porometer. Lydon et al. (2004) used both Porofil and Galwick
(surface tension was not mentioned) in Coulter Porometer I and only Galwick in 1100AEX
Capillary Flow Porometer. Aydilek, et al. (2006) used deionized water as a wetting liquid for 11
non-woven and 18 woven geotextiles in the capillary flow test. They used a capillary flow device
which was made at the University of Washington. Elton and Hayes (2007) conducted tests on a
polypropylene non-woven geotextile with six different liquids (water, porewick, mineral oil, 2-
ethyl-hexanol, drakeol 600, and glycerin). The device used in their tests was designed at Auburn
University. Przybylo (2007) used CFP-1500 AEDLS-2C manufactured by PMI, to test 12 heat
bonded non-woven geotextiles with Galwick as a wetting liquid (15.9 dynes/cm). TENCATE
(2015) used 3different types of woven monofilament geotextiles (woven monofilament, woven
monofilament with tape filling, and high strength woven monofilament with tape filling) to
perform capillary flow test using PMI porometer. No further information about the device and
liquid was reported. Zeru, et al. (2014) used two woven, one non-woven and one geo-composite
in the analysis using PMI automated Capillary flow porometer (CFP- 1003A) with mineral oil as
a wetting liquid (34.7 dynes/cm).
In addition to mineral oil, researchers have used Porofil, Galwick, Porewick, 2-ethyl-hexanol,
Drakeol 600, glycerin, water as wetting liquid and very few of them verified the consistency with
mineral oil. In ASTM D 6767, it is mentioned that mineral oil with a surface tension of 34.7
dynes/cm at 25̊C should be used as a wetting liquid. Use of different liquids may produce
different results, since the contact angle between test specimen and wetting liquid is different.

10
2.3.1 Contact Angle and Viscosity of Wetting Liquid
The contact angle is the angle, conventionally measured through the liquid, where a liquid
interface meets a solid surface (see Figure 2.1). Generally, liquids generating an angle with solid
surface less than 90 degrees are called ‘hydrophilic’ and greater than 90 degrees are called
‘hydrophobic’. A wetting situation is called when a hydrophilic liquid runs over a fibrous matrix
or a given surface. Elton et al. (2007) stated that the hydrophobic liquids demand an external
energy to propagate. According to the studies, surface roughness (Bikerman 1958, Adamson
1976, Good 1984, Berg 1989) and surface chemistry (Berg 1989) can influence the contact
angle. Since, contact angle is a function of solid –liquid interactions (Van de Velde and Kickens
1999), any discrepancy in the properties of either liquid or solid may change the result of the
contact angle. Chemical properties of a liquid such as pH, ironic strength, and concentration can
also change the contact angle (Byron et al 2000, Mohammed and Kibbey 2005).
θ = Contact angle
Figure 2.1: Contact Angle (Jena et al. 1999)

11
Since, ASTM D 6767-16 does not provide any instruction about the measurement of contact
angle, generally it is assumed that the contact angle is zero. However, Elton et al. (2007) showed
that different liquids generate different contact angles with the same geotextile, which results in
the change of bubble point (O98). Elton et al. (2007) measured bubble point, O98 of a
polypropylene non-woven geotextile using the capillary flow testing with six different liquids
having distinct surface tension and viscosity. The wetting liquids, used included water, Porewick,
mineral oil, 2-ethyl-hexanol, drakeol 600, glycerin etc. Cahn Dynamic Contact Angle (DCA)
Analyzer was used to measure the contact angle of different liquids. Table 2.1shows the results
of the capillary flow test performed with different liquids.
Table 2.1: Summary of Results with Dynamic Contact Angles (Elton et al. (2007)) Geotextiles Wetting liquid Bubble point
(microns), with 0̊
contact angle
Dynamic contact angle (Cahn Dynamic contact
angle, θ)
Bubble point (microns) with dynamic contact
angle
Polypropylene non-woven geotextile
Water 390 67.53 160 Porewick 190 0 190
Mineral oil 300 0 300 2-ethyl-hexanol 180 0 180
Drakeol 290 0 290 Glycerin 300 34.51 240
Table 2.1 shows that the dynamic contact angle of water and glycerin with geotextile is not zero
but 67.53̊ and 34.51̊ respectively. Using the correct contact angle, the bubble point of geotextile
changed significantly. Mineral oil and Porewick, the most widely used wetting liquid, have zero
contact angle with the polypropylene nonwoven geotextiles.
2.4 Shape Factor
The relation between the measured pore size by the capillary flow test and the actual pore size
depends on the ratio of the diameter of the largest particle passing through the pore (d) and the

12
measured pore diameter (D), which is called pore shape factor, λ. The shape factor can be
defined by the following equation (Jena et al., 2003):
λ = = [(1 + n2)/ 2n2]1/2 2.4
n = axial ratio of elliptical cross – section of pore
Figure 2.2: Elliptical Cross-Section of Pore (Cap.Fl.5-12- 09)
In Table 2.2 shape factors are given for pores of different shapes (Jena et al., 2003). Based on the
pore cross-section, the measured diameter of a pore is computed by multiplying the shape factor,
λ with the diameter measured by equation 2.4.
Table 2.2: Pore Cross-Section and Shape Factors, Jena et al., 2003

13
2.5 Previous Studies
Different researchers have used different devices based on the capillary flow test principles.
Some of the devices were made by the researchers themselves and others were made of by the
commercial companies like Coulter Corporation and Porous Materials, Inc (PMI). Different
versions of PMI manufactured devices have been using to perform capillary flow test. The
capillary flow device used by Aydilek, et al. (2006) at University of Maryland and Elton, et al
(2007) at Auburn University were constructed based on the schematic sketch given in Figure 2.3
and Figure 2.4 respectively. Two versions of Porometer manufactured by Coulter, Coulter
Porometer I and Coulter Porometer II, were used by Vermeersch, et al. (1996) and Lydon, et al.
(2004). The Coulter Porometer II, controlled by microprocessor, is associated with a compressor,
since the supplied pressure is used for the capillary flow test. However, no detailed information
is available about the Coulter Porometer I, which was used by Lydon, et al. (2004). Different
generations of PMI devices have been using at Syracuse University for the capillary flow tests.
These devices included PMI Automated Perm-Porometer (Model No. APP-200) by Bhatia, et al.
(1996); PMI automated device CFP-1500 AEDLS-2C by Przybylo (2007); Capillary Flow
Porometer (CFP-1003A) by Kiffle, et al. (2014); and Geo Pore Pro (GPP-101A). For the current
study, the Geo Pore Pro (GP-1001A) is used. Lydon, et al. (2004) also tested several multi-
layered woven filter media using 1100AEX Capillary Flow Porometer manufactured Porous
Materials, Inc. (PMI). In Table 2.3, details of all different Capillary Flow Porometers used by
researchers are provided.

14
Figure 2.3: Schematic of the Capillary Flow Device Used in University of Maryland by Aydielk,
et al. (2006)
MV = Metering valve, V = Valve, R = Rotometer, BG = Backpressure Gauges, SH = Sample
Holder, M = Manometer
Figure 2.4: Schematic of the Capillary Flow Device used in Auburn University by Elton, et al.
(2007)
15
Table 2.3: Details of Capillary Flow Test Devices Used by Different Researchers
Device Vermeersch, et al. (1996)
Lydon, et al. (2004) Aydilek, et al. (2006)
Elton, et al. (2007) Przybylo (2007) Current study
Standard ASTM E 1294-89 was followed.
ASTM F316-80 and SAE ARP901 were followed.
ASTM D6767 was followed
ASTM D6767 was followed
ASTM D6767-02 was followed
ASTM D6767-16 was followed
Testing device
Coulter Porometer II® Coulter Porometer I, and 1100AEX Capillary Flow Porometer.
No information was available.
No information was available.
CFP-1500 AEDLS-2C Geo Pore Pro (GPP-1001A)
Research institution
No information was available.
No information was available.
University of Washington
Auburn University Syracuse University Syracuse University
Manufacturing company
Coulter Coulter and Porous Materials Inc.
Designed by the research institution
Designed by the research institution
Porous Materials Inc. Porous Materials Inc.
Mechanization
No information was available.
No information was available.
No information was available.
No information was available.
Fully automated Fully automated
Dynamic range of operation
202 Pa (0.002 bar) to 1418 Pa (14 bar)
No information was available.
No information was available.
No information was available.
No information was available.
No information was available.
Features Compressor as the pressure supplier, RS232C microprocessor, data acquisition system to collect 256 data points.
No information was available.
No information was available.
No information was available.
No information was available.
No information was available.
Rotometers No information was available.
No information was available.
Rotometer (flow meter) is installed between the pressure regulator and the bleed-off valve. According to Aydilek, et al. (2006), the rotometer/flow meter does not have sufficient capacity to measure the airflow in the system through the 25 mm diameter geotextile specimens.
The rotometers measure the flow rate of air ranging from 0.00838 to 3400 L/min. A hose running from the filter is divided into two parts, one leading to the larger rotometers, which measure the higher flows and involve higher air velocities, and the other one leading to the smaller ones. Therefore, the larger rotometers have a more direct link
A set of rotometers record air flows. No more information was available.
Flow transducer is installed between V1 (controls the flow to the low flow controller) and pressure transducer (P1).

16
to the air source, reducing head losses.
Washers and O rings
No information was available.
No information was available.
Due to the problem in measuring airflow and reduce the airflow, nylon flat washers having a 12 mm center hole were installed on each side of the geotextile specimen. O-rings were inserted between the washers and specimen holder to prevent air loss around the perimeters of the washers.
No information was available.
A thin metal disc with multiple circular holes arranged in a grid pattern each with an approximate diameter of 40 microns was used as a support screen. The samples are located on the supporting screen inside the depression. 14 mm O-ring was used to seal the sample.
The sample is sealed by the O-rings. The sample perimeter must be enclosed by the O-ring to prevent gas flow between the O-ring and sample.
Metering and cutoff
valves
No information was available.
No information was available.
No information was available.
Metering valves with variable sizes were used to control the airflow to the open rotometer.
No information was available.
Motorized metering valve opens in increments. The numbers indicate how many increments (displayed in counts) the valve has been opened or closed. This valve, located in the conjunction with the regulator, is used to control pressure flow.
Sample holder
No information was available.
No information was available.
A sample holder is installed next to the manometer. No more information was available.
Sample holder has four parts: the inlet pipe, a wire screen, a washer, and an exhaust pipe.
CFP-1500 AEDLS-2C has two sample chambers for high and low flow rates capable of analyzing materials with a wide range of bubble points. Each chamber is equipped with a computer-controlled pneumatic piston which seals the samples being tested.
The sample is inserted inside the sample chamber which is connected to a tube of 1.0-inch diameter.
Testing mode
Wet and dry test respectively.
Wet and dry test respectively.
No information was available.
Dry run and wet run accordingly.
Dry up/wet up: It consists a sequence
Wet up/Calc. Dry: the wet curve is run with

17
which includes a dry and wet run with sample saturation accordingly.
the pressure increasing; a linear dry plot is extrapolated from the wet phase data.
Reference Vermeersch, et al., 1996
Lydon, et al., 2004 Aydilek, et al. (2006)
Elton, et al. (2007) Przybylo (2007) Fatema (2017)

18
Due to the use of different types of capillary flow devices, the pore size distribution results of a
geotextile could be different. Hence, it was necessary to validate the accuracy of the test results
by calibrating the eqipment.
2.6 Calibration Performed in the Previous Studies:
The calibration of the individual capillary flow equipment was performed by testing meshes of
known pore openings at both Auburn University (Elton et al., 2007), and Syracuse University
(Przybylo, 2007 and Kiffle, 2014). To evaluate the accuracy of the capillary flow test, Elton et al.
(2007) performed calibration test with US Sieve no. 100 (0.150 mm) and no. 200 (0.075 mm)
squared-holed screens, and a round-holed screen with a diameter of 0.140 mm. The result of the
calibration tests (see Table 2.4) shows that O100 obtained from the test is larger (11% - 28%) than
the actual hole size of squared holed screens, while for round-holed screen it is 34% larger than
the actual size. No information of wetting liquid was found.
Table 2.4: Calibration Results by Previous Studies
Reference Materials Hole size Wetting liquid Theoretical
measurement (microns)
Bubble point, O100 (microns)
% difference
Elton et al. (2007)
#100 Square Not mentioned 150 175 – 210 28.3
#200 Square Not mentioned 75 80 – 86 10.67
Round holed screen Round Not mentioned 140 175 – 200 33.92
Przybylo (2007)
Thin metal plate Cylindrical Galwick 166 207 20
Wire mesh Square Galwick 58 77 24
Membrane 1 Cylindrical Galwick 20 32 37
Membrane 2 Cylindrical Galwick 5 8.4 40
Kiffle (2014) Thin metal plate Round Mineral oil 180 244.71 – 254.44 38.65

19
Przybylo (2007) used a thin metal plate with cylindrical holes, wire mesh with square holes, and
two polycarbonate tracts etch membranes for calibration and he used galwick (surface tension of
15.9 dynes/cm) as a wetting liquid. The metal plate and wire mesh were examined using a
Scanning Electron Microscope (SEM). The average bubble point (O100) measured for metal plate
and wire mesh were 166 and 58 microns respectively. In Table 2.4, the results of calibration for 4
materials are provided. The measured bubble points were larger by 20% - 40% than the real pore
openings. The difference decreases as the pore size increases.
Kiffle, 2014 used a metallic screen with round holes (180 microns) of known size to validate the
accuracy of the equipment (PMI automated porometer, CFP 1003A) using mineral oil as a
wetting liquid (34.76 dynes/cm). The measured bubble point, O98 reported differs 38.65% from
the actual value measured by microscopic image (see Table 2.4).
2.7 Capillary Flow Test Apparatus
A state of the art capillary flow porometer, Geo Pore Pro (GPP 1001A) (see Figure 2.5) was used
in this study for the calibration tests. This device is fully automated and manufactured by the
Porous Materials Inc. (Ithaca, NY). It is consolidated by PMI with the evolution of improved
rotometer, manometer, pressure transducer and electronic system, new sample chamber design
etc. The equipment consists of an electronically controlled pressure regulator (0 to 4000 counts),
an absolute pressure transducer (usually 100 psi) and a differential pressure transducer (5 psi), 1
part in 20000 resolution, 0.15% accuracy in readings, two mass flow transducers (0 to 10 cc/min,
0 to 500 L/min), and a sample chamber. The sample chamber is connected to a tube of 1.0-inch
diameter. The PMI porometer’s APP CPCS is directed by a computer connected to the device,
which controls valves opening and closing.

20
Figure 2.5: Geo Pore Pro GPP-1001A at Syracuse University
Software Consideration:
A software “CapWin” is used to analyze the results obtained from capillary flow test and
produce a complete pore size distribution.
Wetting Liquid:
ASTM D 6767-16 suggests mineral oil as a standard wetting liquid. However, it does not restrict
use of other wetting liquids in the testing. Based on the properties of wetting liquid such as
surface tension and contact angle, the software automatically modifies the bubble point and pore
size distribution results.
Shape Factor:
A shape factor of 1 is used for round and square holes. However, for rectangular and irregular
holes 0.75 and 0.715 are used as a shape factor respectively.
Type of test:

21
Based on the sequence of the dry and wet phase during testing, the software can function the
testing phase. The operator can change the category of the test based on the order of the test
phases. Geo Pore Pro can perform four functions as follows: Wet up/ Dry down, Wet up/ Dry up,
Dry up/ Wet up, Wet up/ Calc. Dry. For this study, Wet up/ Calc. Dry was used to perform
capillary flow test, which stands for the wet curve is run with the pressure increasing; a linear dry
plot is extrapolated from the wet phase data. Therefore, the operator does not need to interrupt
during the test and the software will compose the dry curve itself. However, the results do not get
affected by the type of function. The operator can select for bubble point test only, in that case
the specimen will be saturated and tested only to obtain the largest pore opening and no pore size
distribution will be generated.
Max/Min. Pressure:
The selection of pressure lets the operator to determine the starting and terminating pressure.
Usually the starting pressure is assigned as 0 psi. The maximum or ending pressure is assigned in
a way so that the pressure can force the fluid to come out of the smaller pores and allow the data
to be collected to make a complete ‘S’ shaped pore size distribution. The highest maximum
pressure recorded during testing stage was 0.5 psi. With 0.5 psi pressure, the test usually takes 40
minutes to complete. However, one can choose higher pressure than 0.5 psi, which will take a
long time to complete one test.
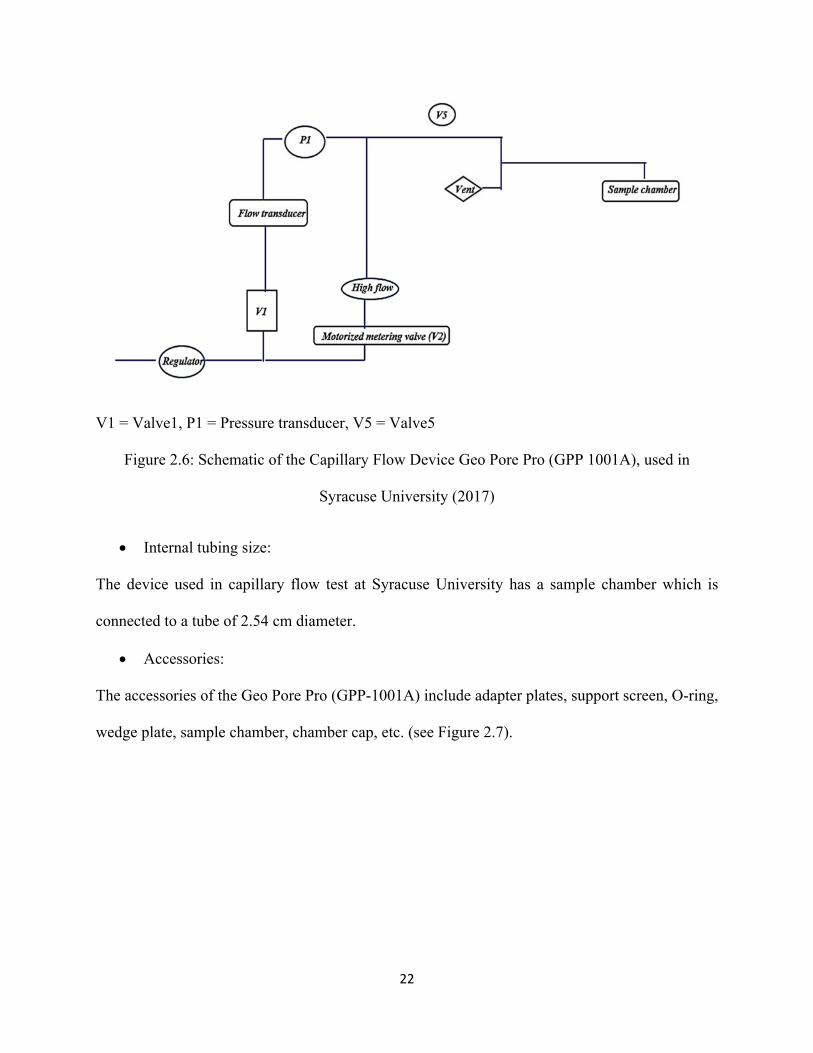
Regulator:
The pressure entering the system is controlled by the regulator (see Figure 2.6), which is defined
as counts (0 to 4000), referring to the maximum regulator setting. The amount of pressure
incremented with each count depends on the air pressure going into the machine, and regulator
range.
22
V1 = Valve1, P1 = Pressure transducer, V5 = Valve5
Figure 2.6: Schematic of the Capillary Flow Device Geo Pore Pro (GPP 1001A), used in
Syracuse University (2017)
Internal tubing size:
The device used in capillary flow test at Syracuse University has a sample chamber which is
connected to a tube of 2.54 cm diameter.
Accessories:
The accessories of the Geo Pore Pro (GPP-1001A) include adapter plates, support screen, O-ring,
wedge plate, sample chamber, chamber cap, etc. (see Figure 2.7).

23
(a) (b) (c) (d)
Figure 2.7: Accessories of Geo Pore Pro; (a) Adapter Plate; (b) Adapter Plate Built-in Screen,
Support Screen, and O-Ring; (c) Wedge Plate;(d) Sample Chamber and Cap
2.8 Calibration
To assess the accuracy of the capillary flow test results, calibration of the latest version of PMI
equipment, Geo Pore Pro (GPP-1001A) was performed. The GeoPore at Syracuse University was
calibrated using six different materials. The materials used in calibration included thin metal plate
with circular holes (made of 300 series Alloy stainless steel, 0.003-inch thickness), and
membranes. Table 2.5 shows the physical properties of the materials used in calibration.
Table 2.5: Physical Properties of Calibration Materials
Calibration material
Type Type of
pore Manufacturing company
Material type
Thickness, mm
Manufacturing pore opening,
mcirons
A1 Thin metal plate
Circular holes
E-FAB Photo Chemical Machining, Engineering, &
Fabrication
300 series Alloy
stainless steel
0.076 244
A2 Thin metal plate
Circular holes
E-FAB Photo Chemical Machining, Engineering, &
Fabrication
300 series Alloy
stainless steel
0.076 165
A3 Thin metal plate
Circular holes
E-FAB Photo Chemical Machining, Engineering, &
Fabrication
300 series Alloy
stainless steel
0.076 150

24
A4 Thin metal plate
Circular holes
E-FAB Photo Chemical Machining, Engineering, &
Fabrication
300 series Alloy
stainless steel
0.13 169
C1 Membrane Non-
uniform Collected from Porous
Materials, Inc. N/A 0.7 120
C2 Membrane Non-
uniform Collected from Porous
Materials, Inc. N/A 0.22
40
* E-FAB Photo Chemical Machining, Engineering, & Fabrication (1075 Richard Ave. Santa Clara, California 95050, USA)
The metal plate and membraes were examined using Scanning Electron Microscope in the
departement of Paper and Bioprocess Engineering at State University of New York College of
Environmental Science and Forestry (SEM, JSM-5800LV, manufactured by JEOL, Solutions for
Innovation). The SEM images of the calibration materials are provided below.
Specimen: Thin metal plate, A-1
Manufacturing company: E-FAB Photo
Chemical Machining, Engineering, &
Fabrication
Manufacturing pore size: 244 mcirons
Shape of pores:
Thickness: 0.076 mm

25
Specimen: Thin metal plate, A-2
Manufacturing company: E-FAB Photo
Chemical Machining, Engineering, &
Fabrication
Manufacturing pore size: 165 mcirons
Shape of pores:
Thickness: 0.076 mm
Specimen: Thin metal plate, A-3
Manufacturing company: E-FAB Photo
Chemical Machining, Engineering, &
Fabrication
Manufacturing pore size: 150 mcirons
Shape of pores:
Thickness: 0.076 mm
Specimen: Thin metal plate, A-4
Manufacturing company: E-FAB Photo
Chemical Machining, Engineering, &
Fabrication
Manufacturing pore size: 169 mcirons
Shape of pores:
Thickness: 0.13 mm

26
Specimen: Membrane, C-1
Manufacturing company: Collected from
Porous Materials, Inc.
Manufacturing pore size: 120 mcirons
Shape of pores: irregular
Thickness: 0.7 mm
Specimen: Membrane, C-2
Manufacturing company: Collected from
Porous Materials, Inc.
Manufacturing pore size: 40 mcirons
Shape of pores: irregular
Thickness: 0.22 mm
Figure 2.8: SEM Images of Calibration Materials: Thin Metal Plate (A1, A2, A3, and A4); and
Membrane (C1, C2)
In
Figure 2.8, A1 and A2 are thin metal plates with circular holes, A3 and A4 are thin metal plates
with 3D shaped circular holes; and C1 and C2 have irregular holes. Capillary flow device

27
measured the constriction size of pores, which means for meshes A3 and A4, it would measure
the smallest size of the hole.
2.8.1 Method
For the Capillary Flow test, the following sample preparation and testing procedures were
used.
2.8.1.1 Sample Preparation
Five to eight samples were cut with a measurement of 2-inch x 2-inch to fit in the sample
holder. The samples were selected randomly from the swatch/sheet of the sample.
ASTM D6767-16 suggests submerging the specimens into tap water for an hour and
allow to dry in the standard atmosphere for 24 hours. However, the metal plates were not
submerged into water, to avoid corrosion.
2.8.1.2 Wetting Liquid
Mineral oil was used to saturate the materials. Mineral oil was purchased from Walmart with a
batch number of NDC 49035-035-16 (equateTM). Its surface tension was measured by KRUSS
USA (1020 Crews Road, Suite K Matthews, NC 28105, USA). They used the Wilhelmy Plate
method to measure the surface tension of the mineral oil. Three tests were performed to achieve
the accuracy and 30 ml aliquots were used for each testing. Surface tension of each aliquot were
monitored for180 secs using the Wilhelmy plate method. In addition, the surface tension of water
was measured as a reference. The surface tension of mineral oil was reported as 31.67 – 31.71
dynes/cm.
2.8.1.3 Contact Angle Test Results
The dynamic contact angle between mineral oil and thin metallic plate was tested measured by
KRUSS USA (1020 Crews Road, Suite K Matthews, NC 28105, USA). They used the Wilhelmy

28
Plate method to measure the dynamic contact angle and five tests were performed to achieve the
accuracy. The receding contact angle between mineral oil and thin metallic plate was reported as
zero degree.
2.8.1.4 Cleaning Materials
The cleaning of the test specimens plays an important role in the calibration. Four thin metal
plates and two membranes were selected to use in the cleaning process prior to calibration. The
calibration materials were cleaned with Methanol (from PHARMCO-AAPER, Batch no: 12214-
03). The following procedure was used:
A 2-inch x 2-inch specimen was soaked in Methanol for 1/2 hour in a shaker and
removed.
Then the specimen was dried thoroughly for 24 hours and transferred into the Porometer
for testing.
Cleaning is very important for calibration materials and it can affect the result
significantly. The results of cleaned and uncleaned samples are produced later.
2.8.1.5 Testing Procedure
The common procedure used in the calibration test either with or without cleaning process is as
follows:
The specimens were submerged in mineral oil for a period of 1 hour.
Test was conducted with Wet up/ Calc. dry and a linear dry curve. The tests were performed
in the wet state first and then the sample was pressurized to calculate the dry curve by the
software.
The following set up was made for the test with mineral oil as a wetting liquid; a gasket of
0.5-inch diameter at the bottom – specimen – a 0.5-inch adapter plate – clamp (see Figure

29
2.9). Then the chamber cap was placed above the adapter plate to secure the system
provided a tight seal around the sample to ensure that no air escaped during the test.
During testing 0.5 psi was kept as maximum pressure. For metallic screen with circular
holes, a shape factor of 1.0 was used; for membranes with irregular holes a shape factor of
0.715 was used (Jena, 2014).
Figure 2.9: Test Setup for Calibrating Materials with Mineral Oil
The test was started and the pressure was increased at a constant rate. The pressure and
flow rate were recorded by the software.
Each test took approximately 30-35 minutes to complete.
After the test the pressure was reduced itself, the holder and adapter plate were removed
and holder was cleaned for the next test.
2.8.1.6 Factors Affecting the Results
During testing with mineral oil as a liquid, the hole of the adapter plate should be large
enough for mineral oil to get enough pressure to be pushed out from the pores.
Otherwise, the results obtained would be 2-3 times larger than the actual size.
It was noticed that the maximum pressure (0.5 psi) setup for one test fluctuated
frequently, even it became zero at some points. Sometimes the pressure dropped down to
negative and the test stopped itself without any results. There is a regulator inside the test
equipment (Geo Pore Pro - 1001 A) which controls the pressure, which was beyond the
30
capacity of the operator to manage. When the pores are pressurized to drain out the
liquid, there might be a little drop in the regulator which affects the test. To increase the
pressure, the regulator of the equipment needed to increase up to 1200 – 1800 counts. It
takes 45 – 50 minutes to finish the test rather than 30 - 35 minutes (usual time). However,
it does not affect the test results.
Sometimes it happened that the specimen could not hold the liquid in the pores and the
flow was not 100% in the test. Therefore, the smaller pores did not get enough pressure to
discharge the liquid and the software could not measure the smaller pores in the specimen
During the test, it was ensured that the plate and gasket were dry completely. The gasket,
metal plates, clamp should be cleaned with alcohol if the fluid needs to be changed.
It should be kept in mind that Geo Pore is measuring the complete pore size distribution. Therefore, in the case of materials that have 3-D shaped holes, the smallest pore size is measured as the largest pore, O100 or bubble point diameter (See A4 in
Figure 2.8).
2.8.1.7 Cleaning of the Equipment during Test
ASTM D6767 suggests cleaning the geosynthetics with water for an hour before testing. Since,
the metallic screens may get corroded, Methanol was used to clean the calibration materials
instead. However, with several tests performed in the current study, it was noticed that only
cleaning the test specimens is not enough to get accurate calibration results. Along with the test
specimens, the test chamber, gasket, and adapter plate needed to be cleaned properly after each
test. Otherwise, mineral oil would not get pressurized enough to discharge from the pores.
Cleaning plays a very important role on the calibration test results. A broad deviation in the test
results was noticed with and without the cleaning process. Without cleaning the test specimens
and equipment, the O100 measured with mineral oil was two times larger than the actual pore size
31
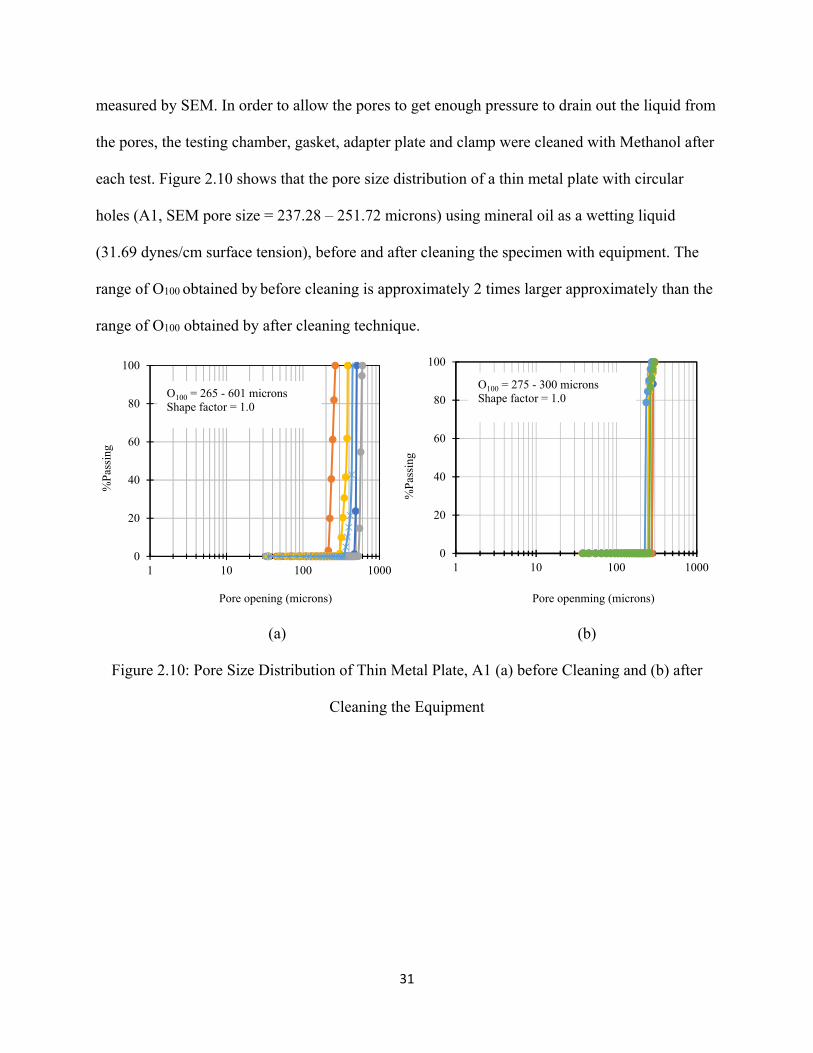
measured by SEM. In order to allow the pores to get enough pressure to drain out the liquid from
the pores, the testing chamber, gasket, adapter plate and clamp were cleaned with Methanol after
each test. Figure 2.10 shows that the pore size distribution of a thin metal plate with circular
holes (A1, SEM pore size = 237.28 – 251.72 microns) using mineral oil as a wetting liquid
(31.69 dynes/cm surface tension), before and after cleaning the specimen with equipment. The
range of O100 obtained by before cleaning is approximately 2 times larger approximately than the
range of O100 obtained by after cleaning technique.
(a) (b)
Figure 2.10: Pore Size Distribution of Thin Metal Plate, A1 (a) before Cleaning and (b) after
Cleaning the Equipment
0
20
40
60
80
100
1 10 100 1000
%P
assi
ng
Pore opening (microns)
O100 = 265 - 601 micronsShape factor = 1.0
0
20
40
60
80
100
1 10 100 1000
%P
assi
ng
Pore openming (microns)
O100 = 275 - 300 micronsShape factor = 1.0

32
(a) (b)
Figure 2.11: Pore Size Distribution of Thin Metal Plate, A3 (a) before Cleaning and (b) after
Cleaning the Equipment
Figure 2.11 shows the capillary flow test results of A3 (SEM pore size = 120 – 130.91 microns),
a thin metal plate of circular holes using mineral oil as a wetting liquid (31.69 dynes/cm surface
tension), before and after cleaning. The difference in the range of pore sizes before and after
cleaning process is 45 – 175 microns. The pore size distribution of both thin metal plates after
cleaning process provided more reproducible results. The cleaning of testing device made a
notable change in the result of bubble point, O100 for both thin metal plates. However, the range
is still 40 – 50 microns larger than the actual pore size obtained by SEM analyzer.
2.8.1.8 Results
The largest pore size (O100) was measured by the Capillary flow test for 4 metallic screens with
circular and cylindrical holes and 2 membranes with irregular holes. Mineral oil (31.69 dynes/cm
surface tension) was used for all tests and a shape factor of 1 was used for uniform holes and
0.715 was used for irregular holes. In Table 2.6, manufacturing pore sizes, SEM image measured
pore sizes and O100 from the Capillary Flow test for six thin metal plates and membranes are
0
20
40
60
80
100
1 10 100 1000
%P
assi
ng
Pore opening (microns)
O100 = 205 - 365 micronsShape factor = 1.0
0
20
40
60
80
100
1 10 100 1000
%P
assi
ng
Pore opening (microns)
O100 = 160 - 192.5 micronsShape factor = 1.0

33
shown. For A1 and A2, the manufacturing pore sizes fall in the range of SEM pore sizes,
whereas, for A3 and A4, the manufacturing pore sizes are higher than the range of SEM pore
sizes. Metal sheets, A3 and A4 have not cylindrical holes, one side smaller than other (see Figure
2.8). Since, the manufacturing values are larger than the SEM sizes for A3 and A4, which means
the manufacturing values were reported as the largest sizes and SEM values were reported as the
constriction sizes.
Table 2.6: Capillary Flow Test Results for Thin Metallic Plates and Membranes
Wetting liquid: Mineral oil
Type Manufacturing process
Pore opening
Shape factor
Manufacturing Pore size, microns
SEM pore size, microns
Measured O100, microns
Difference in pore opening, microns (SEM ~ O100)
A1 Thin metal
plate Circular 1 244
Range = 237.28 – 251.72
Range = 275 – 300
Range = 37.72 – 48.28
Mean = 244.5 Mean = 289.5
Standard deviation = 10.21
Standard deviation = 9.29
A2 Thin metal
plate Circular 1 165
Range = 160 – 169.09
Range = 181 - 214.5
Range = 21 - 45.41
Mean = 164.55 Mean = 202.07
Standard deviation = 6.43
Standard deviation = 11.83
A3 Thin metal
plate Cylindrical 1 150
Range = 120 – 130.91
Range = 160 - 192.5
Range = 40 - 61.59
Mean = 125.45 Mean = 174.83
Standard deviation = 7.71
Standard deviation = 11.14
A4 Thin metal
plate Cylindrical 1 169 Range = 106– 112
Range = 161 - 182.5
Range = 55 - 70.5

34
Mean = 109 Mean = 169.43
Standard deviation = 4.24
Standard deviation = 7.41
C1 Membrane Irregular 0.715 120 N/A
Range = 135 - 189.5
N/A Mean = 170.42
Standard deviation = 19.50
C2 Membrane Irregular 0.715 40 N/A
Range = 46.5 - 53
N/A Mean = 49.35
Standard deviation = 2.66
The pore sizes obtained by SEM images and Capillary flow test were reported in range rather
than a single number. The membranes have complex pore sizes, which made it difficult to have
any measurements from SEM images. The computed mean and standard deviation of the pore
sizes obtained by SEM image and Capillary flow test are given in Table 2.6. The difference
between SEM measurements and test results was provided in Table 2.6 for 4 metallic screens. It
was found that the test results were 15.89% - 62.94% larger than the pore sizes measured by
SEM images. It was noticed that the %difference increases with the decreasing actual pore sizes.
The test results reported were higher than the manufacturing values as well. Based on the
comparison made in Table 2.6, it could be stated that the Capillary flow test measured the largest
opening sizes of the metallic screens and membranes rather than the constriction sizes.
Figure 2.12 shows the range of O100 (obtained from the test) plotted against the SEM pore sizes.
The measured pore sizes were showed in the plot as a range rather than a single number, because
the measured pore sizes for A1 to A4 by the Capillary flow test were 20 – 70 microns larger than

35
the SEM measurements and it was found that not all the holes were accurately identical. It was
also noticed that the SEM pore sizes were equally smaller than manufacturing values (See Table
2.6).
Figure 2.12: Measured O100 vs. SEM Measurements for Thin Metallic Plates and Membranes
It is clearly noticed from Figure 2.12 that the ranges of measured O100 by the Capillary flow test
were larger than the ranges of pore sizes obtained by SEM images. The dotted line plotted Figure
2.12 provided the SEM measurements of 4 metallic screens. Due to the complex and irregular
pore sizes, SEM images could not measure the pore sizes of 2 membranes (C1 and C2).
Therefore, to evaluate the difference between O100 (obtained by Capillary flow test) and
manufacturing values, O100 were plotted as a function of manufacturing pore sizes in Figure 2.13.
0
50
100
150
200
250
300
350
0 50 100 150 200 250 300 350
Mea
sure
d O
100,
mic
rons
SEM pore sizes, microns
A1
A2
A3
A4

36
Figure 2.13: Measured O100 vs. Manufacturing Pore Sizes for Thin Metallic Plates and Membranes
Figure 2.13 showed the values of pore openings obtained by the test as a range, however, the
manufacturing values were reported as a single number. It was noticed that the range of
measured pore size is larger than the manufacturing values as well.
Based on the results obtained from the capillary flow test, larger pore values were compared to
SEM measurements and manufacturing values and the percent increase in pore size is inversely
proportional to the actual size of a specimen.
To validate the accuracy of the calibration test, two thin metal plates with circular holes (A1 and
A3) and known pore sizes were sent to an industry, SAGEOS (CTT Group) to perform capillary
flow test. The device used in the test was Geo Pore Pro (GPP 1001A) manufactured by PMI.
0
50
100
150
200
250
300
350
0 50 100 150 200 250 300 350
Mea
sure
d O
100,
mic
rons
Manufacturing pore size, microns
A1
A2
A3
A4
C1
C2

37
Mineral oil (32.51 dynes/cm surface tension) was used in the test as a wetting liquid. The results
obtained by SAGEOS were reported as 335.38 microns for A1 and 189.09 microns for A3.
2.9 Summary
Four thin metallic plates and two membranes were used in the calibration of the Geo Pore Pro
(GPP-1001A), following the ASTM D 6767. Mineral oil (31.69 dynes/cm surface tension) was
used as a wetting liquid for the calibration tests. The surface tension of the wetting liquid and
dynamic contact angle between wetting liquid and thin metallic plate were measured tested as
well. It was found that cleaning of the specimens and equipment made a significant difference in
the test results, which was not mentioned in the ASTM D6767. The results (O100) obtained by the
Capillary flow test were larger than pore sizes obtained by SEM measurements and
manufacturers. The calibration results obtained in the current study were compared with the
results obtained by Przybylo (2007) and a similar trend of larger test results was found.
However, ASTM D 6767 was not followed in the test performed by Przybylo (2007).
2.10 References
ASTM D6767-16 Standard Test Method for Pore Size Characteristics of Geotextiles by
Capillary Flow Test, ASTM International, West Conshohocken, PA, 2014.
ASTMF316, “Standard Test Method for Pore Size Characteristics of Membrane Filters by
Bubble Point and Mean Flow Pore Test”, American Society for Testing and Materials,
West Conshohocken, Pennsylvania, USA.
Akshaya Jena, 'Wetting Liquid Extrusion Techniques: Part I-Capillary Flow Porometry',
PMI Short Course May 2009, 2.0-2.30.
Akshaya Jena and Krishna Gupta, 'Characterization of Pore Structure of Filtration Media',
Fluid/Particle Separation Journal, Vol. 14, No. 3, 2002, 227-241.

38
Aydilek, A. H., D'Hondt, D., & Holtz, R. D. (2006). Comparative evaluation of geotextile
pore sizes using bubble point test and image analysis. (2006): 1-9.
Bhatia, S. K., & Smith, J. L. (1996). Geotextile characterization and pore-size distribution:
Part II. A review of test methods and results. Geosynthetics International, 3(2), 155-180.
Bhatia, S. K., & Smith, J. L. (1994). Comparative study of bubble point method and
mercury intrusion porosimetry techniques for characterizing the pore-size distribution of
geotextiles. Geotextiles and Geomembranes, 13(10), 679-702.
Cap.Fl.5-12- 09 Capillary Flow Porometer 7.0, Porous Materials Inc.
Christopher, B.R. and Holtz, R.D., 1985, “Geotextile Engineering Manual”, U.S.
Department of Transportation, Federal Highway Administration, Washington, DC, USA,
Report No. FHWA-TS-86/203, March 1985, 1044.
Elton, D. J., Hayes, D. W., & Adanur, S. (2006). Bubble point testing of geotextiles:
apparatus and operation. (2006): 1-8.
Elton, D. J., & Hayes, D. W. (2007). The Bubble point Method for Characterizing
Geotextile Pore Size. In Geosynthetics in Reinforcement and Hydraulic Applications (1-
10). ASCE.
Fannin, J. (2006). The use of geosynthetics as filters in civil engineering. Geosynthetics in
Civil Engineering, Sarsby, R. W., Editor, Woodhead Publishing, Cambridge, UK, 127–
147.
Fischer, G. R., 1994, “The Influence of Fabric Pore Structure on the Behavior of Geotextile
Filters,” Ph.D. Dissertation, University of Washington, Seattle, WA, 501.
Fischer, G.R., Holtz, R.D. and Christopher, B.R., 1996, “Characteristics of Geotextile Pore
Structure”, Recent Developments in Geotextile Filters and Prefabricated Drainage
39
Geocomposites, Bhatia, S.K. and Suits, L.D., Editors, ASTM Special Technical
Publication 1281, proceedings of a symposium held in Denver, Colorado, USA, June 1995,
in press.
Giroud, J.P., 1982, “Filter Criteria for Geotextiles”, Proceedings of the Second
International Conference on Geotextiles, IFAI, Vol. 1, Las Vegas, Nevada, USA, August
1982, 103-108.
Giroud, J.P. (1996). “Granular Filters and Geotextile Filters.” Proceedings of Geofilters
‘96, Montreal, Canada, 565-680.
Gupta, K. (2014). Wetting Liquid Extrusion Techniques: Part I- Capillary Flow Porometry.
Jena, A. K., & Gupta, K. M. (1999). In-plane compression porometry of battery separators.
Journal of Power Sources, 80(1), 46-52.
Jena, A., & Gupta, K. (2003). Liquid extrusion techniques for pore structure evaluation of
nonwovens. International Nonwovens Journal, 12(3), 45-53.
Kiffle, Z. B., Bhatia, S. K., Khachan, M. M. & Jackson, E. K. (2014). Effect of pore size
distribution on sediment retention and passing.
Koerner, R.M., Designing with Geosynthetics, 2nd edition, Prentice Hall, Englewood
Cliffs, N.J., 1990.
Koerner, R. M., & Koerner, G. R. (2014). On the Need for a Better Test Method Than Dry
or Wet Sieving to Obtain the Characteristic Opening Size for Geotextile Filter Design
Purposes. Geosynthetic Institute’s White Paper, 31.
Lydon, R., Mayer, E., & Rideal, G. R. (2004, April). Comparative methods for the pore
size distribution of woven and metal filter media. In Ninth world filtration congress, New
Orleans, LA, USA (1-6).

40
Przybylo, Lukasz (2007). An investigation of the Bubble Point method and Capillary flow
porometry for geotextiles characterization. MS Thesis. Syracuse University, Syracuse, NY,
USA.
Rankilor, P.R., 1981, “Membranes in Ground Engineering”, John Wiley, Chichester,
United Kingdom, 377.
Smith, J. L., & Bhatia, S. K. (1995). Application of the bubble point method to the
characterization of the pore-size distribution of geotextiles. (1995): 94-105.
Vermeersch, O. G., & Mlynarek, J. (1996). Determination of the pore size distribution of
nonwoven geotextiles by a modified capillary flow porometry technique. In Recent
developments in geotextile filters and prefabricated drainage geocomposites. ASTM
International.
Washburn, E.W. (1921). Proceedings of the National Academy of Science, Vol. 7, No.
115.

41
Chapter 3 Capillary Flow Test Results
3.1 Introduction:
A research study was undertaken at Syracuse University with 51 different types of geotextiles to
measure the largest pore size O98, bubble point and pore size distribution of geotextiles using the
Capillary flow test (ASTM D 6767). This study included 7 monofilament woven, 10 slit-film
woven, 1 fibrillated fiber woven, 2 multifilament, 8 heat-bonded non-woven, 21 needle-punched
non-woven and 2 geo-composites (a combination of woven and non-woven geotextiles). The
geotextiles were selected based on the difference in manufacturing process from 4 US, 1
Canadian and 1 UK geotextile manufacturers. These manufacturers produce diverse kinds of
geotextiles to fulfill the multi-purpose requirements of industries and research institutions. Based
on the capillary flow technique stated in the ASTM D 6767 – 16, pore size distribution of each
geotextile was measured. From the pore size distribution, O98 (bubble point according to ASTM)
is calculated. O50 and O15 are also calculated. Dry sieving tests (ASTM D 4751) were also
performed for selected geotextiles. Physical properties including mass per unit area and thickness
were measured. Relationships between O98 and mass per unit area, permeability and O98, O50,
O10 were investigated.
Woven geotextiles of high tensile strength and low elongation are produced on a loom from
monofilament, multifilament or slit-film fibers, to provide dimensional stability, and these
geotextiles are used for soil reinforcement, separation, and filtration. For woven geotextiles,
Warp threads (longitudinal thread in a roll held in tension on a frame), run along the length of the
loom are interrupted by weft threads (transverse thread). Four approaches are used in the
weaving process including shedding, picking, battening and taking up and letting off (Joseph
1981). Based on the fiber types, woven geotextiles are classified as monofilament, multifilament,
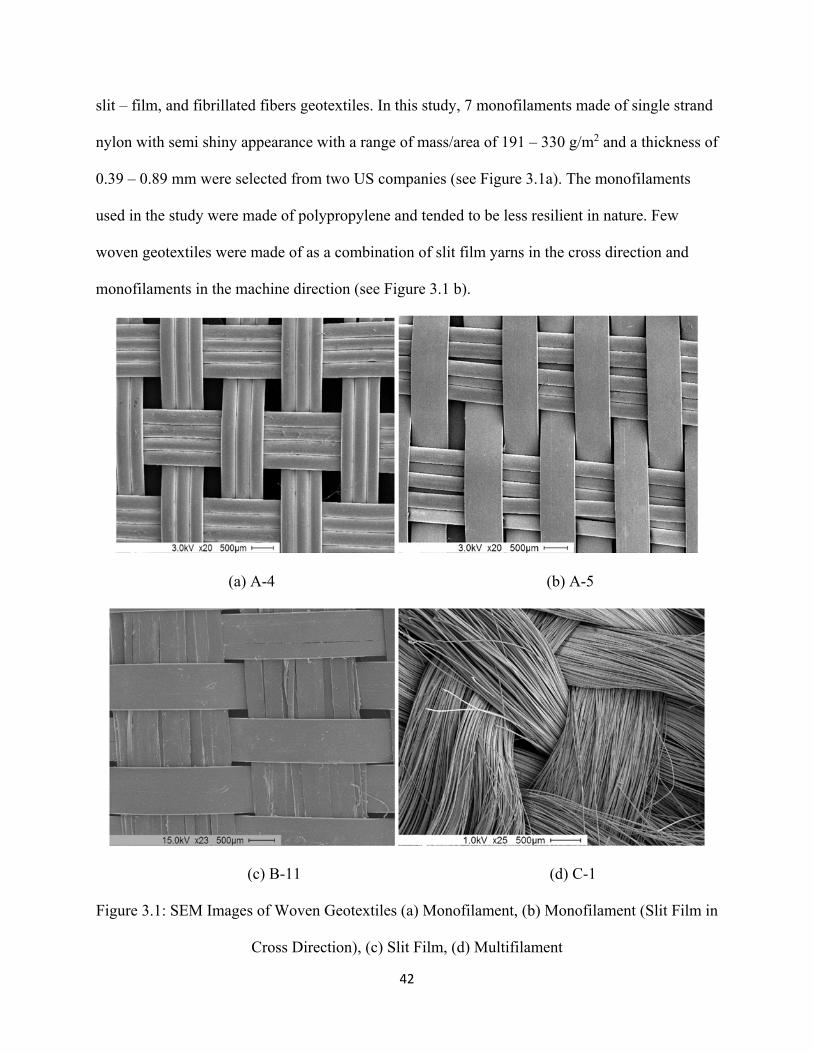
42
slit – film, and fibrillated fibers geotextiles. In this study, 7 monofilaments made of single strand
nylon with semi shiny appearance with a range of mass/area of 191 – 330 g/m2 and a thickness of
0.39 – 0.89 mm were selected from two US companies (see Figure 3.1a). The monofilaments
used in the study were made of polypropylene and tended to be less resilient in nature. Few
woven geotextiles were made of as a combination of slit film yarns in the cross direction and
monofilaments in the machine direction (see Figure 3.1 b).
(a) A-4 (b) A-5
(c) B-11 (d) C-1
Figure 3.1: SEM Images of Woven Geotextiles (a) Monofilament, (b) Monofilament (Slit Film in
Cross Direction), (c) Slit Film, (d) Multifilament
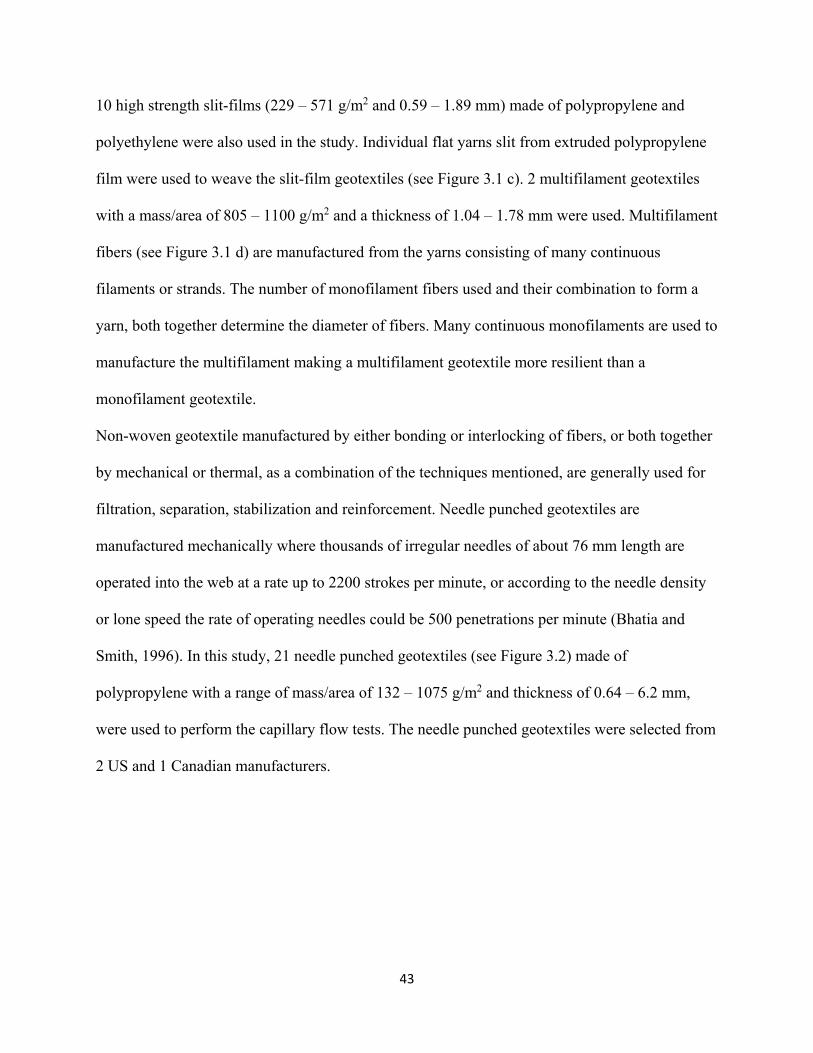
43
10 high strength slit-films (229 – 571 g/m2 and 0.59 – 1.89 mm) made of polypropylene and
polyethylene were also used in the study. Individual flat yarns slit from extruded polypropylene
film were used to weave the slit-film geotextiles (see Figure 3.1 c). 2 multifilament geotextiles
with a mass/area of 805 – 1100 g/m2 and a thickness of 1.04 – 1.78 mm were used. Multifilament
fibers (see Figure 3.1 d) are manufactured from the yarns consisting of many continuous
filaments or strands. The number of monofilament fibers used and their combination to form a
yarn, both together determine the diameter of fibers. Many continuous monofilaments are used to
manufacture the multifilament making a multifilament geotextile more resilient than a
monofilament geotextile.
Non-woven geotextile manufactured by either bonding or interlocking of fibers, or both together
by mechanical or thermal, as a combination of the techniques mentioned, are generally used for
filtration, separation, stabilization and reinforcement. Needle punched geotextiles are
manufactured mechanically where thousands of irregular needles of about 76 mm length are
operated into the web at a rate up to 2200 strokes per minute, or according to the needle density
or lone speed the rate of operating needles could be 500 penetrations per minute (Bhatia and
Smith, 1996). In this study, 21 needle punched geotextiles (see Figure 3.2) made of
polypropylene with a range of mass/area of 132 – 1075 g/m2 and thickness of 0.64 – 6.2 mm,
were used to perform the capillary flow tests. The needle punched geotextiles were selected from
2 US and 1 Canadian manufacturers.
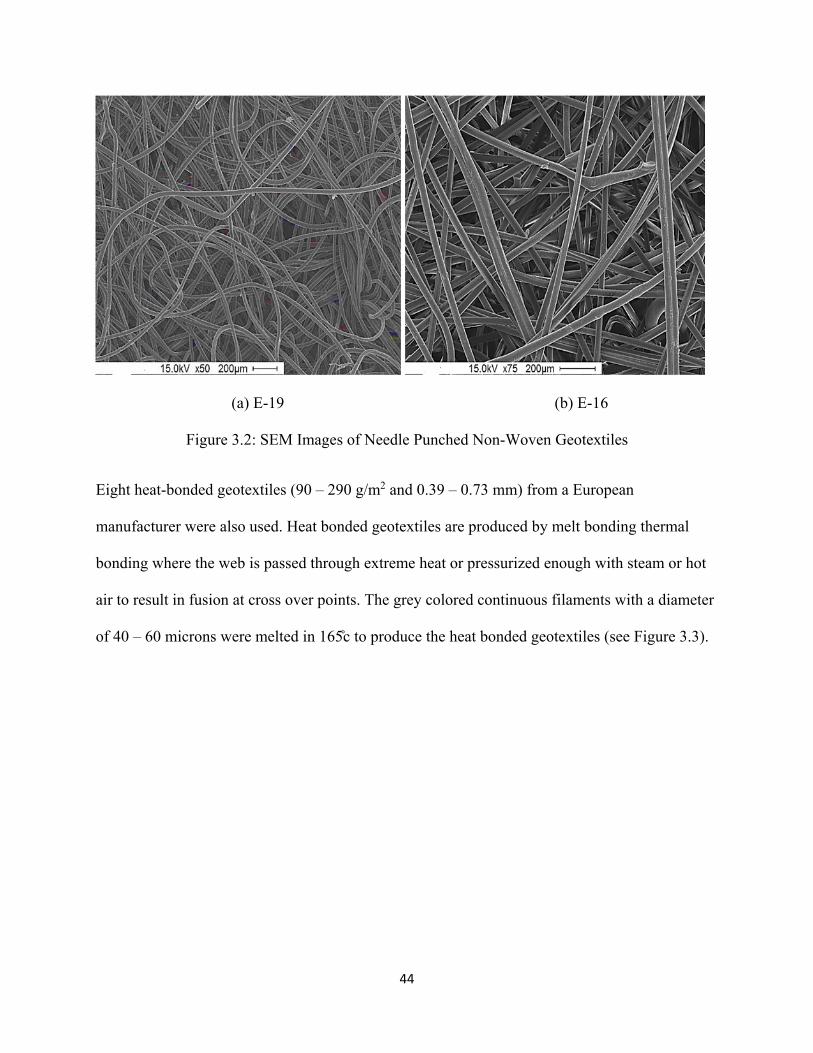
44
(a) E-19 (b) E-16
Figure 3.2: SEM Images of Needle Punched Non-Woven Geotextiles
Eight heat-bonded geotextiles (90 – 290 g/m2 and 0.39 – 0.73 mm) from a European
manufacturer were also used. Heat bonded geotextiles are produced by melt bonding thermal
bonding where the web is passed through extreme heat or pressurized enough with steam or hot
air to result in fusion at cross over points. The grey colored continuous filaments with a diameter
of 40 – 60 microns were melted in 165̊c to produce the heat bonded geotextiles (see Figure 3.3).
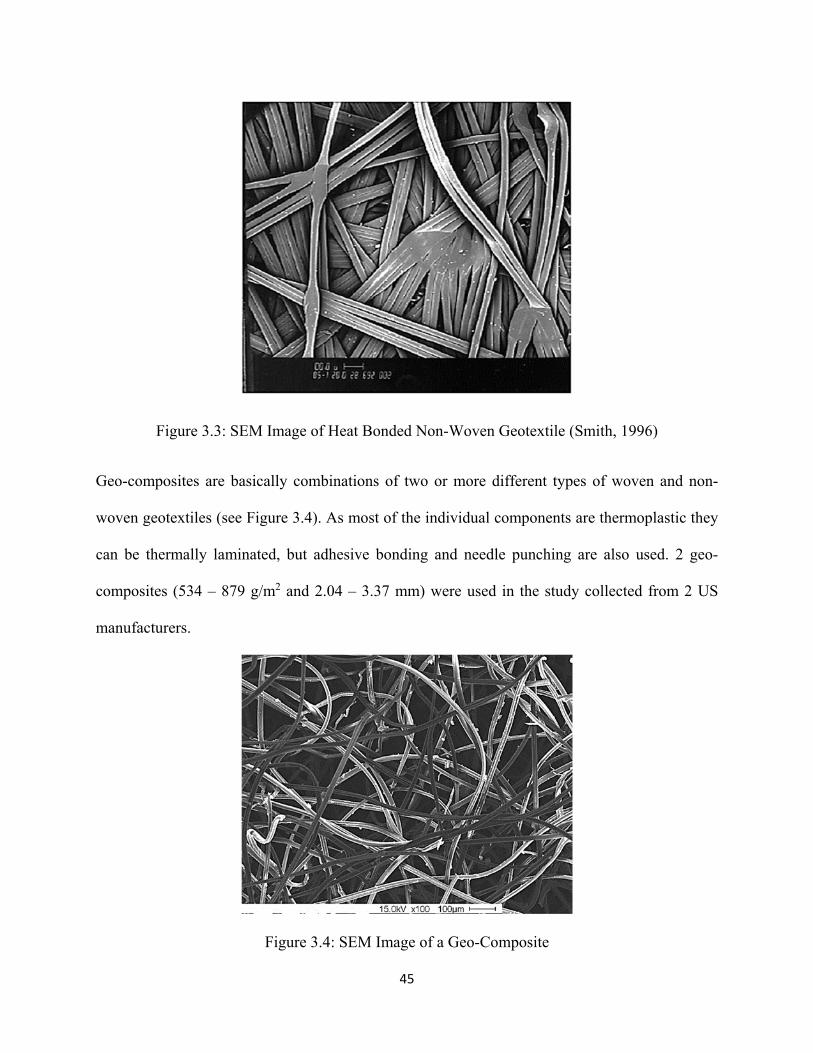
45
Figure 3.3: SEM Image of Heat Bonded Non-Woven Geotextile (Smith, 1996)
Geo-composites are basically combinations of two or more different types of woven and non-
woven geotextiles (see Figure 3.4). As most of the individual components are thermoplastic they
can be thermally laminated, but adhesive bonding and needle punching are also used. 2 geo-
composites (534 – 879 g/m2 and 2.04 – 3.37 mm) were used in the study collected from 2 US
manufacturers.
Figure 3.4: SEM Image of a Geo-Composite

46
The physical properties of these geotextiles, selected from different manufacturing companies,
are provided in Table 3.1. The mass per unit area for each geotextile was measured following
ASTM D 5261 and the thickness was measured using a slide calipers. Table 3.1 shows that
majority of the geotextiles are made of polypropylene (PP) and only 3 out of 51 geotextiles are
made of polyethylene (PET). All geotextiles are divided into 6 categories: Type A is
monofilament woven geotextiles, Type B is slit film woven geotextiles, Type C is multifilament
woven geotextiles, Type D is heat – bonded non-woven geotextiles, type E is needle – punched
non-woven geotextiles, and type F is geo – composite (a combination of woven and non-woven
geotextile). The mass per unit area and thickness given by the manufacturers are also provided in
the Table 3.1. A difference (0.44% – 44%) could be noticed in the measured mass per unit area
and thickness with manufacturing’s values. Even after using the same standard ASTM D5261,
few geotextiles showed a large variation in the mass per unit area. For an example: B-11 has a
manufacturing mass per unit area of 585 g/m2 and a range of measured mass per unit area of
388 – 408 g/m2.
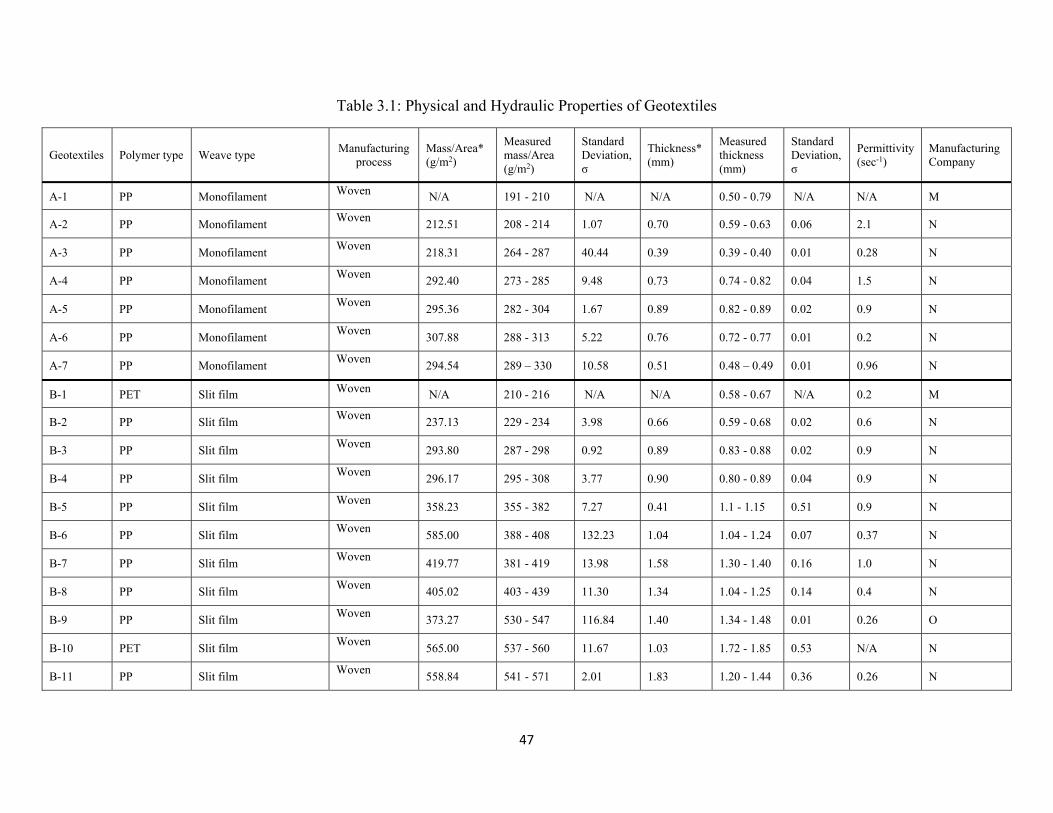
47
Table 3.1: Physical and Hydraulic Properties of Geotextiles
Geotextiles Polymer type Weave type Manufacturing
process Mass/Area* (g/m2)
Measured mass/Area (g/m2)
Standard Deviation, σ
Thickness* (mm)
Measured thickness (mm)
Standard Deviation, σ
Permittivity (sec-1)
Manufacturing Company
A-1 PP Monofilament Woven N/A 191 - 210 N/A N/A 0.50 - 0.79 N/A N/A M
A-2 PP Monofilament Woven
212.51 208 - 214 1.07 0.70 0.59 - 0.63 0.06 2.1 N
A-3 PP Monofilament Woven
218.31 264 - 287 40.44 0.39 0.39 - 0.40 0.01 0.28 N
A-4 PP Monofilament Woven
292.40 273 - 285 9.48 0.73 0.74 - 0.82 0.04 1.5 N
A-5 PP Monofilament Woven
295.36 282 - 304 1.67 0.89 0.82 - 0.89 0.02 0.9 N
A-6 PP Monofilament Woven
307.88 288 - 313 5.22 0.76 0.72 - 0.77 0.01 0.2 N
A-7 PP Monofilament Woven
294.54 289 – 330 10.58 0.51 0.48 – 0.49 0.01 0.96 N
B-1 PET Slit film Woven N/A 210 - 216 N/A N/A 0.58 - 0.67 N/A 0.2 M
B-2 PP Slit film Woven
237.13 229 - 234 3.98 0.66 0.59 - 0.68 0.02 0.6 N
B-3 PP Slit film Woven
293.80 287 - 298 0.92 0.89 0.83 - 0.88 0.02 0.9 N
B-4 PP Slit film Woven
296.17 295 - 308 3.77 0.90 0.80 - 0.89 0.04 0.9 N
B-5 PP Slit film Woven
358.23 355 - 382 7.27 0.41 1.1 - 1.15 0.51 0.9 N
B-6 PP Slit film Woven
585.00 388 - 408 132.23 1.04 1.04 - 1.24 0.07 0.37 N
B-7 PP Slit film Woven
419.77 381 - 419 13.98 1.58 1.30 - 1.40 0.16 1.0 N
B-8 PP Slit film Woven
405.02 403 - 439 11.30 1.34 1.04 - 1.25 0.14 0.4 N
B-9 PP Slit film Woven
373.27 530 - 547 116.84 1.40 1.34 - 1.48 0.01 0.26 O
B-10 PET Slit film Woven
565.00 537 - 560 11.67 1.03 1.72 - 1.85 0.53 N/A N
B-11 PP Slit film Woven
558.84 541 - 571 2.01 1.83 1.20 - 1.44 0.36 0.26 N

48
Geotextiles Polymer type Weave type Manufacturing process
Mass/Area* (g/m2)
Measured mass/Area (g/m2)
Standard Deviation, σ
Thickness* (mm)
Measured thickness (mm)
Standard Deviation, σ
Permittivity (sec-1)
Manufacturing Company
C-1 PET Multifilament Woven 813.00 805 - 912 32.17 1.08 1.04 - 1.25 0.05 0.37 N
C-2 PP Multifilament Woven
1117.00 1078 - 1100 19.80 1.76 1.62 – 1.78 0.04 0.35 N
D-1 PP Heat bonded Non-woven 90 90 - 100 3.54 0.39 0.3 – 0.38 0.04 1 P
D-2 PP Heat bonded Non-woven
N/A 88 - 108 N/A N/A 0.27 - 0.34 N/A N/A P
D-3 PP Heat bonded Non-woven
110 104 – 118 0.71 0.43 0.33 – 0.4 0.05 0.89 P
D-4 PP Heat bonded Non-woven
125 120 – 139 3.18 0.45 0.38 – 0.45 0.02 0.486 P
D-5 PP Heat bonded Non-woven
136 140 – 148 5.66 0.47 0.33 – 0.43 0.06 0.51 P
D-6 PP Heat bonded Non-woven
150 144 – 182 9.19 0.48 0.4 – 0.5 0.02 0.45 P
D-7 PP Heat bonded Non-woven
190 194 – 210 8.49 0.57 0.48 – 0.54 0.04 0.29 P
D-8 PP Heat bonded Non-woven
290 279 - 340 13.79 0.73 0.54 – 0.64 0.10 0.17 P
E-1 PP Needle - punched Non-woven N/A 132 - 162 N/A N/A 0.7 - 0.83 N/A N/A Q
E-2 PP Needle - punched Non-woven
N/A 146 - 163 N/A N/A 0.64 - 0.89 N/A 1.7 N
E-3 PP Needle - punched Non-woven
185 226 – 235 1.3 1.3 0.99 – 1.2 0.14 0.61 Q
E-4 PP Needle - punched Non-woven
203 158 – 169 1.7 1.7 0.83 – 0.88 0.60 1.6 Q
E-5 PP Needle - punched Non-woven
N/A 223 – 256 N/A N/A 1.02 - 1.32 N/A 1.5 N
E-6 PP Needle - punched Non-woven
N/A 251 – 258 N/A N/A 0.80 - 1.09 N/A 1.4 N
E-7 PP Needle - punched Non-woven
271 212 - 228 2.3 2.3 1.00 – 1.19 0.85 1.26 Q
E-8 PP Needle - punched Non-woven
285 270 – 287 1.8 1.8 1.29 – 1.44 0.31 0.3 Q
E-9 PP Needle - punched Non-woven
N/A 268 - 306 N/A N/A 1.48 - 2.0 N/A 1.5 N
E-10 PP Needle - punched Non-woven
N/A 268 - 325 N/A N/A 1.14 - 1.34 N/A 1.4 N

49
Geotextiles Polymer type Weave type Manufacturing process
Mass/Area* (g/m2)
Measured mass/Area (g/m2)
Standard Deviation, σ
Thickness* (mm)
Measured thickness (mm)
Standard Deviation, σ
Permittivity (sec-1)
Manufacturing Company
E-11 PP Needle - punched Non-woven
N/A 265 - 330 N/A N/A 0.83 - 1.02 N/A 1.4 M
E-12 PP Needle - punched Non-woven
N/A 289 - 365 N/A N/A 1.18 - 1.5 N/A 0.8 N
E-13 PP Needle - punched Non-woven
N/A 319 - 346 N/A N/A 1.53 - 1.98 N/A 1.36 N
E-14 PP Needle - punched Non-woven
N/A 367 - 407 N/A N/A 2.2 - 2.88 N/A 1 N
E-15 PP Needle - punched Non-woven
N/A 372 - 400 N/A N/A 1.62 - 1.72 N/A 1 M
E-16 PP Needle - punched Non-woven
N/A 384 - 539 N/A N/A 1.93 - 2.13 N/A 0.7 N
E-17 PP Needle - punched Non-woven
N/A 432 - 462 N/A N/A 1.87 - 2.14 N/A 0.8 N
E-18 PP Needle - punched Non-woven
490 531 - 587 2.9 2.9 2.48 – 2.89 0.15 0.15 Q
E-19 PP Needle - punched Non-woven
N/A 518 - 563 N/A N/A 3.47 - 4.12 N/A 0.9 N
E-20 PP Needle - punched Non-woven
N/A 545 - 648 N/A N/A 3.49 - 4.0 N/A 0.7 N
E-21 PP Needle - punched Non-woven
930 937 - 1075 53.74 5.8 5.5 - 6.2 0.035 0.27 Q
F-1 PP Geo -composite Combination of woven and non-woven
N/A 534 - 601 N/A N/A 2.84 - 3.37 N/A 0.45 M
F-2 PP Geo -composite Combination of woven and non-woven
945.6 857 - 879 54.87 2.23 2.04 - 2.40 0.01 0.39 R
PP = Polypropylene, PET = Polyester, N/A = not available, M = US Manufacturer- 1, N = US Manufacturer- 2, O = US Manufacturer- 3, P = UK Manufacturer, Q = Canadian Manufacturer, R = US Manufacturer- 4.

50
3.2 Test Procedures
Two methods were used to determine the largest pore size of geotextiles; Capillary flow test and
Dry sieving test. The ASTM D 6767 standard was followed and the PMI Automated Geo Pore
Pro (Model No. GPP-1001A) was used for Capillary flow test. For Dry sieving test, the
“Standard test method for determining the apparent opening size of a geotextile” (ASTM D4751)
was used.
For Capillary flow test, in total, approximately 700 tests were performed with different specimen
for 51 varied materials to validate the repeatability of the test results. The capillary flow test
follows the following sample preparation and testing procedure.
3.2.1 Specimens’ Preparation
A full width swatch of 1 m long from the end of each roll geotextile was taken.
Nine to ten samples were cut from each swatch with a measurement of 2-inch x 2-inch to
fit in the sample holder. Five samples were cut regularly spaced along a diagonal line on
the swatch. The rest of the four – five samples were cut randomly from the swatch of the
sample.
The specimens were weighed at the standard atmosphere. A balance Voyager Pro
(accuracy up to 0.001gm) was used to weigh the specimens.
The specimens were submerged in tap water for 1 hour.
After that the specimens dried in the standard atmosphere with a fan for 24 hours.
The specimens were weighed again to 0.001g after air drying until a constant weight
equal or less than the initial weight of the specimen was achieved. After 24 hours, all
specimens were dry.

51
3.2.2 Wetting Liquid
Mineral oil was used to saturate the materials. The surface tension of mineral oil used in the test
was 31.69 dynes/cm and it was measured in a company called KRUSS USA.
3.2.3 Shape Factor
Shape factor is a number which is related to the measured pore size and actual pore size of the
geotextile. According to PMI (Porous Materials, Inc.) operating system, a shape factor of 0.715
was used for irregular pores of a geotextile. However, for rectangular pores, 0.75 was used as a
shape factor in the analysis.
3.2.4 Testing Procedure
The specimens were submerged in the mineral oil for a period of 1 hour.
For each type of geotextile nine/ten tests were conducted.
Test was conducted with Wet up/ Calc. dry and a linear dry curve. The tests were
performed in the wet state first and then the sample was pressurized to calculate the dry
curve by the software.
The wetted specimen was placed on the 1.5-inch gasket (see Figure 3.5 (b)) and an
adapter plate with a 1.375-inch O-ring was placed over the specimen (see Figure 3.5 c).
Then the chamber cap was placed above the adapter plate to secure the system provided a
tight seal around the sample to ensure that no air escaped during the test (see Figure 3.5
(d)).
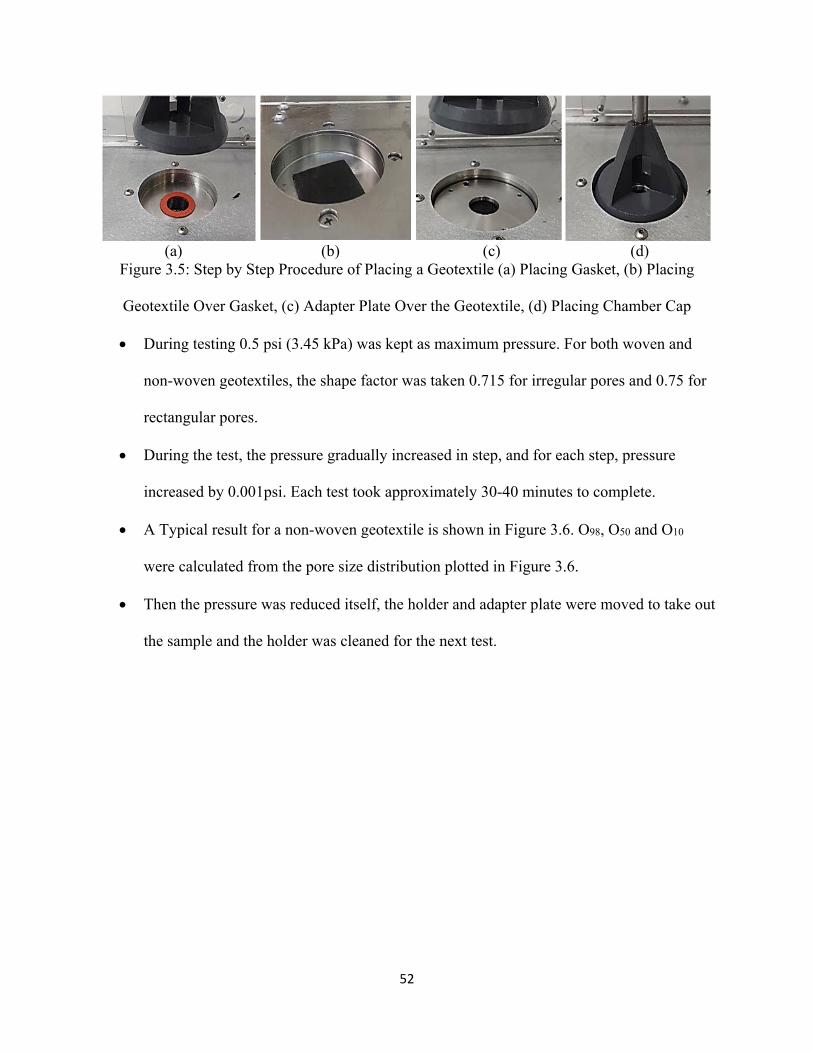
52
(a) (b) (c) (d)
Figure 3.5: Step by Step Procedure of Placing a Geotextile (a) Placing Gasket, (b) Placing
Geotextile Over Gasket, (c) Adapter Plate Over the Geotextile, (d) Placing Chamber Cap
During testing 0.5 psi (3.45 kPa) was kept as maximum pressure. For both woven and
non-woven geotextiles, the shape factor was taken 0.715 for irregular pores and 0.75 for
rectangular pores.
During the test, the pressure gradually increased in step, and for each step, pressure
increased by 0.001psi. Each test took approximately 30-40 minutes to complete.
A Typical result for a non-woven geotextile is shown in Figure 3.6. O98, O50 and O10
were calculated from the pore size distribution plotted in Figure 3.6.
Then the pressure was reduced itself, the holder and adapter plate were moved to take out
the sample and the holder was cleaned for the next test.

53
Figure 3.6: Typical Pore Size Distribution Results of a Non-Woven Geotextile
3.2.5 Factors Influencing the Results
During the testing, periodically the pressure became zero or negative and test stopped
without any results. To start the test, the regulator connected inside the device was
adjusted to 1200 - 1800 counts in CapWin software, which resulted into the increase in
step pressure. In this case, it took 1-1.5 hours to complete one single test. However, it did
not affect the bubble point, O98 of a geotextile.
For thick needle-punched non-woven geotextiles, because of lack of fully saturation, the
smaller pores in the thick non-woven geotextiles did not get enough pressurized to drain
out the liquid, and therefore, the smaller pores may not be measured.
For thin non-woven and open woven geotextile, mineral oil did not stay in the large pores
and the capillary flow test did not reach 100% total flow. As a result, the test might finish
earlier without a complete pore size distribution.
0
20
40
60
80
100
1 10 100 1000
%P
assi
ng
Pore opening (microns)
Test-1
Test-2
Test-3
Test-4
Test-5
Test-6
Test-7
Test-8
Test-9
Bubble point, O98 = 145 - 205 micronsShape factor = 0.715Mass per unit area = 223 - 256 g/m2
O50
O10
O98

54
3.3 Test Results
Capillary flow tests were performed to evaluate the pore size distribution and the largest pore
size, bubble point (O98) of individual geotextile specimen (51 types of geotextiles). Typical pore
size distribution results for a monofilament, a slit film, and a multifilament woven geotextiles, a
heat – bonded, and a needle – punched non – woven geotextiles, and a geo – composite
geotextiles are provided in Figure 3.7 to Figure 3.12.
As it can be seen that good repeatability was found for majority of test results, the contact angle
of mineral oil with geotextiles was taken zero in the equation d = , to calculate the bubble
point, O98. The maximum pressure used in all tests to conclude the test with a complete pore size
distribution and persuade the smaller pores to evacuate the liquid was 0.5 psi. From the pore size
distribution results, O95, O50 and O10 were measured; which are the pore openings used in soil
retention criterion.
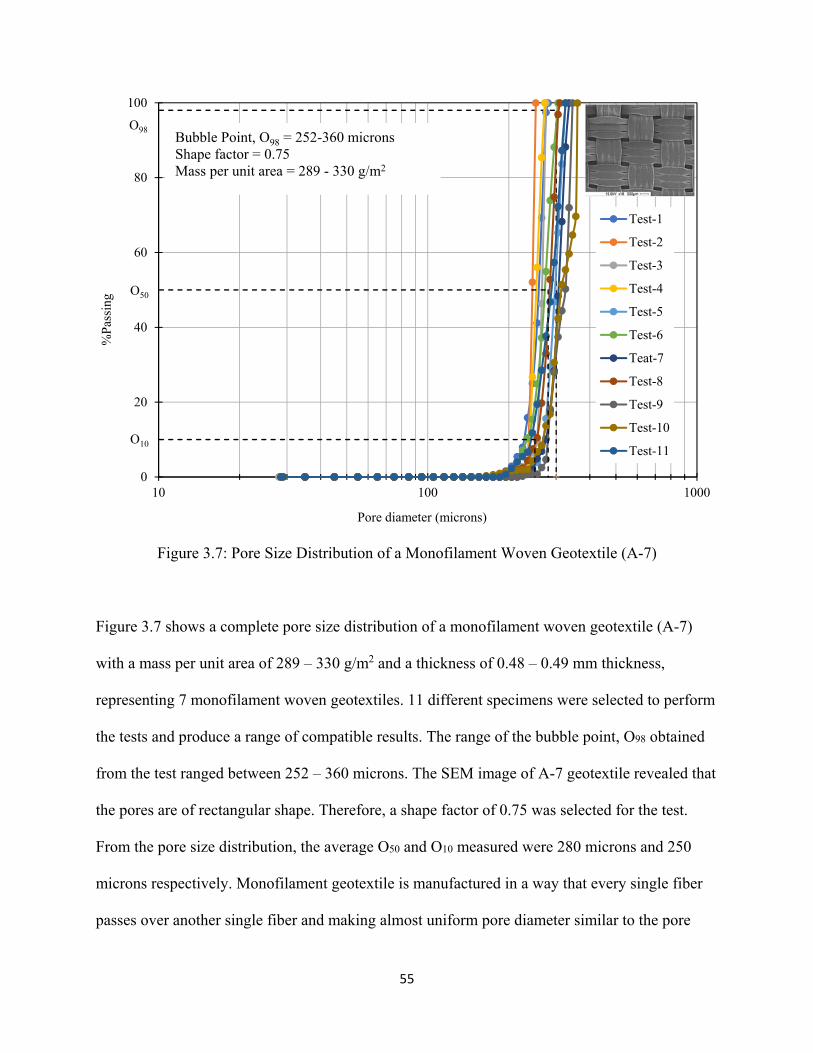
55
Figure 3.7: Pore Size Distribution of a Monofilament Woven Geotextile (A-7)
Figure 3.7 shows a complete pore size distribution of a monofilament woven geotextile (A-7)
with a mass per unit area of 289 – 330 g/m2 and a thickness of 0.48 – 0.49 mm thickness,
representing 7 monofilament woven geotextiles. 11 different specimens were selected to perform
the tests and produce a range of compatible results. The range of the bubble point, O98 obtained
from the test ranged between 252 – 360 microns. The SEM image of A-7 geotextile revealed that
the pores are of rectangular shape. Therefore, a shape factor of 0.75 was selected for the test.
From the pore size distribution, the average O50 and O10 measured were 280 microns and 250
microns respectively. Monofilament geotextile is manufactured in a way that every single fiber
passes over another single fiber and making almost uniform pore diameter similar to the pore
0
20
40
60
80
100
10 100 1000
%P
assi
ng
Pore diameter (microns)
Test-1
Test-2
Test-3
Test-4
Test-5
Test-6
Teat-7
Test-8
Test-9
Test-10
Test-11
Bubble Point, O98 = 252-360 micronsShape factor = 0.75Mass per unit area = 289 - 330 g/m2
O50
O10
O98

56
diameter of the holes in the spinneret. It could be noticed that the average O50 and O10 are in
same ranges as of O98, which indicates that the pores are almost uniform sizes for the
monofilament geotextiles.
Figure 3.8: Pore Size Distribution of a Slit Film Woven Geotextile (B-2)
For the slit film woven geotextile (B-2), 9 samples were selected to perform the capillary flow
tests. As a representative, the results of 1 slit film geotextile, B-2 (229 – 234 g/m2 mass/area and
0.59 – 0.68 mm thickness) are showed in Figure 3.8. The SEM image shows that the pores in the
geotextile are a combination of rectangular and square shapes. Unlike monofilaments, the pores
in a slit film woven geotextile are not uniform. Therefore, a shape factor of 0.715 was used for
the test. The range of bubble point, O98 obtained ranged between 295 – 372 microns. The
0
20
40
60
80
100
1 10 100 1000
%P
assi
ng
Pore opening (microns)
Test-1
Test-2
Test-3
Test-4
Test-5
Test-6
Test-7
Test-8
Test-9
Bubble Point, O98 = 295 - 372 micronsShape factor = 0.715Mass per unit area = 229 - 234 g/m2
O50
O10
O98

57
average O50 and O10 measured from the pore size distribution were 250 microns and 200
microns. Therefore, in a slit film geotextile, the pores are not uniform and small pores exist in the
geotextile, which resulted in smaller O50 and O10 values as compared to O98.
Figure 3.9: Pore Size Distribution of a Multifilament Woven Geotextile (C-2)
Figure 3.9 shows the pore size distribution of a multifilament geotextile (C-2) with a mass per
unit area of 1078 - 1100 g/m2 and a thickness of 1.62 – 1.78 mm. A shape factor of 0.715 was
used in the test, due to the non-uniform pores in the multifilament geotextile. A range of bubble
points, O98 (421 – 630 microns) were obtained from 9 tests using individual specimens. In a
multifilament, many monofilament fibers run over each other or twisted along each other, form
irregular pores. The SEM image attached shows the irregular pores of the multifilament
0
20
40
60
80
100
1 10 100 1000
%P
assi
ng
Pore diameter (microns)
Test-1
Test-2
Test-3
Test-4
Test-5
Test-6
Test-7
Test-8
Test-9
Bubble Point, O98 = 421-630 micronsShape factor = 0.715Mass per unit area = 1078 - 1100 g/m2
O98
O50
O10

58
geotextile. A shape factor of 0.715 was used in the test for irregular pores. The smaller pores
within the multifilament fiber, the average O50 (350 microns) and O10 (210 microns) obtained
from the pore size distribution were 175 - 315 microns smaller than the average largest pore size
(525.5 microns).
Figure 3.10: Pore Size Distribution of a Heat Bonded Non-Woven Geotextile (D-3)
Figure 3.10 shows the pore size distribution of a heat bonded non-woven geotextile (D-3) with a
mass per unit area of 104 - 118 g/m2 and a thickness of 0.33 – 0.4 mm.9 heat bonded geotextiles
were used to perform the capillary flow tests. The tests were conducted with 9 individual
specimens providing a range of bubble point, O98 (225 – 375 microns). Heat bonded geotextile is
manufactured by an orientation of continuous filaments or staple fibers bonded with heat or
0
20
40
60
80
100
1 10 100 1000
%P
assi
ng
Pore opening (mcirons)
Test-1
Test-2
Test-3
Test-4
Test-5
Test-6
Test-7
Test-8
Test-9
Bubble Point, O98 = 225 - 375 micronsShape factor = 0.715Mass per unit area = 104 - 118 g/m2
O50
O10
O98

59
pressurized steam either by an area or point process. The fibers run along over one another
spontaneously making nonuniform pores with a range of bubble point of 225 – 375 microns.
Since the fiber orientation is not uniform, a significant difference exists between O50 and O10
with O98. The average O50 and O10 measured were 210 – 240 microns smaller than the bubble
point, O98.
Figure 3.11: Pore Size Distribution of a Needle Punched Non-Woven Geotextile (E-2)
A total of 21 needle punched non-woven geotextiles were. Pore size distribution results of 1 out
of 21 needle punched geotextiles (E-2) of a mass per unit area of 146 - 163 g/m2 and a thickness
of 0.64 – 0.89 mm are shown in Figure 3.11, which provides a range of bubble point, O98 (137.5
– 207.5 microns). The average O50 (80 microns) and O10 (50 microns) were also measured from
0
20
40
60
80
100
1 10 100 1000
%P
assi
ng
Pore opening (microns)
Test-1
Test-2
Test-3
Test-4
Test-5
Test-6
Test-7
Test-9
Bubble Point, O98 = 137.5 - 207.5 micronsShape factor = 0.715Mass per unit area = 146 - 163 g/m2
O10
O50
O98

60
the pore size distribution as well. The free moving of fibers under needles makes the rough
surface of geotextile with nonuniform pores in each side. The fibers running spontaneously leave
random spaces in between the fibers. The pore size may vary depending on the side to be tested.
The average O50 and O10 measured from the pore size distribution were 90 – 120 microns smaller
than the average bubble point, O98.
Figure 3.12: Pore Size Distribution of a Geo-Composite (F-1)
Two geo-composites (a combination of woven and non-woven geotextiles) selected form 2 US
companies were used in the study. Pore size distribution results of a geo-composite, F-1 (857 –
879 g/m2 mass/area and 2.04 – 2.40 mm thickness) which is a combination of a thin non-woven
on top of a woven geotextile, are shown in Figure 3.12. Results showed that the average O50 (65
0
20
40
60
80
100
1 10 100 1000
%P
assi
ng
Pore diameter (microns)
Test-1
Test-2
Test-3
Test-4
Test-6
Test-7
Test-8
Test-9
Bubble point, O98 = 88-122.5 micronsShape factor = 0.715Mass per unit area = 857 - 879 g/m2
O50
O10
O98
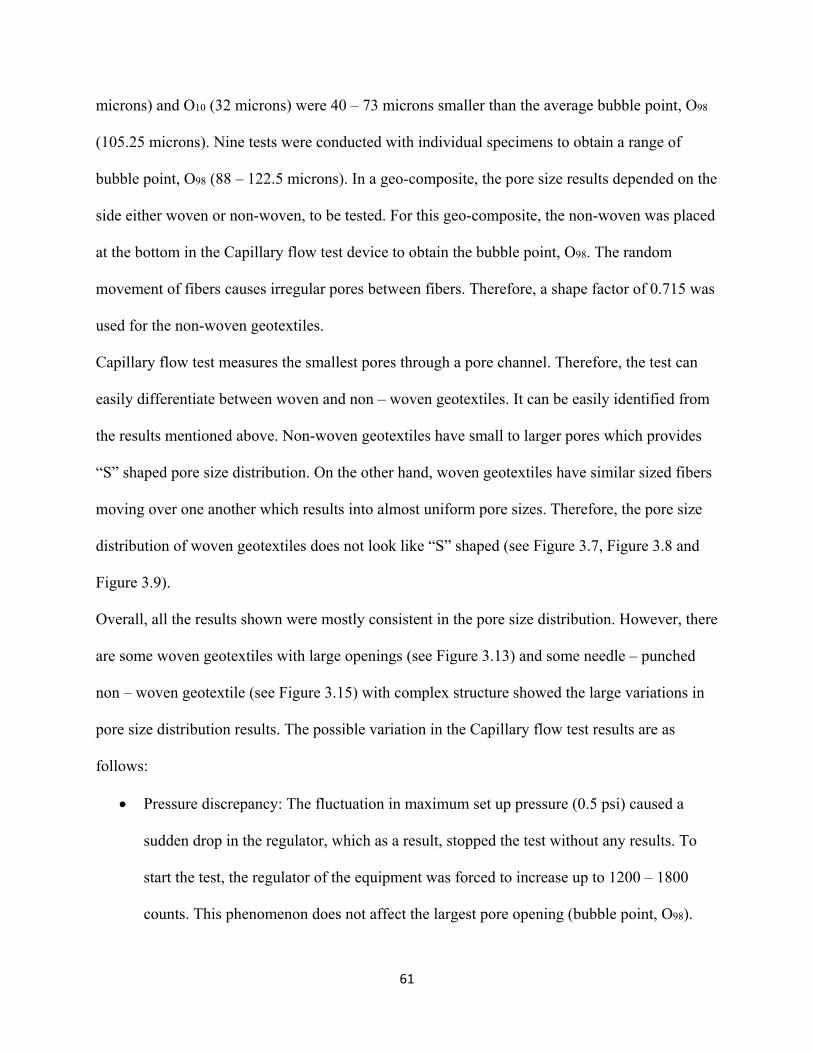
61
microns) and O10 (32 microns) were 40 – 73 microns smaller than the average bubble point, O98
(105.25 microns). Nine tests were conducted with individual specimens to obtain a range of
bubble point, O98 (88 – 122.5 microns). In a geo-composite, the pore size results depended on the
side either woven or non-woven, to be tested. For this geo-composite, the non-woven was placed
at the bottom in the Capillary flow test device to obtain the bubble point, O98. The random
movement of fibers causes irregular pores between fibers. Therefore, a shape factor of 0.715 was
used for the non-woven geotextiles.
Capillary flow test measures the smallest pores through a pore channel. Therefore, the test can
easily differentiate between woven and non – woven geotextiles. It can be easily identified from
the results mentioned above. Non-woven geotextiles have small to larger pores which provides
“S” shaped pore size distribution. On the other hand, woven geotextiles have similar sized fibers
moving over one another which results into almost uniform pore sizes. Therefore, the pore size
distribution of woven geotextiles does not look like “S” shaped (see Figure 3.7, Figure 3.8 and
Figure 3.9).
Overall, all the results shown were mostly consistent in the pore size distribution. However, there
are some woven geotextiles with large openings (see Figure 3.13) and some needle – punched
non – woven geotextile (see Figure 3.15) with complex structure showed the large variations in
pore size distribution results. The possible variation in the Capillary flow test results are as
follows:
Pressure discrepancy: The fluctuation in maximum set up pressure (0.5 psi) caused a
sudden drop in the regulator, which as a result, stopped the test without any results. To
start the test, the regulator of the equipment was forced to increase up to 1200 – 1800
counts. This phenomenon does not affect the largest pore opening (bubble point, O98).

62
However, it influenced the smaller pore openings (see Figure 3.13). It can be seen in
Figure 3.13 that 7 out of 9 tests provided uniform results and only two tests showed
deviation in the results. Only 1 out of 51 geotextiles showed this kind of discrepancy in
the results.
Figure 3.13: Pore Size Distribution of a Monofilament Woven Geotextile (A-4)
Incomplete pore size distribution: When the specimens are not fully saturated enough due
to either thickness or larger pores, the test cannot provide a complete pore size
distribution. Figure 3.14 shows incomplete pore size distribution, the test could not
measure the values of smaller pores. Another reason behind this error could be not
getting enough pressure to drain out the liquid and measure the pore size. The test could
not reach 100% flow during the wet test and the software could not provide the smaller
pores and a complete pore size distribution. Only 1 out of 51 geotextiles provided
incomplete pore size distribution result.
0
20
40
60
80
100
1 10 100 1000
%P
assi
ng
Pore diameter (microns)
Test-1
Test-2
Test-3
Test-4
Test-5
Test-6
Test-7
Test-8
Test-9
Bubble point, O98 = 400 - 501 micronsShape factor = 0.75Mass per unit area = 273 - 285 g/m2
O10
O50
O98

63
Figure 3.14: Pore Size Distribution of a Needle Punched Non-Woven Geotextile (E-10)
Figure 3.15: Pore Size Distribution of a Needle Punched Non-Woven Geotextile (E-1)
0
20
40
60
80
100
1 10 100 1000
%P
assi
ng
Pore opening (microns)
Test-1
Test-2
Test-3
Test-4
Test-5
Test-6
Test-7
Test-8
Bubble point, O98 = 107.5 - 166.5 micronsShape factor = 0.715Mass per unit area = 268 - 325 g/m2
O10
O50
O98
0
20
40
60
80
100
1 10 100 1000
%P
assn
g
Pore opening (microns)
Test-1
Test-2
Test-3
Test-4
Test-5
Test-6
Test-7
Test-8
Test-9
Bubble point, O98 = 157.5 - 675 micronsShape factor = 0.715Mass per unit area = 132 - 162 g/m2
O10
O50
O98

64
Variations in results: Figure 3.15 shows pore size distribution results of a non-woven
geotextile (E-1) with wide variation. Possible reasons could be sample variation, non-
saturation, pressure discrepancy etc. However, it is not a common phenomenon and only
1 out of 51 geotextiles showed this kind of variation.
Based on the pore structure and manufacturing process of geotextiles, the range of pore opening,
O98 varies from geotextile to geotextile. Even in the same geotextile, individual specimen can
provide different result. Therefore, box plot and whisker diagrams are used to calculate the
minimum and maximum outliers for each geotextile.
3.3.1 Box Plot and Whisker Diagram
In the previous section, the results of capillary flow tests of a representative geotextile from each
category were discussed. In addition, conflicting results of 2 needle punched non-woven
geotextiles (E-1 and E-10) and 1 monofilament woven geotextile (A-4) were discussed.
Box plot and whisker diagrams were used based on the five-number summary: minimum, first
quartile, mean, third quartile, and maximum (http://www.physics.csbsju.edu/stats/box2.html) to
find out the outlier results of O98. The box plot and whisker diagram consists of a box which lies
in between first and third quartiles. The mean can also be indicated in the diagram. The
"whiskers" are straight line extending from the ends of the box to the maximum and minimum
values. A procedure to calculate the outliers in a box plot is discussed below.
Example to Calculate Outliers:
For a geotextile (E-1) with a range of bubble points of 157.5 – 675 microns, the five-number
summary can be computed as follows:
Range of Bubble Point values, O98 (microns): 157.5, 425, 430, 430, 441, 450, 525, 642, and 675
Minimum = 157.5 microns

65
First quartile, Q1 = 430 microns
Mean = 463.94 microns
Third quadrant, Q3 = 525 microns
Maximum = 675 microns
Interquartile range, IQR = Q3 – Q1 = 95 microns
Outliers = Any data point less than Q1 – 1.5*IQR, or any data point greater than Q3 + 1.5*IQR
Minimum non - outliers, Q1 – 1.5*IQR = 430 – 1.5*95 = 287.5 microns;
Maximum non - outliers, Q3 + 1.5*IQR = 525 + 1.5*95 = 667.5 microns
Therefore, for the geotextile E1, any bubble point (O98) less than 287.5 microns and greater than
667.5 microns are considered as outliers (see Figure 3.16). Figure 3.16 shows a Box Plot and
Whisker Diagram of a needle punched non-woven geotextile (E-1) which provides the maximum
and minimum outliers.
Figure 3.16: Box Plot and Whisker Diagram
0
100
200
300
400
500
600
700
800
Ran
ge o
f bu
bble
poi
nt, O
98(m
icro
ns)
Geotextile (E-1)
Maximum and minimumoutliers Maximum (675 microns)
3rd quartile, Q3 (525 microns)
Mean (463.94 microns)
1st quartile, Q1 (430 microns)
Minimum (157.5 microns)
Whisker
Whisker

66
Figure 3.17 shows the box plot and whisker diagram for a set of 7 monofilament geotextiles. The
diagram shows that two monofilament geotextiles (A-1 and A-2) have a wide range of Bubble
Point values, O98 and A-3 to A-7 have smaller range of Bubble Point values, O98. Geotextiles
with lesser mass per unit area (A-1 and A-3) has outliers as compared to the heavier geotextiles
(A-6, A-7). The range of bubble point, O98 for A-1 (490 – 1100 microns) is found to be the
largest among 7 geotextiles with a maximum outlier (1100 microns) in the range. Although, A-3
is not a heavy geotextile but has the smallest range of O98 (221 – 305 microns), it has a
maximum outlier (305 microns). Following the calculation discussed in section 3.5.1, the
minimum and maximum outliers are calculated from the box plot and whisker diagram for
geotextiles A-1 an A-3 (see Table 3.2).
Figure 3.17: Box Plot and Whisker Diagram for a Set Of 7 Monofilament Woven Geotextiles
0
200
400
600
800
1000
1200
A-1 A-2 A-3 A-4 A-5 A-6 A-7
Ran
ge o
f bu
bble
poi
nts,
O98
(mic
rons
)
Monofilament Woven Geotextiles
Min. and max. outliers

67
Table 3.2: Minimum and Maximum Outliers of Monofilament Woven Geotextiles.
Geotextiles Maximum outliers, microns Minimum outliers, microns A-1 1100 N/A A-3 305 N/A
N/A: Not available
Eleven slit film woven geotextiles were used in the analysis and the range of bubble point, O98 of
each geotextile are plotted in Figure 3.18. B-7 shows the largest range of bubble point, O98 (340
– 500 microns) and B-10 gives the smallest range of bubble point, O98 (325 – 382 microns). Like
monofilament, the minimum and maximum outliers were computed for slit film geotextiles. In
Table 3.3, maximum and minimum outliers for B-7 and B-10 geotextiles are shown.
Figure 3.18: Box Plot and Whisker Diagram for a Set Of 11 Slit Film Woven Geotextiles
Table 3.3: Minimum and Maximum Outliers of Slit Film Woven Geotextiles
Geotextiles Maximum outliers, microns Minimum outliers, microns B-7 480, 500 340, 355 B-10 382 325
0
100
200
300
400
500
600
B-1 B-2 B-3 B-4 B-5 B-6 B-7 B-8 B-9 B-10 B-11
Ran
ge o
f bu
bble
poi
nt, O
98(m
icro
ns)
Slit Film Woven Geotextiles
Min. and max. outliers
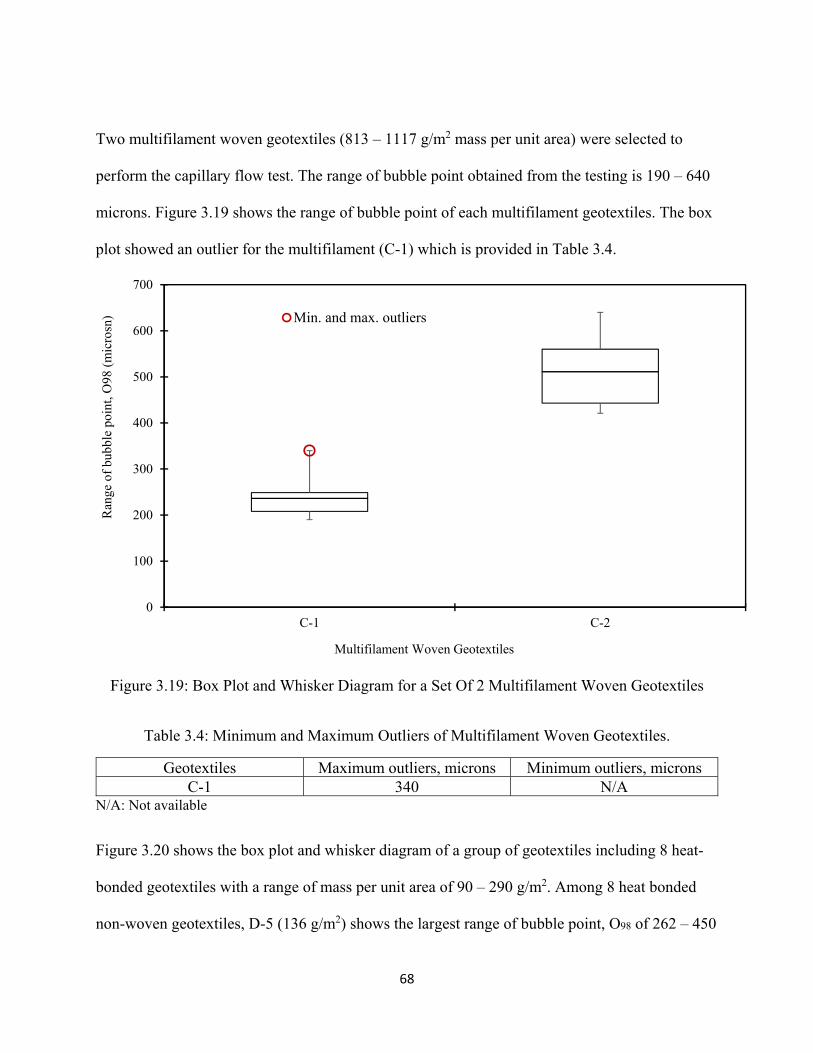
68
Two multifilament woven geotextiles (813 – 1117 g/m2 mass per unit area) were selected to
perform the capillary flow test. The range of bubble point obtained from the testing is 190 – 640
microns. Figure 3.19 shows the range of bubble point of each multifilament geotextiles. The box
plot showed an outlier for the multifilament (C-1) which is provided in Table 3.4.
Figure 3.19: Box Plot and Whisker Diagram for a Set Of 2 Multifilament Woven Geotextiles
Table 3.4: Minimum and Maximum Outliers of Multifilament Woven Geotextiles.
Geotextiles Maximum outliers, microns Minimum outliers, microns C-1 340 N/A
N/A: Not available
Figure 3.20 shows the box plot and whisker diagram of a group of geotextiles including 8 heat-
bonded geotextiles with a range of mass per unit area of 90 – 290 g/m2. Among 8 heat bonded
non-woven geotextiles, D-5 (136 g/m2) shows the largest range of bubble point, O98 of 262 – 450
0
100
200
300
400
500
600
700
C-1 C-2
Ran
ge o
f bu
bble
poi
nt, O
98 (
mic
rosn
)
Multifilament Woven Geotextiles
Min. and max. outliers

69
microns and D-7 shows the smallest range of bubble point, O98 of 186 – 245 microns. No outlier
was found from the box plot and whisker diagram drawn for heat-bonded geotextiles.
Figure 3.20: Box Plot and Whisker Diagram for a Set Of 8 Heat Bonded Non- Woven
Geotextiles
A wide range of needle-punched non-woven geotextiles (147 – 1006 g/m2) were used in the
analysis to draw the box plot and whisker diagram (see Figure 3.21) E-1, E-4 and E-8 showed a
broad range of bubble point, O98 (157.5 – 675 microns, 255 – 510 microns, and 75 – 415 microns
respectively); and E-13 and E-20 represent small range of bubble point, O98 (137.5 – 157.5
microns and 121 – 127.5 microns respectively). 9 needle punched geotextiles showed outliers in
the box plot Figure 3.21. Table 3.5 also shows the minimum and maximum outliers of E-1, E-4,
E-11, E-14 to E-17, E-19 and E-21.
0
100
200
300
400
500
D-1 D-2 D-3 D-4 D-5 D-6 D-7 D-8
Ran
ge o
f bu
bble
poi
nt, O
98 (m
icro
ns)
Heat bonded non-woven geotextiles

70
Figure 3.21: Box Plot and Whisker Diagram for a Set Of 21 Needle Punched Non- Woven
Geotextiles
Table 3.5: Minimum and Maximum Outliers of Needle Punched Non-Woven Geotextiles.
Geotextiles Maximum outliers, microns Minimum outliers, microns E-1 675 157.5 E-5 196, 205 145 E-11 160 N/A E-14 157.5 N/A E-15 167.5 N/A E-16 205 N/A E-17 167.5 N/A E-19 252.5 N/A E-21 N/A 88
N/A: Not available
0
100
200
300
400
500
600
700
800
E-1 E-2 E-3 E-4 E-5 E-6 E-7 E-8 E-9 E-10 E-11 E-12 E-13 E-14 E-15 E-16 E-17 E-18 E-19 E-20 E-21
Ran
ge o
f bu
bble
poi
nt, O
98(m
icro
ns)
Needle Punched Non-woven Geotextiles
Min. and max. outliers

71
Figure 3.22: Box Plot and Whisker Diagram for a Set of 2 Geo-Composites
Figure 3.22 shows the range of bubble point, O98 (125 – 146 microns and 88 – 122.5 microns
respectively) of two geo-composites. No minimum or maximum outlier could be found from the
box plot and whisker diagram.
Two monofilament woven geotextiles (A-1 and A-3), 2 slit film woven geotextiles (B-7 and B-
10), 1 multifilament woven geotextile (C-1), and 9 needle punched non-woven geotextiles (E-1,
E-5, E-11, E-14, E-15, E-16, E-17, E-19, E-21) showed outliers in the range of pore opening
(bubble point, O98) obtained in the box plot and whisker diagram. The outliers could be an
outcome of systematic error in the experiment, unsteady pressure transduce, diverse pore
structure of woven and non-woven geotextiles, etc. To find a correlation between mass per unit
area and the bubble point, O98, the outliers are taken out from the analysis.
0
20
40
60
80
100
120
140
160
F-1 F-2
Ran
ge o
f bu
bble
poi
nt, O
98 (
mic
rons
)
Geo-composite

72
3.4 Relationships between O98, O50 and O10, and Mass per Unit Area of Geotextiles
Several researches were investigated to find a correlation between a physical property and a
hydraulic property of geotextiles. Bhatia and Smith (1996), Vermeersch et al. (1996), Aydilek et
al. (2006) and Elton (2007) proposed several correlations between mass per unit area and the
largest pore openings, which provided a predicted pore opening for a given mass per unit area of
a geotextile.
For this study, the Bubble Point values (O98), a function of mass per unit area for monofilament
and slit film woven geotextiles are plotted in Figure 3.23. For these plots, mean bubble point
values were used after removing any minimum or maximum outliers. The bubble point, O98 of
woven geotextiles, both monofilaments and slit films, do not show clear trend with the increasing
of mass per unit area. Woven geotextiles are manufactured from the single layer fibers passing
each other and the mass per unit area of woven geotextiles depends on the mass of fibers. The
pore size of woven geotextiles mostly depends on the orientation of the fibers instead of the mass
or thickness of fibers. Therefore, it is not surprising to find no relationship between O98 and mass
per unit area for the monofilaments and slit film woven geotextiles.

73
Figure 3.23: Bubble Point vs. Mass per Unit Area of Monofilament and Slit-film Woven
Geotextiles
The same condition does not apply for non-woven geotextiles, either needle punched non-woven
or heat bonded non-woven geotextiles. For both needle punched and heat bonded non-woven
geotextiles, bubble point, O98 decreases with the increasing mass per unit area (see Figure 3.24
and Figure 3.25). For needle punched non-woven geotextiles, O10 and O50 were also plotted
against mass per unit area (see Figure 3.24 b).
y = 1131.3x-0.201
R² = 0.1595
y = 670338x-1.352
R² = 0.5534
0
100
200
300
400
500
600
700
800
0 100 200 300 400 500 600
Bub
ble
poin
t, O
98(m
icro
ns)
Mass per unit area, g/m2
Slit film
Monofilament

74
(a)
(b)
Figure 3.24: O10, O50, and O98 vs. Mass per Unit Area of Needle Punched Non-Woven
Geotextiles
y = 5281.5x-0.601
R² = 0.5188
0
100
200
300
400
500
600
0 200 400 600 800 1000 1200
O98
(mic
rons
)
Mass per unit area, g/m2
y = 514.37x-0.31
R² = 0.2269
y = 471.78x-0.39
R² = 0.26610
100
200
300
400
500
600
0 200 400 600 800 1000 1200
O50
, O10
(mic
rons
)
Mass per unit area, g/m2
O50
O10
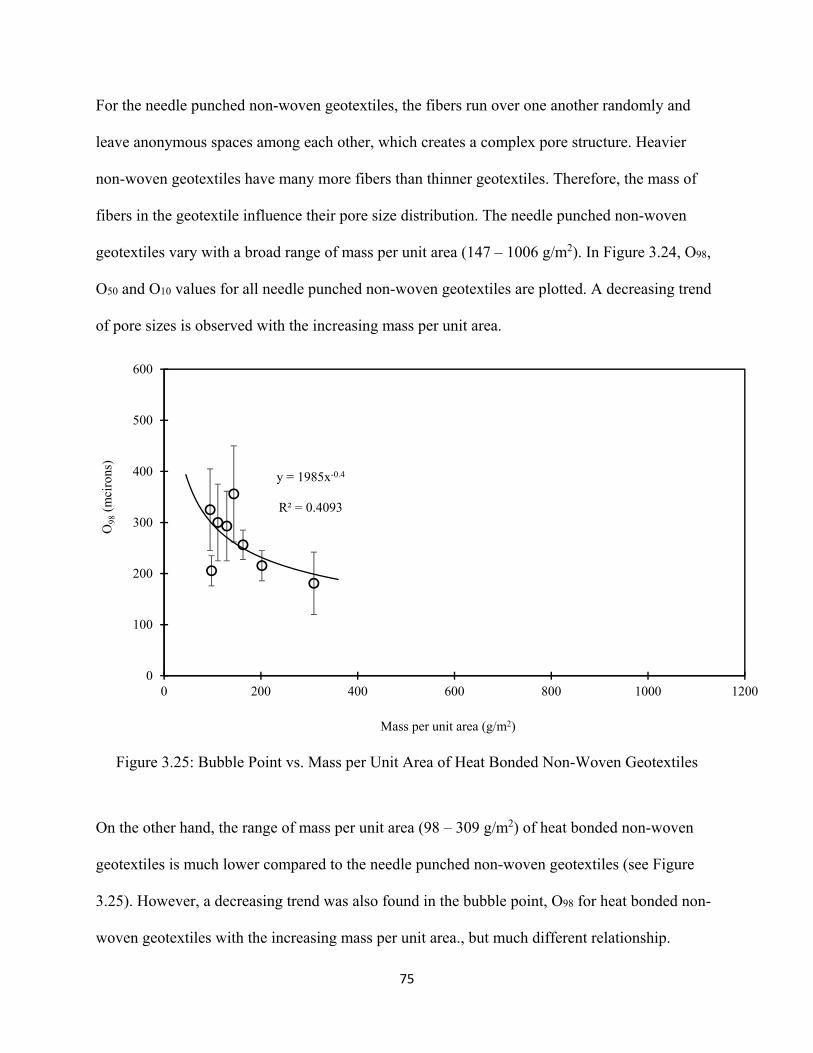
75
For the needle punched non-woven geotextiles, the fibers run over one another randomly and
leave anonymous spaces among each other, which creates a complex pore structure. Heavier
non-woven geotextiles have many more fibers than thinner geotextiles. Therefore, the mass of
fibers in the geotextile influence their pore size distribution. The needle punched non-woven
geotextiles vary with a broad range of mass per unit area (147 – 1006 g/m2). In Figure 3.24, O98,
O50 and O10 values for all needle punched non-woven geotextiles are plotted. A decreasing trend
of pore sizes is observed with the increasing mass per unit area.
Figure 3.25: Bubble Point vs. Mass per Unit Area of Heat Bonded Non-Woven Geotextiles
On the other hand, the range of mass per unit area (98 – 309 g/m2) of heat bonded non-woven
geotextiles is much lower compared to the needle punched non-woven geotextiles (see Figure
3.25). However, a decreasing trend was also found in the bubble point, O98 for heat bonded non-
woven geotextiles with the increasing mass per unit area., but much different relationship.
y = 1985x-0.4
R² = 0.4093
0
100
200
300
400
500
600
0 200 400 600 800 1000 1200
O98
(mci
rons
)
Mass per unit area (g/m2)

76
Needle punched non-woven geotextiles have a broad range of Bubble Point (63 – 675 microns)
along with the mass per unit area, which made a dramatic change in the relationship curve
between O98 and mass per unit area. On the other hand, heat bonded non-woven geotextiles have
a smaller range of pore openings (120 – 450 microns), and a flatter slope in the curve of heat
bonded non-woven geotextiles was found with a completely different relation.
3.5 Dry Sieving Test
In the current study, most of the AOS results of geotextiles were obtained from the
manufacturers. However, for all heat – bonded geotextiles, some woven geotextiles (A-6 and A-
7) and needle – punched non – woven geotextiles (E-3, E-4, E-7, E-8, E-13, and E-18), dry
sieving tests were conducted at Syracuse University. One needle – punched non – woven
geotextile (E-21) could not be tested due to its high thickness.
ASTM D4751 – The Standard Test Method for Determining the Apparent Opening Size (AOS)
was followed to perform the tests. Dry sieving test is based on the concept that glass beads of a
specific diameter placed on a piece of a geotextile is sieved in a shaker to determine the
percentage of beads passing through the geotextile, whether it is 5% or less. The repetition of the
process with glass beads of different diameter provides apparent opening size (AOS, O95) of a
geotextile. In this test, a #4 sieve frame, a pan, a cover and a hoop to secure the geotextile inside
the frame were used. A mechanical sieve shaker was used in the test to sieve the glass beads
through the geotextile (see Figure 3.26).
Glass beads were sieved before performing the test to verify the diameter. 50 gm glass beads of
known diameter were used in each test. The geotextile was cut into a size of 24 cm diameter,
which has a cross-sectional area of 0.045 m2 and a testing area of 0.0314 m2. Like Capillary flow
test, the sample preparation was followed by soaking the specimens into clean water for an hour
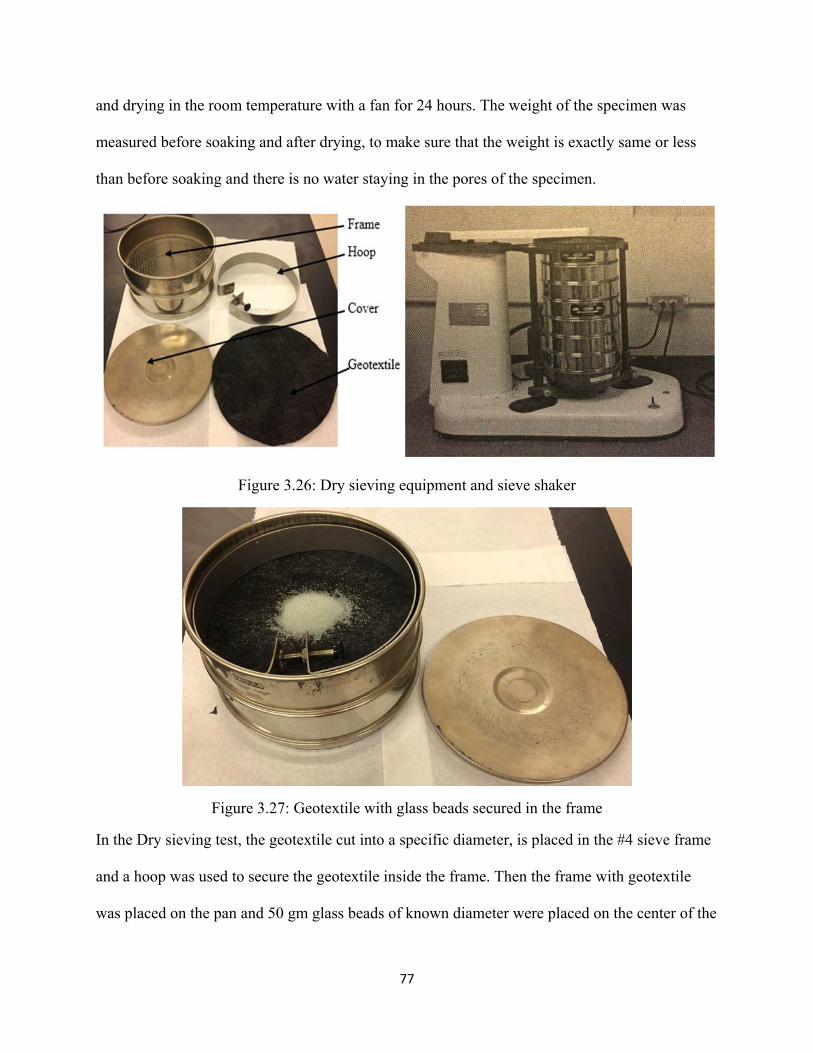
77
and drying in the room temperature with a fan for 24 hours. The weight of the specimen was
measured before soaking and after drying, to make sure that the weight is exactly same or less
than before soaking and there is no water staying in the pores of the specimen.
Figure 3.26: Dry sieving equipment and sieve shaker
Figure 3.27: Geotextile with glass beads secured in the frame
In the Dry sieving test, the geotextile cut into a specific diameter, is placed in the #4 sieve frame
and a hoop was used to secure the geotextile inside the frame. Then the frame with geotextile
was placed on the pan and 50 gm glass beads of known diameter were placed on the center of the

78
geotextile (see Figure 3.27). A cover was used on the frame. Then the frame was sieved in a
mechanical shaker for 10 minutes. This test was conducted repeating the same technique with
progressively larger beads until the percent passing of glass beads was 5% or less by weight.
After sieving, the weight of glass beads in the pan and weight of geotextile with glass beads were
measured and recorded. Approximately 5-6 tests were conducted for each type of geotextile.
Dry sieving test is a time-consuming test. It takes several hours to complete the test for one
geotextile. The geotextile with large thickness could not be used in the test. The geotextiles were
secured in the frame with hoop, however, sagging was noticed with several specimens which
might have some effects on the result. The AOS values were plotted a function of mass per unit
area for needle punched (see Figure 3.28) and heat bonded (see Figure 3.29) non-woven
geotextiles.
Figure 3.28: AOS vs. Mass per Unit Area for Needle Punched Non-Woven Geotextiles
y = 6682.1x-0.67
R² = 0.4641
0
100
200
300
400
500
600
700
0 100 200 300 400 500 600 700
AO
S (
mic
rons
)
Mass/unit area (g/m2)
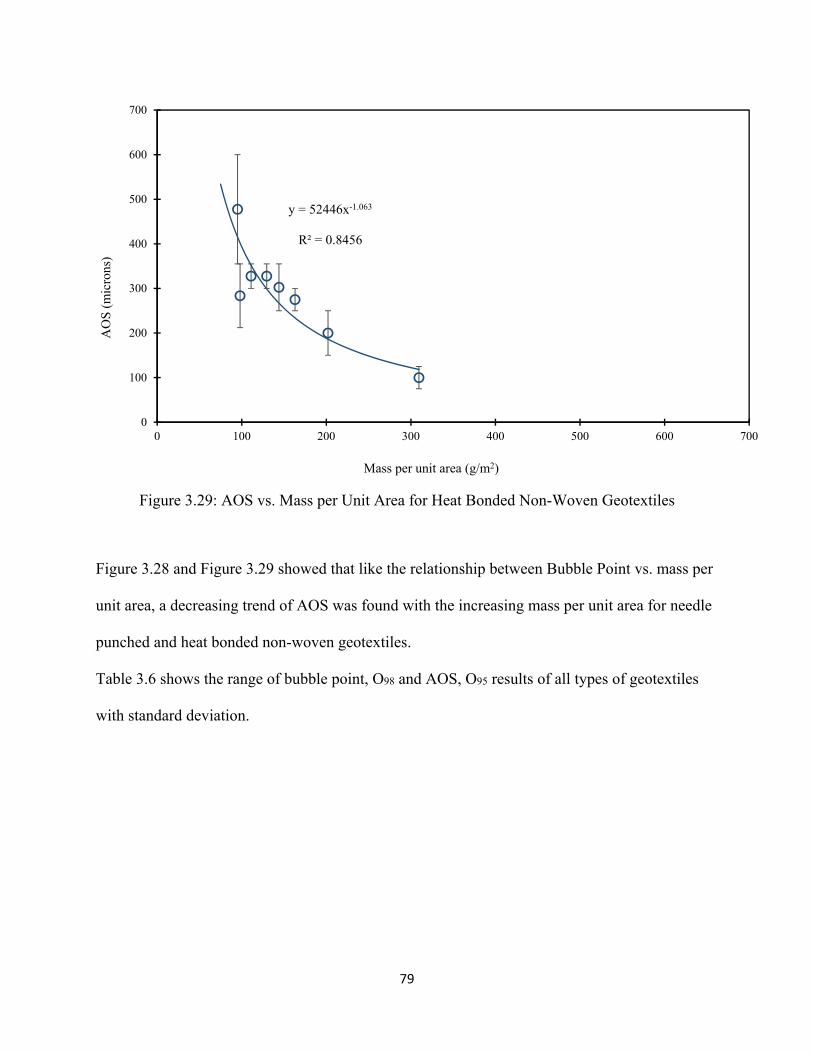
79
Figure 3.29: AOS vs. Mass per Unit Area for Heat Bonded Non-Woven Geotextiles
Figure 3.28 and Figure 3.29 showed that like the relationship between Bubble Point vs. mass per
unit area, a decreasing trend of AOS was found with the increasing mass per unit area for needle
punched and heat bonded non-woven geotextiles.
Table 3.6 shows the range of bubble point, O98 and AOS, O95 results of all types of geotextiles
with standard deviation.
y = 52446x-1.063
R² = 0.8456
0
100
200
300
400
500
600
700
0 100 200 300 400 500 600 700
AO
S (
mic
rons
)
Mass per unit area (g/m2)

80
Table 3.6: Capillary Flow and Dry Sieving Test Results of Geotextiles
Geotextiles Manufacturing process Measured
Bubble point O98, microns
Standard deviation, σ
AOS, O95* (microns)
Standard deviation, σ
Difference (microns)
A-1 Monofilament 490 - 740 176.78 425 - 850 300.52 65 - 110
A-2 Monofilament 301 - 545 172.53 300 - 504 144.25 1 - 41
A-3 Monofilament 221 - 305 59.40 150 - 212 43.84 71 - 93
A-4 Monofilament 400 - 501 71.42 426 - 430 2.83 26 - 71
A-5 Monofilament 232 - 332 70.71 355** N/A 73
A-6 Monofilament 252 – 360 76.37 355 – 425** 49.50 65 – 103
A-7 Monofilament 285 - 340 38.89 300 - 425 88.39 15 - 85
B-1 Slit film 250 - 400 106.07 212 - 600 274.36 38 - 200
B-2 Slit film 295 - 372 54.45 518 - 585 47.38 213 - 223
B-3 Slit film 315 - 411 67.88 414 - 425 7.78 14 - 99
B-4 Slit film 350 - 430 56.57 422 - 424 1.41 6 - 72
B-5 Slit film 305 - 400 67.18 400 - 418 12.73 18 - 95
B-6 Slit film 265 - 331 46.67 271 - 388 82.73 6 - 57
B-7 Slit film 340 - 500 113.14 353 - 418 45.96 13 - 82
B-8 Slit film 375 - 480 74.25 333 - 655 227.69 42 - 175
B-9 Slit film 282 - 370 62.23 425 N/A 99
B-10 Slit film 325 - 382 40.31 420 N/A 66.5
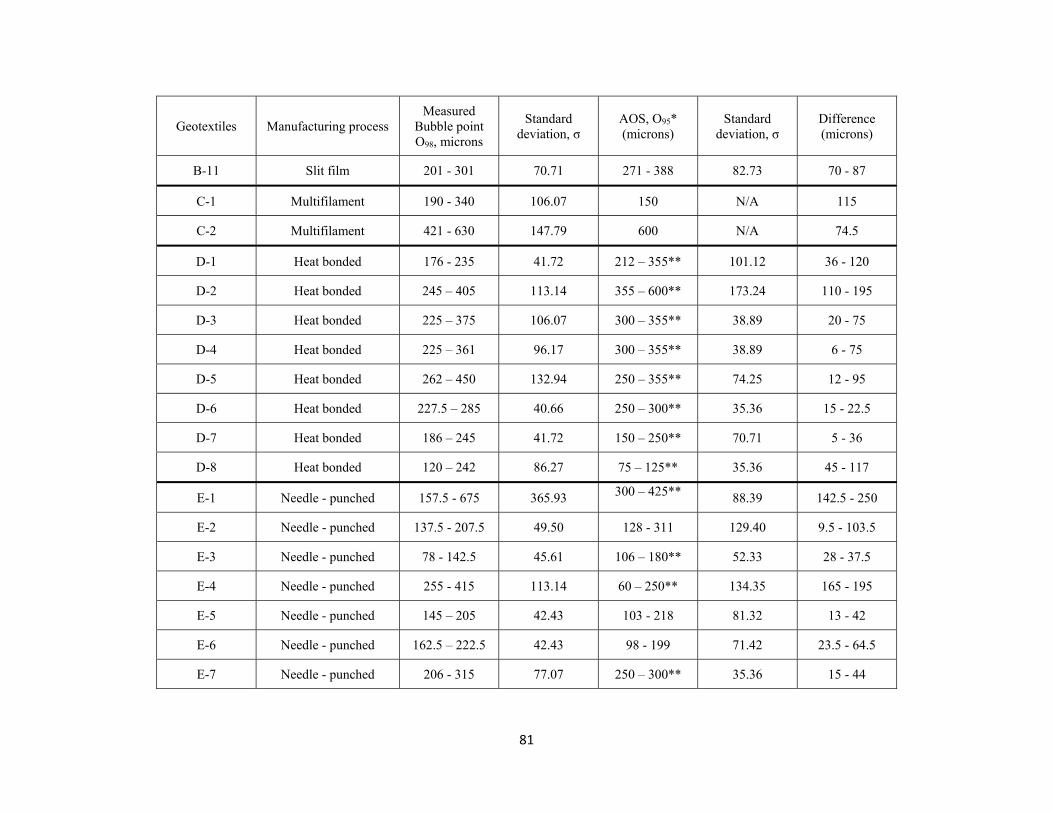
81
Geotextiles Manufacturing process Measured
Bubble point O98, microns
Standard deviation, σ
AOS, O95* (microns)
Standard deviation, σ
Difference (microns)
B-11 Slit film 201 - 301 70.71 271 - 388 82.73 70 - 87
C-1 Multifilament 190 - 340 106.07 150 N/A 115
C-2 Multifilament 421 - 630 147.79 600 N/A 74.5
D-1 Heat bonded 176 - 235 41.72 212 – 355** 101.12 36 - 120
D-2 Heat bonded 245 – 405 113.14 355 – 600** 173.24 110 - 195
D-3 Heat bonded 225 – 375 106.07 300 – 355** 38.89 20 - 75
D-4 Heat bonded 225 – 361 96.17 300 – 355** 38.89 6 - 75
D-5 Heat bonded 262 – 450 132.94 250 – 355** 74.25 12 - 95
D-6 Heat bonded 227.5 – 285 40.66 250 – 300** 35.36 15 - 22.5
D-7 Heat bonded 186 – 245 41.72 150 – 250** 70.71 5 - 36
D-8 Heat bonded 120 – 242 86.27 75 – 125** 35.36 45 - 117
E-1 Needle - punched 157.5 - 675 365.93 300 – 425** 88.39 142.5 - 250
E-2 Needle - punched 137.5 - 207.5 49.50 128 - 311 129.40 9.5 - 103.5
E-3 Needle - punched 78 - 142.5 45.61 106 – 180** 52.33 28 - 37.5
E-4 Needle - punched 255 - 415 113.14 60 – 250** 134.35 165 - 195
E-5 Needle - punched 145 – 205 42.43 103 - 218 81.32 13 - 42
E-6 Needle - punched 162.5 – 222.5 42.43 98 - 199 71.42 23.5 - 64.5
E-7 Needle - punched 206 - 315 77.07 250 – 300** 35.36 15 - 44
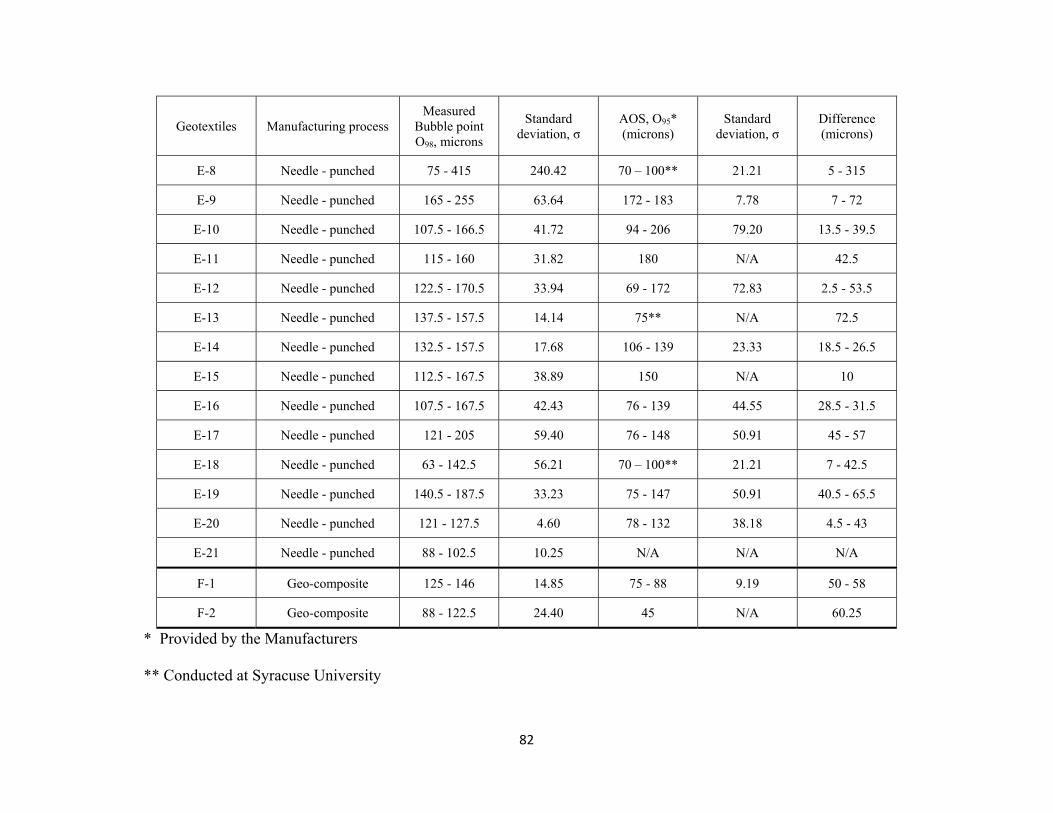
82
Geotextiles Manufacturing process Measured
Bubble point O98, microns
Standard deviation, σ
AOS, O95* (microns)
Standard deviation, σ
Difference (microns)
E-8 Needle - punched 75 - 415 240.42 70 – 100** 21.21 5 - 315
E-9 Needle - punched 165 - 255 63.64 172 - 183 7.78 7 - 72
E-10 Needle - punched 107.5 - 166.5 41.72 94 - 206 79.20 13.5 - 39.5
E-11 Needle - punched 115 - 160 31.82 180 N/A 42.5
E-12 Needle - punched 122.5 - 170.5 33.94 69 - 172 72.83 2.5 - 53.5
E-13 Needle - punched 137.5 - 157.5 14.14 75** N/A 72.5
E-14 Needle - punched 132.5 - 157.5 17.68 106 - 139 23.33 18.5 - 26.5
E-15 Needle - punched 112.5 - 167.5 38.89 150 N/A 10
E-16 Needle - punched 107.5 - 167.5 42.43 76 - 139 44.55 28.5 - 31.5
E-17 Needle - punched 121 - 205 59.40 76 - 148 50.91 45 - 57
E-18 Needle - punched 63 - 142.5 56.21 70 – 100** 21.21 7 - 42.5
E-19 Needle - punched 140.5 - 187.5 33.23 75 - 147 50.91 40.5 - 65.5
E-20 Needle - punched 121 - 127.5 4.60 78 - 132 38.18 4.5 - 43
E-21 Needle - punched 88 - 102.5 10.25 N/A N/A N/A
F-1 Geo-composite 125 - 146 14.85 75 - 88 9.19 50 - 58
F-2 Geo-composite 88 - 122.5 24.40 45 N/A 60.25
* Provided by the Manufacturers
** Conducted at Syracuse University

83
3.6 Previous studies
Bhatia and Smith (1996) showed that the staple fiber, needle-punched nonwoven geotextiles
showed the least variation in Capillary flow test results. On the other hand, woven and heat
bonded geotextiles with large openings showed a wide variation in Capillary flow test results.
They also found that the bubble point, O98 of non-woven geotextiles decrease with the increasing
mass per unit area (see Figure 3.30). However, woven geotextiles do not behave the same way.
Vermeersch et al. (1996) selected 9 continuous filaments, polypropylene needle-punched non-
woven geotextiles (mass per unit area = 140 – 1025 g/m2) and 6 continuous filaments,
polypropylene heat-bonded non-woven geotextiles (mass per unit area = 95 – 307 g/m2) for
capillary flow testing. They used Porofil® as a wetting liquid which has a surface tension of 16
mN/m and 170 Pa (1.28 mmHg) vapor pressure. The bubble point reported in the study was O100
instead of O98. Like Bhatia et al. (1996), Vermeersch et al. (1996) also found that the bubble
point (O100) of needle punched and heat bonded non-woven geotextiles decreases with the
increasing mass per unit area (see Figure 3.30).
Aydilek et al. (2006) used 8 monofilaments, 3 multifilaments and 7 slit film woven geotextiles
(102 – 850 g/m2) and 10 needle punched and 1 heat bonded non-woven geotextiles (110 – 533
g/m2) to perform capillary flow test. Aydilek et al. (2006) used a device to perform the Capillary
flow test which is manufactured in the University of Washington. The wetting liquid used in the
testing was deionized water. They found that the relatively larger pore openings in woven
geotextiles created problems during the bubble point test as a sufficient quantity of flow could
not be sustained. Aydilek et al. (2006) reported the bubble point as O95 instead of O98. They
investigate that measured bubble points of non-woven geotextiles decrease with the increasing
mass per unit area.
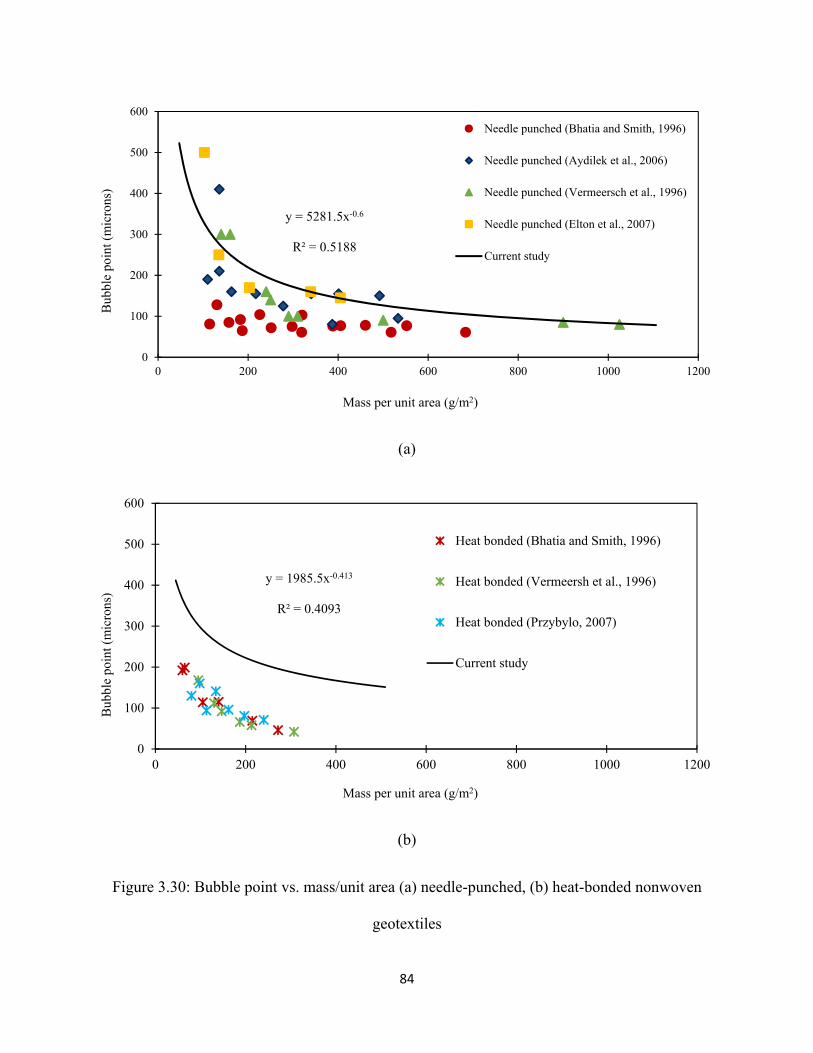
84
(a)
(b)
Figure 3.30: Bubble point vs. mass/unit area (a) needle-punched, (b) heat-bonded nonwoven
geotextiles
y = 5281.5x-0.6
R² = 0.5188
0
100
200
300
400
500
600
0 200 400 600 800 1000 1200
Bub
ble
poin
t (m
icro
ns)
Mass per unit area (g/m2)
Needle punched (Bhatia and Smith, 1996)
Needle punched (Aydilek et al., 2006)
Needle punched (Vermeersch et al., 1996)
Needle punched (Elton et al., 2007)
Current study
y = 1985.5x-0.413
R² = 0.4093
0
100
200
300
400
500
600
0 200 400 600 800 1000 1200
Bub
ble
poin
t (m
icro
ns)
Mass per unit area (g/m2)
Heat bonded (Bhatia and Smith, 1996)
Heat bonded (Vermeersh et al., 1996)
Heat bonded (Przybylo, 2007)
Current study

85
Elton et al., 2007 form Auburn University conducted capillary flow test with 5 needle punched
non-woven geotextiles (103 – 405 g/m2 mass per unit area). The equipment used in the test was
manufactured in Auburn University. They investigated that the bubble point results of needle
punched non-woven geotextiles decrease with the increasing mass per unit area (see Figure 3.30
(a)).
Przybylo (2007) tested 12 heat – bonded non – woven textiles made of polypropylene (54 - 240
g/m2) with uniform fiber diameters (fiber diameter ranged from 27 to 50 microns in thickness) in
his research at Syracuse University. The equipment used in the test was PMI automated CFP-
1500 AEDLS-2C. He used Galwick as a wetting liquid for geotextiles (15.9 dynes/cm surface
tension and 1/10th vapor pressure of Porewick). During testing a tortuosity factor of 0.715 was
used for all textiles. It was found that the bubble points of heat bonded non-woven geotextiles
decrease with the increasing mass per unit area (see Figure 3.30 (b)).
From the analysis conducted previously, it was found that the researchers have been using
different types of Capillary flow devices in their study. However, in all studies it was reported
that for needle punched and heat bonded non – woven geotextiles, the bubble point tends to
decrease with the increase in mass per unit area (Bhatia and Smith (1996), Vermeersch et al.
(1996), Aydilek et al. (2006), Elton et al. (2007), Przybylo (2007)). It can be noticed that most of
the bubble point results obtained from the previous study fall apart from the range of current
study. Only the results from Elton et al. (2007), few from Vermeersch et al. (1996) and Aydilek
et al. (2006) are close to the range of current study. No such trend was reported for woven
geotextiles in any study. These results validate the analysis conducted at Syracuse University.

86
3.7 Summary
20 woven geotextiles, 29 non-woven geotextiles, and 2 geo-composites were used in the
Capillary flow test and pore size distribution results with various shapes were obtained
for woven and non-woven geotextiles. 9 – 10 tests were conducted for each type of
geotextile with individual specimens to obtain consistency in the results. O50 and O10
were obtained from the pore size distribution along with bubble point, O98. Non-woven
geotextiles have small to larger pores which provides “S” shaped pore size distribution.
On the other hand, woven geotextiles have similar sized fibers moving over one another
which results into almost uniform pore sizes. Therefore, the pore size distribution of
woven geotextiles does not look like “S” shaped. The deviation in the test results were
also described in the study.
To find out the minimum and maximum outliers, box plot and whisker diagrams were
used in the analysis for 7 kinds of geotextiles (monofilament, slit film, fibrillated fill, and
multifilament woven geotextiles, needle punched and heat bonded non-woven
geotextiles, and geo-composites). Two monofilament woven, 2 slit film woven, 1
multifilament woven and 9 needle punched non-woven geotextiles showed outliers in the
box and whisker diagram.
From the results plotted for pore openings vs. mass per unit area, it was found that O98,
O50 and O10 of non-woven geotextiles decrease with the increasing mass per unit area.
However, no such trend could be found for woven geotextiles. The previous analysis
conducted by Bhatia (1996), Vermeersch et al. (1996), Aydilek (2006), Elton et al (2007),
and Przybylo (2007) were investigated as well and it was found that the bubble points of

87
non-woven geotextiles decrease with the increasing mass per unit area which validates
the current study.
3.8 References
ASTMD4404, “Standard Test Method for Determination of Pore Volume and Pore Volume
Distribution of Soil and Rock by Mercury Intrusion Porosimetry”, American Society for
Testing and Materials, West Conshohocken, Pennsylvania, USA.
ASTM D6767-16 Standard Test Method for Pore Size Characteristics of Geotextiles by
Capillary Flow Test, ASTM International, West Conshohocken, PA, 2014.
ASTM D4751-16 Standard Test Methods for Determining Apparent Opening Size of a
Geotextile, ASTM International, West Conshohocken, PA, 2016.
ASTMF316, “Standard Test Method for Pore Size Characteristics of Membrane Filters by
Bubble Point and Mean Flow Pore Test”, American Society for Testing and Materials,
West Conshohocken, Pennsylvania, USA.
Aydilek, A. H., & Edil, T. B. (2003). Evaluation of woven geotextile pore structure
parameters using image analysis. (2003): 1-12.
Aydilek, A. H., D'Hondt, D., & Holtz, R. D. (2006). Comparative evaluation of geotextile
pore sizes using bubble point test and image analysis. (2006): 1-9.
Bhatia, S.K., Huang, Q. and Smith, J., 1993, “Application of Digital Image Processing in
Morphological Analysis of Geotextiles”, Proceedings of Conference on Digital Image
Processing: Techniques and Applications in Civil Engineering, ASCE, proceedings of a
symposium held in Kona, Hawaii, USA, February-March 1993, 95-108.
88
Bhatia, S.K. and Smith, J.L., 1995, “Application of the Bubble Point Method to the
Characterization of the Pore-Size Distribution of Geotextiles”, ASTM Geotechnical
Testing Journal, Vol. 18, No. 1, 94-105.
Bhatia, S. K., & Smith, J. L. (1996). Geotextile characterization and pore-size distribution:
Part I. A review of manufacturing processes. Geosynthetics International, 3(1), 85-105.
Bhatia, S. K., & Smith, J. L. (1996). Geotextile characterization and pore-size distribution:
Part II. A review of test methods and results. Geosynthetics International, 3(2), 155-180.
Bhatia, S. K., & Smith, J. L. (1994). Comparative study of bubble point method and
mercury intrusion porosimetry techniques for characterizing the pore-size distribution of
geotextiles. Geotextiles and Geomembranes, 13(10), 679-702.
Blond, Eric; Vermeersch, O. G.; and Diederich, Romain (2015). A Comprehensive
Analysis of the Measurement Techniques used to Determine Geotextile Opening Size:
AOS, FOS, O90, and ‘Bubble Point’. Geosynthetics 2015, February 15-18, Portland,
Oregon.
Calhoun, C.C., Jr., 1972, “Development of Design Criteria and Acceptance Specifications
for Plastic Filter Cloth”, Technical Report F-72-7, U.S. Army Corps of Engineers
Waterways Experimental Station, Vicksburg, Mississippi, USA, 105.
Cap.Fl.5-12- 09 Capillary Flow Porometer 7.0, Porous Materials Inc.
Christopher, B.R. and Holtz, R.D., 1985, “Geotextile Engineering Manual”, U.S.
Department of Transportation, Federal Highway Administration, Washington, DC, USA,
Report No. FHWA-TS-86/203, March 1985, 1044.
Elsharief, A.H. and Lovell, C.W., 1996, “Determination and Comparison of Structural
Properties of Nonwoven Geotextiles”, Recent Developments in Geotextile Filters and

89
Prefabricated Drainage Geocomposites, Bhatia, S.K. and Suits, L.D., Editors, ASTM
Special Technical Publication 1281, proceedings of a symposium held in Denver,
Colorado, USA, June 1995, in press.
Elton, D. J., Hayes, D. W., & Adanur, S. (2006). Bubble point testing of geotextiles:
apparatus and operation. (2006): 1-8.
Elton, D. J., & Hayes, D. W. (2007). The Bubble Point Method for Characterizing
Geotextile Pore Size. In Geosynthetics in Reinforcement and Hydraulic Applications (1-
10). ASCE.
Fayoux,D., 1977, “Filtration Hydro dynamique des Sols par des Textiles”, Proceedings of
the International Conference on the Use of Fabrics in Geotechnics, Vol. 2, Paris, France,
April 1977, 329-332. (in French)
Giroud, J.P., 1982, “Filter Criteria for Geotextiles”, Proceedings of the Second
International Conference on Geotextiles, IFAI, Vol. 1, Las Vegas, Nevada, USA, August
1982, 103-108.
Gourc, J.P., 1982, “Quelques Aspects du Comportement des Géotextiles en Mécanique des
Sols”, Thèse de Docteur des Sciences, Université Joseph Fourier, Grenoble, France, 249
(in French).
Ingold, T.S. and Miller, K.S., 1988, “Geotextiles Handbook”, Thomas Telford Ltd.,
London, United Kingdom, 152.
Joseph, M.L., 1981, “Introductory Textile Science”, 4th Edition, CBS Publishing, New
York, New York, USA, 406.
Khachan, M. M. (2016). Sustainable and innovative approaches for geotextile tube
dewatering technology. PhD Dissertation. Syracuse University, NY, USA.

90
Kiffle, Z. B., Bhatia, S. K., Khachan, M. M., & Jackson, E. K. (2014). Effect of pore size
distribution on sediment retention and passing. In 10th International Conference on
Geosynthetics, ICG 2014 Deutsche Gesellschaft fur Geotechnik e. V.
Koerner, R. M., & Koerner, G. R. (2014). On the Need for a Better Test Method Than Dry
or Wet Sieving to Obtain the Characteristic Opening Size for Geotextile Filter Design
Purposes. Geosynthetic Institute’s White Paper, 31.
Kulter, H., 1985, “Non-Woven Bonded Fabrics”, Lunenschloss, J. and Albrecht, W., Eds.,
Ellis Horwood, Ltd., Chichester, United Kingdom, 178.
Kutay, M. E., & Aydilek, A. H. (2004). Retention performance of geotextile containers
confining geomaterials. Geosynthetics International, 11(2), 100-113.
Lawson, C. R. (2008). Geotextile containment for hydraulic and environmental
engineering. Geosynthetics International, 15(6), 384-427.
Liao, K., & Bhatia, S. K. (2005). Geotextile tube: filtration performance of woven
geotextiles under pressure. Proceedings of NAGS, 1-15.
Lombard, G. and Rollin, A., 1987, “Filtration Behavior Analysis of Thin Heat Bonded
Geotextiles”, Proceedings of Geosynthetics ’87, IFAI, Vol. 2, NewOrleans, Louisiana,
USA, February 1987, 482-492.
Lydon, R., Mayer, E., & Rideal, G. R. (2004, April). Comparative methods for the pore
size distribution of woven and metal filter media. In 9th World Filtration Congress. (1-6)
Masounave, J., Denis, R. and Rollin, A.L., 1980, “Prediction of Hydraulic Behavior of
Synthetic Non-Woven Filter Fabrics Used in Geotechnical Works”, Canadian
Geotechnical Journal, Vol. 17, No. 4, 517-525.
91
Moraci, N., Mandaglio, M.C., Salmi, M. (2016). Long term behavior of woven and
nonwoven geotextile filters. GeoAmericas 2016, vol. 1, 740-749.
Mori, H., Miki, H., & Tsuneoka, N. (2002). The geo-tube method for dioxin-contaminated
soil. Geotextiles and Geomembranes, 20(5), 281-288.
Mlynarek, J., Lafleur, J., Rollin, R. and Lombard, G., 1993, “Filtration Opening Size of
Geotextiles by Hydrodynamic Sieving”, ASTM Geotechnical Testing Journal, Vol. 16, No.
1, 61-69.
Muthukumaran, A. E., & Ilamparuthi, K. (2006). Laboratory studies on geotextile filters
as used in geotextile tube dewatering. Geotextiles and Geomembranes, 24(4), 210-219.
Palmeira, E. M., Fannin, R. J., & Vaid, Y. P. (1996). A study on the behavior of soil
geotextile systems in filtration tests. Canadian Geotechnical Journal, 33(4), 899-912.
Palmeira, E. M., & Gardoni, M. G. (2000). The influence of partial clogging and pressure
on the behavior of geotextiles in drainage systems. Geosynthetics International, 7(4-6),
403-431.
Prapaharan, S., Holtz, R.D. and Luna, J.D., 1989, “Pore Size Distribution of Nonwoven
Geotextiles”, ASTM Geotechnical Testing Journal, Vol. 12, No. 4, 261-268.
Przybylo, Lukasz (2007). An investigation of the Bubble Point method and Capillary flow
porometry for geotextiles characterization. MS Thesis. Syracuse University, NY, USA.
Rollin, A.L., Masounave, J. and Dallaire, G., 1977, “Etudes des propriétés hydrauliques
desmembranes non-tissées”, Proceedings of the International Conference on the Use of
Fabrics in Geotechnics, Vol. 2, Paris, France, April 1977, 201-206. (In French)

92
Saathoff, F. and Kohlhase, S., 1986, “Research at the Franzius-Institut on Geotextile Filters
in Hydraulic Engineering,” Proceedings of the Fifth Congress Asian and Pacific Regional
Division, ADP/IAHR, Seoul, Korea, 9-10.
Satyamurthy, R., & Bhatia, S. K. (2009). Effect of polymer conditioning on dewatering
characteristics of fine sediment slurry using geotextiles. Geosynthetics International, 16(2),
83-96.
Siva, U. and Bhatia, S.K., 1993, “Rapid Filtration Performance Tests for Nonwoven
Geotextiles with Silty Sands”, Proceedings of Geosynthetics ’93, IFAI, Vol. 1, Vancouver,
British Columbia, Canada, March 1993, 483-500.
Smith, J. L., & Bhatia, S. K. (1995). Application of the bubble point method to the
characterization of the pore-size distribution of geotextiles. 94-105.
Smith, J.L. (1996). The pore size distribution of geotextiles. MS Thesis. Syracuse
University, Syracuse, NY, USA.
Vermeersch, O. G., & Mlynarek, J. (1996). Determination of the pore size distribution of
nonwoven geotextiles by a modified capillary flow porometry technique. In Recent
developments in geotextile filters and prefabricated drainage geocomposites. ASTM
International.
Washburn, E.W. (1921). Proceedings of the National Academy of Science, Vol. 7, No.
115.

93
Chapter 4 Bubble Point Results: Correlations
4.1 Introduction
For the last 15 years, extensive studies have been carried out to find a common standard for
measuring the largest pore size of geotextiles. However, different standards are used in different
countries as a practice to measure the pore sizes of geotextiles. The pore sizes of a geotextile
differ based on the variation in standards and devices. In USA, Dry sieving (ASTM D4751) is a
common standard to measure the O95 (AOS) of geotextiles, which is one of the major properties
used to evaluate geotextile retention performance. Despite of the disadvantages (electrostatic
effects, clogging of glass beads etc.) encountered with the dry sieving test, in the USA, most of
the geotextile filters are designed based on the AOS, O95 values. Along with the largest pore,
smaller pores also play an important role in the life of geotextile as a filter (Rankilor 1981,
Giroud 1982, Christopher and Holtz 1985). Therefore, researchers have been looking for a
method to measure the smaller pores as well as larger pores of geotextiles. Besides Dry sieving,
Capillary flow test is an approved standard in the US which can provide a complete pore size
distribution with the largest pore size (O98) of a geotextile. Despite of numerous advantages of
ASTM D 6767, this test is not widely used in USA. Therefore, an ASTM meeting was held at
Syracuse University in the summer of May 4th, 2015, having participants from industries and
research institution, to come up with a correlation between Dry sieving test and Capillary flow
test results.
For the last 20 years, ASTM D 4751 is used to determine the apparent opening size (AOS, O95)
of a geotextile in the industries and research institutions. In the current standard of ASTM
D4751-16, two methods of calculating pore size of a geotextile are presented; method A covers
the determination of AOS, O95 by sieving glass beads through a geotextile and method B deals

94
with the capillary flow test by pressurizing the pores to overcome the capillary attraction. The
new addition to the ASTM D 4751, method B follows ASTM D6767 to obtain the pore opening
(bubble point, O98) of geotextiles. It means, capillary flow test has already been accepted as an
alternative method to dry sieving test for determining the pore size of geotextiles. However, it is
noted in the ASTM D4751-16 that the AOS, O95 obtained by the dry sieving test may not be
precisely identical to the bubble point, O98 obtained by the ASTM D6767. Capillary flow test
was recommended to use as an alternative test with proper correlation with dry sieving test and
established requirements of the test method for distinct types of geotextiles. The testing
procedure of capillary flow test is described in ASTM D4751 following ASTM D6767. A set of
three capillary flow tests are suggested to establish a correlation between the results obtained by
ASTM D4751 and ASTM D6767.
4.2 Correlation between Capillary Flow and Dry Sieving Test
4.2.1 Current study
In this study, Capillary flow test and Dry sieving test results of a wide range of woven (190 –
1100 g/m2), non – woven (88 – 1075 g/m2) geotextiles and geo-composites (534 – 879 g/m2)
from different manufacturers, correlation between these two types of test results is obtained. For
many geotextiles, the AOS values were provided by the manufacturers. For seventeen geotextiles
(2 monofilaments woven, 7 needle punched non-woven, and 8 heat bonded non-woven
geotextiles), for which dry sieving test results were not available, dry sieving tests were
conducted. The ASTM D4751 was followed to perform the tests. The glass beads was used in the
test were standardized according to the ASTM D4751 and 5 to 6 tests were performed for each
type of geotextile to obtain the AOS as a range rather than a single number.
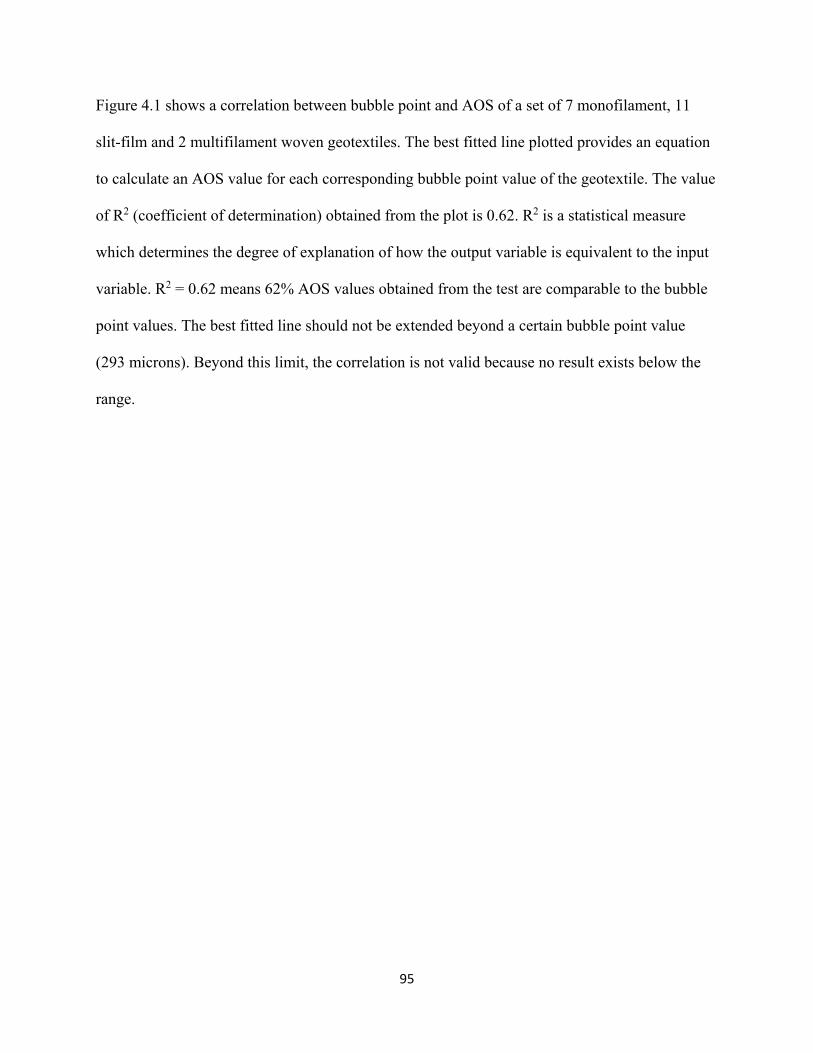
95
Figure 4.1 shows a correlation between bubble point and AOS of a set of 7 monofilament, 11
slit-film and 2 multifilament woven geotextiles. The best fitted line plotted provides an equation
to calculate an AOS value for each corresponding bubble point value of the geotextile. The value
of R2 (coefficient of determination) obtained from the plot is 0.62. R2 is a statistical measure
which determines the degree of explanation of how the output variable is equivalent to the input
variable. R2 = 0.62 means 62% AOS values obtained from the test are comparable to the bubble
point values. The best fitted line should not be extended beyond a certain bubble point value
(293 microns). Beyond this limit, the correlation is not valid because no result exists below the
range.

96
Figure 4.1: Correlation between Bubble Point and AOS of Woven Geotextiles
The best fitted line shows a positive slope which indicates an increasing trend of AOS
corresponding to bubble point for each monofilament geotextile. In Figure 4.1, the range of AOS
and bubble point values are presented with mean +/-2SD (a band around the mean with a width
of two standard deviations). According to the three-sigma rule of thumb, mean +/- 2SD is called
95% confidence level as well. Figure 4.1 shows that 1 out of 2 multifilaments has the smallest
bubble point and one monofilament has the largest bubble point value. The equation presented
with the best fitted line provides comparable AOS against a bubble point for each woven
y = 0.98x + 46R² = 0.62
0
100
200
300
400
500
600
700
0 100 200 300 400 500 600 700
AO
S, m
icro
ns
BBP, microns
monofilament
slit film
multifilament
Best fitted line
Mean - 2SD
Mean +2SD

97
geotextile. For any bubble point in the equation, y = 0.98x + 46, provides a larger AOS of a
woven geotextile. If bubble point of a woven geotextile is 300 microns, using the equation from
Figure 4.1 the AOS can be obtained as follows:
y = 0.98*x + 46
AOS, O95 = 0.98*300 + 46 = 340 microns
Theoretically 15 out of 20 geotextiles showed larger AOS values than the bubble point values.
However, 3 monofilament (A-2 to A-4) and 1 multifilament (C-1) woven geotextiles provided
smaller AOS values than bubble point values. Therefore, the correlation for all woven geotextiles
presented in this study, should not be considered valid for all types of woven geotextiles, there
might be some deviation which should be evaluated properly.
Relationship between Bubble Point and AOS of 8 heat bonded and 21 needle punched non-
woven geotextiles is shown in Figure 4.2. A best fitted curve represented with a linear equation,
y = 0.97x -13, provides a positive correlation with 61% possibility to obtain AOS results
comparable to the corresponding bubble point result of each non-woven geotextile (see Figure
4.2). Any bubble point in the equation provides a smaller AOS for a non-woven geotextile.
However, based on the capillary flow and dry sieving test results, 5 out of 8 heat bonded (D-1 to
D-4 and D-6) and 6 out of 21 needle punched (E-2, E-3, E-7, E-10, E-11, and E-15) non-woven
geotextiles had larger AOS values than bubble point. It was also noticed that for heat bonded
geotextiles, a small range of bubble point (181 – 356 microns) provided a broad range of AOS
(100 – 477.5 microns). However, for needle punched geotextiles, the range of bubble point is
124 – 416 microns and AOS is 75 – 362.5 microns respectively. The range of possible AOS and
bubble point values were showed with mean +/- 2SD. Beyond a value of 105 microns of bubble

98
point and 75 microns of AOS, the correlation is not reliable for any heat bonded and needle
punched non-woven geotextile because no result is available in the correlation below this limit.
Figure 4.2: Correlation between Bubble Point and AOS of Non- Woven Geotextiles
y = 0.97x - 13R² = 0.61
0
100
200
300
400
500
600
700
0 100 200 300 400 500 600 700
AO
S (
mcr
ons)
BBP (mcirons)
heat bonded
needle punched
Best fitted line
Mean +2SD
Mean - 2SD
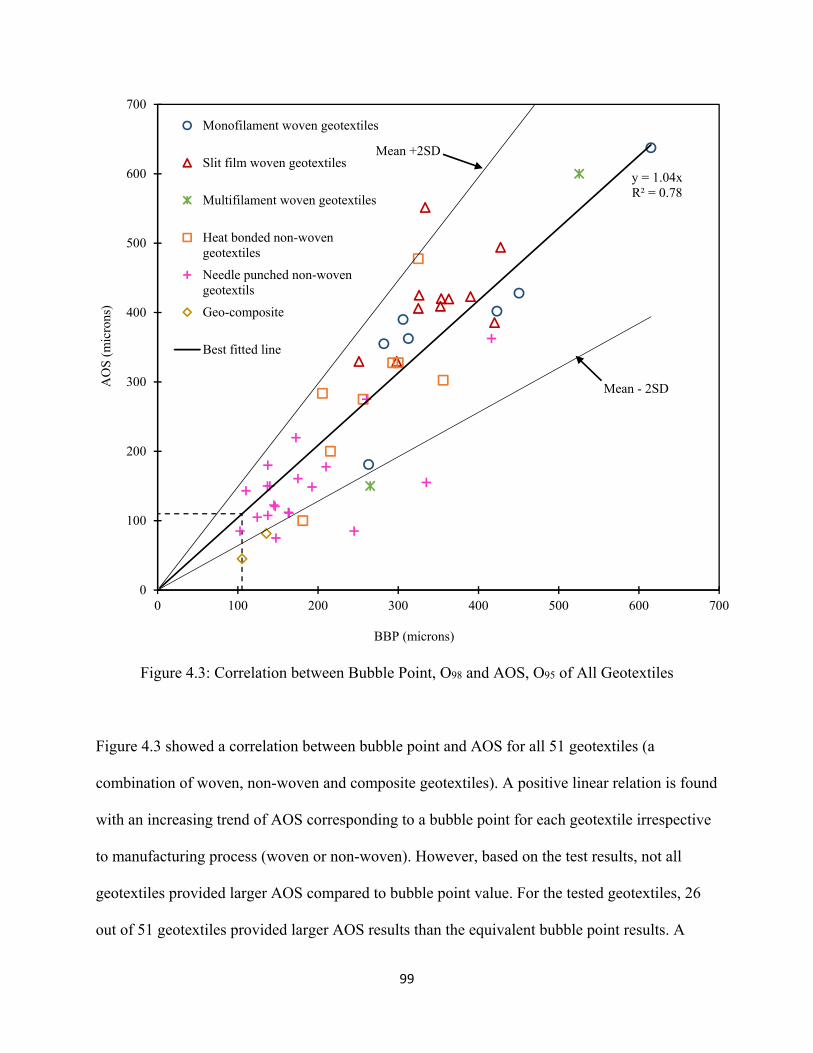
99
Figure 4.3: Correlation between Bubble Point, O98 and AOS, O95 of All Geotextiles
Figure 4.3 showed a correlation between bubble point and AOS for all 51 geotextiles (a
combination of woven, non-woven and composite geotextiles). A positive linear relation is found
with an increasing trend of AOS corresponding to a bubble point for each geotextile irrespective
to manufacturing process (woven or non-woven). However, based on the test results, not all
geotextiles provided larger AOS compared to bubble point value. For the tested geotextiles, 26
out of 51 geotextiles provided larger AOS results than the equivalent bubble point results. A
y = 1.04xR² = 0.78
0
100
200
300
400
500
600
700
0 100 200 300 400 500 600 700
AO
S (
mic
rons
)
BBP (microns)
Monofilament woven geotextiles
Slit film woven geotextiles
Multifilament woven geotextiles
Heat bonded non-wovengeotextiles
Needle punched non-wovengeotextils
Geo-composite
Best fitted line
Mean +2SD
Mean - 2SD
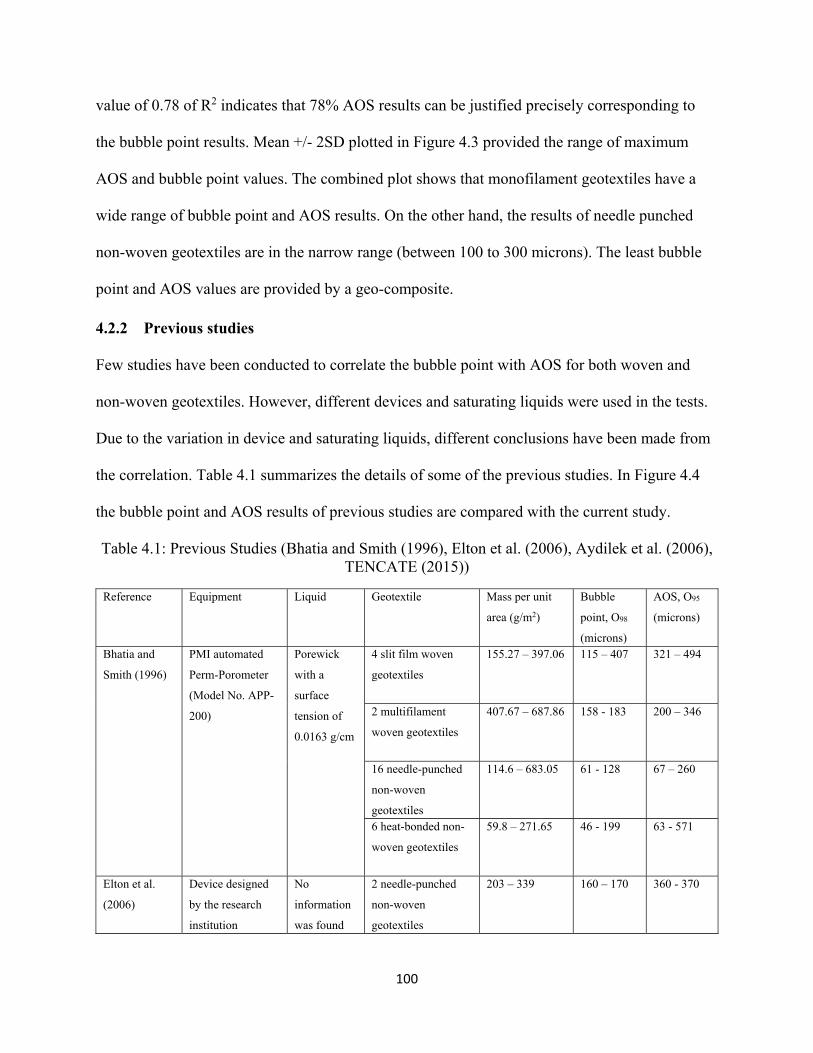
100
value of 0.78 of R2 indicates that 78% AOS results can be justified precisely corresponding to
the bubble point results. Mean +/- 2SD plotted in Figure 4.3 provided the range of maximum
AOS and bubble point values. The combined plot shows that monofilament geotextiles have a
wide range of bubble point and AOS results. On the other hand, the results of needle punched
non-woven geotextiles are in the narrow range (between 100 to 300 microns). The least bubble
point and AOS values are provided by a geo-composite.
4.2.2 Previous studies
Few studies have been conducted to correlate the bubble point with AOS for both woven and
non-woven geotextiles. However, different devices and saturating liquids were used in the tests.
Due to the variation in device and saturating liquids, different conclusions have been made from
the correlation. Table 4.1 summarizes the details of some of the previous studies. In Figure 4.4
the bubble point and AOS results of previous studies are compared with the current study.
Table 4.1: Previous Studies (Bhatia and Smith (1996), Elton et al. (2006), Aydilek et al. (2006), TENCATE (2015))
Reference Equipment Liquid Geotextile Mass per unit
area (g/m2)
Bubble
point, O98
(microns)
AOS, O95
(microns)
Bhatia and
Smith (1996)
PMI automated
Perm-Porometer
(Model No. APP-
200)
Porewick
with a
surface
tension of
0.0163 g/cm
4 slit film woven
geotextiles
155.27 – 397.06 115 – 407 321 – 494
2 multifilament
woven geotextiles
407.67 – 687.86 158 - 183 200 – 346
16 needle-punched
non-woven
geotextiles
114.6 – 683.05 61 - 128 67 – 260
6 heat-bonded non-
woven geotextiles
59.8 – 271.65 46 - 199 63 - 571
Elton et al.
(2006)
Device designed
by the research
institution
No
information
was found
2 needle-punched
non-woven
geotextiles
203 – 339 160 – 170 360 - 370

101
Aydilek, et al.
(2006)
Device
manufactured in
the University of
Washington
Water 8 monofilament
woven geotextiles
120 – 490 295 – 920 212 – 650
7 slit film woven
geotextiles
102 – 291 190 – 585 212 – 425
3 multifilament
woven geotextiles
257 – 850 285 – 920 150 - 600
11 needle-punched
non-woven
geotextiles
110 – 533 80.5 – 410 106 - 300
TENCATE
(2015)
PMI porometer No
information
was found
8 monofilament
woven geotextiles
(woven
No information
was found
277 – 421 300 - 425

102
Figure 4.4: Correlation between Bubble Point, O98 and AOS, O95 of All Geotextiles (Bhatia et al.
(1996), Aydilek et al. (2006), Elton eta al. (2007) and TENCATE (2014))
Figure 4.4 showed a correlation between bubble point and AOS results of all geotextiles tested
by Bhatia et al. (1996), Aydilek et al. (2006), Elton et al. (2007) and TENCATE (2014)). The
results obtained by Aydilek et al. (2006) were mostly scattered and provided the largest range of
bubble point (80 – 610 microns). The results obtained by Bhatia et al. (1996) showed least
variation in the bubble point results. The straight line plotted with an equation, y = 1.04x and R2
y = 1.04xR² = 0.78
0
200
400
600
800
1000
0 200 400 600 800 1000
AO
S (
mic
rons
)
BBP (mirons)
Slit film (Bhatia et al.,1996)
Multifilament (Bhatia et al.,1996)
Needle punched (Bhatia etal., 1996)
Heat bonded (Bhatia et al.,1996)
Slit film (Aydilek et al.,2006)
Multifilament (Aydilek etal., 2006)
Monofilament (Aydilek etal., 2006)
Needle punched (Aydilek etal., 2006)
Monofilament (TENCATE,2014)
Needle punched (Elton etal., 2007)
Current study
Mean +2SD
Mean - 2SD

103
= 0.78, showed the test results of Capillary flow and Dry sieving test obtained in the current
study. The results of mostly non-woven geotextiles (except Elton et al., 2006) in the previous
study are close to the current study, results of few heat bonded non-woven geotextiles performed
by Bhatia et al. (1996) fall in the range of current study. The woven geotextiles (monofilament,
slit film and multifilament) are falling apart from the test results in the current study. Bhatia et al.
(1996) and Elton et al. (2006) showed an increasing trend of AOS in their results compared to
bubble point. The results obtained by Aydilek et al. (2006) do not show the similar trend of
increasing AOS for all geotextiles. The range of maximum AOS and bubble point values were
shown with mean +/- 2SD, which represents 95% confidence level (three-sigma rule of thumb).
Most of the results obtained by Bhatia et al. (1996) and Elton et al. (2007) did not fall into the
range of 95% confidence level of current study.
4.3 Comparison of Filtration Opening Size and Bubble Point
Based on a large number of experimental data and theoretical concepts, Giroud (1996)
established a mathematical equation which relates fiber diameter, fiber density, porosity and
thickness of a geotextile with the pore opening (filtration opening) of non-woven geotextile. The
equation is as follows:
4.1
Where, OF = filtration opening size, mm
df = diameter of fiber, mm
tGT = thickness of a non-woven geotextile, mm
n = porosity of a non-woven geotextile

104
On the right side in the equation, the factor 10 was obtained through calibration with many
experimental data. The porosity (n) of a non-woven geotextile can be calculated using the
following equation.
Where, μGT = mass per unit area of non-woven geotextile, g/m2
ρf = density of fiber, g/m3
tGT = thickness of non-woven geotextile, m
The theoretical filtration opening (Of) size of 21 needle punched non-woven geotextiles were
calculated using the equation 4.1given by Giroud, and compared with the pore opening, O98
obtained by the Capillary flow test. For all non-woven geotextiles, the mass per unit area and
thickness of geotextiles were measured at Syracuse University (see Table 4.2). The fiber
diameter information was collected from the manufacturers and a typical fiber density (density of
Polypropylene = 946 kg/m3, https://en.wikipedia.org/wiki/Polypropylene) was used in the
analysis. Table 4.2 shows the physical properties of the non-woven geotextiles used to calculate
the filtration opening sizes. Since all geotextiles were made of polypropylene, fiber density was
used as 946 kg/m3 for the calculations. Equation 4.2 was used to calculate the porosity of the
non-woven geotextile which used mass per unit area and thickness of geotextile and fiber
density. In Figure 4.5, the filtration opening size (Of) and O98 are plotted against the mass per
unit area of non-woven geotextiles. As it can be seen that for lighter geotextiles, the bubble point
(O98) values are generally larger than the filtration opening sizes and the difference decreases
with increasing mass per unit area. A correlation in the pore openings is plotted in Figure 4.5 and
Figure 4.6 respectively.
4.2

105
Table 4.2: Physical Properties of Non-Woven Geotextiles
Geotextiles Mass per unit area, g/m2 Thickness, mm Diameter of
fiber, microns Porosity, n
E-1 147 0.765 38.5 0.796 E-2 154.5 0.765 36.7 0.786 E-3 230.5 1.095 38.5 0.777 E-4 163.5 0.855 38.5 0.797 E-5 239.5 1.17 45 0.783 E-6 254.5 0.945 40 0.715 E-7 220 1.095 38.5 0.787 E-8 278.5 1.365 38.5 0.784 E-9 287 1.74 32 0.825
E-10 296.5 1.24 36 0.747 E-11 297.5 0.925 38.5 0.660 E-12 327 1.34 38.7 0.742 E-13 332.5 1.755 38.5 0.799 E-14 387 2.54 38.5 0.838 E-15 386 1.67 38.5 0.755 E-16 447 2.005 40 0.764 E-17 461.5 2.03 36 0.759 E-18 559 2.685 38.5 0.779 E-19 540.5 3.795 38.5 0.849 E-20 596.5 3.745 35 0.831 E-21 1006 5.85 38.5 0.818

106
Figure 4.5: Theoretical and Measured Pore Openings vs. Mass Per Unit Area of Needle Punched Non-Woven Geotextiles
0
50
100
150
200
250
300
350
400
450P
ore
open
ing,
mic
rons
Mass per unit area, g/m2
Filtration opening size, Of
Bubble point, O98
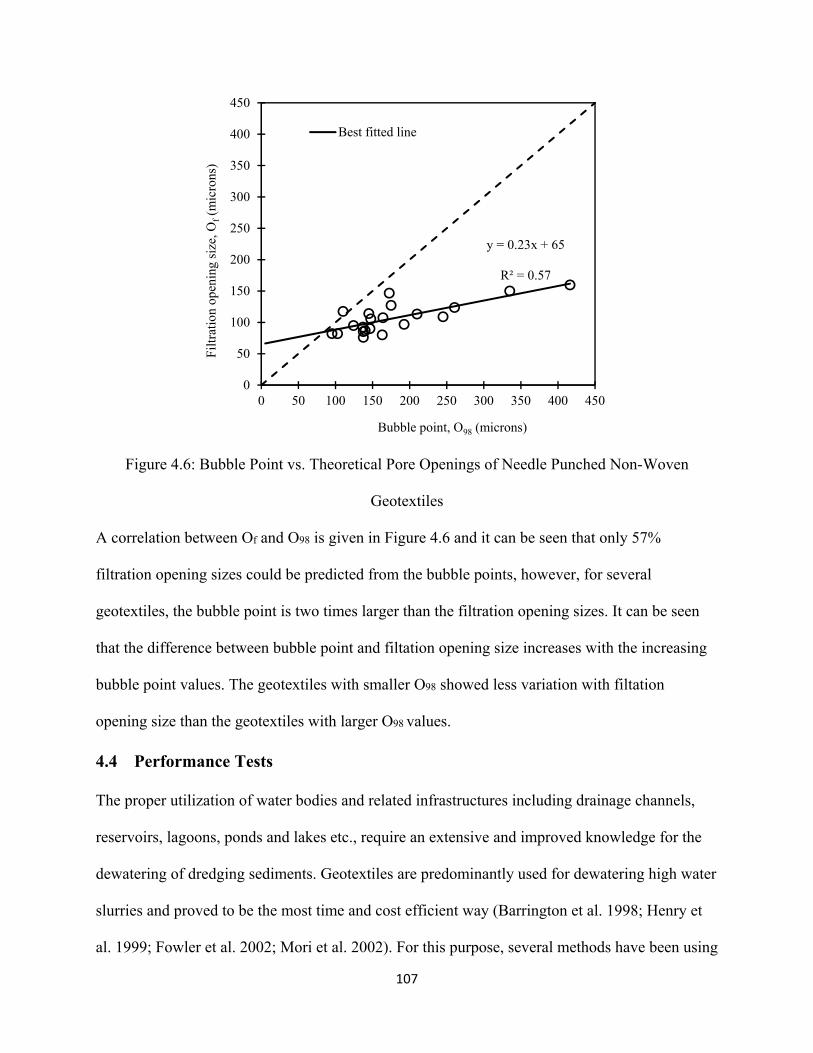
107
Figure 4.6: Bubble Point vs. Theoretical Pore Openings of Needle Punched Non-Woven
Geotextiles
A correlation between Of and O98 is given in Figure 4.6 and it can be seen that only 57%
filtration opening sizes could be predicted from the bubble points, however, for several
geotextiles, the bubble point is two times larger than the filtration opening sizes. It can be seen
that the difference between bubble point and filtation opening size increases with the increasing
bubble point values. The geotextiles with smaller O98 showed less variation with filtation
opening size than the geotextiles with larger O98 values.
4.4 Performance Tests
The proper utilization of water bodies and related infrastructures including drainage channels,
reservoirs, lagoons, ponds and lakes etc., require an extensive and improved knowledge for the
dewatering of dredging sediments. Geotextiles are predominantly used for dewatering high water
slurries and proved to be the most time and cost efficient way (Barrington et al. 1998; Henry et
al. 1999; Fowler et al. 2002; Mori et al. 2002). For this purpose, several methods have been using
y = 0.23x + 65
R² = 0.57
0
50
100
150
200
250
300
350
400
450
0 50 100 150 200 250 300 350 400 450
Filt
ratio
n op
enin
g si
ze, O
f(m
icro
ns)
Bubble point, O98 (microns)
Best fitted line

108
including pressurized and non-pressurized techniques to dewater the dredged sediments. The
water content of these dredged sediments can be as high as 800% and very low shear strength
before dewatering (Pilarczyk 2000, Moo-Young et al. 2002). To ensure high tensile strength to
carry the high-water content sediments, the high tensile strength woven geotextiles are seamed
together to manufacture the geotextile tubes. The sediments are pumped into the tubes as a slurry
and allowed to settle down and the water filters through the pores of the geotextile tubes. The
pore sizes of the geotextile tubes play an important role in dewatering. The dewatering of fine
grained sediments may cause excessive piping due to the large pores of geotextile tubes,
therefore, the geotextiles are selected carefully during the manufacturing of tubes. To ensure the
long-term performance of geotextile tubes, two major factors including soil piping and clogging
are important. The geotextile should be selected in a way that it will not be clogged and soil
piping will be minimal. Therefore, soil retention is an important criterion, especially in a case of
high water content slurries. In addition, the formation of filter cake during dewatering plays a
crucial role in filtration, since it controls the piping of fine grained materials, provides soil
retention and prevents excessive clogging of the filter. Several methods are used to evaluate the
filter cake formation and its properties including, Pressure filtration test (Montero and Overmann
(1990); Moo-Young et al. (1999); Moo-Young et al. (2002); Aydilek and Edil (2002, 2003);
Kutay and Aydilek (2004); Liao and Bhatia (2005)), Hanging bag test (Baker et al. (2002); and
Falling head dewatering test (Huang and Luo (2007)), etc.
In this study, relationships between geotextile filter performance and its relationship to pore
openings is evaluated by conducting two different types of tests: 1-D filtration (Falling-head test)
and Pressurized 2-D test. The falling-head tests were performed with 6 woven and 6 non-woven
geotextiles which have similar O98 but different pore size distributions. The 2-D tests were

109
performed with 1 slit film and 1 multifilament woven geotextiles, 2 geo-composites, 6 needle-
punched non-woven geotextiles. The selected geotextiles had a range of pore size distribution
and permutabilities.
4.4.1 1-D Filtration Test (Falling Head Test)
Several studies have been carried out to evaluate dewatering and sediment retention of high
water content slurries with a variety of geotextiles using falling-head test (Kutay and Aydielk
(2004); Liao and Bhatia, (2005); Muthukumaran and Ilmaparuthi (2006); and Kiffle et al.
(2014)). According to Kutay and Aydilek (2004), the retention performance of a geotextile tube
depends on several factors including apparent opening size (AOS, O95), permittivity, and water
content of slurry. Kiffle et al. (2014) study was the only one that investigated the role of pore
size distribution of geotextiles on sediment retention of high water content of slurries. However,
their study was limited to 2 pairs of geotextiles only.
Many researchers have developed sediment retention and geotextile clogging criteria for both
woven and non-woven geotextiles for high water content slurries. For the retention purpose, the
larger pore sizes of geotextiles (O50 – O95) and particle sizes (d50 – d95) are usually used. The
clogging criteria include small pore openings of geotextiles (O40) and sediments (d15). Moo-
Young and Tucker (2002) used three high strength woven geotextiles (two are made of
polypropylene and one is made of polyester fiber) of AOS of 212 – 425 microns, to perform
vacuum filtration test to evaluate the filtration and retention capacity of geotextiles. The high-
water content (250%, 500%, and 1200%) slurries were used. The range of the piping rate
reported was 25 – 2173 g/m2, which was less than the piping rate limit of 2500 g/m2 (Lafleur et
al., 1989). Moo-Young and Tucker (2002) also investigated that as a clogging criterion, the

110
allowable range of percent open area (POA) of woven geotextile is 1 – 5 percent. No further
information was available for the measurement of clogging.
Aydilek (2006) used 4 monofilament, 4 slit film and 1 multifilament woven geotextiles of O95 of
130 – 665 microns to evaluate the filtration performance of soil-geotextile system using
RETAIN and compare with the laboratory soil-geotextile filtration tests. The soil used in the test
was silty sand (USCS classification) with a specific gravity of 2.67. No further information was
found for soil, water content and laboratory test. The range of measured and predicted piping rate
were 100 – 3900 g/m2 and 471 – 4809 g/m2 respectively. The clogging of geotextile was
measured by comparing the ratio of permeability of clean and clogged geotextiles.
Muthukumaran et al. (2006) used 4 woven geotextiles (90 – 600 microns AOS) to perform the
Standard Filtration test with unidirectional flow. The sediments used in the test including harbor
sediments and fly ash to prepare the slurry with 80% - 320% water content. The following
retention criteria were proposed by Muthukumaran et al. (2006): AOS of the geotextiles ≤ 425
microns; 40< AOS/d15< 125; and 0.3< AOS (d85/d15) < 1.7.
Liao and Bhatia (2008) used one high strength polypropylene monofilament woven geotextile
(O95 = 443 microns) and two high strength polyester multifilament woven geotextiles (O95 = 218
- 307 microns) to perform pressure filtration test using three soils (Cayuga Lake sediments,
Ottawa clean sand, and silt) with a water content of 100%, 200%, 300% and 400%. They found
that the filtration efficiency of the coarse-grained materials decreases a little bit (3%) with the
increasing water content (100% - 400%), however, the filtration efficiency of fine-grained
materials decreases 10% with the increasing water content (100% - 400%). The range of piping
obtained in the test was reported as 152.64 – 252.48 g/m2 and piping increases with the
increasing pressure.

111
Palmeira and Gardoni (2000) used eight needle punched non-woven geotextiles (60 – 500
microns FOS) to evaluate the behavior of partially clogged geotextiles using compressibility,
transmissivity and permittivity tests. The soil sediments used in the clogging tests included
residual quartzite soil, sand, clayey sand, 4 types of glass beads. Several tests including vibration
(laboratory test), water flow, compaction (laboratory and field tests) were used to clog the
geotextiles. The range of impregnation level or degree of clogging (ratio of mass of soil particles
in the geotextile voids and mass of geotextile fibers) reported was 0.2 to 15.0. The large values
of degree of clogging were obtained when vibration was applied to clog the geotextiles.
Palmeira and Galvis (2016) used 7 needle punched non-woven geotextiles (200 – 1800g/m2 mass
per unit area and 60 – 130 microns FOS) to evaluate the behavior of partially clogged geotextiles
with glass beads using vibration to favor the penetration of beads in the voids. The range of
impregnation level or degree of clogging reported was 0.5 to 3.0. It was found that the degree of
clogging decreased with the increasing O95/df and O98/df where, df = diameter of fiber (df = 0.027
mm for geotextile).
Table 4.3 shows the existing criteria followed to select geotextile filter for high water content
sediments.
Table 4.3: Geotextile Filter Selection Criteria with High-Water Content Slurry
Criteria Soil and Geotextile type Reference
Retention: O95/D85<1
Clogging: POA (%) =1-5
Sandy or silty slurry; Woven
geotextile
Moo-Young and Tucker (2002)
Retention: O95<0.3 mm or
O90/D90=2-5
Clayey slurry; Woven geotextile Moo-Young and Tucker (2002)
Retention: O85/D50<1 for all POA Silty sand slurry; Woven geotextile Aydilek (2006)
Clogging: O40/D15 >1 for POA <8
O40/D30>1 for POA >8
Silty sand slurry; Woven geotextile Aydilek (2006)
AOS<0.425 mm
40<AOS/D15 <125
Silty slurries; Woven geotextile Muthukumaran and Ilmaparuthi
(2006)

112
0.3<AOS x D85/D15 <1.7
Filtration efficiency decreases 3%
with increasing water content,
100% - 400%
Coarse-grained Liao and Bhatia (2008)
Filtration efficiency decreases 10%
with increasing water content,
100% - 400%
Fine-grained Liao and Bhatia (2008)
To further investigate the influence of a complete pore size distribution on the soil retention
performance of a geotextile with high water content slurries, 1-D filtration tests (Falling head
test) were conducted on 6 pairs (3 pairs of woven and 3 pairs of non-woven geotextiles) having
similar bubble point (O98) but different pore size distribution (see Table 4.4and Figure 4.7).
Table 4.4: Physical properties of geotextiles used in the test
Pairs Geotextiles Manufacturing
process
Thickness
(mm)
Bubble point,
O98 (microns)
O50
(microns)
O10
(microns)
Permittivity
(sec-1)
1 A-5 Woven 0.82 – 0.89 285 – 340 200 170 0.9
A-7 Woven 0.48 – 0.49 252 – 360 280 250 0.96
2 A-4 Woven 0.74 – 0.82 400 – 501 430 390 1.5
B-8 Woven 1.04 – 1.25 375 – 480 377 277 0.4
3 B-3 Woven 0.83 – 0.88 315 – 411 200 127 0.9
B-5 Woven 1.1 – 1.15 305 – 400 275 210 0.9
4 E-10 Non-woven 1.14 – 1.34 107.5 – 166.5 65 37 1.4
E-17 Non-woven 1.93 – 2.13 107.5 – 167.5 75 45 0.8
5 E-12 Non-woven 1.18 – 1.5 122.5 – 170.5 70 40 0.8
E-14 Non-woven 2.2 – 2.88 132.5 – 157.5 90 57 1.0
6 E-16 Non-woven 1.87 – 2.14 121 – 205 85 45 0.7
E-19 Non-woven 3.47 – 4.12 140.5 – 187.5 103 50 0.9
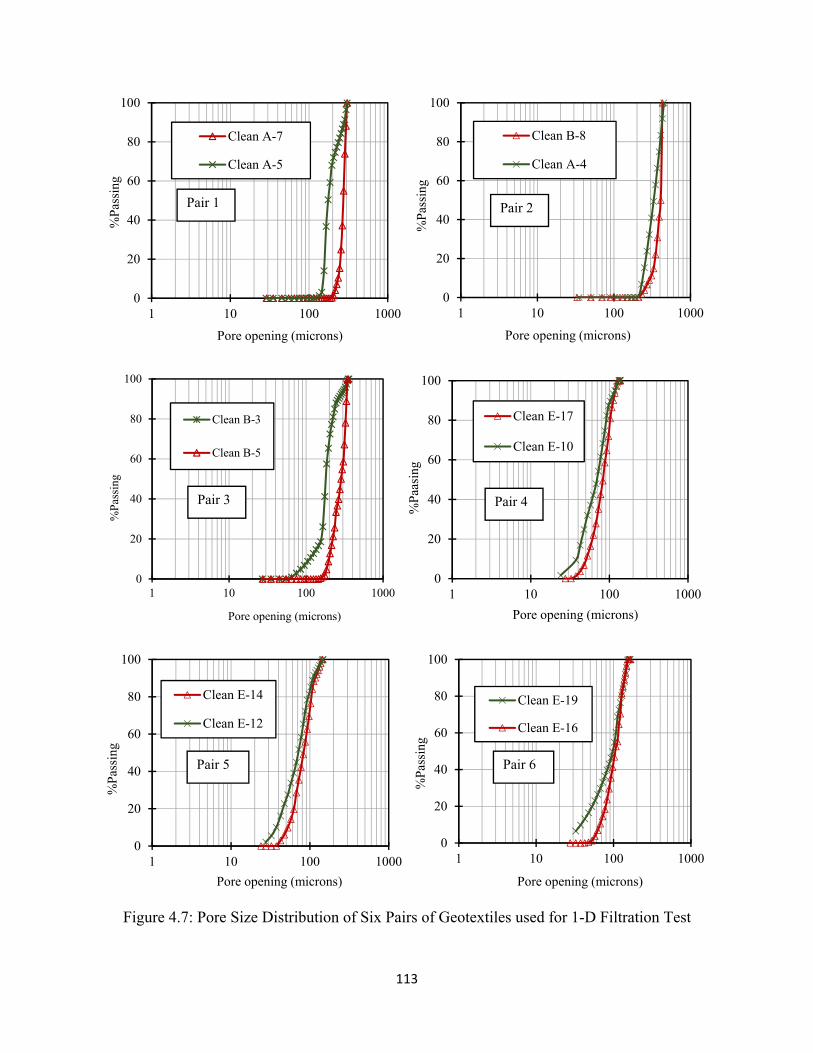
113
Figure 4.7: Pore Size Distribution of Six Pairs of Geotextiles used for 1-D Filtration Test
0
20
40
60
80
100
1 10 100 1000
%P
assi
ng
Pore opening (microns)
Clean A-7
Clean A-5
Pair 1
0
20
40
60
80
100
1 10 100 1000
%P
assi
ng
Pore opening (microns)
Clean B-8
Clean A-4
Pair 2
0
20
40
60
80
100
1 10 100 1000
%P
assi
ng
Pore opening (microns)
Clean B-3
Clean B-5
Pair 3
0
20
40
60
80
100
1 10 100 1000
%P
aasi
ng
Pore opening (microns)
Clean E-17
Clean E-10
Pair 4
0
20
40
60
80
100
1 10 100 1000
%P
assi
ng
Pore opening (microns)
Clean E-14
Clean E-12
Pair 5
0
20
40
60
80
100
1 10 100 1000
%P
assi
ng
Pore opening (microns)
Clean E-19
Clean E-16
Pair 6
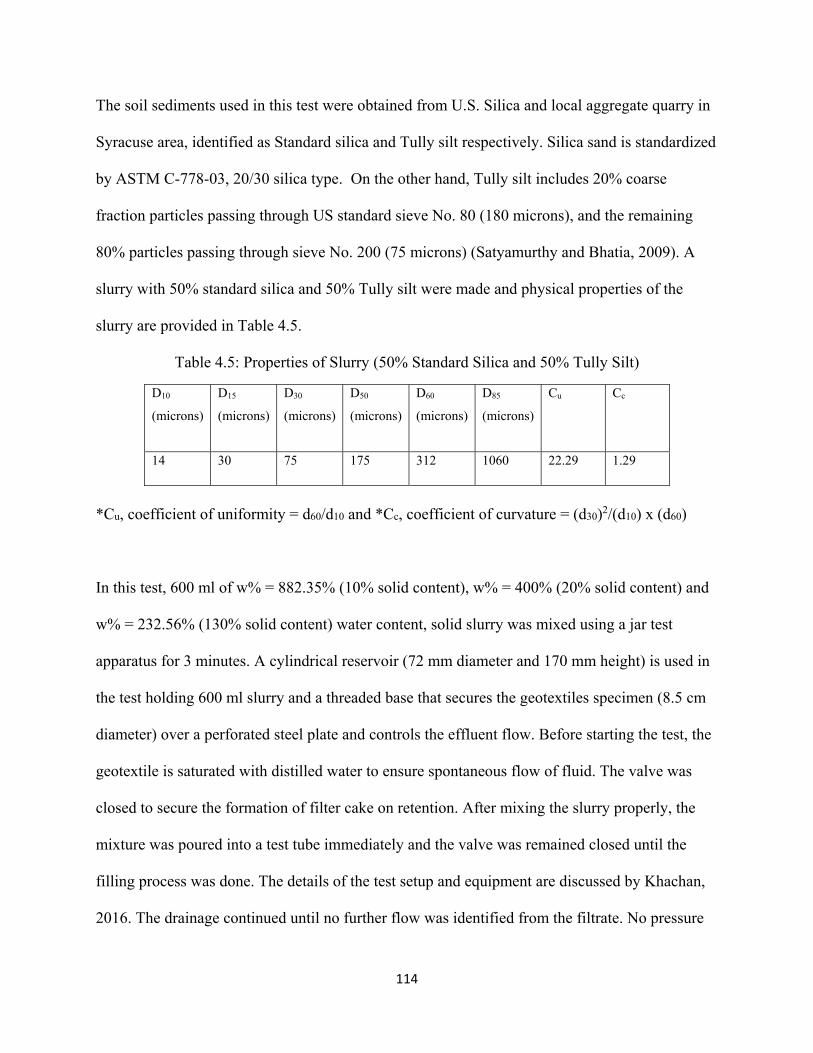
114
The soil sediments used in this test were obtained from U.S. Silica and local aggregate quarry in
Syracuse area, identified as Standard silica and Tully silt respectively. Silica sand is standardized
by ASTM C-778-03, 20/30 silica type. On the other hand, Tully silt includes 20% coarse
fraction particles passing through US standard sieve No. 80 (180 microns), and the remaining
80% particles passing through sieve No. 200 (75 microns) (Satyamurthy and Bhatia, 2009). A
slurry with 50% standard silica and 50% Tully silt were made and physical properties of the
slurry are provided in Table 4.5.
Table 4.5: Properties of Slurry (50% Standard Silica and 50% Tully Silt)
D10
(microns)
D15
(microns)
D30
(microns)
D50
(microns)
D60
(microns)
D85
(microns)
Cu Cc
14 30 75 175 312 1060 22.29 1.29
*Cu, coefficient of uniformity = d60/d10 and *Cc, coefficient of curvature = (d30)2/(d10) x (d60)
In this test, 600 ml of w% = 882.35% (10% solid content), w% = 400% (20% solid content) and
w% = 232.56% (130% solid content) water content, solid slurry was mixed using a jar test
apparatus for 3 minutes. A cylindrical reservoir (72 mm diameter and 170 mm height) is used in
the test holding 600 ml slurry and a threaded base that secures the geotextiles specimen (8.5 cm
diameter) over a perforated steel plate and controls the effluent flow. Before starting the test, the
geotextile is saturated with distilled water to ensure spontaneous flow of fluid. The valve was
closed to secure the formation of filter cake on retention. After mixing the slurry properly, the
mixture was poured into a test tube immediately and the valve was remained closed until the
filling process was done. The details of the test setup and equipment are discussed by Khachan,
2016. The drainage continued until no further flow was identified from the filtrate. No pressure
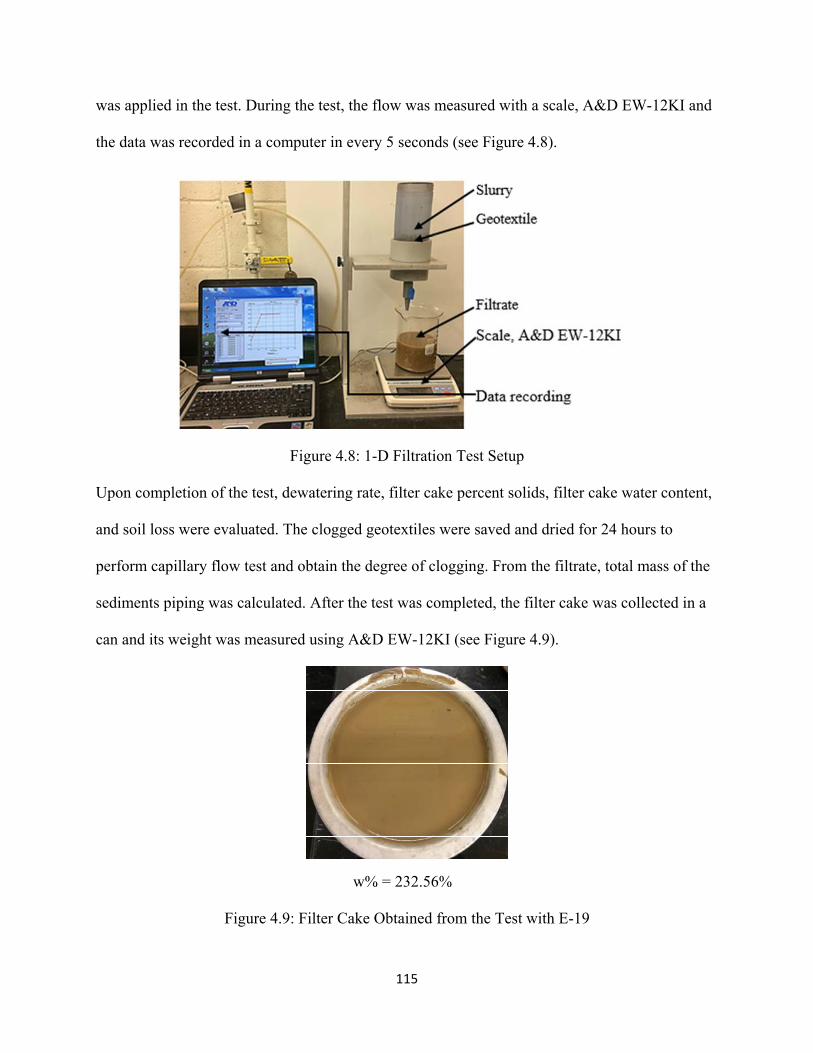
115
was applied in the test. During the test, the flow was measured with a scale, A&D EW-12KI and
the data was recorded in a computer in every 5 seconds (see Figure 4.8).
Figure 4.8: 1-D Filtration Test Setup
Upon completion of the test, dewatering rate, filter cake percent solids, filter cake water content,
and soil loss were evaluated. The clogged geotextiles were saved and dried for 24 hours to
perform capillary flow test and obtain the degree of clogging. From the filtrate, total mass of the
sediments piping was calculated. After the test was completed, the filter cake was collected in a
can and its weight was measured using A&D EW-12KI (see Figure 4.9).
w% = 232.56%
Figure 4.9: Filter Cake Obtained from the Test with E-19

116
The percentage of soil loss is defined as the ratio of dry weight of soil passing through geotextile
and initial total weight of dry soil in the 600-ml slurry, expressed in percentage.
% Soil loss =
∗ 100 4.3
Along with the % soil loss, from the falling-head test, piping rate and degree of clogging were
calculated in this study.
Piping rate =
g/m2 4.4
Degree of clogging =
4.5
The results of the 1-D filtration tests for water content of 882.35%, 400% and 232.56% are
provided in Table 4.6.
Table 4.6: 1-D Filtration (Falling-Head Test) Test Results
w% = 882.35% (10% Solid content)
Geotextiles % Soil loss Piping rate (g/m2) Water content in filter cake (%)
Trial 1 Trial 2 Trial 1 Trial 2 Trial 1 Trial 2
A-5 22.21 22.64 2661.26 2714.13 27.06 26.58 A-7 26.76 16.94 3207.61 2030.31 29.21 33.11
A-4 18.39 22.87 2204.79 2740.57 33.73 37.31 B-8 21.1 18.7 2528.73 2241.09 32.5 26.75
B-3 24.17 20 2897.43 2396.89 30.67 31.42 B-5 21.76 23.82 2608.39 2855.13 29.85 26.47
E-10 14.4 16.77 1722.59 2013.751 29.59 31.89 E-17 11.89 12.28 1424.95 1472.47 23.96 26.48
E-12 11.9 13.95 1479.25 1619.093 33.15 36.30 E-14 19.25 21.04 2400 2429.045 32.91 38.08
E-16 7.04 8.84 878 1025.42 36.69 37.38 E-19 8.99 9.21 1077.00 1104.88 41.01 41.55

117
w% = 400% (20% Solid content)
Geotextiles % Soil loss Piping rate (g/m2) Water content in filter cake (%)
Trial 1 Trial 2 Trial 1 Trial 2 Trial 1 Trial 2
A-5 28.93 24.4 7648.92 6450.47 29.16 27.86 A-7 27.27 24.62 7208.32 6510.39 35.32 29.74
A-4 25.3 25.06 6697.22 6626.72 33.87 31.3 B-8 18.2 20.04 4811.42 5297.85 29.78 29.42
B-3 25.26 25.86 6679.59 6838.21 26.68 28.94 B-5 21.7 19.6 5736.69 5181.53 31.34 30.67
E-10 11.2 13.36 2960.87 3531.9 28.66 29.46 E-17 15.95 16.39 4216.6 4334.687 28.85 30.43
E-12 10.65 12.49 3005.19 3113.95 25.56 26.67 E-14 13.13 15.29 3699 815.98 28.69 31.62
E-16 14.9 16.96 3939.02 4485.37 29.4 31.78 E-19 11.89 12.95 5406.45 5890.69 25.95 26.78
w% = 232.56% (30% Solid content)
Geotextiles % Soil loss Piping rate (g/m2) Water content in filter cake (%)
Trial 1 Trial 2 Trial 1 Trial 2 Trial 1 Trial 2
A-5 22.79 19.08 10364.822 8679.94 26.76 26.15 A-7 27.31 23.24 12421.57 10571.02 21.15 27.42
A-4 25.08 24.18 11404.6 10998.71 29.5 27.36 B-8 16.71 17.1 7598.13 7775.47 25.64 29.5
B-3 21 23.11 9552.34 10509.34 24.31 28.05 B-5 24.45 23.48 11120.9 10680.3 27.94 27.51
E-10 14.92 16.46 6784.21 7487.9 25.59 26.88 E-17 8.55 11.24 3887.73 2971.44 25.45 27.01
E-12 20.26 23.93 9879.38 10215.79 27.5 30.37 E-14 14.25 17.14 6967.55 7308.09 24.66 27.27
E-16 8.50 11.11 3864.99 5052.88 24.64 26.76 E-19 11.89 12.95 5406.45 5890.69 25.95 26.76
Three different retention criteria have been developed for woven geotextiles and sand-silty
slurries. In these, O95, O90 and O85 are compared with D85, D90 and D50 of the sediments. In
Figure 4.10, ratio of O98/d85 are plotted against piping rate for three different water content
slurries.

118
Figure 4.10: 1-D Filtration Test Piping Rate Results Against O98/d85 for the Soil-Geotextile
Systems
The highest piping occurred for a 232.56% water content (30% solid content) and the piping rate
for 882.35% water content (10% solid content) was the least for both woven and non-woven
geotextiles. The woven geotextiles selected for the tests showed a broad range of pore sizes,
whereas, non-woven geotextiles had a narrow range of O98. Woven geotextiles showed higher
piping rate than non-woven geotextiles for all three water content slurries. It was found that for
all three water content slurries, piping increases for the value of O98/d85 = 0 - 0.3, and after that
range piping remains stable. For a range of O98/d85 = 0 – 0.3, piping increases up to 3000 g/m2,
0
2000
4000
6000
8000
10000
12000
14000
0 0.2 0.4 0.6
Pip
ing
(g/m
2 )
O98/d85
woven (w% = 882.35%)
non-woven (w% = 882.35%)
0
2000
4000
6000
8000
10000
12000
14000
0 0.1 0.2 0.3 0.4 0.5
Pip
ing
(g/m
2 )
O98/d85
woven (w% = 400%)
non-woven (w% = 400%)
0
2000
4000
6000
8000
10000
12000
14000
0 0.1 0.2 0.3 0.4 0.5
Pip
ing
(g/m
2 )
O98/d85
woven (w% = 232.56%)
non-woven (w% = 232.56%)

119
7000 g/m2 and 11,000 g/m2 in terms of 882.35%, 400% and 232.56% water content respectively.
Moo-Young and Tucker (2002) suggested an allowable limit of piping rate of 2500 g/m2 in their
study. However, in this study, the highest piping reported for woven and non-woven geotextiles
with 232.56% water content, are almost 12,500 g/m2 and 11,000 g/m2. With the increase in pore
sizes, not a significant change in piping was noticed in Figure 4.10. Table 4.7 shows the
applicability of the existing retention and clogging criteria observed in the current study.
Table 4.7: Applicability of the Existing Criteria
Geotextiles Existing criteria
Moo-
Young and
Tucker
(2002):
Retention -
O95/D85<1
Moo-Young
and Tucker
(2002):
Retention -
O95<0.3
mm or
O90/D90=2-
5
Aydilek
(2006):
Retention -
O85/D50<1
for all POA
Aydilek
(2006):
Clogging:
O40/D15
>1 for POA
<8
O40/D30>1
for POA >8
Muthukumaran
and
Ilmaparuthi
(2006):
40<AOS/D15
<125
Muthukumaran
and
Ilmaparuthi
(2006):
AOS<0.425
mm
Muthukumaran
and
Ilmaparuthi
(2006):
0.3<AOS
(D85/D15)
<1.7
A-5 OK OK Not OK OK OK OK Not OK
A-7 OK OK Not OK OK OK OK Not OK
A-4 OK OK Not OK OK OK Not OK Not OK
B-8 OK OK Not OK OK OK Not OK Not OK
B-3 OK OK Not OK OK OK OK Not OK
B-5 OK OK Not OK OK OK OK Not OK
E-10 OK OK OK Not OK OK OK Not OK
E-17 OK OK OK Not OK OK OK Not OK
E-12 OK OK OK Not OK OK OK Not OK
E-14 OK OK OK OK OK OK Not OK
E-16 OK OK OK OK OK OK Not OK
E-19 OK OK OK OK OK OK Not OK

120
In Table 4.7, it was found that most of the existing criteria were satisfied for geotextile-slurry
performance in the current study. However, the performance depends on the water content of
slurry, which is not mentioned by any existing study. In addition, the allowable piping rate is not
mentioned as well, therefore, these criteria cannot be considered as complete.
After 1-D filtration tests were completed, the clogged geotextiles (see Figure 4.11) were saved
and Capillary flow tests were performed to evaluate the clogging. The degree of clogging is
expressed in terms of impregnation level (λ), which is calculated as a ratio of mass of soil
particles in the geotextile voids and the mass of geotextile fibers (Palmeira et al. 1996). Upon the
completion of 1-D filtration test, the filter cake was carefully removed from the geotextile and
the cylindrical reservoir. To attain the degree of clogging, the wet and clogged geotextiles were
collected carefully and weighted with a scale, A&D EW-12KI. Clogged geotextiles were allowed
to dry for 24 hours at room temperature before taking the dry weight. Care was taken not to
disturb the soil particles sticking on the surface of the geotextile.
w% = 232.56%
Figure 4.11: Clogged and Wet Non-Woven Geotextiles (E-19) after 1-D Filtration Test
The impregnation level or clogging level of geotextiles was calculated using the following
equation.

121
λ = 4.6
Where,
λ = impregnation level of geotextile
Ms = Mass of soil particles in the geotextile voids, gm
Mf = Mass of geotextile fibers, gm
Table 4.8: Impregnation Level of Clogged Geotextiles Obtained from the Test
Nonwoven Ms (gm) Mf (gm) λ (Ms/Mf) Woven Ms (gm) Mf (gm) λ (Ms/Mf)
E-10 2.2 - 3.51 1.45 1.52 - 2.42 A-4 0.95 – 2.18 1.59 0.60 – 1.37
E-12 1.56 - 5.33 1.76 0.89 - 3.03 A-5 0.74 – 0.84 1.66 0.45 – 0.51
E-14 1.65 - 5.65 2.04 0.81 - 2.77 A-7 0.36 – 0.5 1.74 0.21 – 0.29
E-16 1.38 - 4.97 2.16 0.64 - 2.30 B-3 0.13 – 0.64 1.66 0.08 – 0.39
E-17 1.2 - 6.52 2.62 0.48 - 2.49 B-6 1.07 – 4.34 2.06 0.52 – 2.11
E-19 2.68 - 7.34 2.35 1.14 - 3.12 B-8 2.62 – 3.49 2.28 1.15 – 1.53
Results given in Table 4.8, it can be observed that the range of λ for non-woven geotextiles is
higher (0.48 – 3.12) than the range (0.21 – 2.11) for woven geotextiles, which means more soil
particles got trapped in the pores of non-woven geotextiles rather than woven geotextiles.
Figure 4.12: Relationship of Clogging to O95/d85 and O50/d50
0
0.5
1
1.5
2
2.5
0 0.1 0.2 0.3 0.4 0.5
Deg
ree
of c
logg
ing,
λ
O98/d85
Woven geotextiles
Non-woven geotextiles
0
0.5
1
1.5
2
2.5
0 1 2 3
Deg
ree
of c
logg
ing,
λ
O50/d50
Woven geotextiles
Non-woven geotextiles
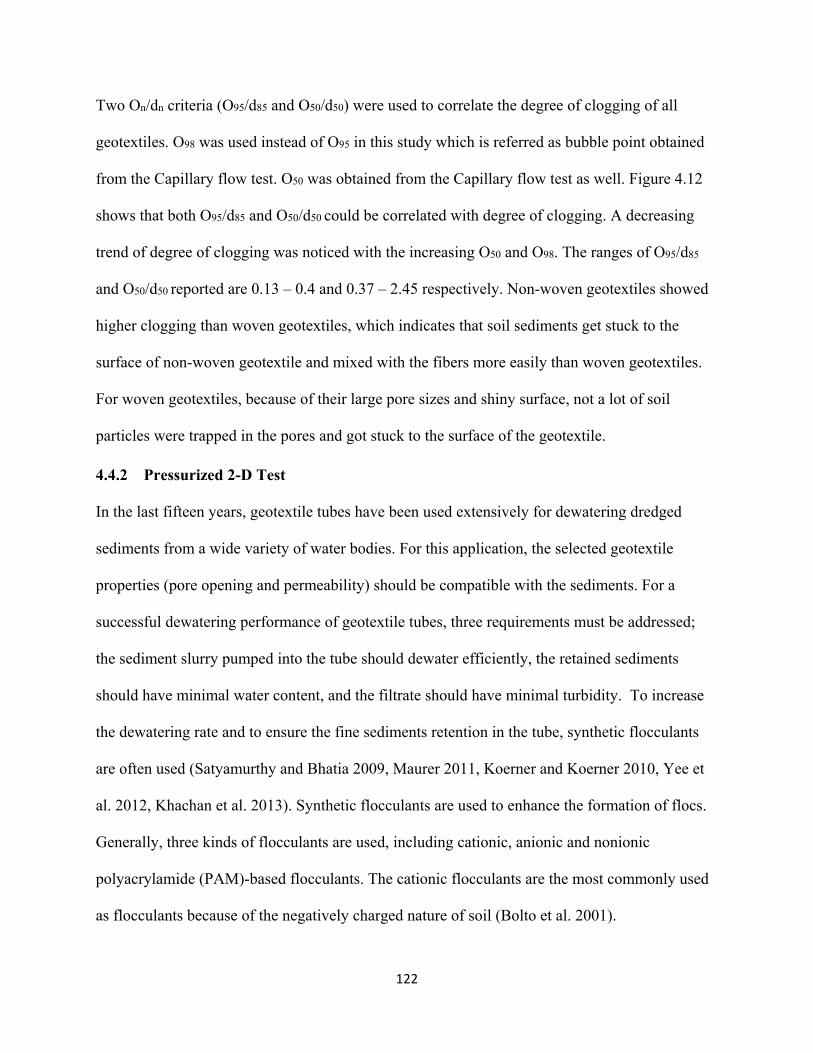
122
Two On/dn criteria (O95/d85 and O50/d50) were used to correlate the degree of clogging of all
geotextiles. O98 was used instead of O95 in this study which is referred as bubble point obtained
from the Capillary flow test. O50 was obtained from the Capillary flow test as well. Figure 4.12
shows that both O95/d85 and O50/d50 could be correlated with degree of clogging. A decreasing
trend of degree of clogging was noticed with the increasing O50 and O98. The ranges of O95/d85
and O50/d50 reported are 0.13 – 0.4 and 0.37 – 2.45 respectively. Non-woven geotextiles showed
higher clogging than woven geotextiles, which indicates that soil sediments get stuck to the
surface of non-woven geotextile and mixed with the fibers more easily than woven geotextiles.
For woven geotextiles, because of their large pore sizes and shiny surface, not a lot of soil
particles were trapped in the pores and got stuck to the surface of the geotextile.
4.4.2 Pressurized 2-D Test
In the last fifteen years, geotextile tubes have been used extensively for dewatering dredged
sediments from a wide variety of water bodies. For this application, the selected geotextile
properties (pore opening and permeability) should be compatible with the sediments. For a
successful dewatering performance of geotextile tubes, three requirements must be addressed;
the sediment slurry pumped into the tube should dewater efficiently, the retained sediments
should have minimal water content, and the filtrate should have minimal turbidity. To increase
the dewatering rate and to ensure the fine sediments retention in the tube, synthetic flocculants
are often used (Satyamurthy and Bhatia 2009, Maurer 2011, Koerner and Koerner 2010, Yee et
al. 2012, Khachan et al. 2013). Synthetic flocculants are used to enhance the formation of flocs.
Generally, three kinds of flocculants are used, including cationic, anionic and nonionic
polyacrylamide (PAM)-based flocculants. The cationic flocculants are the most commonly used
as flocculants because of the negatively charged nature of soil (Bolto et al. 2001).

123
To evaluate the role of pore size distribution and permeability of the geotextiles on dewatering,
pressurized 2-D tests were carried out. For this study, ten different geotextiles were tested with
900% water content slurry of Tully sand. Tully sand was obtained from the Clark Aggregate Co.,
a quarry located in Tully, New York. The properties and classification of the sediments are given
in Table 4.9. The slurry was combined with two different types of polymers obtained from
Watersolve LLC, an anionic polymer (Solve-426) used for coagulation and a cationic polymer
(Solve-9330) used for flocculation. The jar tests were conducted to obtain the optimum dose of
polymers. The optimum polymer dose used in the test for Tully sand slurry of water content
900%, were Coagulant (Solve-426) – 40 ppm and Flocculant (Solve-9330) – 30 ppm
(Ratnayesuraj (2017)).
Table 4.9: Properties of Tully Sand Used in the Test, Ratnayesuraj (2017)
D10
(mm)
D30
(mm)
D60
(mm)
Cu Liquid
limit, LL
Plastic
limit, PL
Plasticity
index, PI (%)
USCS
classification
0.0025 0.025 0.28 112 26 14 12 SP-SC
*Cu, coefficient of uniformity = d60/d10
The woven geotextiles selected are more open geotextiles with large pore sizes (O98), the geo-
composites are tight geotextiles and non-woven geotextiles ranged in their pore size distribution.
(see Figure 4.13). The physical properties of these geotextiles are provided in Table 4.10.
Thickness and permittivity of geotextiles were obtained from the manufacturers, and
permeability was calculated by multiplying permittivity and thickness. The permeability of the
selected geotextiles ranged between 0.385 – 4.86 mm/sec.

124
Figure 4.13: Pore Size Distribution of Geotextiles used in the P2DT
Table 4.10: Physical Properties of Geotextiles Used in the Pressurized 2-D Test
Geotextiles Manufacturing process Thickness*
(mm)
Bubble point,
O98 (microns)
Permittivity*
(sec-1)
Permeability
(mm/sec)
B-6 Slit film woven 1.04 265 – 331 0.37 0.385
C-2 Multifilament woven 1.76 421 – 630 0.35 0.616
GC-2 Geo-composite 2.23 88 – 122.5 0.39 0.869
GC-1 Geo-composite 2.84 – 3.37** 125 – 146 0.45 1.28 – 1.52
E-4 Needle punched non-woven 1.7 255 – 415 1.6 2.72
E-7 Needle punched non-woven 2.3 206 – 315 1.26 2.898
NW-2 Needle punched non-woven 0.69 – 0.99** 170.5 – 285 2.94 2.02 – 2.91
NW-1 Needle punched non-woven 1.88 – 2.52** 145 – 206 1.93 3.62 – 4.86
E-3 Needle punched non-woven 1.3 78 – 142.5 0.61 0.793
E-21 Needle punched non-woven 5.8 88 – 102.5 0.27 1.566
* Provided by the Manufacturers, ** Conducted at Syracuse University
0
20
40
60
80
100
1 10 100 1000
%P
assi
ng
Pore opening (microns)
B-6
C-2
GC-2
GC-1
NW-1
NW-2
E-3
E-4
E-7
E-21
B-6 (Slit-film
woven geotextile)
GC-2 (Geo-composite)
GC-1 (Geo-composite)
Needle punched
non-woven geotextiles
C-2 (multifilament
woven geotextile)

125
A cylindrical frame with an internal diameter of 15 cm and an internal height of 30 cm was used
in the test (see Figure 4.14). In 2-D test, two pieces of geotextiles, a 20-cm diameter geotextile
used at the bottom of the equipment for axial flow and a 58-cm by-36 cm geotextile bolted inside
the cylindrical frame, were used. To secure the bottom geotextile, a perforated steel plate was
used under it. Before starting the test, the geotextiles were saturated properly with tap water to
ensure a continuous flow during the test. For the test, 3599 ml of 900% water content slurry was
mixed with 30 ml Solve-426 and 22.5 ml Solve-9330 properly and poured into the system and
the valve was remained closed until the filling process was done. A high capacity (400 liters)
balloon (Party Magic USA, L36-56729-3) was used to pressurize the slurry and promote the
dewatering rate using 10kPa pressure. The further details of the experimental setup and test
equipment can be found in Ratnayesuraj (2017). The dewatering was allowed to continue until
no further axial or radial flow was measured. The axial and radial flows were measured using
A&D EW-12KI and A&D FG-200KAL respectively, and flow ratio (a ratio of radial flow and
axial flow) was measured for all geotextiles.
Figure 4.14:Pressurized 2-D Test Setup (Ratnayesuraj (2017))
Axial flow
Radial flow

126
Figure 4.16 (a and b) shows the results of Pressurized 2-D test as a plot of effluent volume (L)
against dewatering time (minute) for all geotextiles. It was found that within 60 seconds most of
the dewatering was completed for all geotextiles. As soon as the test started, a high radial flow
was noticed for all woven, non-woven geotextiles and geo-composites. It was found that the
radial flow was higher than the axial flow for all geotextiles. For GC-1 (geo-composite) and
NW-1 (needle punched non-woven geotextile), the radial flow was higher than axial flow at the
beginning of the test, however, after 1 – 1.5 minutes, the axial flow became slightly higher than
the radial flow. Because after 1 minute of the test, a thin radial filter cake was formed along with
a thick filter cake on the bottom geotextile, which reduced the permeability of geotextile and
resisted the radial flow. For woven geotextiles, the radial flow rate within a minute was 2.6 – 2.7
liters, however, the axial flow rate was very low (0.2 – 0.25 L). No filter cake was formed on the
radial surface of woven geotextiles, which led to a high radial flow, whereas, a filter cake was
formed immediately on the bottom geotextile, which as a result decreased the axial flow. For
geo-composites, filter cake was formed on the radial surface and bottom geotextile, which made
the radial flow 1 – 1.3 L lower than woven geotextiles. Like geo-composites, for non-woven
geotextiles, a thin radial filter cake was formed on the surface and a thick one on the bottom
geotextile (see Figure 4.15). In the Pressurized 2-D test, since flocculated slurry was used for the
test, the amount of soil piping and turbidity were very low (100 – 200 g/m2 soil piping and 20 –
95 NTU turbidity). Most of the soil retained in the tube as a filter cake. Therefore, instead of soil
piping flow rate is the issue in P2DT. To evaluate the flow rate of all geotextiles, flow ratio
(radial flow/axial flow) was calculated and given in Table 4.11.

127
Figure 4.15: Filter Cake Formed for GC-1 (Ratnayesuraj (2017))

128
(a) (b)
Figure 4.16: Pressurized 2-D Test Results of Geotextiles (a) Woven Geotextiles and Geo-composites (b) Non-Woven Geotextiles
0
0.5
1
1.5
2
2.5
3
0 0.5 1 1.5 2 2.5 3 3.5
Eff
luen
t vol
ume
(L)
Dewatering time (min)
B-6_Radial (slit-film woven)
B-6_Axial (slit-filmwoven)
C-2_Radial(multifilamentwoven)
C-2_Axial(multifilamentwoven)
GC-1_Radial (geo-composite)
GC-1_Axial (geo-composite)
GC-2_Radial (geo-composite)
GC-2_Axial (geo-composite)
B-6
GC-2
GC-1
GC-1
GC-2
B-6
C-2
0
0.5
1
1.5
2
2.5
3
0 0.5 1 1.5 2 2.5 3 3.5
Eff
luen
t vol
ume
(L)
Dewatering time (min)
NW-1_Radial
NW-1_Axial
NW-2_Radial
NW-2_Axial
E-3_radial
E-3_axial
E-4_Radial
E-4_Axial
E-7_Radial
E-7_Axial
E-21_Radial
E-21_Axial
Non-woven geotextiles
E-4
NW-2
E-7
E-3
E-21
NW-1 radial
NW-1 axial
C-2

129
No correlation was obtained between flow (radial or axial) and pore sizes of the geotextiles.
Upon completion of the test, the filter cakes formed on the surface and bottom geotextile were
removed very carefully. The wet and clogged geotextile was saved and evaluated for degree of
clogging. Since, flocs were used in the test, soil retention was not an issue in the P2D test and it
was found that the degree of clogging is very low. Flow ratio was calculated for all geotextiles
and plotted against a hydraulic property, permeability of geotextiles (see Figure 4.17).
Table 4.11: Pressurized 2-D Test Results (Ratnayesuraj (2017))
Geotextile Manufacturing process Permeability
(mm/sec)
Flow ratio
(Radial/axial)
B-6 Slit film woven 0.666* 6.10
C-2 Multifilament woven 0.595* 7.00
GC-2 Geo-composite 0.869* 2.50
GC-1 Geo-composite 1.28 – 1.52** 0.80
NW-1 Needle punched non- 5.24* 0.83
NW-2 Needle punched non- 3.62* 2.31
E-3 Needle punched non- 1.2* 3.35
E-4 Needle punched non- 2.72* 3.95
E-7 Needle punched non- 2.898* 3.18
E-21 Needle punched non- 1.7* 1.2
* Provided by the Manufacturers, ** Conducted at Syracuse University

130
Figure 4.17: Flow ratio vs. Permeability
In Figure 4.17, a decreasing trend of flow ratio with the increasing permeability could be
observed. The permeability used in the Figure 4.17 are the permeability of clean geotextiles.
After the test, filter cake reduced the permeability. However, no radial filter cake was formed on
the smooth surface of woven geotextiles, which resulted in the high radial flow. It was found that
for woven geotextile with the smallest permeability, the flow ratio was higher than other
geotextiles. For geo-composites and non-woven geotextiles, a thin radial filter cake was formed
with time which decreased the permeability of geotextile and radial flow, and a thick filter cake
was formed on the bottom geotextile. Therefore, the flow ratio of non-woven geotextiles is much
lower than woven geotextiles, even with high permeability. In terms of non-woven geotextiles,
some trend was found between flow ratio and permeability. Flow ratio decreased with the
increasing permeability for non-woven geotextiles. However, the range of permeability is very
narrow to draw any conclusion.
0
1
2
3
4
5
6
7
8
0 1 2 3 4 5 6 7 8
Flo
w R
atio
(R
adia
l/ A
xial
)
Permeability, mm/s
B-6 C-2
GC-2 GC-1
NW-1 NW-2
E-3 E-4
E-7 E-21
Woven geotextiles
Geo-composites

131
4.5 Summary:
Twenty woven, twenty-nine non-woven geotextiles, and two geo-composites were used
to develop a correlation factor between capillary flow test and dry sieving test. For all
types of geotextiles, an increasing trend of AOS was found with the increasing BBP
values. A better correlation was found for woven and non-woven geotextiles together
rather than a correlation interpreted separately. Almost 78% AOS values could be
predicted from the bubble point values in the correlation. Bhatia and Smith (1996) and
TENCATE (2014) found that the measured bubble point, O98 obtained by the capillary
flow test is consistently smaller than the AOS (O95) obtained by the dry sieving test.
However, Aydilek, et al., 2006 could not find any consistent relationship between
capillary flow and dry sieving test. The results obtained from the previous studies were
plotted as AOS vs. BBP, however, no strong correlation was noticed from the plot.
Giroud (1996) equation was used to calculate the filtration pore opening of needle
punched non-woven geotextiles and compared with the measured pore sizes obtained
from the Capillary flow test. The theoretical values were found to be under-predictive
compared to the Capillary flow test results.
Performance test: 1-D filtration test (falling-head test) and Pressurized 2-D tests were
performed to evaluate the influence of smaller to larger pores on the performance of soil
retention and dewatering of geotextiles. It was found that in 1-D filtration test, soil piping
rate of both woven and non-woven geotextiles increased with the decreasing water
content (increasing solid content). Capillary flow test was performed with the clogged
geotextiles preserved from the 1-D test. It was found that the degree of clogging
decreases with the increasing pore sizes.

132
In pressurized 2-D test, no significant filter cake was formed on the surface of woven
geotextiles. Therefore, the radial flow was much higher than other geotextiles. For non-
woven geotextiles and geo-composites, filter cake was formed on the surface and bottom
geotextiles, which resulted into lower radial and axial flow rate. From the figure plotted
for flow ratio against permeability, it was found that flow ratio decreases with the
increasing permeability of geotextiles.
4.6 References:
ASTM D6767-16 Standard Test Method for Pore Size Characteristics of Geotextiles by
Capillary Flow Test, ASTM International, West Conshohocken, PA, 2014.
ASTM D4751-16 Standard Test Methods for Determining Apparent Opening Size of a
Geotextile, ASTM International, West Conshohocken, PA, 2016.
ASTMF316, “Standard Test Method for Pore Size Characteristics of Membrane Filters by
Bubble Point and Mean Flow Pore Test”, American Society for Testing and Materials,
West Conshohocken, Pennsylvania, USA.
Aydilek, A.H. and Edil, T.B., (2002). Filtration performance of woven geotextiles with
wastewater treatment sludge, Geosynthetics International, 9(1):41-69.
Aydilek, A.H. and Edil, T.B. (2003). Long-term filtration performance of nonwoven
geotextile-sludge systems, Geosynthetics International, 10(4):110-123.
Aydilek, A. H., & Edil, T. B. (2003). Evaluation of woven geotextile pore structure
parameters using image analysis. (2003): 1-12.
Aydilek, A. H. (2006). A semi-analytical methodology for development of woven
geotextile filter selection criteria. Geosynthetics International, 13(2), 59-72.

133
Aydilek, Ahmet H., and Tuncer B. Edil. "Remediation of high water content geomaterials:
a review of geotextile filter performance." First Panamerican Conference on Geosynthetics,
GeoAmericas. 2008. (902-910)
Baker, K. B., J. P.Chastain, and R. B. Dodd. (2002). Treatment of lagoon sludge and liquid
animal manure utilizing geotextile filtration, ASABE Paper No. 024128, St. Joseph, MI.
Barrington, S. F., El Moueddeb, K., Jazestani, J. & Dussault, M. (1998). The clogging of
nonwoven geotextiles with cattle manure slurries. Geosynthetics International, 5, No. 3,
309–325.
Bhatia, S. K., & Smith, J. L. (1996). Geotextile characterization and pore-size distribution:
Part II. A review of test methods and results. Geosynthetics International, 3(2), 155-180.
Bhatia, S. K., & Smith, J. L. (1994). Comparative study of bubble point method and
mercury intrusion porosimetry techniques for characterizing the pore-size distribution of
geotextiles. Geotextiles and Geomembranes, 13(10), 679-702.
Blond, Eric; Vermeersch, O. G.; and Diederich, Romain (2015). A Comprehensive
Analysis of the Measurement Techniques used to Determine Geotextile Opening Size:
AOS, FOS, O90, and ‘Bubble Point’. Geosynthetics 2015, February 15-18, Portland,
Oregon.
Bolto, B., Dixon, D., Eldridge, R., and King, S. (2001). Cationic polymer and clay or metal
oxide combinations for natural organic matter removal. Water Research, 35(11): 2669-
2676.
Christopher, B.R. and Holtz, R.D., 1985, “Geotextile Engineering Manual”, U.S.
Department of Transportation, Federal Highway Administration, Washington, DC, USA,
Report No. FHWA-TS-86/203, March 1985, 1044.

134
CR., Ratnayesuraj. (2017). Analytical Modelling, Testing and Comparison of 1-D, 2-D and
3-D Dewatering Process. MS Thesis. Syracuse University, NY, USA.
Elton, D. J., Hayes, D. W., & Adanur, S. (2006). Bubble point testing of geotextiles:
apparatus and operation. 1-8.
Fischer, G. R., Christopher, B. R., & Holtz, R. D. (1990, May). Filter criteria based on pore
size distribution. In Proceedings of the Fourth International Conference on Geotextiles
(Vol. 1, 289-294). The Hague The Netherlands.
Fowler, J., Duke, M., Schmidt, M. L., Crabtree, B., Bagby, R. M. & Trainer, E. (2002).
Dewatering sewage sludge and hazardous sludge with geotextile tubes. Proceedings of the
7th International Conference on Geosynthetics, Delmas, Gourc and Girard, Editors, Swets
& Zeitlinger, Lisse, 1007 – 1012.
Giroud, J.P., 1982, “Filter Criteria for Geotextiles”, Proceedings of the Second
International Conference on Geotextiles, IFAI, Vol. 1, Las Vegas, Nevada, USA, August
1982, 103-108.
Giroud, J. P. (2010, May). Development of criteria for geotextile and granular filters. In
Proceedings of the 9th International Conference on Geosynthetics, Guaruja, Brazil (Vol.
2327, 4564).
Henry, K. S., Walsh, M. R. & Morin, S. H. (1999). Selection of silt fence to retain
suspended toxic particles. Geotextiles and Geomembranes, 17, No. 5–6, 371–387.
Holtz, R. D., Christopher, B. R. & Berg, R. R. (1997). Geosynthetic Engineering, BiTech
Publishers, Richmond, BC, Canada, 29–68.
https://en.wikipedia.org/wiki/Polypropylene

135
Huang, C. C., & Luo, S. Y. (2007). Dewatering of reservoir sediment slurry using woven
geotextiles. Part I: Experimental results. Geosynthetics International, 14(5), 253-263.
Khachan, M. M., Bhatia, S. K. & Smith, J. L. (2012). Retention performance of woven
geotextiles subjected to cyclic-flow conditions. Geosynthetics International, 19, No. 3,
200–211.
Khachan, M. M., Bhatia, S. K., Bader, R. A., Cetin, D. & Ramarao, B. V. (2014). Cationic
starch flocculants as an alternative to synthetic polymers in geotextile tube dewatering.
Geosynthetics International, 21, No. 2, 119–136.
Khachan, M. M. (2016). Sustainable and innovative approaches for geotextile tube
dewatering technology. PhD Dissertation. Syracuse University, NY, USA.
Koerner, R.M., and Koerner, G.R. (2010). Performance tests for the selection of fabrics
and additives when used as geotextile bags, containers, and tubes, Geotechnical Testing
Journal, 33(3):1-7.
Kiffle, Z. B., Bhatia, S. K., Khachan, M. M., & Jackson, E. K. (2014). Effect of pore size
distribution on sediment retention and passing. In 10th International Conference on
Geosynthetics, ICG 2014 Deutsche Gesellschaft fur Geotechnik e. V., 2014.
Kutay, M. E., & Aydilek, A. H. (2004). Retention performance of geotextile containers
confining geomaterials. Geosynthetics International, 11(2), 100-113.
LaFleur, J., Mlynarek, J., Rollin, A.L., 1989. Filtration of broadly graded cohesionless
soils. Journal of Geotechnical Engineering 115 (12), 1747–1768.
Lawson, C. R. (2008). Geotextile containment for hydraulic and environmental
engineering. Geosynthetics International, 15(6), 384-427.

136
Liao, K., & Bhatia, S. K. (2005). Geotextile tube: filtration performance of woven
geotextiles under pressure. Proceedings of NAGS, 1-15.
Liao, K., & Bhatia, S. K. (2005). Geotextile tube: filtration performance of woven
geotextiles under pressure. Proceedings of NAGS, 1-15.
Lombard, G. and Rollin, A., 1987, “Filtration Behavior Analysis of Thin Heat Bonded
Geotextiles”, Proceedings of Geosynthetics ’87, IFAI,Vol. 2,NewOrleans, Louisiana,
USA, February 1987, 482-492.
Maurer, B.W. (2011) Flocculation and Filtration in the Geotextile Tube Environment.
Department of Civil and Environmental Engineering, MS Thesis. Syracuse University,
Syracuse, NY, USA.
Montero, C.M. and Overmann, L.K. (1990). Geotextile filtration performance test,
Geosynthetic Testing for Waste Containment Applications, ASTM STP 1081:273-284.
Moo-Young, H. K., Gaffney, D. A. &Mo, X. (2002). Testing procedures to assess the
viability of dewatering with geotextile tubes. Geotextiles and Geomembranes, 20, No. 5,
289–303.
Moraci, N., Mandaglio, M.C., and Salmi, M. (2016). Long term behavior of woven and
nonwoven geotextile filters. GeoAmericas 2016, vol. 1, 740-749.
Mori, H., Miki, H., & Tsuneoka, N. (2002). The geo-tube method for dioxin-contaminated
soil. Geotextiles and Geomembranes, 20(5), 281-288.
Muthukumaran, A. E., & Ilamparuthi, K. (2006). Laboratory studies on geotextile filters
as used in geotextile tube dewatering. Geotextiles and Geomembranes, 24(4), 210-219.
Palmeira, E. M., Fannin, R. J., & Vaid, Y. P. (1996). A study on the behavior of soil
geotextile systems in filtration tests. Canadian Geotechnical Journal, 33(4), 899-912.

137
Palmeira, E. M., & Gardoni, M. G. (2000). The influence of partial clogging and pressure
on the behaviour of geotextiles in drainage systems. Geosynthetics International, 7(4-6),
403-431.
Palmeira, E. M., & Trejos Galvis, H. L. (2016). Opening sizes and filtration behaviour of
nonwoven geotextiles under confined and partial clogging conditions. Geosynthetics
International, 1-14.
Pilarczyk, K. W. (2000). Geosynthetics and Geosystems in Hydraulic and Coastal
Engineering, A.A. Balkema, Rotterdam, Netherlands.
Rankilor, P.R., 1981, “Membranes in Ground Engineering”, John Wiley, Chichester,
United Kingdom, 377.
Satyamurthy, R., & Bhatia, S. K. (2009). Effect of polymer conditioning on dewatering
characteristics of fine sediment slurry using geotextiles. Geosynthetics International, 16(2),
83-96.
Schiereck, G. J. (2003). Introduction to Bed, Bank and Shore Protection, Spon Press, New
York, NY, USA, pp. 135–140.
Smith, J.L. (1996). The pore size distribution of geotextiles. MS Thesis. Syracuse
University, Syracuse, NY, USA.
Yee, T.W., Lawson, C.R., Wang, Z.Y., Ding, L., and Liu, Y. (2012). Geotextile tube
dewatering of contaminated sediments, Tianjin Eco-City, China, Geotextiles and
Geomembranes, 31:39-50.
Yee, T.W., Lawson, C.R., (2012). Modelling of Geotextile Tube Dewatering Process,
Geosynthetics International, 19(5), 339-353.

138
Chapter 5 Conclusion
5.1 Major Conclusion
Geotextile filters have been generally used to prevent soil erosion and provide maximum safety
to a structure without the threat of leakage. Basically, two types of filters are used widely in
geotechnical engineering, including granular filters composed of gravel or sand and filters
composed of woven and non-woven geotextiles. For the last two decades, geotextiles have been
extensively used for filtration performance. The rapidly growing geotextile industries have led to
a diversity in the manufacturing process and characteristics of geotextiles. Filtration performance
of a geotextile predominantly depends on the pore structure of a geotextile, permeability, soil
retention criteria and clogging parameters. A properly designed geotextile filter is required to be
free from clogging and to ensure the retention of filtered materials. The ability of a geotextile
filter to fulfill these requirements basically depends on the pore sizes of a geotextile. In the USA,
two standard methods of measuring the largest pore size of a geotextile have been accepted
including dry sieving test (ASTM D4751) and capillary flow test (ASTM D676). Despite of the
several drawbacks of dry sieving test including trapping of glass beads with the geotextiles and
electrostatic effects, many filtration criteria are designed depending on the apparent opening size
(AOS, O95) of a geotextile obtained by the dry sieving test. On the contrary, the capillary flow
test provides a complete pore size distribution along with the largest pore size (bubble point, O98)
of a geotextile. Regardless of providing both larger and finer pore sizes (O95, O90, O50 and O15)
that impact the existing geotextile retention criteria, this test is not widely accepted yet due to the
variation in devices and liquids used in the test. Therefore, a study was carried out at Syracuse
University to analyze the evolution of capillary flow test following ASTM D6767.
139
The objectives of this study were: 1) performing calibration of the Geo Pore Pro (GPP-1001A)
with several materials of known sizes; 2) comparing the capillary flow test devices used by
others with different ASTM standards and limitations; 3) comparing the results obtained by the
capillary flow test with dry sieving test results; 4) establishing correlations between bubble point,
O98 and AOS, O95 for woven and non-woven geotextiles. Evaluating the role of pore size
distribution in the performance of geotextiles using 1-D filtration test and Pressurized 2-D test.
For this study, more than 700 capillary flow tests were performed using Geo Pore Pro (GPP-
1001A) manufactured by Porous Materials, Inc., for woven, non-woven, and composite (a
combination of woven and non-woven geotextile) geotextiles. ASTM D 6767 was followed in
this study. Mineral oil with a surface tension of 31.69 dynes/cm was used as a wetting liquid in
the test. Comparisons were made between the capillary flow test device used in the current study
and the devices used by others. Four thin metallic plates with uniform circular and cylindrical
holes and two membranes with irregular holes were used to calibrate the Geo Pore Pro (GPP-
1001A). The dynamic contact angle was tested for a thin metallic plate with mineral oil and it
was found that the receding contact angle is zero degrees. Cleaning of the calibration materials
and the testing equipment with Methanol significantly altered the results, which was not
mentioned in the ASTM D 6767. It was found that the results (O100) measured from the
calibration test were larger than the actual pore sizes obtained by the manufacturers and the
Scanning Electron Microscope. The calibration results obtained in the current study were
compared with the results obtained by Przybylo (2007) and a similar trend in larger test results
was found. However, ASTM D 6767 was not followed in the test performed by Przybylo (2007).
Twenty woven geotextiles (7 monofilament, 11 slit film and 2 multifilament woven geotextiles),
twenty-nine non-woven geotextiles (21 needle punched non-woven and 8 heat bonded non-
140
woven geotextiles), and two geo-composites were used in the capillary flow test to measure the
pore size distribution. Nine to ten tests were performed with individual specimens to achieve a
range of consistent bubble point, O98. O50 and O10 were also measured from the pore size
distribution along with O98. It was found that the systematic error in the test and deviation in the
pressure transducer influenced the test results crucially. Box plot and whisker diagrams were
used in the study to find out the maximum and minimum outliers for all geotextiles. It was found
that 2 monofilament, 2 slit film and 1 multifilament woven geotextiles, and 9 needle punched
non-woven geotextiles provided outliers in the box plot and whisker diagram.
The smaller and larger pore sizes (O10, O50, and O98) were plotted as a function of mass per unit
area for woven and non-woven geotextiles. It was found that for both needle punched and heat
bonded non-woven geotextiles, pore sizes (O10, O50, and O98) decrease with the increasing mass
per unit area. However, no such trend was found for woven geotextiles. The previous analysis
conducted by Bhatia (1996), Vermeersch et al. (1996), Aydilek (2006), Elton et al (2007), and
Przybylo (2007) were investigated as well and it was found that the bubble points of non-woven
geotextiles decrease with the increasing mass per unit area, which validates the current study.
A correlation factor was established for all woven and non-woven geotextiles between the
capillary flow test and the dry sieving test. The dry sieving test results were obtained from the
manufacturers for most of the geotextiles and those geotextiles without available results were
tested using the dry sieving test method. For all types of geotextiles, an increasing trend of AOS
was found with the increasing BBP values. A better correlation with a straight-line equation: y =
1.04x and R2 = 0.78, was found for woven and non-woven geotextiles together rather than a
correlation interpreted separately. Almost 78% AOS values could be predicted from the bubble
point values in the correlation. However, beyond a limit of AOS and bubble point values, the

141
correlation is not valid for any geotextile with smaller pore sizes. The straight-line equation, y =
1.04x, obtained from the correlation for all geotextiles provides comparable AOS values
corresponding to the bubble point values. However, theoretically, some woven and non-woven
geotextiles provided much higher AOS values compared to bubble point values. Bhatia and
Smith (1996) and TENCATE (2014) found that the measured bubble point, O98 obtained by the
capillary flow test is consistently smaller than the AOS (O95) obtained by the dry sieving test.
However, Aydilek, et al., 2006 could not find any consistent relationship between capillary flow
and dry sieving tests. The results obtained from the previous studies were plotted as AOS vs.
BBP, however the plot revealed no strong correlation.
To evaluate the role of pore size distribution in the performance test of geotextiles, 1-D filtration
test (falling-head test) and pressurized 2-D tests were conducted and the influence of pore sizes
on the performance of soil retention and dewatering of geotextiles were investigated. 6 pairs of
geotextiles (3 pairs of woven and 3 pairs of non-woven geotextiles) were used to perform 1-D
filtration test using 3 different water content (882.35%, 400% and 232.56%) and it was found
that piping rate of both woven and non-woven geotextiles increases with the decreasing water
content. After the filtration test, the partially clogged geotextiles were evaluated to measure the
degree of clogging. It was found that the level of impregnation (degree of clogging) was higher
than woven geotextiles, which means more soil particles were trapped in the non-woven
geotextiles. In the pressurized 2-D test, 2 woven, 2 geo-composites, and 6 non-woven geotextiles
were used. Tully sand combined with two different types of polymers were used in the test as a
slurry. 10 kPa pressure was applied to promote the dewatering rate. It was found that no
significant filter cake was formed on the surface of woven geotextiles. Therefore, the radial flow
was much higher than with other geotextiles. For non-woven geotextiles and geo-composites, a

142
filter cake formed on the surface and bottom geotextiles, which resulted into lower radial and
axial flow rates. From the figure plotted for flow ratio against permeability, it was found that
flow ratio decreases with the increasing permeability of geotextiles.
5.2 Future Work
The device used in the capillary flow test is not a standard device. The pressure transducer
attached inside the equipment fluctuates very frequently, which may not affect the results of
largest pore sizes, however, it may affect the smaller pore sizes. Therefore, the pressure
transducer should be stable throughout the test. Before doing the test, the operator should
acknowledge the particularities of the equipment as well.
Cleaning of calibration materials play an important role in the results that should be mentioned in
the ASTM standard. The standard liquid, mineral oil, provided larger pore sizes of the calibration
materials than manufacturers and SEM pore sizes, however, the dynamic contact angle was
reported as zero degrees. Therefore, the role of wetting liquid should be examined properly
before doing any test.
Only two multifilament woven geotextiles and two geo-composites were used in the capillary
flow test. Therefore, no correlation was developed for them separately between bubble point and
AOS results. More multifilament woven and composite geotextiles should be included in the
study in future to evaluate the pore size distribution.

143
APPENDIX A
Capillary Flow Test – Pore Size Distribution
0
20
40
60
80
100
1 10 100 1000 10000
%P
assi
ng
Pore opening (microns)
Bubble point, O98 = 490 -1100 micronsSurface tension = 31.69 dynes/cmShape factor = 0.715
0
20
40
60
80
100
1 10 100 1000
%P
assi
ng
Pore diameter (microns)
Bubble point, O98 = 301 - 545 micronsSurface tension = 31.76 micronsShape factor = 0.75
A-2
0
20
40
60
80
100
1 10 100 1000
%P
assi
ng
Pore diameter (microns)
Bubble point, O98 = 221 - 305 micronsSurface tension = 31.76 dynes/cmShape factor = 0.75
A-3
0
20
40
60
80
100
1 10 100 1000
%P
assi
ng
Pore diameter (microns)
Bubble point, O98 = 285 - 340 micronsSurface tension = 31.76 dynes/cmShape factor = 0.75
A-5
A-1

144
0
20
40
60
80
100
1 10 100 1000
%P
assi
ng
Pore diameter (microns)
Bubble point, O98 = 232 - 332 micronsSurface tension = 31.76 dynes/cmShape factor = 0.715
A-6
0
20
40
60
80
100
1 10 100 1000
%P
assi
ng
Pore diameter (microns)
Bubble point, O98 = 250 -400 micronsSurface tension = 31.69 dynes/cmShape factor= 0.715
B-1
0
20
40
60
80
100
1 10 100 1000
%P
assi
ng
Pore diameter (microns)
Bubble point, O98 = 315 - 411 micronsSurface tension = 31.69Shape factor = 0.715
B-3B-3
0
20
40
60
80
100
1 10 100 1000
%P
assi
ng
Pore diameter (microns)
Bubble point, O98 = 350 - 430 micronsSurface tension = 31.69 dynes/cmshape factor= 0.715
B-4

145
0
20
40
60
80
100
1 10 100 1000
%P
assi
ng
Pore diameter (microns)
Bubble point, O98 = 305 - 400 micronsSurface tension = 31.69 dynes/cmShape factor = 0.715
B-5
0
20
40
60
80
100
1 10 100 1000
%P
assi
ng
Pore diameter (microns)
Bubble point, O98 = 265 - 331 micronsSurface tension = 31.69 dynes/cmShape factor = 0.715
B-6
0
20
40
60
80
100
1 10 100 1000
%P
assi
ng
Pore diameter (microns)
Bubble point, O98 = 340 - 500 micronsSurface tension = 31.69 dynes/cmShape factor = 0.715
B-7
0
20
40
60
80
100
1 10 100 1000
%P
assi
ng
Pore diameter (micorns)
Bubble point, O98 = 375 - 480 micronsSurface tension = 31.69 dynes/cmShape factor =0.715
B-8

146
0
20
40
60
80
100
1 10 100 1000
%P
assi
ng
Pore diameter (microns)
Bubble point, O98 = 282 - 370 micronsSurface tension = 31.69 dynes/cmShape factor = 0.715
B-9
0
20
40
60
80
100
1 10 100 1000
%P
assi
ng
Pore diameter (microns)
Bubble point, O98 = 325 - 382 micronssurface tension = 31.76 dynes/cm
B-10
0
20
40
60
80
100
1 10 100 1000
%P
assi
ng
Pore diameter (microns)
Bubble point, O98 = 201 - 301 micronsSurface tension = 31.69 dynes/cm
B-11
0
20
40
60
80
100
1 10 100 1000
%P
assi
ng
Pore diameter (microns)
Bubble point, O98 = 190-340 micronsSurface tension = 31.69 dynes/cmShape factor= 0.715
C-1

147
0
20
40
60
80
100
1 10 100 1000
%P
assi
ng
Pore opening (microns)
Bubble point, O98 = 245 - 405 micronsSurface tension = 31.69 dynes/cmShape factor = 0.715
D-1
0
20
40
60
80
100
1 10 100 1000
%P
assi
ng
Pore opening (microns)
Bubble point, O98 = 176 -235 micronsSurface tension = 31.69 dynes/cmShape factor = 0.715
D-2
0
20
40
60
80
100
1 10 100 1000
%P
assi
ng
Pore opening (microns)
Bubble point, O98 = 225 - 361 micronsSurface tension = 31.69 dynes/cmShape factor = 0.715
D-4
0
20
40
60
80
100
1 10 100 1000
%P
assi
ng
Pore opening (microns)
Bubble point, O98 = 262 -450 micronsSurface tension = 31.69 dynes/cmShape factor = 0.715
D-5
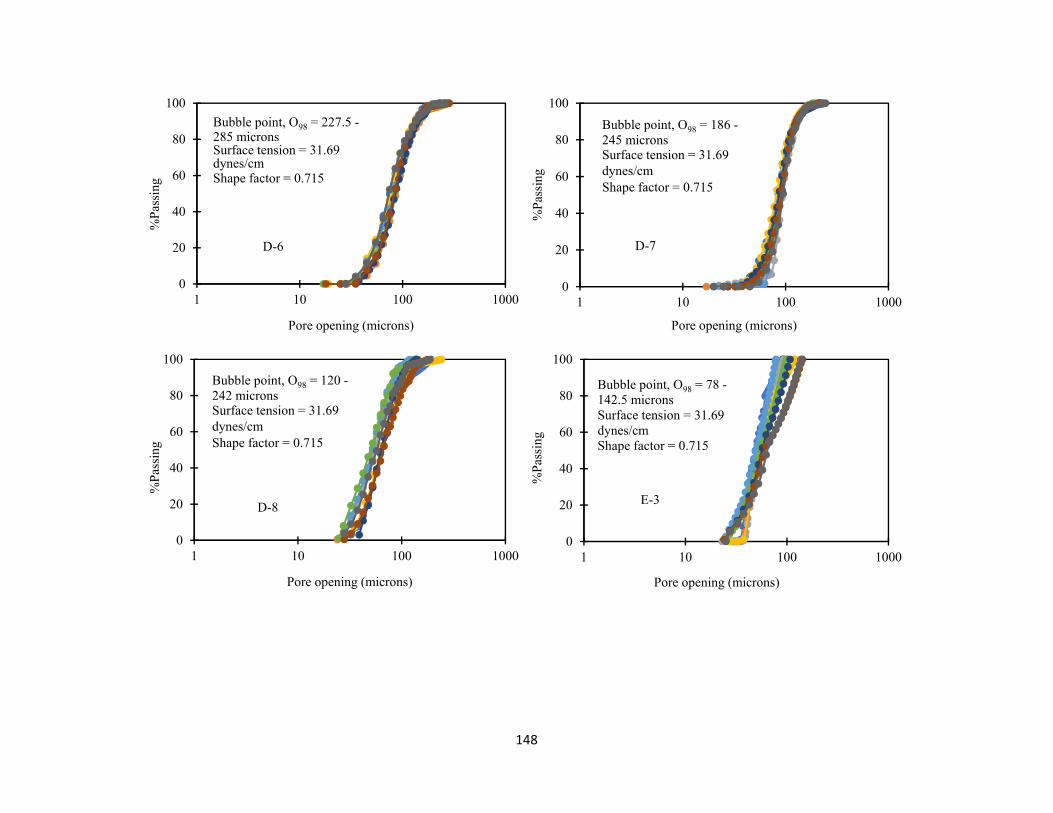
148
0
20
40
60
80
100
1 10 100 1000
%P
assi
ng
Pore opening (microns)
Bubble point, O98 = 227.5 -285 micronsSurface tension = 31.69 dynes/cmShape factor = 0.715
D-6
0
20
40
60
80
100
1 10 100 1000
%P
assi
ng
Pore opening (microns)
Bubble point, O98 = 186 -245 micronsSurface tension = 31.69 dynes/cmShape factor = 0.715
D-7
0
20
40
60
80
100
1 10 100 1000
%P
assi
ng
Pore opening (microns)
Bubble point, O98 = 120 -242 micronsSurface tension = 31.69 dynes/cmShape factor = 0.715
D-8
0
20
40
60
80
100
1 10 100 1000
%P
assi
ng
Pore opening (microns)
Bubble point, O98 = 78 -142.5 micronsSurface tension = 31.69 dynes/cmShape factor = 0.715
E-3

149
0
20
40
60
80
100
1 10 100 1000
%P
assi
ng
Pore opening (microns)
Bubble point, O98 = 255 - 415 micronsSurface tension = 31.69 dynes/cmShape factor = 0.715
E-4
0
20
40
60
80
100
1 10 100 1000
%P
assi
ng
Pore opening (microns)
Bubble point, O98 = 162.5 -222.5 micronsSurface tension = 31.69 dynes/cmShape factor = 0.715
E-6
0
20
40
60
80
100
1 10 100 1000
%P
assi
ng
Pore opening (microns)
Bubble point, O98 = 206 -315 micronsSurface tension = 31.69 dynes/cmShape factor = 0.715
E-7
0
20
40
60
80
100
1 10 100 1000
%P
assi
ng
Pore opening (microns)
Bubble point, O98 = 75 -415 micronsSurface tension = 31.69 dynes/cmShape factor = 0.715
E-8

150
0
20
40
60
80
100
1 10 100 1000
%P
assi
ng
Pore opening (microns)
Bubble point, O98 = 165 - 255 micronsSurface tension = 31.69 dynes/cmShape factro = 0.715
E-9
0
20
40
60
80
100
1 10 100 1000
%P
assi
ng
Pore opening (microns)
Bubble point, O98 = 115- 160 micronsSurface tension = 31.69 dynes/cmShape factor = 0.715
E-11E-11
0
20
40
60
80
100
1 10 100 1000
%P
assi
ng
Pore opening (microns)
Bubble point, O98 = 122.5 - 170 micornsSurface tension = 31.69 dynes/cmShape factor = 0.715
E-12
0
20
40
60
80
100
1 10 100 1000
%P
assi
ng
Pore opening (microns)
Bubble point, O98 = 137.5 -157.5 micronsSurface tension = 31.69 dynes/cmShape factor = 0.715
E-13

151
0
20
40
60
80
100
1 10 100 1000
%P
assi
ng
Pore opening (microns)
Bubble point, O98 = 132.5 -157.5 micronsSurface tension = 31.69 dynes/cmShape factor = 0.715
E-14
0
20
40
60
80
100
1 10 100 1000
%P
assi
ng
Pore opening (microns)
Bubble point, O98 = 112.5 - 167.5 micronsSurface tension = 31.69 dynes/cmShape factor = 0.715
E-15
0
20
40
60
80
100
1 10 100 1000
%P
assi
ng
Pore opening (microns)
Bubble point, O98 = 121 -205 micronsSurface tension = 31.69 dynes/cmShape factor = 0.715
E-16
0
20
40
60
80
100
1 10 100 1000
%P
assi
ng
Pore opening (microns)
Bubble point, O98 = 122.5 -170.5 micronsSurface tension = 31.69 dynes/cmShape factor = 0.715
E-17
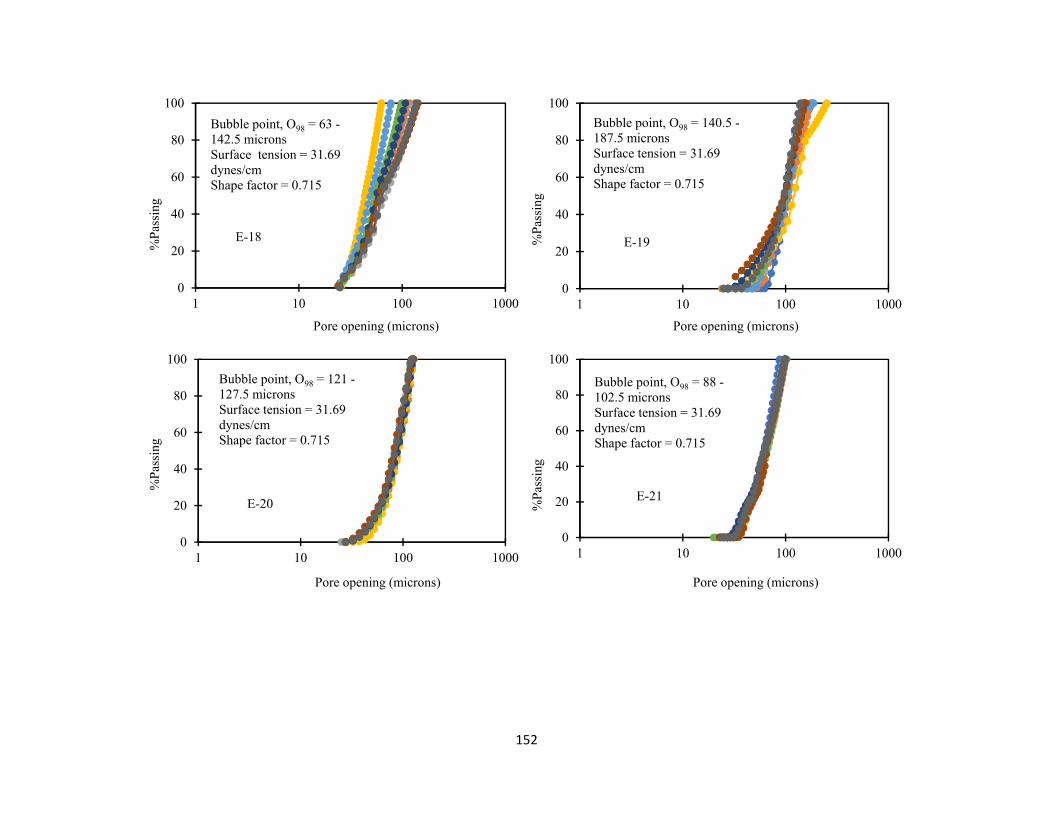
152
0
20
40
60
80
100
1 10 100 1000
%P
assi
ng
Pore opening (microns)
Bubble point, O98 = 63 -142.5 micronsSurface tension = 31.69 dynes/cmShape factor = 0.715
E-18
0
20
40
60
80
100
1 10 100 1000
%P
assi
ng
Pore opening (microns)
Bubble point, O98 = 140.5 -187.5 micronsSurface tension = 31.69dynes/cmShape factor = 0.715
E-19
0
20
40
60
80
100
1 10 100 1000
%P
assi
ng
Pore opening (microns)
Bubble point, O98 = 121 -127.5 micronsSurface tension = 31.69 dynes/cmShape factor = 0.715
E-20
0
20
40
60
80
100
1 10 100 1000%
Pas
sing
Pore opening (microns)
Bubble point, O98 = 88 -102.5 micronsSurface tension = 31.69 dynes/cmShape factor = 0.715
E-21

153
0
20
40
60
80
100
1 10 100 1000
%P
assi
ng
Pore opening (microns)
Bubble point, O98 = 125 - 146 micronsSurface tension = 31.69 dynes/cmShape factor= 0.715
F-1

154
Vita
Name of Author: Nuzhath Fatema
Place of Birth: Bangladesh
Date of Birth: March 1, 1989
Graduate and Undergraduate Schools Attended:
Bangladesh University of Engineering and Technology (BUET), Bangladesh
Syracuse University, Syracuse, New York
Degrees Awarded:
Bachelor of Science, Civil Engineering, 2013, BUET
Master of Science, Civil Engineering, 2017, Syracuse University
Professional Experience:
Research Assistant, Department of Civil and Environmental Engineering, Syracuse
University, Spring 2016, Summer 2016, Summer 2017
Teaching Assistant, Department of Civil and Environmental Engineering, Syracuse
University, Fall 2016, Fall and Spring 2017.


