
Hochschild Mining plc
Analyst teach-in 18 June 2008

DisclaimerSome statements contained in this presentation or in documents referred to in it are or may be forward-looking statements. Actual results may differ from those expressed in such statements, depending on a variety of factors.Past performance of the Company or its shares cannot be relied on as a guide to future performance.Any forward-looking information contained in this presentation has been prepared on the basis of a number of assumptions which may prove to be incorrect, and accordingly, actual results may vary.This presentation does not constitute, or form part of or contain any invitation or offer to any person to underwrite, subscribe for, otherwise acquire, or dispose of any shares in Hochschild Mining plc or advise persons to do so in any jurisdiction, nor shall it, or any part of it, form the basis of or be relied on in any connection with or act as an inducement to enter into any contract or commitment therefore. No reliance may be placed for any purpose whatsoever on the information or opinions contained in this document or on its completeness and no liability whatsoever is accepted for any loss howsoever arising from any use of this document or its contents otherwise in connection therewith. Nothing in this presentation is to be construed as a profit or production forecast. This presentation has been prepared in compliance with English law and English courts will have exclusive jurisdiction over any disputes arising from or connected with this presentation.
1

2
Welcome & introduction

Welcome & introduction
PURPOSE: to generate greater understanding of assets and
their geology to assist forecasting at mine level & to update
on current market conditions
3

Today’s agendaCompany overview
Calculating reserves & resources
Understanding the geology
Financial & political situation
4

Leading precious metals producer
5
Diversified asset base
Growth story
Underground mining and regional expertise
Proven track record in reserve replacement
Hochschild: Almost 100 years in Latin America
Strong financial performance & low cash costs
A responsible operator
Experienced management team

Achieving our goals
6
Lake Shore Gold Corp. C$144 million total investment for 35% ownership
Q1 production in-line with forecast
Consolidated San Felipe ownership — 100% for $52 million
Appointment of Miguel Aramburú as CEO
2008
Achieved production target of 26 moz Ag eq
Completed expansion at Arcata, Ares and Selene
Commenced production at San José, Moris and Pallancata
Increased reserve life
100% hedge free
Declared and paid dividend
2007

Operating in the Americas
7
x
PERUArcata (100%)Ares (100%)Selene (100%)Pallancata (60%) ARGENTINA
San José (51%)
x
x
MEXICOMoris (70%)San Felipe (100%)
CANADALake Shore Gold Corp. (35%)
x

4th largest primary silver producer…
12
13
14
15
16
16
16
17
17
19
34
39
48
No. Company 2007 production (moz Ag) % of global¹
3 Fresnillo plc
2 KGHM Polska Miedz
1 BHP Billiton
7 Volcan
4 Kazakhmys
5 Pan American Silver
6 Goldcorp
8 Buenaventura
9 Polymetal
10 Grupo Mexico
11 Hochschild Mining
12 Rio Tinto
13 Coeur d’Alene
7%
6%
6%
3%
3%
3%
2%
2%
2%
2%
2%
2%
2%12
14
16
17
34
Hochschild
Coeur
Polymetal
Pan American
Primary silver producers
Source: JPMorgan Cazenove/GFMS; Hochschild Mining considered a primary silver producer with approximately 60% of revenue derived from silver¹ Assumes 2007 global production of 670.6 million ounces Excludes production relating to Silver Wheaton purchases, includes attributable production from Luismin, Marlin and La Coipa Includes equity production Minera Yanacocha
Fresnillo
8

…and a mid-sized producer of gold
Source: GFMS, Company filings Assumes 2007 global production of 670.6 million ounces
445
297
285
249
242
231
201
183
182
159
155
Randgold
Peter Hambro
Teck Cominco
Fresnillo
Polymetal
Agnico Eagle
Hochschild Mining
Oceana
BHP
Aruizon
St Barbara
Select companies 2007 production (koz Au) % of global
Randgold
Teck Cominco
Polymetal
Hochschild Mining
Oceana
BHP Billiton
0.6%
0.4%
0.3%
0.3%
0.3%
0.2%
0.2%
Agnico Eagle
Peter Hambro
0.2%
Aurizon
Equigold
0.3%
0.2%
Fresnillo
0.4%
9

Our strategy for growth
1 Maximize the potential of our existing operations through exploration and expansion
Bring into production new, profitable precious metal projects throughout the Americas
2
LONG TERM PROFITABLE GROWTH
10

Delivering on our strategy
11
Expanding existing operations:
San José (+100%)
Arcata (+30%)
Selene-Pallancata (+50%)
1
Q3 2008
Q3 2008
Q4 2008
New projects:
San Felipe feasibility
Lake Shore production
2
Q4 2008
2009
San Felipe production Q4 2010
Exploration, joint ventures, acquisitions

12
Eduardo HochschildExecutive Chairman
Roberto DañinoDeputy Chairman & Executive
Director
Miguel AramburúChief Executive Officer
Jorge BenavidesSenior Vice President
Corporate Development
Ignacio RosadoChief Financial Officer
Javier DurandLegal Counsel
Ignacio BustamanteChief Operating Officer
José Augusto PalmaSenior Adviser, Executive
Committee
Isac BursteinBusiness Development Manager
Raymond Jannas Vice President Exploration &
Geology
Highly experienced management team

Experienced, independent Board
Committed to transparency and good corporate governance
Ongoing evaluation of the Board to ensure it meets the needs of the business as it evolves as a UK listed company
Effective board structure
Combined Code requirement HOC
Chairman and Chief Executive separate roles
½ Board Independent/Non-Exec Directors
Regular re-election of all board directors
Formal & rigorous annual evaluation
13
Eduardo Hochschild, Executive Chairman
Roberto Dañino, Deputy Chairman and Executive Director
Alberto Beeck, Non-Executive Director
Sir Malcolm Field, Non-Executive Director
Jorge Born Jr., Non-Executive Director
Nigel Moore, Non-Executive Director
Dionisio Romero, Non-Executive Director

14
Calculating reserves & resources

Reserves & resources overview We report reserves semi-annually following the JORC Code
IMC conducts a full audit of reserves and resources annually based on the JORC Code
Cut off policy:
Marginal cost to produce a tonne of ore
Parameters used:
Long term analyst consensus prices
31 December 2007 R&R assumed $600/oz Au & $10.50/oz Ag
Grade is capped according to statistics for each individual deposit
Reserves have an accuracy of 10 – 20%
Inferred resources have an accuracy of 40%
15
Narrow vein mine versus other ore body types
16
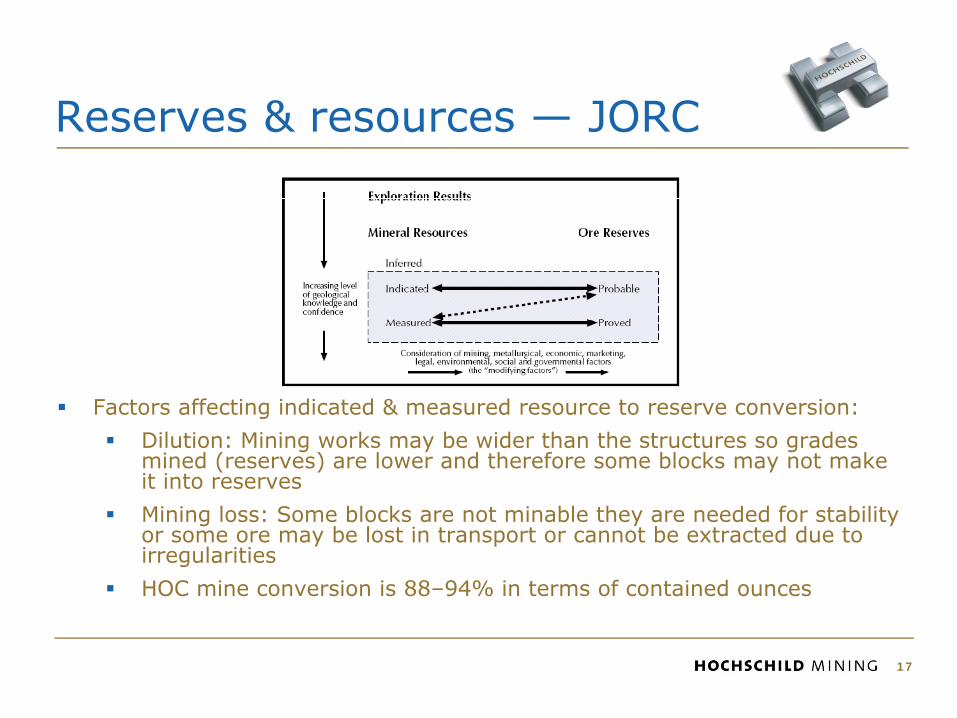
Reserves & resources — JORC
Factors affecting indicated & measured resource to reserve conversion:
Dilution: Mining works may be wider than the structures so grades mined (reserves) are lower and therefore some blocks may not make it into reserves
Mining loss: Some blocks are not minable they are needed for stabilityor some ore may be lost in transport or cannot be extracted due toirregularities
HOC mine conversion is 88–94% in terms of contained ounces
17

Underground mine life benchmarking
Mine Life (Resources < 50 M TM)
0
50
100
150
200
Min
e L
ife (
yrs
)
Resource LifeReserve Life
142 UG mines listed (<50 M TM) in the western hemisphere in all ore types126 mines with < 20 yrs LOM based on reservesAverage LOM (reserves): 5.5 yrsAverage LOM (reserves + resources): 9.2 yrs
18
Source: Mineral Economics Group Database

19
LOM examples in other companies
Mine Company Start date 2000 2001 2002 2003 2004 2005 2006 2007
Quiruvilca Pan American 1922 5.5 4.8 4.2 1.4 2.8 4.2 4.1 4.0
Orcopampa Buenaventura 1967 1.3 1.3 1.8 2.7 2.5 2.5 2.5 2.8
Lucky Friday Hecla Mining Co 1942 5.2 5.0 7.5 4.3 4.6 6.0 4.1 4.1
Fresnillo Fresnillo plc 1976 8.3 6.7 6.9 9.0 8.0 5.7 5.2 11.5
Average 5.1 4.5 5.1 4.3 4.5 4.6 4.0 5.6
Source: Cazenove equity research until 2005 company filings thereafter

20
Increasing reserve & resource base GOAL: 4 years reserves + 4 years resources
Attributable resources (moz Ag eq.)1
Jun-06 Dec-06 Jun-07 Dec-07
Attributable reserves (moz Ag eq.)1
Jun-06 Dec-06 Jun-07 Dec-07
Arcata
Ares
Selene
Pallancata
San José
Moris
2007 life of mine2
2.5
3.8
2.3
10.0
10.2
13.0
7.8
2.8
5.1
16.1
2.42.8
LOM (reserves)
LOM (reserves + resources)
1 Includes 35% of Lake Shore Gold Corp’s reserves and resources2 LOM = reserves / yearly plant capacity. Both as of 31 December 20073 Based on 2,000 tpd and subject to completion of feasibility study
San Felipe33.9
12.015.4
Lake shore
-
83104
119138
178202
219 231

Mining average reserve gradesCorporate policy maximizes shareholder value over the long run
Not always feasible
If we mine higher grade, then average grade decreases
Depends on replacement grade
21

Policy for guidance on grades
22
Initial reserve (31 Dec 07) 2008B production
100% kt Ag (g/t) Au (g/t) kt Ag (g/t) Au (g/t)
Arcata 1,838 476 1.2 545 570 1.3
Ares 844 183 5.9 333 165 6.4
Selene 809 269 1.7 307 230 1.6
Pallancata 3,546 289 1.2 504 325 1.2
San José 2,695 403 6.0 365 457 7.3
Moris 2,534 4.8 1.5 1,062 4.6 1.5
Comments:
Reserve and resource information released on 12 March 2008
We will give guidance on grades for the current year
We will publish R&R information semi-annually (prelims & interims)
Based on this information market can interpret data and formulate opinion on future grades

Final grade calculation based on reserves
23
Initial Reserve
MT 1,000,000 A
Ag (g/t) 500 B
Additions
MT 400,000 E
Ag (g/t) 500 F
Production
MT 400,000 C
Ag (g/t) 750 D
Final Reserve Formula
MT 1,000,000 G = (A - C + E)
Ag (g/t) 400 = (B*A - D*C + F*E) / G
- +

Application of calculationBased on previous methodology
24
Calculation of 2009 reserves
100% kt Ag (g/t) Au (g/t)
Arcata 1,293 436 1.2
Ares 511 195 5.6
Selene 502 293 1.8
Pallancata 3,042 283 1.2
San José 2,330 395 5.8
Moris 1,472 5.0 1.5
Comments:
Assumes no reserve replenishment
Ares and Selene may vary 20-30% because we could incorporate low grade material from vein splits that might be economic

25
Understanding the geology

Quality assets
26
Rank Mine/Country Company Prod.(m oz) 1 Cannington*, Australia BHP Billiton 37.472 Fresnillo, Mexico Fresnillo 33.523 Dukat, Russia OJSC Polymetal 10.804 Uchucchacua, Peru Compañia de Minas Buenaventura SA 9.875 Greens Creek**, U.S. Hecla Mining Co 8.656 Arcata, Peru Hochschild Mining 6.557 Pallancata, Peru*** Hochschild Mining 6.008 San Jose, Argentina*** Hochschild Mining 5.509 Imiter, Morocco Société Métallurgique d'Imiter 5.4110 Rochester, U.S. Coeur d'Alene Mines 4.6111 Tayahua***, Mexico Grupo Carso 4.0012 La Colorada, Mexico Pan American Silver Corp 3.9613 Huaron, Peru Pan American Silver Corp 3.8314 Alamo Dorado, Mexico Pan American Silver Corp 3.8115 Selene, Peru Hochschild Mining 3.41
World's Leading Primary Silver Mines in 2007
*reported payable metal in concentrate; **historically a silver mine, Greens Creek's primary revenue stream sw itched to zinc in 2006. GFMS regard this as a short term anomaly and as such have maintained its classif ication as a primary silver mine; ***estimated.

Arcata – a world class silver district
In production since 1964
Total production + resources: ± 240 moz Ag, 400 koz Au to date
Southern part of district mined until 2005
Mariana vein and other structures mined starting in 2005
Average grade mined: 700 grams in the past 10 years
67% of production comes from Mariana
Ag & Au production up 38% and 29%, respectively (2007)
Plant expansion almost completed (capacity to 618 ktpa)
27

Arcata
28

Reserve replenishment — Arcata
29
K TM Ag eq (gr /TM)
M oz Ag Eq. contained K TM Ag eq (gr
/TM) M oz Ag Eq. contained K TM Ag eq (gr
/TM) oz Ag eq
1,990 1,504 666.0 32.2 311 685.8 6.9 4.841,991 1,252 674.0 27.1 262 758.6 6.4 10 4,093.7 1.3 4.781,992 1,159 681.2 25.4 260 778.4 6.5 167 886.5 4.8 4.461,993 1,212 620.4 24.2 259 700.4 5.8 312 461.0 4.6 4.681,994 1,312 649.6 27.4 326 763.0 8.0 426 819.5 11.2 4.021,995 1,477 664.8 31.6 357 817.6 9.4 522 807.5 13.6 4.141,996 1,340 680.0 29.3 357 838.0 9.6 220 1,038.4 7.3 3.751,997 1,028 679.0 22.4 374 847.8 10.2 62 1,675.6 3.3 2.751,998 817 695.4 18.3 375 850.0 10.2 164 1,151.7 6.1 2.181,999 546 498.6 8.8 380 863.6 10.6 109 296.0 1.0 1.442,000 682 507.0 11.1 371 672.2 8.0 507 636.9 10.4 1.842,001 448 479.0 6.9 359 640.4 7.4 125 789.8 3.2 1.252,002 540 618.0 10.7 236 567.6 4.3 328 771.6 8.1 2.292,003 315 800.8 8.1 236 583.4 4.4 11 5,110.4 1.8 1.332,004 440 564.6 8.0 290 683.4 6.4 415 468.3 6.2 1.522,005 769 637.4 15.8 282 610.4 5.5 611 677.4 13.3 2.732,006 1,229 515.2 20.4 314 620.4 6.3 774 436.5 10.9 3.912,007 1,838 547.4 32.3 415 645.8 8.6 1,024 625.9 20.6 4.43
5,764 725.8 134.5 5,787 686.9 127.8 3.13
LOM (years)
Total
Reserves Extracted Replenishment
Year

Arcata — Mariana Vein crosssection
30

Arcata — reserves & resources
M Oz Eq Ag M Oz Eq Ag M + I 13.68 Inferred 13.49
M + I 5.52 Inferred 7.48
M + I 0.69 Inferred 3.99
M + I 23.41 Inferred 10.42
M + I 34.91 Inferred 35.37
ARCATA VEINS Resources Reserves
12.74
Mariana Vein System- Secondary Veins
5.13
Mariana Vein
13.85
Alexia Vein System
NW-SE Vein System
32.35 Total
0.64
31

32
Arcata
Ave
rage
gra
de
(Ag E
q/T
M)
Met
al c
onte
nt
(moz
Ag E
q)
Cut-off (Ag Eq/TM) Cut-off (Ag Eq/TM)
Graphs based on total resource (including inferred). No allowance for dilution or mine loss.

Grade variability at Arcata
Current reserves 476 g/t Ag & 1.19 g/t Au
Mining 2008 at 570 g/t Ag
Grade in 2008 is higher than reserves and resources due to mine configuration
33

Arcata — upside potential & exploration plans
Significant exploration potential in covered areas to the north
The discovery of the vein field of Mariana and the northern structures confirms that the hydrothermal system is larger than previously thought
2008 exploration plans:
40 holes (5,000 metres total) to expand resource base
2,000 metres of development and 3,000 m in short drills to convert known inferred resources into measured & indicated and hence into reserves
34

Ares In production since 1998
± 80% - 90% of the production comes from the Victoria Vein and associated structures
1.9 moz Au & 26.8 moz Ag past production
Tonnage mined being consistently replaced albeit with a declining grade
Mature high grade gold deposit
35
Ares
36

Reserve replenishment — Ares
37
K TM Ag eq (gr /TM)
M oz Ag Eq.
contained K TM Ag eq (gr
/TM)
M oz Ag Eq.
contained K TM Ag eq (gr
/TM) oz Ag eq
1,998 1,098 1,658.4 58.5 129 1,607.4 6.7 1,999 656 1,606.6 33.9 241 1,927.6 14.9 (201) 1,504.7 (9.7) 2.72 2,000 838 1,732.2 46.7 273 1,780.0 15.6 455 1,942.0 28.4 3.07 2,001 831 1,686.6 45.1 283 1,502.4 13.7 276 1,359.3 12.1 2.94 2,002 961 1,593.2 49.2 271 1,649.0 14.4 401 1,437.4 18.5 3.55 2,003 1,032 1,657.2 55.0 277 1,642.8 14.6 348 1,822.5 20.4 3.73 2,004 762 1,496.2 36.7 273 1,724.8 15.1 3 (33,085.2) (3.2) 2.79 2,005 828 1,172.8 31.2 281 1,720.0 15.5 347 905.7 10.1 2.95 2,006 845 821.2 22.3 289 1,353.1 12.6 306 375.0 3.7 2.92 2,007 844 539.4 14.6 334 1,153.2 12.4 333 440.0 4.7 2.53
2,651 1,590.8 135.5 2,268 1,165.4 85.0 3.02
LOM (years)
Total
Year
Reserves Extracted Replenishment

Ares — Victoria Vein
38

Ares — reserves & resources
M Oz Eq Ag M Oz Eq Ag M + I 4.71 Inferred 0.08
M + I 7.58 Inferred 0.44
M + I 0.48 Inferred 0.06
M + I 2.83 Inferred 0.50
M + I 15.74 Inferred 1.08
ARES VEINS Resources Reserves
4.05 Victoria Vein
7.11
2.61
0.50
14.64
Victoria System- Secondary Veins
Victoria System- oblique veins
Outlying Veins
Total
39

Exploration potential & plansContinue drilling in the Victoria structural corridor to continuereplenishing tonnes
New exploration model developedto look for another pristine highgrade structure
2008 exploration plans:
± 20 holes (8,000 metres total) to expand resource base
800 metres of development and 4,000 m in short drills to gain reserves around the Victoria Vein
40
Selene
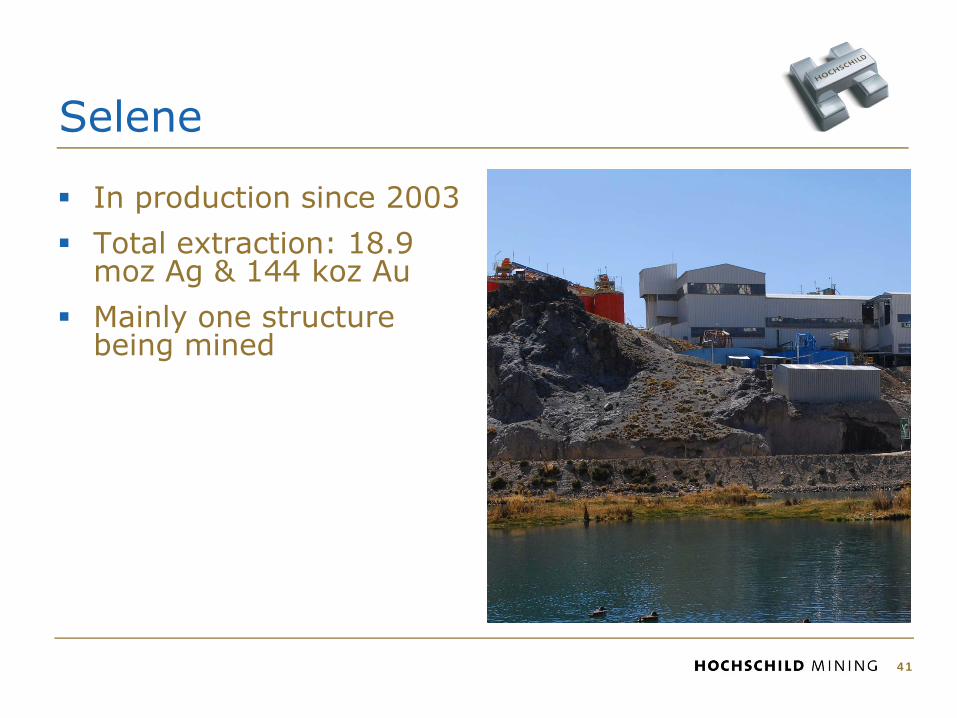
In production since 2003
Total extraction: 18.9 moz Ag & 144 koz Au
Mainly one structure being mined
41

Reserve replenishment — Selene
42

Selene
43

Selene — Explorador Vein
44

Selene — reserves & resources
45
M Oz Eq Ag M Oz Eq Ag M + I 6.78 Inferred 1.09
M + I 1.61 Inferred 0.89
M + I 1.59 Inferred 5.49
M + I 0.31 Inferred 0.75
M + I 10.28 Inferred 8.21
Secondary Veins in Explorador
Tumiri-Sofia Vein System and Secondary Veins
Outlying Veins
Resources Reserves
Total
Explorador Vein 6.36
1.51
0.30
1.42
SELENE VEINS
9.62

Pallancata Acquired by IMC in late 2002
Discovery holes: 2003
60% acquisition by HOC in mid 2006
In production by mid 2007
Significant exploration upside
46

Pallancata
47

Pallancata — Pallancata Vein
48

Pallancata — reserves & resources
M Oz Eq Ag M Oz Eq Ag M + I 38.17 Inferred 5.91
M + I 5.88 Inferred 0.43
M + I 0.26 Inferred 32.41
M + I 44.39 Inferred 38.78
35.70
5.49
PALLANCATA VEINS Resources Reserves
Veta Oeste
41.43
Other veins associated with the Pallancata Vein System
Veta Cimoide
0.24
Total
49
3,546,271

50
Pallancata
Ave
rage
gra
de
(Ag E
q/T
M)
Cut-off (Ag Eq/TM)
Met
al c
onte
nt
(moz
Ag E
q)
Cut-off (Ag Eq/TM)
Graphs based on total resource (including inferred). No allowance for dilution or mine loss.

Pallancata — exploration upside
Hole ID True Width (m) Ag (gr / TM) Au (gr / TM) Ag Eq (gr / TM
PAC 57 0.40 385 0.86 437 PAC 59 0.30 1,260 3.25 1,455 PAC 60 1.20 622 1.18 693 DLPL-A-61 0.10 1,374 4.10 1,620
0.20 2,520 13.25 3,315 0.30 1,395 14.30 2,253 0.50 575 2.10 701 0.90 535 2.20 667 0.20 383 16.10 1,349
PAC 64 0.90 553 3.61 770 PAC 65 0.70 786 5.05 1,089
0.40 1,275 8.35 1,776 0.20 246 1.11 313 0.40 542 3.06 726 0.20 17 8.51 528
PAC 62
PAC 63
PAC 67
PAC 68
51

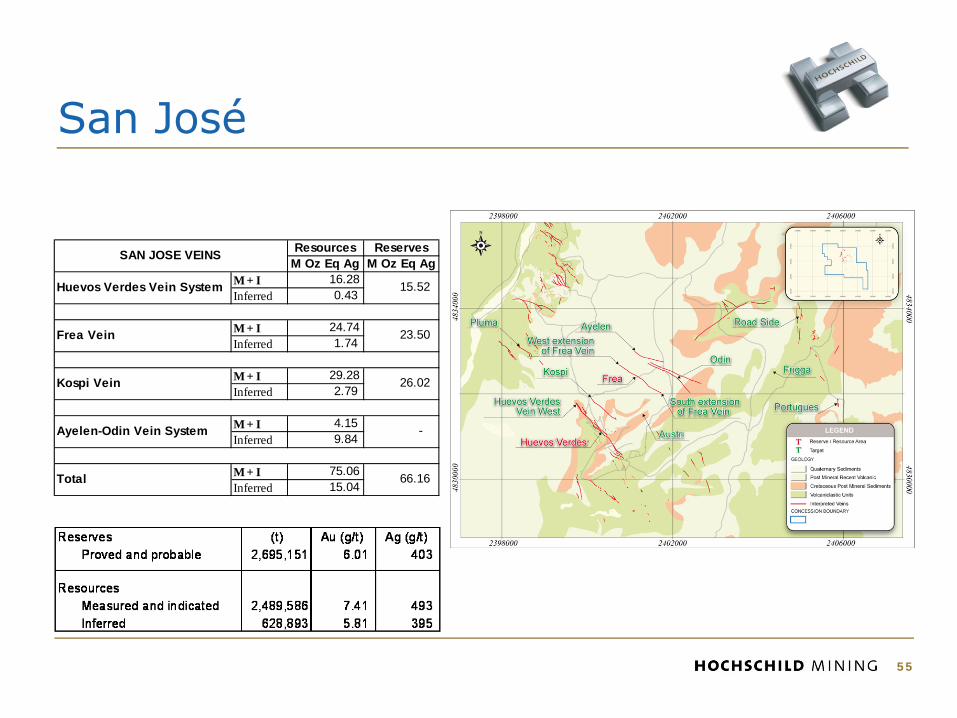
San JoséDiscovered in 1998 by Minera Andes
HOC acquired 51% in 2001
In production since mid 2007
50 thousand hectare land package
Over 40 kilometres veins reported, less than 20% explored
52

San José
53

San José — Huevos Verdes Vein
54
San José
M Oz Eq Ag M Oz Eq Ag M + I 16.28 Inferred 0.43
M + I 24.74 Inferred 1.74
M + I 29.28 Inferred 2.79
M + I 4.15 Inferred 9.84
M + I 75.06 Inferred 15.04
Ayelen-Odin Vein System
Total
Huevos Verdes Vein System
Frea Vein
Kospi Vein
66.16
26.02
-
15.52
23.50
SAN JOSE VEINS Resources Reserves
55

San José — exploration upside
56

San Felipe
Consolidating ownership: acquired 100% of project for $51.5 million on 5 June 2008
Zn/Pb/Cu/Ag deposit in Sonora, Mexico
Resources:
Indicated: 2.32 M TM @ 7.32% Zn, 3.19% Pb, 0.41% Cu & 71 g/t Ag
Inferred: 0.40 M TM @ 6.25% Zn, 2.98% Pb, 0.27% Cu & 49 g/t Ag
Moving towards feasibility
Only La Ventana structure explored in detail
57

San Felipe
58

59
El Gachi — Mexico (70%)
59
* Measured + indicated + inferred, includes reserves
El Gachi providing additional upside to San Felipe
60 km from San Felipe
2.5 to 8.0 m “manto” identified in the property
Historic (no JORC) resource of ± 100 K TM @ 400 – 500 gr Ag & 15 – 20 % Pb + Zn
Significant upside potential

Lake Shore Gold Corp.
60
HOC increased stake to 35% on 17 June 2008
Canadian (Timmins, Ontario) gold development company
Mining friendly jurisdiction
Fully financed to develop four independent gold assets over the next 18 months to feed the Bell Creek mill. These assets provide production flexibility
Commissioning of the Bell Creek mill expected at the rate of 800 tpd by Q1 2009
Bell Creek mill to be expanded to 3,000 tpd in 2010
215,000 Au oz expected in 2011
Relatively low cost production (lower third of the industry)
Experienced management
Source: Wellington West report dated 4 June 2008

Lake Shore Gold Corp.
61

Exploring the region
Generative
Prospect
Existing mining operations
Resource delineation
Feasibility completed
Target definition
Development projects
AresArcataSelene
San JoséPallancata
MorisNew opportunities To Divest / Drop / JV
62
Exploration offices in Peru, Argentina, Mexico and Chile
554,298 Has. 35,400 Has. 181,425 Has. 60,889 Has.
San Felipe
Peñón Blanco
Gavilanes Pozos
El GachiAzuca
Cacurani
Claudia
El MosquitoCañadón del Moro
Manantiales
Tres Chepas
Encrucijada Parihuana
La Flora
Ccello PuntaMoris Reg.
Quevar (JV)
Tignamar
Calderón
El Pino (JV)
Sierra Mojina (JV)
El Pocito (JV)
San Luis Cordero
Paraiso
Argentina
Chile
Mexico
Peru
CanadaLake Shore
Moctezuma

63
Financial & political situation

2007 unit cost breakdown ($/tonne)
64
Note: costs do not include depreciation. According to IFRS 1 Does not consider Moris which is an open pit mine
2007
Arcata $55
Ares $77
Selene $54
Pallancata $50
San José $189
Moris $18
Weighted average1 $70

Current operating environmentOutlook for 2008 costs
65
Peru
– Impact of incorporating contractor workers in payroll
– US dollar devaluation
– Consumables prices increase affecting mine and plant
– More materials required to support mine to enhance security
– More royalties given higher prices
Argentina
– Personnel expenses increase due to higher salaries (related to market conditions) and higher transportation expenses
– Higher consumables prices and freight rates
– Local inflation pressure higher than expected
Mexico
– Lower tonnage treated
– Increase of maintenance costs and tariffs of contractors
– Greater cement consumption for agglomeration
– Payroll increase due to new market conditions

Selling our productDore versus concentrate
66
Produced at Ares1, San José and Moris (44% of total oz’s produced)
• Frequent pick up from mine
• Risk transfers upon pick up
• 100% of revenuereceived upfront
• Reduced workingcapital requirement
• Stable commercial market conditions
• Fewer discounts
Produced at Arcata, Selene, Pallancata andSan José (56% of total oz’s produced)
Evaluating taking concentrate to doré
• Shipments made on a monthly or quarterly basis
• Risk transfers when mineral reaches smelter
• 85%-90% of revenuereceived upon arrival (30-45 days)
• Increased workingcapital requirement
• Volatile market conditions
• Higher discounts
1 Ares and Selene material treated at Ares

Discounts & selling expenses
67
2009 outlook:
Arcata may become doré in 2Q09Selene and Pallancata 100% doré in 2Q09San José 100% doré in 2Q09Other contracts will remain the same
2007 & 2008 summary & outlook:
1 Doré: includes non payable contents. Other charges such as refining and freights are included in unit cost Concentrates: includes non payable contents, treatment charges, penalties and freights. No charges to unit cost
2 Lower because delivery point changed from Tampico (Mexico) to Callao (Peru)3 Selling expenses include export tax (10% of net sales for concentrate and 5% of net sales for doré)
AresArcataSelenePallancataSan JoséMoris
DoréConcentrateDoré (85%) / Concentrate (15%)ConcentrateDoré (63%) / Concentrate (37%)Doré
0.2%10.2%
2.6%
7.1%
N.A
0.2%
ProductDiscounts
(% gross sales)Selling exp.
(% gross sales)
0.2%14.9%
1.2%
6.4%
2.3%
0.2%
0.1%1.9%
0.6%
1.6%
N.A
-
0.1%1.5%
0.3%
1.3%
6.0%
-
‘07 ‘08E ‘07 ‘08E
2
3
1
Overview of the concentrate market
68
Negotiate annual contracts generally in Oct/Nov of preceding yearHave contracts with Peñoles, Cormin, Doe Run, Norddeutsche Affinerie, and Teck ComincoSurplus base metal concentrate production and tougher environmental regulations regarding deleterious elements results in tougher concentrate market conditionsArcata concentrate most difficult to sell due to arsenic content of 0.6%, down from historic highs of 6% (ideal to have <0.3%)Outlook for concentrate market is to remain difficult as base metal markets (zinc & lead) expected to remain in a surplus stateWe continue to mitigate risk by increasing our production of doré vs. concentrate and increasing our customer base
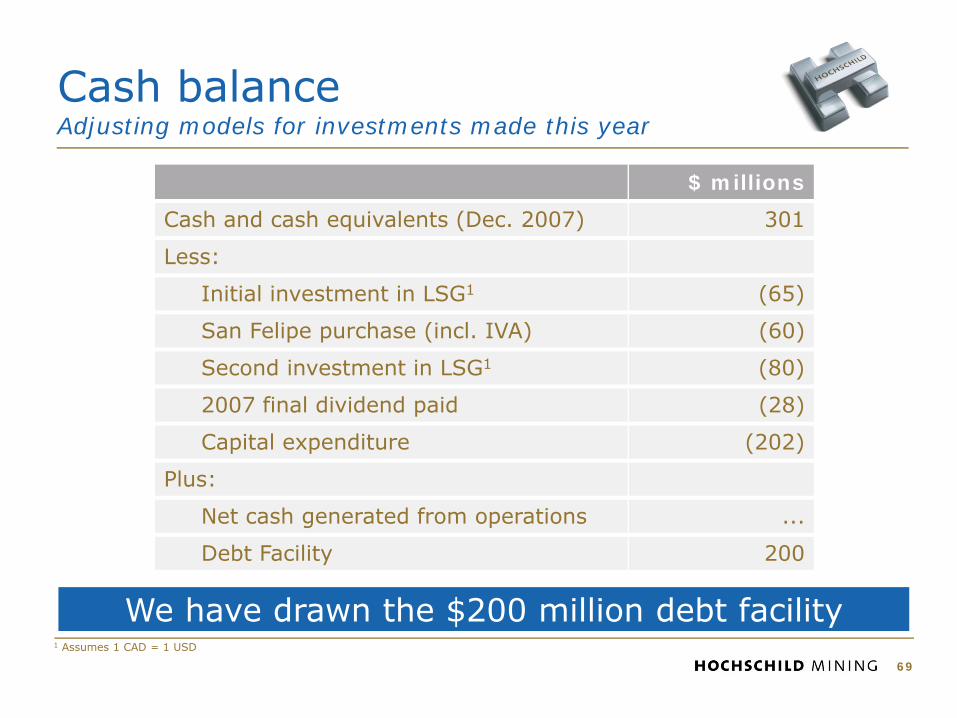
Cash balanceAdjusting models for investments made this year
69
$ millions
Cash and cash equivalents (Dec. 2007) 301
Less:
Initial investment in LSG1 (65)
San Felipe purchase (incl. IVA) (60)
Second investment in LSG1 (80)
2007 final dividend paid (28)
Capital expenditure (202)
Plus:
Net cash generated from operations ...
Debt Facility 200
We have drawn the $200 million debt facility1 Assumes 1 CAD = 1 USD

Peru political situationNo significant change
70
Mining royalties were introduced in 2004 and dictated by Peruvian legislation
Owners of mining concessions must pay 1%—3% of sales
Sales<US$60m: 1%
US$60m < sales < US$120m: 2%
US$120 million < sales: 3%
Percentage depends on the value of the mineral concentrates according to the international quoted market price published by the Ministry of Energy and Mines
Voluntary social contribution implemented in 2006
Workers’ profit sharing
8% of pre-tax profit
We include 70% in administration expenses and 30% in cost of goods sold
Stability agreement at Ares Unit
Currently do not pay royalties but expires in December 31, 2008

Argentina political situationExport tax included in “selling expense”
71
Mining Royalties vary from province to province. For San José the royalty is fixed at 1.85% of the pit-head value per year when the final product is doré and 2.55% when the final product are mineral concentrates or precipitates.
National Export tax of 5% when the final product is doré and 10% when the final product are gold or silver concentrates although rebates available for the first 3 years if shipped from port (3%, 2% and 1% rebate for years 2007, 2008 and 2009, respectively
Export tax included in “Selling Expense” line of income statement
Stability certificate granted by the Ministry of Mines for San José
National and provincial tax regimes are frozen for a period of 30 years
No workers’ profit sharing

Mexico political situation
72
No mining royalties
No stability agreements
Workers’ profit sharing equal to 10% of pre-tax profit
IETU equal to 16.5% for year 2008; 17% for year 2009; and 17.5% from year 2010 and so on, over cash flow

2008 outlook
73
• Year of consolidation
– Stable production
– Focus on cost containment in inflationary environment
• Advancing on growth strategy through:
– Further expansions
– Feasibility at San Felipe
– Continue to pursue further acquisitions
• Positive on fundamentals for silver and gold
– Global macroeconomic outlook
– Industrial demand for silver especially from China
• Remain on track to achieve production targets
– Q1 2008 production inline with forecast

Contact us
Miguel Aramburú, CEO (Lima)+511 437 6018
Ignacio Rosado, CFO (Lima)+511 437 6007
Wray Barber, Head of Investor Relations (London) +44 20 7907 2934
74


