Download - Annual Audited Accounts

A S P E C T S M O O D Y CERTIFICATION
U K SENVIRONMENTALMANAGEMENT
041
Certificate No. 1495
Vision / Mission
Corporate Information
Company Profile
Organizational Chart
Our Core Values
Notice of Annual General Meeting
Chairman’s Message
Statement of Ethics & Business Practices
Vertical Analysis
Horizontal Analysis
Chairman’s Review
Directors’ Report
Statement of Value Added
Summery of Cash Flow Statement
Financial Highlights
Statement of Compliance with the Code of Corporate Governance
Review Report to the Members on Statement of Compliance
with best practices of Code of Corporate Governance
Pattern of Shareholding
Auditors' Report to the Members
Statement of Financial Position
Income Statement
Statement of Comprehensive Income
Statement of Cash Flow
Statement of Changes in Equity
Notes to the Financial Statements
Proxy Form
APPROVED
UNITED KINGDOM
ACCREDITATIONSERVICE
Reg. No.: 9901118
02
03
04
05
06
08
09
10
14
15
16
22
27
28
29
34
36
37
41
42
43
44
45
46
47
The Company should secure and provide a rewarding returnon investment to its shareholders and investor, quality productsto its customer, a secured and friendly environment at place ofwork to its employees and present itself a reliable partner toall business associates.
2 Din Textile Mills Limited
We aim at transforming Din Textile Mills Ltd. ( DTML)into a Complete Textile unit to further explore internationalmarket of very high value products. Our emphasis would be onproduct and market diversification, value addition and costeffectiveness. We intend to fully equip the Company acquirepioneer role in the economic developmentof the country.
Board of Directors Shaikh Mohammad Muneer Chairman/Chief Executive Shaikh Mohammad Pervez Director Shaikh Mohammad Tanveer Director
Director Director Director
Director
Mr. Shahzad Naseer Mr. S. M. Naveed Mr. Faisal Jawed Mr. Farhad Shaikh Mohammad
Ba
nk
er
s
Audit Committee
Shaikh Mohammad Pervez ChairmanMr. Faisal Jawed MemberMr. Farhad Shaikh Mohammad Member
Company Secretary
Mr. Islam Ahmed
Chief Financial OfficerMr. Shaukat Hussain Ch.
(APA, CFC)
Registered Office Din House, 35 - A/1, Lalazar Area,
Opp: Beach Luxury Hotel, M. T. Khan Road, Karachi.
Mills
Unit-I and II : Kot Akbar Khan, 70Km Multan Road, Tehsil Pattoki, District Kasur, Punjab.
Unit-III : Revenue Estate, Bhai Kot, Tablighi Chowk, Raiwind Road, Tehsil and Distt. Lahore.
Website www.dingroup.com
Auditors
Mushtaq & Co.,Chartered Accountants
Annual Report 2010 3
Allied Bank Ltd.
Arif Habib Bank Ltd.
Barclays Bank PLC .
Citibank N.A.
Dubai Islamic Bank Pakistan Ltd.
Faysal Bank Ltd.
Habib Bank Ltd.
Habib Metropolitan Bank Ltd.
HSBC Bank Middle East Ltd.
KASB Bank Ltd.
MCB Bank Ltd.
Meezan Bank Ltd.
Pak Oman Investment Co. Ltd.
Standard Chartered Bank (Pakistan) Ltd.
4 Din Textile Mills Limited
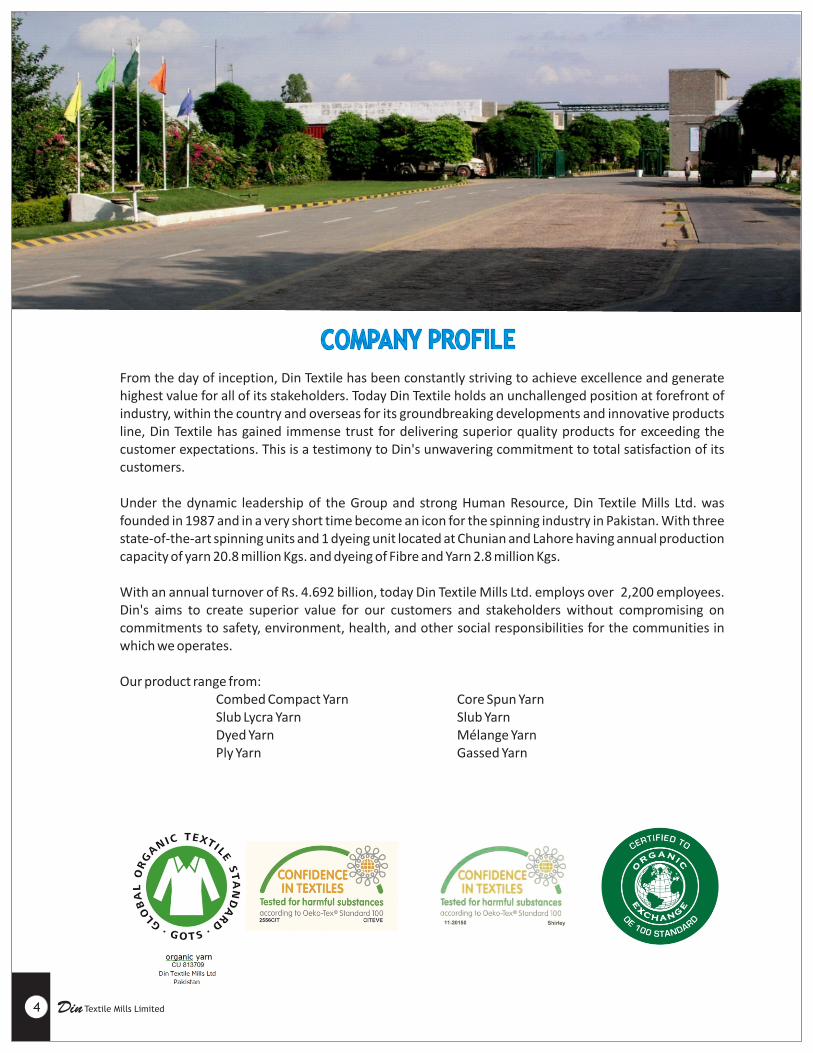
From the day of inception, Din Textile has been constantly striving to achieve excellence and generate highest value for all of its stakeholders. Today Din Textile holds an unchallenged position at forefront of industry, within the country and overseas for its groundbreaking developments and innovative products line, Din Textile has gained immense trust for delivering superior quality products for exceeding the customer expectations. This is a testimony to Din's unwavering commitment to total satisfaction of its customers.
Under the dynamic leadership of the Group and strong Human Resource, Din Textile Mills Ltd. was founded in 1987 and in a very short time become an icon for the spinning industry in Pakistan. With three state-of-the-art spinning units and 1 dyeing unit located at Chunian and Lahore having annual production capacity of yarn 20.8 million Kgs. and dyeing of Fibre and Yarn 2.8 million Kgs.
With an annual turnover of Rs. 4.692 billion, today Din Textile Mills Ltd. employs over 2,200 employees. Din's aims to create superior value for our customers and stakeholders without compromising on commitments to safety, environment, health, and other social responsibilities for the communities in which we operates.
Our product range from: Combed Compact Yarn Core Spun Yarn
Slub Lycra Yarn Slub Yarn Dyed Yarn Mélange Yarn Ply Yarn Gassed Yarn

Annual Report 2010 5
CHAI
RMAN
BOA
RD O
FDI
RECT
ORS
BOARD OF DIRECTORS
CHIEF FINANCIAL OFFICER
A.M. RAW MATERIAL PROCURMENT
PURCHASE DEPARTMENT
MANAGER IT/IS IT/IS DEPARTMENT
MANAGER ACCOUNTSACCOUNTS
DEPARTMENT
RESIDENT DIRECTOR
GENERAL MANAGER (SPINNING MILLS 1)
GENERAL MANAGER (SPINNING MILLS 2)
GENERAL MANAGER (SPINNING MILLS 3)
GENERAL MANAGER (DYEING UNIT)
PURCHASE MANAGER
AUDIT COMMITTEEDEPARTMENT
INTERNAL AUDIT
SHIFT ENGINEER
SHIFT SUPERVISOR
SHIFT ENGINEER
ELECTRICAL ENGINEER
SHIFT SUPERVISOR
ELECTRICAL ENGINEERPLANT MANAGER
(POWER 1)
PLANT MANAGER (POWER 3)
SALES & MARKETING DEPARTMENT
ADMIN DEPARTMENT
TECHNICAL DIRECTOR
MANAGER SALES & MARKETING
GENERAL MANAGER ADMIN (HEAD OFFICE)
TECHNICAL MANAGER
SPINNING MANAGER
MECHANICAL MANAGER
TECHNICAL MANAGER
SPINNING MANAGER
MECHANICAL MANAGER
TECHNICAL MANAGER
SPINNING MANAGER
MECHANICAL MANAGER
PLANT MANAGER
PROCESSING MANAGER
QUALITY CONTROL MANAGER
LAB INCHARGE

Several features which have contributed to our growth and reputation include the exceedingly professional, high quality textile products for the various manufacturing companies. Out of all the factors, the most significant is our unwavering commitment to our Core Values. Our plans, and approach towards the market, changes in accordance with the varying market conditions. Din’s Core values will prove to be consistent to overcome future challenges.
Dedication to Core Values
Entrepreneurship
Customer Orientation &
Satisfaction
Responsiveness With
Excellence
Integrity &
Honesty
Exceeding Expectation With
Team Work
Professionalism &
RespectCommunication
Result Oriented
Quality
6 Din Textile Mills Limited
Customer Orientation and Satisfaction.To achieve success, we believe in listing our customers and considering their needs. Everything we do encompasses the fact that our customers remain satisfied in all aspects.
Responsiveness with Excellence.We strive for superior quality, even with the smallest task assigned. We are responsive to our customers, prospects and partners, separating Core Matrix from our competitors.
Integrity and Honesty.Core matrix is intolerant towards any legal or ethical breaches. We believe in the highest level of integrity, sincerity and honesty.
Exceeding Expectation with Team Work.In order to exceed the expectations of our customers, we respect each individual by contributing equally to the success of each effort laid.
Professionalism and Respect.Professionalism and Courtesy has always been the prior concern of our code of conduct.
Communication.In order to achieve positive outcomes, we believe in being open and honest with the give-and-take with customers, partners and peers.
Result Oriented.Core matrix must address each challenge with a "result-oriented" approach, and focus on the solution of the problems that arise.
Quality.Commitment and dedication can be observed with all that we do from emails, to proposals, to customer documents and meetings, to the phone calls, as well as training sessions.
Entrepreneurship.There is passion and the ability to observe greater opportunities in every task we undertake.
Annual Report 2010 7
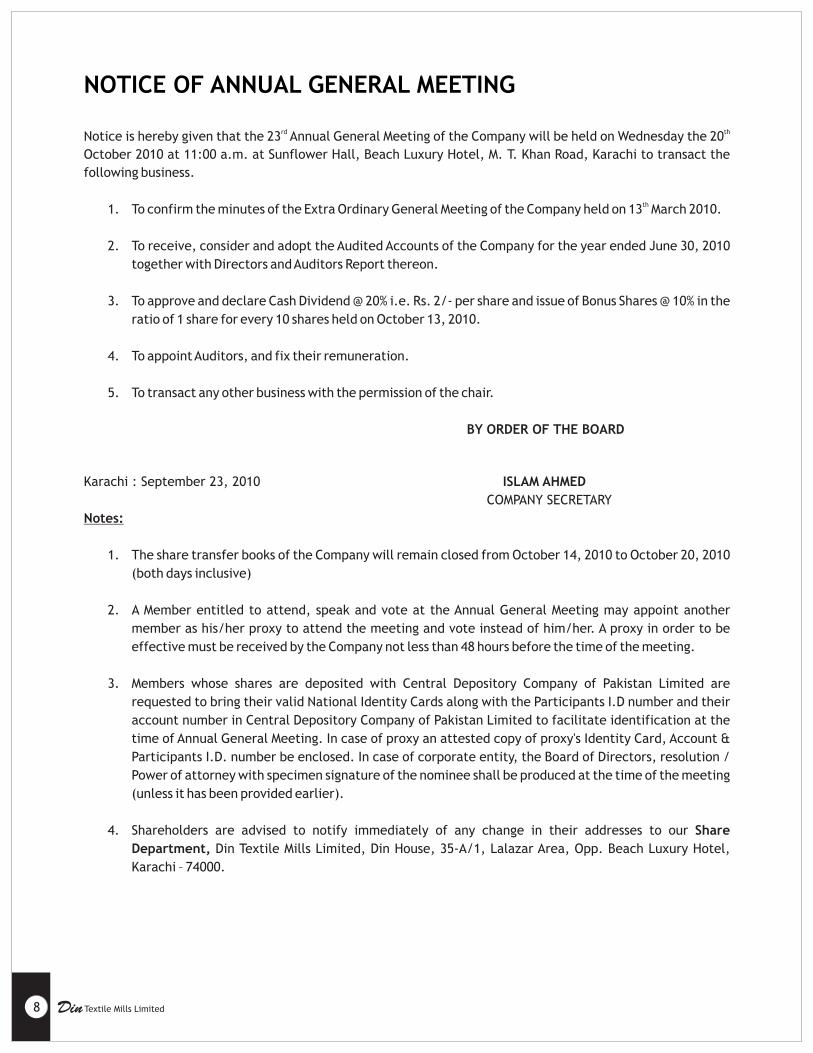
NOTICE OF ANNUAL GENERAL MEETING
rd thNotice is hereby given that the 23 Annual General Meeting of the Company will be held on Wednesday the 20
October 2010 at 11:00 a.m. at Sunflower Hall, Beach Luxury Hotel, M. T. Khan Road, Karachi to transact the
following business.
th1. To confirm the minutes of the Extra Ordinary General Meeting of the Company held on 13 March 2010.
2. To receive, consider and adopt the Audited Accounts of the Company for the year ended June 30, 2010
together with Directors and Auditors Report thereon.
3. To approve and declare Cash Dividend @ 20% i.e. Rs. 2/- per share and issue of Bonus Shares @ 10% in the
ratio of 1 share for every 10 shares held on October 13, 2010.
4. To appoint Auditors, and fix their remuneration.
5. To transact any other business with the permission of the chair.
BY ORDER OF THE BOARD
Karachi : September 23, 2010 ISLAM AHMED
COMPANY SECRETARY
Notes:
1. The share transfer books of the Company will remain closed from October 14, 2010 to October 20, 2010
(both days inclusive)
2. A Member entitled to attend, speak and vote at the Annual General Meeting may appoint another
member as his/her proxy to attend the meeting and vote instead of him/her. A proxy in order to be
effective must be received by the Company not less than 48 hours before the time of the meeting.
3. Members whose shares are deposited with Central Depository Company of Pakistan Limited are
requested to bring their valid National Identity Cards along with the Participants I.D number and their
account number in Central Depository Company of Pakistan Limited to facilitate identification at the
time of Annual General Meeting. In case of proxy an attested copy of proxy's Identity Card, Account &
Participants I.D. number be enclosed. In case of corporate entity, the Board of Directors, resolution /
Power of attorney with specimen signature of the nominee shall be produced at the time of the meeting
(unless it has been provided earlier).
4. Shareholders are advised to notify immediately of any change in their addresses to our Share
Department, Din Textile Mills Limited, Din House, 35-A/1, Lalazar Area, Opp. Beach Luxury Hotel,
Karachi – 74000.
8 Din Textile Mills Limited
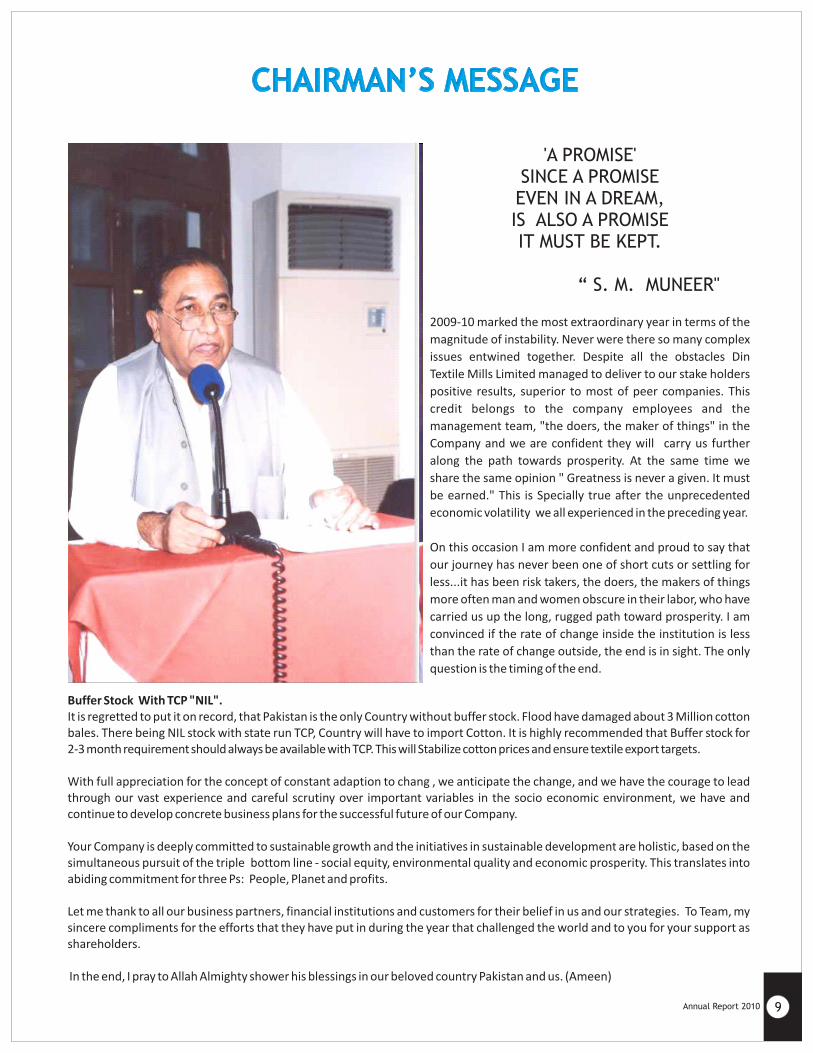
'A PROMISE'SINCE A PROMISEEVEN IN A DREAM,IS ALSO A PROMISEIT MUST BE KEPT.
“ S. M. MUNEER"
2009-10 marked the most extraordinary year in terms of the
magnitude of instability. Never were there so many complex
issues entwined together. Despite all the obstacles Din
Textile Mills Limited managed to deliver to our stake holders
positive results, superior to most of peer companies. This
credit belongs to the company employees and the
management team, "the doers, the maker of things" in the
Company and we are confident they will carry us further
along the path towards prosperity. At the same time we
share the same opinion " Greatness is never a given. It must
be earned." This is Specially true after the unprecedented
economic volatility we all experienced in the preceding year.
On this occasion I am more confident and proud to say that
our journey has never been one of short cuts or settling for
less...it has been risk takers, the doers, the makers of things
more often man and women obscure in their labor, who have
carried us up the long, rugged path toward prosperity. I am
convinced if the rate of change inside the institution is less
than the rate of change outside, the end is in sight. The only
question is the timing of the end.
Buffer Stock With TCP "NIL".It is regretted to put it on record, that Pakistan is the only Country without buffer stock. Flood have damaged about 3 Million cotton bales. There being NIL stock with state run TCP, Country will have to import Cotton. It is highly recommended that Buffer stock for 2-3 month requirement should always be available with TCP. This will Stabilize cotton prices and ensure textile export targets.
With full appreciation for the concept of constant adaption to chang , we anticipate the change, and we have the courage to lead through our vast experience and careful scrutiny over important variables in the socio economic environment, we have and continue to develop concrete business plans for the successful future of our Company.
Your Company is deeply committed to sustainable growth and the initiatives in sustainable development are holistic, based on the simultaneous pursuit of the triple bottom line - social equity, environmental quality and economic prosperity. This translates into abiding commitment for three Ps: People, Planet and profits.
Let me thank to all our business partners, financial institutions and customers for their belief in us and our strategies. To Team, my sincere compliments for the efforts that they have put in during the year that challenged the world and to you for your support as shareholders.
In the end, I pray to Allah Almighty shower his blessings in our beloved country Pakistan and us. (Ameen)
Annual Report 2010 9

10 Din Textile Mills Limited
•
The core values of Din Textile Mills Ltd. which are the vital part of our Success, Integrity, Honesty, Professionalism and Respect in all our Business Practices; are backed up by the creativity and passion of our people.
The loyalty and confidence in our products and services is because of our solemnity in our business relations with our Customers, Suppliers, Shareholders, Regulatory Agencies and the Community as general. This is only possible because of the Leaders at Din Textile who consider all this their one of the prime responsibility of setting example through personal performances and excellent attitudes to convey the ethical values to each individual at Din Textile Mills Ltd.
For retaining our glory and reputation, an uncompromising adherence to ethical excellence is integral for sustaining and creating the necessary strong foundation on which Din Textile had & can ‘Grow and Prosper!’ People at Din Textile today and in future, must be aware of and contribute for the high achieving standards required in all our business practices.
• Scope.
The Board of Directors on the whole is responsible for the appliance of ethical business practices and principles, which is applicable to every individual of Din Textile Mills Limited. The word ‘Individual’ refer to you and your use in this code includes all employees and officers.
• Principles:
1. Din's Commitment to Its People.v Share ownership.The key objective of Din Textile is to ensure its people are able to share the value which they helped to create. This is achieved through the promotion of staff share ownership.
v Equal Opportunities.Din Textile values the Individuality, Diversity and Creative potential that every individual brings to its business. All employees are treated with equal respect and dignity and are provided with equality of opportunity to develop themselves and their careers.
We want to attract, develop and motivate the best people. We are creating a working environment that is open, honest and unprejudiced, which encourages people to achieve their full potential. We value people individuality and team contributions and offer opportunities to share in the company commercial success.
Policy Statement.
For the year ended June 30, 2010

Annual Report 2010 11
v Employment, Discrimination and Harassment.Din Textile policy is to respect the human rights of all individuals compiling with National Laws considering working hours and good compensation. Din Textile enforces strict prohibition on the use of forced or child labor.
To Din Textile the harassment or discrimination of any individual is unacceptable. In particular, sexual and racial discrimination or harassment is totally unacceptable.
Human Capital Administrators & Managers are required to take account of the core International Labor Organization conventions and strive to observe the United Nation Declarations on Human Rights, for a guaranteed respected if the individual at Din Textile. What needs to be observed in particular is as follow: " Universal respect for an observance of human rights and fundamental freedom for all without any discrimination. We remunerate fairly with respect to skill, performance, our peers and local conditions."
2. What Din Textile requires of its peoplev Compliance with LawsDin Textile, with its individuals, must comply with the laws and regulations of any country in which it is operating business. The policy applies without any exceptions. Particular areas to be noted here control the competition aspect, along with the communication laws. These concern safety, health and the environment as well. It is the responsibility of Din’s individuals to ensure, by taking appropriate advice by making them aware of all the relevant local laws.
Din Textile complies with the Listing, the Prospectus, and the Disclosure and Transparency Rules.
v Security of InformationInformation generated within the organization including Computer Programs, is the Property of Din Textile, and should not be disclosed without proper authority and authentication unless legally required.
v Use of Information for personal gainIndividuals must not use confidential information obtained during their employment in Din Textile for personal gains. Individuals are responsible for maintaining the secrecy and confidentiality of the sensitive and unpublished data and information of Din Textile must not provide that to any other individual outside the organization. The organization has enforced a strict share dealing code which prohibits individuals to trade the information internally.
v BribesBribes are strictly prohibited to or from customers. Din Textile funds must not be used for the payments; direct or indirect, to government officials or individuals of state organizations for any unlawful or improper purpose.
v Political Donations Financial donations to political parties or for promotion of any political cause are strictly prohibited. Payments
or gifts to any individual influencing any political decision for obtaining or retaining Din Textile business, is unacceptable.
v Conflicts of interestIndividuals of Din Textile must avoid situations in which their personal or financial interests conflicts with those of the Din Textile while dealing with the Customers, Suppliers, Contractors, Competitors, Partners or any individual doing or seeking business from Din Textile. The individuals of Din Textile should act in favor of the group and personal preferences should not be a prior concern. Every Din’s Individual is welcomed for a sound advice when ever they find their selves facing a potential conflict of interest.This all is not limited to owning shares with business partners, company shares trading, personal or family involvement in commercial transactions with Din Textile; but also includes such activities or owning any interest like borrowing from third party based on the business relationship of Din Textile.
12 Din Textile Mills Limited
v Corporate Reporting and Internal ControlsIt is important for every Din’s individual that all of the official accounts and records must be documented in such a manner that clearly identified and describes the true nature of business transactions, assets or liabilities, and properly and timely classification of the records; so as the entries presented and saved in the records are in conformity with the generally accepted accounting principles. No records, entry or document should be false, distorted, misleading, misdirected, deliberately incomplete or suppressed.Din Textile strictly adhere the principles of good corporate governance and it is committed to achieve the highest standards of corporate governance. Din Textile maintain effective, transparent financial reporting and sound internal control system ensuring true and fair performance measurement and compliance with local regulatory requirements and international accounting standards as applicable.
3. Din Textile's Commitment with their CompetitorsDin Textile competes enthusiastically but fairly in the operating markets in the true spirit to win the market. Din Textile being honest and trustworthy in all of its dealings had never and will not damage the reputation of competitors either directly or by implication or innuendo.Din Textile had never and will not attempt to acquire information about a competitor’s business by disreputable means nor will it engage in restrictive trade practices of abuse any position of market dominance.
4. Din Textile's Commitment with their CustomersDin Textile had always been and wishes to be our customer's first choice for the excellent quality and efficient services. Relationship based on mutual trust will helps us deliver innovative solutions that anticipate and meet our customer's needs.Din Textile believes that reliability in dealing with customers is a prerequisite for a successful and sustained business relationship with them. In all advertising and other publications from Din Textile untrue, concealment and overstatement had always been and will be avoided.
5. Din Textile's commitment with their SuppliersDin Textile aims to develop and maintain best relationships with its suppliers based on mutual trust and embark on timely and agreed trade terms payments. Din Textile purchasing power must never be used unscrupulously. All of the information regarding the Din Textile and its suppliers must be respected and kept confidential.Din Textile buying decisions are always been a commitment of assurance that whatever material which is purchased foe production and procurement, will always be safe for environment. We expect that our suppliers also enforce the same standards of employment, harassment and discrimination policies as like Din Textile.
6. Din Textile's Commitment with their ShareholdersDin Textile always communicates its business policies, achievements and prospects with honesty and in accordance with applicable guideline and regulations.We always strive to create excellent long term value to reward investment. We will always maintain the highest standards of business practices and will be transparent in all our dealings as before.
7. Din Textile's Commitment with their Local CommunitiesDin’s individuals are encouraged for participation in the local communities and civil affairs. We at Din recognize our responsibilities as active members of the communities where ever we operate. Din strongly believes in contribution for the well being of wider communities. Din emphasizes our efforts in community services like education, literacy, healthcare and we will respect the traditions, cultures and heritages.
8. Din Textile's Commitment to the environmentDin Textile always been given a great importance for protecting the environment in which we all live. We are concerned with the preservation of the environment in its broadest sense and recognize that certain resources are finite and must be used responsibly.

Annual Report 2010 13
Din Textile believe to provide a clean, safe, healthy and pollution free environment for all of the individuals who live in and around Din Textile's manufacturing sites, by employing such technologies which are beneficial in maintaining and protecting environmental hygiene and health.
Implementation of this statementThe examples given in this statement are not intended to be comprehensive and Din Textile individuals must endeavor to observe the principles that they embody.Din Textile reputation depends on effective implementation of policies and it is the responsibility of all managers to ensure that this statement and these policies and their application are communicated, understood and taken seriously by all individuals.Din Textile Management must secure the co-operation of individuals and positively promote these policies by personal example, by clear guidance and by making advice available as appropriate.

14 Din Textile Mills Limited
Variance vs Last Variance vs Last Variance vs Last
Year Increase/ Year Increase/ Year Increase/
2010 (Decrease) % 2009 (Decrease) % 2008 (Decrease) % 2007
Operating ResultsSales - net 4,692 26.38 3,712 19.71 3,101 14.24 2,714
Cost of sales (3,768) 13.32 (3,325) 22.98 (2,704) 11.67 (2,421)
Gross profit 924 138.44 388 (2.51) 397 35.48 293
Distribution cost 195 69.60 115 5.77 109 223.67 34
Administrative expenses 81 84.84 44 9.98 40 12.75 35
Other operating expenses 32 188.32 11 (10.32) 12 159.38 5
Finance cost 213 49.84 142 24.72 114 (16.60) 137
Other operating income 11
17.99 10
(2.90) 10
29.71 8
Profit before taxation 414
387.72 85
(35.86) 132
46.21 91
Provision for taxation (54)
3.47 (52)
(205.56) 49
(34.78) 76
Profit for the year 360
1005.70 33
(82.02) 182
9.30 166
Balance Sheet
NON CURRENT ASSETS
Property, plant and equipment 1,670
(3.82) 1,736
(8.57) 1,899
(5.29) 2,005
Long term loans and advances -
(44.40) 1
(54.75) 1
(11.06) 2
Long term deposits 12
89.67 6
71.76 4
25.52 3
Total non current assets 1,683
(3.49) 1,744
(8.45) 1,904
(5.25) 2,010
CURRENT ASSETS
Stores, spare parts and loose tools 141
33.50 105
(8.12) 115
18.50 97
Stock in trade 865
67.84 515
(7.87) 559
(13.26) 645
Trade debts 548
(2.33) 561
34.54 417
18.15 353
Loans and advances 90
(53.44) 194
117.12 89
165.17 34
Trade deposits and short term prepayments 2
18.55 2
(33.47) 3
14.92 3
Other receivables -
(98.09) 9
18.37 7
(19.63) 9
Advance income tax - net 64 175.44 23 124.39 10 182.10 4
Cash and bank balances 25 71.25 14 (38.97) 24 175.37 9
Total current assets 1,735
21.87 1,423
16.26 1,224
6.28 1,152
Total assets 3,417
7.91 3,167
1.22 3,129
(1.05) 3,162
CURRENT LIABILITIES
Trade and other payables 244
33.84 182
19.99 152
13.49 134
Accrued mark up and interest 44
60.60 28
25.84 22
13.51 19
Short term borrowings 1,051
(0.17) 1,053
36.48 771
(0.13) 772
Current portion of
Long term financing 89
(16.49) 106
(68.32) 336
49.19 225
Long term financing from directors and others 250
0.00 -
0.00 -
0.00 -
Liabilities against assets subject to finance lease 14
21.42 11
1.39 11
338.78 3
Total Current Liabilities 1,692
22.57 1,380
6.82 1,292
12.07 1,153
WORKING CAPITAL 43
(0.26) 43
(164.11) (68)
8125.83 (1)
TOTAL CAPITAL EMPLOYEED 1,726
(3.41) 1,787
(2.72) 1,837
(8.58) 2,009
NON CURRENT LIABILITIES
Long term financing 143
123.20 64
(63.85) 178
(64.56) 502
Long term loan from directors and others -
(100.00) 500
0.00 500
0.00 500
Liabilities against assets subject to finance lease 16 (16.36) 19 (37.02) 31 1908.42 2
Deferred liabilities
Staff retirement benefits - gratuity 50 (4.38) 52 14.83 45 17.70 38
Deferred taxation 54 11.66 48 392.95 10 (87.16) 76
Total Non Current Liabilities 263 (61.50) 684 (10.44) 764 (31.68) 1,118
Net Worth 1,463 32.62 1,103 2.77 1,073 20.40 891
Net Worth Represented by:
Issued, subscribed and paid up capital 185 0.00 185 0.00 185 0.00 185
Reserves 1,277 39.20 918 3.36 888 25.75 706
1,463 32.61 1,103 2.78 1,073 20.40 891
Total liabilities 3,417 7.91 3,167 1.22 3,129 (1.05) 3,162
HORIZONTAL ANALYSIS(Rupees in million)
Annual Report 2010 15
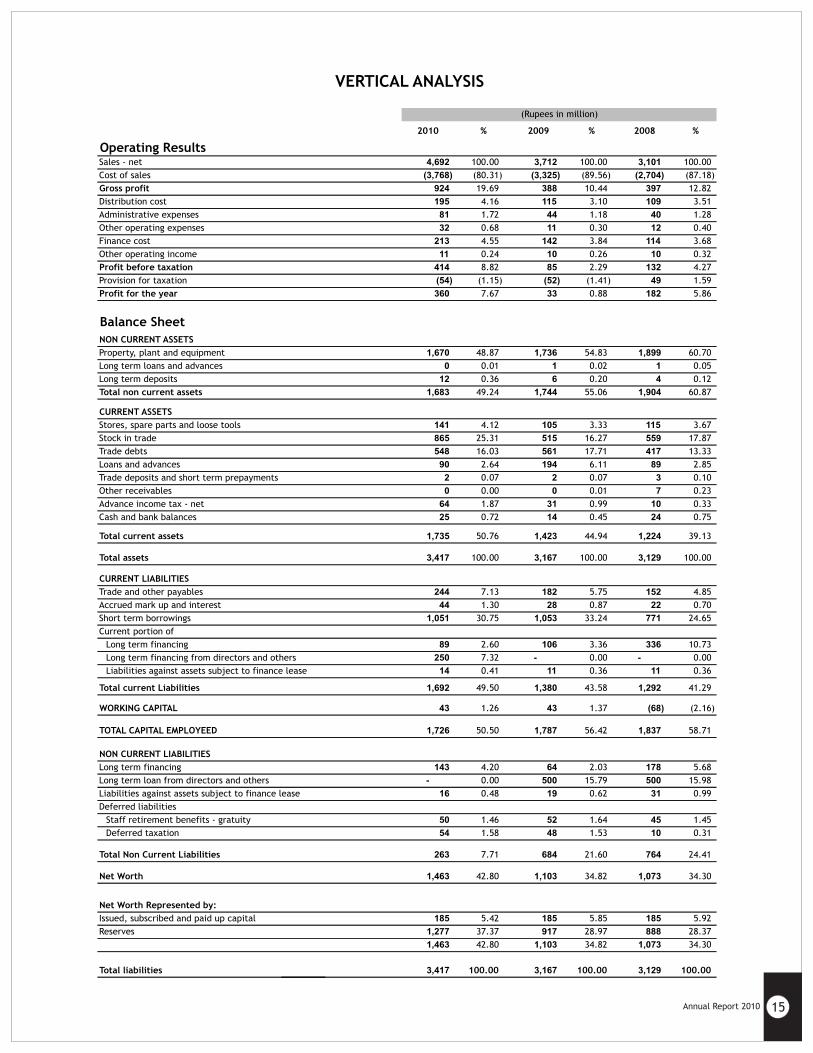
2010 % 2009 % 2008 %
Operating ResultsSales - net 4,692 100.00 3,712 100.00 3,101 100.00
Cost of sales (3,768) (80.31) (3,325) (89.56) (2,704) (87.18)
Gross profit 924 19.69 388 10.44 397 12.82
Distribution cost 195 4.16 115 3.10 109 3.51
Administrative expenses 81
1.72 44 1.18 40 1.28
Other operating expenses 32
0.68 11 0.30 12 0.40
Finance cost 213
4.55 142
3.84 114 3.68
Other operating income 11
0.24 10
0.26 10 0.32
Profit before taxation 414
8.82 85
2.29 132 4.27
Provision for taxation (54)
(1.15) (52)
(1.41) 49 1.59
Profit for the year 360
7.67 33
0.88 182 5.86
Balance Sheet
NON CURRENT ASSETS
Property, plant and equipment 1,670
48.87 1,736
54.83 1,899 60.70
Long term loans and advances 0
0.01 1
0.02 1 0.05
Long term deposits 12
0.36 6
0.20 4 0.12
Total non current assets 1,683
49.24 1,744
55.06 1,904 60.87
CURRENT ASSETS
Stores, spare parts and loose tools 141
4.12 105
3.33 115 3.67
Stock in trade 865
25.31 515
16.27 559 17.87
Trade debts 548
16.03 561
17.71 417 13.33
Loans and advances 90
2.64 194
6.11 89 2.85
Trade deposits and short term prepayments 2
0.07 2
0.07 3 0.10
Other receivables 0
0.00 0
0.01 7 0.23
Advance income tax - net 64
1.87 31
0.99 10 0.33
Cash and bank balances 25
0.72 14
0.45 24 0.75
Total current assets 1,735 50.76 1,423 44.94 1,224 39.13
Total assets 3,417
100.00 3,167
100.00 3,129 100.00
CURRENT LIABILITIES
Trade and other payables 244
7.13 182
5.75 152 4.85
Accrued mark up and interest 44
1.30 28
0.87 22 0.70
Short term borrowings 1,051
30.75 1,053
33.24 771 24.65
Current portion of
Long term financing 89
2.60 106
3.36 336 10.73
Long term financing from directors and others 250
7.32 -
0.00 - 0.00
Liabilities against assets subject to finance lease 14
0.41 11
0.36 11 0.36
Total current Liabilities 1,692
49.50 1,380
43.58 1,292 41.29
WORKING CAPITAL 43
1.26 43
1.37 (68) (2.16)
TOTAL CAPITAL EMPLOYEED 1,726
50.50 1,787
56.42 1,837 58.71
NON CURRENT LIABILITIES
Long term financing 143
4.20 64
2.03 178 5.68
Long term loan from directors and others -
0.00 500
15.79 500 15.98
Liabilities against assets subject to finance lease 16
0.48 19
0.62 31 0.99
Deferred liabilities
Staff retirement benefits - gratuity 50
1.46 52
1.64 45 1.45
Deferred taxation 54
1.58 48
1.53 10 0.31
Total Non Current Liabilities 263 7.71 684 21.60 764 24.41
Net Worth 1,463 42.80 1,103 34.82 1,073 34.30
Net Worth Represented by:
Issued, subscribed and paid up capital 185 5.42 185 5.85 185 5.92
Reserves 1,277 37.37 917 28.97 888 28.37
1,463 42.80 1,103 34.82 1,073 34.30
Total liabilities 3,417 100.00 3,167 100.00 3,129 100.00
VERTICAL ANALYSIS
(Rupees in million)
As the chairman of Din Textile Mills Limited, I feel pleasure to present the Annual Audited Accounts along with the auditor’s report there on for the year ended June 30, 2010.
Economic EnvironmentPakistan's economy witnessed yet another turbulent year. The impact of external factor was highly expected, but our difficulties were profound nevertheless. Despite a reported 9 percent decline in outward remittances from the AGCC countries in 2009, overall remittances were the major contributor to the economy. These have helped reduce current account deficit sharply as Pakistan received record remittances of dollar 9 billion. In 2010, Currency Market Associates (CMKA) is expecting a discount rate hike of 100 basis points and rupee could lose 6 percent of its value against dollar. Easing of inflationary pressure, helped the central bank to slash its discount rate by 250 basis points to 12.5 percent. CPI briefly touched the magical single digit figure. The fall was due to some efforts made by the central bank, as bigger factor in containing inflation was the base effect. No extraordinary steps were taken by the fiscal planners that could have left a lasting impact on inflation slowdown, which has started to creep up again. A cut in discount rate eased off pressure on 6-month Kibor that fell to 12.43 percent from the highs of 15.68 percent. And, six-month Treasury bill yield gained 190 basis points to close at a yield of 12.1 percent. Similarly, yield of 10-year government bond (most actively traded instrument) was dealt at a yield of 14.94 percent in January 2009. A sharp gain was witnessed on expectations of discount rate cut and demand from corporate sector that pushed yield to 11.44 percent before easing on fear of thin corporate demand in 2010. It closed at a yield of 12.65 percent. Recent economic indicators may suggest that Pakistan's economy has started shaping up well, but we have some legitimate doubts on the existence of such trends because we are unable to identify real economic gains. Inflation numbers may have dipped sharply, but the cost of doing business and prices of essential items continue to remain a worrisome factor.
CMKA is forecasting quite a mixed bag of economic growth, as the economy is dependent on foreign donors funding. A grave risk for 2010 lies in rising commodity prices, since oil and food could be the key factor and it has the potential to feed inflationary expectations. Export sector is unlikely to take a big stride unless some innovative measures are taken. To meet the fiscal deficit target and reduce government borrowing, banks will be encouraged to invest in T/bills and government bonds. Against the T/bills maturities of Rs 750 billion in the last two quarters of FY10, we are expecting increase in T/bills target amount to Rs 800 billion and additional target of Rs 30 billion in PIBs against zero maturity has already been announced. Therefore, a 3 percent GDP growth target would be tough, unless excess liquidity is made available to the banking system. Fiscal deficit is another key number to watch. In our view, a deficit target of 4.9 percent of the GDP set by the IMF is unfair and too demanding and is difficult to be met with the projected growth rate. This would continue to choke economy and hinder growth prospects in private sector while pressure will mount on the revenue target. Domestic debt and external debt are the major cause of concern.
Inflation risk has re-emerged, which could once again put pressure for a discount rate hike, as we see fiscal year end y-o-y CPI inflation surpassing 13 percent. We are expecting a 3 to 4 percent surge in inflation numbers by the end of June. There is a growing fear that with the surge in global growth, demand for food will increase, pushing food prices higher. Similarly, global growth will create more demand for oil, which would push oil prices higher. An average price of oil beyond dollar 80 per barrel will not be sustainable for our economy. Hence, the need for an oil hedging strategy. Another inflationary factor that needs to be checked quickly is constant growth in currency in circulation.
16 Din Textile Mills Limited
Chairman's Review
Despite a sharp fall in the current account deficit and record home remittances rupee lost 6.5 percent of its value against dollar to close at 84.24. On January 01, 2009, one dollar would fetch Rs 79.1. It is understandable that as long as the large part of foreign exchange reserves consists of borrowed money, external debt keeps on piling up and exports growth remains quite disappointing, the rupee is bound to come under pressure. Since we do not see high export growth prospects, a broader risk to rupee could arise from rising commodity prices in the international market that could ultimately exert pressure on the current account deficit. Therefore, in the first two quarters of 2010, rupee is likely to lose its gloss against dollar by two percent, and another four percent by the end of December. Trade and current account deficits. A substantial fall in current account deficit in the last five months is very encouraging. This was possible due to a significant fall in imports and a one-third rise in remittances. The fall in import of food items was mainly helped by drop in wheat import.
Textile sector, which is considered as the backbone of economy and a flagship of exports, has once again failed to cope up with the pace due to numerous negative factors, which needs quick attention. Since textile contributes over 60 percent of the overall export target, we expect a drop in net export target of dollar half billion to one billion. CMKA is optimistic about home remittances are most likely to surpass dollar 9 billion. FDI is unlikely to make big strides for the second consecutive year and may remain around dollar two billion. Therefore, the current account deficit for FY09-10 would be close to dollar three billion.
Textile Out LookThe Pakistan textile industry contributes more than 60 percent (US $ 9.6 billion) to the country’s total exports. However, currently this industry is facing great decline in its growth rate. The major reasons for this decline can be the global recession, internal security concerns, the high cost of production due to increase in the energy costs etc. Depreciation of Pakistani rupee that significantly raised the cost of imported inputs, rise in inflation rate, and high cost of financing has also effected seriously the growth in the textile industry. As a result neither the buyers are able to visit frequently Pakistan nor are the exporters able to travel abroad for effectively marketing their products. With an in-depth investigation it was found that the Pakistan’s textile industry can once again be brought back on winning track if government takes serious actions in removing or normalizing the above mentioned hurdles. Additionally, the government should provide subsidy to the textile industry, minimize the internal dispute among the exporters, withdraw the withholding and sales taxes etc. Purchasing new machinery or enhancing the quality of the existing machinery and introducing new technology can also be very useful in increasing the research & development (R & D) related activities that in the modern era are very important for increasing the industrial growth of a country.
The Pakistan textile industry total export is around 9.6 billion US dollars. The textile industry contributes approximately 46 percent to the total output or 8.5 percent of the country GDP. In Asia, Pakistan is the 8th largest exporter of textile products providing employment to 38 percent of the work force in the country. However, the textile industry currently faces massive challenges. Textile Mills needs to enhance the quality of its products. However, the other factors such as high interest rates and cost of inputs, non conducive government policies, and non-guaranteed energy supplies hinder their competitiveness.
Pakistan’s textile has been the one of the top five cotton producers in the world for the past few decades. The opportunity to build on its strength, is matched by internal counter currents which have incredibly diminished Pakistan’s Global Textile relevance quite effectively. Other countries have moved on, and in fact been able to capitalize on lack of competitive challenge posed by Pakistan. Countries that have been able to buy Pakistani cotton and yarn have emerged as winners, while the entire domestic textile sector has been experiencing a roller coaster ride of sorts. Ironically, the recent cotton price spike, further perpetuates the lack of competitive positioning while a short term windfall is harvested. Once again at an economic cross road of opportunity, the country can take some proactive steps to set up medium and long term success.
As a global cotton demand is confronted with a transition due to China migrating significant hectors to food and premium crops, Pakistan has an opportunity to fill the vacuum but needs to switch to GM/BT sowing cotton significantly and immediately. Shifts to these varieties are already in place in the US, China and India. Pakistan has been lagging behind in adoption due to political issues. A 5 percent yield increase can cause Pakistan to be part of the new equilibrium solution and comes at a great time when prices are up. In fact if this switch had been made already, as it should have been over the past few years aggressively, the country would have already more fully benefited due to the pricing surge. Instead, it remains mired in political and economic arm-wrestling competition between the government, large land holders and international seeds suppliers on the cost, benefits and timing while profits are vaporizing every year.
Annual Report 2010 17
Labor Force development, which creates an educated work force at the vocational level and management level in all provinces are critical. Recent demographic changes in the labor forces in India and China in terms of age, mobility and importantly cost increases, make the Pakistani labor competiveness more relevant, provided the challenge of productivity are ready to be met. Infrastructure of education needs a priority which is as equal, if not, more than the security situation. Population is a combustible asset or a liability which can match any security or nuclear priority. A provincial ring of textile educational institutes which target vocational, management and research needs for the industry needs significant investment to match global best in class. A private public partnership to drive this is very important.
Marketing ActivitiesPakistan’s foreign trade policy needs to seek access not just to US and EU market places but aggressively position itself in Asia, Latin America and Africa. One can argue that trade access to countries like Brazil, China, South Africa etc. can deliver better return on time invested vs. the effort some of the western countries require. Also accelerating the relevance of SAFTA ahead of even political resolutions can provide Pakistan the economic benefit in textiles which can form a part of the political leverage for the future. Currently inbound duty structures in ASEAN prefer India over Pakistan. Through ASEAN, China is also giving duty free access to certain countries in Asia in 2010 and at the same time ramping down duties for other like India while Pakistan holds on to its own FTA which is less compelling. Bottom line is that Pakistan needs to join trade blocks not just negotiate one on one deals.
The cotton yarn crisis cropped up late last year when global cotton production stood less by around 5 percent against the total demand. China and United States being the largest producers of cotton witnessed major shortfall in their production. Consequently, world cotton prices, which were initially being quoted below 50 cent per lb. began to move up and touched highest level over 90 cent per lb. Similarly, raw cotton prices in the domestic market also surged to historic high level of over Rs 6,600 per maund. This resulted in shortage and high prices of cotton yarn in domestic market, which deprived the downstream textile industry of its basic raw material.
In this market scenario your company achieved sales volume of 15.467 million Kgs of different counts of cotton and blended yarn as against sale of 17.443 million Kgs of yarn during last year, there by selling 11.32% Less than previous year. Decrease in sale volume was due to imposition of Quota and 15% Regulatory Duty on Export of yarn and stagnancy of yarn market backed with price sensitivity. Less than targeted production of cotton crop worldwide resulted in higher prices of raw material and cotton was procured at relatively higher prices in the current year as compared to corresponding year. least. We saw some very attractive pricing off and on during the year for a very short span of time, the gross profit margin of our company increased to 19.63% from 10.44% in last year.
Operational ReviewIt is essential for our operation that we ensure long term availability of a reliable supply of raw material. This is achieved through development of long lasting, mutually beneficial relationships with our supplier and other commercial Partners to secure raw material sources. Generating optimal returns from large scales commodity manufacturing requires firm control over cost and other risks to preserve values. Getting Maximum yield from our raw materials is essential for running a high margin operation and we accomplish this by focusing on innovative manufacturing techniques and minimizing wastage in manufacturing process. we rely on our team of highly skilled and motivated people to develop. manufacture and sell a wide range of products to customers in domestic and international markets.
During the year under review, your company produced 19.358 Million Kgs of Yarn as against production of 19.687 Million Kgs during the last year; thereby achieving an average capacity utilization of 92.75% as against 94.32% during previous year. 59,704 out of 61,728 spindles remained operational during the year which attained 96.72% utilization of installed capacity as against 59,254 working spindle having 95.99% utilization of installed capacity in last year.
The Annual production and yield targets are achieved. This allowed us to meet enhanced market demand in spite of excessive nationwide load shedding of electricity and gas. The management team of your company emphasized the need to be strategically prepared for emergency and crises situations, such as energy crisis.
18 Din Textile Mills Limited

Financial ReviewCompany made considerable strides in its endeavors to establish and promote a cost conscious culture in all facets of the business with Increase of 69.60 % in Distribution cost, 84.84% in Administrative expenses, and 49.78% in Financial cost , as compare to the figure of previous year while increase in inflation have major effective on Cost and Profitability of the business, company managed to grow sales by 26.38% in an increasingly competitive market.
During the year under review, company achieved sales volume of Rs. 4.692 billion as compared to Rs.3.712 billion during the last year. The gross profit earned during the year 921 million as against Rs.388 million during the previous year, thus Increase in the gross profit by 137.70 %. The Increase in gross profit is mainly due to increase in export sales and operating cost by increase in mandatory wage rate and spiraling price hikes in energy cost.
In case of cost of sale our cost base remained under intense pressure on account of many factors including material cost increase driven by high inflation, rupee devaluation rising a commodity and oil prices as well as a sharp increase in energy cost. Furthermore, sever power shortage forced extensive use of generators adding substantially to our cost during the year. We, however have mitigated a parts of these effect through various productivity measures which has helped us to come out with improved financial results despite the adverse conditions.
DividendYour Directors are pleased to Propose cash dividend of 20% i.e Rs. 2 per share of Rs. 10 each and bonus shares of 10 % i-e Rs. 1 per share of Rs. 10 each of the issued and paid-up capital of Rs. 185,303,210.
Contribution To National EconomyBeing a responsible and active member of the corporate community Din Textile always contributed towards national economy on account of taxes and other levies. During this year your company paid 196.607 million as cost of financing and contribute to the foreign reserve of country US $ 20.052 million as direct export sales. The benefits of increased growth profitability of our operations also accrued to the government in term of tax payment. The company paid Rs. 72.854 million in shape of taxes .
Research & DevelopmentKeeping pace with the ever growing customer's need we are regularly investing in state of the art technology, plant and equipment, training of human recourses, and diversification to new products as a part of our strategy to bring organic growth in the base business and grow in high growth market and segments. The invest portfolio of the company has been realigned as per changing market needs. Our flexible and dynamic corporate strategy strive to enhance customer satisfaction through continuous improvement and value added benefits. Our range of products is constant over the years, we have come up with significant innovations in our product line, which have added value to our products for different segments. Your company is not only equipped with R&D facilities at every site of business, but also has a continuous interaction with the customers for their feedbacks. We strongly believe in regular and continuous vigilance on products improvement and have always been it comes to introduction of new products in the markets.
Information Technology Information Technology is considered the back bone of our company. Your company is highly vigilant in deploying the same technical development, which take place around the world and are inline with the strategic pathway and long term vision of the company. Our IT department believes in providing quality and timely support to all of the operating business areas of the company to enhance their productivity, effectiveness and decision making capabilities to support consistent growth of the company.
Health, Safety and EnvironmentA strong culture of health and safety is essential for a company that wants to be successful, and we are no different. We know that the health and safety of our people is of paramount importance, as is the safety of our processes and the sanctity of environment. we have worked consistently over the years to put in place a strong Health Safety and Environment system which continuous to evolve. Our goal to increase stake holders' value by delivering sustainable solutions to our customers as this is critical to the success of our company. To achieve this we work on sustainable business operation concept to meet our needs today while protecting resources and right for our Health safety and environment performance through leadership commitment, dedicating of our staff and application of professional standard in our work.
Annual Report 2010 19
20 Din Textile Mills Limited
Din Textile does not believe in making profit at the cost of damage to our environment. We proactively fund and support environmental protection activities in our communities in particular and on national level generally. Our business complete the whole year without any lost time injury and reportable occupational illness to employee and supervised contractors.
HR Management and Employment RelationsIn line with our company values developing the talents of our people, we provide development opportunities through cross functional exposures. Capability groups within the organization have been formed to ascertain bench strength in each functional area and plan future career roadmap for our key talent. This ensures a strong line of succession within the organization, in areas of commercial, technical, finance and HR.
Our company wide talent management system identifies, develops and sustain the flow of talent to ensure that we have right people in the right job at the right time. The company strives to provide its employees competitive remuneration packages and an enabling corporate environment with ample learning opportunities to develop technically professionally and personally. For the Talent management system to really take shapes, we concentrate on these three principals.
1- Leadership. 2- Talent Development. 3- High Performance Culture.
Corporate Social ResponsibilityWe work with the Government and other organizations to meet our legal and civic obligations and contribute towards the development of country's economy. We strive to be good corporate citizen by being and active member of society and through our contribution towards society in various roles. We are committed to our communities as we are to our customers, shareholders and employees. Social responsibility is way of life at Din Textile. we recognize that we cannot have a healthy and growing business unless the communities we serve are healthy and sustainable. We have long history of community investment that 's evolved to meet the complexities and challenges of a developing society. We support a broad range of initiatives in the area of education health and environment protection as we believe they provide the fundamental building principals for the development of society. At Din Textile, there is never any compromise on being anything less than an exemplary corporate citizen.
Good governess for us is not an exercise to comply with regulatory requirements. We aim to go beyond what is required of us in rules and regulations. Corporate governance is constant review and evaluation of all aspects of our operations, our strategy and the way we conduct our business. The company fully complies with SECP's code of Corporate Governance and Din Group Polices.
Future OutlookProspects of a global recovery in 2010 remain mixed. However, debate on an end to the monetary and fiscal stimuli and servicing the mounting public debts in the US and Euro zone weigh heavily on the shape of this recovery and hence the uncertainty. on the domestic front, there are too uncertainty about macro economic stability . However this hard gained recovery is threatened by the pressure building up on the fiscal account, further increase in energy shortage, persistent inflation and unease on the continued security incident. Business environment is therefore expected to remain tough in 2011.
The deadly flash of flood that swept across the lands of Pakistan has wiped off the country's positive expectations regarding cotton. A grim reminder of danger in wilderness has destroyed more than 3 million bales of cotton crops, and the Government is powerless to achieve its target of 14 million bales of annual production. Due to this, Pakistan, being Asia's fourth largest producer of cotton is likely to fall back by 10-15% of its cotton production. Most of the agriculture being done on the banks of rivers, the extent of damage was more in these localities. The heavy deluge that swamped through the cotton fields, threatened the commodity's production causing it to slump. Incessant downpour has damaged the fields in Piplan Layyah, Mianwali, and Mithankot. Regions in the Central Punjab such as Rajanpur, Layyah, Rahimyar Khan, and DG Khan were seriously affected losing thousands of bales of cotton crop. Areas of Ghotki, Daherki, Sukkar, and Naushehro Feroz, Bhakkar, Jhang, Shorkot, and Mianwali were also affected by flood.

Annual Report 2010 21
Pakistan Government fixed the annual export target as $ 21 billion. With the production targets being spoiled by the current catastrophe, it has become impossible doing so. The country's textile sector will bear a burden of more than $900 million on the cotton imports from US, Brazil, and India. Export of cotton during 2009 August till 2010 July was 908, 100 bales while 320, 000 bales of cotton were imported during the same period. During 2010-11, Pakistan was expecting an increase of 2.5-3.0 million bales in production, over the previous year's production of 12.7 million bales. As per the declaration of Pakistan Cotton Ginners Association (PCGA), BT cotton variety sown in Sindh and Punjab were severely affected due to rain, and the resulting floods. Traders expect a relief package to cotton farmers and compensation for the ginners for losses incurred due to flood.
Estimates state that losses due to rain are marked about 2 million bales. There is also no guarantee that the remaining cotton in fields will have good quality. Pakistanis who import cotton are seeking to approach cotton producers from around the world. Textile made-up exporters and manufacturers are positively expecting to get cotton on easy terms. Industry analysts predict that, despite formal permission not being given, EU, and US might allow free access of textile products from Pakistan.
Under these very difficult challenges, your Company remains committed to business growth and opportunity for new investment. Meanwhile we draw the attention of the Government on issues requiring policy interventions in order to safeguard the existing industrial base, revive economic growth and attract productive investment.
AcknowledgementThe directors are always a source of guidance and support for the management and we appreciate their commitment to your company's progress and prosperity. Your Company maintained it strong position, with a healthy balance sheet while meeting stakeholders' expectations. The performance of the Company is a strong evidence of the contribution our employees makes towards the Company in difficult times. Your Company's performance as reflected in the improved results for the year under review would not have been possible without the contribution of our committed employees devoted customers and continued support received from the supplier and contractors.
The Board would like to thanks all stakeholders for their valuable support and untiring efforts, which enables the Company to achieve this performance. At the end, I would like to state here that we are confident that we will continue to lead textile industry responsibly and will endeavor to maintain the growth momentum in our performance. Please join me in praying Almighty Allah to give us the courage and wisdom to face the challenges ahead and to work even harder for the prosperity of the company and its stake holders.
on behalf of the Board.
S.M. MuneerChairman / Chief Executive
22 Din Textile Mills Limited
Financial Result
Profit & Loss Appropriations
2010 2009
Un-appropriated Profit brought forward 506,990
477,361
Profit after Tax 359,879 32,547
Dividend for the year 2008 @Rs. 1 per share - (2,918)
Un-appropriated Profit carried forward 866,869 506,990
Earning Per share 19.42 1.76
Chairman's Review
The Directors of the company endorse the contents of the Chairman's Review which covers review
of business and operations, outlook and investment plans for strategic growth.
Operational Performance
Increase /
2010 2009 (Decrease)
%age
Total Sales 4,691,884 3,712,392 26.38
Local Sales 1,473,565 2,296,220 (35.83)
Export Sales 3,218,320 1,416,172 127.25
Gross Profit 923,984 387,514 138.44
The Directors are pleased to present the 2010 Annual Report togather with the audited Financial
Statements of the Company for the year ended June 30, 2010.
Year ended June 30
Year ended June 30
(Rupees in Thousands)
(Rupees in Thousands)
Directors’ Report
Financial Management
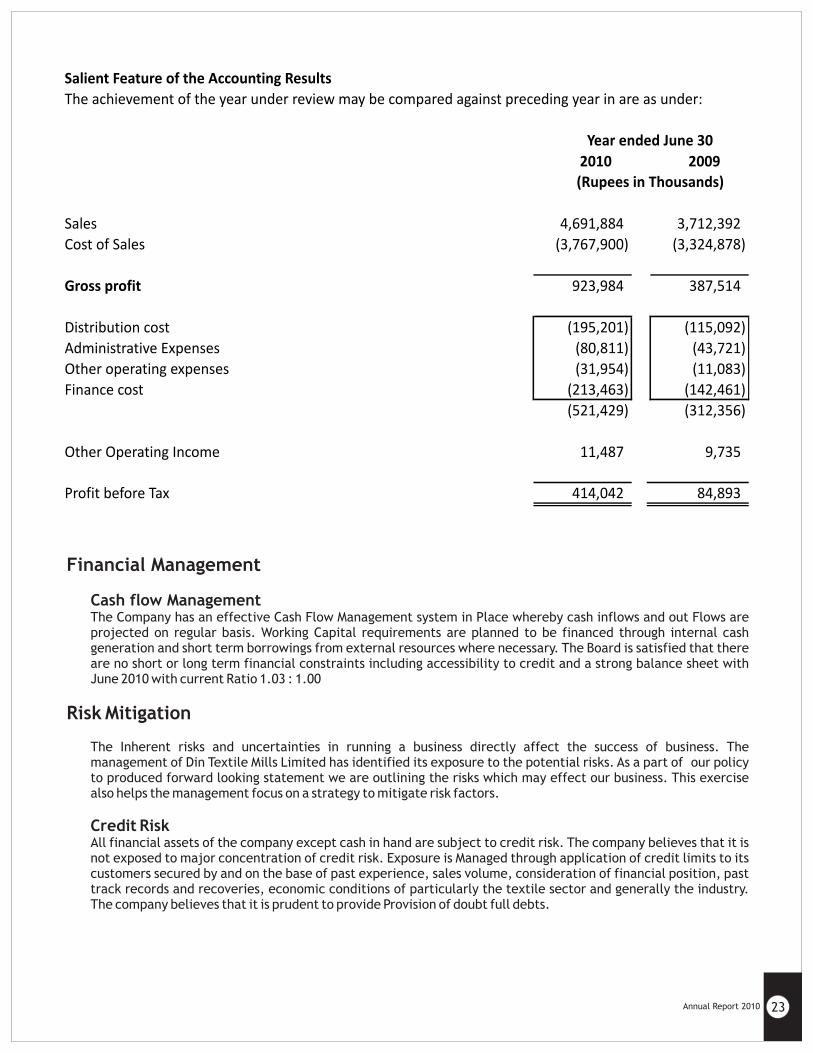
Cash flow ManagementThe Company has an effective Cash Flow Management system in Place whereby cash inflows and out Flows are projected on regular basis. Working Capital requirements are planned to be financed through internal cash generation and short term borrowings from external resources where necessary. The Board is satisfied that there are no short or long term financial constraints including accessibility to credit and a strong balance sheet with June 2010 with current Ratio 1.03 : 1.00
Risk Mitigation
The Inherent risks and uncertainties in running a business directly affect the success of business. The management of Din Textile Mills Limited has identified its exposure to the potential risks. As a part of our policy to produced forward looking statement we are outlining the risks which may effect our business. This exercise also helps the management focus on a strategy to mitigate risk factors.
Credit RiskAll financial assets of the company except cash in hand are subject to credit risk. The company believes that it is not exposed to major concentration of credit risk. Exposure is Managed through application of credit limits to its customers secured by and on the base of past experience, sales volume, consideration of financial position, past track records and recoveries, economic conditions of particularly the textile sector and generally the industry. The company believes that it is prudent to provide Provision of doubt full debts.
Annual Report 2010 23
Salient Feature of the Accounting Results
The achievement of the year under review may be compared against preceding year in are as under:
2010 2009
Sales 4,691,884 3,712,392
Cost of Sales (3,767,900) (3,324,878)
Gross profit 923,984 387,514
Distribution cost (195,201) (115,092) Administrative Expenses (80,811) (43,721) Other operating expenses (31,954) (11,083) Finance cost (213,463) (142,461)
(521,429) (312,356)
Other Operating Income 11,487 9,735
Profit before Tax 414,042 84,893
Year ended June 30
(Rupees in Thousands)

Liquidity RiskPrudent liquidity risk management ensures availability of the sufficient funds for meeting contractual commitments. The Company's fund management strategy aims at managing liquidity risk through internal cash generation and committed credit lines with financial institutions. Through internal cash generation and committed credit lines with financial institutions.
Interest Rate Risk Majority of the interest rate exposure arises from short and long term borrowing from banks and term deposits and deposits in PLS saving accounts with banks. Therefore, a change in interest rates at the reporting date would not effect the profit and loss accounts.
Foreign Exchange Risk.Foreign currency risk arises mainly where receivables and payables exist due to transaction in foreign currencies. The company is mainly exposed to short term USD/ PKR parity on its imports of raw material and Plant and Machinery.
Production facilities.Performance of our production facilities was excellent with unprecedented levels of output. Our team continued to improve efficiencies through harmonized efforts, eliminating wastage and avoidance of shutdowns on numerous occasions. The Company is determined to continue its focus on maximum capacity utilization for sustained profitability and to maintain its position as the leading Textile Manufacturer of the Country.
Related PartiesThe Board of Directors have approved the policy for transaction/contract between company and its related parties on an arm's length biases and relevant rates are to be determined as per the comparable un controlled price methods. The Company has fully comply with the best practices of transfer pricing as contained in the listing regulation of Stock Exchanges.
Corporate GovernanceYour company is committed to maintain high standard of good corporate governance without any exception. The Directors are pleased to state that your company is compliant with the provision of the Code of Corporate Governance as required by SECP and formed as part of stock exchanges listing regulations. Statement of Compliance with Code of Corporate Governance is Annexed
Disclosures under Code of Corporate GovernanceCorporate and Financial Reporting Framework
a)- The financial statements prepared by the management of the company, fairly present state of its affairs, the result of its operations, cash flows and changes in equity.
b)- Proper books of accounts of the company have been maintained.
c)- Appropriate accounting policies have been consistently applied in preparation of financial statement and accounting estimate are based on reasonable and prudent judgment.
d)- International Accounting Standards, as applicable in Pakistan, have been followed in preparation of financial statements and any departure therefrom has been adequately disclosed.
e)- The System of internal control and other such procedure which are in place, are being continuously reviewed by the Internal Audit Function. The Process of Review will continue and any weakness in control will be removed.
f)- There are no significant doubts upon the company's ability to continue as a going concern.
g)- There has been no deviation from the best practices of corporate governance as detailed in the Listing Regulations.
24 Din Textile Mills Limited
Annual Report 2010 25
h)- Key operating and financial data for last six years in summarized form annexed.
i)- The outstanding statutory duties, taxes, charges and levies, if any have been fully disclosed in the financial statements.
j)- The significant plans and decisions along with futures prospects have been outlined in the Chairman's Review.
Board of DirectorsConsequent to the approval by the board of Directors and share holders in the Annual General Meeting for the increase in directors remuneration, The Directors' remuneration was increased with effect from July 01, 2009. the Total remuneration during the year was increased by Rs. 32.085 million.
The Board of Directors comprises of 4 Executive Directors and 3 Non Executive Directors. Current member of the Board of Directors have been listed in the company information.
The Directors wish to report the following change in the Board of Directors:On December 26, 2009 Mr. S. M. Naseer resigned from the Board. To fill the vacancy Mr. S. M. Imran was appointed on the Board with effect from December 27, 2009 for the remainder of the term to expire on March 13, 2010. All the Ten Directors Retired and Re-ellected in Extra-ordinary general meeting held on 13-03-2010. Number of Directors reduced to 7 from 10 in Extra Ordinary General Meeting held on the retirement of all Directors and 7 Directors are re-ellected in the same meeting for the term of 3 years. The Board would like to thanks the outgoing Directors and Well come to new Directors.
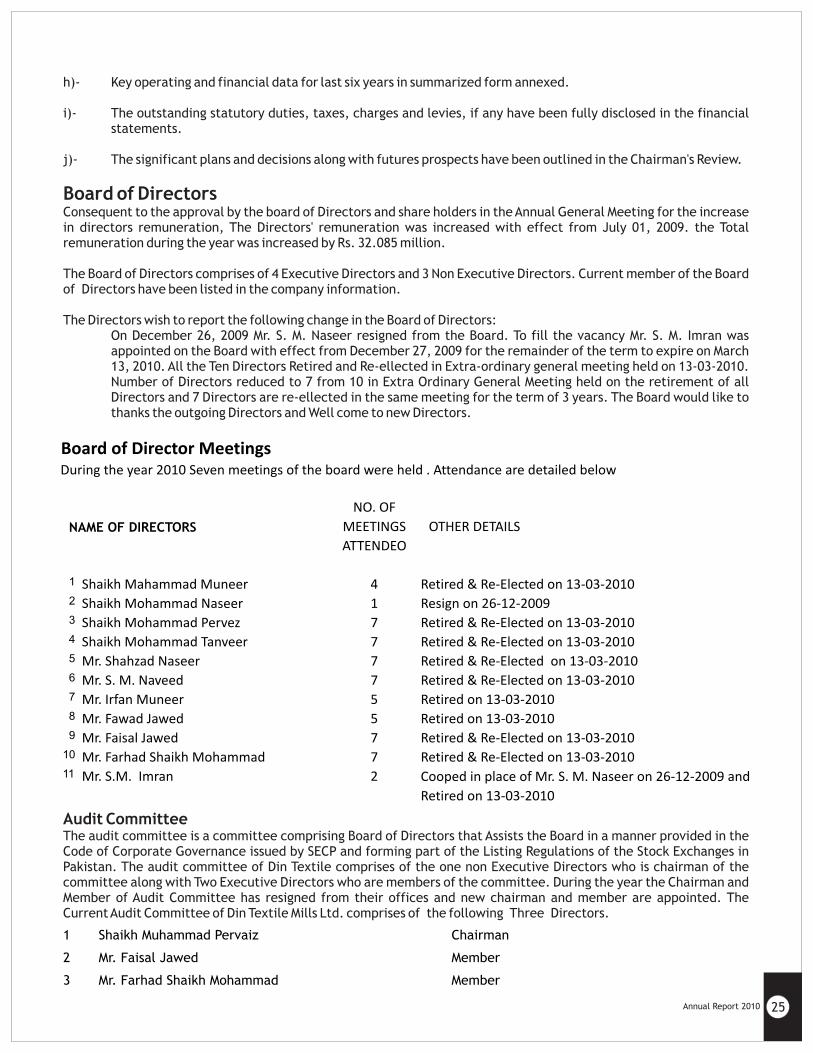
Audit CommitteeThe audit committee is a committee comprising Board of Directors that Assists the Board in a manner provided in the Code of Corporate Governance issued by SECP and forming part of the Listing Regulations of the Stock Exchanges in Pakistan. The audit committee of Din Textile comprises of the one non Executive Directors who is chairman of the committee along with Two Executive Directors who are members of the committee. During the year the Chairman and Member of Audit Committee has resigned from their offices and new chairman and member are appointed. The Current Audit Committee of Din Textile Mills Ltd. comprises of the following Three Directors.
Board of Director MeetingsDuring the year 2010 Seven meetings of the board were held . Attendance are detailed below
NAME OF DIRECTORS
NO. OF
MEETINGS
ATTENDEO
1 Shaikh Mahammad Muneer 4 Retired & Re-Elected on 13-03-20102 Shaikh Mohammad Naseer 1 Resign on 26-12-20093 Shaikh PervezMohammad 7 Retired & Re-Elected on 13-03-20104 Shaikh Mohammad Tanveer 7 Retired & Re-Elected on 13-03-20105 Mr. Shahzad Naseer 7 Retired & Re-Elected on 13-03-20106 Mr. S. M. Naveed 7 Retired & Re-Elected on 13-03-20107 Mr. Irfan Muneer 5 Retired on 13-03-20108 Mr. Fawad Jawed 5 Retired on 13-03-20109 Mr. Faisal Jawed 7 Retired & Re-Elected on 13-03-2010
10 Mr. Farhad Shaikh Mohammad 7 Retired & Re-Elected on 13-03-201011 Mr. S.M. Imran 2 Cooped in place of Mr. S. M. Naseer on 26-12-2009 and
Retired on 13-03-2010
OTHER DETAILS
Chairman
Member
Member
Shaikh Muhammad Pervaiz
Mr. Faisal Jawed
Mr. Farhad Shaikh Mohammad
1
2
3
The committee held four meetings during the year in which external auditors were present to assist the committee on matter relating to financial accounting and reporting. The quarterly , half yearly and annual accounts of the company along with any public announcement relating to them; were reviewed and were recommended by the committee before approval by the Board. Such review sextend to major areas of judgment reflected in the accounts, significant adjustments resulting from audit of accounts the going concern assumption, changes in accounting policies and practices, compliance with applicable accounting standards, listing regulation, and statutory requirements.
The Audit Committee function within the scope of the term of reference approved by the Board, which determine the roles and responsibilities of committee and reflect the requirement of the Code of Corporate Governance. The role and responsibilities of Audit Committee include determining appropriate measure to safeguard the company's assets, reviewing quarterly, half yearly, and annual financial statements of the company and preliminary announcements of result before approval by the Board and publication, reviewing the company's statement of inter controls system prior to their approval by the Board, reviewing the external auditors letter to management and its response there to, monitoring compliance with best practices of corporate governance and instituting special projects and investigations on any matter deemed appropriate by the committee or desired by the board.
The audit committee assists the Board of Directors in monitoring the framework of managing business risk and internal control. The committee seeks assurance on the measures taken by the management in identification, evaluation and mitigation of relevant business risk. It also monitors the performance of the internal audit function which adopts a risk based approach for planning and conducting business process, audits consistently with the company's established work practices. The scope and extent of internal audit including the annual internal audit plan, are reviewed and approved by the committee, which also regularly monitors the progress. While the external auditor independently determine their plan of audit, the committee is informed of their progress and especially in regard to issues stated in their letter to management and responses received. Without interfering with the independence of the External and Internal auditors, the committee encourages coordination between then in the discharge of their respective function. The committee recommend to the Board the Appointment of External Auditor and their engagement terms based on the Committee's review of their performance and value provided to the company.
AuditorsStatutory Audit for the company for the financial year ended June 30, 2010 has been concluded and the auditors have issued their Audit Report on the company's Financial Statements, and the Statement of Compliance with Code of Corporate Governance. The Auditors Messrs.' Mushtaq & Company , Chartered Accountants, Karachi, shall retire at the conclusion of annual general meeting and they have indicated their willingness to continue as Auditors. They have confirmed achieving satisfactory rating by the Institute of Chartered Accountant of Pakistan (ICAP) and compliance with the Guideline on the Code of Ethics of the International Federation of Accountants (IFAC) as adopted by ICAP. The Board proposed their reappointment as auditor for the financial year ended June 30,2010 the engagement partner will be rotated in line with the requirement of Code of Corporate Governance.
ShareholdingThe pattern of shareholding as at June 30,2010 along with disclosure as required under Code of Corporate Governance, is annexed.The Directors, Chief Executive Officer, Chief Financial Officer, Company Secretary, and their spouses and minor children, have reportedly carried out no trading in the shares of the Company.
AcknowledgementYour Company maintained its strong position, with a healthy balance sheet while meeting stakeholders' expectations. The performance of the Company is a strong evidence of the contribution our employees make towards the success of the Company in difficult times. Your Company's performance as reflected in the improved result for year 2010 would not have been possible without the contribution of our committed employees, devoted customers and continued support received from supplier and contractors. The Board would like to thanks all stake holders for their valuable support and untiring efforts which enables the Company to achieves this performance.
On behalf of the Board
Chairman / Chief ExecutiveS. M. Muneer
26 Din Textile Mills Limited
Annual Report 2010 27
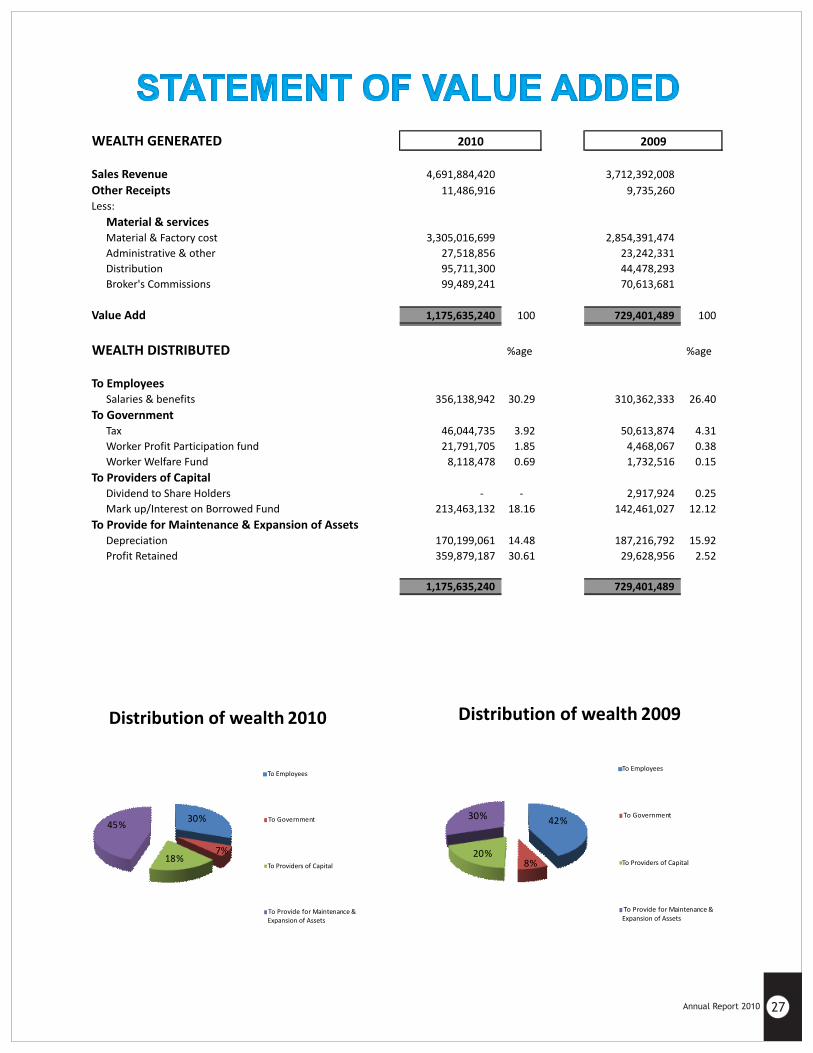
WEALTH GENERATED
Sales Revenue 4,691,884,420
3,712,392,008
Other Receipts 11,486,916
9,735,260
Less:
Material & servicesMaterial & Factory cost 3,305,016,699
2,854,391,474
Administrative & other 27,518,856
23,242,331
Distribution 95,711,300
44,478,293
Broker's Commissions 99,489,241
70,613,681
Value Add 1,175,635,240
100
729,401,489
100
WEALTH DISTRIBUTED %age %age
To EmployeesSalaries & benefits 356,138,942
30.29
310,362,333
26.40
To GovernmentTax 46,044,735
3.92
50,613,874
4.31
Worker Profit Participation fund 21,791,705
1.85
4,468,067
0.38
Worker Welfare Fund 8,118,478
0.69
1,732,516
0.15
To Providers of CapitalDividend to Share Holders -
-
2,917,924
0.25
Mark up/Interest on Borrowed Fund 213,463,132
18.16
142,461,027
12.12
To Provide for Maintenance & Expansion of AssetsDepreciation 170,199,061
14.48
187,216,792
15.92
Profit Retained 359,879,187 30.61 29,628,956 2.52
1,175,635,240 729,401,489
2010 2009
42%
8%20%
30%
Distribution of wealth 2009
To Employees
To Providers of Capital
Expansion of Assets
30%
7%18%
45%
Distribution of wealth 2010
To Employees
To Providers of Capital
Expansion of Assets

Year ended June 30,
28 Din Textile Mills Limited
Cash Flows from / (Used in) 2010 2009 2008 2007 2006
Nine Month
Ended June 30,
2005
operation activities 307,799
86,975
285,259
52,947
372,912
(31,580)
investing activities (106,580) (23,352) (47,239) (91,813) (153,753) (1,424,831)
financing activities (189,116)
(354,138)
(222,019)
(66,087)
(151,705)
1,170,078
Net Cash Flows 12,103
(290,515)
16,001
(104,953)
67,454
(286,333)
Opening Cash and Cash Equivalents (1,038,163)
(747,648)
(763,649)
(658,695)
(726,149)
(439,816)
Closing Cash and Cash Equivalents (1,026,059) (1,038,163) (747,648) (763,648) (658,695) (726,149)
(Rupees in Thousands)
(1,500,000)
(1,000,000)
(500,000)
-
500,000
1,000,000
1,500,000
2010 2009 2008 2007 2006 Nine Month Ended June
30, 2005
operation activities
investing activities
financing activities
Annual Report 2010 29
(Times)
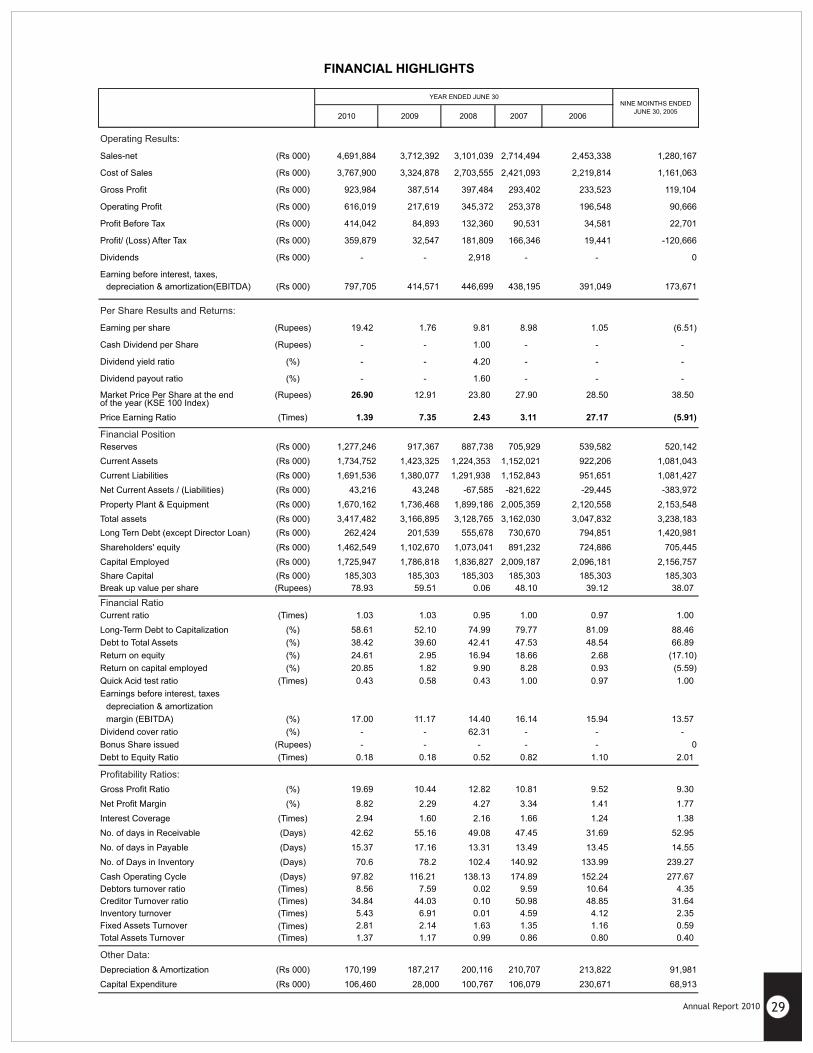
2010 2009 2008 2007 2006
Operating Results:
Sales-net (Rs 000) 4,691,884 3,712,392 3,101,039 2,714,494 2,453,338 1,280,167
Cost of Sales (Rs 000) 3,767,900 3,324,878 2,703,555 2,421,093 2,219,814 1,161,063
Gross Profit (Rs 000) 923,984 387,514 397,484 293,402 233,523 119,104
Operating Profit (Rs 000) 616,019 217,619 345,372 253,378 196,548 90,666
Profit Before Tax (Rs 000) 414,042 84,893 132,360 90,531 34,581 22,701
Profit/ (Loss) After Tax (Rs 000) 359,879 32,547 181,809 166,346 19,441 -120,666
Dividends (Rs 000) - - 2,918 - - 0
Earning before interest, taxes,
depreciation & amortization(EBITDA) (Rs 000) 797,705 414,571 446,699 438,195 391,049 173,671
Per Share Results and Returns:
Earning per share (Rupees) 19.42
1.76
9.81
8.98
1.05
(6.51)
Cash Dividend per Share (Rupees) -
-
1.00
-
-
-
Dividend yield ratio (%) -
-
4.20
-
-
-
Dividend payout ratio (%) -
-
1.60
-
-
-
Market Price Per Share at the end (Rupees) 26.90
12.91
23.80
27.90
28.50
38.50of the year (KSE 100 Index)
Price Earning Ratio (Times) 1.39
7.35
2.43
3.11
27.17
(5.91)
Financial Position
Reserves (Rs 000) 1,277,246 917,367 887,738 705,929 539,582 520,142
Current Assets (Rs 000) 1,734,752 1,423,325 1,224,353
1,152,021 922,206 1,081,043
Current Liabilities (Rs 000) 1,691,536 1,380,077 1,291,938
1,152,843 951,651 1,081,427
Net Current Assets / (Liabilities) (Rs 000) 43,216 43,248 -67,585 -821,622 -29,445 -383,972
Property Plant & Equipment (Rs 000) 1,670,162 1,736,468 1,899,186 2,005,359 2,120,558 2,153,548
Total assets (Rs 000) 3,417,482 3,166,895 3,128,765 3,162,030 3,047,832 3,238,183
Long Tern Debt (except Director Loan) (Rs 000) 262,424 201,539 555,678 730,670 794,851 1,420,981
Shareholders' equity (Rs 000) 1,462,549 1,102,670 1,073,041 891,232 724,886 705,445
Capital Employed (Rs 000) 1,725,947 1,786,818 1,836,827 2,009,187 2,096,181 2,156,757
Share Capital (Rs 000) 185,303 185,303 185,303 185,303 185,303 185,303
Break up value per share (Rupees) 78.93 59.51 0.06 48.10 39.12 38.07
Financial Ratio
Current ratio (Times) 1.03
1.03
0.95
1.00
0.97
1.00
Long-Term Debt to Capitalization (%) 58.61
52.10
74.99
79.77
81.09
88.46
Debt to Total Assets (%) 38.42
39.60
42.41
47.53
48.54
66.89
Return on equity (%) 24.61
2.95
16.94
18.66
2.68
(17.10)
Return on capital employed (%) 20.85
1.82
9.90
8.28
0.93
(5.59)
Quick Acid test ratio (Times) 0.43
0.58
0.43
1.00
0.97
1.00
Earnings before interest, taxes
depreciation & amortization
margin (EBITDA) (%) 17.00
11.17
14.40
16.14
15.94
13.57
Dividend cover ratio (%) -
-
62.31
-
-
-
Bonus Share issued (Rupees) -
-
-
-
-
0
Debt to Equity Ratio (Times) 0.18
0.18
0.52
0.82
1.10
2.01
Profitability Ratios:
Gross Profit Ratio (%) 19.69
10.44
12.82
10.81
9.52
9.30
Net Profit Margin (%) 8.82
2.29
4.27
3.34
1.41
1.77
Interest Coverage (Times) 2.94
1.60
2.16
1.66
1.24
1.38
No. of days in Receivable (Days) 42.62
55.16
49.08
47.45
31.69
52.95
No. of days in Payable (Days) 15.37 17.16 13.31 13.49 13.45 14.55
No. of Days in Inventory (Days) 70.6 78.2 102.4 140.92 133.99 239.27
Cash Operating Cycle (Days) 97.82 116.21 138.13 174.89 152.24 277.67
Debtors turnover ratio (Times) 8.56 7.59 0.02 9.59 10.64 4.35
Creditor Turnover ratio (Times) 34.84 44.03 0.10 50.98 48.85 31.64
Inventory turnover (Times) 5.43 6.91 0.01 4.59 4.12 2.35
Fixed Assets Turnover 2.81 2.14 1.63 1.35 1.16 0.59
Total Assets Turnover (Times) 1.37 1.17 0.99 0.86 0.80 0.40
Other Data:
Depreciation & Amortization (Rs 000) 170,199 187,217 200,116 210,707 213,822 91,981
Capital Expenditure (Rs 000) 106,460 28,000 100,767 106,079 230,671 68,913
FINANCIAL HIGHLIGHTS
NINE MOINTHS ENDED
JUNE 30, 2005
YEAR ENDED JUNE 30
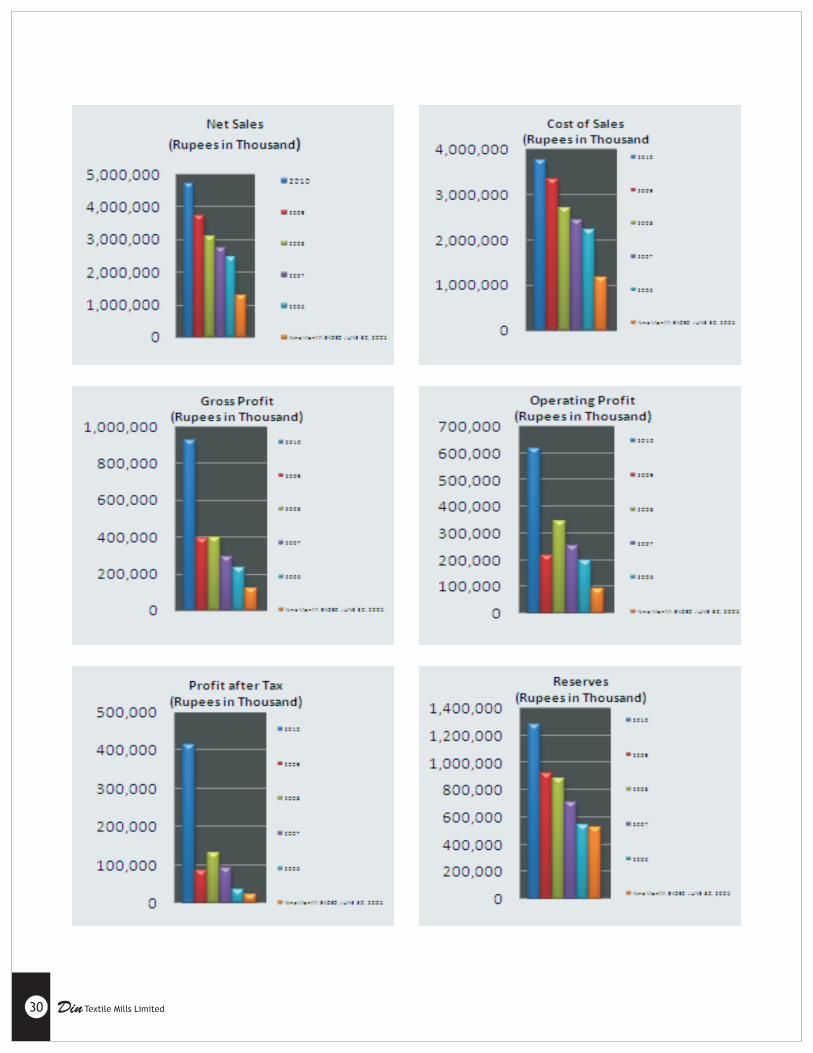
30 Din Textile Mills Limited
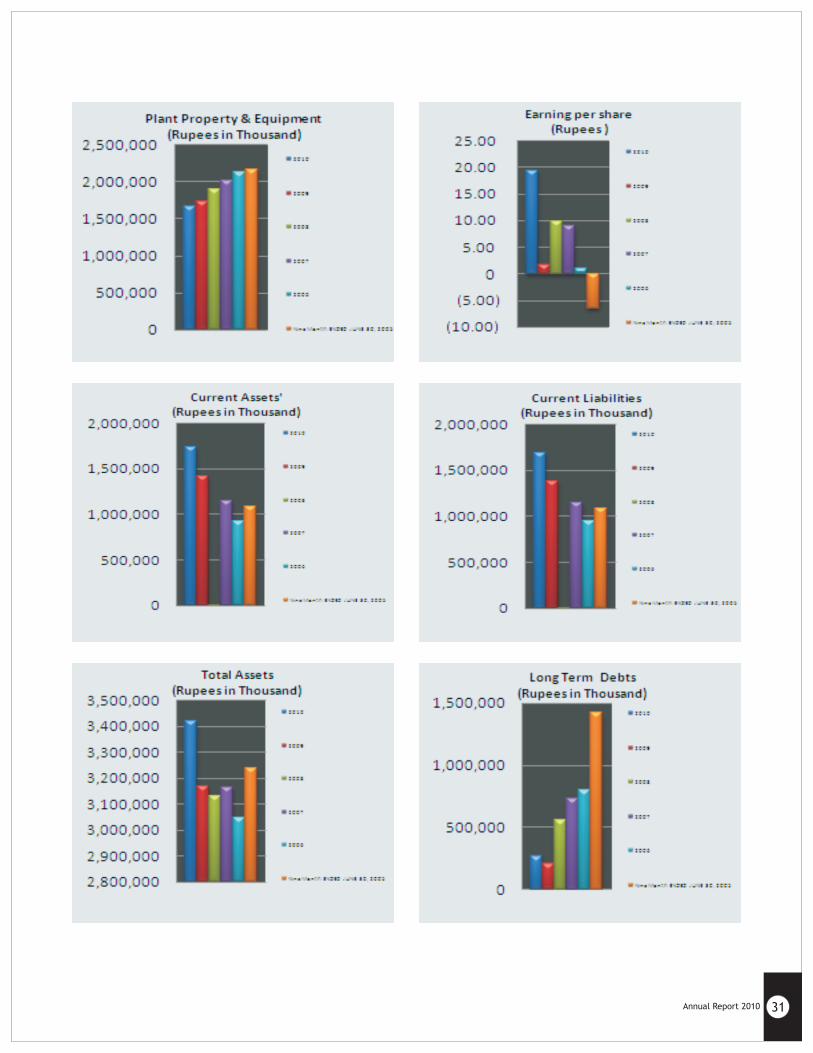
Annual Report 2010 31
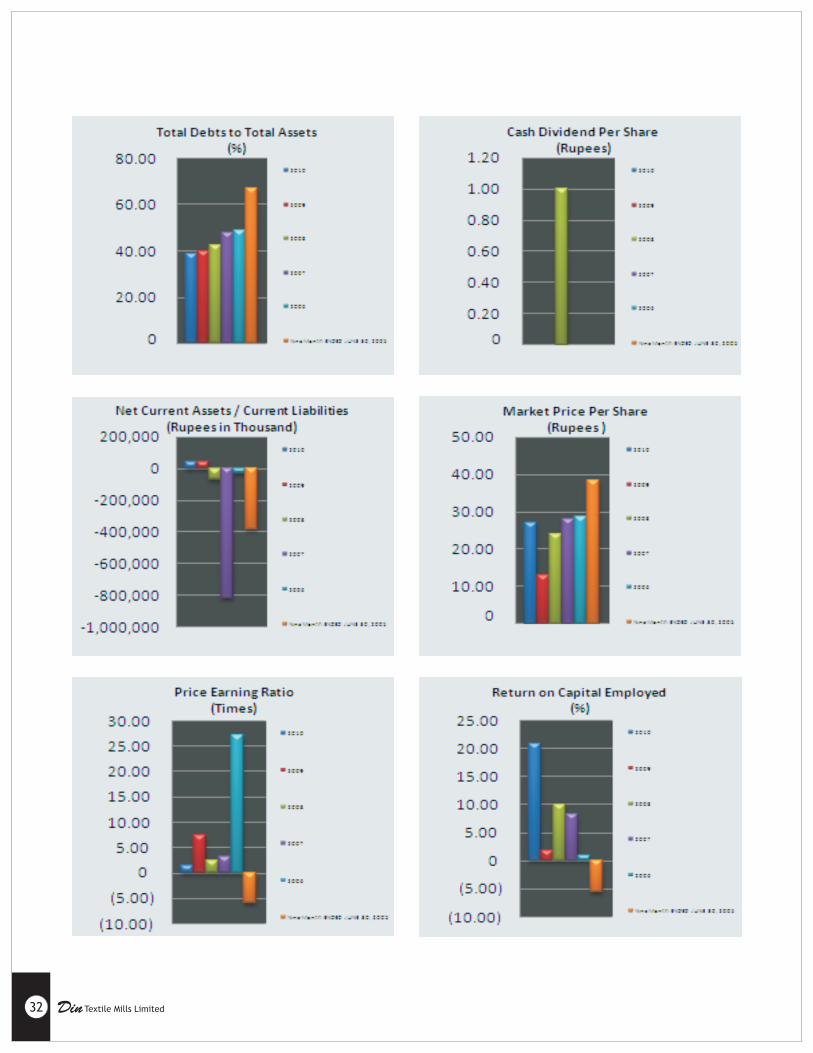
32 Din Textile Mills Limited
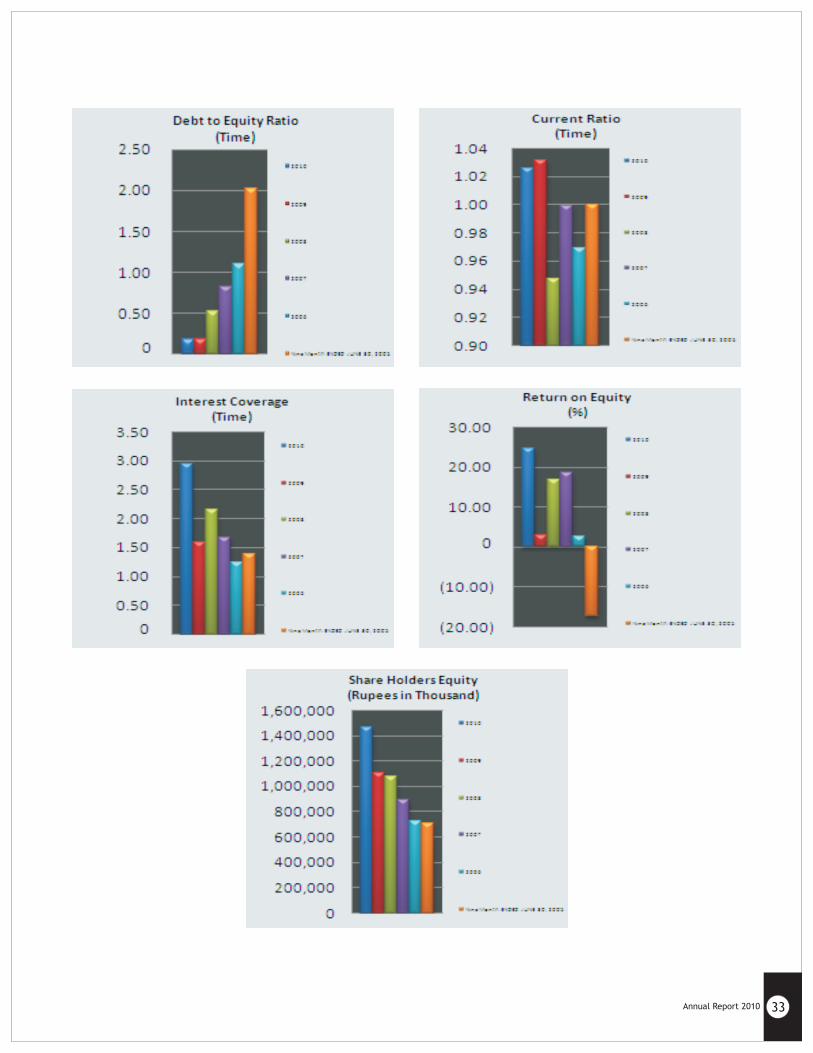
Annual Report 2010 33
STATEMENT OF COMPLIANCE WITH THE CODE OF CORPORATE GOVERNANCE FOR THE YEAR ENDED
JUNE 30, 2010
This statement is being presented to comply with the Code of Corporate governance contained in the listing regulation of Karachi and Lahore Stock Exchange for the purpose of establishing a framework of good governance, whereby a listed company is managed in compliance with the best practices of corporate governance.
The company has applied the principle contained in the following manner:
1. The company encourages representation of independent non-executive directors and directors
representing minority interests on its Board of Directors. At present the Board includes three non
executive directors and non representing minority shareholders.
2. The directors have confirmed that none of them is serving as a director in more than ten listed
companies, including this company
3. All the directors of the Company are registered as taxpayers and none of them has defaulted in
payment of any loan to a banking company, a DFI or an NBFI or, being a member of a stock exchange,
has been declared as a defaulted by that stock exchange.
4. One casual vacancy occurred during the period under review which was filled by the Board within 30
days thereof. As required under section 178 the companies ordinance 1984 election of Directors was
due on 13-03-2010 therefore the number of Directors was fixed at seven (7) and the election was held
on 13-03-2010 at the Extra Ordinary General Meeting and present seven (7) Directors were elected in
the meeting.
5. The Company has prepared a “Statement of Ethics and Business Practices”, which has been signed by
all the directors and employees of the company.
6. The Board has developed vision and mission statement, over all corporate strategy and significant
policies of the company, which have been approved by the Board of Directors.
7. All the powers of the Board have been duly exercised and decisions on material transactions, including
appointment and determination of remuneration and terms and condition of employment of the CEO
and others executive directors have been taken by the Board.
8. The meeting of the Board was presided over by the Chairman and in his absence by a director elected
by the board for this purpose and the Board met at least once in every quarter. The Board held seven
meetings during the year. Written notices of the Board Meeting, along with agenda and working
papers, were circulated at least seven days before the meeting. The minutes of the meeting were
appropriately recorded and circulated.
9. The Directors of the company attended the orientation courses for their duties and responsibilities.
10. There was no change in the position of Company Secretary, Chief Financial Officer except to change
Head of Internal Audit Mr. Fawad Jawed replaced with Mr. S. M. Imran during the year.
11. The director's report for this year has been prepared in compliance with the requirement of the Code
and fully describes the salient matters required to be disclosed.
34 Din Textile Mills Limited

12. The Financial Statements of the Company were duly endorsed by CEO and CFO before approval of the
Board.
13. The directors, CEO and Executive do not hold any interest in the shares of the Company other than
that disclosed in the pattern of shareholding.
14. The Company has complied with all the corporate and financial reporting requirements of the Code.
15. The Board has formed an audit committee. It comprises three members, of whom two are non-
executive directors including the chairman of committee.
16. The meeting of the audit committee were held at least once every quarter prior to approval of interim
and final results of the Company and as required by the Code. The terms of reference of the
committee have been formed and advised to the committee for compliance.
17. The Board has setup an internal audit function.
18. The statutory auditors of the Company have confirmed that they have given a satisfactory rating
under the quality control review program of the Institute of Chartered Accountants of Pakistan, that
they or any of the partners of the firm their spouses and minor children do not hold shares of the
company and that the firm and all partners are in compliance with International Federation of
Accountants (IFAC) guidelines on code of ethics as adopted by the Institute of Chartered Accountants
of Pakistan.
19. The statuary auditors or the person associated with them have not been appointed to provide other
services except in accordance with the listing regulations and auditors have confirmed that they
have observed IFAC guidelines in this regard.
20. We confirm that all other material principals contained in the Code have been complied with.
Karachi: Date: September 23, 2010
On behalf of the Board of Directors
S. M. Muneer)Chairman / Chief Executive
Annual Report 2010 35
REVIEW REPORT TO THE MEMBERS
On the Statement of Compliance with Best Practices of the Code of Corporate Governance
MUSHTAQ & COMPANYChartered AccountantsEngagement Partner:Shahabuddin A. Siddiqui
We have reviewed the Statement of Compliance with the best practices contained in the Code of Corporate Governance prepared by the Board of Directors of Din Textile Mills Limited to comply with the Listing Regulation No. 37 of the Karachi Stock Exchange (Guarantee) Limited and Chapter XIII of Lahore Stock Exchange (Guarantee) Limited where the company is listed.
The responsibility for compliance with the Code of Corporate Governance is that of the Board of Directors of the company. Our responsibility is to review, to the extent where such compliance can be objectively verified, whether the Statement of Compliance reflects the status of the company's compliance with the provisions of the Code of Corporate Governance and report if it does not. A review is limited primarily to inquiries of the company personnel and review of various documents prepared by the company to comply with the Code.
As part of our audit of financial statements we are required to obtain an understanding of the accounting and internal control systems sufficient to plan the audit and develop an effective audit approach. We have not carried out any special review of the internal control system to enable us to express an opinion as to whether the Board's statement on internal control covers all controls and the effectiveness of such internal controls.
Based on our review, nothing has come to our attention which causes us to believe that the Statement of Compliance does not appropriately reflect the company's compliance, in all material respects, with the best practices contained in the Code of Corporate Governance as applicable to the company for the year ended June 30, 2010.
Karachi: Date: September 23, 2010
36 Din Textile Mills Limited
MUSHTAQ & CO. CHARTERED ACCOUNTANTS
407-Commerce Centre Hasrat Mohani Road Karachi-74200 Pakistan Tel: +92-21-32638521-4 Fax: +92-21-32639843 E-mail: [email protected]
Branch Office: 20-B, Block-G Gulberg-III Lahore-54660
Tel: +92-42-35884926, 35865618 Fax: +92-42-35843360 E-mail:[email protected]
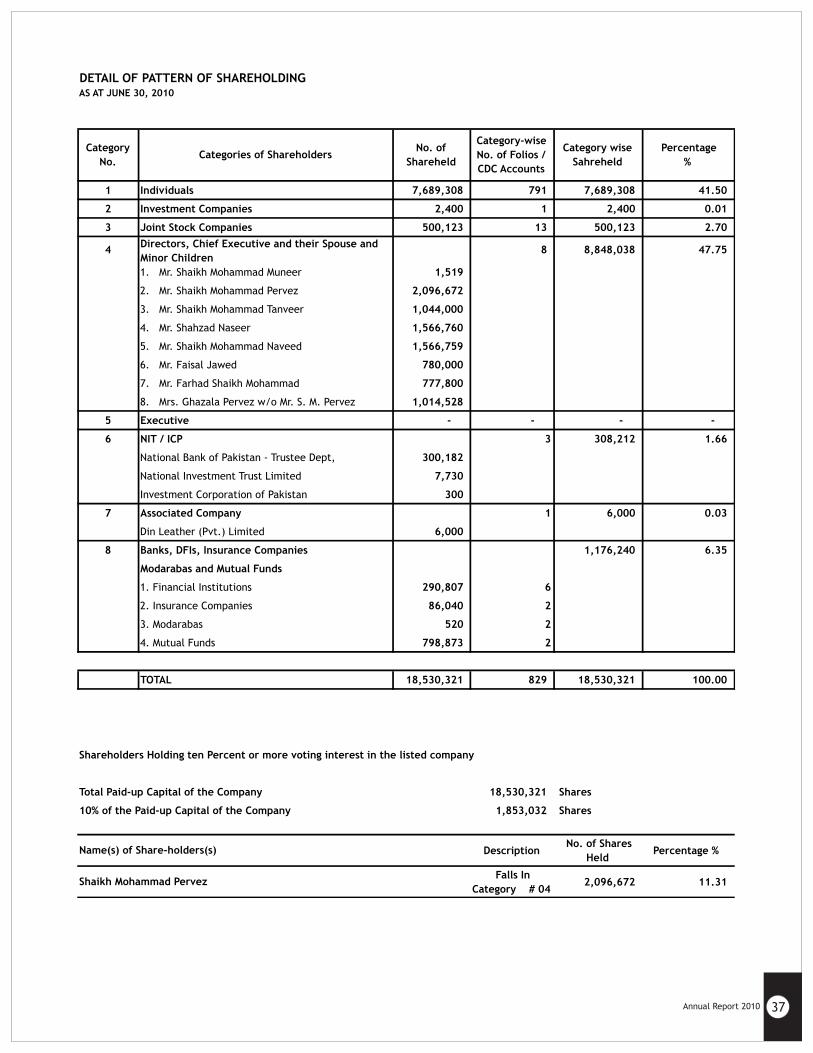
Annual Report 2010 37
DETAIL OF PATTERN OF SHAREHOLDINGAS AT JUNE 30, 2010
1 Individuals 7,689,308 791 7,689,308 41.50
2 Investment Companies 2,400 1 2,400 0.01
3 Joint Stock Companies 500,123 13 500,123 2.70
4Directors, Chief Executive and their Spouse and
Minor Children8
8,848,038
47.75
1. Mr. Shaikh Mohammad Muneer 1,519
2. Mr. Shaikh Mohammad Pervez 2,096,672
3. Mr. Shaikh Mohammad Tanveer 1,044,000
4. Mr. Shahzad Naseer 1,566,760
5. Mr. Shaikh Mohammad Naveed 1,566,759
6. Mr. Faisal Jawed 780,000
7. Mr. Farhad Shaikh Mohammad 777,800
8. Mrs. Ghazala Pervez w/o Mr. S. M. Pervez 1,014,528
5 Executive -
-
-
-
6 NIT / ICP 3 308,212
1.66
National Bank of Pakistan - Trustee Dept, 300,182
National Investment Trust Limited 7,730
Investment Corporation of Pakistan 300
7 Associated Company 1 6,000 0.03
Din Leather (Pvt.) Limited 6,000
8 Banks, DFIs, Insurance Companies
1,176,240
6.35
Modarabas and Mutual Funds
1. Financial Institutions 290,807
6
2. Insurance Companies 86,040
2
3. Modarabas 520
2
4. Mutual Funds 798,873
2
TOTAL 18,530,321
829
18,530,321
100.00
Shareholders Holding ten Percent or more voting interest in the listed company
Total Paid-up Capital of the Company 18,530,321 Shares
10% of the Paid-up Capital of the Company 1,853,032 Shares
Description No. of Shares
Held Percentage %
Falls In
Category # 042,096,672 11.31
Percentage
%
Name(s) of Share-holders(s)
Shaikh Mohammad Pervez
Categories of ShareholdersNo. of
Shareheld
Category-wise
No. of Folios /
CDC Accounts
Category wise
Sahreheld
Category
No.
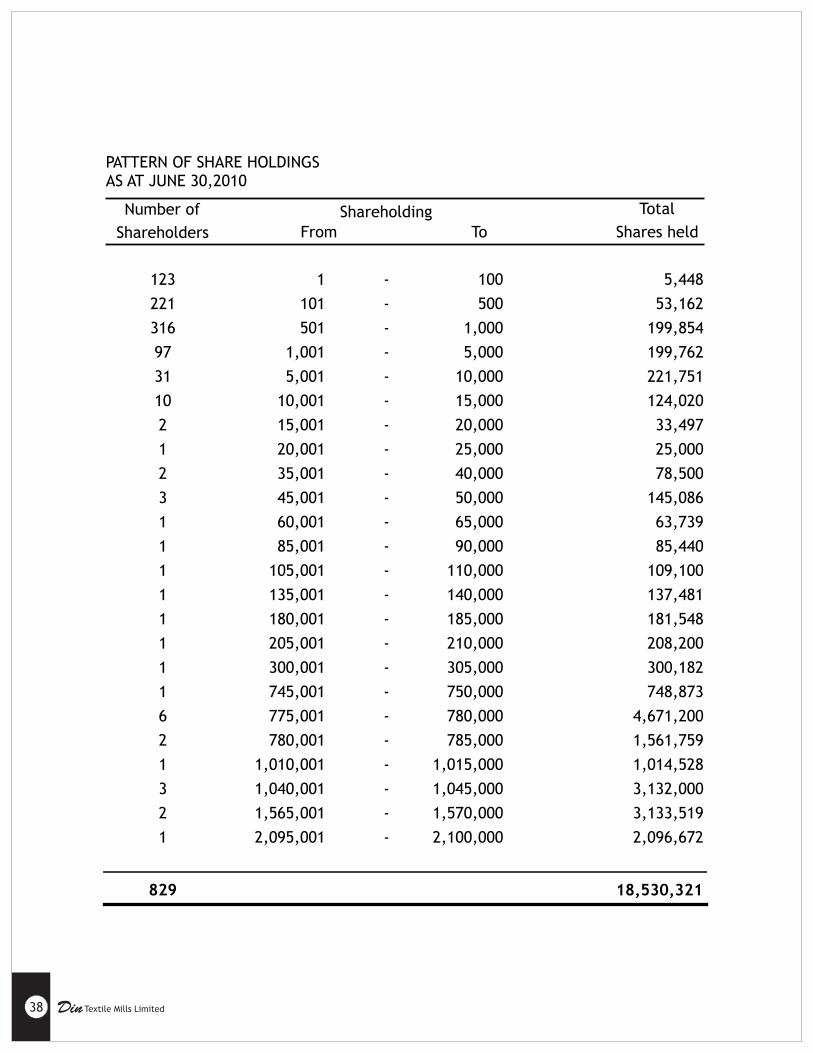
38 Din Textile Mills Limited
Number of Total
Shareholders Shares held
123 1 - 100 5,448
221 101 - 500 53,162
316 501 - 1,000 199,854
97 1,001 - 5,000 199,762
31 5,001 - 10,000 221,751
10 10,001 - 15,000 124,020
2 15,001 - 20,000 33,497
1 20,001 - 25,000 25,000
2 35,001 - 40,000 78,500
3 45,001 - 50,000 145,086
1 60,001 - 65,000 63,739
1 85,001 - 90,000 85,440
1 105,001 - 110,000 109,100
1 135,001 - 140,000 137,481
1 180,001 - 185,000 181,548
1 205,001 - 210,000 208,200
1 300,001 - 305,000 300,182
1 745,001 - 750,000 748,873
6 775,001 - 780,000 4,671,200
2 780,001 - 785,000 1,561,759
1 1,010,001 - 1,015,000 1,014,528
3 1,040,001 - 1,045,000 3,132,000
2 1,565,001 - 1,570,000 3,133,519
1 2,095,001 - 2,100,000 2,096,672
829 18,530,321
Shareholding
PATTERN OF SHARE HOLDINGS AS AT JUNE 30,2010
From To

FINANCIAL FINANCIAL
STATEMENTSSTATEMENTS2010201020102010

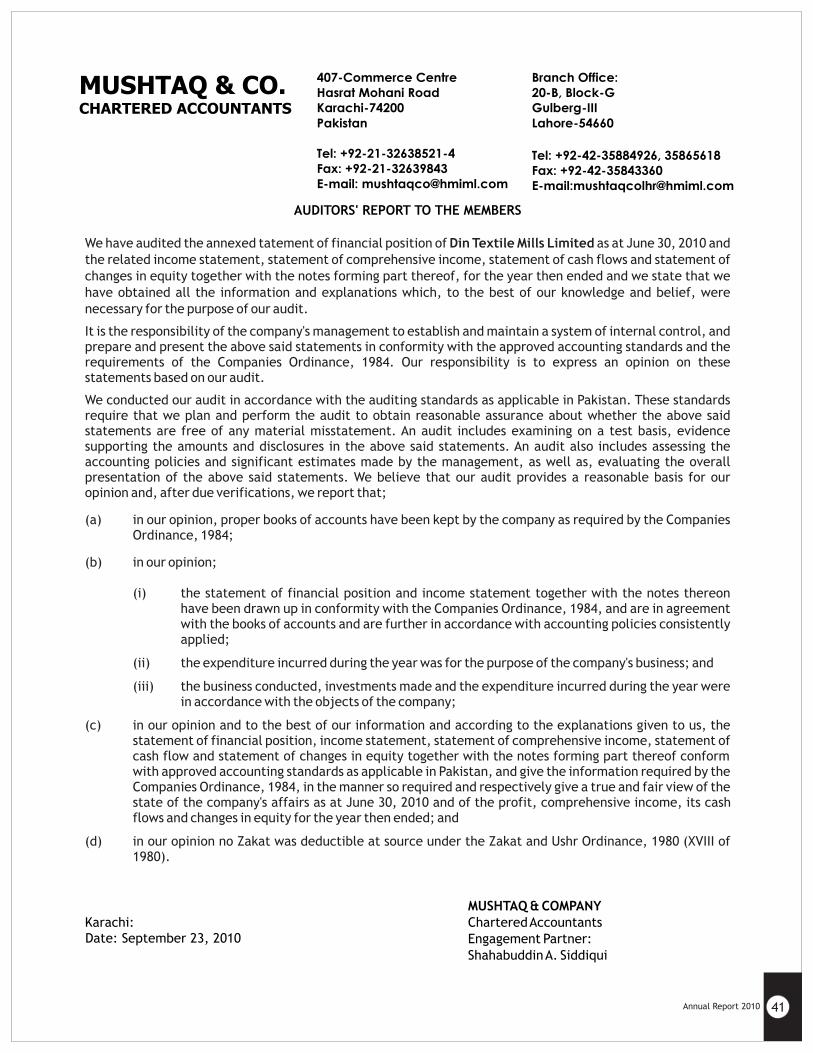
AUDITORS' REPORT TO THE MEMBERS
MUSHTAQ & COMPANYKarachi: Chartered Accountants
Engagement Partner:Shahabuddin A. Siddiqui
We have audited the annexed tatement of financial position of Din Textile Mills Limited as at June 30, 2010 and the related income statement, statement of comprehensive income, statement of cash flows and statement of changes in equity together with the notes forming part thereof, for the year then ended and we state that we have obtained all the information and explanations which, to the best of our knowledge and belief, were necessary for the purpose of our audit.
It is the responsibility of the company's management to establish and maintain a system of internal control, and prepare and present the above said statements in conformity with the approved accounting standards and the requirements of the Companies Ordinance, 1984. Our responsibility is to express an opinion on these statements based on our audit.
We conducted our audit in accordance with the auditing standards as applicable in Pakistan. These standards require that we plan and perform the audit to obtain reasonable assurance about whether the above said statements are free of any material misstatement. An audit includes examining on a test basis, evidence supporting the amounts and disclosures in the above said statements. An audit also includes assessing the accounting policies and significant estimates made by the management, as well as, evaluating the overall presentation of the above said statements. We believe that our audit provides a reasonable basis for our opinion and, after due verifications, we report that;
(a) in our opinion, proper books of accounts have been kept by the company as required by the Companies Ordinance, 1984;
(b) in our opinion;
(i) the statement of financial position and income statement together with the notes thereon have been drawn up in conformity with the Companies Ordinance, 1984, and are in agreement with the books of accounts and are further in accordance with accounting policies consistently applied;
(ii) the expenditure incurred during the year was for the purpose of the company's business; and
(iii) the business conducted, investments made and the expenditure incurred during the year were in accordance with the objects of the company;
(c) in our opinion and to the best of our information and according to the explanations given to us, the statement of financial position, income statement, statement of comprehensive income, statement of cash flow and statement of changes in equity together with the notes forming part thereof conform with approved accounting standards as applicable in Pakistan, and give the information required by the Companies Ordinance, 1984, in the manner so required and respectively give a true and fair view of the state of the company's affairs as at June 30, 2010 and of the profit, comprehensive income, its cash flows and changes in equity for the year then ended; and
(d) in our opinion no Zakat was deductible at source under the Zakat and Ushr Ordinance, 1980 (XVIII of 1980).
Date: September 23, 2010
Annual Report 2010 41
MUSHTAQ & CO. CHARTERED ACCOUNTANTS
407-Commerce Centre
Hasrat Mohani Road
Karachi-74200
Pakistan Tel: +92-21-32638521-4 Fax: +92-21-32639843 E-mail: [email protected]
Branch Office:
20-B, Block-G
Gulberg-III
Lahore-54660
Tel: +92-42-35884926, 35865618Fax: +92-42-35843360 E-mail:[email protected]

42 Din Textile Mills Limited
Statement of Financial PositionAs at June 30, 2010
Note 2010 2009
Rupees Rupees
NON CURRENT ASSETS
Property, plant and equipment 5 1,670,162,349
1,736,468,468
Long term loans and advances 6 373,300
671,344
Long term deposits 7 12,194,682
6,429,363
1,682,730,331
1,743,569,175
CURRENT ASSETS
Stores, spare parts and loose tools 8 140,651,363
105,354,466
Stock in trade 9 864,829,665
515,264,284
Trade debts 10 547,899,636
560,982,844
Loans and advances 11 90,106,436
193,507,133
Trade deposits and short term prepayments 12 2,462,807
2,077,356
Other receivables 13 163,824
282,175
Income Tax and Sales Tax 14 63,972,483
31,454,159
Cash and bank balances 15 24,665,598
14,403,051
1,734,751,812
1,423,325,468
CURRENT LIABILITIES
Trade and other payables 16 243,632,210
182,032,808
Accrued mark up and interest 17 44,455,705
27,681,243
Short term borrowings 18 1,050,725,072
1,052,565,863
Current portion of
Long term financing 19 88,793,818
106,325,743
Long term financing from directors and others 20 250,000,000 -
Liabilities against assets subject to finance lease 21 13,928,746 11,471,459
1,691,535,551
1,380,077,116
WORKING CAPITAL 43,216,261
43,248,352
TOTAL CAPITAL EMPLOYED 1,725,946,592 1,786,817,527
NON CURRENT LIABILITIES
Long term financing 19 143,393,757
64,245,675
Long term financing from directors and others 20 -
500,000,000
Liabilities against assets subject to finance lease 21 16,307,416
19,496,461
Deferred liabilities
Staff retirement benefits - gratuity 22 49,728,712
52,008,160
Deferred taxation 23 53,967,522
48,397,233
263,397,407
684,147,529
CONTINGENCIES AND COMMITMENTS 24
Net Worth 1,462,549,185
1,102,669,998
EQUITY AND LIABILITIES
SHARE CAPITAL AND RESERVES
Authorized capital
50,000,000 ordinary shares of Rs. 10 each 500,000,000
500,000,000
Net Worth Represented by:
Issued, subscribed and paid up capital 25 185,303,210
185,303,210
Reserves 26 1,277,245,975
917,366,788
1,462,549,185 1,102,669,998
The annexed notes form an integral part of these financial statements.
SHAIKH MOHAMMAD MUNEER SHAIKH MOHAMMAD TANVEER
Chief Executive Director

Annual Report 2010 43
Income StatementFor the year ended June 30, 2010
Note 2010 2009
Rupees Rupees
Sales - net
27 4,691,884,420
3,712,392,008
Cost of sales 28 (3,767,900,161)
(3,324,877,658)
Gross profit 923,984,259
387,514,350
Distribution cost 29 195,200,541
115,091,974
Administrative expenses 30 80,810,935
43,720,551
Other operating expenses 31 31,954,167
11,082,788
Finance cost 32 213,463,132 142,461,027
521,428,775 312,356,340
402,555,484
75,158,010
Other operating income 33 11,486,916
9,735,260
Profit before taxation 414,042,400
84,893,270
Provision for taxation 34 (54,163,213)
(52,346,390)
Profit for the year 359,879,187
32,546,880
Earnings per share - basic and diluted 35 19.42
1.76
The annexed notes form an integral part of these financial statements.
SHAIKH MOHAMMAD MUNEER SHAIKH MOHAMMAD TANVEER
Chief Executive Director

Statement of Comprehensive IncomeFor the year ended June 30, 2010
Note 2010 2009
Rupees Rupees
Profit for the year
359,879,187
32,546,880
Other comprehensive income for the year - -
Total comprehensive income for the year 359,879,187 32,546,880
The annexed notes form an integral part of these financial statements.
SHAIKH MOHAMMAD MUNEER SHAIKH MOHAMMAD TANVEER
Chief Executive Director
44 Din Textile Mills Limited
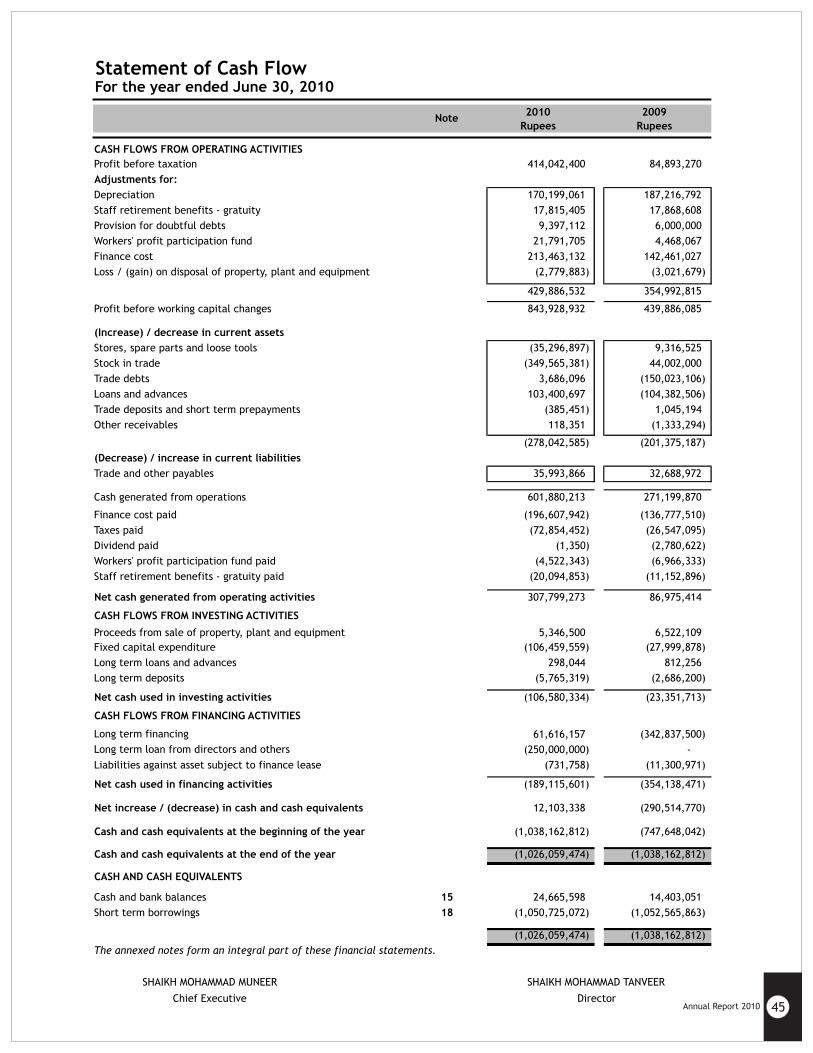
Statement of Cash FlowFor the year ended June 30, 2010
2010 2009
Rupees Rupees
CASH FLOWS FROM OPERATING ACTIVITIES
Profit before taxation 414,042,400
84,893,270
Adjustments for:
Depreciation 170,199,061
187,216,792
Staff retirement benefits - gratuity 17,815,405
17,868,608
Provision for doubtful debts 9,397,112
6,000,000
Workers' profit participation fund 21,791,705
4,468,067
Finance cost 213,463,132
142,461,027
Loss / (gain) on disposal of property, plant and equipment (2,779,883)
(3,021,679)
429,886,532
354,992,815
Profit before working capital changes 843,928,932
439,886,085
(Increase) / decrease in current assets
Stores, spare parts and loose tools (35,296,897)
9,316,525
Stock in trade (349,565,381)
44,002,000
Trade debts 3,686,096
(150,023,106)
Loans and advances 103,400,697
(104,382,506)
Trade deposits and short term prepayments (385,451)
1,045,194
Other receivables 118,351
(1,333,294)
(278,042,585)
(201,375,187)
(Decrease) / increase in current liabilities
Trade and other payables 35,993,866
32,688,972
Cash generated from operations 601,880,213
271,199,870
Finance cost paid (196,607,942) (136,777,510)
Taxes paid (72,854,452) (26,547,095) Dividend paid (1,350) (2,780,622) Workers' profit participation fund paid (4,522,343)
(6,966,333)
Staff retirement benefits - gratuity paid (20,094,853)
(11,152,896)
Net cash generated from operating activities 307,799,273
86,975,414
CASH FLOWS FROM INVESTING ACTIVITIES
Proceeds from sale of property, plant and equipment 5,346,500
6,522,109
Fixed capital expenditure (106,459,559)
(27,999,878)
Long term loans and advances 298,044
812,256
Long term deposits (5,765,319)
(2,686,200)
Net cash used in investing activities (106,580,334)
(23,351,713)
CASH FLOWS FROM FINANCING ACTIVITIES
61,616,157
(342,837,500)
(250,000,000)
-
Liabilities against asset subject to finance lease (731,758)
(11,300,971)
Net cash used in financing activities (189,115,601)
(354,138,471)
Net increase / (decrease) in cash and cash equivalents 12,103,338
(290,514,770)
Cash and cash equivalents at the beginning of the year (1,038,162,812)
(747,648,042)
Cash and cash equivalents at the end of the year (1,026,059,474)
(1,038,162,812)
CASH AND CASH EQUIVALENTS
Cash and bank balances 15 24,665,598
14,403,051
Short term borrowings 18 (1,050,725,072)
(1,052,565,863)
(1,026,059,474)
(1,038,162,812)
The annexed notes form an integral part of these financial statements.
SHAIKH MOHAMMAD MUNEER SHAIKH MOHAMMAD TANVEER
Chief Executive Director
Long term loan from directors and others
Long term financing
Note
Annual Report 2010 45
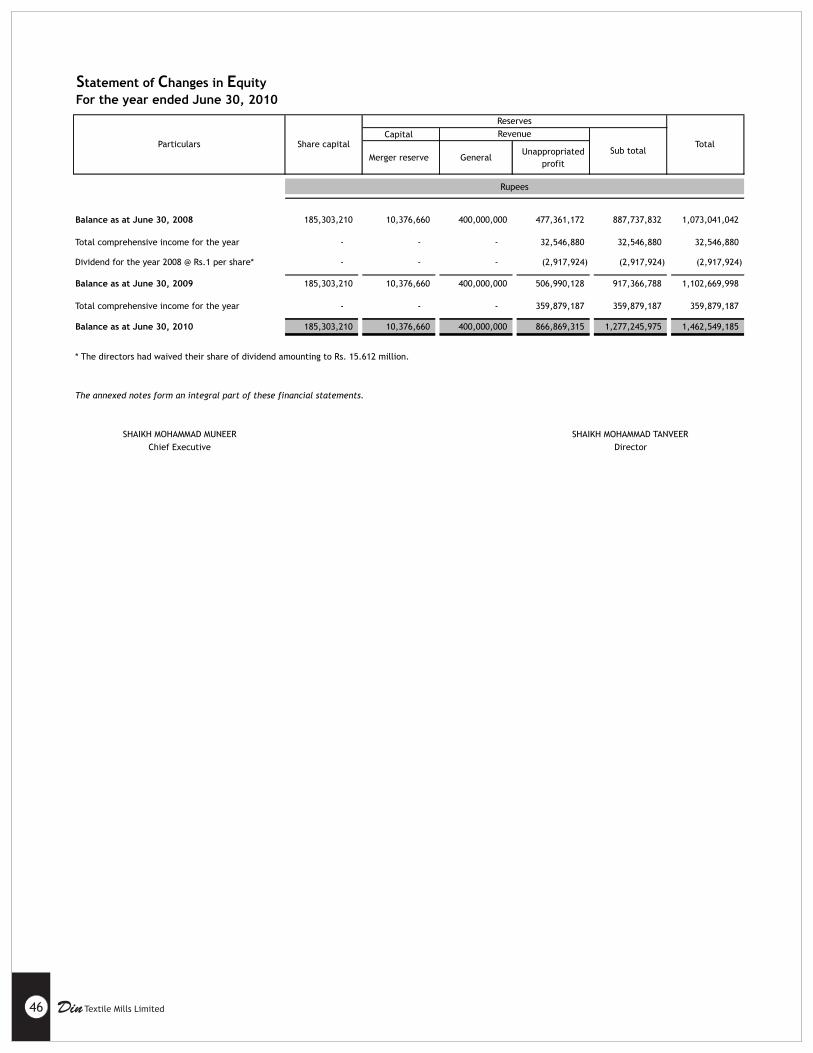
Statement of Changes in Equity
For the year ended June 30, 2010
Capital
Merger reserve GeneralUnappropriated
profit
Balance as at June 30, 2008 185,303,210
10,376,660
400,000,000
477,361,172
887,737,832
1,073,041,042
Total comprehensive income for the year -
-
-
32,546,880
32,546,880
32,546,880
Dividend for the year 2008 @ Rs.1 per share* -
-
-
(2,917,924)
(2,917,924)
(2,917,924)
Balance as at June 30, 2009 185,303,210
10,376,660
400,000,000
506,990,128
917,366,788
1,102,669,998
Total comprehensive income for the year -
-
-
359,879,187
359,879,187
359,879,187
Balance as at June 30, 2010 185,303,210
10,376,660
400,000,000
866,869,315
1,277,245,975
1,462,549,185
* The directors had waived their share of dividend amounting to Rs. 15.612 million.
The annexed notes form an integral part of these financial statements.
SHAIKH MOHAMMAD MUNEER SHAIKH MOHAMMAD TANVEER
Chief Executive Director
Total
Rupees
Reserves
RevenueParticulars
Sub totalShare capital
46 Din Textile Mills Limited
Annual Report 2010 47
Notes to and Forming Part of the Financial Statements
For the year ended June 30, 2010
1 LEGAL STATUS AND NATURE OF BUSINESS
1.1
1.2
2 BASIS OF PREPARATION
2.1 Statement of compliance
2.2 Functional and presentation currency
2.3
2.3.1
¤
¤
¤
¤ IAS 38 (Amendment),' Intangible Assets'. is effective from annual periods beginning on or after July 1, 2009.
The amendment clarifies guidance in measuring the fair value of an intangible asset acquired in a business
combination and it permits the grouping of intangible assets as a single asset if each asset has similar useful
economic lives. The amendment will not result in any significant impact on the company's financial
statements.
IAS 1 (Revised), 'Presentation of Financial Statements' is effective from January 2009. The revised standard
requires that all changes in equity arising from transactions with owners in their capacity as owners (i.e owners
changes in equity) to be presented separately from non-owner changes in equity. An entity is not permitted to
present components of comprehensive income (i.e non-owner changes in equity) in the statement of changes in
equity. As a result the company shows all owner related changes in equity in statement of changes in equity,
whereas all non-owner changes in equity are presented in other comprehensive income, Comparative
information is required to be re-presented so that it is in conformity with the revised standard.
IAS 23 (Amendment), 'Borrowing Costs' is effective from January 1, 2009. The amendment requires an entity
shall capitalize borrowing costs that are directly attributable to the acquisition, construction or production of
a qualifying asset as part of the cost of that asset. The allowed alternative treatment of recognition of
borrowing cost has been removed. The company's current accounting policy is in compliance with this
amendment, and therefore there is no impact on the company's financial statements.
Income and expenses to be presented in one statement (a statement of comprehensive income) or in two
statements (a separate income statement and a statement of comprehensive income). The company has
preferred to present two statements; (a statement displaying components of profit or loss separate income
statement) and a second statement beginning with profit or loss and displaying components of other
comprehensive income (statement of comprehensive income). Comparative information has also been re
presented/re arranged so it is in conformity with the revised standard. The amendment change only
presentation aspects of the financial statements, it has no impact on profit or loss for the year.
Revised IFRS - 3 Business Combinations (applicable for annual periods beginning on or after 01 July 2009)
broadens among other things the definition of business resulting in more acquisitions being treated as business
combinations, contingent consideration to be measured at fair value, transaction costs other than share and
debt issue costs to be expensed, any pre-existing interest in an acquiree to be measured at fair value, with the
related gain or loss recognized in profit or loss and any non-controlling (minority) interest to be measured at
either fair value, or at its proportionate interest in the identifiable assets and liabilities of an acquiree, on a
transaction-by-transaction basis. The application of this standard is not likely to have an effect on the
company's financial statements.
The company is limited by shares, incorporated in Pakistan on June 13, 1988 and is quoted on stock exchanges at Karachi
and Lahore. The registered office of the company is situated at 35 - A / 1 Lalazar Area, Opposite Beach Luxury Hotel,
Karachi in the province of Sind, Pakistan.
Standards, interpretations and amendments to published approved accounting standards that are effective
in the current year
These financial statements are presented in Pak Rupees, which is the company's functional and presentation currency and
figures are rounded to the nearest rupee.
The principal business of the company is manufacture and sale of yarn. The manufacturing units are located at Pattoki
and Raiwind in the province of Punjab.
These financial statements have been prepared in accordance with approved accounting standards as applicable in
Pakistan. Approved accounting standards comprise of such International Financial Reporting Standards (IFRS) issued by the
International Accounting Standard Board as are notified under the Companies Ordinance, 1984, provisions of and
directives issued under the Companies Ordinance, 1984. In case requirements differ, the provisions or directives of the
Companies Ordinance, 1984 shall prevail.
Standards, interpretations and amendments to published approved accounting standards

48 Din Textile Mills Limited
¤
¤
¤
¤
¤
¤
¤
¤ IFRIC 17 - Distribution of non - cash assets to owner( effective from July 01, 2009) states that when a company
distributes non cash assets to its shareholders as dividend, the liability for dividend is measured at fair value. If
there are subsequent changes in the fair value before the liability is discharged, this is recognized in the
equity. When the non cash assets is distributed, the difference between the carrying amount and fair value is
recognized in the income statement.
Amendment to IAS - 39 Financial Instruments : Recognition and Measurement - Eligible hedged items (effective
for annual periods beginning on or after 01 July 2009) clarifies the application of existing principles that
determine whether specific risks or portions of cash flows are eligible for designation in a hedging relationship.
The amendment is not likely to have an effect on the company's financial statements.
Amendments to IAS - 39 and IFRIC - 9 Embedded derivatives (effective for annual periods beginning on or after
01 January 2009). Amendments require entities to assess whether they need to separate an embedded
derivative from a hybrid (combined) financial instrument when financial assets are reclassified out of the fair
value. The amendments are not likely to have an effect on company's financial statements.
Amendment to IFRS - 2 Share-based Payment - Vesting Conditions and Cancellations (effective for annual
periods beginning on or after 01 January 2009) clarifies the definition of vesting conditions, introduces the
concept of non-vesting conditions, requires non-vesting conditions to be reflected in grant-date fair value and
provides the accounting treatment for non-vesting conditions and cancellations. The application of this
standard is not likely to have any effect on the company's financial statements.
IFRS - 4 Insurance Contracts (effective for annual periods beginning on or after 01 January 2009). The IFRS
makes limited improvements to accounting for insurance contracts until the Board completes the second phase
of its project on insurance contracts. The standard also requires that an entity issuing insurance contracts (an
insurer) to disclose information about those contracts. The standard is not applicable to the company's
operations.
IFRS 7,'Financial Instruments: Disclosures' is effective from January 1, 2009. IFRS 7 introduces new disclosures
relating to financial instruments. The application of IFRS 7 has resulted in additional disclosures in the
company's financial statements, however, there is no impact on profit for the year.
IFRS 8,'Operating Segments' is effective for annual periods beginning on or after January 01, 2009. IFRS 8
replaces the IAS 14" segment reporting" and introduces the "management approach " to segment reporting. It
requires a change in the presentation and disclosure of segment information based on the internal reports that
are regularly reviewed by the company's "chief operating decision maker" in order to asses each segment's
performance and to allocate resources to them. The amendment will not result in any impact on the
company's financial statements.
IFRIC - 15, 'Agreement for the Construction of Real Estate' (effective for annual periods beginning on or after
January 01, 2009) clarifies the recognition of revenue by real estate developers for sale of units, such as
apartments or houses, 'off-plan', that is, before construction is complete. The IFRIC is not relevant to the
company's operations.
¤
¤
IAS 27 (Revised),' Consolidated and Separate Financial Statements', is effective from July 1, 2009. The revised
standard requires the effects of all transactions with non-controlling interests to be recorded in equity if there
is no change in control and these transactions will no longer result in goodwill or gains or losses. The standard
also specifies the accounting when control is lost. Any remaining interest in the entity is re-measured to fail
value, and a gain or loss is recognized in income statement. The amendment will not result in any material
impact on the company's financial statements.
Amendments to IAS - 32 Financial Instruments : Presentation and IAS - 1 Presentation of Financial Statements
(effective for annual period beginning on or after 01 January 2009) - Puttable Financial Instruments and
Obligations Arising on Liquidations requires puttable instruments, and instruments that impose on the entity an
obligation to deliver to another party pro rata share of the net assets of the entity only on liquidation, to be
classified as equity if certain conditions are met. The amendments, which requires retrospective application,
are not expected to have any impact on the company's financial statements.
¤ IAS - 27 Consolidated and Separate Financial Statements (effective for annual periods beginning on or after 01
January 2009). The amendment removes the definition of the cost methods from IAS - 27 and replaces it with a
requirement to present dividends as income in the separate financial statements of the investor. The
amendment is not likely to have an effect on company's financial statements.
Annual Report 2010 49
¤
¤
¤
¤
¤
¤
¤
¤
IFRIC 18- Transfers of the assets from customer (to be applied prospectively to transfer of assets from
customers received on or after 1st July 2009). This interpretation clarifies the requirements of IFRSs for
agreements in which an entity receives from a customer an item of property, plant, and equipment that the
entity must then use either to connect the customer to a network or to provide the customer with ongoing
access to a supply of goods or services (such as a supply of electricity, gas or water).
Standards, interpretations and amendments to published approved accounting standards that are not yet
effective and have not been early adopted in the current year
IAS 1 (Amendment), 'Presentation of Financial Statements' . The amendment is part of the IASB's annual
improvements project published in April 2009. The amendment provides clarification that the potential
settlement of a liability by the issue of equity is not relevant to its classification as current or non-current. By
amending the definition of current liability, the amendment permits a liability to be classified as non-current
(provided that the entity has an unconditional right to defer settlement by transfer of cash or other assets for
at least 12 months after the accounting period) notwithstanding the fact that the entity could be required by
the counterparty to settle in shares at any time. The company will apply IAS 1(amenndment) from January 1,
2010. It is not expected to have a material impact on the company's financial statements.
IAS 39 (Amendment),' Cash Flow Hedge Accounting'. This amendment provides clarification when to recognize
gains or losses on hedging instruments as a reclassification adjustments in a cash flow hedge of forecast
transaction that results subsequently in the recognition of a financial instrument. The amendment clarifies
that gains or losses should be reclassified from equity to income statement in the period in which the hedged
forecast cash flow affects income statement. The company will apply IAS 39 (Amendment) from January 1,
2010. It is not expected to have any significant impact on the company's financial statements.
IFRS 2 (Amendment), "Share-based Payment - Group Cash-settled Share-based Payment Transactions is
effective for annual periods beginning on or after January 01, 2010. The IASB amended IFRS 2 to require an
entity receiving goods or services (receiving entity) in either an equity settled or a cash-settled share-based
payment transaction to account for the transaction in its separate or individual financial statements. This
principal even applies if another group entity or shareholder settles the transaction (settling entity) and the
receiving entity has no obligation to settle the payment. Retrospective application is subject to the transitional
requirements in IFRS 2.
IAS 36 (Amendment), 'Impairment of Assets' (effective for annual periods beginning on or after January 1,
2010). The amendments clarify that the largest unit to which goodwill should be allocated is the operating
segment level as defined in IFRS 8 before applying the aggregation criteria of IFRS 8. The amendment apply
prospectively. The amendment is not relevant to company's operations.
The following amendments and interpretations to existing standards have been published and are mandatory
for the company's accounting periods beginning on or after January 1, 2010 or later periods, but the company
has not early adopted them:
IAS 17 (Amendment). 'Leases' is effective from annual periods beginning on or after January 1, 2010. The IASB
deleted guidance stating that a lease of land with an indefinite economic life normally is classified as an
operating lease, unless at the end of the lease term title is expected to pass to the lessee. The amendment
clarify that when a lease includes both the land and building elements, an entity should determine the
classification of each element based on paragraphs 7-13 of IAS 17, taking account of the fact that land
normally has an indefinite economic life. The amendment is not relevant to the company's operations.
IAS 24. 'Related Party Disclosures (revised 2009)' (effective for annual periods beginning on or after January 1,
2011). The revised IAS amends the definition of a related party and modifies certain related party disclosure
requirements for government-related entities. These amendments are unlikely to have an impact on the
company's financial statements.
IAS 32 (Amendment), 'Financial Instruments: Presentation- Classification of Rights Issues is effective for annual
periods beginning on or after January 1, 2010. The IASB amended IAS 32 to allow rights, options or warrants to
acquire a fixed number of entity's own equity instruments for a fixed amount of any currency to be classified
as equity instruments provided the entity offers right, options or warrants pro rata to all of its existing owners
of the same class of its own non-derivative equity instruments. These amendments are unlikely to have an
implication on the company's financial statements.
¤
¤
¤
¤
¤
¤
¤
3 BASIS OF MEASUREMENT
3.1 Provision for taxation
3.2 Staff retirement benefits - gratuity
IFRS 5 (Amendment), 'Measurement of Non-Current Assets (or disposal group) Classified as Held-for-Sale'. The
amendment is part of the IASB's annual improvements project published in April 2009. The amendment
provides clarification that IFRS 5 specifies the disclosures required in respect of non-current asset (or disposal
group) classified as held-for-sale or discontinued operations. It also clarifies that the general requirement of
IAS 1 still apply, particularly paragraph 15 (to achieve a fair presentation) and paragraph 125 (sources of
estimation uncertainty) of IAS 1. The company will apply IFRS 5 (Amendment) from January 1, 2010. It is not
expected to have a material impact on the company's financial statements.
IFRS-9 'Financial Instruments' (effective for annual periods beginning on or after January 1, 2013). IFRS 9 is the
first standard issued as a part of a wider project to replace IAS 39. IFRS 9 retains but simplifies the mixed
measurement model and establishes two primary classifications depends on the entity's business model and the
contractual cash flow characteristics of the financial asset. The guidance in IAS 39 on impairment of financial
assets and hedge accounting continues to apply.
Certain actuarial assumptions have been adopted as disclosed in relevant note to the financial statements for valuation of
present value of defined benefit obligation. Any changes in these assumptions in future year might affect unrecognized
IFRIC-19, 'Extinguishing Financial Liabilities with Equity Instruments' (effective for annual periods beginning on
or after July 1, 2010). This interpretation provides guidance on the accounting for debt for equity swaps. The
amendment is not relevant to the company's operations.
IFRS 7, 'Financial Instruments: Disclosures' (effective for annual periods beginning on or after January 1, 2011).
The amendments add an explicit statement that qualitative disclosures should be made in the contact of the
quantitative disclosures to better enable users to evaluate an entity's exposure to risks arising from financial
statements. In addition, the IASB amended and removed existing disclosure requirements. These amendments
would result in increase in disclosures in the financial statements of the company.
IAS 34, 'Interim Financial Reporting' (effective for annual periods beginning on or after January 1, 2011). The
amendments add examples to the list of events or transactions that require disclosures under IAS 34 and
remove references to materiality in IAS 34 that describes other minimum disclosures.
The company's significant accounting policies are stated in note 4. Not all of these significant policies require the management to
make difficult, subjective or complex judgments or estimates. The following is intended to provide an understanding of the
policies which the management considers critical because of their complexity, judgment of estimation involved in their
application and their impact on these financial statements. Estimates and judgments are continually evaluated and are based on
historical experience, including expectations of future events that are believed to be reasonable under the circumstances. These
judgments involve assumptions or estimates in respect of future events and the actual results may differ from these estimates.
The areas involving higher degree of judgments or complexity or areas where assumptions and estimates are significant to the
financial statements are as follows.
IFRIC - 14 IAS 19- The Limit on a Defined Benefit Assets, Minimum Funding Requirements and their Interaction
(effective for annual periods beginning on or after January 1, 2011). These amendments remove unintended
consequences arising from the treatment of prepayments where there is a minimum funding requirement.
These amendments result in prepayments of contributions in certain circumstances being recognized as an
asset rather than an expense. These amendments are unlikely to have an impact on the company's financial
statements.
IFRIC 13, 'Customer Loyalty Programmes' (effective for annual periods beginning on or after January 1, 2011).
The amendment clarify that the fair value of the award credits takes into account the amount of discounts or
incentives that otherwise would be offered to customers that have not earned the award credits.
The company takes into account the current income tax law and decisions taken by the appellate authorities. Instances
where the company's' view differs from the view taken by the income tax department at the assessment stage and where
the company considers that its view on items of material nature is in accordance with law, the amounts are shown as
contingent liabilities.
These financial statements have been prepared under the historical cost convention on accrual basis except Cash flows and for
revaluation of certain financial instruments at fair value and recognition of certain staff retirement benefits at present value.
50 Din Textile Mills Limited
gains and losses in those years.
Annual Report 2010 51
3.3 Financial instruments
3.4 Property, plant and equipment
3.5
3.5.1
3.5.2
3.5.3
3.5.4
Provision for doubtful debts
The company reviews recoverable amount, useful life , residual value and possible impairment on an annual basis. Any
changes, if material in the estimates in future years might affect the carrying amounts of the respective items of
property, plant and equipment with a corresponding affect on the depreciation charge and impairment.
Estimation of net realizable value
Other areas involving a higher degree of judgment or complexity, or areas where assumptions and estimates are
significant to the financial statements are as follows.
The fair value of financial instruments that are not traded in an active market is determined by using valuation
techniques based on assumptions that are dependent on market conditions existing at statement of financial position date.
Computation of deferred taxation
Disclosure of contingencies
4 SIGNIFICANT ACCOUNTING POLICIES
4.1 Property, plant and equipment - owned
Recognition
Depreciation
Derecognition
4.2 Accounting for leases and assets subject to finance lease
4.2.1 Finance lease
Recognition
An item of property, plant and equipment is derecognized on disposal or when no future economic benefits are
expected from its use or disposal. Any gain or loss arising on derecognition of the asset (calculated as the
difference between the net disposal proceeds and carrying amount of the assets) is included in the income
statement in the year the assets is derecognized.
Subsequent costs are included in the asset's carrying amount or recognized as a separate asset, as appropriate,
only when it is probable that future economic benefits associated with the item will flow to the company and
the cost of the item can be measured reliably. All other repair and maintenance costs are charged to income
during the period in which they are incurred.
Depreciation on additions is charged from the month in which the asset is acquired or capitilized while no
depreciation is charged in the month of disposal.
The significant accounting policies adopted in the preparation of theses financial statements are set out below. These policies
have been consistently applied to all the years presented unless otherwise stated.
Leases where the company has substantially all the risks and rewards of ownership are classified as finance
lease. Assets subject to finance lease are initially recognized at the commencement of the lease term at the
lower of present value of minimum lease payments under the lease agreements and the fair value of the leased
assets, each determined at the inception of the lease. Subsequently these assets are stated at cost less
accumulated depreciation and any identified impairment loss. The related rental obligations, net off finance
cost, are included in liabilities against assets subject to finance lease. The liabilities are classified as current
and non current depending upon the timing of payments.
Property, plant and equipment except for freehold land are stated at cost less accumulated depreciation and
any identified impairment loss. Freehold land is stated at cost less any identified impairment loss. Cost of
tangible assets consists of historical cost pertaining to erection / construction period and other directly
attributable cost of bringing the asset to working condition.
Depreciation on all items of property, plant and equipment except for freehold land is charged to income
applying the reducing balance method so as to write off historical cost of an asset over its estimated useful life
at the rates as disclosed in note 5.
52 Din Textile Mills Limited
4.2.2 Operating lease
4.3 Capital work in progress
4.4
4.5 Stores, spare parts and loose tools
4.6 Stock in trade
4.6.1
In hand
In transit
4.6.2
4.6.3
4.7 Trade debts and other receivables
4.8 Cash and cash equivalents
Cost comprising invoice value plus other charges
Trade debts originated by the company are recognized and carried at original invoice value less any allowance for
uncollectible amounts. An estimated provision for doubtful debts is made when there is objective evidence that collection
of the full amount is no longer probable. The amount of provision is charged to income. Bad debts are written off as
incurred. Other receivables are stated at amortized cost. Known impaired receivables are written off, while receivables
considered doubtful are provided for.
Cash in hand, cash at bank and short term deposits, which are held to maturity, are carried at cost. For the purpose of
cash flow statements, cash and cash equivalent comprise cash in hand, with banks on current & saving accounts and short
term borrowings.
These are stated at cost which represents the fair value of consideration given.
Leases where significant portion of the risk and rewards of ownership are retained by the lessor are classified
as operating leases. Payments made under operating leases are charged to the income on a straight-line basis
over the period of lease.
Waste
Net realizable value signifies the estimated selling prices in the ordinary course of business less estimated costs of
completion and the estimated costs necessary to make the sales.
Weighted average cost
These are valued at lower of cost and net realizable value. Cost is determined by moving average method. Items
considered obsolete are carried at nil value. Items in transit are valued at cost comprising invoice value plus other
charges incurred thereon.
Financial charges
Assets acquired under a finance lease are depreciated in the same manner and at the same rates used for
similar owned assets, so as to depreciate these assets over their estimated useful lives in view of certainty of
ownership of these assets at the end of lease term. Depreciation of the leased assets is charged to income.
Lease payments are allocated between the liability and finance cost so as to achieve a constant rate on the
balance outstanding. The finance cost is charged to income over the lease term.
Long term deposits
Income arising from sale and lease back transaction, if any, which results in finance lease, is deferred and
amortized equally over the lease period.
Depreciation
Deferred income
Finished goods and work in process Raw material cost plus appropriate manufacturing overheads
Raw material
Net realizable value
These are valued at lower of cost and net realizable value except waste which is valued at net realizable value. Cost is
determined as follows.
Capital work in progress is stated at cost less any identified impairment loss. Transfers are made to relevant fixed assets
category as and when assets are available for use.
4.9 Staff retirement benefits
Defined benefit plan
4.10 Taxation
4.10.1 Current
4.10.2 Deferred
4.11 Trade and other payables
4.12 Provisions
4.13 Borrowings and borrowing costs
Deferred tax asset and liability is measured at the tax rates that are expected to apply to the period when the
asset is realized or the liability is settled, based on the rates (and tax laws) that have been enacted or
substantively enacted at the statement of financial position date.
Provision is made annually to cover the obligation on the basis of actuarial valuation and charged to income currently.
The most recent actuarial valuation was carried on June 30, 2009 using the Projected Unit Credit Method.
Deferred tax liabilities are recognized for all taxable temporary differences and deferred tax assets are
recognized for all deductible temporary differences and carry forward of unused tax losses and tax credits to
the extent that it is probable that future taxable profits will be available against which deferred tax asset can
be utilized, except where the deferred tax asset relating to the deductible temporary difference arises from
the initial recognition of an asset or liability that, at the time of transaction, affects neither the accounting
nor taxable profits.
Net cumulative unrecognized actuarial gains / losses relating to previous reporting periods in excess of the higher of 10
percent of present value of defined benefit obligation or 10 percent of the fair value of plan assets are recognized as
income or expense over the estimated remaining working lives of the employees.
The carrying amount of deferred tax assets is reviewed at each statement of financial position date and reduced to
the extent that it is no longer probable that sufficient taxable profits will be available to allow all or part of
the deferred tax asset to be utilized.
A provision is recognized in the statement of financial position when the company has a legal or constructive obligation
result ofas a past event, and it is probable that an out flow of resource embodying economic benefits will be
required to settle the obligation and a reliable estimate can be made of the amount of obligation.
Borrowing costs are recognized as an expense in the period in which these are incurred except to the extent of the
borrowing costs that are directly attributable to the acquisition, construction or production of a qualifying asset. Such
borrowing costs are capitalized as part of the cost of that asset up to the date of its commissioning.
Borrowings are recorded at the proceeds received. Finance costs are accounted for on an accrual basis and are included in
current liabilities to the extent of the amount remaining unpaid.
Deferred tax is provided, using the balance sheet liability method, on all temporary differences at the statement
of financial position date between the tax base of assets and liabilities and their carrying amounts for
financial reporting purposes.
Provision for current taxation is based on taxability of certain income streams of the company under
presumptive / final tax regime at the applicable tax rates and remaining income streams chargeable at current
rate of taxation under the normal tax regime after taking into account tax credit and tax rebates available, if
any. The charge for current tax includes any adjustment to past years liabilities.
Liabilities for trade and other payable are carried at cost which is fair value of the consideration to be paid in the future
for goods and services received, whether or not billed to the company.
Income tax expense comprises current and deferred tax. Income tax expense is recognized in the income statement
except to the extent that it relates to items recognized directly in equity, in which case it is recognized in equity.
The company operates an unfunded gratuity scheme covering for all its permanent employees who have attained the
minimum qualifying period for entitlement to the gratuity.
Annual Report 2010 53
4.14 Revenue recognition
4.15 Foreign currencies
4.16 Financial instruments
4.17 Offsetting of financial assets and liabilities
4.18 Impairment
4.19 Related party transactions
4.20 Government grants
4.21 Research and development cost
4.22 Dividend
Revenue is recognized on dispatch of goods or on performance of services. Return on deposits is recognized on a time
proportion basis by reference to the principal outstanding and the applicable rate of return.
Monetary assets and liabilities in foreign currencies are translated into Pak Rupee at the rate of exchange prevailing at
the statement of financial position date, except those covered by forward contracts, which are stated at contracted
rates. Foreign currency transactions are translated into Pak Rupees at the rates prevailing at the date of transaction
except for those covered by forward contracts, which are translated at contracted rates. Non monetary items are
translated into Pak Rupee on the date of transaction or on the date when fair values are determined. Exchange differences
are included in income currently.
The dividend distribution to the shareholders is recognized as a liability in the period in which it is approved by the
shareholders.
Where an impairment loss subsequently reverses, the carrying amount of the asset is increased to the revised estimate of
its recoverable amount, but so that the increased carrying amount does not exceed the carrying amount that would have
been determined, had no impairment loss been recognized for the asset in prior years. A reversal of an impairment loss is
recognized as income immediately.
If the recoverable amount of an asset is estimated to be less than its carrying amount, the carrying amount of the asset is
reduced to its recoverable amount. Impairment losses are recognized as an expense immediately.
At each statement of financial position date, the company reviews the carrying amounts of its assets to determine
whether there is any indication that those assets have suffered an impairment loss. If any such indication exists, the
recoverable amount of the asset is estimated in order to determine the extent of the impairment loss, if any. Recoverable
amount is the greater of net selling price and value in use.
Research and development cost is charged to income statement in the year in which it is incurred.
All transactions with related parties are carried out by the company at arms' length price using the method prescribed
under the Companies Ordinance, 1984 with the exception of loan taken from related parties which is interest / mark up
free.
Government grants for meeting revenue expenses are set off from respective expenses in the year in which they become
receivable.
A financial asset and financial liability is offset and the net amount is reported in the statement of financial position if
the company has a legal enforceable right to set off the recognized amounts and intends either to settle on net basis or
to realize the assets and the liabilities simultaneously.
Financial assets and financial liabilities are recognized when the company becomes a party to the contractual provisions
of the instrument and derecognized when the company loses control of contractual rights that comprise the financial
assets and in case of financial liabilities when the obligation specified in the contract is discharged, cancelled or expired.
Any gain or loss on Derecognition of financial assets and financial liabilities is included in the income statement for
the year.
All financial assets and financial liabilities are initially measured at cost, which is the fair value of the consideration given
and received respectively. These financial assets and liabilities are subsequently measured at fair value, amortized cost
or cost, as the case may be. The particular recognition methods adopted are disclosed in the individual policy statements
associated with each item.
54 Din Textile Mills Limited
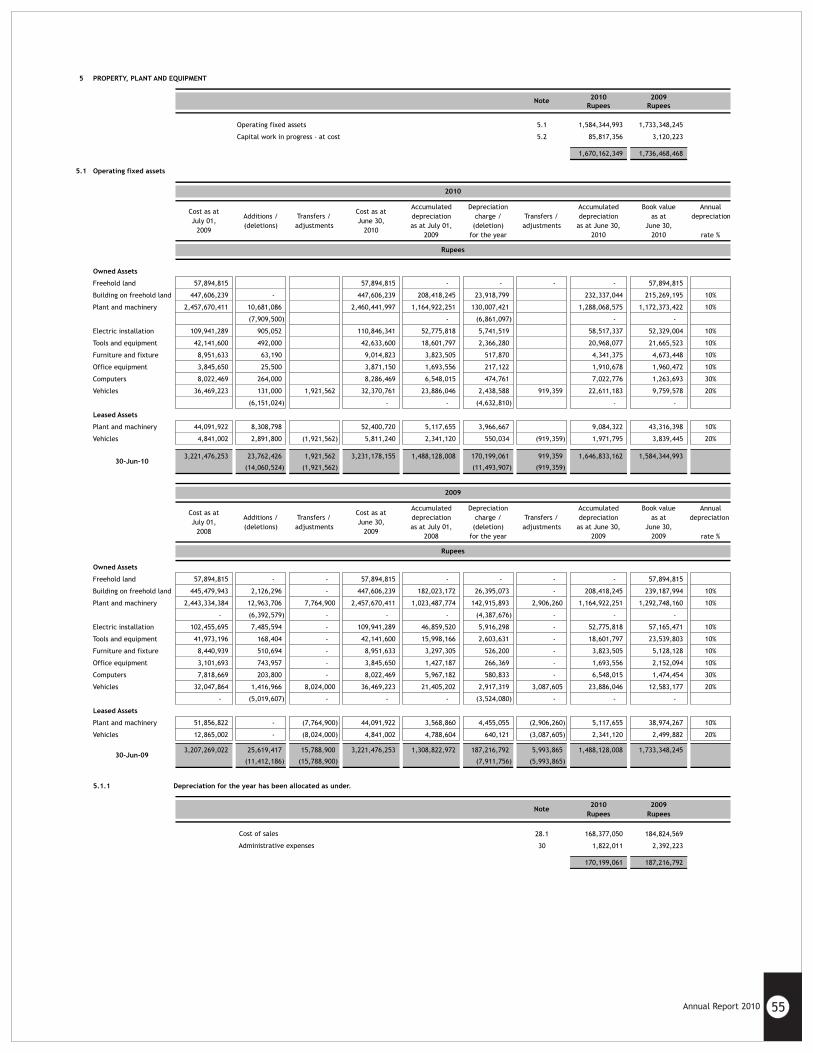
5 PROPERTY, PLANT AND EQUIPMENT
2010 2009
Rupees Rupees
Operating fixed assets 5.1 1,584,344,993 1,733,348,245
Capital work in progress - at cost 5.2 85,817,356 3,120,223
1,670,162,349 1,736,468,468
5.1 Operating fixed assets
Cost as at
July 01,
2009
Additions /
(deletions)
Transfers /
adjustments
Cost as at
June 30,
2010
Accumulated
depreciation
as at July 01,
2009
Depreciation
charge /
(deletion)
for the year
Transfers /
adjustments
Accumulated
depreciation
as at June 30,
2010
Book value
as at
June 30,
2010
Annual
depreciation
rate %
Owned Assets
Freehold land 57,894,815
57,894,815
-
-
- - 57,894,815
Building on freehold land 447,606,239
-
447,606,239
208,418,245
23,918,799
232,337,044 215,269,195 10%
Plant and machinery 2,457,670,411
10,681,086
2,460,441,997
1,164,922,251
130,007,421
1,288,068,575 1,172,373,422 10%
(7,909,500)
-
(6,861,097)
- -
Electric installation 109,941,289
905,052
110,846,341
52,775,818
5,741,519
58,517,337 52,329,004 10%
Tools and equipment 42,141,600
492,000
42,633,600
18,601,797
2,366,280
20,968,077 21,665,523 10%
Furniture and fixture 8,951,633
63,190
9,014,823
3,823,505
517,870
4,341,375 4,673,448 10%
Office equipment 3,845,650
25,500
3,871,150
1,693,556
217,122
1,910,678 1,960,472 10%
Computers 8,022,469
264,000
8,286,469
6,548,015
474,761
7,022,776 1,263,693 30%
Vehicles 36,469,223
131,000
1,921,562
32,370,761
23,886,046
2,438,588
919,359 22,611,183 9,759,578 20%
(6,151,024)
-
-
(4,632,810)
- -
Leased Assets
Plant and machinery 44,091,922
8,308,798
52,400,720
5,117,655
3,966,667
9,084,322 43,316,398 10%
Vehicles 4,841,002
2,891,800
(1,921,562)
5,811,240
2,341,120
550,034
(919,359) 1,971,795 3,839,445 20%
3,221,476,253
23,762,426
1,921,562
3,231,178,155
1,488,128,008
170,199,061
919,359 1,646,833,162 1,584,344,993
(14,060,524)
(1,921,562)
(11,493,907)
(919,359)
Cost as at
July 01,
2008
Additions /
(deletions)
Transfers /
adjustments
Cost as at
June 30,
2009
Accumulated
depreciation
as at July 01,
2008
Depreciation
charge /
(deletion)
for the year
Transfers /
adjustments
Accumulated
depreciation
as at June 30,
2009
Book value
as at
June 30,
2009
Annual
depreciation
rate %
Owned Assets
Freehold land 57,894,815 - - 57,894,815 - - - - 57,894,815
Building on freehold land 445,479,943 2,126,296 - 447,606,239 182,023,172 26,395,073 - 208,418,245 239,187,994 10%
Plant and machinery 2,443,334,384 12,963,706 7,764,900 2,457,670,411 1,023,487,774 142,915,893 2,906,260 1,164,922,251 1,292,748,160 10%
- (6,392,579) - - - (4,387,676) - - -
Electric installation 102,455,695 7,485,594 - 109,941,289 46,859,520 5,916,298 - 52,775,818 57,165,471 10%
Tools and equipment 41,973,196 168,404 - 42,141,600 15,998,166 2,603,631 - 18,601,797 23,539,803 10%
Furniture and fixture 8,440,939 510,694 - 8,951,633 3,297,305 526,200 - 3,823,505 5,128,128 10%
Office equipment 3,101,693 743,957 - 3,845,650 1,427,187 266,369 - 1,693,556 2,152,094 10%
Computers 7,818,669 203,800 - 8,022,469 5,967,182 580,833 - 6,548,015 1,474,454 30%
Vehicles 32,047,864 1,416,966 8,024,000 36,469,223 21,405,202 2,917,319 3,087,605 23,886,046 12,583,177 20%
- (5,019,607) - - - (3,524,080) - - -
Leased Assets
Plant and machinery 51,856,822 - (7,764,900) 44,091,922 3,568,860 4,455,055 (2,906,260) 5,117,655 38,974,267 10%
Vehicles 12,865,002 - (8,024,000) 4,841,002 4,788,604 640,121 (3,087,605) 2,341,120 2,499,882 20%
3,207,269,022 25,619,417 15,788,900 3,221,476,253 1,308,822,972 187,216,792 5,993,865 1,488,128,008 1,733,348,245
(11,412,186) (15,788,900) (7,911,756) (5,993,865)
5.1.1 Depreciation for the year has been allocated as under.
2010 2009
Rupees Rupees
28.1 168,377,050 184,824,569
30 1,822,011 2,392,223
170,199,061 187,216,792
Administrative expenses
Cost of sales
Note
Rupees
Rupees
2009
30-Jun-10
30-Jun-09
Note
2010
Annual Report 2010 55
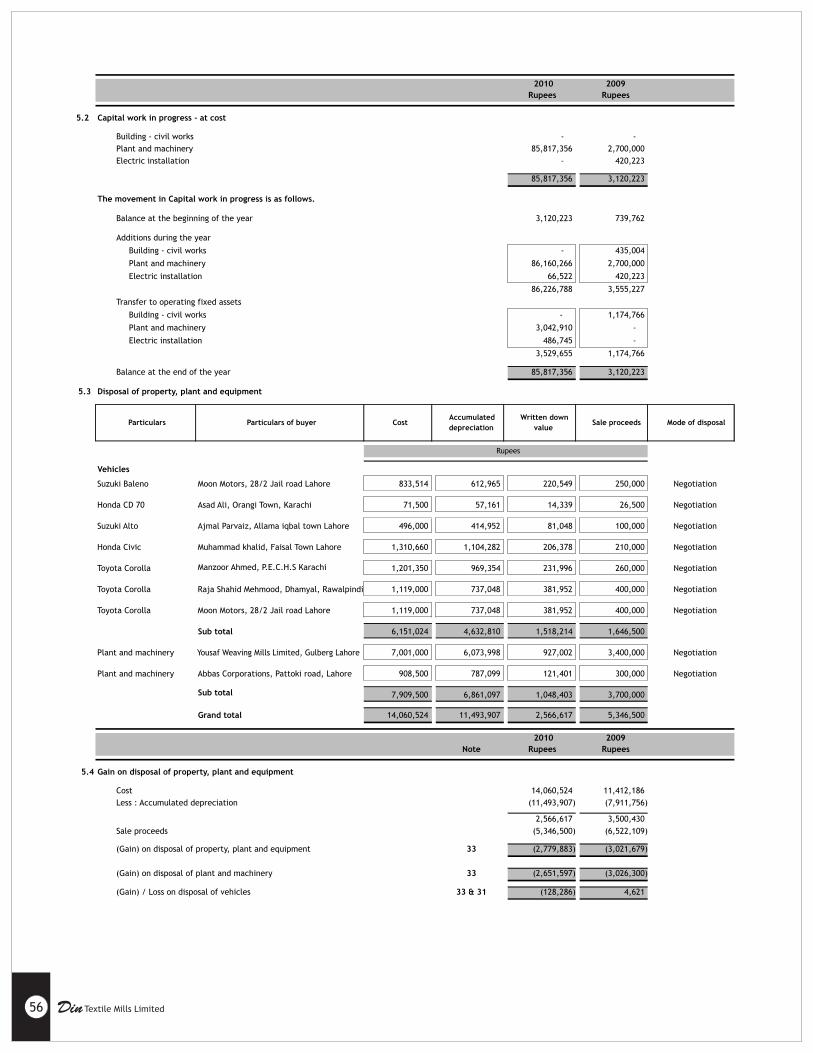
2010 2009
Rupees Rupees
5.2 Capital work in progress - at cost
Building - civil works - -
Plant and machinery 85,817,356 2,700,000
Electric installation - 420,223
85,817,356 3,120,223
The movement in Capital work in progress is as follows.
Balance at the beginning of the year 3,120,223 739,762
Additions during the year
Building - civil works -
435,004
Plant and machinery 86,160,266
2,700,000
Electric installation 66,522
420,223
86,226,788
3,555,227
Transfer to operating fixed assets
Building - civil works 1,174,766
Plant and machinery 3,042,910
-
Electric installation 486,745
-
3,529,655
1,174,766
Balance at the end of the year 85,817,356
3,120,223
5.3 Disposal of property, plant and equipment
Vehicles
Suzuki Baleno Moon Motors, 28/2 Jail road Lahore 833,514
612,965
220,549
250,000
Negotiation
Honda CD 70 Asad Ali, Orangi Town, Karachi 71,500 57,161 14,339 26,500 Negotiation
Suzuki Alto Ajmal Parvaiz, Allama iqbal town Lahore 496,000
414,952
81,048
100,000
Negotiation
Honda Civic Muhammad khalid, Faisal Town Lahore 1,310,660
1,104,282
206,378
210,000
Negotiation
Toyota Corolla Manzoor Ahmed, P.E.C.H.S Karachi 1,201,350
969,354
231,996
260,000
Negotiation
Toyota Corolla Raja Shahid Mehmood, Dhamyal, Rawalpindi 1,119,000
737,048
381,952
400,000
Negotiation
Toyota Corolla Moon Motors, 28/2 Jail road Lahore 1,119,000
737,048
381,952
400,000
Negotiation
Sub total 6,151,024
4,632,810
1,518,214
1,646,500
Plant and machinery Yousaf Weaving Mills Limited, Gulberg Lahore 7,001,000
6,073,998
927,002
3,400,000
Negotiation
Plant and machinery Abbas Corporations, Pattoki road, Lahore 908,500
787,099
121,401
300,000
Negotiation
Sub total 7,909,500
6,861,097
1,048,403
3,700,000
Grand total 14,060,524
11,493,907
2,566,617
5,346,500
2010 2009
Note Rupees Rupees
5.4 Gain on disposal of property, plant and equipment
Cost 14,060,524 11,412,186
Less : Accumulated depreciation (11,493,907) (7,911,756)
2,566,617 3,500,430
Sale proceeds (5,346,500) (6,522,109)
(Gain) on disposal of property, plant and equipment 33 (2,779,883) (3,021,679)
(Gain) on disposal of plant and machinery 33 (2,651,597) (3,026,300)
(Gain) / Loss on disposal of vehicles 33 & 31 (128,286) 4,621
Mode of disposal Sale proceeds
Rupees
Particulars Accumulated
depreciation Cost
Written down
value Particulars of buyer
-
56 Din Textile Mills Limited
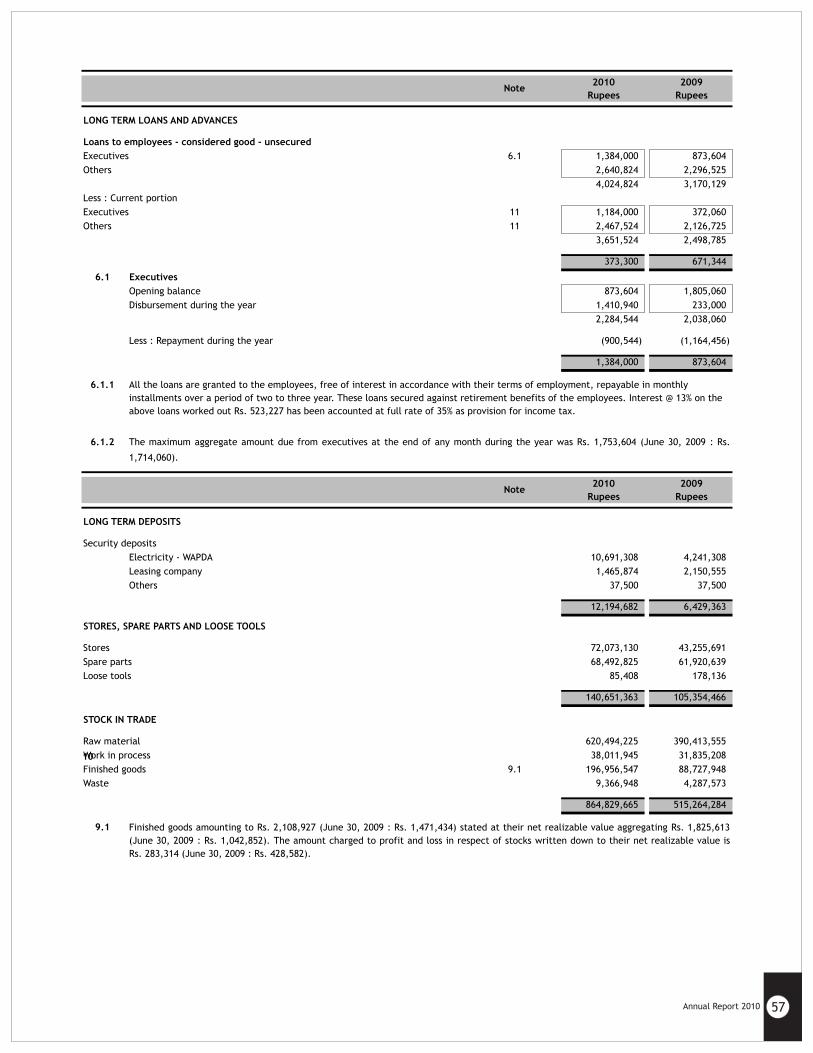
10
2010 2009
Rupees Rupees
LONG TERM LOANS AND ADVANCES
Loans to employees - considered good - unsecured
Executives 6.1 1,384,000 873,604
Others 2,640,824 2,296,525
4,024,824 3,170,129
Less : Current portion
Executives 11 1,184,000
372,060
Others 11 2,467,524
2,126,725
3,651,524
2,498,785
373,300
671,344
6.1 Executives
Opening balance 873,604
1,805,060
Disbursement during the year 1,410,940
233,000
2,284,544
2,038,060
Less : Repayment during the year (900,544)
(1,164,456)
1,384,000
873,604
6.1.1
6.1.2
2010 2009
Rupees Rupees
LONG TERM DEPOSITS
Security deposits
Electricity - WAPDA 10,691,308
4,241,308
Leasing company 1,465,874 2,150,555
Others 37,500 37,500
12,194,682
6,429,363
STORES, SPARE PARTS AND LOOSE TOOLS
Stores 72,073,130
43,255,691
Spare parts 68,492,825
61,920,639
Loose tools 85,408
178,136
140,651,363
105,354,466
STOCK IN TRADE
Raw material 620,494,225
390,413,555
Work in process 38,011,945
31,835,208
Finished goods 9.1 196,956,547
88,727,948
Waste 9,366,948
4,287,573
864,829,665 515,264,284
9.1
Note
All the loans are granted to the employees, free of interest in accordance with their terms of employment, repayable in monthly
installments over a period of two to three year. These loans secured against retirement benefits of the employees. Interest @ 13% on the
above loans worked out Rs. 523,227 has been accounted at full rate of 35% as provision for income tax.
The maximum aggregate amount due from executives at the end of any month during the year was Rs. 1,753,604 (June 30, 2009 : Rs.
1,714,060).
Finished goods amounting to Rs. 2,108,927 (June 30, 2009 : Rs. 1,471,434) stated at their net realizable value aggregating Rs. 1,825,613
(June 30, 2009 : Rs. 1,042,852). The amount charged to profit and loss in respect of stocks written down to their net realizable value is
Rs. 283,314 (June 30, 2009 : Rs. 428,582).
Note
Annual Report 2010 57

2010 2009
Rupees Rupees
10 TRADE DEBTS
Considered good
Secured 289,478,745 379,241,315
Unsecured 258,420,891 181,741,529
547,899,636 560,982,844
Considered doubtful 15,000,000
9,000,000
562,899,636
569,982,844
Provision for doubtful debts 10.1 (15,000,000)
(9,000,000)
547,899,636
560,982,844
10.1 The movement in provision during the year is as follows:
Balance as at July 1 9,000,000
3,000,000
Add: Provision during the year 9,397,112
6,000,000
18,397,112
9,000,000
Less: Bad debts written off during the year (3,397,112)
-
Balance as at June 30 15,000,000
9,000,000
11 LOANS AND ADVANCES
Considered good
Loan to employee
Executive - unsecured 6 1,184,000
372,060
Others - unsecured 6 2,467,524
2,126,725
Advances to suppliers
Against purchases - unsecured 8,004,937
12,703,187
Against letter of credit - secured 78,449,975
178,305,161
90,106,436 193,507,133
12 TRADE DEPOSITS AND SHORT TERM PREPAYMENTS
Security deposits 2,292,950
1,094,100
Prepayments 169,857
983,256
2,462,807
2,077,356
13 OTHER RECEIVABLES
Considered good
Export rebate 163,824
282,175
163,824
282,175
14 INCOME TAX AND SALES TAX
Advances Income Tax 145,770,354
84,442,721
Less:
Provision for Income Tax
Opening Balance (61,299,029) (49,277,592)
During the year 49,277,592 (40,474,446) (12,021,437)
43,996,879 23,143,692
Sales tax 19,975,604 8,310,467
63,972,483 31,454,159
58 Din Textile Mills Limited

15 CASH AND BANK BALANCES
Cash with banks
In current accounts 15.1 23,292,252 13,029,016
In dividend accounts 15.2 1,358,157 1,359,507
In savings account 15.3 15,189 14,528
24,665,598 14,403,051
15.1 It includes balance with associated company (MCB Bank Limited) of Rs. 1,017,323 (June 30, 2009 : Rs. 1,311,073).
15.2 It represents balance with associated company (MCB Bank Limited) of Rs. 1,358,157 (June 30, 2009 : Rs. 1,359,507).
15.3
2010 2009
Rupees Rupees
16 TRADE AND OTHER PAYABLES
Creditors 134,661,969
105,294,421
Accrued liabilities 44,872,055
45,440,460
Advances from customers 8,347,060
1,152,337
Retention money 356,239
356,239
Excise duty on loans 16.1 4,429,581
4,429,581
Sales tax claim payable 16.2 14,759,966
14,759,966
Workers' profit participation fund 16.3 21,872,433 4,522,343
Workers' welfare fund 11,128,563 3,010,085
Unclaimed dividend 3,066,026
3,067,376
Withholding tax payable 138,318
-
243,632,210
182,032,808
16.1
16.2
2010 2009
Rupees Rupees
16.3 Workers' profit participation fund
Opening balance 4,522,343
6,966,333
Interest on fund utilized in company's business 80,728
54,276
4,603,071 7,020,609
Paid during the year (4,522,343) (6,966,333)
80,728 54,276
Allocation for the year 414,042,400 21,791,705 4,468,067
Closing balance 21,872,433 4,522,343
16.3.1 Interest on Workers' profit participation fund has been provided @ 15.5% (2009: 15%)
The company has filed appeal in High Court of Sind, Karachi against the order of Custom / Excise and Sales Tax Appellate Tribunal,
Karachi regarding penalty and additional tax.
The company had provided the excise duty payable on loans from banks / financial institutions. The Supreme Court of Pakistan has
decided the case against the company. The demand against payment of excise duty has not been raised by the authorities.
It represents balance with associated company (MCB Bank Limited) and carries mark up at the rate of 5.00 to 7.00 (June 30, 2009 : 5.50
to 7.00) percent per annum.
Note
2010 2009
Rupees Rupees
17 ACCRUED MARK UP AND INTEREST
Mark up / interest accrued on secured loans
Long term financing 1,860,855
957,233
Short term borrowings 42,594,850
26,718,286
Liabilities against assets subject to finance lease -
5,724
44,455,705 27,681,243
18 SHORT TERM BORROWINGS
Secured - from banking companies
Running finance 30,093,248
114,043,657
Money market loan 205,000,000
200,000,000
Morabaha 815,631,824 738,522,206
1,050,725,072 1,052,565,863
Note
2010 2009
Rupees Rupees Note
Annual Report 2010 59
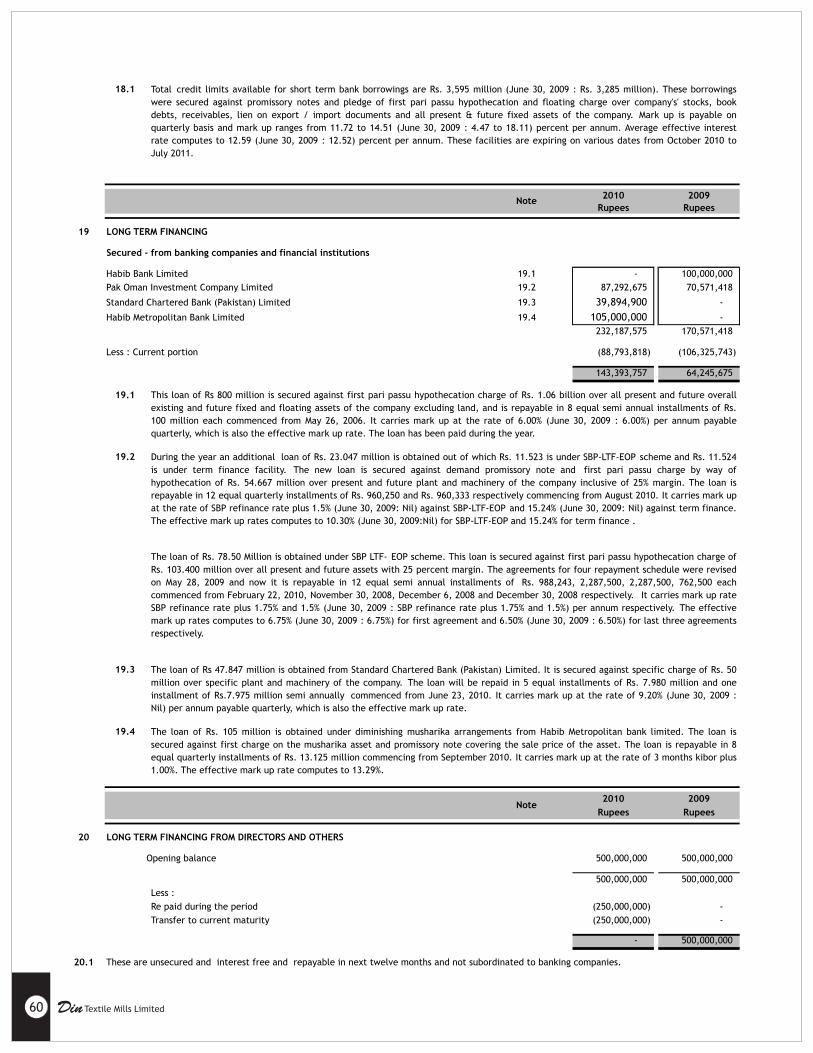
18.1
2010 2009
Rupees Rupees
19 LONG TERM FINANCING
Secured - from banking companies and financial institutions
Habib Bank Limited 19.1 -
100,000,000
Pak Oman Investment Company Limited 19.2 87,292,675
70,571,418
Standard Chartered Bank (Pakistan) Limited 19.3 39,894,900
-
Habib Metropolitan Bank Limited 19.4 105,000,000
-
232,187,575
170,571,418
Less : Current portion (88,793,818)
(106,325,743)
143,393,757
64,245,675
19.1
19.2
19.3
19.4
2010 2009
Rupees Rupees
20 LONG TERM FINANCING FROM DIRECTORS AND OTHERS
Opening balance 500,000,000 500,000,000
500,000,000 500,000,000
Less :
Re paid during the period (250,000,000) -
Transfer to current maturity (250,000,000) -
- 500,000,000
20.1 These are unsecured and interest free and repayable in next twelve months and not subordinated to banking companies.
Note
Total credit limits available for short term bank borrowings are Rs. 3,595 million (June 30, 2009 : Rs. 3,285 million). These borrowings
were secured against promissory notes and pledge of first pari passu hypothecation and floating charge over company's' stocks, book
debts, receivables, lien on export / import documents and all present & future fixed assets of the company. Mark up is payable on
quarterly basis and mark up ranges from 11.72 to 14.51 (June 30, 2009 : 4.47 to 18.11) percent per annum. Average effective interest
rate computes to 12.59 (June 30, 2009 : 12.52) percent per annum. These facilities are expiring on various dates from October 2010 to
July 2011.
The loan of Rs 47.847 million is obtained from Standard Chartered Bank (Pakistan) Limited. It is secured against specific charge of Rs. 50
million over specific plant and machinery of the company. The loan will be repaid in 5 equal installments of Rs. 7.980 million and one
installment of Rs.7.975 million semi annually commenced from June 23, 2010. It carries mark up at the rate of 9.20% (June 30, 2009 :
Nil) per annum payable quarterly, which is also the effective mark up rate.
This loan of Rs 800 million is secured against first pari passu hypothecation charge of Rs. 1.06 billion over all present and future overall
existing and future fixed and floating assets of the company excluding land, and is repayable in 8 equal semi annual installments of Rs.
100 million each commenced from May 26, 2006. It carries mark up at the rate of 6.00% (June 30, 2009 : 6.00%) per annum payable
quarterly, which is also the effective mark up rate. The loan has been paid during the year.
Note
During the year an additional loan of Rs. 23.047 million is obtained out of which Rs. 11.523 is under SBP-LTF-EOP scheme and Rs. 11.524
is under term finance facility. The new loan is secured against demand promissory note and first pari passu charge by way of
hypothecation of Rs. 54.667 million over present and future plant and machinery of the company inclusive of 25% margin. The loan is
repayable in 12 equal quarterly installments of Rs. 960,250 and Rs. 960,333 respectively commencing from August 2010. It carries mark up
at the rate of SBP refinance rate plus 1.5% (June 30, 2009: Nil) against SBP-LTF-EOP and 15.24% (June 30, 2009: Nil) against term finance.
The effective mark up rates computes to 10.30% (June 30, 2009:Nil) for SBP-LTF-EOP and 15.24% for term finance .
The loan of Rs. 105 million is obtained under diminishing musharika arrangements from Habib Metropolitan bank limited. The loan is
secured against first charge on the musharika asset and promissory note covering the sale price of the asset. The loan is repayable in 8
equal quarterly installments of Rs. 13.125 million commencing from September 2010. It carries mark up at the rate of 3 months kibor plus
1.00%. The effective mark up rate computes to 13.29%.
The loan of Rs. 78.50 Million is obtained under SBP LTF- EOP scheme. This loan is secured against first pari passu hypothecation charge of
Rs. 103.400 million over all present and future assets with 25 percent margin. The agreements for four repayment schedule were revised
on May 28, 2009 and now it is repayable in 12 equal semi annual installments of Rs. 988,243, 2,287,500, 2,287,500, 762,500 each
commenced from February 22, 2010, November 30, 2008, December 6, 2008 and December 30, 2008 respectively. It carries mark up rate
SBP refinance rate plus 1.75% and 1.5% (June 30, 2009 : SBP refinance rate plus 1.75% and 1.5%) per annum respectively. The effective
mark up rates computes to 6.75% (June 30, 2009 : 6.75%) for first agreement and 6.50% (June 30, 2009 : 6.50%) for last three agreements
respectively.
60 Din Textile Mills Limited

21 LIABILITIES AGAINST ASSETS SUBJECT TO FINANCE LEASE
15,960,359 2,031,613 13,928,746 13,875,419 2,403,960 11,471,459
18,412,002 2,104,586 16,307,416 21,248,378 1,751,917 19,496,461
34,372,361
4,136,199
30,236,162
35,123,797
4,155,877
30,967,920
21.1
2010 2009
Rupees Rupees
22 STAFF RETIREMENT BENEFITS - GRATUITY
22.1 Movement in the net liability recognized in the balance sheet
Opening net liability 52,008,160
45,292,448
Expense for the year 22.2 17,815,405
17,868,608
69,823,565
63,161,056
Benefits paid during the year (20,094,853)
(11,152,896)
Closing net liability 49,728,712
52,008,160
22.2 Expense recognized in the Income statement
Current service cost 11,695,950
11,522,833
Interest cost 5,494,504 5,497,741
Actuarial loss recognized 624,951 848,034
17,815,405
17,868,608
22.3 Movement in the present value of defined benefit obligation
Present value of defined benefit obligation 62,835,084
57,205,102
Current service cost 11,695,950
11,522,833
Interest cost 5,494,504
5,497,741
Actuarial loss / (gain) 3,047,302
(237,696)
Benefits paid (20,094,853)
(11,152,896)
62,977,987
62,835,084
22.4 Historical information
2010 2009 2008 2007 2006
62,977,987 62,835,084 57,205,102 46,696,855 35,879,389
(3,047,302) 237,696 (4,194,890) (5,833,393) (3,295,841)
RupeesRupees
Present value of
minimum lease
payments
Financial charges
for future periods
Present value of
minimum lease
payments
Present value of defined benefit
obligation
Minimum lease
payments
Financial charges for
future periods
2010
Up to one year
Experience adjustments on plan
liabilities
2009
Minimum lease
payments
Later than one year but
not later than five years
Note
The total lease rentals due under the lease agreements aggregate Rs. 34.372 million (June 30, 2009 : Rs. 35.124 million) and are payable
in equal monthly / semi annually installments under various lease agreements, latest by 2013. The present value of minimum lease
payments has been discounted at interest rate implicit in the lease, which equates to an interest rate of approximately 10.00 to 14.32
(June 30, 2009 : 10.00 to 10.35) percent per annum. If any lease is terminated, the lessee is required to pay the purchase price specified
in the lease agreements. The cost of repairs and insurance are borne by the lessee. The liability is partially secured by a deposit of Rs.
2.693 million (June 30, 2009 : Rs. 2.239 million) and demand promissory note. The estimated residual value of assets acquired on finance
lease is Rs. 2.693 million (June 30, 2009 : Rs. 2.239 million). The company intend to exercise the option of purchasing the leased assets at
residual value upon completion of lease term. The number of maximum / minimum monthly lease rentals payable are 34 and 6
respectively.
Annual Report 2010 61
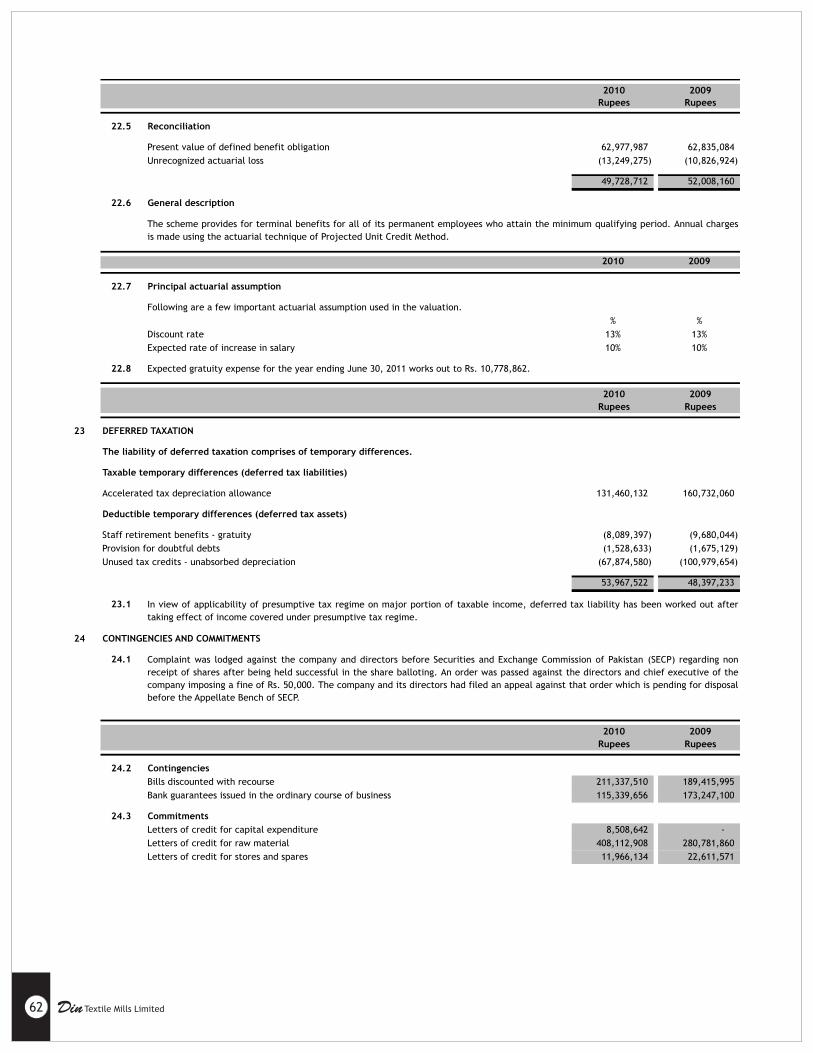
2010 2009
Rupees Rupees
22.5 Reconciliation
Present value of defined benefit obligation 62,977,987 62,835,084
Unrecognized actuarial loss (13,249,275) (10,826,924)
49,728,712 52,008,160
22.6 General description
2010 2009
22.7 Principal actuarial assumption
Following are a few important actuarial assumption used in the valuation.
% %
Discount rate 13% 13%
Expected rate of increase in salary 10% 10%
22.8 Expected gratuity expense for the year ending June 30, 2011 works out to Rs. 10,778,862.
2010 2009
Rupees Rupees
23 DEFERRED TAXATION
The liability of deferred taxation comprises of temporary differences.
Taxable temporary differences (deferred tax liabilities)
Accelerated tax depreciation allowance 131,460,132
160,732,060
Deductible temporary differences (deferred tax assets)
Staff retirement benefits - gratuity (8,089,397)
(9,680,044)
Provision for doubtful debts (1,528,633)
(1,675,129)
Unused tax credits - unabsorbed depreciation (67,874,580)
(100,979,654)
53,967,522
48,397,233
23.1
24 CONTINGENCIES AND COMMITMENTS
24.1
2010 2009
Rupees Rupees
24.2 Contingencies
Bills discounted with recourse 211,337,510 189,415,995
Bank guarantees issued in the ordinary course of business 115,339,656 173,247,100
24.3 Commitments
Letters of credit for capital expenditure 8,508,642 -
Letters of credit for raw material 408,112,908 280,781,860
Letters of credit for stores and spares 11,966,134 22,611,571
In view of applicability of presumptive tax regime on major portion of taxable income, deferred tax liability has been worked out after
taking effect of income covered under presumptive tax regime.
Complaint was lodged against the company and directors before Securities and Exchange Commission of Pakistan (SECP) regarding non
receipt of shares after being held successful in the share balloting. An order was passed against the directors and chief executive of the
company imposing a fine of Rs. 50,000. The company and its directors had filed an appeal against that order which is pending for disposal
before the Appellate Bench of SECP.
The scheme provides for terminal benefits for all of its permanent employees who attain the minimum qualifying period. Annual charges
is made using the actuarial technique of Projected Unit Credit Method.
62 Din Textile Mills Limited
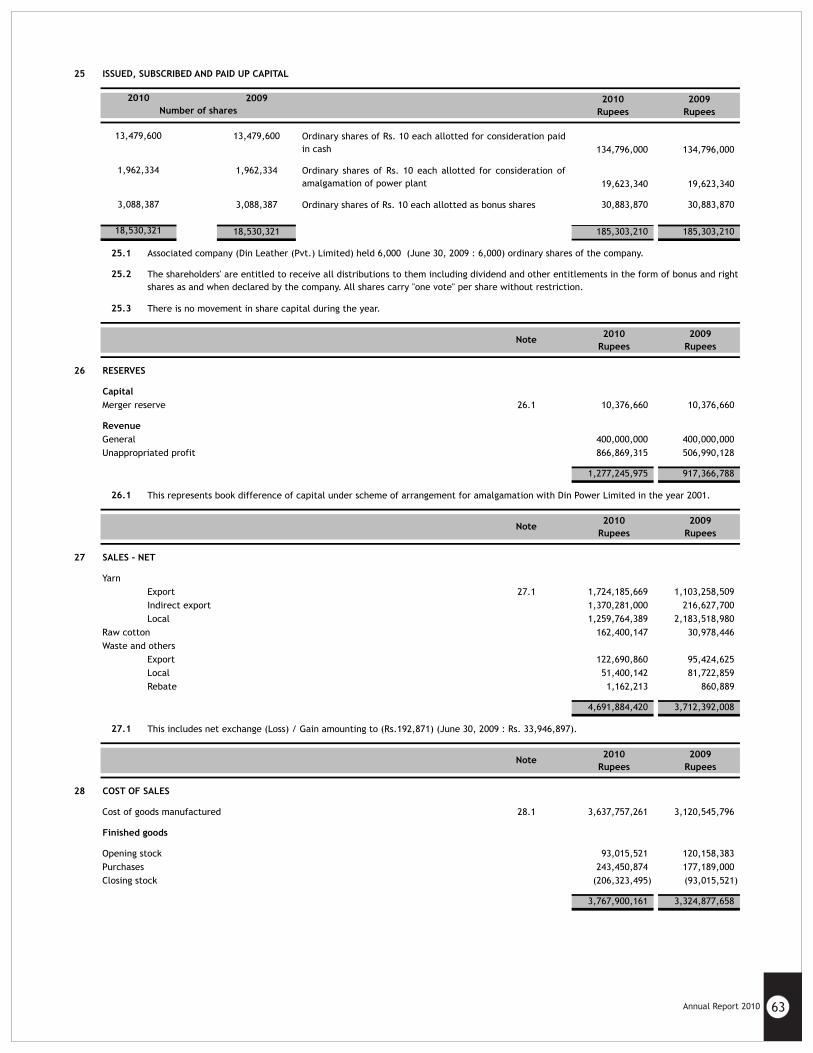
25 ISSUED, SUBSCRIBED AND PAID UP CAPITAL
2009 2010 2009
Rupees Rupees
13,479,600
134,796,000 134,796,000
1,962,334
19,623,340 19,623,340
3,088,387 30,883,870 30,883,870
18,530,321 185,303,210 185,303,210
25.1 Associated company (Din Leather (Pvt.) Limited) held 6,000 (June 30, 2009 : 6,000) ordinary shares of the company.
25.2
25.3
2010 2009
Rupees Rupees
26 RESERVES
Capital
Merger reserve 26.1 10,376,660
10,376,660
Revenue
General 400,000,000
400,000,000
Unappropriated profit 866,869,315
506,990,128
1,277,245,975
917,366,788
26.1
2010 2009
Rupees Rupees
27 SALES - NET
Yarn
Export 27.1 1,724,185,669
1,103,258,509
Indirect export 1,370,281,000
216,627,700
Local 1,259,764,389
2,183,518,980
Raw cotton 162,400,147
30,978,446
Waste and others
Export 122,690,860
95,424,625
Local 51,400,142
81,722,859
Rebate 1,162,213
860,889
4,691,884,420
3,712,392,008
27.1
2010 2009
Rupees Rupees
28 COST OF SALES
Cost of goods manufactured 28.1 3,637,757,261
3,120,545,796
Finished goods
Opening stock 93,015,521
120,158,383
Purchases 243,450,874
177,189,000
Closing stock (206,323,495) (93,015,521)
3,767,900,161 3,324,877,658
Ordinary shares of Rs. 10 each allotted for consideration of
amalgamation of power plant
Number of shares
1,962,334
13,479,600 Ordinary shares of Rs. 10 each allotted for consideration paid
in cash
2010
Note
Note
This includes net exchange (Loss) / Gain amounting to (Rs.192,871) (June 30, 2009 : Rs. 33,946,897).
There is no movement in share capital during the year.
This represents book difference of capital under scheme of arrangement for amalgamation with Din Power Limited in the year 2001.
Note
Ordinary shares of Rs. 10 each allotted as bonus shares
18,530,321
The shareholders' are entitled to receive all distributions to them including dividend and other entitlements in the form of bonus and right
shares as and when declared by the company. All shares carry "one vote" per share without restriction.
3,088,387
Annual Report 2010 63
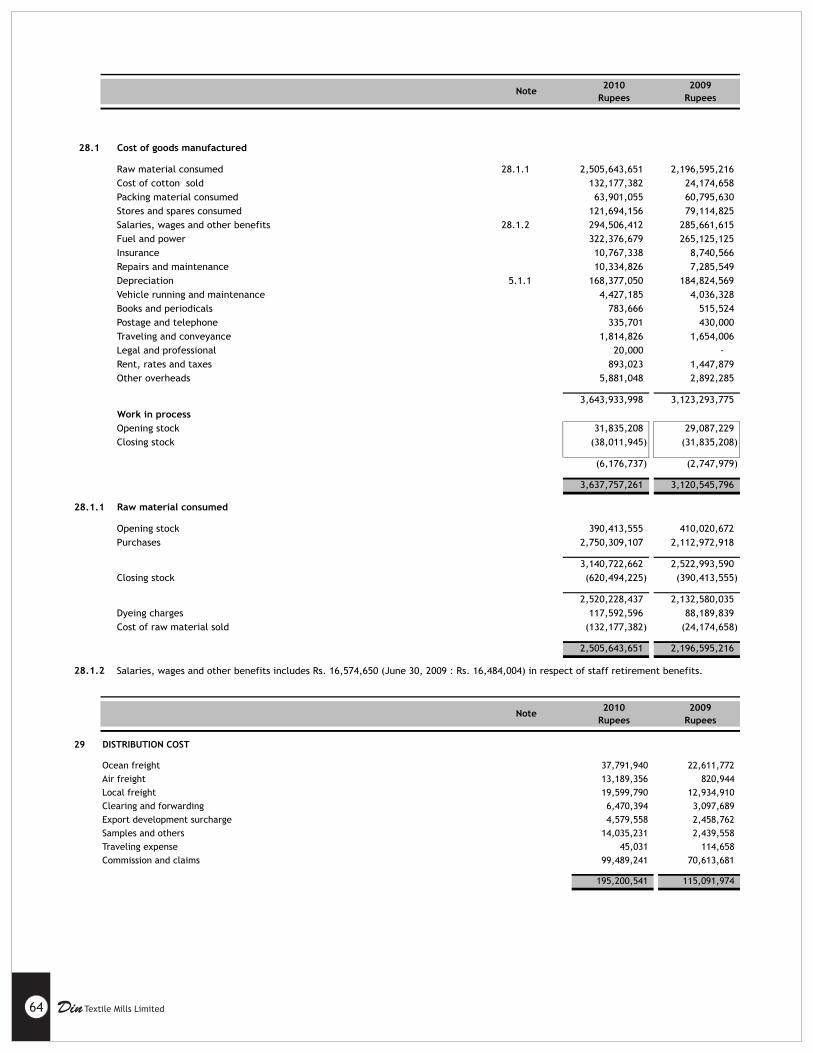
28.1 Cost of goods manufactured
Raw material consumed 28.1.1 2,505,643,651 2,196,595,216
Cost of cotton sold 132,177,382 24,174,658
Packing material consumed 63,901,055 60,795,630
Stores and spares consumed 121,694,156 79,114,825
Salaries, wages and other benefits 28.1.2 294,506,412
285,661,615
Fuel and power 322,376,679
265,125,125
Insurance 10,767,338
8,740,566
Repairs and maintenance 10,334,826
7,285,549
Depreciation 5.1.1 168,377,050
184,824,569
Vehicle running and maintenance 4,427,185
4,036,328
Books and periodicals 783,666
515,524
Postage and telephone 335,701
430,000
Traveling and conveyance 1,814,826
1,654,006
Legal and professional 20,000
-
Rent, rates and taxes 893,023
1,447,879
Other overheads 5,881,048
2,892,285
3,643,933,998 3,123,293,775
Work in process
Opening stock 31,835,208
29,087,229
Closing stock (38,011,945)
(31,835,208)
(6,176,737)
(2,747,979)
3,637,757,261
3,120,545,796
28.1.1 Raw material consumed
Opening stock 390,413,555
410,020,672
Purchases 2,750,309,107
2,112,972,918
3,140,722,662
2,522,993,590
Closing stock (620,494,225)
(390,413,555)
2,520,228,437
2,132,580,035
Dyeing charges 117,592,596 88,189,839
Cost of raw material sold (132,177,382) (24,174,658)
2,505,643,651 2,196,595,216
28.1.2 Salaries, wages and other benefits includes Rs. 16,574,650 (June 30, 2009 : Rs. 16,484,004) in respect of staff retirement benefits.
2010 2009
Rupees Rupees
29 DISTRIBUTION COST
Ocean freight 37,791,940
22,611,772
Air freight 13,189,356
820,944
Local freight 19,599,790
12,934,910
Clearing and forwarding 6,470,394
3,097,689
Export development surcharge 4,579,558
2,458,762
Samples and others 14,035,231
2,439,558
Traveling expense 45,031
114,658
Commission and claims 99,489,241
70,613,681
195,200,541
115,091,974
Note
2010 2009
Rupees Rupees
Note
64 Din Textile Mills Limited
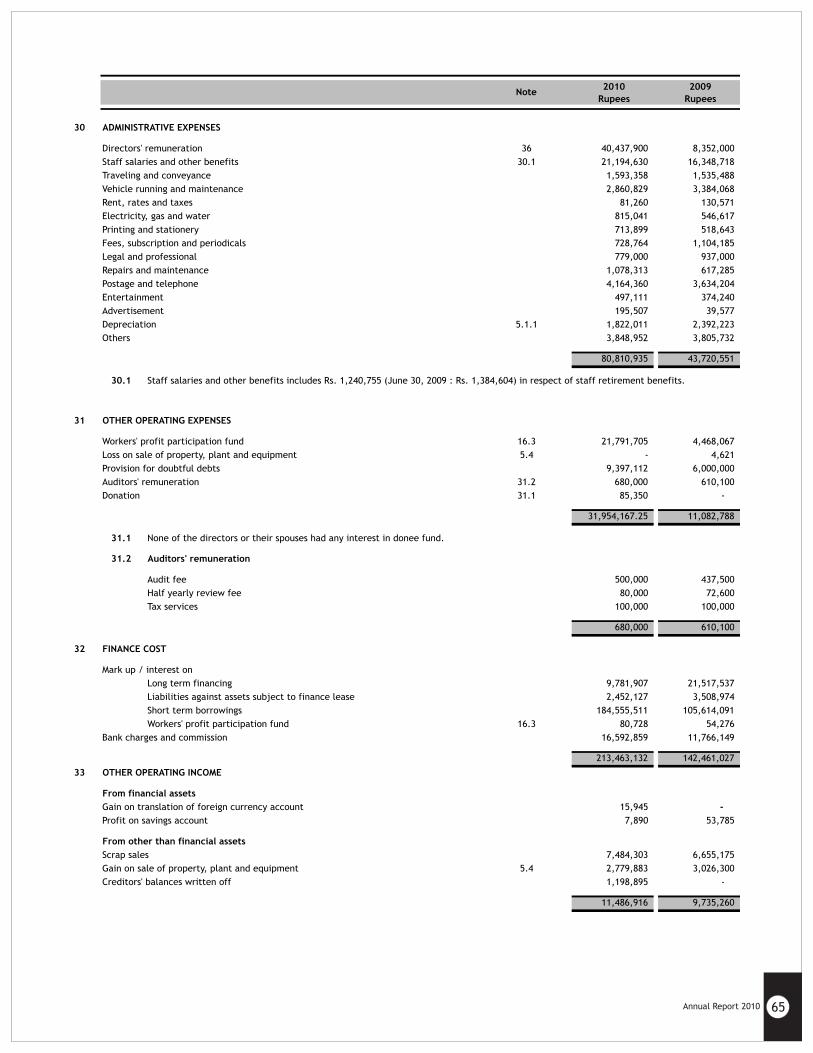
30 ADMINISTRATIVE EXPENSES
Directors' remuneration 36 40,437,900 8,352,000
Staff salaries and other benefits 30.1 21,194,630 16,348,718
Traveling and conveyance 1,593,358 1,535,488
Vehicle running and maintenance 2,860,829 3,384,068
Rent, rates and taxes 81,260 130,571
Electricity, gas and water 815,041 546,617
Printing and stationery 713,899 518,643
Fees, subscription and periodicals 728,764 1,104,185
Legal and professional 779,000 937,000
Repairs and maintenance 1,078,313 617,285
Postage and telephone 4,164,360 3,634,204
Entertainment 497,111
374,240
Advertisement 195,507
39,577
Depreciation 5.1.1 1,822,011
2,392,223
Others 3,848,952
3,805,732
80,810,935
43,720,551
30.1
31 OTHER OPERATING EXPENSES
Workers' profit participation fund 16.3 21,791,705
4,468,067
Loss on sale of property, plant and equipment 5.4 - 4,621
Provision for doubtful debts 9,397,112 6,000,000
Auditors' remuneration 31.2 680,000 610,100
Donation 31.1 85,350
-
31,954,167.25
11,082,788
31.1
31.2 Auditors' remuneration
Audit fee 500,000
437,500
Half yearly review fee 80,000
72,600
Tax services 100,000
100,000
680,000
610,100
32 FINANCE COST
Mark up / interest on
Long term financing 9,781,907
21,517,537
Liabilities against assets subject to finance lease 2,452,127
3,508,974
Short term borrowings 184,555,511
105,614,091
Workers' profit participation fund 16.3 80,728
54,276
Bank charges and commission 16,592,859
11,766,149
213,463,132
142,461,027
2010 2009
Rupees Rupees
33 OTHER OPERATING INCOME
From financial assets
Gain on translation of foreign currency account 15,945
-
Profit on savings account 7,890
53,785
From other than financial assets
Scrap sales 7,484,303 6,655,175
Gain on sale of property, plant and equipment 5.4 2,779,883 3,026,300
Creditors' balances written off 1,198,895 -
11,486,916 9,735,260
Note
None of the directors or their spouses had any interest in donee fund.
Staff salaries and other benefits includes Rs. 1,240,755 (June 30, 2009 : Rs. 1,384,604) in respect of staff retirement benefits.
Annual Report 2010 65
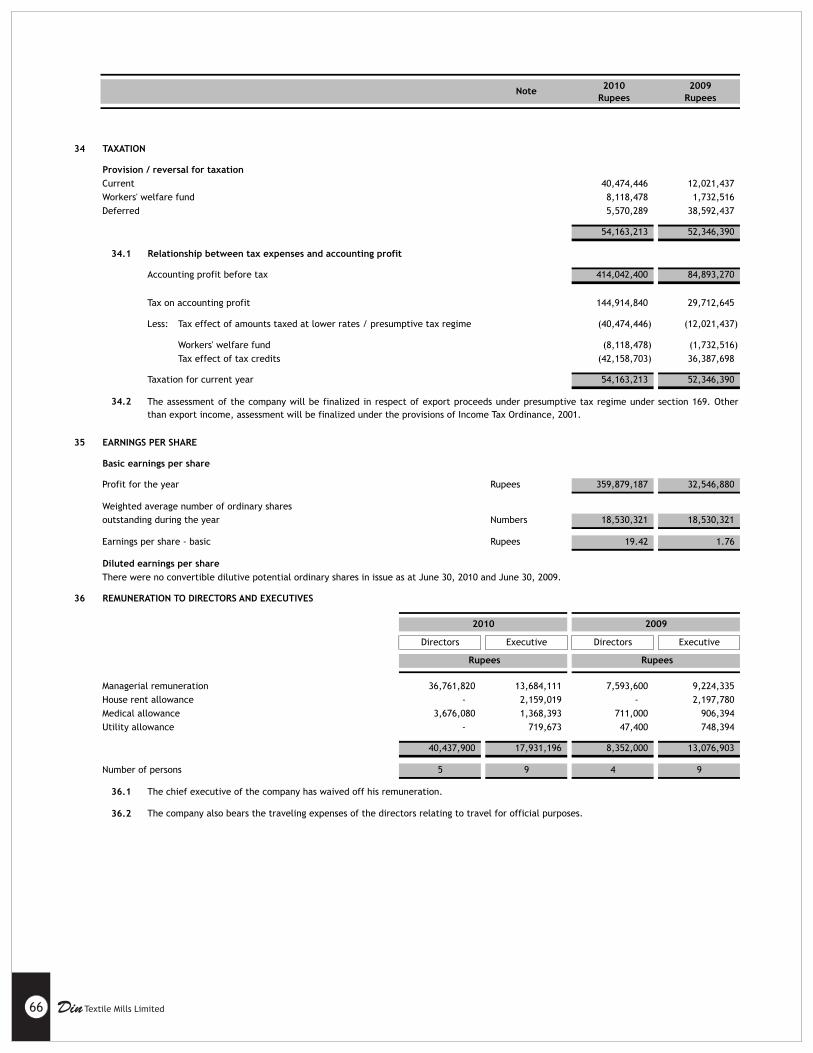
34 TAXATION
Provision / reversal for taxation
Current 40,474,446 12,021,437
Workers' welfare fund 8,118,478 1,732,516
Deferred 5,570,289 38,592,437
54,163,213 52,346,390
34.1 Relationship between tax expenses and accounting profit
Accounting profit before tax 414,042,400
84,893,270
Tax on accounting profit 144,914,840
29,712,645
Less: Tax effect of amounts taxed at lower rates / presumptive tax regime (40,474,446)
(12,021,437)
Workers' welfare fund (8,118,478)
(1,732,516)
Tax effect of tax credits (42,158,703)
36,387,698
Taxation for current year 54,163,213
52,346,390
34.2
35 EARNINGS PER SHARE
Basic earnings per share
Profit for the year Rupees 359,879,187
32,546,880
Weighted average number of ordinary shares
outstanding during the year Numbers 18,530,321
18,530,321
Earnings per share - basic Rupees 19.42
1.76
Diluted earnings per share
There were no convertible dilutive potential ordinary shares in issue as at June 30, 2010 and June 30, 2009.
36 REMUNERATION TO DIRECTORS AND EXECUTIVES
Directors Executive Directors Executive
Managerial remuneration 36,761,820
13,684,111
7,593,600
9,224,335
House rent allowance -
2,159,019
-
2,197,780
Medical allowance 3,676,080
1,368,393
711,000
906,394
Utility allowance - 719,673 47,400 748,394
40,437,900 17,931,196 8,352,000 13,076,903
Number of persons 5 9 4 9
36.1 The chief executive of the company has waived off his remuneration.
36.2 The company also bears the traveling expenses of the directors relating to travel for official purposes.
Rupees Rupees
The assessment of the company will be finalized in respect of export proceeds under presumptive tax regime under section 169. Other
than export income, assessment will be finalized under the provisions of Income Tax Ordinance, 2001.
2010 2009
2010 2009
Rupees Rupees Note
66 Din Textile Mills Limited
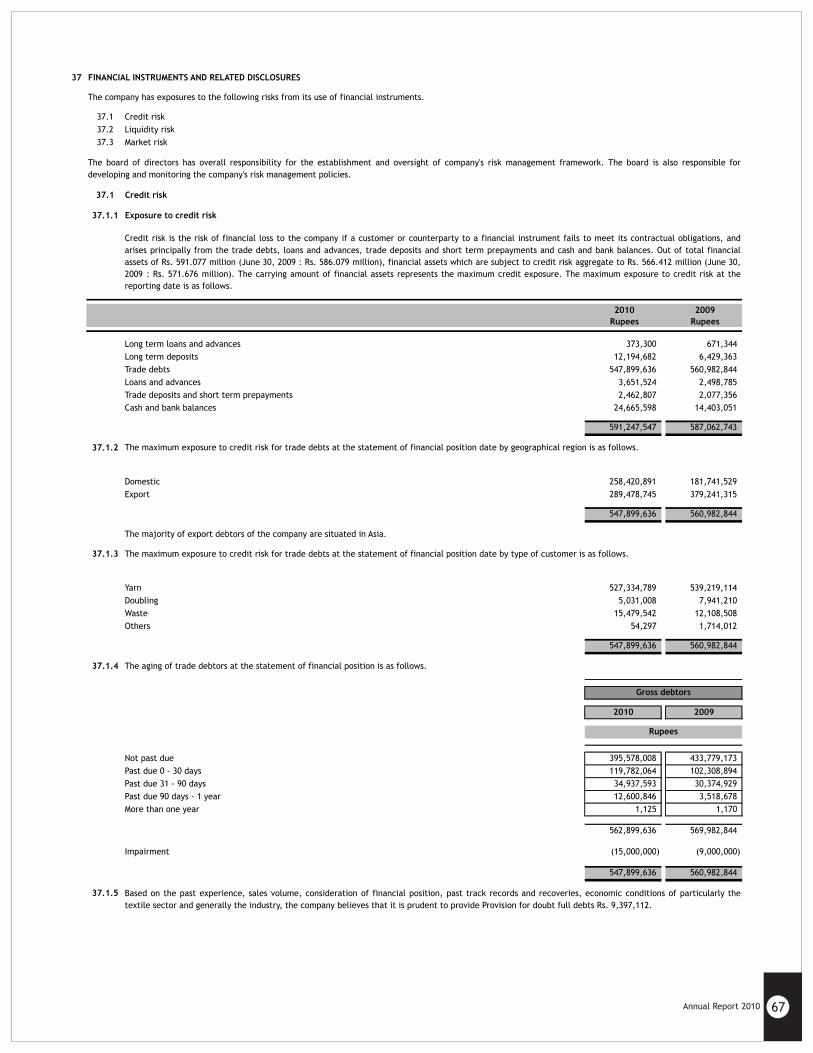
37 FINANCIAL INSTRUMENTS AND RELATED DISCLOSURES
The company has exposures to the following risks from its use of financial instruments.
37.1 Credit risk
37.2 Liquidity risk
37.3 Market risk
37.1 Credit risk
37.1.1 Exposure to credit risk
2010 2009
Rupees Rupees
Long term loans and advances 373,300
671,344
Long term deposits 12,194,682
6,429,363
Trade debts 547,899,636
560,982,844
Loans and advances 3,651,524
2,498,785
Trade deposits and short term prepayments 2,462,807
2,077,356
Cash and bank balances 24,665,598
14,403,051
591,247,547
587,062,743
37.1.2
Domestic 258,420,891 181,741,529
Export 289,478,745 379,241,315
547,899,636
560,982,844
37.1.3 The maximum exposure to credit risk for trade debts at the date by type of customer is as follows.statement of financial position
Yarn 527,334,789
539,219,114
Doubling 5,031,008
7,941,210
Waste 15,479,542
12,108,508
Others 54,297
1,714,012
547,899,636
560,982,844
37.1.4 The aging of trade debtors at the is as follows.statement of financial position
2010 2009
Not past due 395,578,008 433,779,173
Past due 0 - 30 days 119,782,064 102,308,894
Past due 31 - 90 days 34,937,593 30,374,929
Past due 90 days - 1 year 12,600,846 3,518,678
More than one year 1,125 1,170
562,899,636 569,982,844
Impairment (15,000,000) (9,000,000)
547,899,636 560,982,844
37.1.5 Based on the past experience, sales volume, consideration of financial position, past track records and recoveries, economic conditions of particularly the
textile sector and generally the industry, the company believes that it is prudent to provide Provision for doubt full debts Rs. 9,397,112.
The majority of export debtors of the company are situated in Asia.
Gross debtors
Rupees
The board of directors has overall responsibility for the establishment and oversight of company's risk management framework. The board is also responsible for
developing and monitoring the company's risk management policies.
Credit risk is the risk of financial loss to the company if a customer or counterparty to a financial instrument fails to meet its contractual obligations, and
arises principally from the trade debts, loans and advances, trade deposits and short term prepayments and cash and bank balances. Out of total financial
assets of Rs. 591.077 million (June 30, 2009 : Rs. 586.079 million), financial assets which are subject to credit risk aggregate to Rs. 566.412 million (June 30,
2009 : Rs. 571.676 million). The carrying amount of financial assets represents the maximum credit exposure. The maximum exposure to credit risk at the
reporting date is as follows.
The maximum exposure to credit risk for trade debts at the statement of financial position date by geographical region is as follows.
Annual Report 2010 67
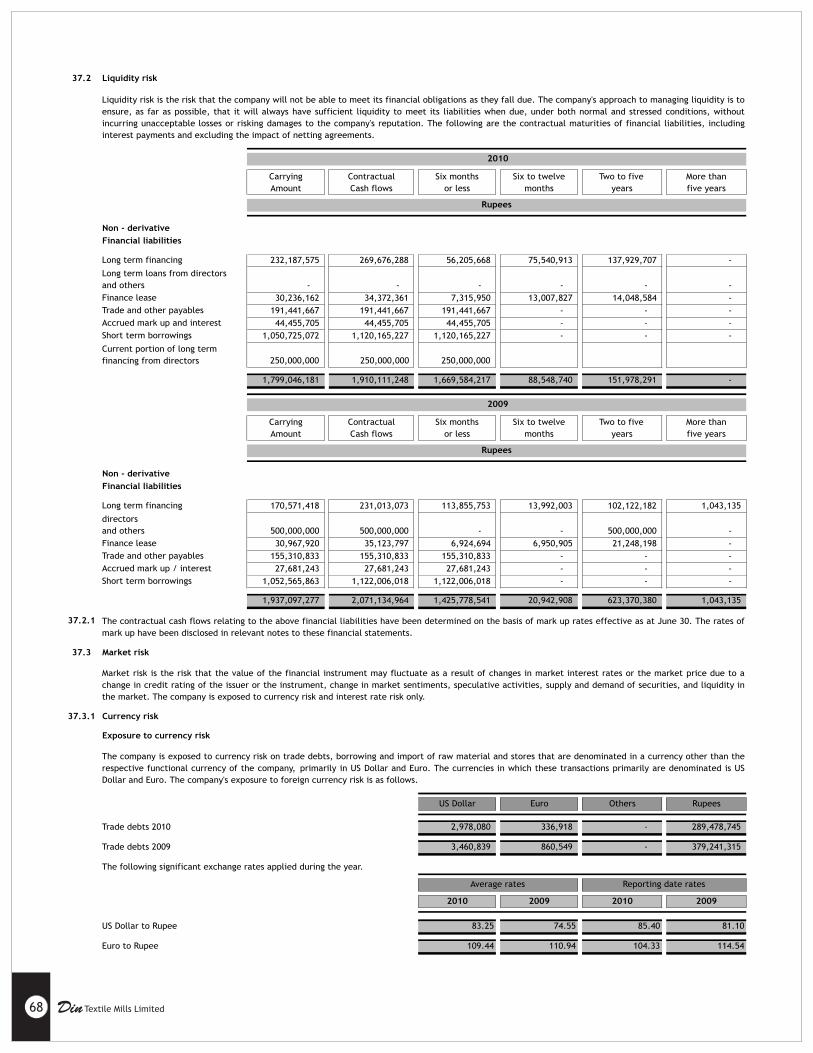
37.2 Liquidity risk
Carrying
Amount
Contractual
Cash flows
Six months
or less
Six to twelve
months
Two to five
years
More than
five years
232,187,575
269,676,288
56,205,668
75,540,913
137,929,707
-
-
-
-
-
-
-
30,236,162
34,372,361
7,315,950
13,007,827
14,048,584
-
191,441,667
191,441,667
191,441,667
-
-
-
44,455,705
44,455,705
44,455,705
-
-
-
1,050,725,072
1,120,165,227
1,120,165,227
-
-
-
1,799,046,181
1,910,111,248
1,669,584,217
88,548,740
151,978,291
-
Carrying
Amount
Contractual
Cash flows
Six months
or less
Six to twelve
months
Two to five
years
More than
five years
170,571,418
231,013,073
113,855,753
13,992,003
102,122,182
1,043,135
500,000,000
500,000,000
-
-
500,000,000
-
30,967,920 35,123,797 6,924,694 6,950,905 21,248,198 -
155,310,833 155,310,833 155,310,833 - - -
27,681,243
27,681,243
27,681,243
-
-
-
1,052,565,863
1,122,006,018
1,122,006,018
-
-
-
1,937,097,277
2,071,134,964
1,425,778,541
20,942,908
623,370,380
1,043,135
37.2.1
37.3 Market risk
37.3.1 Currency risk
Exposure to currency risk
US Dollar Euro Others Rupees
Trade debts 2010 2,978,080 336,918 - 289,478,745
Trade debts 2009 3,460,839 860,549 - 379,241,315
The following significant exchange rates applied during the year.
2010 2009 2010 2009
US Dollar to Rupee 83.25 74.55 85.40 81.10
Euro to Rupee 109.44 110.94 104.33 114.54
2010
Financial liabilities
Liquidity risk is the risk that the company will not be able to meet its financial obligations as they fall due. The company's approach to managing liquidity is to
ensure, as far as possible, that it will always have sufficient liquidity to meet its liabilities when due, under both normal and stressed conditions, without
incurring unacceptable losses or risking damages to the company's reputation. The following are the contractual maturities of financial liabilities, including
interest payments and excluding the impact of netting agreements.
Long term financing
Long term loans from directors
and others
Finance lease
Trade and other payables
Rupees
Non - derivative
The contractual cash flows relating to the above financial liabilities have been determined on the basis of mark up rates effective as at June 30. The rates of
mark up have been disclosed in relevant notes to these financial statements.
Market risk is the risk that the value of the financial instrument may fluctuate as a result of changes in market interest rates or the market price due to a
change in credit rating of the issuer or the instrument, change in market sentiments, speculative activities, supply and demand of securities, and liquidity in
the market. The company is exposed to currency risk and interest rate risk only.
Finance lease
Accrued mark up and interest
Accrued mark up / interest
Rupees
Non - derivative
Financial liabilities
Short term borrowings
2009
Long term financing
Reporting date ratesAverage rates
The company is exposed to currency risk on trade debts, borrowing and import of raw material and stores that are denominated in a currency other than the
respective functional currency of the company, primarily in US Dollar and Euro. The currencies in which these transactions primarily are denominated is US
Dollar and Euro. The company's exposure to foreign currency risk is as follows.
Short term borrowings
directors
and others
Trade and other payables
Current portion of long term
financing from directors 250,000,000 250,000,000 250,000,000
68 Din Textile Mills Limited

Sensitivity analysis
2010 2009
Rupees Rupees
US Dollar (12,716,402) (14,033,702)
Euro (1,757,535) (4,928,364)
37.3.2 Interest rate risk
Fixed rate instruments
Financial assets - -
Financial liabilities 233,693,961 201,539,338
Variable rate instruments
Financial assets 15,189
14,528
Financial liabilities 1,053,374,563
1,052,565,863
Fair value sensitivity analysis for fixed rate instruments
Cash flow sensitivity analysis for variable rate instruments
10,533,746 (10,533,746) - -
10,525,659
(10,525,659)
-
-
37.4 Fair value of financial assets and liabilities
37.5 Off statement of financial position items
Bills discounted with recourse 211,337,510 189,415,995
Bank guarantees issued in ordinary course of business 115,339,656 173,247,100
Letters of credit for raw material
Letters of credit for capital expenditure
408,112,908
8,508,642
280,781,860
-
Letters of credit for stores and spares 11,966,134 22,611,571
37.6
The sensitivity analysis prepared is not necessarily indicative of the effects on profit for the year and liabilities of the company.
5% strengthening of Pak Rupee against the following currencies at June 30, would have increased / (decreased) equity and income statement by the amount
shown below. The analysis assumes that all other variables, in particular interest rates, remain constant. 5% weakening of Pak Rupee against the above
currencies at periods ends would have had the equal but opposites effect on the above currencies to the amount shown below, on the basis that all other
variables remain constant.
100 bps
increase
100 bps
decrease
100 bps
increase
100 bps
decrease
Interest rate risk is the risk that the fair value or future cash flows of a financial instrument will fluctuate because of changes in market interest rates.
Majority of the interest rate exposures arises from short and long term borrowings from bank and term deposits and deposits in PLS saving accounts with
banks. At reporting date the interest rate profile of the company's interest bearing financial instrument is as follows.
The company does not account for any fixed rate financial assets and liabilities at fair value through income statement. Therefore, a change in interest rates at
reporting date would not affect income statement.
Cash flow sensitivity - variable rate instruments 2009
The effective rate of interest / mark up for the monetary financial assets and liabilities are mentioned in respective notes to the financial statements.
A change of 100 basis points in interest rates at reporting date would have increased / (decreased) equity and profit or loss by the amounts shown below. This
analysis assumes that all other variables, in particular foreign currency rates, remain constant. The analysis is performed on the same basis for June 30, 2009.
The carrying value of all financial instruments reflected in the financial statements approximate to their fair values. Fair value is determined on the basis of
objective evidence at each reporting date.
Rupees
Cash flow sensitivity - variable rate instruments 2010
Profit and loss Equity
Annual Report 2010 69
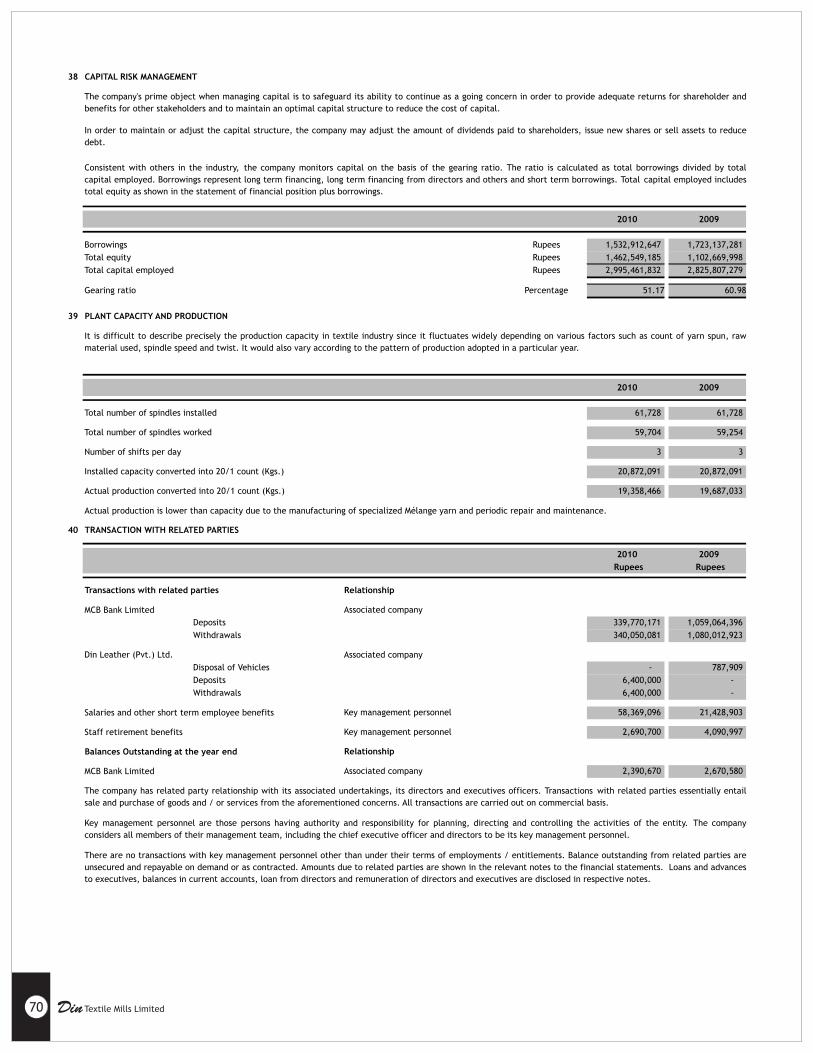
38 CAPITAL RISK MANAGEMENT
2010 2009
Rupees 1,532,912,647 1,723,137,281
Rupees 1,462,549,185 1,102,669,998
Rupees 2,995,461,832 2,825,807,279
Percentage 51.17 60.98
39 PLANT CAPACITY AND PRODUCTION
2010 2009
Total number of spindles installed 61,728
61,728
Total number of spindles worked 59,704
59,254
Number of shifts per day 3
3
Installed capacity converted into 20/1 count (Kgs.) 20,872,091 20,872,091
Actual production converted into 20/1 count (Kgs.) 19,358,466
19,687,033
40 TRANSACTION WITH RELATED PARTIES
2010 2009
Rupees Rupees
Transactions with related parties Relationship
Associated company
Deposits 339,770,171
1,059,064,396
Withdrawals 340,050,081
1,080,012,923
Din Leather (Pvt.) Ltd. Associated company
Disposal of Vehicles -
787,909
Deposits 6,400,000
-
Withdrawals 6,400,000
-
Key management personnel 58,369,096
21,428,903
Key management personnel 2,690,700
4,090,997
Balances Outstanding at the year end Relationship
Associated company 2,390,670
2,670,580
The company's prime object when managing capital is to safeguard its ability to continue as a going concern in order to provide adequate returns for shareholder and
benefits for other stakeholders and to maintain an optimal capital structure to reduce the cost of capital.
In order to maintain or adjust the capital structure, the company may adjust the amount of dividends paid to shareholders, issue new shares or sell assets to reduce
debt.
Consistent with others in the industry, the company monitors capital on the basis of the gearing ratio. The ratio is calculated as total borrowings divided by total
capital employed. Borrowings represent long term financing, long term financing from directors and others and short term borrowings. Total capital employed includes
total equity as shown in the statement of financial position plus borrowings.
Total capital employed
It is difficult to describe precisely the production capacity in textile industry since it fluctuates widely depending on various factors such as count of yarn spun, raw
material used, spindle speed and twist. It would also vary according to the pattern of production adopted in a particular year.
There are no transactions with key management personnel other than under their terms of employments / entitlements. Balance outstanding from related parties are
unsecured and repayable on demand or as contracted. Amounts due to related parties are shown in the relevant notes to the financial statements. Loans and advances
to executives, balances in current accounts, loan from directors and remuneration of directors and executives are disclosed in respective notes.
Actual production is lower than capacity due to the manufacturing of specialized Mélange yarn and periodic repair and maintenance.
Borrowings
Total equity
Gearing ratio
The company has related party relationship with its associated undertakings, its directors and executives officers. Transactions with related parties essentially entail
sale and purchase of goods and / or services from the aforementioned concerns. All transactions are carried out on commercial basis.
Key management personnel are those persons having authority and responsibility for planning, directing and controlling the activities of the entity. The company
considers all members of their management team, including the chief executive officer and directors to be its key management personnel.
MCB Bank Limited
Salaries and other short term employee benefits
Staff retirement benefits
MCB Bank Limited
70 Din Textile Mills Limited
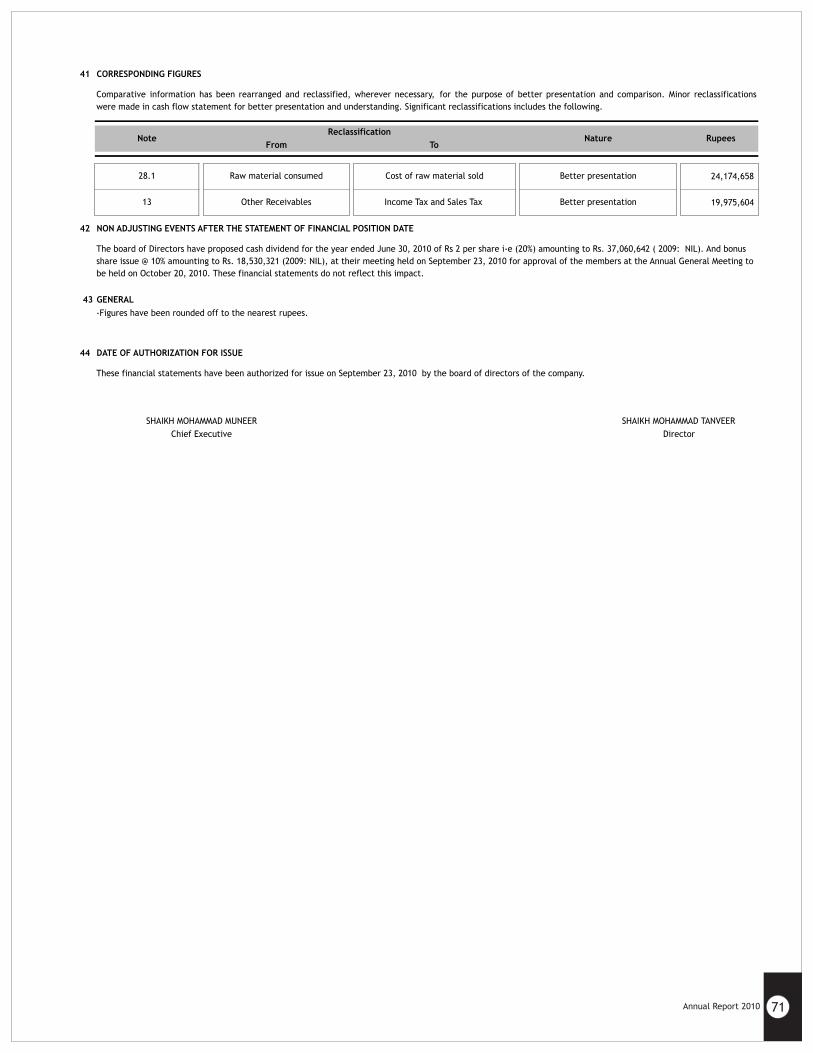
Annual Report 2010 71
41 CORRESPONDING FIGURES
24,174,658
19,975,604
42 NON ADJUSTING EVENTS AFTER THE STATEMENT OF FINANCIAL POSITION DATE
43 GENERAL
44 DATE OF AUTHORIZATION FOR ISSUE
SHAIKH MOHAMMAD MUNEER SHAIKH MOHAMMAD TANVEER
Chief Executive Director
The board of Directors have proposed cash dividend for the year ended June 30, 2010 of Rs 2 per share i-e (20%) amounting to Rs. 37,060,642 ( 2009: NIL). And bonus
share issue @ 10% amounting to Rs. 18,530,321 (2009: NIL), at their meeting held on September 23, 2010 for approval of the members at the Annual General Meeting to
be held on October 20, 2010. These financial statements do not reflect this impact.
ToNote
Comparative information has been rearranged and reclassified, wherever necessary, for the purpose of better presentation and comparison. Minor reclassifications
were made in cash flow statement for better presentation and understanding. Significant reclassifications includes the following.
ReclassificationNature
These financial statements have been authorized for issue on September 23, 2010 by the board of directors of the company.
28.1 Raw material consumed Cost of raw material sold Better presentation
Rupees From
13 Other Receivables Income Tax and Sales Tax Better presentation
-Figures have been rounded off to the nearest rupees.
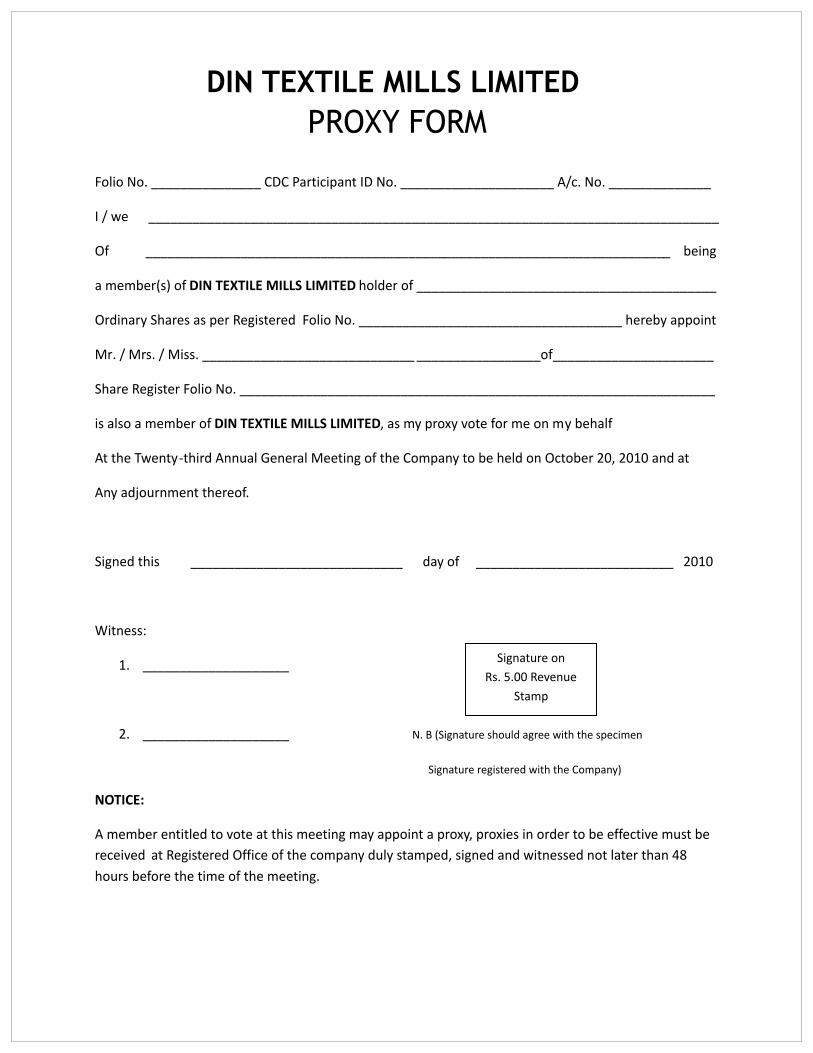
DIN TEXTILE MILLS LIMITED PROXY FORM
Folio No. _______________ CDC Participant ID No. _____________________ A/c. No. ______________
I / we ______________________________________________________________________________
Of ________________________________________________________________________ being
a member(s) of DIN TEXTILE MILLS LIMITED holder of _________________________________________
Ordinary Shares as per Registered Folio No. ____________________________________ hereby appoint
Mr. / Mrs. / Miss. _____________________________ _________________of______________________
Share Register Folio No. _________________________________________________________________
is also a member of DIN TEXTILE MILLS LIMITED, as my proxy vote for me on my behalf
At the Twenty-third Annual General Meeting of the Company to be held on October 20, 2010 and at
Any adjournment thereof.
Signed this _____________________________ day of ___________________________ 2010
Witness:
1. ____________________
2. ____________________ N. B (Signature should agree with the specimen
Signature registered with the Company)
NOTICE:
A member entitled to vote at this meeting may appoint a proxy, proxies in order to be effective must be
received at Registered Office of the company duly stamped, signed and witnessed not later than 48
hours before the time of the meeting.
Signature on
Rs. 5.00 Revenue
Stamp


