
Guy F. CarusoAdministrator
Energy Information Administration
The Council of State GovernmentsSpring Conference
Lexington, KYMay 29, 2008
Annual Energy Outlook 2008

$0
$25
$50
$75
$100
$125
$150
$175
$200
1980 1995 2006 2015 2030
World oil prices are higher in all AEO2008 casesnominal dollars per barrel
Annual Energy Outlook 2008
History Projections
High Price
Reference
Low Price

0
10
20
30
40
50
1960 1970 1980 1990 2000 2010 2020 2030
Liquid fuels continue to dominate primary energy consumption in the United States
Annual Energy Outlook 2008
History Projections
Liquid Fuels
Natural Gas
Coal
Nuclear
Renewables
quadrillion Btu

The transportation sector dominates liquid fuel consumption
0
5
10
15
20
1970 1980 1990 2000 2010 2020 2030
Industrial
Transportation
Residential and CommercialElectric Power
ProjectionsHistory
Annual Energy Outlook 2008
million barrels per day

Average fuel economy of new light-duty vehicles is expected to reach 36.6 miles per gallon
0
5
10
15
20
25
30
35
40
45
1980 1995 2005 2015 2030
Cars
All Light-Duty Vehicles
Light Trucks
Annual Energy Outlook 2008
History Projections
miles per gallon

0
5
10
15
20
Motor Gasoline Diesel Biofuels
2006 2030
Biofuels includes ethanol, liquids from biomass, and biodiesel.Diesel excludes liquids from biomass and biodiesel.Motor gasoline excludes ethanol.
Transportation energy use shifts slightly from petroleum to biofuels
quadrillion Btu
Annual Energy Outlook 2008

0
500
1,000
1,500
2,000
2,500
3,000
3,500
2015 2030
Unconventional light-duty vehicles constitute 45 percent of sales in 2030
Hybrids
Flex Fuel
Turbo Direct Injection Diesel
GaseousElectric
Fuel Cell
Annual Energy Outlook 2008
thousand units

Crude oil production is primarily from the onshore and deep offshore
0
2
4
6
8
1990 2000 2005 2010 2020 2030
Lower 48 Onshore
Alaska
Deepwater Offshore
ProjectionsHistory
Annual Energy Outlook 2008
Total
Shallow Water Offshore
million barrels per day

0
5
10
15
20
25
1960 1970 1980 1990 2000 2010 2020 2030
Dependence on imports of liquid fuels and other petroleum declines by 2030
Consumption
Domestic Supply
Net Imports
60%
54%
Annual Energy Outlook 2008
History Projections
million barrels per day

Natural gas consumption in the electric power sector declines after the next 10 years
0
2
4
6
8
10
1990 2000 2005 2010 2020 2030
Transportation**
Industrial*
Residential
Commercial
Electric Power
ProjectionsHistory
* Includes lease and plant fuel** Includes pipeline fuel
Annual Energy Outlook 2008
trillion cubic feet

Dependence on natural gas net imports declines slightly
0
5
10
15
20
25
30
1960 1970 1980 1990 2000 2010 2020 2030
16% 14%Net Imports
Consumption
Production
Natural Gas Net Imports, 2006 and 2030(trillion cubic feet)
2.9
0.50.3
2.8
0
1
2
3
4
Pipeline Liquefied Natural Gas
20062030
Annual Energy Outlook 2008
History Projections
trillion cubic feet

Unconventional natural gas production will account for nearly half of domestic supply
0
2
4
6
8
10
1990 2000 2005 2010 2020 2030
Alaska
Lower 48 Non-Associated Unconventional
Lower 48 Non-Associated Offshore
Lower 48 Associated-Dissolved
Lower 48 Non-AssociatedConventional Onshore
ProjectionsHistory
Annual Energy Outlook 2008
trillion cubic feet

Net pipeline imports fall as supplies from Canada decline and exports to Mexico increase; LNG imports grow rapidly
-1
0
1
2
3
4
1990 1995 2000 2005 2010 2015 2020 2025 2030
Overseas LNG
Mexico
Canada
History Projections
Annual Energy Outlook 2008
trillion cubic feet

$0
$1
$2
$3
$4
$5
$6
$7
$8
1970 1980 1990 2000 2010 2020 2030
Natural gas wellhead prices will decline before rising again
Annual Energy Outlook 2008
History Projections
2006 dollars per thousand cubic feet
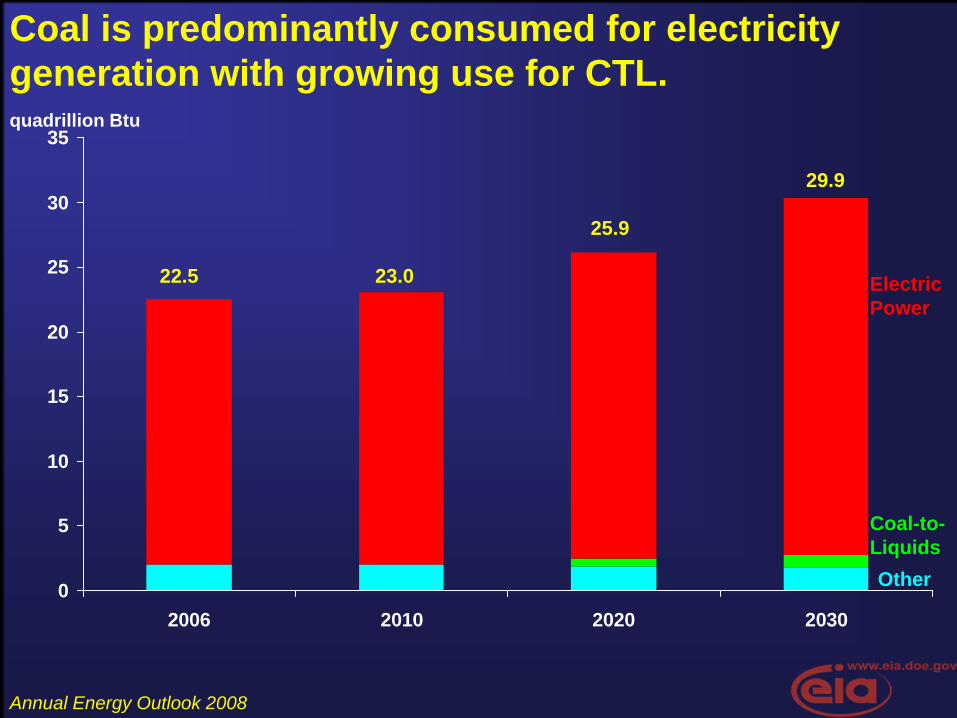
Coal is predominantly consumed for electricity generation with growing use for CTL.
0
5
10
15
20
25
30
35
2006 2010 2020 2030
22.5 23.0
25.9
Coal-to-LiquidsOther
ElectricPower
29.9
Annual Energy Outlook 2008
quadrillion Btu

U.S. electricity consumption grows slowly in all sectors
0
500
1,000
1,500
2,000
1980 1990 2000 2005 2010 2020 2030
Residential
Industrial
CommercialProjectionsHistory
Annual Energy Outlook 2008
billion kilowatthours

Coal and renewables gain larger shares of electricity generation, but nuclear generation also increases
49
19 20
10
2
54
1814 13
10
1,000
2,000
3,000
Coal Nuclear Natural Gas Renewable Petroleum
20062030
- percent of total
Annual Energy Outlook 2008
billion kilowatthours

0
100
200
300
400
2006 2010 2020 2030
97
169
286
356
Annual Energy Outlook 2008
Nonhydroelectric renewables make significant gains
GeothermalSolar
Biomass
MSW andLandfill Gas
Wind
billion kilowatthours

Price of electricity follows pattern of delivered fuels used at power plants
0
2
4
6
8
10
12
1970 1980 1990 2000 2010 2020 2030Annual Energy Outlook 2008
History Projections
2006 cents per kilowatthour

0
500
1,000
1,500
2,000
2,500
3,000
3,500
Residential Commercial Industrial Transportation Electric Power
ElectricityCoalNatural GasPetroleum
2030
5,500
6,000
6,500
7,000
7,500
8,000
2006 2010 2015 2020 2025 2030
Carbon dioxide emissions grow at a slower rate than energy consumption
Delivered, including electricity losses
2006
million metric tons
Total Carbon Dioxide Emissions
Annual Energy Outlook 2008

Guy F. Caruso
Periodic ReportsPetroleum Status and Natural Gas Storage Reports, weekly
Short-Term Energy Outlook, monthly
Annual Energy Outlook 2008, March 2008, full report, May 2008
International Energy Outlook 2007, May 2007, next update July 2008
Examples of Special Analyses“Economic Effects of High Oil Prices,” Annual Energy Outlook 2006
Analysis of Crude Oil Production in the Arctic National Wildlife Refuge,
May 2008
The Global Liquefied Natural Gas Market: Status and Outlook, December 2003
“Impacts of Increased Access to Oil and Natural Gas Resources in the Lower 48 Federal Outer Continental Shelf,” Annual Energy Outlook 2007
Energy Market and Economic Impacts of S.2191, the Lieberman-Warner Climate Security Act of 2007, April 2008
www.eia.doe.gov


