88
Chapter V : Appraisal of Forest Resources
Chapter- V
Appraisal of Forest Resources
5.1 Introduction
Appraisal is the process of estimating a value or simply market value of the
forest. Appraisal is common in many countries particularly where commercial
forestry has been performed. While appraising the forest, species richness, its quality,
average diameter, size etc are seen which is dependent on peculiar climatic conditions
of the region. The impact of the Western Ghats is clearly marked on the vegetation
pattern in the entire Khadakwasala irrigation project division. The crest of the
Western Ghats forms the northern and western boundary of Pune forests division.
These hill ranges run parallel to the coast line, with an average elevation of about 650
meters and sometimes, these hills rises to the height of 1300 meters or even more
above the mean sea level. The ridge of the Western Ghats has an immense effect on
the climate of the study area. Since there is a heavy rainfall on the ridge itself, with
very marked rainshadow effect from east to west. The rapid change in rainfall
conditions over such a short distance have direct effect on the vegetation pattern since
large portion of the area becomes a succession of tension zone where vegetational
formations can find optimum conditions. Such a fascinating environment has
produced a variety of vegetation patterns with a variety of plants adapting to different
localities. Villages located on steep eastern slopes like Tekpole, Mangaon, Pole,
Dhamanohol, Gadale etc which are still inaccessible have retained the forests. In such
villages hacking and grazing is limited just to satisfy and fulfill the family
requirements. Contrary to this, villages on eastern parts of the study area particularly
in Khadakwasala catchment which are fairly accessible have been suffering steady
depressions, commercial exploitation of the forests coupled with hacking and grazing
have reduced the greater part of the area to a stage where trees have given place to
shrubs and grasses only.
5.2 Methods to study vegetation pattern
Since the major objective of the present study is to understand the status and
pattern of existing vegetation cover, it was necessary to find the vegetation parameters
like density of plants, frequency and abundance of plants in the study area. Generally
for the detailed information about the plant composition, structure, species diversity,
89
Chapter V : Appraisal of Forest Resources
growth, density, abundance and the other characteristics of the community,
‘Phytocosiological methods’ are mostly used. In these methods, three forms of
sampling units viz. a) Area (quadrat method), b) Line (transact method) and c) Point
(point method) are used.
To acquaint with the existing forests cover in the study area, extensive
vegetation surveys were conducted. The forests were visited during the dry period of
the year in the month of March, April and May for the phyto-sociological data
collection. In the present study quadrate method has been adopted to collect the
various parameters regarding the vegetation. Sampling with quadrate i.e. plots of a
standard size can be used for most plant communities (Cox, 1990). A quadrate
delimits an area in which vegetation cover can be estimated, plants counted, or
species listed. It can be established randomly, regularly or subjectively within the
study area. In all twenty two quadrate plots of 20m × 20m size were laid randomly
according to the altitudinal variation in the forests area (Fig 5.1). The quadrat survey
is employed in counting the individual plants of each species to determine their
frequency, density and abundance. Quadrat is a square area of varying size marked off
for the purpose of plant enumeration. The geographical co ordinates of each sample
plot were recorded using Geographical Positioning System (GPS) receiver (Table
5.1a). The species of all trees, in each sample plot were listed. The entire study area is
characterized by various types of shrubs and grasses, which are also noticed
separately. All the major trees found in the study area were studied according to its
economical as well as ecological importance. While addressing the importance,
parameters like food, fodder, fuel, fiber, timber, ornamental, manure, tanning,
religious, spices or flavor, perfume, ecological, folk medicines and medicinal aspects
were considered in data entry and further in analysis.
5.2.1 Characters used in community structure
In any geographical area pattern and distribution of plants in a community is
not totally uniform. The important quantitative analysis like density, frequency and
abundance of tree species were determined. It is influenced by environmental
characteristics and biotic factors.

LOCATION OF QUADRAT
KHADAKWASALA IRRIGATION PROJECT DIVISION
Fig 5.1
Ch
ap
ter V : A
pp
raisa
l of F
orest R
esou
rces90

Plot No Latitude Longitude Altitude (M) Village
1 18.39925879 73.72003906 634.677 Malkhed
2 18.37575073 73.76930937 722.019 Thopatewadi
3 18.36995423 73.73517439 919.401 Thopatewadi
4 18.34934442 73.72969991 901.808 Mogarwadi
5 18.36673394 73.70071737 750.255 Nigade Mose
6 18.39088605 73.70007332 578.087 Wardade
7 18.41819912 73.68505362 901.825 Sangrun
8 18.43629202 73748699571 591.384 Kudje
9 18.36639049 73.64460326 749.782 Rule
10 18.36159718 73.60788588 814.335 Dhindali
11 18.38564199 73.58834943 670.428 Saiv Kh
12 18.40281678 73.56945711 706.864 Mose Bk
13 18.38521257 73.62076693 597.266 Panshet
14 18.39332207 73.45094151 703.084 Ugavali
15 18.39637622 73.44171928 686.769 Dhamaohol
16 18.38521257 73.45867943 691.427 Gadale
17 18.39143845 73.47864517 664.832 Sakhari
18 18.34764262 73.52759345 762.852 Balvadi
19 18.34206084 73.45438572 753.654 Dapsare
20 18.32022777 73.49165198 901.11 Tekpole
21 18.32544952 73.54820325 746.513 Shirkoli
22 18.37921615 73.78299375 905.536 Donaje
Sr.No. Altitude (M) Plot No Total
1 Below 700 1,6,8,11,13,15,16,17, 8
2 700 to 900 2,5,9,10,12,14,18,19,21 9
3 Above 900 3,4,7,20,22 5
Total 22
Table 5.1b-Altitude wise distribution of quadrate
Table 5.1a -Geographical coordinates and village wise location of quadrate
91Chapter V : Appraisal of Forest Resources
KHADAKWASALA IRRIGATION PROJECT DIVISION

92
Chapter V : Appraisal of Forest Resources
5.2.1.1 Frequency
This term indicates degree of dispersion of an individual species in an area or
community and it is estimated in percentage occurrence and can be calculated as
under.
Frequency = Number of quadrats in which species occured
Total number of quadrats studied × 100
Regular pattern of distribution indicates high frequency of the plants, while
cluster appearance exhibits low frequency. Random distribution pattern indicate
moderate frequency. Frequency of each species can be grouped under five frequency
classes (Raunkiaer’s 1934). Depending upon the frequency value there are total five
frequency classes viz, 00 to 20% A-class, 21 to 40% B-class, 41 to 60% C-class, 61 to
80% D class and 81 to 100% indicates E-class.
5.2.1.2 Density
The number of individual of species in any unit area is its density. Density
gives an idea of degree of competition. It indicates the numerical strength of plants in
a community and the number of plant species per unit area; it is calculated as under.
Density = Total number of plants of in the quadrats
Number of quadrates’ quadrats examined
5.2.1.3 Abundance
Abundance is related with density and is expressed in a qualitative terms. It is
the numerical strength of plant species in total number of quadrates in which it occurs.
Abundance is calculated as under.
Abundance = Total number of plants of species in all the quadrats
Number of quadrats in which the species occurred
5.3 Altitude wise distribution of species in the study area
All the twenty two randomly selected quadrat samples collected are organized
in zone I, II and III according to the altitudinal variation (Table 5.1b). Quadrat study
shows that, the present forest cover in the study area is characterized by various
vegetation types which mainly belongs to tropical moist-deciduous forests, sub-
tropical semi evergreen forest, grass lands and in few pockets by ravine or broad
leaved forests. The vegetation pattern changes from few pockets of grass lands in the
zone I (below 700 m), to moist deciduous type and few evergreen species vegetation

93
Chapter V : Appraisal of Forest Resources
in zone II (700 to 900 m) and finally semi- evergreen types of vegetation can be
observed in last zone i.e. zone III (900 to 1100 m). Although there is no clear
demarcation, there is great change in the type of vegetation pattern from the lower
part to the crest line. In the study area, many sacred groves were observed. Vartak
(1966) has placed the vegetation of these sacred groves under the category of broad
leaved valley or ravine vegetation.
5.3.1 Variation in major plant species below 700 m ASL
It is the lower most part of the study area as far as altitude is concern and
covers 40.69 % of the total geographical area. Most of the part of this zone gets
submerged under water during the monsoon as the level of water increases. In this
zone particularly very large trees are seen. Total eight randomly selected quadrat
samples were laid below the altitude of 700 m in the study area (Table 5.2). In these
samples total 127 individual species has been observed. According to the Raunkier’s
frequency classes, out of 24 species, around 5 species are observed in frequency class
‘A’ (00% to 20%) and 10 species found in frequency class ‘B’ (21% to 40%).
Mangifera indica, Hardwickia binata Roxb, Syzygium cumini Skeels, Dalbergia
latifolia Roxb, Acacia nilotica, Terminalia alata Heyen Grawia tillaefolia are found
in frequency class ‘C’. All these species has high frequency as they occurred in at
least five quadrate out of total eight quadrates laid in this sample area. Total density
of major plant species is also calculated and it ranges from 12.50 to 50 ha. Mangifera
indica, Bauhinia racemosa Lam, Eucalyptus glchosus, Leucaena leucocephals,
Zizyphus mauritiana Lamk have a greater density.
Total abundance was observed 2374 ha and it ranges from 28 to 400 per ha.
It
shows greater variation, except Bassia longifolia L. as this species was found only one
quadrate and hence it has frequency range of very much frequent (400 per ha),
followed by Ficus beneghalensis, Semecarpus anacardium L.F, Eucalyptus glchosus,
Ficus arnottiana Miq, Zizyphus mauritiana Lamk etc occurs frequently.
It has also been observed that, 51.53 % of the entire settlement area in the
study area is observed below the 700 m contour. Hence most of the area under forest
in this altitudinal zone is affected and altered.
5.3.2 Variation in major plant species between 700 to 900 m ASL
This zone covers total 43.64 % of total geographical area and it acts as a buffer
zone. It is characterized by few evergreen and mostly deciduous trees. In this
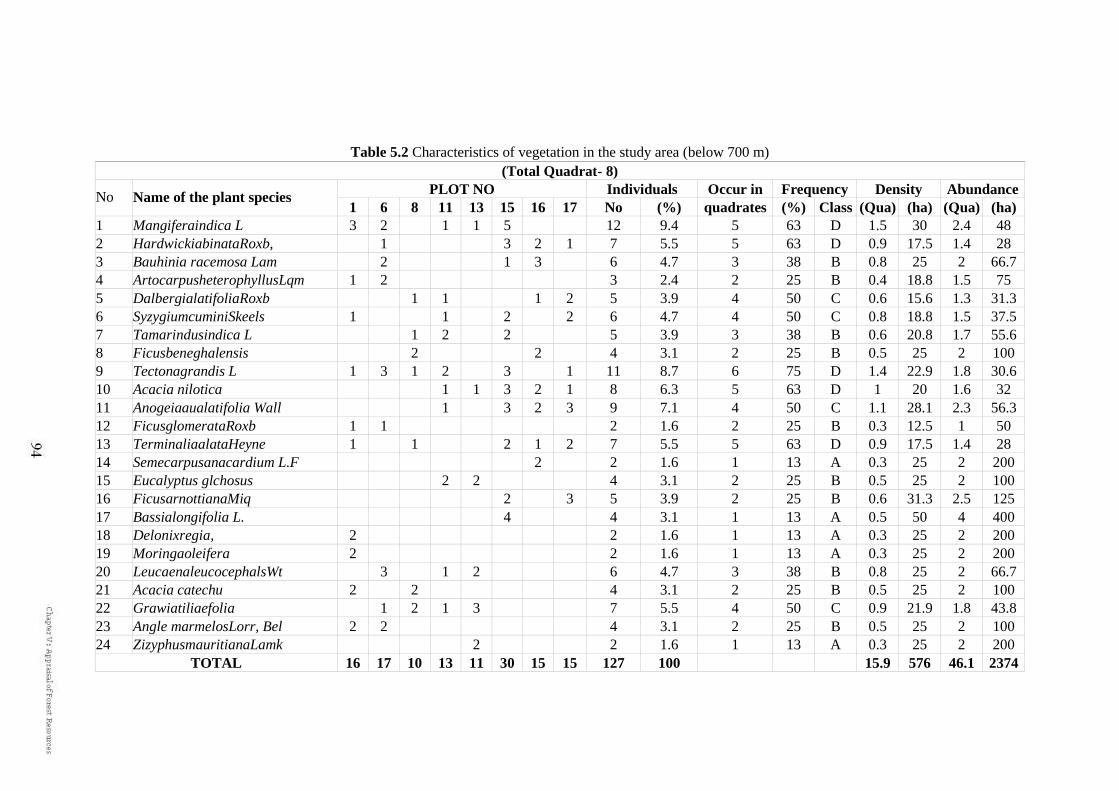
Table 5.2 Characteristics of vegetation in the study area (below 700 m)
(Total Quadrat- 8)
No Name of the plant species PLOT NO Individuals Occur in Frequency Density Abundance
1 6 8 11 13 15 16 17 No (%) quadrates (%) Class (Qua) (ha) (Qua) (ha)
1 Mangiferaindica L 3 2
1 1 5
12 9.4 5 63 D 1.5 30 2.4 48
2 HardwickiabinataRoxb,
1
3 2 1 7 5.5 5 63 D 0.9 17.5 1.4 28
3 Bauhinia racemosa Lam
2
1 3
6 4.7 3 38 B 0.8 25 2 66.7
4 ArtocarpusheterophyllusLqm 1 2
3 2.4 2 25 B 0.4 18.8 1.5 75
5 DalbergialatifoliaRoxb
1 1
1 2 5 3.9 4 50 C 0.6 15.6 1.3 31.3
6 SyzygiumcuminiSkeels 1
1
2
2 6 4.7 4 50 C 0.8 18.8 1.5 37.5
7 Tamarindusindica L
1 2
2
5 3.9 3 38 B 0.6 20.8 1.7 55.6
8 Ficusbeneghalensis
2
2
4 3.1 2 25 B 0.5 25 2 100
9 Tectonagrandis L 1 3 1 2
3
1 11 8.7 6 75 D 1.4 22.9 1.8 30.6
10 Acacia nilotica
1 1 3 2 1 8 6.3 5 63 D 1 20 1.6 32
11 Anogeiaaualatifolia Wall
1
3 2 3 9 7.1 4 50 C 1.1 28.1 2.3 56.3
12 FicusglomerataRoxb 1 1
2 1.6 2 25 B 0.3 12.5 1 50
13 TerminaliaalataHeyne 1
1
2 1 2 7 5.5 5 63 D 0.9 17.5 1.4 28
14 Semecarpusanacardium L.F
2
2 1.6 1 13 A 0.3 25 2 200
15 Eucalyptus glchosus
2 2
4 3.1 2 25 B 0.5 25 2 100
16 FicusarnottianaMiq
2
3 5 3.9 2 25 B 0.6 31.3 2.5 125
17 Bassialongifolia L.
4
4 3.1 1 13 A 0.5 50 4 400
18 Delonixregia, 2
2 1.6 1 13 A 0.3 25 2 200
19 Moringaoleifera 2
2 1.6 1 13 A 0.3 25 2 200
20 LeucaenaleucocephalsWt
3
1 2
6 4.7 3 38 B 0.8 25 2 66.7
21 Acacia catechu 2
2
4 3.1 2 25 B 0.5 25 2 100
22 Grawiatiliaefolia
1 2 1 3
7 5.5 4 50 C 0.9 21.9 1.8 43.8
23 Angle marmelosLorr, Bel 2 2
4 3.1 2 25 B 0.5 25 2 100
24 ZizyphusmauritianaLamk
2
2 1.6 1 13 A 0.3 25 2 200
TOTAL 16 17 10 13 11 30 15 15 127 100
15.9 576 46.1 2374

Table 5.3. Characteristics of vegetation in the study area ( between 700 to 900 m)
(Total Quadrat - 9)
No Name of the plant species PLOT NO Individuals Occur in Frequency Density Abundance 2 5 9 10 12 14 18 19 21 No (%) Quadrate (%) Class (Qua) (ha) (Qua) (ha)
1 TerminaliaalataHeyne 1 1 4 2 2 4 14 8.33 6 66.7 D 1.56 25.93 2.33 38.89 2 Mangiferaindica L 1 3 4 2.38 2 22.2 B 0.44 22.22 2 100 3 Bauhinia racemosa Lam 3 1 2 6 3.57 3 33.3 B 0.67 22.22 2 66.67 4 Acacia suma B-ham 1 2 2 5 2.98 3 33.3 B 0.56 18.52 1.67 55.56 5 AlbizziaproceraBenth 1 2 1 4 2.38 3 33.3 B 0.44 14.81 1.33 44.44 6 Acacia catechu 1 1 3 3 8 4.76 4 44.4 C 0.89 22.22 2 50 7 DalbergialatifoliaRoxb 1 1 1 3 1.79 3 33.3 B 0.33 11.11 1 33.33 8 Erythrina variegate L 1 2 1 4 2.38 3 33.3 B 0.44 14.81 1.33 44.44 9 SyzygiumcuminiSkeels 2 1 1 2 6 3.57 4 44.4 C 0.67 16.67 1.5 37.5 10 Eucalyptus glchosusi 3 1 2 6 3.57 3 33.3 B 0.67 22.22 2 66.67 11 GrewiatillaefoliaValln 1 5 1 1 2 2 12 7.14 6 66.7 D 1.33 22.22 2 33.33 12 FicusglomerataRoxb 2 2 4 8 4.76 3 33.3 B 0.89 29.63 2.67 88.89 13 Semecarpusanacardium L.F 3 3 1.79 1 11.1 A 0.33 33.33 3 300 14 Tectonagrandis L 4 1 2 4 11 6.55 4 44.4 C 1.22 30.56 2.75 68.75 15 ZizyphusmauritianaLamk 1 2 1 4 2.38 3 33.3 B 0.44 14.81 1.33 44.44 16 HardwickiabinataRoxb 1 1 1 1 2 2 8 4.76 6 66.7 D 0.89 14.81 1.33 22.22 17 AzadirachtaindicaA.Juss 1 1 2 1.19 2 22.2 B 0.22 11.11 1 50 18 Holarrhenaantidysenterica Wall 1 1 3 5 2.98 3 33.3 C 0.56 18.52 1.67 55.56 19 Tamarindusindica L 3 3 1.79 1 11.1 A 0.33 33.33 3 300 20 EmblicaofficinalisGaertin 1 2 3 1.79 2 22.2 B 0.33 16.67 1.5 75 21 Anogeiaaualatifolia Wall 3 2 5 2.98 2 22.2 B 0.56 27.78 2.5 125 22 AnthocephaluscadambaKig 2 2 1.19 1 11.1 A 0.22 22.22 2 200 23 FicusarnottianaMiq , 2 2 4 2.38 2 22.2 B 0.44 22.22 2 100 24 ButeamonospermaTaub 2 1 1 4 2.38 3 33.3 B 0.44 14.81 1.33 44.44 25 Flacourtialatifolia 1 1 1 1 2 6 3.57 5 55.6 C 0.67 13.33 1.2 24 26 Terminaliachebula Retz 1 2 2 2 3 4 14 8.33 6 66.7 D 1.56 25.93 2.33 38.89 27 MitragynaparavifloraKunth 2 1 1 2 6 3.57 4 44.4 C 0.67 16.67 1.5 37.5 28 HomonoiaripariaLour 1 3 1 3 8 4.76 4 44.4 C 0.89 22.22 2 50
TOTAL 13 12 14 12 25 21 10 31 30 168 100
18.67 580.9 52.28 2195.5
Table 5.2 Characteristics of vegetation in the study area ( below 700 m)

Table 5.4. Characteristics of vegetation in the study area (between 900 to 1100 m)
(Total Quadrat - 5)
No Name of the plant species PLOT NO Individuals Occur in Frequency Density Abundance
3 4 7 20 22 No (%) Quadrates (%) Class (Qua) (ha) Qua) (ha)
1 TerminaliaalataHeyne
1 2 1 4 6.35 3 60 C 0.8 26.67 1.33 44.4
2 DalbergialatifoliaRoxb
1 1
2 3.17 2 40 B 0.4 20 1 50
3 Bauhinia racemosa Lam
3
3 4.76 1 20 A 0.6 60 3 300
4 HardwickiabinataRoxb
2
2 3.17 1 20 A 0.4 40 2 200
5 Anogeiaaualatifolia Wall 2 2
3
7 11.1 3 60 C 1.4 46.67 2.33 77.8
6 Terminaliachebula Retz
2 4
6 9.52 2 40 B 1.2 60 3 150
7 GrewiatillaefoliaVall 1
1
2 4 6.35 3 60 C 0.8 26.67 1.33 44.4
8 Acacia nilotica 2
2 3.17 1 20 A 0.4 40 2 200
9 GmelinaarboreaRoxb
2
2 3.17 1 20 A 0.4 40 2 200
10 Adina cordifoliaRoxb
1
1 1.59 1 20 A 0.2 20 1 100
11 CynadondatylonMarli
1
1 1.59 1 20 A 0.2 20 1 100
12 HomonoiaripariaLour
1 1 1.59 1 20 A 0.2 20 1 100
13 SemecarpusAnacardium 1 1
1
3 4.76 2 40 B 0.6 30 1.5 75
14 CeseariagraveolensDelz 1
1 1.59 1 20 A 0.2 20 1 100
15 Eleodendronglaucum,Pers. 2
2 4 6.35 2 40 B 0.8 40 2 100
16 Bombaxceiba L
1 1
2 4 6.35 3 60 C 0.8 26.67 1.33 44.4
17 Albizzialebbeck
1 2 1 4 6.35 2 40 B 0.8 40 2 100
18 Erythrinavariegata
2
2 4 6.35 2 40 B 0.8 40 2 100
19 Angle marmelosLorr
2 2 3.17 1 20 A 0.4 40 2 200
20 MytragynaparvifloraKuntha
1
1 1.59 1 20 A 0.2 20 1 100
21 OleadioicaRoxb
1 1
2 3.17 2 40 B 0.4 20 1 50
22 Terminaliabellerica
1 2
3 4.76 2 40 B 0.6 30 1.5 75
TOTAL 9 8 14 19 13 63 100
12.6 726.7 36.33 2511

97
Chapter V : Appraisal of Forest Resources
altitudinal zone of 700 to 900 meter, total nine randomly sample quadrate were
selected and around 168 plant species were listed (Table 5.3). In this altitudinal zone
out of 28 species 3 species have frequency class ‘A’, 14 species have class ‘B’, 7
species have class ‘C’ and ‘D’ frequency class have 4 species. In this zone Terminalia
alata Heyne, Acacia catechu, Syzygium cumini Skeels, Grewia tillaefolia Vall,
Tectona grandis, Carissa congesta Wigesto, Hardwickia binata Roxb, Terminalia
chebula Retz , Lasiosiphon ericephalus Dene etc have greater frequency. It shows that
occurrence of these species was more than in 4 quadrate within 700 to 900 m.
Total density of this altitudinal zone is calculated and is observed to be 580.93
per ha and it ranges from 11.11 to 33.33 per ha. Terminalia alata Heyne, Ficus
glomerata Roxb , Semecarpus anacardium L.F, Tectona grandis, Tamarindus indica
A.Juss, Homonoia riparia Lour, Anogeiaaua latifolia Wall etc. species have more
than density of 25 per ha. Out of 28 species Dalbergia latifolia Roxb and Azadirachta
indica A.Juss shows less density per ha and it is observed to 11.11 per ha.
Abundance in this altitude ranges from 22.22 to 300 per ha, except
Semecarpus anacardium L.F and Tamarindus indica A.Juss have 300 per ha. It
includes in very much frequent group of abundance, followed by Bassia longifolia L,
Mangifera indica L, Anogeiaaua latifolia, and Ficus arnottiana Miq includes under
common group.
5.3.3 Variation in major plant species between 900 to 1100 m ASL
This zone covers 15.68% of the total study area and in this altitudinal zone,
total five randomly sampled quadrates were taken where total 63 plant species are
observed (Table 5.4). The percentage frequency observed and out of total 22 major
plant species, 10 species have class ‘A’, 8 species have class ‘B’ and total 4 species
have class ‘C’. Terminalia alata Heyne , Grewia tillaefolia Vall Syzygium cumini
Skeels etc have more frequency and occurred in 3 quadrate out of selected 5
quadrates. Whereas Bauhinia racemosa Lam, Hardwickia binata Roxb, Ficus
glomerata Roxb Ficus arnottiana Miq , Syzygium cumini Skeels Lasiosiphon
ericephalus Dene etc shows less percentage of frequency.
Total abundance for this altitudinal zone has been calculated and it is observed
that it comes 2511.11 ha. Bauhinia racemosa Lam, Ficus glomerata Roxb, Erythrina
variegate L, Angle marmelos Lorr etc are very much frequent group.
98
Chapter V : Appraisal of Forest Resources
Total density of major species in this zone has been observed to be 726.67 per
ha and it ranges from 20 to 60 per ha. Terminalia chebula Retz , Bauhinia racemosa
Lam, Anogeiaaua latifolia Wall etc are found in more than at least 3 quadrates.
The vegetation surveys conducted in the study area during the periods of dry
months. It has been observed that, on the lower part of the hills i.e. zone I only few
large trees were observed. Among these Amba, Vad, Sag, Pimple, were the dominant.
Grass like Partheriur histerephus (Gajargavat), Andropogon monticola (Dongari
Gavat) were also seen.
5.4 Summary of the vegetation surveys conducted in the field
It is clear from the above discussion, that in the present study area some of the
species are spread over the entire area. These species are Mangifera indica 16 species
(7 quadrate), Tectona grandis L 22 species (10 quadrate), Anogeiaaua latifolia Wall
21 species (9 quadrate), Terminalia alata Heyne 18 species (9 quadrates), Grewia
tillaefolia Valln 16 species (9 quadrate), Terminalia chebula Retz 20 species (8
quadrate), Acacia catechu,12 (8 quadrate).
Below the altitude of 700 m, total 8 quadrates were laid and the hierarchy of
the plants is observed as: Mangifera indica, Tectona grandis L, Anogeiaaua latifolia
Wall, Bombax insigne, Hardwickia binata Roxb, Terminalia alata Heyne, Lasiosiphon
ericephalus Dene. The maximum occurrence of Mangifera indica is observed near the
settlements. Tectona grandis L is well distributed in the entire study area, as during
the plantation programmes conducted by forest departments, Tectona grandis L was
given the priority. Tectona grandis L plantation is also a very suitable and adoptive
species in the region and it is economically important plant species.
Between 700 to 900 m altitude zone, individual species according to number
of quadrate are Terminalia alata Heyne, Terminalia chebula Retz, Grewia tillaefolia
Valln, Tectona grandis L. These plants are observed plenty throughout the study area
in plenty numbers. Flacourtia sepaiaria Roxb, Acacia catechu, Ficus glomerata Roxb
Flacourtia sepaiaria Roxb, Dendrocalamus structus etc are satisfactorily observed in
this altitudinal zone.
Above the 900 m the area under the forest is very low and the density and
distribution of the vegetation became very sparse. Hence all the five quadrate were
taken above the margins of 900 m. In this zone, Anogeiaaua latifolia Wall, Terminalia
chebula Retz are mainly observed followed by Terminalia alata Heyne,Grewia
99
Chapter V : Appraisal of Forest Resources
tillaefolia Vall, Eleodendron glaucum,Pers, Bombax ceiba L, Albizzia lebbeck, and
Lasiosiphon ericephalus Dene.
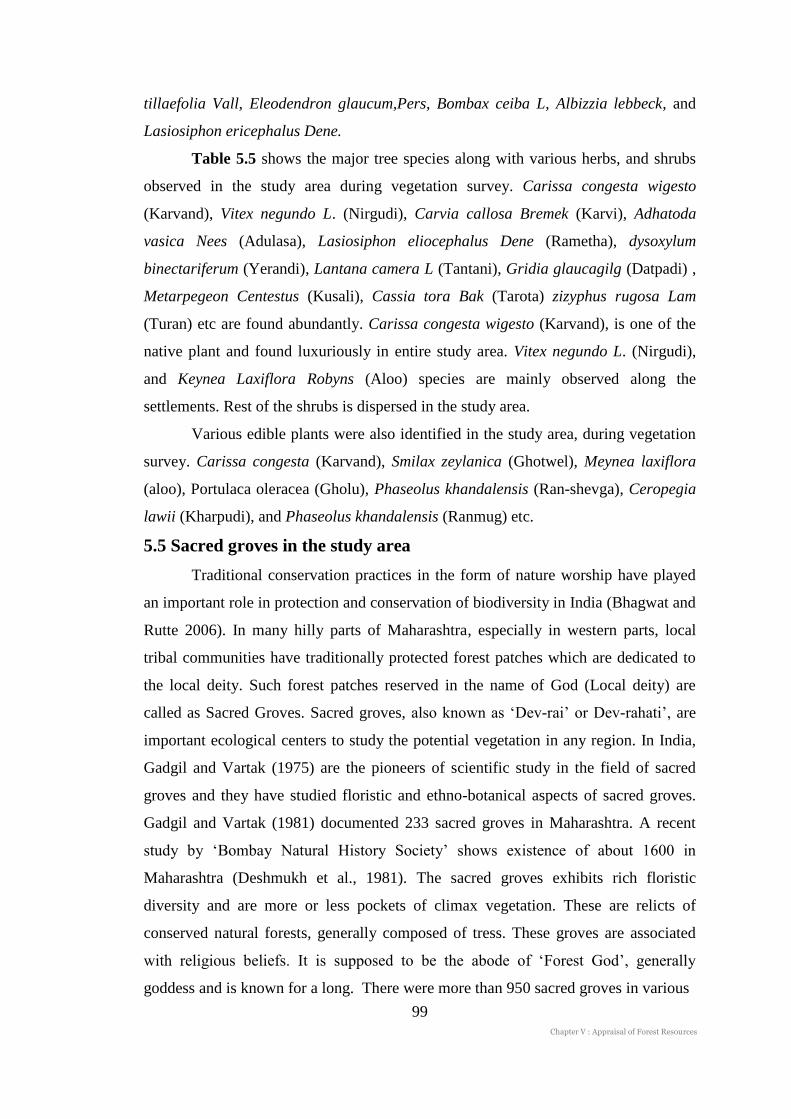
Table 5.5 shows the major tree species along with various herbs, and shrubs
observed in the study area during vegetation survey. Carissa congesta wigesto
(Karvand), Vitex negundo L. (Nirgudi), Carvia callosa Bremek (Karvi), Adhatoda
vasica Nees (Adulasa), Lasiosiphon eliocephalus Dene (Rametha), dysoxylum
binectariferum (Yerandi), Lantana camera L (Tantani), Gridia glaucagilg (Datpadi) ,
Metarpegeon Centestus (Kusali), Cassia tora Bak (Tarota) zizyphus rugosa Lam
(Turan) etc are found abundantly. Carissa congesta wigesto (Karvand), is one of the
native plant and found luxuriously in entire study area. Vitex negundo L. (Nirgudi),
and Keynea Laxiflora Robyns (Aloo) species are mainly observed along the
settlements. Rest of the shrubs is dispersed in the study area.
Various edible plants were also identified in the study area, during vegetation
survey. Carissa congesta (Karvand), Smilax zeylanica (Ghotwel), Meynea laxiflora
(aloo), Portulaca oleracea (Gholu), Phaseolus khandalensis (Ran-shevga), Ceropegia
lawii (Kharpudi), and Phaseolus khandalensis (Ranmug) etc.
5.5 Sacred groves in the study area
Traditional conservation practices in the form of nature worship have played
an important role in protection and conservation of biodiversity in India (Bhagwat and
Rutte 2006). In many hilly parts of Maharashtra, especially in western parts, local
tribal communities have traditionally protected forest patches which are dedicated to
the local deity. Such forest patches reserved in the name of God (Local deity) are
called as Sacred Groves. Sacred groves, also known as ‘Dev-rai’ or Dev-rahati’, are
important ecological centers to study the potential vegetation in any region. In India,
Gadgil and Vartak (1975) are the pioneers of scientific study in the field of sacred
groves and they have studied floristic and ethno-botanical aspects of sacred groves.
Gadgil and Vartak (1981) documented 233 sacred groves in Maharashtra. A recent
study by ‘Bombay Natural History Society’ shows existence of about 1600 in
Maharashtra (Deshmukh et al., 1981). The sacred groves exhibits rich floristic
diversity and are more or less pockets of climax vegetation. These are relicts of
conserved natural forests, generally composed of tress. These groves are associated
with religious beliefs. It is supposed to be the abode of ‘Forest God’, generally
goddess and is known for a long. There were more than 950 sacred groves in various
100
Chapter V : Appraisal of Forest Resources
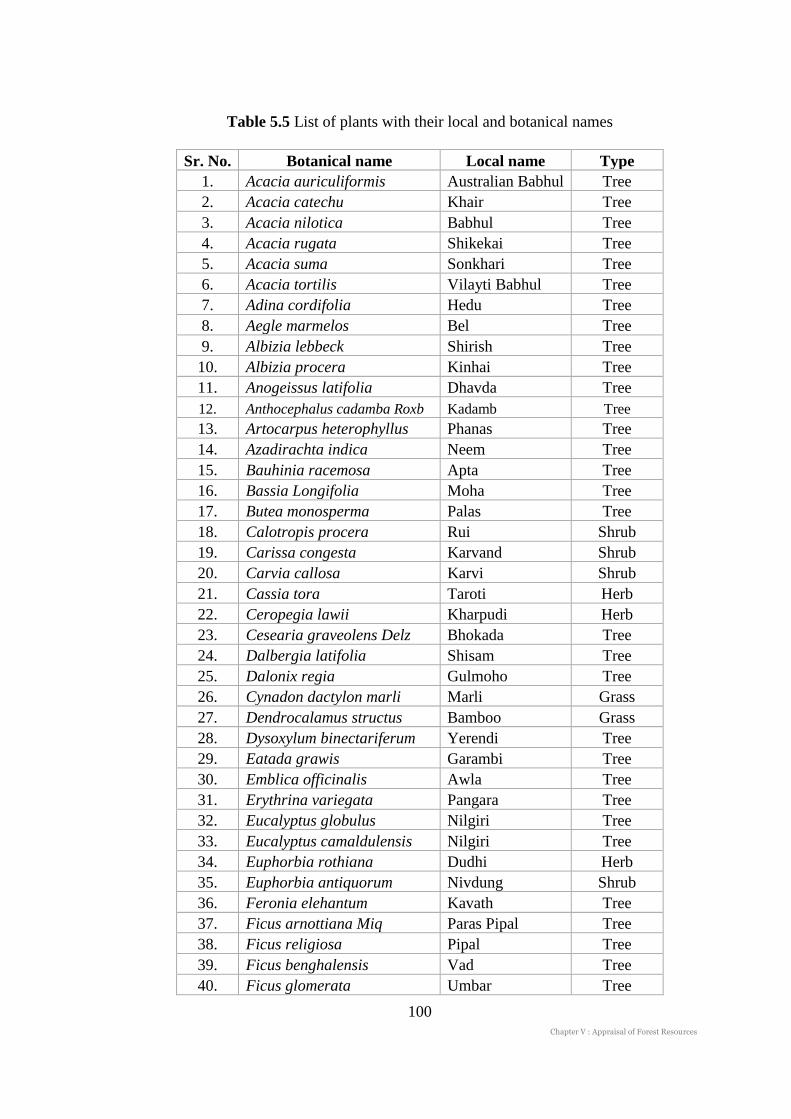
Table 5.5 List of plants with their local and botanical names
Sr. No. Botanical name Local name Type
1. Acacia auriculiformis Australian Babhul Tree
2. Acacia catechu Khair Tree
3. Acacia nilotica Babhul Tree
4. Acacia rugata Shikekai Tree
5. Acacia suma Sonkhari Tree
6. Acacia tortilis Vilayti Babhul Tree
7. Adina cordifolia Hedu Tree
8. Aegle marmelos Bel Tree
9. Albizia lebbeck Shirish Tree
10. Albizia procera Kinhai Tree
11. Anogeissus latifolia Dhavda Tree
12. Anthocephalus cadamba Roxb Kadamb Tree 13. Artocarpus heterophyllus Phanas Tree
14. Azadirachta indica Neem Tree
15. Bauhinia racemosa Apta Tree
16. Bassia Longifolia Moha Tree
17. Butea monosperma Palas Tree
18. Calotropis procera Rui Shrub
19. Carissa congesta Karvand Shrub
20. Carvia callosa Karvi Shrub
21. Cassia tora Taroti Herb
22. Ceropegia lawii Kharpudi Herb
23. Cesearia graveolens Delz Bhokada Tree
24. Dalbergia latifolia Shisam Tree
25. Dalonix regia Gulmoho Tree
26. Cynadon dactylon marli Marli Grass
27. Dendrocalamus structus Bamboo Grass
28. Dysoxylum binectariferum Yerendi Tree
29. Eatada grawis Garambi Tree
30. Emblica officinalis Awla Tree
31. Erythrina variegata Pangara Tree
32. Eucalyptus globulus Nilgiri Tree
33. Eucalyptus camaldulensis Nilgiri Tree
34. Euphorbia rothiana Dudhi Herb
35. Euphorbia antiquorum Nivdung Shrub
36. Feronia elehantum Kavath Tree
37. Ficus arnottiana Miq Paras Pipal Tree
38. Ficus religiosa Pipal Tree
39. Ficus benghalensis Vad Tree
40. Ficus glomerata Umbar Tree

101
Chapter V : Appraisal of Forest Resources
Sr. No. Botanical name Local name Type
41. Flacourtia latifolia Tambat Tree
42. Gmelina arborea Roxb Shivan Tree
43. Glyricidia maculata Glyricidia Tree
44. Grewia tiliaefolia Dhaman Tree
45. Hardwickia binata Anjani Tree
46. Hemidesmus indica Anatmul Tree
47. Heterophragma roxburgii Tambt Tree
48. Holarrhena antidysenterica Kuda Tree
49. Homonoia riparia Lour Kanher Tree
50. Impatiens balsamina Terda Herb
51. Lantana camara Tantai Shrub
52. Lasiosiphon eriocephalus Rametha Shrub
53. Leucaena leucocephala Subabul Tree
54. Mallotus philippensis Shendri Tree
55. Mangifera indica Amba Tree
56. Mapia foetida Narkya Tree
57. Memecylon umbellatum Anjan Tree
58. Mitragyna paraviflora Kunth Kadamb Tree
59. Moringa oleifera Shevga Tree
60. Olea dioica Parjambhul Tree
61. Parthenium hysterophorus Garjargavat Herb
62. Phonix sylvestris Shindi Tree
63. Pongamia pinnata Karanj Tree
64. Psidium guajava Guava Tree
65. Solanum anguivi Chichandri Herb
66. Semecarpus anacardium Bibba Tree
67. Smilax macrophylla Ghotve trailing vine
68. Syzygium cumini Jambool Tree
69. Tamarindus indica Chinch Tree
70. Tectona grandis Teak Tree
71. Terminalia alata Ain Tree
72. Terminalia bellerica Behda Tree
73. Terminalia chebula Hirda Tree
74. Vigna capensis Halunda Climber
75. Vitex negundo Nirgudi Shrub
76. Woodfordia fruticosa Dhayeti Tree
77. Zizyphus mauritiana Lamk Bor Tree
102
Chapter V : Appraisal of Forest Resources
regions of Maharashtra. Pune has nearly 179 sacred groves (Source- Deshmukh
1997). In the present research area many sacred groves have been reported (Madhav
Gadgil & V.D.vartak). The principal plant community in the sacred groves found in
the study area differs depending upon the rainfall, altitude, soil conditions and size of
sacred groves (Table 5.6) the grove. Most of the sacred groves are situated on the
middle central parts of the contours and located on the source regions of the
streamlets on which most of the villages are dependent for their water needs.
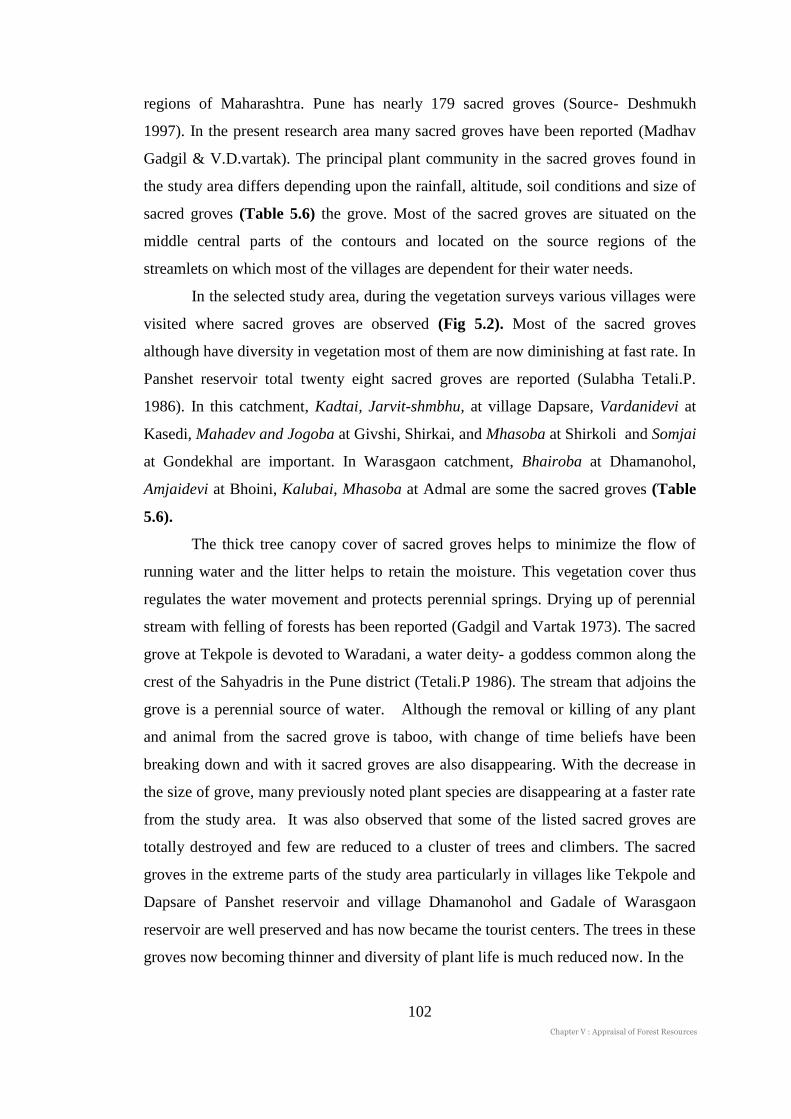
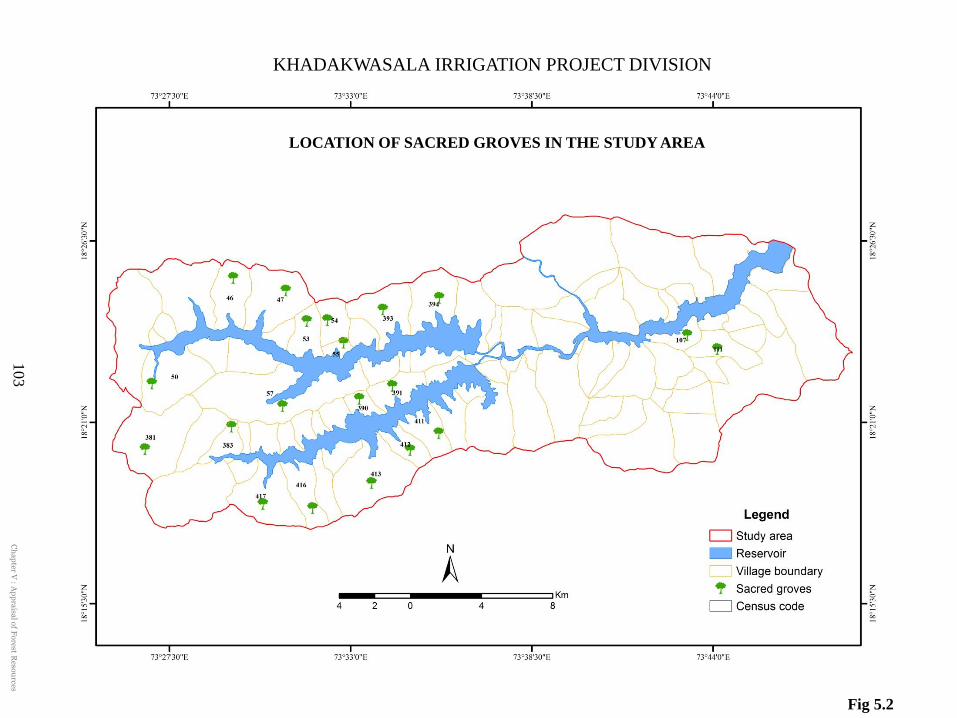
In the selected study area, during the vegetation surveys various villages were
visited where sacred groves are observed (Fig 5.2). Most of the sacred groves
although have diversity in vegetation most of them are now diminishing at fast rate. In
Panshet reservoir total twenty eight sacred groves are reported (Sulabha Tetali.P.
1986). In this catchment, Kadtai, Jarvit-shmbhu, at village Dapsare, Vardanidevi at
Kasedi, Mahadev and Jogoba at Givshi, Shirkai, and Mhasoba at Shirkoli and Somjai
at Gondekhal are important. In Warasgaon catchment, Bhairoba at Dhamanohol,
Amjaidevi at Bhoini, Kalubai, Mhasoba at Admal are some the sacred groves (Table
5.6).
The thick tree canopy cover of sacred groves helps to minimize the flow of
running water and the litter helps to retain the moisture. This vegetation cover thus
regulates the water movement and protects perennial springs. Drying up of perennial
stream with felling of forests has been reported (Gadgil and Vartak 1973). The sacred
grove at Tekpole is devoted to Waradani, a water deity- a goddess common along the
crest of the Sahyadris in the Pune district (Tetali.P 1986). The stream that adjoins the
grove is a perennial source of water. Although the removal or killing of any plant
and animal from the sacred grove is taboo, with change of time beliefs have been
breaking down and with it sacred groves are also disappearing. With the decrease in
the size of grove, many previously noted plant species are disappearing at a faster rate
from the study area. It was also observed that some of the listed sacred groves are
totally destroyed and few are reduced to a cluster of trees and climbers. The sacred
groves in the extreme parts of the study area particularly in villages like Tekpole and
Dapsare of Panshet reservoir and village Dhamanohol and Gadale of Warasgaon
reservoir are well preserved and has now became the tourist centers. The trees in these
groves now becoming thinner and diversity of plant life is much reduced now. In the
LOCATION OF SACRED GROVES IN THE STUDY AREA
KHADAKWASALA IRRIGATION PROJECT DIVISION
Fig 5.2
Ch
ap
ter V : A
pp
raisa
l of F
orest R
esou
rces103

104
No Village Name of Sacred Groves Census Code
1 Bhoini Amjaidevi, Somjai 3104600
2 Dasave Kalbhairai, Boreshwar, Samjai 3104700
3 Gadale Bhairoba 3105000
4 Admal Bedjai, Kalkai, Kalubai, Mhasoba 3105300
5 Palase Bhairoba, Mariai, Namjai, Sonjai, 3105400
6 Bembatmal Vadjai 3105500
7 Tav Lakshmi, Vaghrunjai 3105700
8 Mose Bk. Eknath, Kalkai, Nathmaharaj, Veerdev 3139300
9 Saiv Bk. Kalubai, 3139400
10 Dapsare Jakhinidevi, Jarvit-Shambhu 3138100
11 Gondekhal Vardanidevi 3138300
12 Gholapghar Vardanidevi 3139000
13 Ambegaon Kh. Bhiroba, Pandharfali, Talvatidevi, 3139100
14 Ambegaon Bk Jogoba, Mhasoba, 3141100
15 Givashi Mahadev 3141200
16 Shirkoli Buchoba, Mahadev, Shirkai, 3141300
17 Pole Somajai, 3141600
18 Mangaon Mangaon 3141700
19 Malkhed Sitabai 3110700
20 Sambarewadi Kalubai 3111000
Source : ENVIS center on conservation of ecological heritage and sacred sites of India
Table 5.6 List of sacred groves in the study area
Chapter V : Appraisal of Forest Resources
KHADAKWASALA IRRIGATION PROJECT DIVISION

105
Chapter V : Appraisal of Forest Resources
sacred groves of Ambegaon, Kasedi and Gondekhal instead of thick cover of trees
shrubs cover is dominated by Lantana camara, and Carvia callosa.
5.6. Appraisal of forests resources in the study area
The appraisal of various available natural resources is a basic requirement in
almost all resource planning strategies and hence forest resource planning is no
exception. The purpose of appraising forests resources is to determine its source,
extent and dependability of supply and the character of forest on which an evaluation
of their future control and utilization is to be based. While apprising the forests
resources, three aspects should always be considered i.e., the quantity, the quality and
the reliability of available forest in the area. In appraising the quantity of forests, it is
important to ascertain not only the total quantity available within a certain period of
time, but also the distribution of the available quantity with respect to both location
and time. Quality of forests is important especially for uses such as economical,
ecological as well as domestic and industrial use. Reliability of supply is an
important aspect in deciding the value of forests. For a reliable appraisal of forests
resources spatial and temporal data regarding types of species and its characteristics is
desirable. A very common constraint encountered in the context of forests resources
planning is inadequacy of the previous forests records, but in case of short records
various techniques like remotely sensed data can be used as a suitable technique.
Analysis derived from altitudinal characteristics of vegetation cover and
species observed in sacred groves of the entire study area shows that many species are
economically as well as ecologically important. The livelihoods of local villagers,
particularly in the western part of the study area is largely depends on the forests
products particularly fodder, fuel and timber. Most of the species reported has a
medicinal and ayurvedic values and mainly includes Albizzia procera, Aegle
marmelos, Semecarpus anacardium, Hollarhena anitidysenterica, Hardwickia binata
etc. Leaves, flowers, seeds, roots and flower buds of these plant species are highly
used by villagers. Plants like Mangifera indica Zizyphus mauritiana Syzygium cumini
Aegle marmelos provides food. Acacia catechu, Butea monosperma, Aegle marmelos,
Semecarpus anacardium and Terminalia chebula are useful for tanning in industries.
The forest species that provides a variety of non-timber products which are also know
as known as non-timber forests species (NTF) are recorded. According to the
106
Chapter V : Appraisal of Forest Resources
‘Economic survey of Maharashtra- 2011’, the share of forest in GSDP of agriculture
and allied activities sector during 2009-10 was 20.6 percent.
During the conversation with villagers perceptions regarding the various uses
of plants were obtained. It was observed that most of local needs of villagers in
western parts of study area are derived from the forests and hence dependency on
forests resources is found more in this part. On the contrary villages located in the
eastern part are very close to the urban centers and shows very low dependency on
forests resources.
According to the State of environmental report Maharashtra, Pune forest circle
has produced 114 Cu.m timber worth of Rs. 134.26 lakhs and 311 cu.m of non forest
product of Rs 2.39 lakh during the year 2005. Bamboo, Tendu leaves, Grass Hirda
and Moha are some of the important forest producer. According to the district social
and economic survey, Pune-2010, the total forest cover in Pune district was 1899 km2.
during this economic year fuel wood 810000/- . Grass, shikekai, chich, and other
produces 500000 Rs. Apta and Hirda trees were auctioned by the forests department
and the contractors employ the local labour for the collection of leaves and fruits.
Since last few years this auctioned has been stopped because the prices are so low and
it is now uneconomic to collect it, hence most of the villagers collect themselves all
these forests products.
The information regarding the sale of trees for timber, charcoal making and
sale of fuel wood is very limited now in the study area, and very few merchants are
dealing with this business and refused to provide the information. Timber from trees
like Terminalia chebula Terminalia alata, Hardwickia binata, is suited for making
agricultural equipments as well as timber from trees like Terminalia alata, Anogeissus
latifolia, Syzygium cumini and bamboo is used for house construction. In some parts
grasses like karvi are also used to thatched roof. For fuel shrubs like Carissa congesta,
Carvia callosa Lantana camara, and Lasiosiphon eriocephalus are the common shrub
species. These are also sold in the local market or surrounding villages.
The marginal farmers or peasants also sell products like bamboo and other
economically valued trees. The merchants or contractors from the Pune city usually
bye clumps of bamboo or trees and arrange for felling the trees and its transportation.
The value of trees depends upon species and the size. Farmers also get good return on
a full grown mature Mangifera indica trees as well as trees like Terminalia chebula
107
Chapter V : Appraisal of Forest Resources
Terminalia alata. Up to the last decade, coal merchants operated in the region often
buy the plots which were cleared-felled for shifting cultivation and the payment were
made on the basis of amount of charcoal produced. From the forests lands many
forests products are collected and carried out to the local market as well as to the
wholesale market in Pune. Weeds are naturally grown in the hilly tracks of western
parts of study area which is used to feed the domestic livestock during the monsoon.
Weeding is the labour intensive activity performed during the monsoon particularly in
August and September. Harvesting is done manually at end of year with the
traditional equipments like a sickle and plants are left to dry.
5.7 Degradation of forests cover in the study area
Change in forest cover in Maharashtra state and Pune district shows different
rates. According to the forest survey of India’s state of forest report 1991,
Maharashtra had 20.30% area under forest which drops down up to 16.46% in 2011.
On the other hand, during the same years Pune district has 5.82% and 11.07%
geographical area under forest. All though the district Pune shows the positive
growth, there is significant loss of area under very dense forest and moderately dense
forest. In 1991 there was 442 km2 area under very dense forest which shows 100%
loss in 2011. The growth in open forest from 499 km2 in 1991 to 975 km
2 in 2011 is
responsible to represent the overall growth in the area under forest of Pune district.
Most of the natural forests and some of the plantation in the study area have faced
threats from the growing human population. Forests in the study area have been
disturbed significantly through logging, clear felling, grazing, fire and the collection
of fuel wood, fodder and non-timber forests products. These forests are now gradually
losing their quality in terms of species mainly due to illegal harvesting and clearing
for agricultural and constructional activities. The rate of degradation of forests has
been calculated. Table 5.7 shows that during the period of 1997 to 2012 area under
the moderately forests cover decreased by the rate of 68.09%. It is clear that the
pressure on the moderately dense forests has been increased. Since last fifteen years
this forest area is decreasing by the annual rate of 4.54%. As far as area under open
forest cover is concern, it has shown slight increase from 26.15% in 1997 to 29.77%
in 2012, which is the result of thinning of dense forest. In entire span of fifteen years
this growth rate is very less and it is only 13.84%. Annual growth rate of the area
under open forests is only 0.92%. In all the forests classes taken into consideration,

108
Chapter V : Appraisal of Forest Resources
scrub and degraded forests shows highest rate of growth. It can be clearly observed
that this growth rate was 171.04% of the total period of observation. Among all,
annual degradation rate of forest is more and it is 11.40% per annual (Fig 5.3).
Table 5.7 Degradation of forest (%)
No Forest type
LULC LULC Change between Average rate
1997 2012 1997 & 2012 of change
Area
(km2)
Area
(%)
Area
(km2)
Area
(%)
Area
(km2)
Area
(%)
(km2)/ (%)/
Yr Yr
1 Moderately Dense forest 168.56 37.27 53.79 11.89 -114.77 -68.09 -7.65 -4.54
2 Open Forests 118.24 26.15 134.61 29.77 16.37 13.84 1.09 0.92
3 Scrub/ Degraded forest 21.06 4.66 57.08 12.62 36.02 171.04 2.4 11.4
Source : IRS LISS III data (1997 & 2012) Fig 5.3 degradation of forest in 15 years
Thus most remaining forests in the entire study area are secondary, primarily
post extraction secondary forests arising after significant disturbances through large
scale and small scale forest extractive activities. Post extraction forest are defined as
‘forest regenerating largely through natural processes after significant reduction if the
original forest vegetation through trees extraction at a single time or over an extended
period, and displaying the major difference in forests structure and species
composition with respect to nearby primary forests on similar sites (Chokkalingam et
al. 2000).
Secondary forests are important for the supply of fuel wood, manure, raw
materials for rural communities. They are potentially very important for their
environmental functioning including soil and watershed conservation, flood control
and carbon storage. After the passing of the Forests Conservation Act of 1980, forests
clearing, forests conversion pressures for agriculture and other infrastructural facilities
109
Chapter V : Appraisal of Forest Resources
were reduced. However remaining natural forests mostly secondary continue to be
subject to increasing local extraction pressure with growing populations demand for
forest product, hence large areas of forest are degraded and converted into barren
lands.(Ravindranath & Hall 1994)
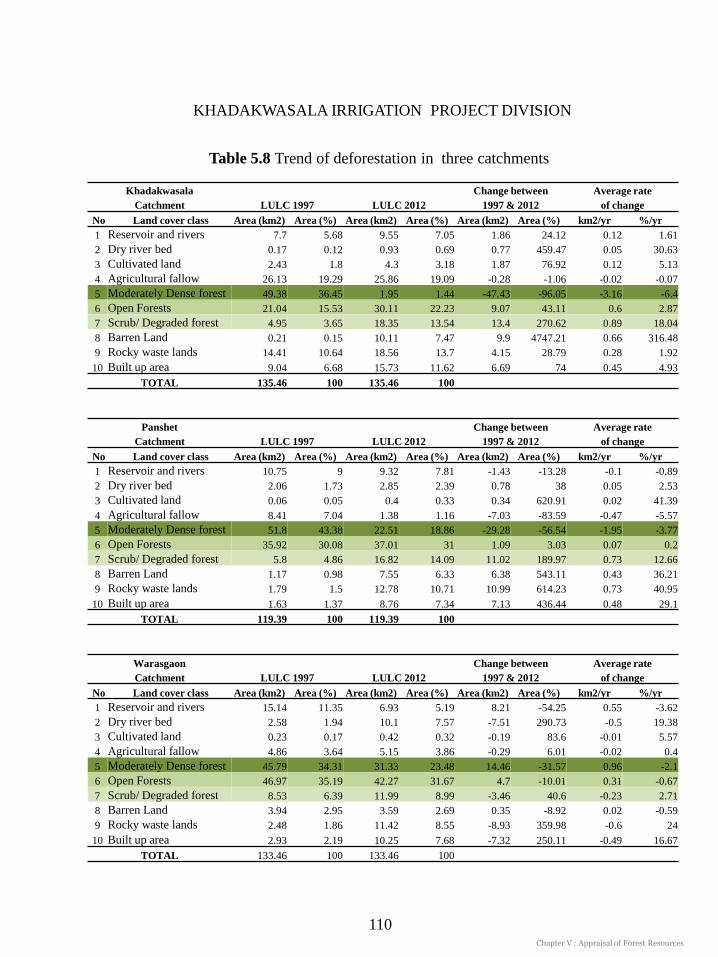
5.8 Deforestation in catchments
An attempt has also been made to study the deforestation in all three
catchments of Khadakwasala irrigation project division. The land use land cover data
for the year of 1997 and 2012 has been obtained by unsupervised classification of
LISS III satellite data. Average rate of change in forest lands are calculated for
geographical area as well as percent per year for the all three catchments.
It can be clearly observed that, among all three catchments, Khadakwasala
reservoir is facing more severe problem of deforestation. Here area under moderately
dense forest is decreasing by 6.40% per year. Whereas in Panshet and Warasgaon
catchment this annual rate of change in moderately dense forests is 3.77% and 2.10%
respectively. Furthermore the annual increasing rate of scrub or degraded forest is
also high in Khadakwasala catchment and it is about 18.04% per year. During the
same period of span this rate of change in Panshet and Warasgaon is 12.66% and
2.71% respectively. Deforestation in Khadakwasala has been resulted in increase of
barren land and it can be observed form the table 5.8. In the year 1997 proportion of
barren land was only 0.15% to the total surface area of the catchment which is
increased up to 7.47% in the year 2012. It is increasing by 0.66 km2 per year. The
growth in built up seems slow in this catchment and4.93% per year. Within the span
of 15 years it has been increased by 74%.
Open forest in the study area are the result of decrease in canopy or
moderately dense forest cover. One of the most important and noticeable aspect is
that, open forest is also decreasing in Warasgaon catchment by 0.67% per year. On
the contrary, area under open forest is increasing in Khadakwasala by 2.87% and in
Panshet by 0.20% per year.
5.9 Normalized difference vegetation index (NDVI) analysis
There are various methodologies for studying seasonal changes in vegetation
through satellite images, one method of which is to apply vegetation indices relating
to the quantity of greenness is the NDVI (Chuvieco, 1998). The Normalized
Difference Vegetation Index (NDVI) is the most commonly used satellite derived
Khadakwasala
LULC 1997 LULC 2012
Change between Average rate
Catchment 1997 & 2012 of change
No Land cover class Area (km2) Area (%) Area (km2) Area (%) Area (km2) Area (%) km2/yr %/yr
1 Reservoir and rivers 7.7 5.68 9.55 7.05 1.86 24.12 0.12 1.61
2 Dry river bed 0.17 0.12 0.93 0.69 0.77 459.47 0.05 30.63
3 Cultivated land 2.43 1.8 4.3 3.18 1.87 76.92 0.12 5.13
4 Agricultural fallow 26.13 19.29 25.86 19.09 -0.28 -1.06 -0.02 -0.07
5 Moderately Dense forest 49.38 36.45 1.95 1.44 -47.43 -96.05 -3.16 -6.4
6 Open Forests 21.04 15.53 30.11 22.23 9.07 43.11 0.6 2.87
7 Scrub/ Degraded forest 4.95 3.65 18.35 13.54 13.4 270.62 0.89 18.04
8 Barren Land 0.21 0.15 10.11 7.47 9.9 4747.21 0.66 316.48
9 Rocky waste lands 14.41 10.64 18.56 13.7 4.15 28.79 0.28 1.92
10 Built up area 9.04 6.68 15.73 11.62 6.69 74 0.45 4.93
TOTAL 135.46 100 135.46 100
Panshet
LULC 1997 LULC 2012
Change between Average rate
Catchment 1997 & 2012 of change
No Land cover class Area (km2) Area (%) Area (km2) Area (%) Area (km2) Area (%) km2/yr %/yr
1 Reservoir and rivers 10.75 9 9.32 7.81 -1.43 -13.28 -0.1 -0.89
2 Dry river bed 2.06 1.73 2.85 2.39 0.78 38 0.05 2.53
3 Cultivated land 0.06 0.05 0.4 0.33 0.34 620.91 0.02 41.39
4 Agricultural fallow 8.41 7.04 1.38 1.16 -7.03 -83.59 -0.47 -5.57
5 Moderately Dense forest 51.8 43.38 22.51 18.86 -29.28 -56.54 -1.95 -3.77
6 Open Forests 35.92 30.08 37.01 31 1.09 3.03 0.07 0.2
7 Scrub/ Degraded forest 5.8 4.86 16.82 14.09 11.02 189.97 0.73 12.66
8 Barren Land 1.17 0.98 7.55 6.33 6.38 543.11 0.43 36.21
9 Rocky waste lands 1.79 1.5 12.78 10.71 10.99 614.23 0.73 40.95
10 Built up area 1.63 1.37 8.76 7.34 7.13 436.44 0.48 29.1
TOTAL 119.39 100 119.39 100
Warasgaon
LULC 1997 LULC 2012
Change between Average rate
Catchment 1997 & 2012 of change
No Land cover class Area (km2) Area (%) Area (km2) Area (%) Area (km2) Area (%) km2/yr %/yr
1 Reservoir and rivers 15.14 11.35 6.93 5.19 8.21 -54.25 0.55 -3.62
2 Dry river bed 2.58 1.94 10.1 7.57 -7.51 290.73 -0.5 19.38
3 Cultivated land 0.23 0.17 0.42 0.32 -0.19 83.6 -0.01 5.57
4 Agricultural fallow 4.86 3.64 5.15 3.86 -0.29 6.01 -0.02 0.4
5 Moderately Dense forest 45.79 34.31 31.33 23.48 14.46 -31.57 0.96 -2.1
6 Open Forests 46.97 35.19 42.27 31.67 4.7 -10.01 0.31 -0.67
7 Scrub/ Degraded forest 8.53 6.39 11.99 8.99 -3.46 40.6 -0.23 2.71
8 Barren Land 3.94 2.95 3.59 2.69 0.35 -8.92 0.02 -0.59
9 Rocky waste lands 2.48 1.86 11.42 8.55 -8.93 359.98 -0.6 24
10 Built up area 2.93 2.19 10.25 7.68 -7.32 250.11 -0.49 16.67
TOTAL 133.46 100 133.46 100
110
Table 5.8 Trend of deforestation in three catchments
Chapter V : Appraisal of Forest Resources
KHADAKWASALA IRRIGATION PROJECT DIVISION

111
Chapter V : Appraisal of Forest Resources
index of vegetation health and density. The premise is that NDVI is an indicator of
vegetation health, (Table 5.8) because degradation of ecosystem vegetation, or a
decrease in green, would be reflected in a decrease in NDVI value (C.L. Meneses-
Tovar). The NDVI is a measurement of the balance between energy received and
energy emitted by objects on Earth surface. When applied to plant communities, this
index establishes a value for how green the area is, that is, the quantity of vegetation
present in a given area and its state of health or vigor of growth. The NDVI is a
dimensionless index, so its values range from –1 to +1. In a practical sense, the values
that are approaching -1 indicates water surface, -0.1 to 0.1 correspond to barren areas
of rock or snow while higher values more than 0.2 are the indicators of high
photosynthetic activity linked to scrub land, temperate forest, rain forest and
agricultural activity.
Various atmospheric effects cause absorption and scattering of the solar
radiation. Reflected or emitted radiation from an object and path radiance
(atmospheric scattering) should be corrected for further analysis of land use and land
cover. Dark Object Subtraction (DOS) is a method of atmospheric correction.
Dark Object Subtraction (DOS) method is a type of Relative radiometric
correction. In an ideal situation, a radiometrically ‘‘dark’’ object produces zero
radiance in all wavelengths. In the Dark Object Subtraction (DOS) method, it is
assumed that any radiance received at the sensor for a dark object pixel is due to
atmospheric path radiance (Chavez, 1996). Thus, for dark objects, the pixels
containing the lowest DN values are selected from the image and their representative
value is subtracted from the DNs across the whole scene to reduce scattering
influences. The dark objects need to be carefully chosen from the scene; clear water
bodies and dark vegetation under shadows are traditionally selected as dark objects
(e.g. Chavez, 1996; Song et al., 2001). DOS is a simple method and has been widely
used in many applications.
In both the image i.e. 1997 and 2012 DOS method has been applied and then
NDVI analysis has been done.
Fig 5.4 shows NDVI images for the year 1997 and 2012 respectively. It can be
observed that for the year 1997oveall range of values was 0.95 to -0.01 which shows
the presence of healthy vegetation. It can be well marked towards the western parts of
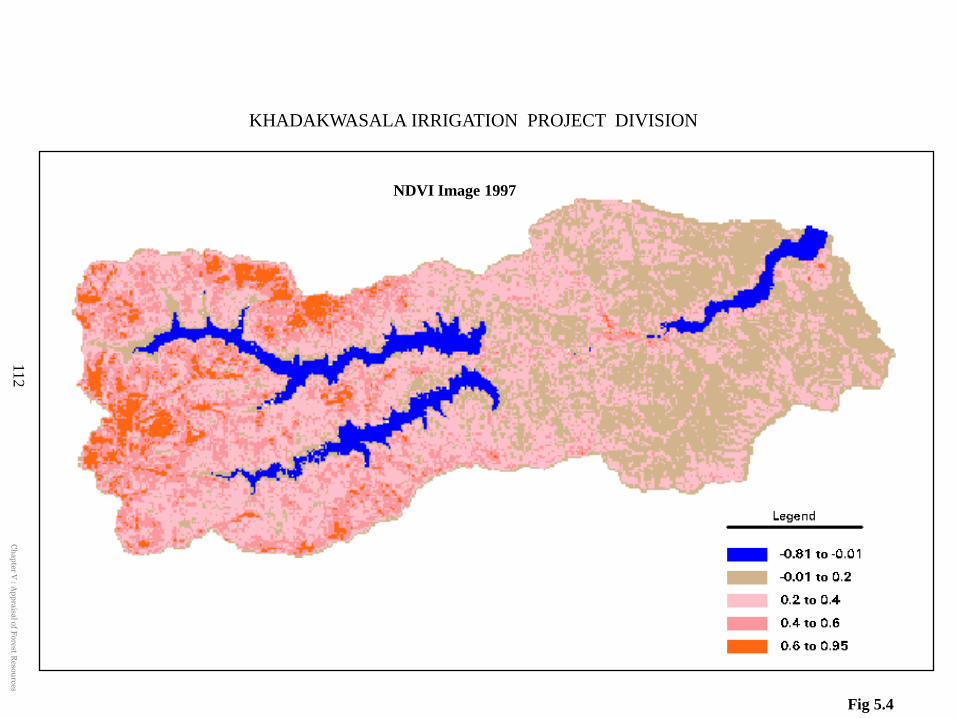
NDVI Image 1997
Fig 5.4
KHADAKWASALA IRRIGATION PROJECT DIVISION
Ch
ap
ter V : A
pp
raisa
l of F
orest R
esou
rces112
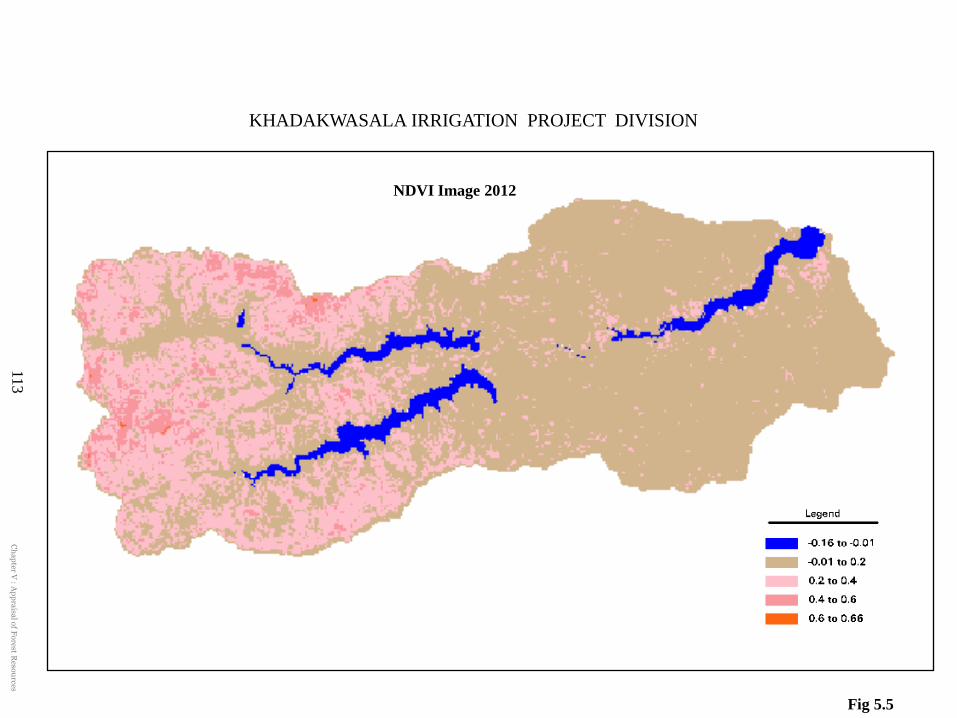
NDVI Image 2012
113
Fig 5.5
KHADAKWASALA IRRIGATION PROJECT DIVISION
Ch
ap
ter V : A
pp
raisa
l of F
orest R
esou
rces

114
Chapter V : Appraisal of Forest Resources
the study area, where NDVI values are ranging from 0.4 to 0.95. Values below the 0.2
indicated the proportion of barren land which is present towards the eastern part of the
study area. However NDVI value below the -0.81 indicates the water surfaces in the
study area.
In the year 2012 (Fig 5.5), there is drastic change in NDVI values where
greenness is decreased which is indicated by 0.6 to 0.66 values. During this year
vegetation is present only in few pockets of extreme western parts of the study area.
Increase in the NDVI values from 0.2 to -0.01 indicates the increase in the barren
land. Entire eastern part of the study i.e. particularly Khadakwasala catchment has
been turned almost into barren region.
The minimum NDVI values occur between February and mid June as these are
the driest periods in India. By considering the ratio of red and infrared bands an image
of vegetation ‘greenness’ can be defined.
5.10 Threat to the forests in the study area
Over and irrational use, technological and industrial growth, expansion of city
and increasing consumption levels are major factors causing depletion of forests
resources in entire Pune district. Land use and land cover changes, forests degradation
and infrastructural development for the period between 1997 to 2012 indicates that
forests degradation is much more severe and its shows strong relationship with
infrastructural development.
5.10.1 Unscientific methods of agriculture
Although area under agriculture is very low in the entire study area, farmers in
the have neither the knowledge nor the proper means for correct agriculture practices
and soil conservation. In addition shifting cultivation is practiced in mostly in the hilly
tract. Slash and burn type of agriculture is the clearing of forested land for raising or
growing the crops until the soil is exhausted of nutrients and site is overtaken by
weeds and then moving on to clear more forest. Along the banks of reservoir where
area under cultivation is more, strip cropping, contour farming, mulching, crop
rotation, cover cropping etc are not generally practiced. Elementary field preparation
measures like land leveling, channel grading contour trenching etc are also not seen in
the entire study area. On the slopes where farmers break virgin hill slopes, fell and
burn forests and cultivate these areas for mere two to three years before moving to
new areas is common.
115
Chapter V : Appraisal of Forest Resources
5.10.2 Commercial encroachment
Expanding cities and towns require land to establish the infrastructures
necessary to support growing population which is done by clearing the forested land
(Mather, 1991; Sands 2005). Most of the places in the study area are becoming
concrete jungles only because the tendency of building of private farm houses,
bungalow along with lodges and hotels for the weekend or for vacations is increasing
rapidly. Whether supported or not by the governmental programmes and planners, this
encroachment have usually colonized forest by using logging trials or new roads to
access the forest for new land. According to the census data for the year, 1991 to
2001, population growth in entire part of the study area has not increased up to the
greater extent. But still the developmental activities have risen up at greater extent.
There is also a noticeable migration of the rural working population from other states.
The entire study area s affected by demographic and development pressure.
5.10.3 Tourism
Tourism is now changing from nature and adventure seeking activity to a
luxury consumption exercise which is exploiting more natural resources. Uncautioned
and improper opening of the areas to the public for tourism is damaging the
vegetation cover in entire study area. When the frequency of visitors or tourist
becomes excessive problems along with land degradation increases. Unfortunately the
government is adopting the tourism for easy way of making money sacrificing the
stringent management strategies. Many companies and resorts who are advertising
themselves as eco-tourist establishments are in fact exploiting the forest profits. The
sites of sacred groves in the study area have become a popular eco-tourism
destination. But due to the repeated injuries caused to the sacred groves by the curious
tourist is responsible in decreasing the total numbers of sacred groves in the entire
study area. Now very few sacred groves are found and some of them are on the edge
of vicinity. In fact in the name of eco-tourism, infrastructure development is taking
place mostly by the private players in these wilderness areas which are further
detrimental in terms of attracting people other than tourist also, causing deforestation
especially deep in the forest. Deforestation, fragmentation and degradation destroy the
biodiversity as a whole and habitat for migratory species including the endangered
ones. The biodiversity loss and associated large changes in forest cover could trigger
abrupt, irreversible and harmful changes.
116
Chapter V : Appraisal of Forest Resources
5.10.4 Livestock management system
A majority of rural households depends on livestock and forest resources to
supplement their livelihood. Livestock in western part of study area is still a source of
food, of income and a means of non-cash exchange. It also provides draught power,
organic manure for crop production and is used for short term transportation purpose.
The entire study area falls under peculiar seasons. During the dry seasons there is
severe shortage of grazing lands relative to the needs of livestock population. During
the dry season due to shortage of fodder this livestock moves up hills and on the bare
soil due these animals soils begins to degrade. The distribution of tree species depends
not only on the ecology of area but also on anthropogenic pressure. Forests that are far
away from the human settlements and on difficult terrain contained large areas under
moderately dense and closed forests. Rural villagers in the study area, as in many
other parts are economically poor and backward and highly dependent on nearby
forests. Non-timber forests products (NTFP’s) including fuel wood, forests fruits and
vegetables, forests medicinal plants play key role in livelihood, consumption and
income generation particularly for the rural people. People along with grazing animals
have direct access in the reserved and protected forests of the study area due to which
forest along with soils in the study area is also degrading.
5.10.5 Forests fires
Fires are a major tool used in clearing the forest for shifting and permanent
agriculture. Fire used responsibly can be a valuable tool in agriculture and forest
management but if abused it can be a significant cause of deforestation (Repetto,
1988; Rowe et al. 1992). In the present study area, with the arrival of summers, hill
and forest ecosystems in the study area are always under threat of forests fires.
Summer season is the peak time for breakout of forests fires. Particularly the dried
grass and flowing wind increase the chances and intensity of spreading the fire at a
faster rate. Forest fire triggered by nature are now very rare and most of the times it is
due to the human negligence or intentional. Sometimes local people believe that
burning of grasses enhances growth of new grass next season for cattle grazing.
Sometimes forests are also set a fire by the forest department to clear it of dry
vegetation in order to avoid the risk of huge fire. During this season along with other
dry vegetations, kusal type of grass becomes very dry due to the scarcity of water.
There were more than 24 forests fire incidence in the year 2011 which was
117
Chapter V : Appraisal of Forest Resources
responsible to the forests loss over 132 hectares, compared to the loss of 800 hectares
of forest loss in 2012. In the entire tract February to May are the months of forests
fires. Although forests department runs awareness programmes to make people
understand the effect of setting fire to forests, not much success has been achieved yet
in this context.
In forest fires, all fuel undergoes various stages of burning: pre-heating, fuel
break down, and combustion. It spread by means of radiation, convection, and
conduction. Fire occurs as a result of certain circumstances which constitutes its
environment which when conducive, triggers off a conflagration (Sharma and Hussin,
1995 et al). The rate of fire spread is governed by the velocity of wind, direction,
atmospheric temperature, vegetation types, combustibility, ground and duff moisture
and steepness of the terrain (Ambrosia and Brass, 1988). The knowledge of behavior
and dynamics of fire is essential to combat the same. In India, about 2-3% of the
forest area is annually affected by fire causing great losses to the forest resources.
Some fire is the incidental but majority of fires are deliberately caused.
5.10.6 Lack of environmental planning
The lack of environmental consideration in the planning of forest resources
has created severe impacts of irreversible nature on the environment, resulting in
ecological destruction in the study area. The production capacity of forests could not
keep pace with the exponential growth rate of human and livestock population in the
study area. In the last decade or so, wide recognition has been given to the existence
of ecological problems associated with forest resources development schemes. A very
few efforts are being done to protect the forest in the study area are seen. Non
government organizations (NGO’s) and institutions like Ecological Society of India,
Pune are working to minimize the degradation in the catchments. For sustainable
development, environmental protection should be an integral part of the development
process. The adverse impacts if any, on the environment, should be minimized and
offset by adequate measures. To ensure that the environmental concerns are dealt
within the planning phase of project, procedures have been established in many
countries which are called Environmental Impact Assessments (EIAs). The
government of India, Ministry of Environment & Forest has formulated a National
Environment Policy in 2006. The policy is intended to mainstream environmental
concerns in all developmental activities.


