ARAB PASSENGERS’ AIRLINES FRAMEWORK AND PERFORMANCE: JORDAN CASE
Nesreen Barakat
Working Paper 727
November 2012
The findings and conclusions in this report are based on our present knowledge and information with respect to economic data, source markets, and the status of the competitive market environment at the completion of our fieldwork and upon certain assumptions regarding the future. It should be noted that the availability of information pertinent to our research is often limited and, in various instances, difficult to collect and verify.
Send correspondence to: Nesreen Barakat To-Excel Consulting Associates [email protected]

First published in 2012 by The Economic Research Forum (ERF) 21 Al-Sad Al-Aaly Street Dokki, Giza Egypt www.erf.org.eg Copyright © The Economic Research Forum, 2012 All rights reserved. No part of this publication may be reproduced in any form or by any electronic or mechanical means, including information storage and retrieval systems, without permission in writing from the publisher. The findings, interpretations and conclusions expressed in this publication are entirely those of the author(s) and should not be attributed to the Economic Research Forum, members of its Board of Trustees, or its donors.
1
Abstract
The past two decades have witnessed vivid changes in the air transport services sector. These changes started in the developed countries, having a drastic effect on the global air transport services sector. This study performs an ex-post analysis; investigates the impact of the current passengers’ airlines conduct (e.g. agreements, alliances etc.) on the performance of the industry (number of passengers, airfares, and welfare) in Jordan. The estimation result- using OLS, 2SLS and GMM- concludes that air liberalization has no effect neither on the number of passengers nor the airfares. This insignificance can be interpreted by the fact Royal Jordanian has full dominance of the Jordanian air market, having the largest market share. However, judging on the desirability of openness is the impact on welfare. Based on the simulation results, increasing competition decreases the total revenue for the producers (as the average airfare has gone down) and increases the consumer surplus. The net effect of these changes on society welfare is positive; the consumer surplus increase outweighs the producers’ surplus decrease. This supports the notion of further liberalization in the air market in Jordan.
JEL Classifications: L11, O53, C51
Keywords: Jordanian airlines, Competition, Welfare
ملخص
لھا تأثیر كبیر على، وكان في البلدان المتقدمة ھذه التغییرات بدأت .خدمات النقل الجوي في قطاع حیة تغییرات شھد العقدین الماضیین
ذه التجرى .خدمات النقلو النقل الجوي العالمي قطاع یال دراسةھ ذ تحل أثر رجعي ینف قوت؛ ب ى حق أثیر ف شركات الطیران سلوك ت
)االجتماعیة فاھةوالر، تذاكر الطیرانعدد الركاب، متمثال فى ( الصناعة أداء على وغیرھا التحالفات مثلتفاقیات من اجراء ال الحالیة
عدد ال على لیس لھ أي تأثیر سوق الطیران ریرتحإلى أن الورقة خلصت -2SLS GMMو، OLS اتباستخدام التقدیرو .في األردن
ى كاملة ھیمنة لدیھا الملكیة األردنیةشركة الطیران بالرجوع الى أن النتیجة ھذه ویمكن تفسیر .و تذاكر الطیران وال الركاب من عل
ة اھةفالر التأثیر على ھو االنفتاح الرغبة في الحكم على ومع ذلك، .في السوق أكبر لھا حصةو، األردني لسوقا ت .االجتماعی نادا اس
ین إجمالي اإلیرادات یقلل منزیادة المنافسة ان ف، المحاكاة إلى نتائج ذكرةب( للمنتج ط سعر الت اض متوس بب انخف ك و )س د منذل یزی
.المنتجین فائض انخفاض یفوق فائض المستھلك، وزیادة إیجابي المجتمعرفاھة ھذه التغیرات على األثر الصافي ل .فائض المستھلك
.في األردن ھواءال السوق رزیادة تحری فكرة ھذا یدعمو
2
1. Introduction The Air transport sector has become more widespread, due to global integration, and has quickly evolved to cater for increasing world tourism, business and investments, and cross-border trade and exchange. To capitalize on such a sector, effort must be undertaken towards improvements and more liberalization of the air services sector. In this context, this paper studies the impact of air services liberalization on the performance of the air transport sector in Jordan.
A number of papers investigating the impacts of airline industry’s structure on its economic performance have been published (e.g. Micco and Serebrisky, 2006; Albers et al., 2005; Brueckner, 2001; Oum et al. 2000). These studies illustrate that air services liberalization is a major concern because the airline framework can have important effects on fares, profits, consumer welfare and labor and non-labor mobility. Despite the high importance of the performance of airlines for economic integration and growth, empirical research investigating the impacts of the air agreements on the Jordanian air services sector’s performance is very limited to non-existent. Unlike other regional countries there are no papers or studies available to predict the impact of deregulating the airline industry prior to deregulation.
The present study seeks to fill this gap in the literature studying the liberalization of air services sector in Jordan. The paper performs an ex-post analysis; investigates the impact of the current passengers’ airlines conduct (e.g. agreements, alliances etc.) on the performance of the industry (number of passengers, airfares, and welfare) in Jordan.
For the analysis, an extended version of the well known Structure-Conduct-Performance (SCP) framework was adopted, which postulates that the direction of causality might run in two directions: firstly, the structure of an industry determines firms’ conduct which in turn determines performance; secondly, the performance may allow a firm to affect the market structure. A theoretical model is presented to highlight the main mechanisms at play in the Jordanian airline market. This model has two main testable implications. First, a higher degree of air liberalization unambiguously reduces the airfares paid by consumers. Second, a higher degree of air liberalization has two opposite effects on the number of passengers for a given carrier. It reduces the number of passengers for a given carrier due to more competition but increases the number due to lower average fares. As more and more carriers are in operation due to more liberalization, passengers are presented with a wide array of carriers to choose from and therefore the number of passengers for a given carrier will decrease. At the same time, due to liberalization, average airfares will decrease which will provide potential passengers with an incentive to travel more and therefore the number of passengers will increase as stipulated by the economic law of demand.
The estimation results confirmed the two main implications, using Ordinary Least Squares (OLS), Two Stage Least Squares (2SLS), and Generalized Method of Moment (GMM). In addition, using simulation under the assumption of more liberalization, the results show that the consumer’s welfare increases, while the producer’s welfare declines. Fortunately, the consumer’s welfare effect outweighs the producer’s welfare effect, leading to an increase in overall societal welfare.
The study is organized as follows: after the introduction, Section II& III provide the background information of the Jordanian Civil Aviation Industry and the Jordanian Airline Industry. Section IV discusses the economic framework and introduces the measure of openness and describes the model used. Section V explains the estimation results, and finally, section VI concludes and provides policy recommendations.
3
2. Jordanian Civil Aviation Industry Background 2.1 Structure (ownership, management, regulations, etc.) This section explores the structure of the Jordanian Civil Aviation Market and will cover the following: The number of domestic and/or national airlines companies in the market and their
activity. The extent to which foreign companies are allowed to operate in Jordan. The number of Jordanian airports, which provide and facilitate air traffic movement and
their relative importance. 2.1.1 Jordanian Airlines Market
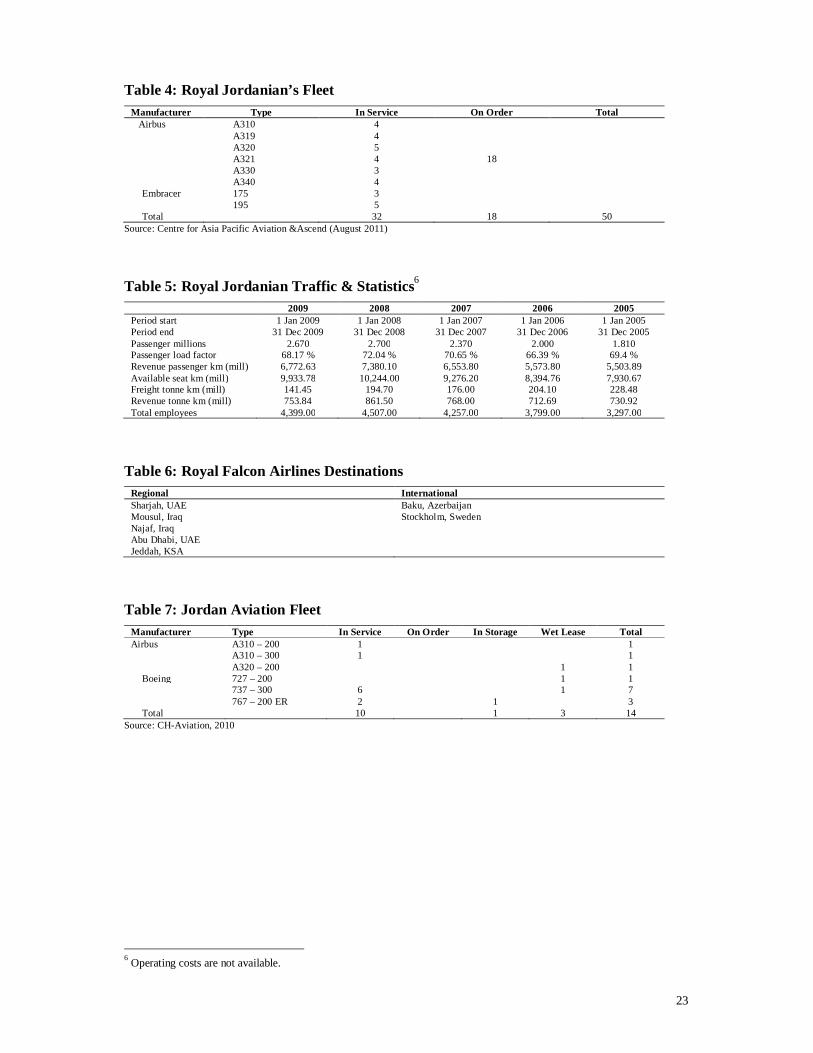
Royal Jordanian Airlines (RJ), the national flag carrier, has been dominating the Jordanian airlines market scene since its establishment in 1963 with scheduled flights domestically, regionally and internationally. According to the Jordanian Civil Aviation Regulatory Commission (CARC) there are 9 Jordanian airline companies that have Air Operating Certificates (AOC) and can operate in the market (Table 1). The majority of these certified airline companies provide charter (non-scheduled) flight services; several are focused on air freight and cargo with only two airlines that operate scheduled flights to regional and international destinations, which are RJ and Royal Falcon. As Royal Jordanian has full dominance of the market, more focus will be placed on it than the other airlines in this section.
2.1.2 Royal Jordanian Airlines Royal Jordanian was established and commenced operations in 1963 as Alia, the Royal Jordanian Airline. The airline was later renamed Royal Jordanian in 1986. Royal Jordanian is headquartered in the capital, Amman, and its flights are operated from Queen Alia International Airport (QAIA) in Amman. It has a modern fleet that covers a network of 58 destinations on four continents.
Royal Jordanian was a 100% government owned institution until its privatization in 2007. In December 2007, Royal Jordanian had its Initial Public Offering (IPO), which changed the company’s ownership structure reducing the government’s ownership to 29%. Table 3 shows major shareholders as of end 2009.
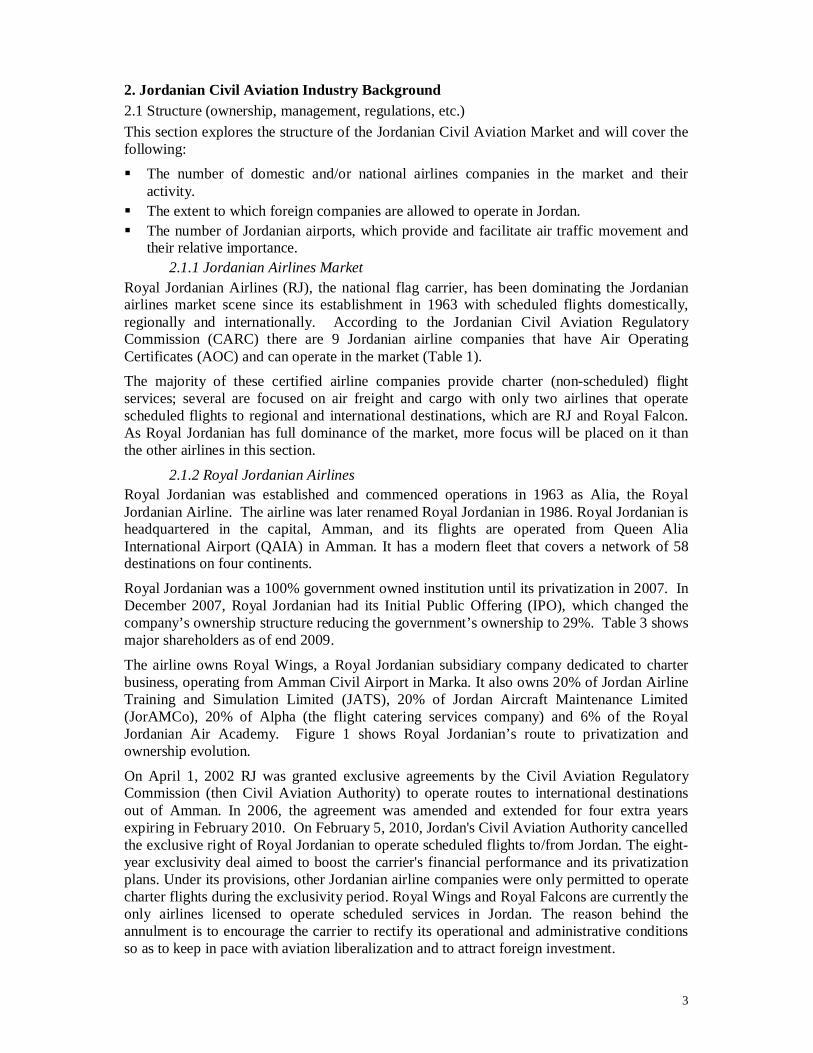
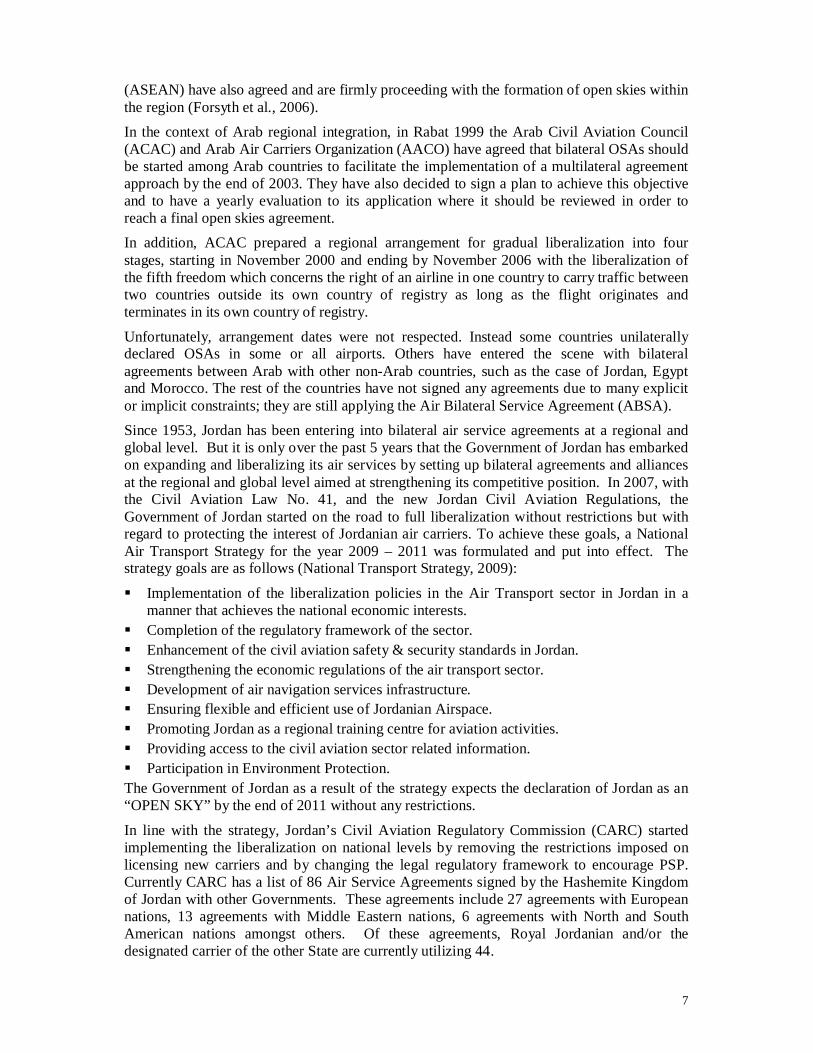
The airline owns Royal Wings, a Royal Jordanian subsidiary company dedicated to charter business, operating from Amman Civil Airport in Marka. It also owns 20% of Jordan Airline Training and Simulation Limited (JATS), 20% of Jordan Aircraft Maintenance Limited (JorAMCo), 20% of Alpha (the flight catering services company) and 6% of the Royal Jordanian Air Academy. Figure 1 shows Royal Jordanian’s route to privatization and ownership evolution.
On April 1, 2002 RJ was granted exclusive agreements by the Civil Aviation Regulatory Commission (then Civil Aviation Authority) to operate routes to international destinations out of Amman. In 2006, the agreement was amended and extended for four extra years expiring in February 2010. On February 5, 2010, Jordan's Civil Aviation Authority cancelled the exclusive right of Royal Jordanian to operate scheduled flights to/from Jordan. The eight-year exclusivity deal aimed to boost the carrier's financial performance and its privatization plans. Under its provisions, other Jordanian airline companies were only permitted to operate charter flights during the exclusivity period. Royal Wings and Royal Falcons are currently the only airlines licensed to operate scheduled services in Jordan. The reason behind the annulment is to encourage the carrier to rectify its operational and administrative conditions so as to keep in pace with aviation liberalization and to attract foreign investment.
4
The airline officially joined the Oneworld airline alliance1 on April 1, 2007, after it completed all technical and technological requirements to become part of the grouping, making RJ the first Arab and regional air carrier selected to join any of the three global airline alliances (Oneworld, SkyTeam and Star Alliance). By joining Oneworld, RJ has entered a network, which jointly serves more than 750 destinations in almost 150 countries. Moreover, Royal Jordanian is a member of Arab Air Carriers Organization
Royal Jordanian currently has marketing alliances, through codesharing, with several International airlines: American Airlines, British Airways, US Airways, Iberia, Malev Hungarian Airlines, Tarom, Gulf Air, Syrian Arab Airlines, and Yemen Airways. Royal Jordanian currently has a fleet of 32 aircrafts of various sizes that cater for its needs. There are 8 aircrafts on order as of 2010. Table 4 provides details of the fleet. Table 5 shows statistical information on Royal Jordanian for the period of 2005 – 2009 that include number of passengers per annum, revenue and number of employees. The above table illustrates how there has been an increasing trend in the number of passengers and the value of the revenue passenger km throughout the period except for the year 2009. It also shows that RJ has been increasing employment each year, except for the year 2009. This trend can be linked to both the privatization process, which was accelerated during this time period and the exclusivity agreement, which was granted to RJ. Both of these factors helped in the achievements of the airline as seen in the above table. However, in 2009, due to the effects of the global economic crisis, passenger numbers dropped along with associated revenues.
2.1.3 Royal Falcons Airlines Royal Falcon Airlines commenced its operation in August 2007 after being awarded its AOC for non-scheduled operation. On 28 June 2009, Royal Falcon Airlines was awarded its Scheduled AOC after completing all economic and technical requirements of the Jordanian Civil Aviation Regulatory Commission (CARC). It currently has several scheduled regular routes to regional and international destinations including Baku in Azerbaijan, Sharjah in the UAE, Mousul and Najaf in Iraq. Table 6 indicates the current Royal Falcon Airlines routes.
Currently Royal Falcon Airlines is currently completing all requirements to pass the IATA Operational Safety Audit (IOSA) to enable it to be a fully-fledged national carrier with scheduled operations.
2.1.4 Jordan Aviation Jordan Aviation was established in 1998 and started operations in October 2000. It launched services from Amman as the first privately owned charter airline in Jordan. It operates scheduled and worldwide charter services flights, mainly to the Middle East, Europe and Africa (see annex 4 for destinations). It also provides wet lease services2 to major airlines seeking additional capacity. Its main bases are Amman Marka Civil Airport and King Hussein International Airport in Aqaba. It is also an important provider of air transportation for UN peacekeeping forces. Jordan Aviation is a member of the Arab Air Carriers Organization. Jordan Aviation is privately owned and has over 700 employees (around 16% of employees in RJ). The airline has grown considerably since it commenced operations nearly 10 years 1The Oneworld member airlines include American Airlines, British Airways, Cathay Pacific Airways, Finnair, Iberia, Japan Airlines, LAN, Malév Hungarian Airlines, Mexicana, Qantas, Royal Jordanian and S7 Airlines. Kingfisher Airlines, India's only five-star airline, and Airberlin, the second largest airline in Germany, will join in the near future. 2 A wet lease is a form of a leasing agreement that provides multiple services and under the agreement, the owner will provide a crew, maintenance, and other services needed for the aircraft. A dry lease on the other hand, is the lease of the basic aircraft without any additional services such as insurance, maintenance… etc.
5
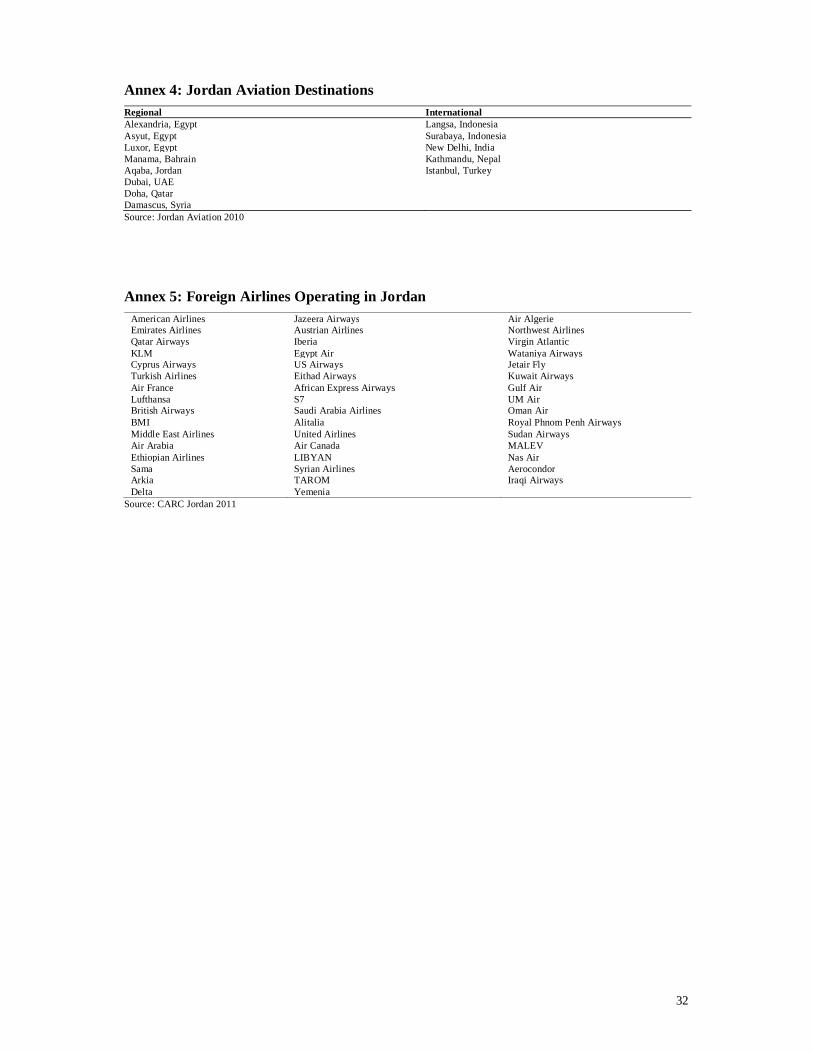
ago, and this is evident from its fleet (see Table 8). Additional aircraft are planned to enter service in the near future as Jordan Aviation is planning to expand into other market segments. It is worth noting here that the number of in-service fleet of Royal Aviation is almost a third of that of RJ. 2.2 Foreign airlines operations in Jordan Concerning foreign carriers, there are over 40 foreign airlines that operate flights to Jordan. Some of the airlines operate the flights to Jordan on a codeshare basis (See Annex 5 for the list of carriers). In addition to these carriers, there are over 30 other airlines that have offices or representatives in Jordan but do not operate any flights to Jordan directly or on codeshare basis.
Any restrictions placed on the operations of foreign carriers in Jordan are based on the different bilateral air service agreements signed between the different countries as well as any affiliate or alliance agreements. This will be discussed in more detail in section2 (Agreement part).
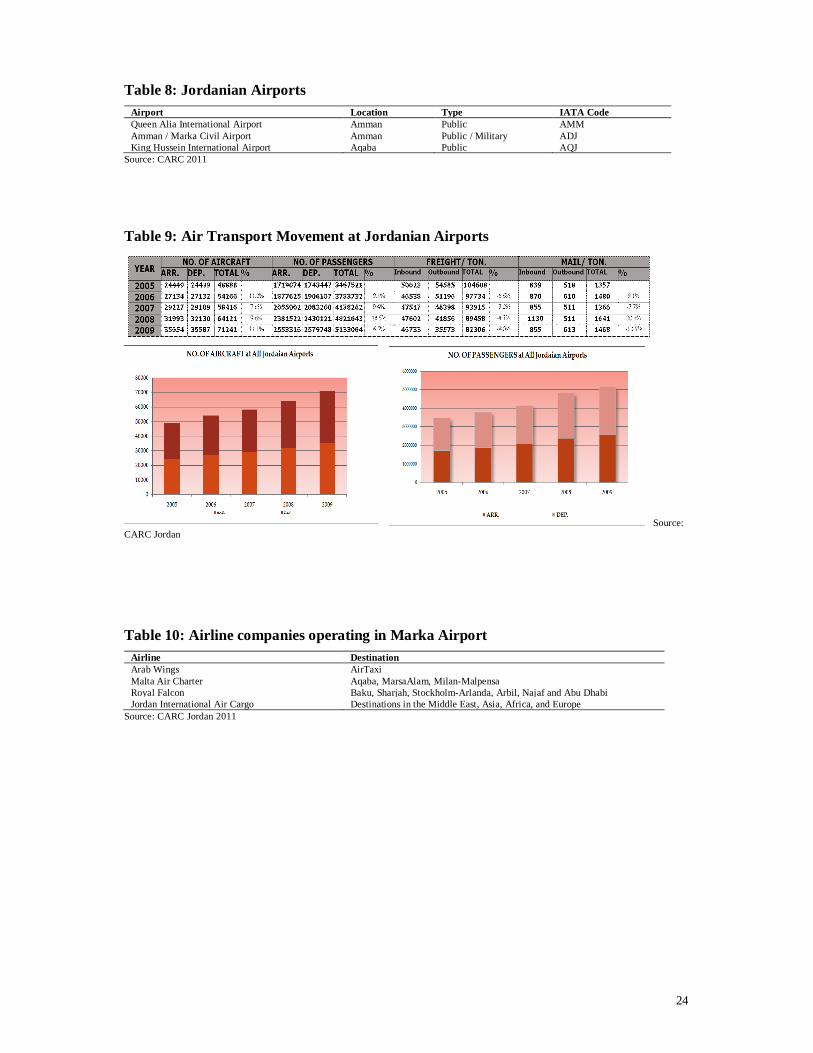
2.2.1 Jordanian Airports There are 3 civil airports that provide and facilitate air traffic movement in Jordan, running domestic, regional and international flights. Two are located in the capital city of Amman and one is in the Seaport City of Aqaba. Table 10lists the airports with their locations, type and IATA code.
Historically all three airports were owned 100% by the Government of Jordan. Over the past ten years the Government of Jordan has been adopting a gradual liberalization policy regarding the civil aviation sector, leading to the privatization of two of its airports. In 2007 it transferred the assets of the King Hussein International Airport to the Aqaba Development Corporation. Also in 2007, the government embarked on both the privatization of Queen Alia International Airport (QAIA), Jordan’s main airport and Royal Jordanian Airline’s hub airport, and its expansion under a BOT (Build, Own, Transfer) agreement, as part of its drive to make Jordan a regional hub.3 Under the terms of the BOT Agreement with the Government, the investor (Airport International Group - AIG) is responsible for the rehabilitation of the existing terminal, development of a new $600M terminal designed by internationally renowned Foster + Partners as well as operating and managing the airport for the period of 25 years. Scheduled to be completed in 2012 at the expansion plan will handle a capacity of 9 million passengers. The importance of the airports differs with the number flights they handle, the number of passengers they can serve as well as freight and mail services. As stated above, the most important airport for Jordan is Queen Alia International Airport; handling over 80% of aircraft traffic and serving around 93% of passenger traffic to Jordan, leaving the rest of flights to the other airports. Table 11 shows the air transport movement in all airports since 2005.
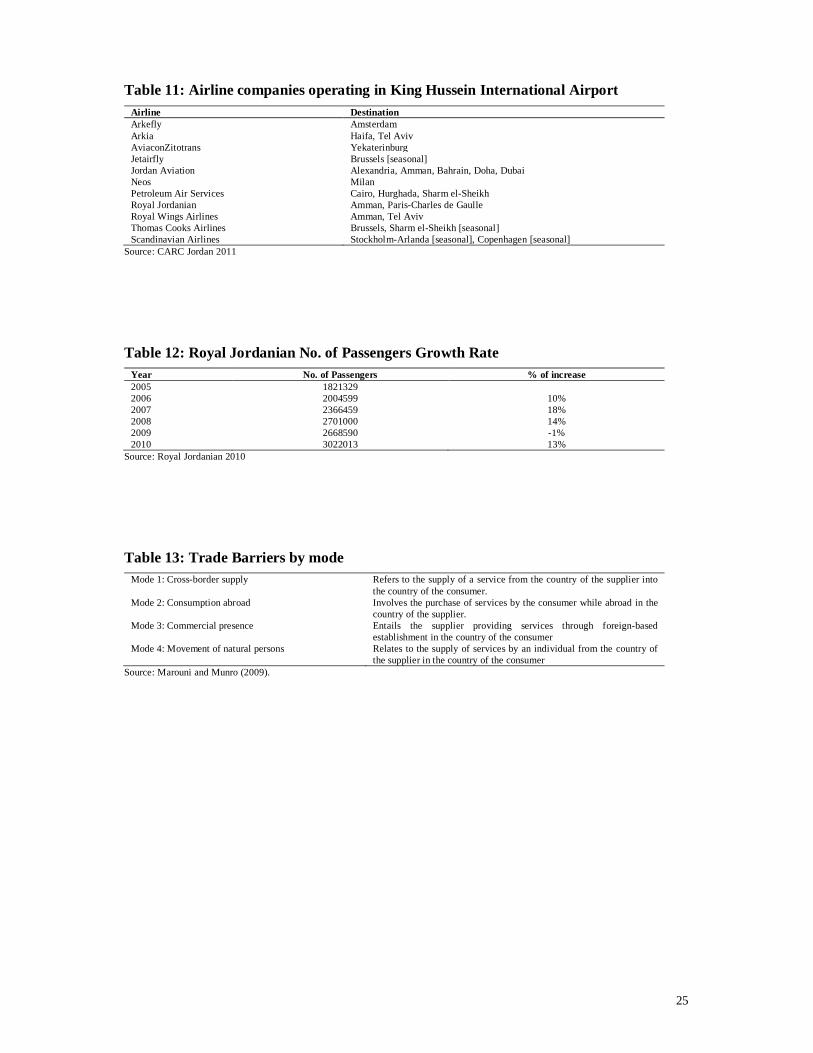
2.2.2 Queen Alia International Airport Currently QAIA serves 47 airlines, four of which are domestic airlines, and 43 of which are foreign airlines, making it the main destination for most of the foreign carriers flying to Jordan. Table 12 lists the airlines that have scheduled regular flights to and from QAIA, noting that some of the foreign airlines operate on codeshare basis to Amman.
3The future expansion project reached financial close on 15 November 2007. The project is a $675 million BOT (Build Own Transfer) basis transaction involving a 25-year contract for Rehabilitation, Expansion and Operation Agreement (“REOA” or “Concession” Agreement).
6
QAIA has been unable to meet the sustained growth in air traffic of 7 percent per year since2000 because of capacity constraints. Therefore, the Jordanian Government decided to rehabilitate and expand the airport, which includes the construction of a new 100,000-square meter terminal. The Government hopes that the upgrades to the airport will see the development of QAIA as a key hub in the region, with the national carrier, Royal Jordanian, having a strong pan-Arabian and intercontinental network. After the expansion of the airport is completed in 2012, QAIA will be able to handle the Airbus A380, thus allowing more flexibility for the airline’s use of airplanes for their Amman/regional route. The airport expansion plan once completed should enable the Queen Alia International Airport to handle around nine million passengers a year, nearly three times as many as it did before the expansion plan.
2.2.3 Amman Marka Civil Airport Amman Marka Civil is a one-terminal airport located in East Amman. It is a public/military airport that was established in 1950 and is owned by the Government. It was the home hub of Royal Jordanian until Queen Alia International Airport was inaugurated in 1983.Marka Airport mainly serves now as a regional airport servicing domestic and nearby international routes. It is home to airlines such as Royal Wings, Royal Falcon, Jordan Aviation, and Arab Wings.
2.2.4 King Hussein International Airport King Hussein International Airport was declared an open airport in 2003.The airport has a single runway and one terminal. The capacity of the Terminal at present is 1.5 million passengers a year. There are currently around 3,000 aircraft movements a year. A significant proportion of these are training flights in addition to the regular and charter flights. The largest operator at Aqaba is Royal Jordanian through its subsidiary Royal Wings. The airport is located in Aqaba International Industrial Estate 2.3 Agreements This section begins with a general outline of the history of agreements between airlines, giving some international examples. It then focuses on agreements in a regional context, mentioning the ACAC plan for gradual liberalization and the problems it encountered. Finally, Jordanian plans for air liberalization and an “Open Skies” declaration by 2011 are discussed, along with the steps taken in line with this strategy.
In 1978 world airlines started to liberalize air transport industry through setting up agreements. Agreements between airlines cover different degrees of cooperation spanning from only simple codesharing to a more complete joint venture including common marketing, services at airports and other service delivery points. Some agreements can also benefit from anti-trust immunity (Brueckner, 2001). Agreements are classified into complementary and parallel categories. The complementary agreement refers to the case where two firms link up their existing networks so as to feed traffic to each other. The parallel agreement refers to the collaboration between two firms who, prior to their alliance, are competitors on some routes (Oum et al., 2000). Such agreements are beneficial for firms as well as for consumer welfare. The deregulation of air services provision influences competition, efficiency in terms of revenue passengers, number of flights, capacity and airfares (mentioned in more details in Section III).
There are many different models around the world. The USA is pursuing, through various bilateral or multilateral agreements, a strategy of liberalization (as far as possible) of the air markets. The European Union (EU) is following a regional strategy by implementing open skies among its members. The countries of the Association of South-East Asian Nations
7
(ASEAN) have also agreed and are firmly proceeding with the formation of open skies within the region (Forsyth et al., 2006). In the context of Arab regional integration, in Rabat 1999 the Arab Civil Aviation Council (ACAC) and Arab Air Carriers Organization (AACO) have agreed that bilateral OSAs should be started among Arab countries to facilitate the implementation of a multilateral agreement approach by the end of 2003. They have also decided to sign a plan to achieve this objective and to have a yearly evaluation to its application where it should be reviewed in order to reach a final open skies agreement. In addition, ACAC prepared a regional arrangement for gradual liberalization into four stages, starting in November 2000 and ending by November 2006 with the liberalization of the fifth freedom which concerns the right of an airline in one country to carry traffic between two countries outside its own country of registry as long as the flight originates and terminates in its own country of registry.
Unfortunately, arrangement dates were not respected. Instead some countries unilaterally declared OSAs in some or all airports. Others have entered the scene with bilateral agreements between Arab with other non-Arab countries, such as the case of Jordan, Egypt and Morocco. The rest of the countries have not signed any agreements due to many explicit or implicit constraints; they are still applying the Air Bilateral Service Agreement (ABSA). Since 1953, Jordan has been entering into bilateral air service agreements at a regional and global level. But it is only over the past 5 years that the Government of Jordan has embarked on expanding and liberalizing its air services by setting up bilateral agreements and alliances at the regional and global level aimed at strengthening its competitive position. In 2007, with the Civil Aviation Law No. 41, and the new Jordan Civil Aviation Regulations, the Government of Jordan started on the road to full liberalization without restrictions but with regard to protecting the interest of Jordanian air carriers. To achieve these goals, a National Air Transport Strategy for the year 2009 – 2011 was formulated and put into effect. The strategy goals are as follows (National Transport Strategy, 2009):
Implementation of the liberalization policies in the Air Transport sector in Jordan in a manner that achieves the national economic interests.
Completion of the regulatory framework of the sector. Enhancement of the civil aviation safety & security standards in Jordan. Strengthening the economic regulations of the air transport sector. Development of air navigation services infrastructure. Ensuring flexible and efficient use of Jordanian Airspace. Promoting Jordan as a regional training centre for aviation activities. Providing access to the civil aviation sector related information. Participation in Environment Protection. The Government of Jordan as a result of the strategy expects the declaration of Jordan as an “OPEN SKY” by the end of 2011 without any restrictions.
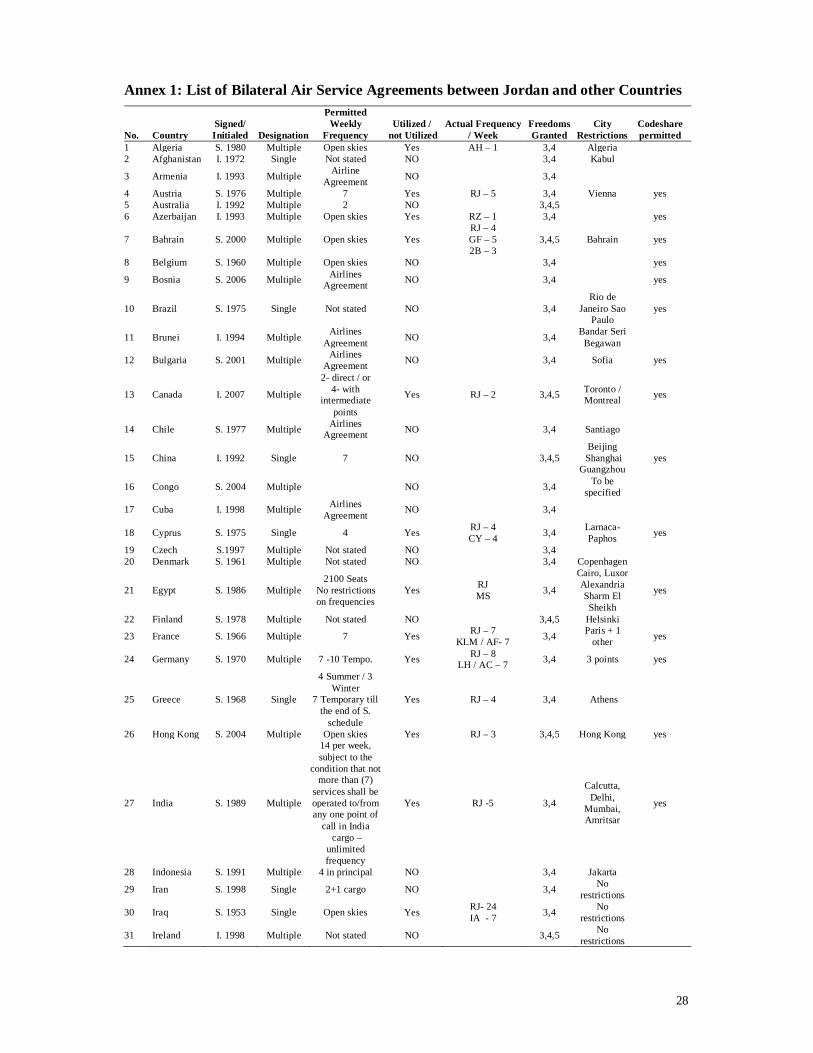
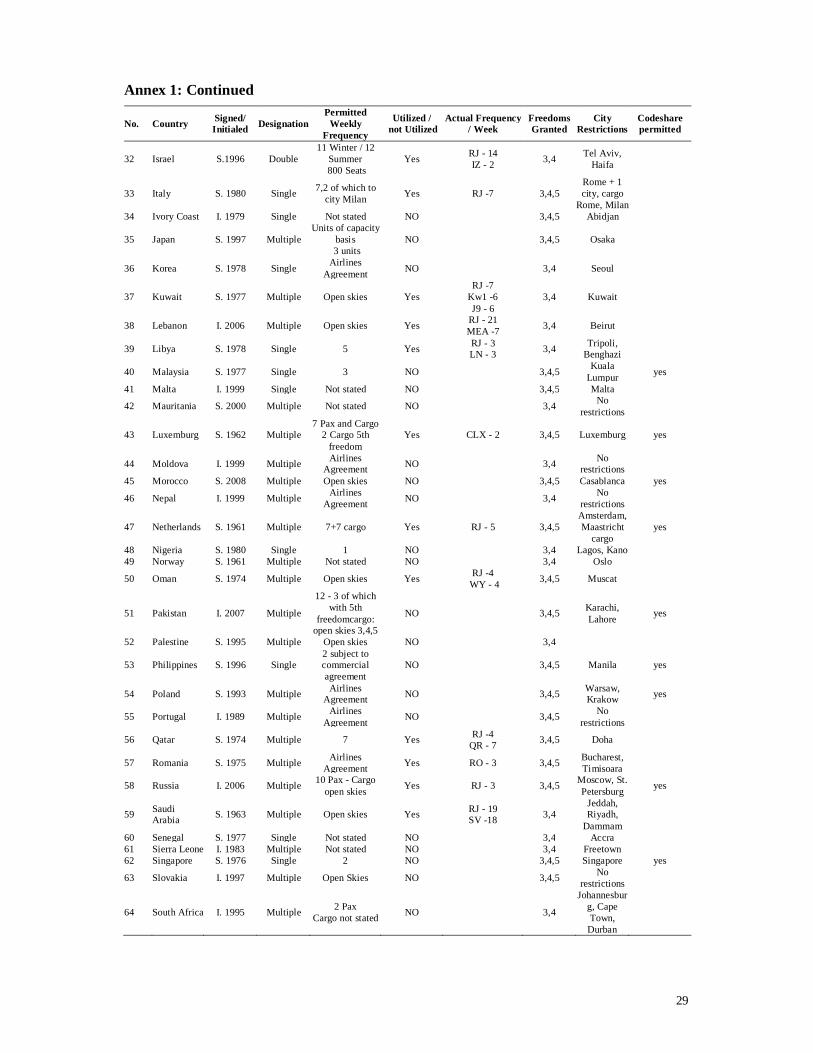
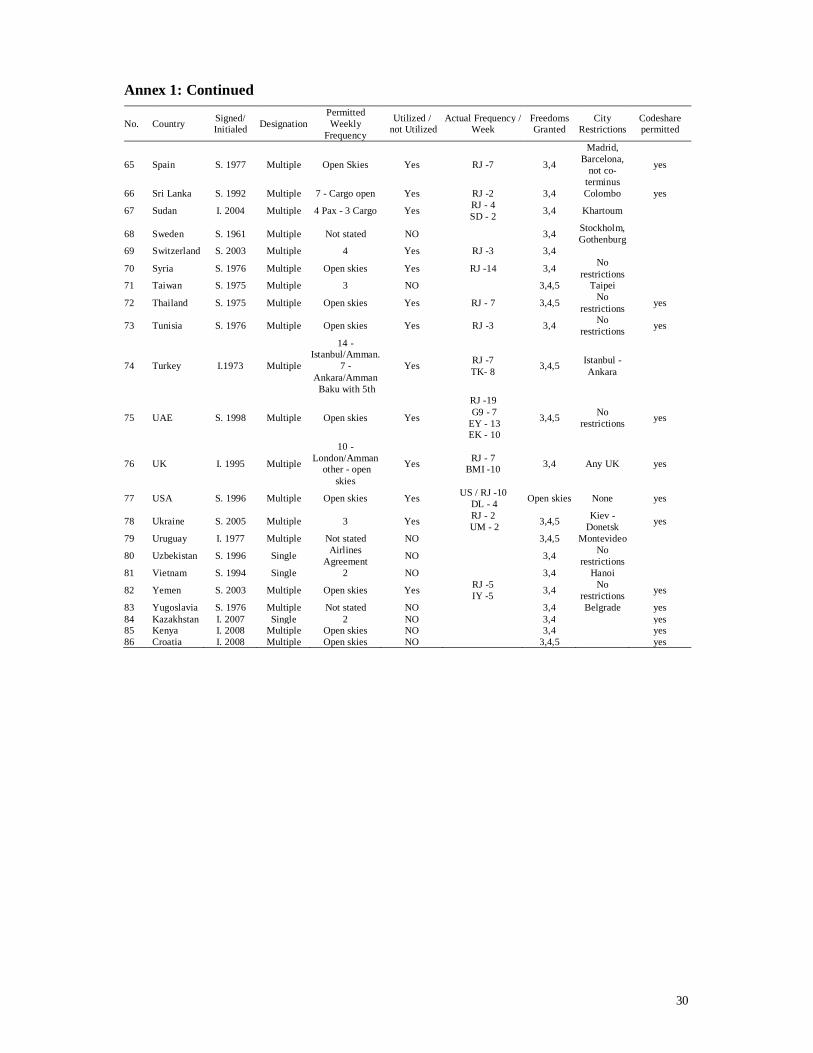
In line with the strategy, Jordan’s Civil Aviation Regulatory Commission (CARC) started implementing the liberalization on national levels by removing the restrictions imposed on licensing new carriers and by changing the legal regulatory framework to encourage PSP. Currently CARC has a list of 86 Air Service Agreements signed by the Hashemite Kingdom of Jordan with other Governments. These agreements include 27 agreements with European nations, 13 agreements with Middle Eastern nations, 6 agreements with North and South American nations amongst others. Of these agreements, Royal Jordanian and/or the designated carrier of the other State are currently utilizing 44.
8
Each of these Bilateral Air Service Agreements (ASA) have certain regulations, permissions and restrictions that govern the air service between Jordan and the other countries that include the designation, permitted weekly frequency, freedoms granted, restricted cities and codeshare permission. Of these permissions and restrictions, the freedoms granted and the permitted weekly frequency have the most effect on the airlines operating these flight routes. The definitions of the freedoms granted are shown in Box (1). The full list of Bilateral Air Service Agreements between Jordan and other countries is shown Annex 1 of this report. By joining Oneworld alliance in 2007, Royal Jordanian gained access to the alliance’s 700 destinations helping it overcome the restrictions dictated by Jordan’s signed bilateral ASAs. Since 2009, CARC has continued to conduct bilateral air transport negotiation for the purpose of concluding new air services agreements and/or amending the current agreements, in line with the national strategy to liberalize the civil aviation sector. Twenty-five “Open Skies” Air Service Agreements have been signed since then. Furthermore Jordan signed the European Horizontal Agreement, with negotiations underway with the EC for the conclusion of a comprehensive agreement. Jordan is currently implementing Open Skies policy with 21 countries on reciprocal basis.
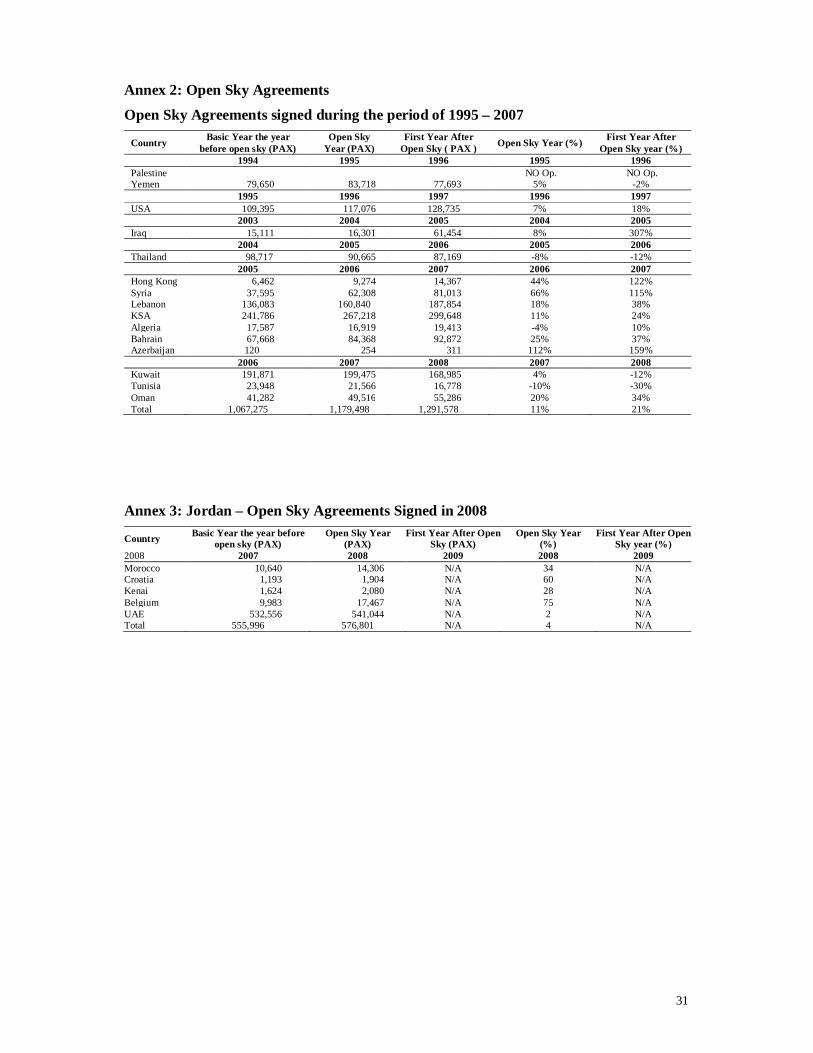
Also part of the liberalization process, CARC ended the Route Exclusivity Agreement with Royal Jordanian in February of 2010 allowing for more competitiveness in the market. Even with this action, the Jordanian Aviation market is still mainly represented by Royal Jordanian, which dominates more than 95 percent of the domestic market compared to domestic airlines and 52 percent in the international market compared to foreign airlines. Since the change of policy and the move towards liberalization, Jordan has witnessed an increase in the number of passengers that travel between it and the countries that it has Open Sky agreements with. Annex 2 shows this increase for the period of 1995 – 2008.
Finally, Royal Jordanian successfully joined an Arab integration project called ARABESK. It is an unofficial voluntary cooperation agreement among 9 Arab airlines (EgyptAir, Saudi Airlines, Gulf Air, Yemen Airways, Royal Jordanian, Middle East, Tunisair, Syrian Air, and Ethihad Airways) under the auspices of the AACO. The project was launched in 2005 and activated in January 2006, having several commercial aspects and means of co-operation among its members, such as coordinating schedules, reducing duplication on routes and linking the destinations network of members, stretching from North America to East Asia. These are followed by commercial agreements such as codeshares, special prorate agreements (SPAs) targeting to reach full commercial co-operation among the members; hence, boosting market share.
3. Jordanian Airline Industry’s Economic Performance 3.1 The Jordanian aviation market This section investigates the Jordanian Aviation Market, with particular focus on Jordanian Airlines represented by Royal Jordanian only. The analysis deals with the performance of the sector in regards to profits, number of passengers and other determinants that account for the sector’s performance. The discussion solely addresses Royal Jordanian since it is the dominant airline. For the period 2005-2009, Royal Jordanian profited annually from larger air traffic movement, except for the last fiscal year 2009 where the movement went down slightly by 1%. The number of passengers grew with an average annual growth of 10% percent for the period, going from 1.82 million in 2005 to 2.66 million in 2009 (explained on page 11). From 2005 to 2006, there was a growth of 10 percent, then; the number of passengers grew by 18 percent in 2007, and 14 percent in 2008 (2.7 million passengers). In 2009, due to the global financial crisis, the number of passengers decreased by 1%.
9
Furthermore, the number of departed flights for the same period of 2005 – 2009 trended upwards with an average annual growth rate of 15%. It is important to note that in 2009, during the global financial crisis, Royal Jordanian’s departure flights did not decrease but went up by 4% (Figure 1-2). This is because in that year, RJ introduced two new routes to its network (Brussels and Benghazi) and increased the frequency of its flights to some destinations such as Beirut, Cairo, Dubai, Abu Dhabi, and Jedda, due to anticipated increase in traffic and to put itself on the map as the carrier of choice in the Middle East. These efforts proved to be fruitful since the number of passengers has increased by 13% from 2009 to 2010 (Royal Jordanian 2010).
It is evident that the international air movement is the major contributor to the air movement trend in Jordan due to the fact that there is only one domestic route between Amman and Aqaba, operating 1 – 2 flights daily, making domestic air movement insignificant. All three airports are primarily for air traffic movement in Jordan. The main airport conducting and servicing flights and passengers are, in order, as follows: Queen Alia International Airport, Marka Civil Airport, and King Hussein International Airport. Queen Alia International Airport has the most critical role as it controls 81% of air traffic movement. For the period 2005-2009, on average, it serves more than 93 percent of the passengers coming to and leaving from Jordan, and 78 percent of the flights arriving and departing Jordan.
Regarding efficiency, the Jordanian Aviation market (Royal Jordanian only) increased its capacity utilization, captured by the passenger load factor PLF4, gradually and slowly. It rose from 69 percent in 2005 to 72 percent in 2008; but it went down to 68% in 2009 due to the effects of the global financial crisis as well as Royal Jordanian not scaling back its number of flights during 2009 even though the number of passengers had decreased. In conclusion, RJ saw a growing trend in the number of passengers throughout the period under study except for 2009, where the number of passengers decreased by 1%. An important point to be raised here is that even though the number of passengers decreased in 2009, the number of flights departed was increased by RJ as part of its overall strategy in solidly positioning itself as the carrier of choice for the MENA region by introducing new routes and increasing the frequency of existing regional routes. It determined on doing this in 2009 because of the need to expand before it lost its exclusivity agreement. Moreover, in all years under study, RJ made a profit except for the year 2008 where oil reached a record price, which translated into a very high fuel expense. However, it should be noted that the effects of hedging conducted by RJ are not taken into account in the analysis. 3.2 The Jordanian Airlines Industry – Royal Jordanian The focus in this section is on the economic performance of the Jordanian airline industry. Since Royal Jordanian is the incumbent carrier in the Jordanian airline market, dominating the scheduled domestic and international air traffic movement, our analysis will only focus on it. Royal Jordanian’s number of passengers witnessed an upward trend since 2004/05 till 2008/09 with the minimal decrease in 2008/09.It also had a positive growth rate of passengers, between 2004 and 2008, and a negative growth rate between 2008 and 2009 (Figure 3). The rate of growth decreased significantly from 14 percent in 2008 to 1 percent in 2009. In this context, we should refer to the impact of the global financial crisis on the air transport industry in general, being one of the most important service industries in the world. Demand on travel declined as well as revenues of the airlines, according to the initial estimates of the 4This measures how much of an airline's passenger carrying capacity is used; it is calculated as the total passengers kilometer to total available seats kilometer
10
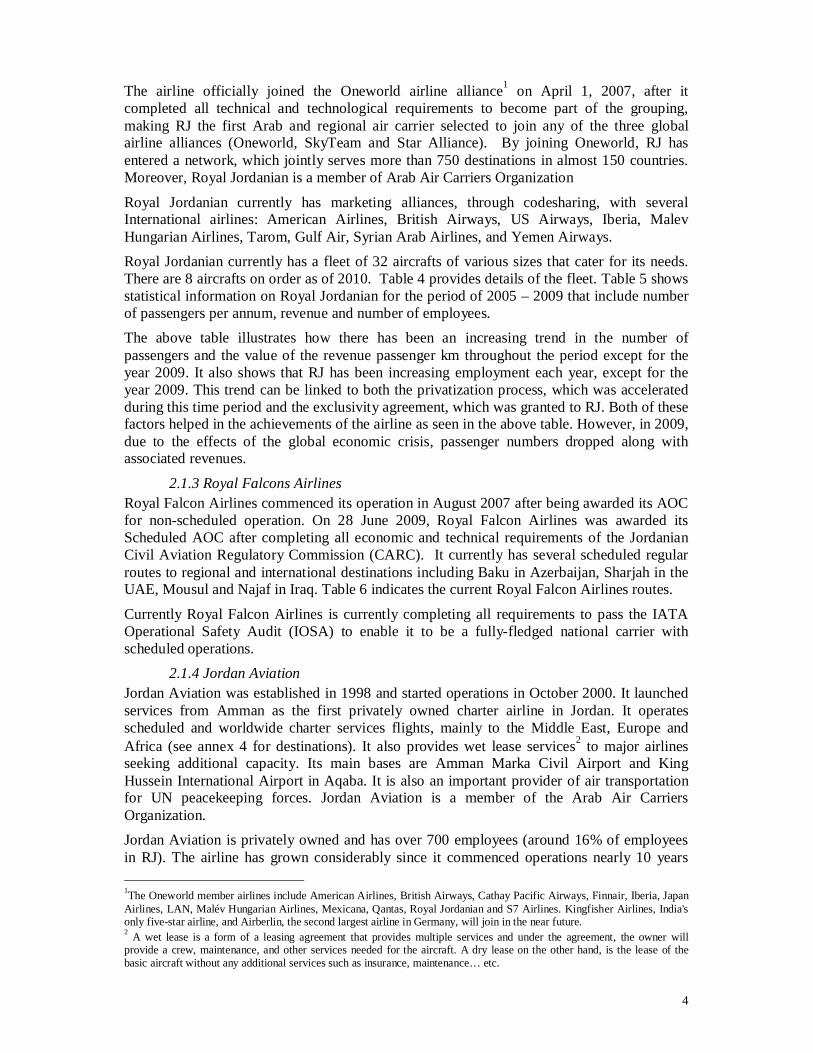
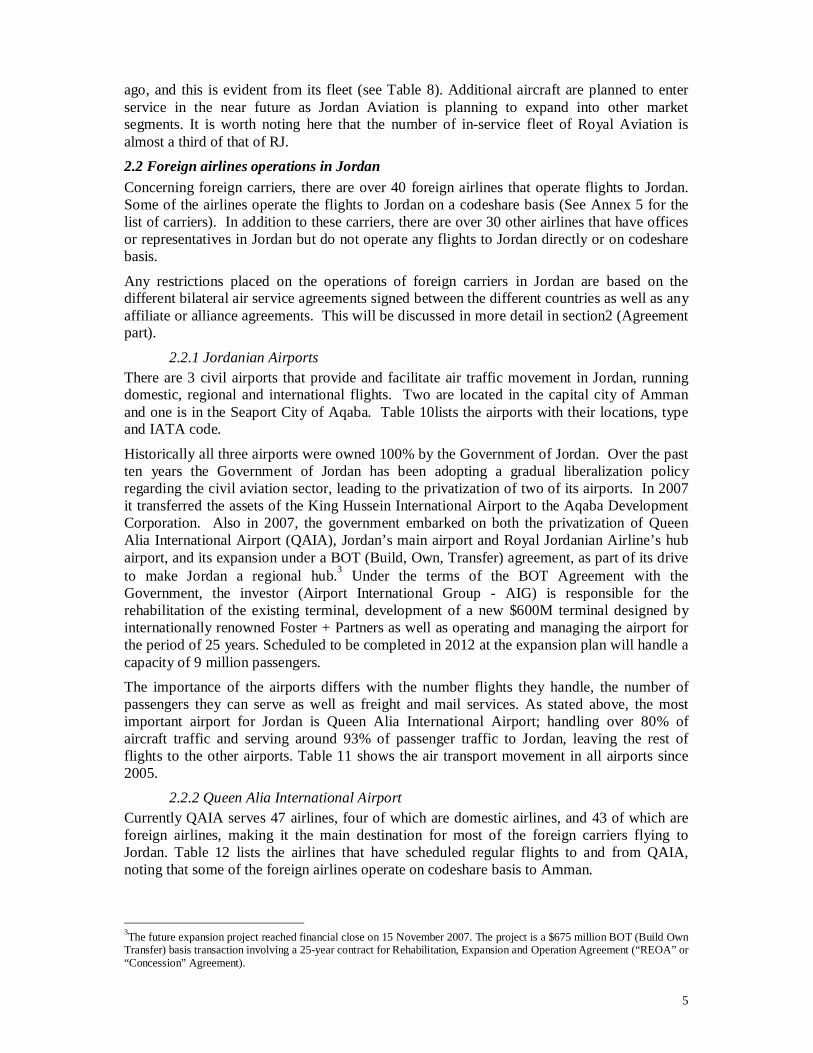
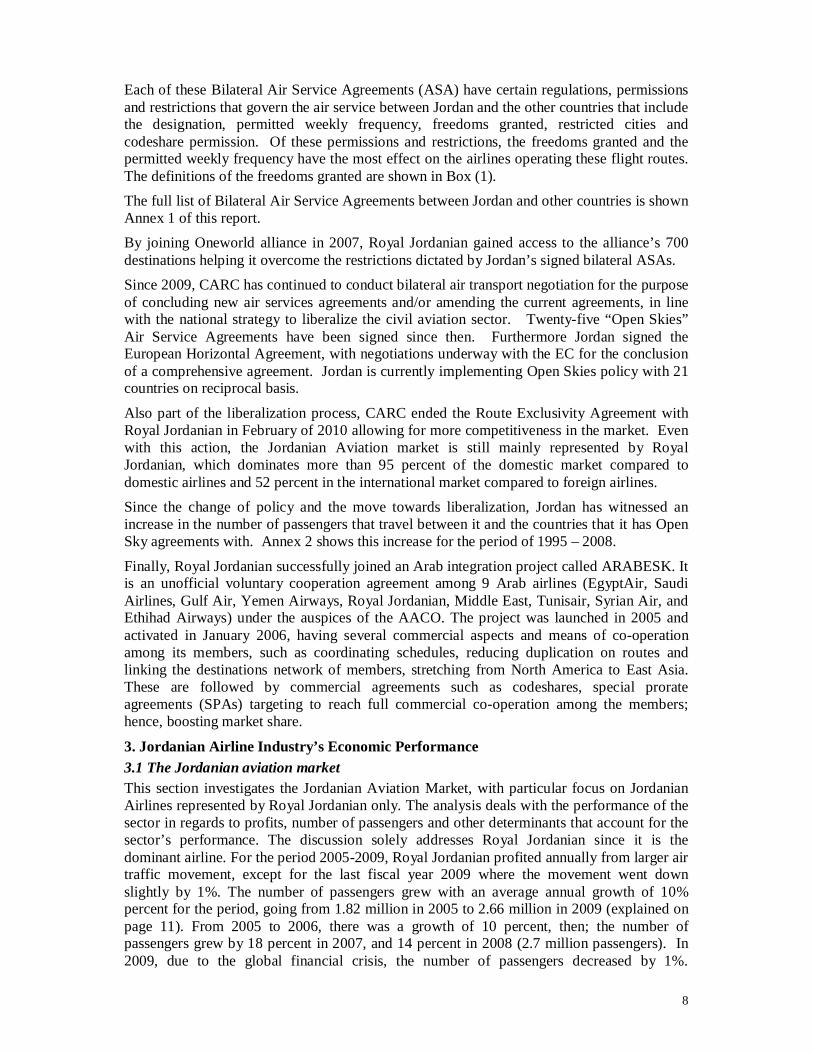
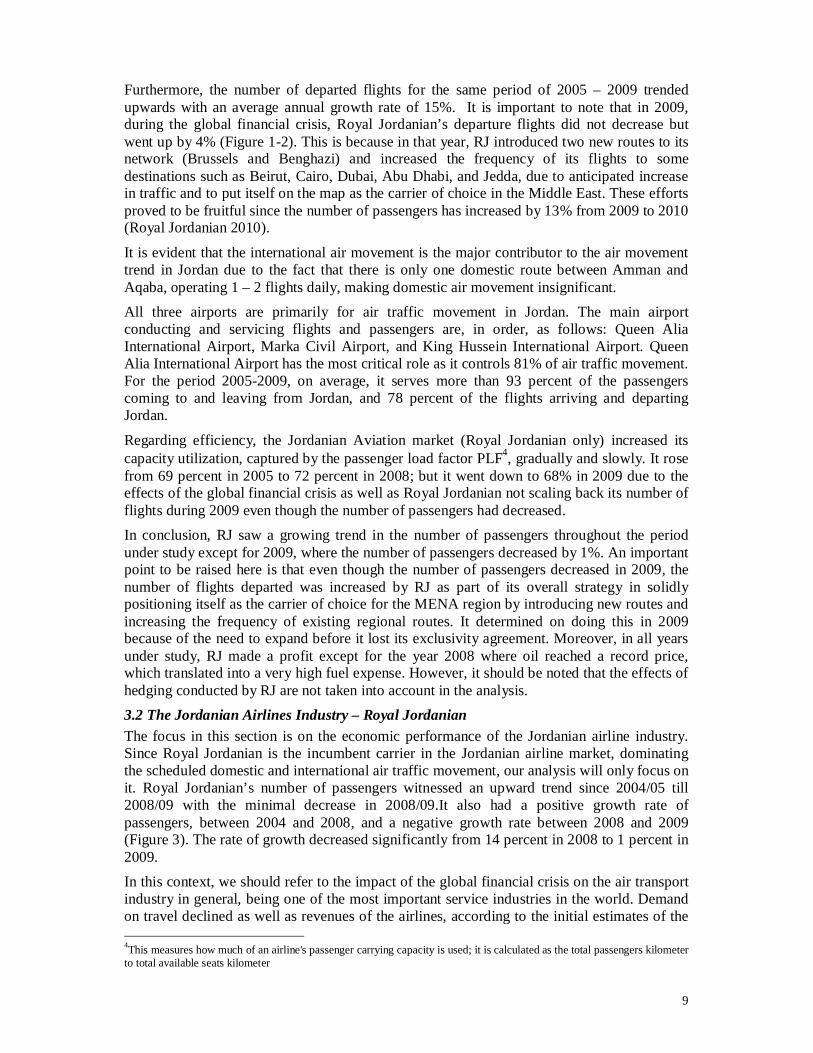
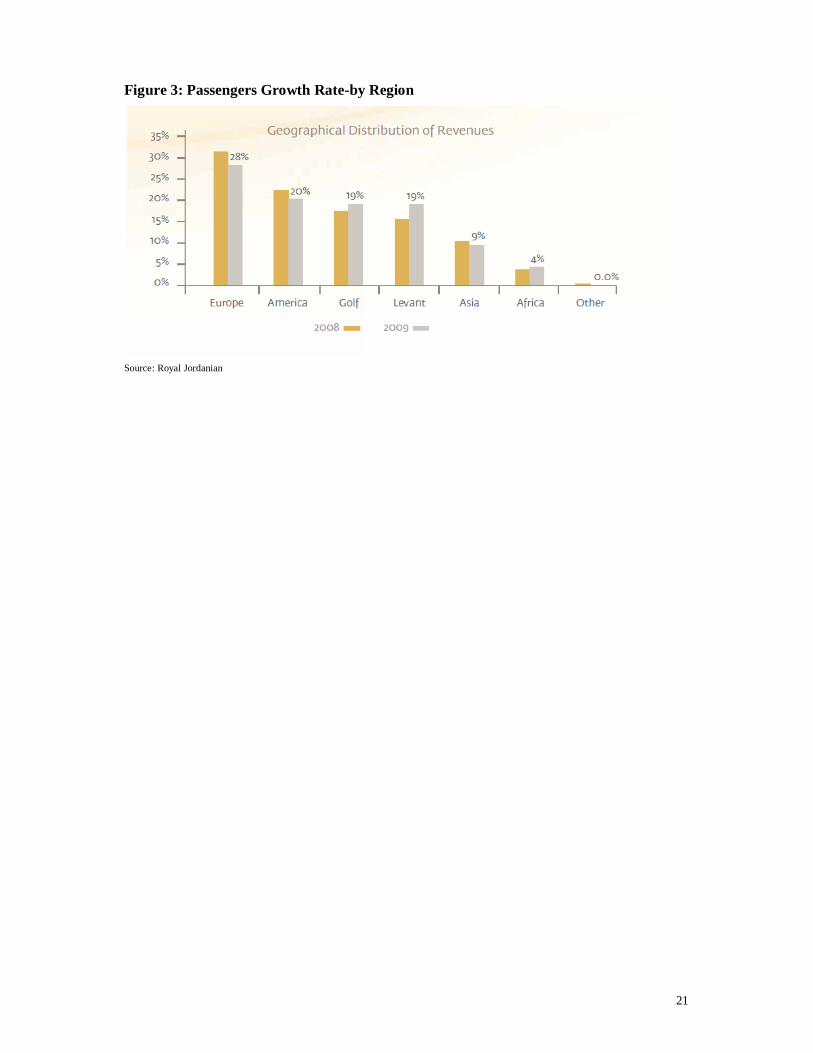
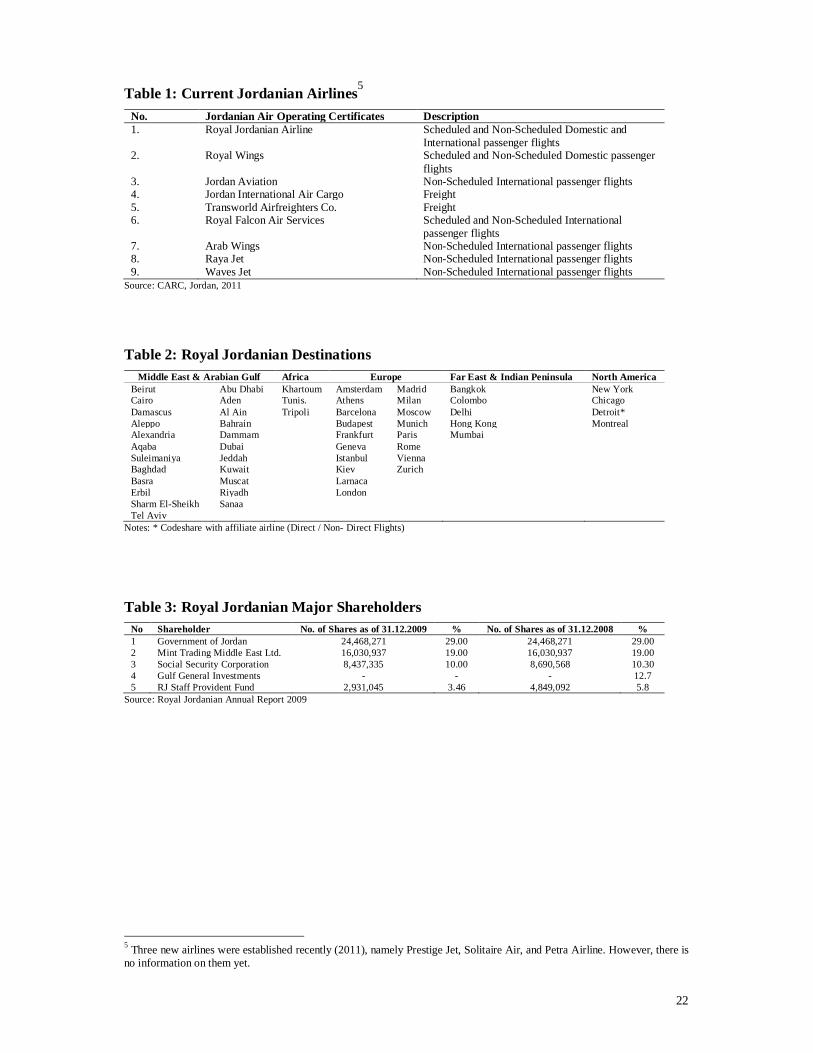
International Air Transport Association (IATA), decreased by about USD80 billion. Net losses were estimated at around USD11 billion. In regards to Royal Jordanian, the decline in passenger and cargo volumes led to a decline in the company's revenues of 14.5% as a result of 13% drop in average passenger yield caused partially by the reduction in fuel surcharge which followed the drop in fuel prices worldwide. In addition, ticket prices decreased because of the high competition among airlines regionally and internationally, and the emergence of low cost carriers in the Middle East and the Gulf Area. On the other hand the Royal Jordanian's operational expenses went down by 19.1% as a result of the drop in the operational costs attributed mainly to a 47% drop in its fuel bill. Accordingly, the company achieved a net profit of about JD28.6million in 2009 against a net loss of JD24.6million in 2008 (due to very high fuel costs), at a time when most world airlines had significant losses (Figure 2). Another important question to be answered is: to what destinations are the Royal Jordanian passengers traveling? This question is important, as the answer will indicate the geographical distribution of passenger revenues and profitable destinations for the airline. Looking at Royal Jordanian’s case, the geographical distribution of regular revenues shows that Europe constituted 28% of the revenues, the highest among the regions, followed by America with 21%. Arabian Gulf, Levant and Africa formed 19%, 18% and 4% respectively. Having said this, the drop in revenue from the European and American sectors was the highest between 2008 and 2009. European and American revenues went down by 21% each. This drop in revenue was due to the global financial crisis, which affected these two continents more than anywhere else. The passenger traffic in the Levant region grew by 4% over the previous year despite the global financial crisis.
All of the above shows that Royal Jordanian is performing well in the market and has shown sustainable growth for the period 2005 – 2009, notwithstanding the effects of the global financial crisis. First, its number of passengers witnesses an upward trend, with the minimal decrease in 2009. Second, it was able to achieve a significant net profit in 2009 when most of the world’s airlines were experiencing losses. Third, during time of economic stability, on average, the highest passengers’ growth rate was in the Europe, America and the Far and Middle East respectively. But in time of erratic negative events, the best performing destinations were in the Middle East. This suggests more efforts should be devoted to expanding its network regionally in the Middle East by enforcing bilateral/multilateral agreements.
4. The Economic Framework This section first introduces the framework and model to be used for the economic analysis and then continues to discuss the measure of openness that is incorporated in the model. Furthermore, an econometric analysis is conducted to inform the discussion and come up with findings based on evidence. Finally, a simulation analysis is conducted to predict the impact of further liberalization. Market structure conduct and performance (SCP) framework was derived from the neoclassical analysis of markets. The SCP paradigm was the brainchild of the Harvard school of thought and popularized during 1940-1960 with its empirical work involving the identification of correlations between industry structure and performance. The structure, conduct and performance hypothesis states that the degree of market concentration is inversely related to the degree of competition. This is because market concentration encourages firms to collude. More specifically, the standard SCP paradigm asserts that there is a direct relationship between the degree of market concentration and the degree of competition among firms.
11
Accordingly, the analysis in this paper will be based on SCP framework, which implies that the structure of an industry determines firms’ conduct, and hence determines firms’ performance.
The framework was first introduced by Bain (1951) and has been much debated subsequently. Bain’s (1951) seminal paper was based on the analysis of the performance of US firms in 42 industries in the latter half of the 1930’s. He found that the rates of return of firms in the relatively more concentrated industries significantly exceeded those of in the relatively dispersed industries. He interpreted this result as evidence for the SCP paradigm. Demsetz (1973) suggested an alternative explanation for the abnormal performance identified by Bain (1951). His argument was that the abnormal profits observed reflected the higher level of efficiency of firms, not the presence of collusive behaviour and pricing.
Another questioning of the SCP framework concerned the nature of the causal links between the 3 components. The original SCP framework states that the structure of an industry determines firms’ conduct, which, in turn, determines performance. However, the literature suggests that the direction of causality might run in other directions than the simple S-C-P. Subsequent development in industrial organization shows that the performance may allow the firm to affect market structure through mergers, acquisitions and other forms of concentration. This is well illustrated by the US airline market. 4.1 The Model To illustrate the conceptual framework of the study, we consider the following simple model. There are 3 distinct countries (cities) indexed by the set of capital letters (A, B, C). Each country is linked by a single hub-city, denoted by the same letter at its country. Individuals living in each country wish to travel to other cities, and all travels are supposed to be round-trips.
The historical framework for airline traffic (before liberalization) has been a duopoly by route. In such framework, each incumbent carrier (i.e. Airline AA for county A) uses A as its hub to operate the whole network. The consumer from A can choose AA or AB for a travel (A-B). Due to the duopoly situation, the consumer is indifferent between the two except if there is a real difference in the quality of services. However, even in the historical framework the consumer from A had potentially a third choice (A-C, C-B) and it happened that (A-C, C-B) is preferred to (A-B). Denoting airline AA fares for (A-B) as FA-AB and abstracting from the quality of services, this means that FAAB > FCAC + FCCB. However, such a third choice was relatively rare. With the possibility of signing airlines agreements (e.g. alliances, OSA etc.) the third choice became much more likely. This is because the agreement could affect, in particular, FA-AB, FC-AC and FC-CB. Actually, one can even imagine a new fare denoted FC-AB, going from A to be B using carrier AC, which is lower than FC-AC + FC-CB. To accurately take account of such complex interactions, the analysis cannot be limited to the carriers and the country levels but should take account of the route level too. Moreover, the demand for air travel depends upon fares but also on frequencies and other service attributes such as the level and quality of air and airports services delivered. Airline agreements might also have an effect on these factors. Hence, even without a change in fares, agreements may change consumers’ preference for a given carrier. The final outcome depends on the type of agreement, consumers' utility and the strategic interactions between the various actors (carriers, airports and governments). From the above discussion, it follows that passengers coming to Jordan will have different choices. Some will take direct flights, others will take indirect flights and for the same
itinerary some will travel with RJ while others will prefer another carrier (regular or low cost). To model such diversity in consumers’ choice, it is now practice in economics to use the Dixit-Stiglitz model. The model considers a representative consumer faced with a variety of products and who chooses the basket (composed of each variety), which maximizes his/her utility. The representative consumer’s decision is, actually, reflecting the choice of the whole set of passengers to Jordan.
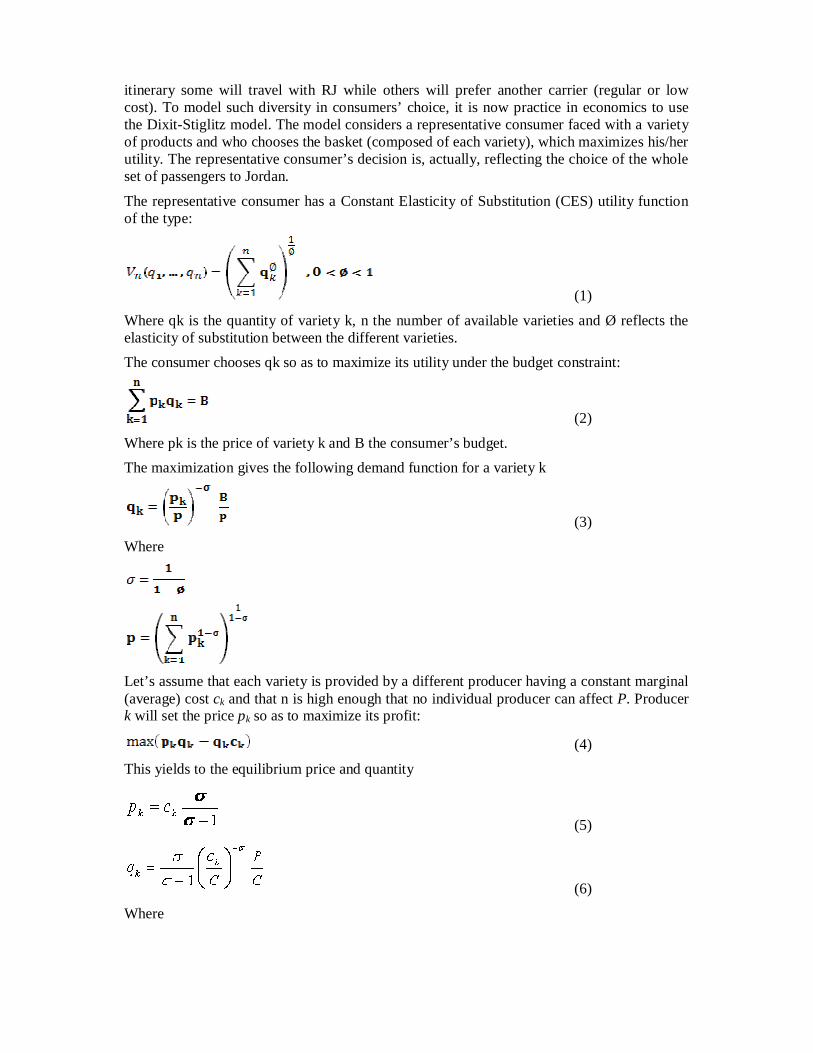
The representative consumer has a Constant Elasticity of Substitution (CES) utility function of the type:
(1)
Where qk is the quantity of variety k, n the number of available varieties and Ø reflects the elasticity of substitution between the different varieties. The consumer chooses qk so as to maximize its utility under the budget constraint:
(2)
Where pk is the price of variety k and B the consumer’s budget. The maximization gives the following demand function for a variety k
(3) Where
Let’s assume that each variety is provided by a different producer having a constant marginal (average) cost ck and that n is high enough that no individual producer can affect P. Producer k will set the price pk so as to maximize its profit:
(4) This yields to the equilibrium price and quantity
(5)
(6)
Where
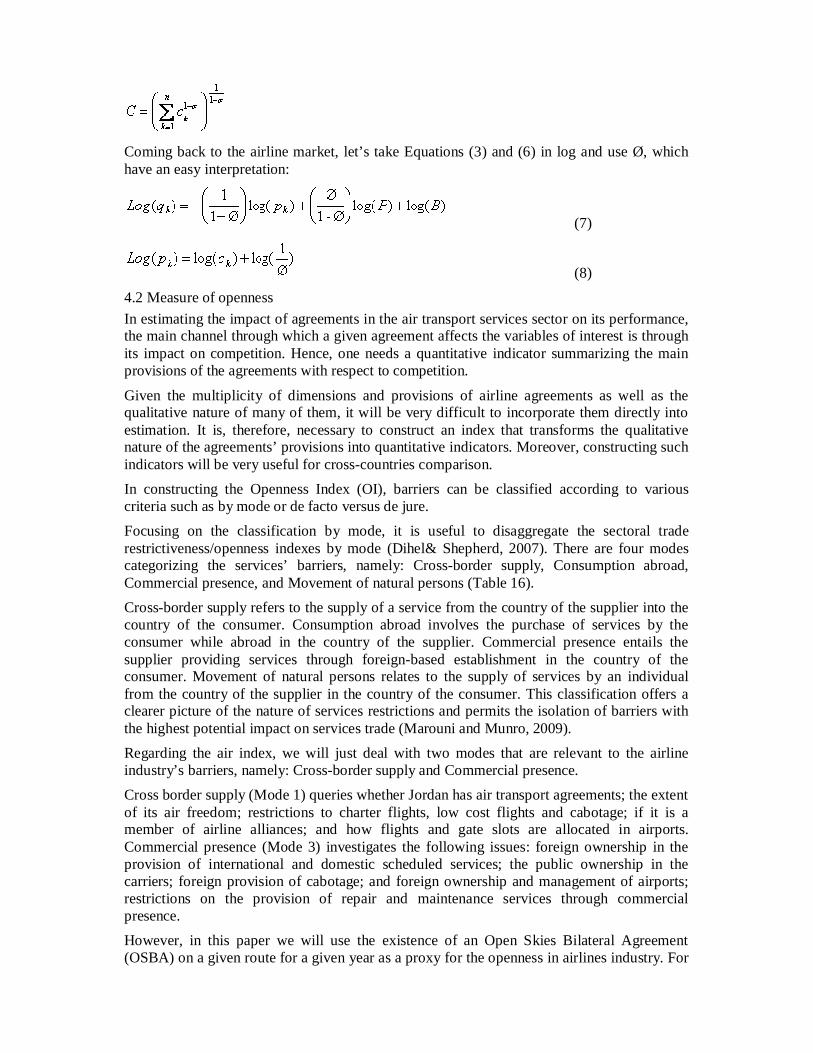
Coming back to the airline market, let’s take Equations (3) and (6) in log and use Ø, which have an easy interpretation:
(7)
(8) 4.2 Measure of openness In estimating the impact of agreements in the air transport services sector on its performance, the main channel through which a given agreement affects the variables of interest is through its impact on competition. Hence, one needs a quantitative indicator summarizing the main provisions of the agreements with respect to competition.
Given the multiplicity of dimensions and provisions of airline agreements as well as the qualitative nature of many of them, it will be very difficult to incorporate them directly into estimation. It is, therefore, necessary to construct an index that transforms the qualitative nature of the agreements’ provisions into quantitative indicators. Moreover, constructing such indicators will be very useful for cross-countries comparison. In constructing the Openness Index (OI), barriers can be classified according to various criteria such as by mode or de facto versus de jure. Focusing on the classification by mode, it is useful to disaggregate the sectoral trade restrictiveness/openness indexes by mode (Dihel& Shepherd, 2007). There are four modes categorizing the services’ barriers, namely: Cross-border supply, Consumption abroad, Commercial presence, and Movement of natural persons (Table 16). Cross-border supply refers to the supply of a service from the country of the supplier into the country of the consumer. Consumption abroad involves the purchase of services by the consumer while abroad in the country of the supplier. Commercial presence entails the supplier providing services through foreign-based establishment in the country of the consumer. Movement of natural persons relates to the supply of services by an individual from the country of the supplier in the country of the consumer. This classification offers a clearer picture of the nature of services restrictions and permits the isolation of barriers with the highest potential impact on services trade (Marouni and Munro, 2009). Regarding the air index, we will just deal with two modes that are relevant to the airline industry’s barriers, namely: Cross-border supply and Commercial presence. Cross border supply (Mode 1) queries whether Jordan has air transport agreements; the extent of its air freedom; restrictions to charter flights, low cost flights and cabotage; if it is a member of airline alliances; and how flights and gate slots are allocated in airports. Commercial presence (Mode 3) investigates the following issues: foreign ownership in the provision of international and domestic scheduled services; the public ownership in the carriers; foreign provision of cabotage; and foreign ownership and management of airports; restrictions on the provision of repair and maintenance services through commercial presence. However, in this paper we will use the existence of an Open Skies Bilateral Agreement (OSBA) on a given route for a given year as a proxy for the openness in airlines industry. For
14
the open skies bilateral agreements, routes with no agreements take a dummy of 0, for a non- enforced agreement take 1, while the enforced agreement take 2.
5. The Results 5.1 Openness index results The OI’s coefficient is statistically not significant in both passengers and fares equations. Given that Openness was measured by one variable only (Open Skies- Bilateral Agreements), the insignificancy of OI may be interpreted by the fact that Royal Jordanian has full dominance of the market in Jordan and has the largest market share. It was established in 1963 and it has a fleet of 32 aircrafts of various sizes and covers a network of 58 destinations on four continents. All these characteristics make Royal Jordanian the first airline company in Jordan. Accordingly, the impact of Open Skies- Bilateral Agreements in the air transport sector on competition, and thus on the performance, will be minimal. 5.2 Econometric results
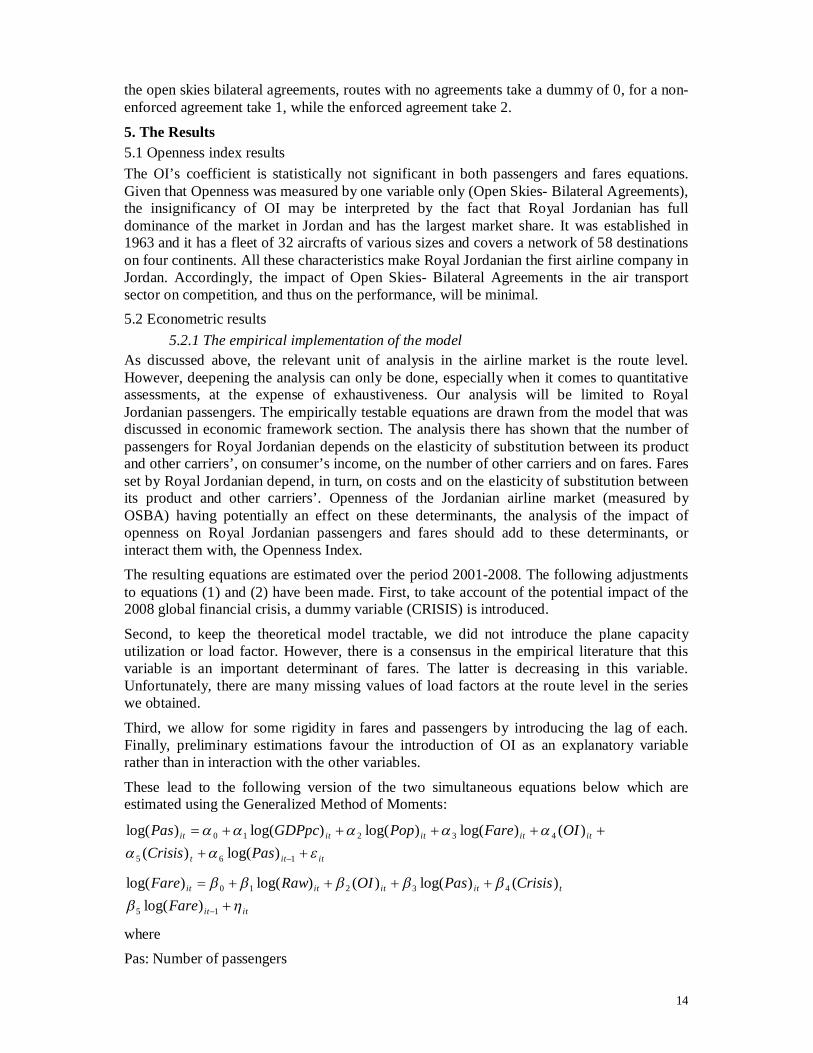
5.2.1 The empirical implementation of the model As discussed above, the relevant unit of analysis in the airline market is the route level. However, deepening the analysis can only be done, especially when it comes to quantitative assessments, at the expense of exhaustiveness. Our analysis will be limited to Royal Jordanian passengers. The empirically testable equations are drawn from the model that was discussed in economic framework section. The analysis there has shown that the number of passengers for Royal Jordanian depends on the elasticity of substitution between its product and other carriers’, on consumer’s income, on the number of other carriers and on fares. Fares set by Royal Jordanian depend, in turn, on costs and on the elasticity of substitution between its product and other carriers’. Openness of the Jordanian airline market (measured by OSBA) having potentially an effect on these determinants, the analysis of the impact of openness on Royal Jordanian passengers and fares should add to these determinants, or interact them with, the Openness Index. The resulting equations are estimated over the period 2001-2008. The following adjustments to equations (1) and (2) have been made. First, to take account of the potential impact of the 2008 global financial crisis, a dummy variable (CRISIS) is introduced.
Second, to keep the theoretical model tractable, we did not introduce the plane capacity utilization or load factor. However, there is a consensus in the empirical literature that this variable is an important determinant of fares. The latter is decreasing in this variable. Unfortunately, there are many missing values of load factors at the route level in the series we obtained.
Third, we allow for some rigidity in fares and passengers by introducing the lag of each. Finally, preliminary estimations favour the introduction of OI as an explanatory variable rather than in interaction with the other variables.
These lead to the following version of the two simultaneous equations below which are estimated using the Generalized Method of Moments:
ititt
ititititit
PasCrisisOIFarePopGDPpcPas
165
43210
)log()()()log()log()log()log(
itit
titititit
FareCrisisPasOIRawFare
15
43210
)log()()log()()log()log(
where Pas: Number of passengers
15
Fare: Air Fares
Pop: Total population in the spaces linked by the route GDPpc: Total GDP per capita in the spaces linked by the route
OI: Openness Index
Raw: Costs of Raw materials computed as explained below
Crisis: Dummy for the financial crisis. It takes 1 in 2007 and 0 otherwise i , t: Route and year respectively.
ε,μ: Error terms From the above discussion and Section V, the expected signs of the coefficients of interest are:
0,0,0,0 4321
and
0,0,0 321
5.3 The data International Civil Aviation Organization (ICAO) provides the number of passengers for the period 1999-2009. Data on airfares per route come from International Airline Industry Association (IATA). They represent the average fare per seat without any information on classes; discount or other loyalty rebates. It is important to keep in mind that defined this way; the fare already includes the distance. Since they are available annually (2001-2008), the effect of seasons is not an issue. Finally, the total number of Air Jordanian routes that are included in the analysis totalled15. 5.4 Estimation results We estimate 6 sets of results: 3 for the passengers’ equation and 3 for fares. Each 3 sets give: first, the OLS results using the reduced form (only exogenous variables as explanatory) of each equation; second, the 2SLS results of the system; and third, the GMM results of the system. In both the 2SLS and the GMM, exogenous variables and lagged dependent variables are used as instruments.
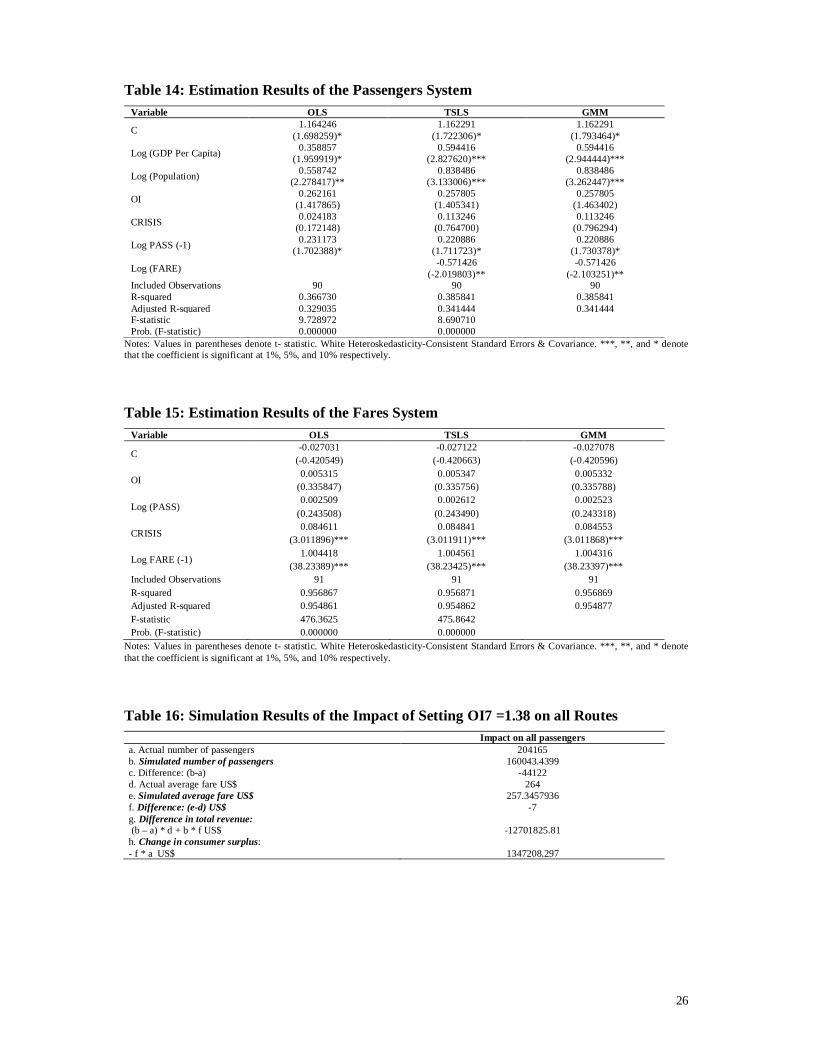
According to table (17), the overall quality of the fit is relatively good (the adjusted R2 is between 0.33 and 0.34). The coefficients of GDP per capita, population, the lagged value of passengers, and fare are significant (at 10 percent or higher) and exhibit the expected sign. The coefficients of lagged dependent variable are highly significant, supporting the introduction of these variables among the explanatory. The system estimations (2SLS and GMM) exhibit similar patterns for the coefficients.
Focusing on the GMM results, the variables of interest are significant with the expected sign. The 2008 global financial crisis did not affect the number of travelling passengers by Royal Jordanian airline, keeping other factors constant. In addition, the coefficient of fare signifies that when fares rise by 1 percent, the number of passengers decline by about 0.6 percent, keeping other factors constant. This result is quite predictable by the law of demand. The rise in airfares makes flights more expensive for people, reducing their purchase of flights tickets and hence decreasing the number of passengers. The OI’s coefficient is statistically not significant, indicating that the liberalization of the aviation market doesn't affect the number of passengers in Jordan.
16
Table (18) reveals the estimation results of fares equation. According to this table, we can note that the overall quality of the fit is very good (the adjusted R2 is around 0.96). The coefficients of crisis and the lagged value of fares are statistically significant with the expected sign. The global financial crisis coefficient is statistically significant at the 1 percent level with a positive sign, indicating that the crisis led airfares in Jordan to rise. The coefficient of the lagged value of fares is significant and positive indicating that airfares in Jordan follow an upwardly trend overtime. The OI coefficient is not significant meaning that the liberalization does not affect airfares in Jordan. 5.5 The impact of further liberalization The previous section examines the relationship between the structure of the airline market and the number of passengers and fares to and from Jordan, taking the structure as given. In the present section, we will examine the impact of further liberalization (changing the structure) on these variables as well as on the welfare in Jordan. Welfare is composed of consumers’ and firms’ surpluses. The impact on consumers’ surplus is, in general, captured by combining the impacts of output and prices, while firms’ surplus is measured by profits. Hence our intermediate variables of interest are output, prices and profits.
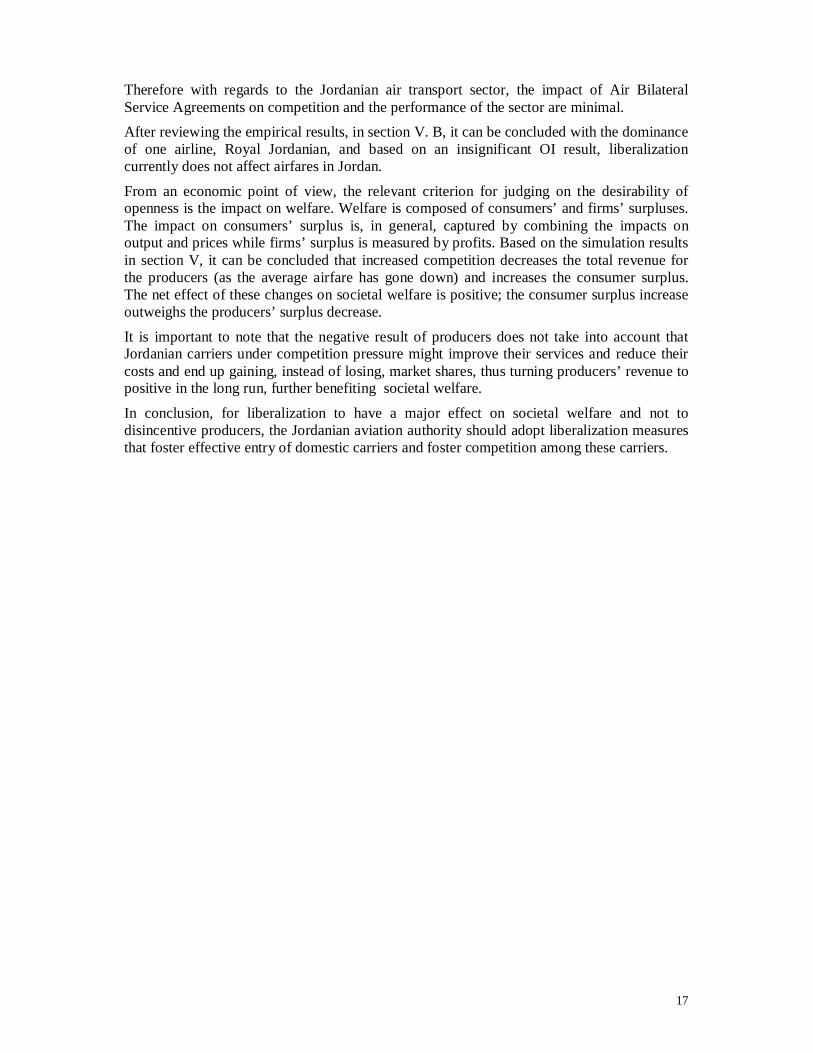
For examining the impact of less restricted aviation environment on the producer, consumer and societal welfare, we use the reduced form of the structural system together with the estimated parameters ( kkand ˆˆ ) and the exogenous variables. The reduced form equations are the following:
23
1
33ˆˆˆ1
1ijij ZZ
ij ePas
(8a)
13
2
33
ˆˆˆ1
1ijij ZZ
ij eFare
(8b)
where
16542101 )log(ˆˆˆ)log(ˆ)log(ˆˆ ittitititit PasCrisisOIPopGDPpcZ
1542102 )log(ˆˆˆ)log(ˆˆ
ittititit FareCrisisOIRawZ
Table 19 shows the results of the scenario where OI7 =1.38 on all routes. As a consequence of increased competition, the number of passengers decreases, as does the average airfare.
We can observe from Table 20 that the total revenue of producers will decrease, while the consumer surplus will increase. The net effect of producer and consumer surplus changes on societal welfare is positive; the consumer surplus increase outweighs the producers’ surplus decrease.
6. Conclusion The past two decades have witnessed vivid changes in the air transport services sector. These changes started in developed countries, where liberalization of the sector was initiated, in turn having a drastic effect on the global air transport services sector. This study examined the Jordanian airline market performance and the link with liberalization.
As shown in the results section, the Openness Index results are statically insignificant in both passenger and fares equations, given that the Openness was measured by one variable only (the Air Bilateral Service Agreement). This insignificance is also interpreted by the fact Royal Jordanian has full dominance of the market, having the largest market share.
17
Therefore with regards to the Jordanian air transport sector, the impact of Air Bilateral Service Agreements on competition and the performance of the sector are minimal. After reviewing the empirical results, in section V. B, it can be concluded with the dominance of one airline, Royal Jordanian, and based on an insignificant OI result, liberalization currently does not affect airfares in Jordan.
From an economic point of view, the relevant criterion for judging on the desirability of openness is the impact on welfare. Welfare is composed of consumers’ and firms’ surpluses. The impact on consumers’ surplus is, in general, captured by combining the impacts on output and prices while firms’ surplus is measured by profits. Based on the simulation results in section V, it can be concluded that increased competition decreases the total revenue for the producers (as the average airfare has gone down) and increases the consumer surplus. The net effect of these changes on societal welfare is positive; the consumer surplus increase outweighs the producers’ surplus decrease.
It is important to note that the negative result of producers does not take into account that Jordanian carriers under competition pressure might improve their services and reduce their costs and end up gaining, instead of losing, market shares, thus turning producers’ revenue to positive in the long run, further benefiting societal welfare.
In conclusion, for liberalization to have a major effect on societal welfare and not to disincentive producers, the Jordanian aviation authority should adopt liberalization measures that foster effective entry of domestic carriers and foster competition among these carriers.
18
References Albers S., B. Kochb and Ch. Ruff. 2005. “Strategic alliances between airlines and airports
theoretical assessment and practical evidence”, Journal of Air Transport Management, 11: 49–58
Bain, J. S. 1951. “Relation of Profit to Industry Concentration: American Manufacturing 1936-1940.” Quarterly Journal of Economics, 65(August): 293-324.
Brueckner, J.K. 2001. “The economics of international codesharing: an analysis of airline alliances”, International Journal of Industrial Organization 19, 1475–1498.
Brueckner, J.K. 2003a. “International airfares in the age of alliances: the effects of codesharing and antitrust immunity”, Review of Economics and Statistics, 85 (1): 105-118.
Brueckner, J.K. 2003b. “The benefits of codesharing and antitrust immunity for international passengers, with an application to the Star alliance”, Journal of Air Transport Management, 9: 83–89.
Demsetz, H. 1973. “Industrial structure, market rivalry and public policy”, Journal of Law and Economics, 16: 1-9.
Dihel, N. and B. Shepherd. 2007. Modal estimates of services barriers. OECD Trade Policy Working Papers, No. 51 .
Marouni M.A. and L. Munro. 2009. “Assessing barriers to trade in services in the MENA Region” Economic Research Forum, Working Paper no. 496
Micco A. and T. Serebrisky. 2006. “Competition regimes and air transport costs: The effects of open skies agreements”, Journal of International Economics, 70: 25– 51
Oum, T.H., J.H. Park and A. Zhang. 2000. Globalization and Strategic alliances: the case of the airline industry. Oxford, Pergamon Press, 252 pp.

19
Box 1: Freedoms Definitions Third freedom
The right of an airline of one country to carry traffic (passenger, cargo, mail) from its country to another country.
Fourth freedom
The right of an airline of one country to carry traffic (passenger, cargo, mail) from its country to another country.
Fifth freedom
The right of an airline of one country to carry traffic between two other countries providing the flight originates and terminates in its own country.
Sixth freedom
The right of an airline of one country to carry traffic between two other countries via its own country.
Seventh freedom
The right of an airline of one country to carry traffic between two other countries without the flight originating or terminating in its own country.
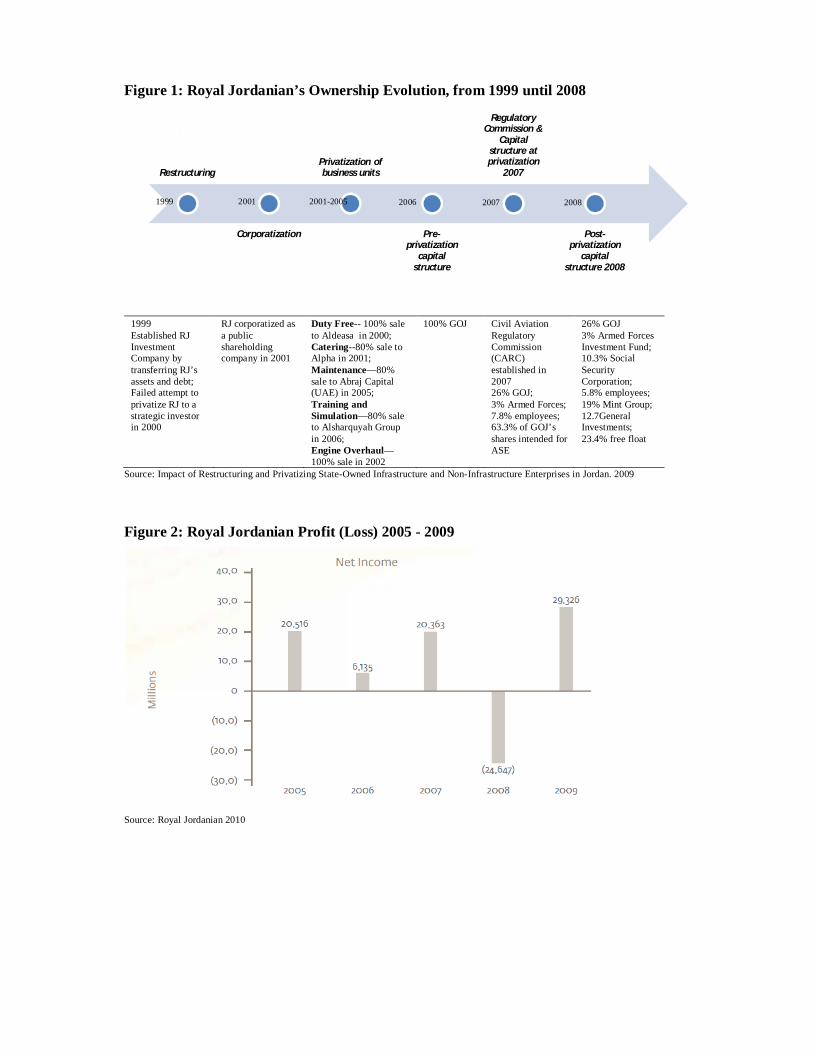
Figure 1: Royal Jordanian’s Ownership Evolution, from 1999 until 2008
1999 Established RJ Investment Company by transferring RJ’s assets and debt; Failed attempt to privatize RJ to a strategic investor in 2000
RJ corporatized as a public shareholding company in 2001
Duty Free-- 100% sale to Aldeasa in 2000; Catering--80% sale to Alpha in 2001; Maintenance—80% sale to Abraj Capital (UAE) in 2005; Training and Simulation—80% sale to Alsharquyah Group in 2006; Engine Overhaul—100% sale in 2002
100% GOJ Civil Aviation Regulatory Commission (CARC) established in 2007 26% GOJ; 3% Armed Forces; 7.8% employees; 63.3% of GOJ’s shares intended for ASE
26% GOJ 3% Armed Forces Investment Fund; 10.3% Social Security Corporation; 5.8% employees; 19% Mint Group; 12.7General Investments; 23.4% free float
Source: Impact of Restructuring and Privatizing State-Owned Infrastructure and Non-Infrastructure Enterprises in Jordan. 2009
Figure 2: Royal Jordanian Profit (Loss) 2005 - 2009
Source: Royal Jordanian 2010
Restructuring
Corporatization
Privatization of business units
Pre-privatization
capital structure
Regulatory Commission &
Capital structure at privatization
2007
Post-privatization
capital structure 2008
2001
2001-2005 2006
2007
1999
2008
21
Figure 3: Passengers Growth Rate-by Region
Source: Royal Jordanian
22
Table 1: Current Jordanian Airlines5 No. Jordanian Air Operating Certificates Description 1. Royal Jordanian Airline Scheduled and Non-Scheduled Domestic and
International passenger flights 2. Royal Wings Scheduled and Non-Scheduled Domestic passenger
flights 3. Jordan Aviation Non-Scheduled International passenger flights 4. Jordan International Air Cargo Freight 5. Transworld Airfreighters Co. Freight 6. Royal Falcon Air Services Scheduled and Non-Scheduled International
passenger flights 7. Arab Wings Non-Scheduled International passenger flights 8. Raya Jet Non-Scheduled International passenger flights 9. Waves Jet Non-Scheduled International passenger flights
Source: CARC, Jordan, 2011
Table 2: Royal Jordanian Destinations Middle East & Arabian Gulf Africa Europe Far East & Indian Peninsula North America
Beirut Abu Dhabi Khartoum Amsterdam Madrid Bangkok New York Cairo Aden Tunis. Athens Milan Colombo Chicago Damascus Al Ain Tripoli Barcelona Moscow Delhi Detroit* Aleppo Bahrain Budapest Munich Hong Kong Montreal Alexandria Dammam Frankfurt Paris Mumbai Aqaba Dubai Geneva Rome Suleimaniya Jeddah Istanbul Vienna Baghdad Kuwait Kiev Zurich Basra Muscat Larnaca Erbil Riyadh London Sharm El-Sheikh Sanaa Tel Aviv
Notes: * Codeshare with affiliate airline (Direct / Non- Direct Flights)
Table 3: Royal Jordanian Major Shareholders No Shareholder No. of Shares as of 31.12.2009 % No. of Shares as of 31.12.2008 % 1 Government of Jordan 24,468,271 29.00 24,468,271 29.00 2 Mint Trading Middle East Ltd. 16,030,937 19.00 16,030,937 19.00 3 Social Security Corporation 8,437,335 10.00 8,690,568 10.30 4 Gulf General Investments - - - 12.7 5 RJ Staff Provident Fund 2,931,045 3.46 4,849,092 5.8
Source: Royal Jordanian Annual Report 2009
5 Three new airlines were established recently (2011), namely Prestige Jet, Solitaire Air, and Petra Airline. However, there is no information on them yet.
23
Table 4: Royal Jordanian’s Fleet Manufacturer Type In Service On Order Total Airbus A310 4
18
A319 4 A320 5 A321 4 A330 3
A340 4 Embracer 175 3 195 5 Total 32 18 50
Source: Centre for Asia Pacific Aviation &Ascend (August 2011)
Table 5: Royal Jordanian Traffic & Statistics6
2009 2008 2007 2006 2005 Period start 1 Jan 2009 1 Jan 2008 1 Jan 2007 1 Jan 2006 1 Jan 2005 Period end 31 Dec 2009 31 Dec 2008 31 Dec 2007 31 Dec 2006 31 Dec 2005 Passenger millions 2.670 2.700 2.370 2.000 1.810 Passenger load factor 68.17 % 72.04 % 70.65 % 66.39 % 69.4 % Revenue passenger km (mill) 6,772.63 7,380.10 6,553.80 5,573.80 5,503.89 Available seat km (mill) 9,933.78 10,244.00 9,276.20 8,394.76 7,930.67 Freight tonne km (mill) 141.45 194.70 176.00 204.10 228.48 Revenue tonne km (mill) 753.84 861.50 768.00 712.69 730.92 Total employees 4,399.00 4,507.00 4,257.00 3,799.00 3,297.00
Table 6: Royal Falcon Airlines Destinations Regional International Sharjah, UAE Baku, Azerbaijan Mousul, Iraq Stockholm, Sweden Najaf, Iraq Abu Dhabi, UAE Jeddah, KSA
Table 7: Jordan Aviation Fleet Manufacturer Type In Service On Order In Storage Wet Lease Total Airbus A310 – 200 1 1 A310 – 300 1 1 A320 – 200 1 1
Boeing 727 – 200 1 1 737 – 300 6 1 7 767 – 200 ER 2 1 3 Total 10 1 3 14
Source: CH-Aviation, 2010
6 Operating costs are not available.
24
Table 8: Jordanian Airports Airport Location Type IATA Code Queen Alia International Airport Amman Public AMM Amman / Marka Civil Airport Amman Public / Military ADJ King Hussein International Airport Aqaba Public AQJ
Source: CARC 2011
Table 9: Air Transport Movement at Jordanian Airports
Source: CARC Jordan
Table 10: Airline companies operating in Marka Airport Airline Destination Arab Wings AirTaxi Malta Air Charter Aqaba, MarsaAlam, Milan-Malpensa Royal Falcon Baku, Sharjah, Stockholm-Arlanda, Arbil, Najaf and Abu Dhabi Jordan International Air Cargo Destinations in the Middle East, Asia, Africa, and Europe
Source: CARC Jordan 2011
1999
2001
2001- 2005
2006
2007
2008
25
Table 11: Airline companies operating in King Hussein International Airport Airline Destination Arkefly Amsterdam Arkia Haifa, Tel Aviv AviaconZitotrans Yekaterinburg Jetairfly Brussels [seasonal] Jordan Aviation Alexandria, Amman, Bahrain, Doha, Dubai Neos Milan Petroleum Air Services Cairo, Hurghada, Sharm el-Sheikh Royal Jordanian Amman, Paris-Charles de Gaulle Royal Wings Airlines Amman, Tel Aviv Thomas Cooks Airlines Brussels, Sharm el-Sheikh [seasonal] Scandinavian Airlines Stockholm-Arlanda [seasonal], Copenhagen [seasonal]
Source: CARC Jordan 2011
Table 12: Royal Jordanian No. of Passengers Growth Rate Year No. of Passengers % of increase 2005 1821329 2006 2004599 10% 2007 2366459 18% 2008 2701000 14% 2009 2668590 -1% 2010 3022013 13%
Source: Royal Jordanian 2010
Table 13: Trade Barriers by mode Mode 1: Cross-border supply Refers to the supply of a service from the country of the supplier into
the country of the consumer. Mode 2: Consumption abroad Involves the purchase of services by the consumer while abroad in the
country of the supplier. Mode 3: Commercial presence Entails the supplier providing services through foreign-based
establishment in the country of the consumer Mode 4: Movement of natural persons Relates to the supply of services by an individual from the country of
the supplier in the country of the consumer Source: Marouni and Munro (2009).
26
Table 14: Estimation Results of the Passengers System Variable OLS TSLS GMM
C 1.164246 (1.698259)*
1.162291 (1.722306)*
1.162291 (1.793464)*
Log (GDP Per Capita) 0.358857 (1.959919)*
0.594416 (2.827620)***
0.594416 (2.944444)***
Log (Population) 0.558742 (2.278417)**
0.838486 (3.133006)***
0.838486 (3.262447)***
OI 0.262161 (1.417865)
0.257805 (1.405341)
0.257805 (1.463402)
CRISIS 0.024183 (0.172148)
0.113246 (0.764700)
0.113246 (0.796294)
Log PASS (-1) 0.231173 (1.702388)*
0.220886 (1.711723)*
0.220886 (1.730378)*
Log (FARE) -0.571426 (-2.019803)**
-0.571426 (-2.103251)**
Included Observations 90 90 90 R-squared 0.366730 0.385841 0.385841 Adjusted R-squared 0.329035 0.341444 0.341444 F-statistic 9.728972 8.690710 Prob. (F-statistic) 0.000000 0.000000
Notes: Values in parentheses denote t- statistic. White Heteroskedasticity-Consistent Standard Errors & Covariance. ***, **, and * denote that the coefficient is significant at 1%, 5%, and 10% respectively.
Table 15: Estimation Results of the Fares System Variable OLS TSLS GMM
C -0.027031
(-0.420549) -0.027122
(-0.420663) -0.027078
(-0.420596)
OI 0.005315 (0.335847)
0.005347 (0.335756)
0.005332 (0.335788)
Log (PASS) 0.002509
(0.243508) 0.002612
(0.243490) 0.002523
(0.243318)
CRISIS 0.084611
(3.011896)*** 0.084841
(3.011911)*** 0.084553
(3.011868)***
Log FARE (-1) 1.004418 (38.23389)***
1.004561 (38.23425)***
1.004316 (38.23397)***
Included Observations 91 91 91 R-squared 0.956867 0.956871 0.956869 Adjusted R-squared 0.954861 0.954862 0.954877 F-statistic 476.3625 475.8642 Prob. (F-statistic) 0.000000 0.000000
Notes: Values in parentheses denote t- statistic. White Heteroskedasticity-Consistent Standard Errors & Covariance. ***, **, and * denote that the coefficient is significant at 1%, 5%, and 10% respectively.
Table 16: Simulation Results of the Impact of Setting OI7 =1.38 on all Routes Impact on all passengers a. Actual number of passengers 204165 b. Simulated number of passengers 160043.4399 c. Difference: (b-a) -44122 d. Actual average fare US$ 264 e. Simulated average fare US$ 257.3457936 f. Difference: (e-d) US$ -7 g. Difference in total revenue: (b – a) * d + b * f US$ -12701825.81 h. Change in consumer surplus: - f * a US$ 1347208.297

27
Table 17: Simulation Results of the Impact of One Standard Deviation Improvement in the OI 7 over All Routes Impact on all passengers a. Actual number of passengers 204165 b. Simulated number of passengers 180388.3275 c. Difference: (b-a) -23777 d. Actual average fare US$ 264 e. Simulated average fare US$ 260 f. Difference: (e-d) US$ -4 g. Difference in total revenue: (b – a) * d + b * f US$ -6957485.942 h. Change in consumer surplus - f * a US$ 769995.4673
28
Annex 1: List of Bilateral Air Service Agreements between Jordan and other Countries
No. Country Signed/ Initialed Designation
Permitted Weekly
Frequency Utilized /
not Utilized Actual Frequency
/ Week Freedoms Granted
City Restrictions
Codeshare permitted
1 Algeria S. 1980 Multiple Open skies Yes AH – 1 3,4 Algeria 2 Afghanistan I. 1972 Single Not stated NO 3,4 Kabul
3 Armenia I. 1993 Multiple Airline Agreement NO 3,4
4 Austria S. 1976 Multiple 7 Yes RJ – 5 3,4 Vienna yes 5 Australia I. 1992 Multiple 2 NO 3,4,5 6 Azerbaijan I. 1993 Multiple Open skies Yes RZ – 1 3,4 yes
7 Bahrain S. 2000 Multiple Open skies Yes RJ – 4 GF – 5 2B – 3
3,4,5 Bahrain yes
8 Belgium S. 1960 Multiple Open skies NO 3,4 yes
9 Bosnia S. 2006 Multiple Airlines Agreement NO 3,4 yes
10 Brazil S. 1975 Single Not stated NO 3,4 Rio de
Janeiro Sao Paulo
yes
11 Brunei I. 1994 Multiple Airlines Agreement NO 3,4 Bandar Seri
Begawan
12 Bulgaria S. 2001 Multiple Airlines Agreement NO 3,4 Sofia yes
13 Canada I. 2007 Multiple
2- direct / or 4- with
intermediate points
Yes RJ – 2 3,4,5 Toronto / Montreal yes
14 Chile S. 1977 Multiple Airlines Agreement NO 3,4 Santiago
15 China I. 1992 Single 7 NO 3,4,5 Beijing
Shanghai Guangzhou
yes
16 Congo S. 2004 Multiple NO 3,4 To be specified
17 Cuba I. 1998 Multiple Airlines Agreement NO 3,4
18 Cyprus S. 1975 Single 4 Yes RJ – 4 CY – 4 3,4 Larnaca-
Paphos yes
19 Czech S.1997 Multiple Not stated NO 3,4 20 Denmark S. 1961 Multiple Not stated NO 3,4 Copenhagen
21 Egypt S. 1986 Multiple 2100 Seats
No restrictions on frequencies
Yes RJ MS 3,4
Cairo, Luxor Alexandria Sharm El Sheikh
yes
22 Finland S. 1978 Multiple Not stated NO 3,4,5 Helsinki
23 France S. 1966 Multiple 7 Yes RJ – 7 KLM / AF- 7 3,4 Paris + 1
other yes
24 Germany S. 1970 Multiple 7 -10 Tempo. Yes RJ – 8 LH / AC – 7 3,4 3 points yes
25 Greece S. 1968 Single
4 Summer / 3 Winter
7 Temporary till the end of S.
schedule
Yes RJ – 4 3,4 Athens
26 Hong Kong S. 2004 Multiple Open skies Yes RJ – 3 3,4,5 Hong Kong yes
27 India S. 1989 Multiple
14 per week, subject to the
condition that not more than (7)
services shall be operated to/from any one point of
call in India cargo –
unlimited frequency
Yes RJ -5 3,4
Calcutta, Delhi,
Mumbai, Amritsar
yes
28 Indonesia S. 1991 Multiple 4 in principal NO 3,4 Jakarta
29 Iran S. 1998 Single 2+1 cargo NO 3,4 No restrictions
30 Iraq S. 1953 Single Open skies Yes RJ- 24 IA - 7 3,4 No
restrictions
31 Ireland I. 1998 Multiple Not stated NO 3,4,5 No restrictions
29
Annex 1: Continued
No. Country Signed/ Initialed Designation
Permitted Weekly
Frequency
Utilized / not Utilized
Actual Frequency / Week
Freedoms Granted
City Restrictions
Codeshare permitted
32 Israel S.1996 Double 11 Winter / 12
Summer 800 Seats
Yes RJ - 14 IZ - 2 3,4 Tel Aviv,
Haifa
33 Italy S. 1980 Single 7,2 of which to city Milan Yes RJ -7 3,4,5
Rome + 1 city, cargo
Rome, Milan
34 Ivory Coast I. 1979 Single Not stated NO 3,4,5 Abidjan
35 Japan S. 1997 Multiple Units of capacity
basis 3 units
NO 3,4,5 Osaka
36 Korea S. 1978 Single Airlines Agreement NO 3,4 Seoul
37 Kuwait S. 1977 Multiple Open skies Yes RJ -7
Kw1 -6 J9 - 6
3,4 Kuwait
38 Lebanon I. 2006 Multiple Open skies Yes RJ - 21 MEA -7 3,4 Beirut
39 Libya S. 1978 Single 5 Yes RJ - 3 LN - 3 3,4 Tripoli,
Benghazi
40 Malaysia S. 1977 Single 3 NO 3,4,5 Kuala Lumpur yes
41 Malta I. 1999 Single Not stated NO 3,4,5 Malta
42 Mauritania S. 2000 Multiple Not stated NO 3,4 No restrictions
43 Luxemburg S. 1962 Multiple 7 Pax and Cargo
2 Cargo 5th freedom
Yes CLX - 2 3,4,5 Luxemburg yes
44 Moldova I. 1999 Multiple Airlines Agreement NO 3,4 No
restrictions
45 Morocco S. 2008 Multiple Open skies NO 3,4,5 Casablanca yes
46 Nepal I. 1999 Multiple Airlines Agreement NO 3,4 No
restrictions
47 Netherlands S. 1961 Multiple 7+7 cargo Yes RJ - 5 3,4,5 Amsterdam, Maastricht
cargo yes
48 Nigeria S. 1980 Single 1 NO 3,4 Lagos, Kano 49 Norway S. 1961 Multiple Not stated NO 3,4 Oslo
50 Oman S. 1974 Multiple Open skies Yes RJ -4 WY - 4 3,4,5 Muscat
51 Pakistan I. 2007 Multiple
12 - 3 of which with 5th
freedomcargo: open skies 3,4,5
NO 3,4,5 Karachi, Lahore yes
52 Palestine S. 1995 Multiple Open skies NO 3,4
53 Philippines S. 1996 Single 2 subject to commercial agreement
NO 3,4,5 Manila yes
54 Poland S. 1993 Multiple Airlines Agreement NO 3,4,5 Warsaw,
Krakow yes
55 Portugal I. 1989 Multiple Airlines Agreement NO 3,4,5 No
restrictions
56 Qatar S. 1974 Multiple 7 Yes RJ -4 QR - 7 3,4,5 Doha
57 Romania S. 1975 Multiple Airlines Agreement Yes RO - 3 3,4,5 Bucharest,
Timisoara
58 Russia I. 2006 Multiple 10 Pax - Cargo open skies Yes RJ - 3 3,4,5 Moscow, St.
Petersburg yes
59 Saudi Arabia S. 1963 Multiple Open skies Yes RJ - 19
SV -18 3,4 Jeddah, Riyadh,
Dammam
60 Senegal S. 1977 Single Not stated NO 3,4 Accra 61 Sierra Leone I. 1983 Multiple Not stated NO 3,4 Freetown 62 Singapore S. 1976 Single 2 NO 3,4,5 Singapore yes
63 Slovakia I. 1997 Multiple Open Skies NO 3,4,5 No restrictions
64 South Africa I. 1995 Multiple 2 Pax Cargo not stated NO 3,4
Johannesburg, Cape Town,
Durban
30
Annex 1: Continued
No. Country Signed/ Initialed Designation
Permitted Weekly
Frequency
Utilized / not Utilized
Actual Frequency / Week
Freedoms Granted
City Restrictions
Codeshare permitted
65 Spain S. 1977 Multiple Open Skies Yes RJ -7 3,4
Madrid, Barcelona,
not co-terminus
yes
66 Sri Lanka S. 1992 Multiple 7 - Cargo open Yes RJ -2 3,4 Colombo yes
67 Sudan I. 2004 Multiple 4 Pax - 3 Cargo Yes RJ - 4 SD - 2 3,4 Khartoum
68 Sweden S. 1961 Multiple Not stated NO 3,4 Stockholm, Gothenburg
69 Switzerland S. 2003 Multiple 4 Yes RJ -3 3,4
70 Syria S. 1976 Multiple Open skies Yes RJ -14 3,4 No restrictions
71 Taiwan S. 1975 Multiple 3 NO 3,4,5 Taipei
72 Thailand S. 1975 Multiple Open skies Yes RJ - 7 3,4,5 No restrictions yes
73 Tunisia S. 1976 Multiple Open skies Yes RJ -3 3,4 No restrictions yes
74 Turkey I.1973 Multiple
14 - Istanbul/Amman.
7 - Ankara/Amman Baku with 5th
Yes RJ -7 TK- 8 3,4,5 Istanbul -
Ankara
75 UAE S. 1998 Multiple Open skies Yes
RJ -19 G9 - 7
EY - 13 EK - 10
3,4,5 No restrictions yes
76 UK I. 1995 Multiple
10 - London/Amman
other - open skies
Yes RJ - 7 BMI -10 3,4 Any UK yes
77 USA S. 1996 Multiple Open skies Yes US / RJ -10 DL - 4 Open skies None yes
78 Ukraine S. 2005 Multiple 3 Yes RJ - 2 UM - 2 3,4,5 Kiev -
Donetsk yes
79 Uruguay I. 1977 Multiple Not stated NO 3,4,5 Montevideo
80 Uzbekistan S. 1996 Single Airlines Agreement NO 3,4 No
restrictions
81 Vietnam S. 1994 Single 2 NO 3,4 Hanoi
82 Yemen S. 2003 Multiple Open skies Yes RJ -5 IY -5 3,4 No
restrictions yes
83 Yugoslavia S. 1976 Multiple Not stated NO 3,4 Belgrade yes 84 Kazakhstan I. 2007 Single 2 NO 3,4 yes 85 Kenya I. 2008 Multiple Open skies NO 3,4 yes 86 Croatia I. 2008 Multiple Open skies NO 3,4,5 yes
31
Annex 2: Open Sky Agreements
Open Sky Agreements signed during the period of 1995 – 2007
Country Basic Year the year before open sky (PAX)
Open Sky Year (PAX)
First Year After Open Sky ( PAX ) Open Sky Year (%) First Year After
Open Sky year (%) 1994 1995 1996 1995 1996 Palestine NO Op. NO Op. Yemen 79,650 83,718 77,693 5% -2% 1995 1996 1997 1996 1997 USA 109,395 117,076 128,735 7% 18% 2003 2004 2005 2004 2005 Iraq 15,111 16,301 61,454 8% 307% 2004 2005 2006 2005 2006 Thailand 98,717 90,665 87,169 -8% -12% 2005 2006 2007 2006 2007 Hong Kong 6,462 9,274 14,367 44% 122% Syria 37,595 62,308 81,013 66% 115% Lebanon 136,083 160,840 187,854 18% 38% KSA 241,786 267,218 299,648 11% 24% Algeria 17,587 16,919 19,413 -4% 10% Bahrain 67,668 84,368 92,872 25% 37% Azerbaijan 120 254 311 112% 159% 2006 2007 2008 2007 2008 Kuwait 191,871 199,475 168,985 4% -12% Tunisia 23,948 21,566 16,778 -10% -30% Oman 41,282 49,516 55,286 20% 34% Total 1,067,275 1,179,498 1,291,578 11% 21%
Annex 3: Jordan – Open Sky Agreements Signed in 2008
Country Basic Year the year before open sky (PAX)
Open Sky Year (PAX)
First Year After Open Sky (PAX)
Open Sky Year (%)
First Year After Open Sky year (%)
2008 2007 2008 2009 2008 2009 Morocco 10,640 14,306 N/A 34 N/A Croatia 1,193 1,904 N/A 60 N/A Kenai 1,624 2,080 N/A 28 N/A Belgium 9,983 17,467 N/A 75 N/A UAE 532,556 541,044 N/A 2 N/A Total 555,996 576,801 N/A 4 N/A
32
Annex 4: Jordan Aviation Destinations Regional International Alexandria, Egypt Langsa, Indonesia Asyut, Egypt Surabaya, Indonesia Luxor, Egypt New Delhi, India Manama, Bahrain Kathmandu, Nepal Aqaba, Jordan Istanbul, Turkey Dubai, UAE Doha, Qatar Damascus, Syria Source: Jordan Aviation 2010
Annex 5: Foreign Airlines Operating in Jordan American Airlines Jazeera Airways Air Algerie Emirates Airlines Austrian Airlines Northwest Airlines Qatar Airways Iberia Virgin Atlantic KLM Egypt Air Wataniya Airways Cyprus Airways US Airways Jetair Fly Turkish Airlines Eithad Airways Kuwait Airways Air France African Express Airways Gulf Air Lufthansa S7 UM Air British Airways BMI
Saudi Arabia Airlines Alitalia
Oman Air Royal Phnom Penh Airways
Middle East Airlines United Airlines Sudan Airways Air Arabia Air Canada MALEV Ethiopian Airlines LIBYAN Nas Air Sama Syrian Airlines Aerocondor Arkia TAROM Iraqi Airways Delta Yemenia
Source: CARC Jordan 2011
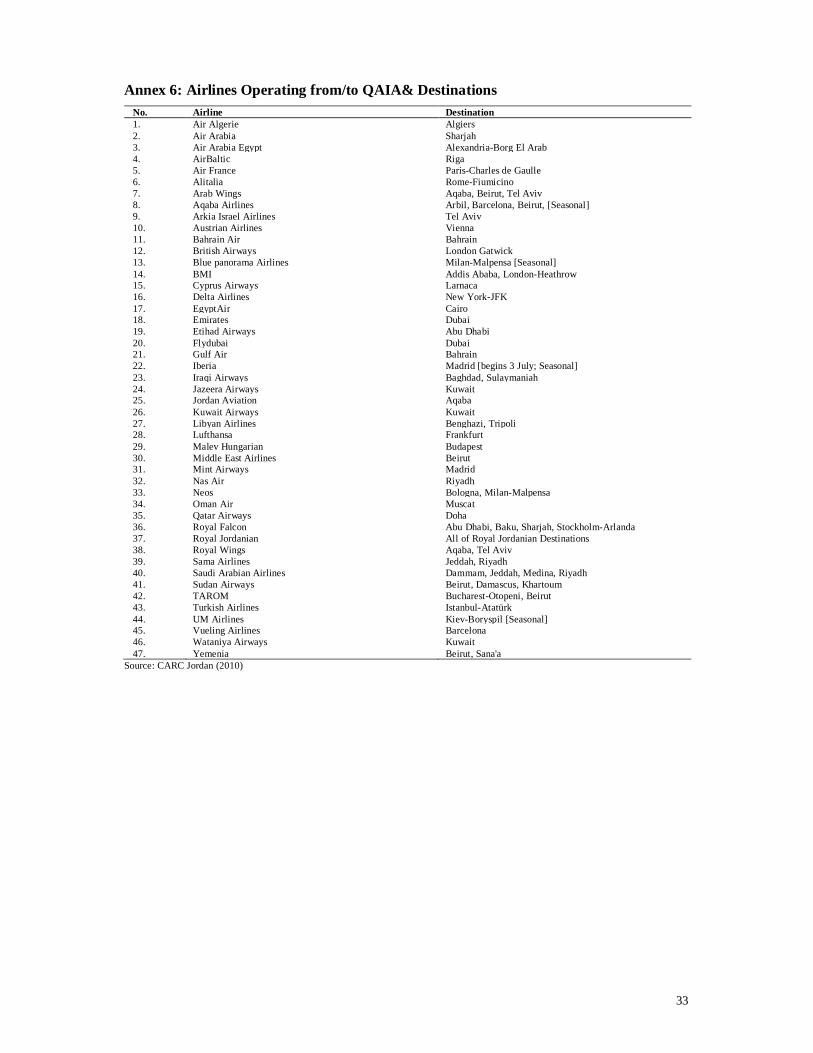
33
Annex 6: Airlines Operating from/to QAIA& Destinations No. Airline Destination 1. Air Algerie Algiers 2. Air Arabia Sharjah 3. Air Arabia Egypt Alexandria-Borg El Arab 4. AirBaltic Riga 5. Air France Paris-Charles de Gaulle 6. Alitalia Rome-Fiumicino 7. Arab Wings Aqaba, Beirut, Tel Aviv 8. Aqaba Airlines Arbil, Barcelona, Beirut, [Seasonal] 9. Arkia Israel Airlines Tel Aviv 10. Austrian Airlines Vienna 11. Bahrain Air Bahrain 12. British Airways London Gatwick 13. Blue panorama Airlines Milan-Malpensa [Seasonal] 14. BMI Addis Ababa, London-Heathrow 15. Cyprus Airways Larnaca 16. Delta Airlines New York-JFK 17. EgyptAir Cairo 18. Emirates Dubai 19. Etihad Airways Abu Dhabi 20. Flydubai Dubai 21. Gulf Air Bahrain 22. Iberia Madrid [begins 3 July; Seasonal] 23. Iraqi Airways Baghdad, Sulaymaniah 24. Jazeera Airways Kuwait 25. Jordan Aviation Aqaba 26. Kuwait Airways Kuwait 27. Libyan Airlines Benghazi, Tripoli 28. Lufthansa Frankfurt 29. Malev Hungarian Budapest 30. Middle East Airlines Beirut 31. Mint Airways Madrid 32. Nas Air Riyadh 33. Neos Bologna, Milan-Malpensa 34. Oman Air Muscat 35. Qatar Airways Doha 36. Royal Falcon Abu Dhabi, Baku, Sharjah, Stockholm-Arlanda 37. Royal Jordanian All of Royal Jordanian Destinations 38. Royal Wings Aqaba, Tel Aviv 39. Sama Airlines Jeddah, Riyadh 40. Saudi Arabian Airlines Dammam, Jeddah, Medina, Riyadh 41. Sudan Airways Beirut, Damascus, Khartoum 42. TAROM Bucharest-Otopeni, Beirut 43. Turkish Airlines Istanbul-Atatürk 44. UM Airlines Kiev-Boryspil [Seasonal] 45. Vueling Airlines Barcelona 46. Wataniya Airways Kuwait 47. Yemenia Beirut, Sana'a
Source: CARC Jordan (2010)


