63The Commercial Salmon Fishery in Alaska • Clark, McGregor, Mecum, Krasnowski and Carroll
KODIAK COMMERCIAL SALMON FISHERY
Area Description and Gear TypesThe Kodiak area includes the waters of the western Gulf of Alaska surrounding the Kodiak Archipelago and the portion of the Alaska Peninsula that drains into Shelikof Straight between Cape Douglas (bound-ary with Cook Inlet) and Kilokak Rocks (boundary with Chignik). The area includes 7 fishing districts (Afognak District, Northeast Kodiak District, East-side Kodiak District, Alitak Bay District, Southwest Kodiak District, Northwest Kodiak District, and Mainland District) each comprised of numerous sec-tions (Figure 75). Gear types currently used in Kodiak area commercial salmon fisheries include purse seines, set gillnets and beach seines. Salmon spawning activ-ity has been documented in about 800 streams within the Kodiak area. An estimated 440 streams support significant salmon production. Of those streams, 4 support Chinook salmon spawning populations, 39 support sockeye salmon spawning populations, 174 support coho salmon spawning populations, all sup-port pink salmon spawning populations, and about 150 support chum salmon spawning populations. Salmon tagging studies have demonstrated the presence of nonlocal stocks of salmon in the commercial salmon harvests of the Kodiak area. Nonlocal stocks of salmon present in Kodiak area commercial salmon fisheries include sockeye salmon migrating to streams in Cook Inlet, Chignik, and the southern portion of the Alaska Peninsula and Chinook salmon from Oregon through Cook Inlet.
History of the Commercial Salmon FisheryThe harvest of salmon in the Kodiak area for subsis-tence use has been ongoing for thousands of years. Commercial use began in the early 1800s by the Rus-sians; however, the fisheries were small and consisted of salted salmon ventures. Salmon streams were blocked and salmon were captured as they schooled behind the barriers. Commercial salmon fishing in the Kodiak area by U.S. citizens began in 1882 when a cannery was built on Karluk spit and 58,800 sockeye salmon were beach seined and processed (Rich and Ball 1931). The Karluk commercial fishery harvest in 1901 was about 4 million sockeye salmon. Thereafter, the Karluk sockeye salmon stock declined in productivity along with the commercial fishery. Since the 1930s, many researchers have discussed the Karluk sockeye salmon stock and theorized about the reasons for the decline.
During the 1880s and 1890s, many additional salmon canneries were built throughout the Kodiak management area and the commercial salmon fishery quickly grew. Within a few years the commercial salmon fishery had spread throughout the Kodiak salmon management area. The first fish trap was built in 1896. Harvest gears used in the Kodiak area as the U.S. salmon fishery developed included beach seines, fish traps, purse seines, and gillnets. Between 1900 and 1909, the annual average commercial harvest in the Kodiak area was about 3,000 Chinook salmon, 3.2 million sockeye salmon, 60,000 coho salmon, and 90,000 pink salmon. Growth of the commercial salmon fishery as measured by increasing harvests continued in the Kodiak management area until the 1930s.
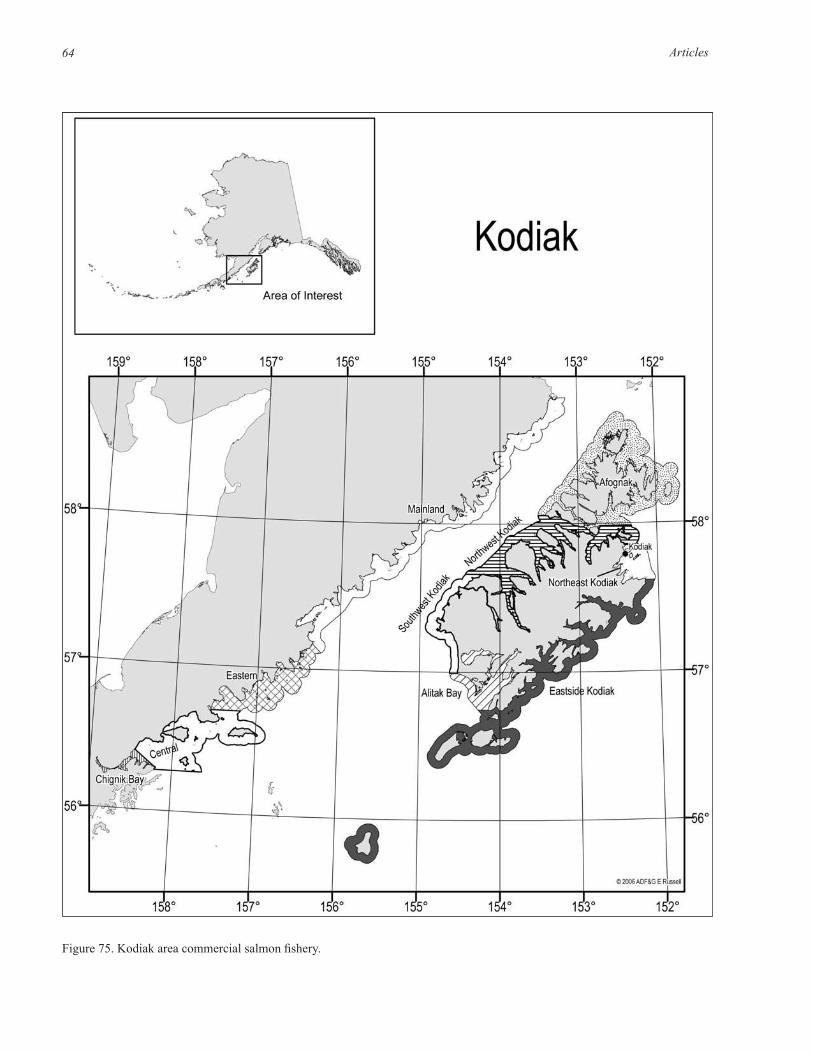
From inception of the fishery until 1987, commer-cial harvests of Chinook salmon in the Kodiak area ranged from 100 to 5,000 fish per year with decadal average annual harvests ranging from 1,100 to 3,300 fish. In 1988, almost 22,400 Chinook salmon were commercially harvested, about 4-fold the earlier peak catch. In 1989, only about 100 Chinook salmon were harvested. Since 1990, annual commercial harvests of Chinook salmon have ranged from 12,300 to 41,000 fish and have averaged about 21,000 fish (Figure 76, Panel A). Sockeye salmon harvests in Kodiak steadily decreased from 3.2 million fish in the 1900s to about 390,000 fish in the 1950s (Figure 76, Panel B). Since statehood, sockeye salmon harvests have increased substantially, averaging 1.7 million fish in the 1980s, 4.3 million fish in the 1990s and 3.1 million fish since 2000. Commercial harvests of coho salmon in the Kodiak area reached a prestatehood average of about 130,000 fish in the 1920s and 1930s. Coho salmon harvests increased substantially over the last 25 years with average catch levels about 194,000 fish in the 1980s, 312,000 fish in the 1990s, and 414,000 fish since 2000 (Figure 76, Panel C). Commercial harvests of pink salmon from the Kodiak area have generally increased over the last 100 years (Figure 76, Panel D). Average annual catch levels for Kodiak pink salmon have been about 9.7 million fish in the 1980s, 15.9 mil-lion fish in the 1990s, and 18.9 million fish since 2000. Chum salmon harvests in the Kodiak area, like pink salmon harvests have generally increased over the last 100 years (Figure 76, Panel E), with average harvest levels of about 911,000 fish in the 1980s, 743,000 fish in the 1990s, and 942,000 fish since 2000. Commercial harvests of all salmon in the Kodiak area show peaks in the 1990s averaging about 21.3 million fish; since 2000 the average has been about 23.4 million fish, with a general increase apparent over the past 100 years (Figure 76, Panel F).
Articles64 65The Commercial Salmon Fishery in Alaska • Clark, McGregor, Mecum, Krasnowski and Carroll
Figure 75. Kodiak area commercial salmon fishery.
Articles64 65The Commercial Salmon Fishery in Alaska • Clark, McGregor, Mecum, Krasnowski and Carroll
Figure 76. Commercial salmon harvests in Kodiak from 1900 –2004; bars provide annual catches and lines provide decade averages.
Other Salmon HarvestsSalmon are harvested for subsistence use in the Kodiak area. The ADF&G Division of Commercial Fisheries manages the Kodiak subsistence salmon fishery; dur-
78
Panel A Chinook Salmon
1900 1910 1920 1930 1940 1950 1960 1970 1980 1990 20000
10,000
20,000
30,000
40,000
50,000
Num
ber o
f Chi
nook
Sal
mon
Panel B Sockeye Salmon
1900 1910 1920 1930 1940 1950 1960 1970 1980 1990 20000
1,000,000
2,000,000
3,000,000
4,000,000
5,000,000
6,000,000
Num
ber o
f Soc
keye
Sal
mon
Panel C Coho Salmon
1900 1910 1920 1930 1940 1950 1960 1970 1980 1990 20000
100,000
200,000
300,000
400,000
500,000
600,000
Num
ber o
f Coh
o Sa
lmon
79
Panel D Pink Salmon
1900 1910 1920 1930 1940 1950 1960 1970 1980 1990 20000
10,000,000
20,000,000
30,000,000
40,000,000
50,000,000
Num
ber o
f Pin
k Sa
lmon
Panel E Chum Salmon
1900 1910 1920 1930 1940 1950 1960 1970 1980 1990 20000
500,000
1,000,000
1,500,000
2,000,000
Num
ber o
f Chu
m S
alm
on
Panel F All Salmon
1900 1910 1920 1930 1940 1950 1960 1970 1980 1990 20000
10,000,000
20,000,000
30,000,000
40,000,000
50,000,000
60,000,000
Num
ber o
f Sal
mon
Figure KOD-1. Commercial salmon harvests in Kodiak from 1900-2004; bars provide annual catches and lines provide decade averages.
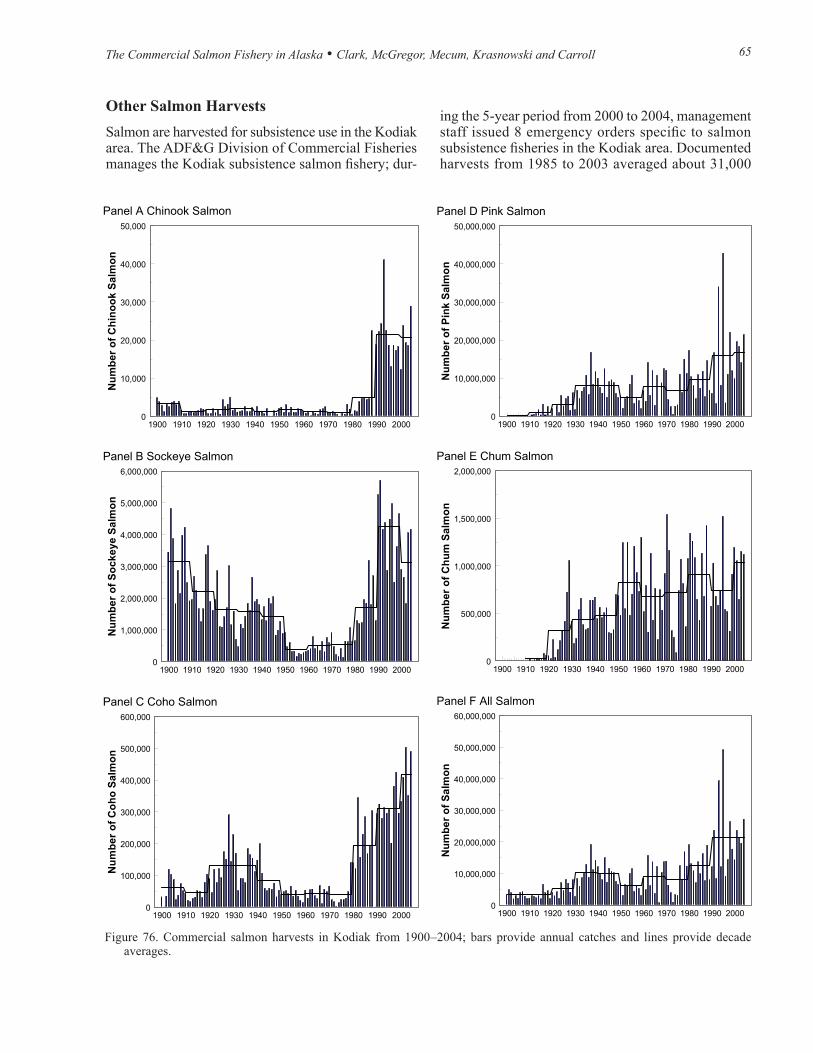
ing the 5-year period from 2000 to 2004, management staff issued 8 emergency orders specific to salmon subsistence fisheries in the Kodiak area. Documented harvests from 1985 to 2003 averaged about 31,000
Articles66 67The Commercial Salmon Fishery in Alaska • Clark, McGregor, Mecum, Krasnowski and Carroll
salmon annually, and ranged from about 16,000 salm-on in 1988 to over 40,000 salmon in 1997, 2001, 2002, and 2003 (Figure 77). About 71% of the subsistence harvest was comprised of sockeye salmon, 21% of coho salmon, 5% of pink salmon, 2% of chum salmon and 1% of Chinook salmon. The subsistence harvest is minor in comparison to the commercial harvest; the ratio of commercial to subsistence harvests during the period of 1985 to 2003 was about 600:1 overall; and by species, was about 70:1 for Chinook salmon, 160:1 for sockeye salmon, 50:1 for coho salmon, 8,500:1 for pink salmon, and 1,500:1 for chum salmon.
Sport fishing harvests in the Kodiak area have been increasing. Sport harvests in the Kodiak area averaged about 36,000 fish during the 1980s, about 40,000 fish in the 1990s, and about 66,000 fish since 2000 (Table 23). Most sport effort is directed at Chinook, coho, and sockeye salmon. Overall, the sport harvest of salmon is small in comparison to the commercial harvest, with the ratio of commercial to sport harvest since 2000 at
about 300:1. The sport harvests of sockeye salmon, pink salmon and chum salmon are minor compared to commercial harvests, with ratios of the commercial to sport harvests since 2000 being about 250:1 for sock-eye salmon, 1,800:1 for pink salmon and 1,600:1 for chum salmon. Sport harvests of Chinook salmon have been rapidly increasing over the past 25 years and the commercial to sport harvest ratio since 2000 is about 2:1. The sport fishery for coho salmon has also been increasing and the commercial to sport harvest ratio since 2000 is about 10:1.
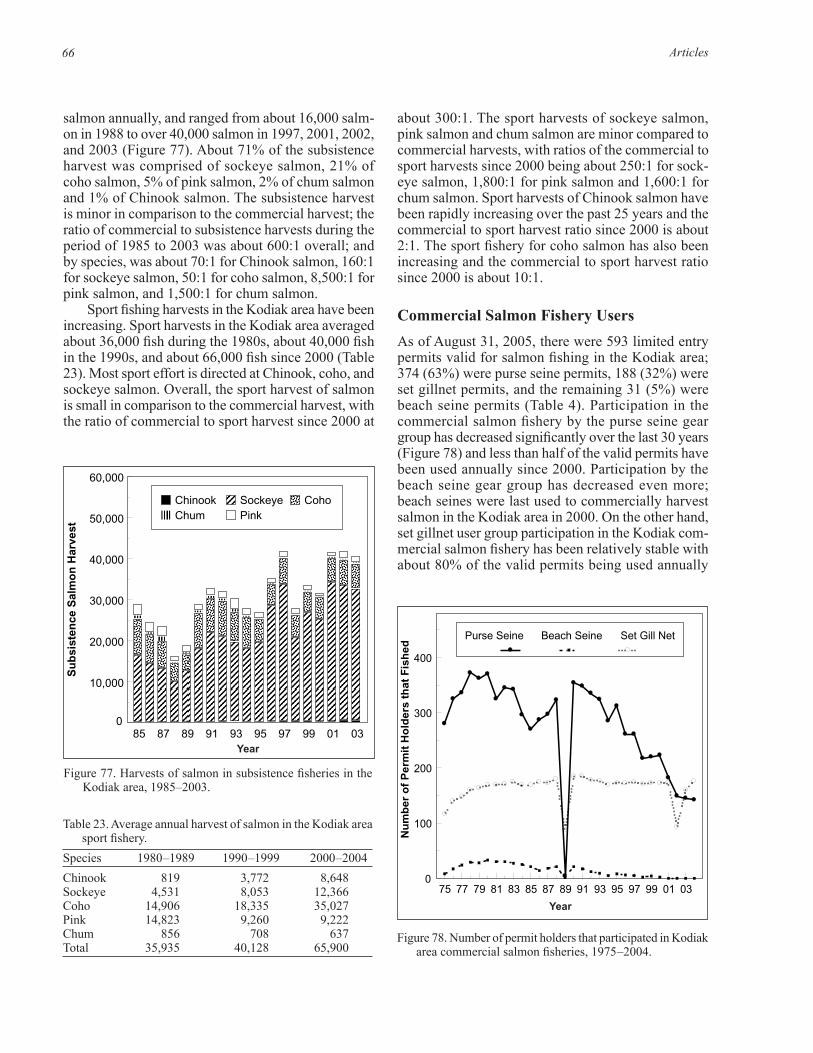
Commercial Salmon Fishery UsersAs of August 31, 2005, there were 593 limited entry permits valid for salmon fishing in the Kodiak area; 374 (63%) were purse seine permits, 188 (32%) were set gillnet permits, and the remaining 31 (5%) were beach seine permits (Table 4). Participation in the commercial salmon fishery by the purse seine gear group has decreased significantly over the last 30 years (Figure 78) and less than half of the valid permits have been used annually since 2000. Participation by the beach seine gear group has decreased even more; beach seines were last used to commercially harvest salmon in the Kodiak area in 2000. On the other hand, set gillnet user group participation in the Kodiak com-mercial salmon fishery has been relatively stable with about 80% of the valid permits being used annually
Figure 77. Harvests of salmon in subsistence fisheries in the Kodiak area, 1985–2003.
Table 23. Average annual harvest of salmon in the Kodiak area sport fishery.
Species 1980 –1989 1990 –1999 2000 –2004Chinook 819 3,772 8,648Sockeye 4,531 8,053 12,366Coho 14,906 18,335 35,027Pink 14,823 9,260 9,222Chum 856 708 637Total 35,935 40,128 65,900
Figure KOD-4. Harvests of salmon in subsistence fisheries in the Kodiak area, 1985-2003.
85 87 89 91 93 95 97 99 01 030
10,000
20,000
30,000
40,000
50,000
60,000
Su
bsi
sten
ce S
alm
on
Har
vest
Chinook Sockeye CohoChum Pink
Year
Figure 78. Number of permit holders that participated in Kodiak area commercial salmon fisheries, 1975 –2004.
Figure KOD-5. Number of permit holders that participated in Kodiak area commercial salmon fisheries, 1975-2004.
75 77 79 81 83 85 87 89 91 93 95 97 99 01 03 0
100
200
300
400
Nu
mb
er o
f P
erm
it H
old
ers
that
Fis
hed
Purse Seine Beach Seine Set Gill Net
Year
Articles66 67The Commercial Salmon Fishery in Alaska • Clark, McGregor, Mecum, Krasnowski and Carroll
since the early 1980s except in 1989, when few fish-ermen participated in the Kodiak commercial salmon fishery due to the Exxon Valdez oil spill.
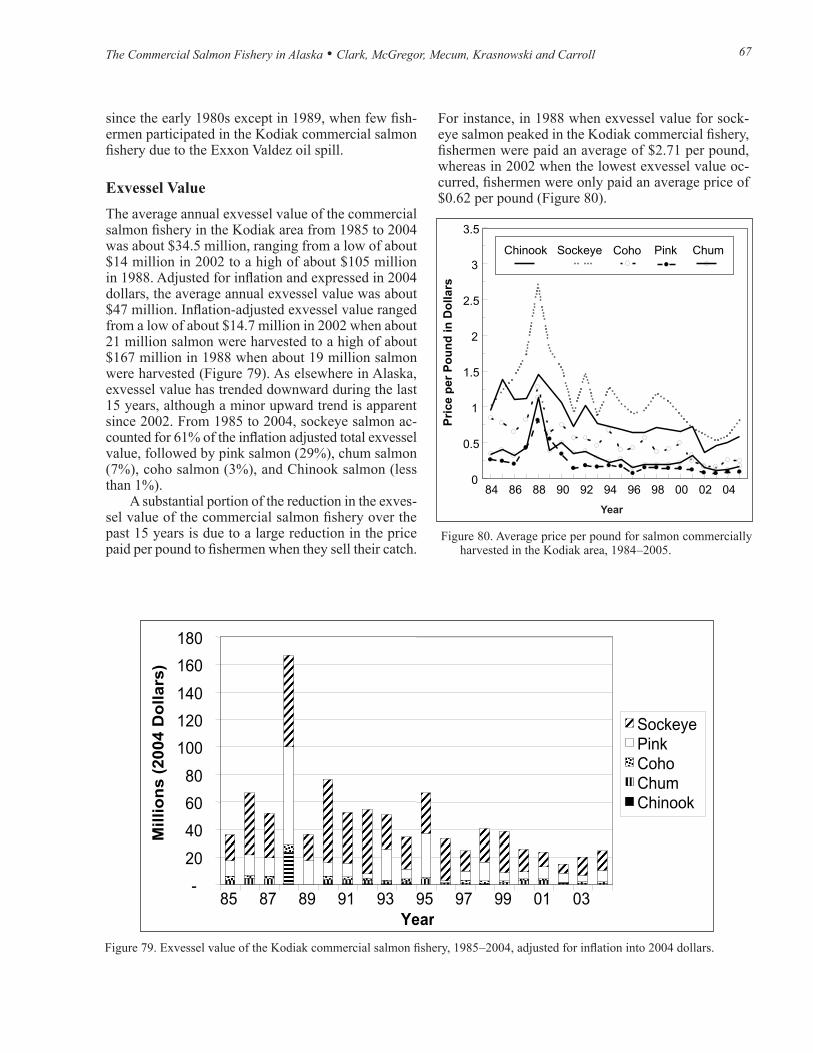
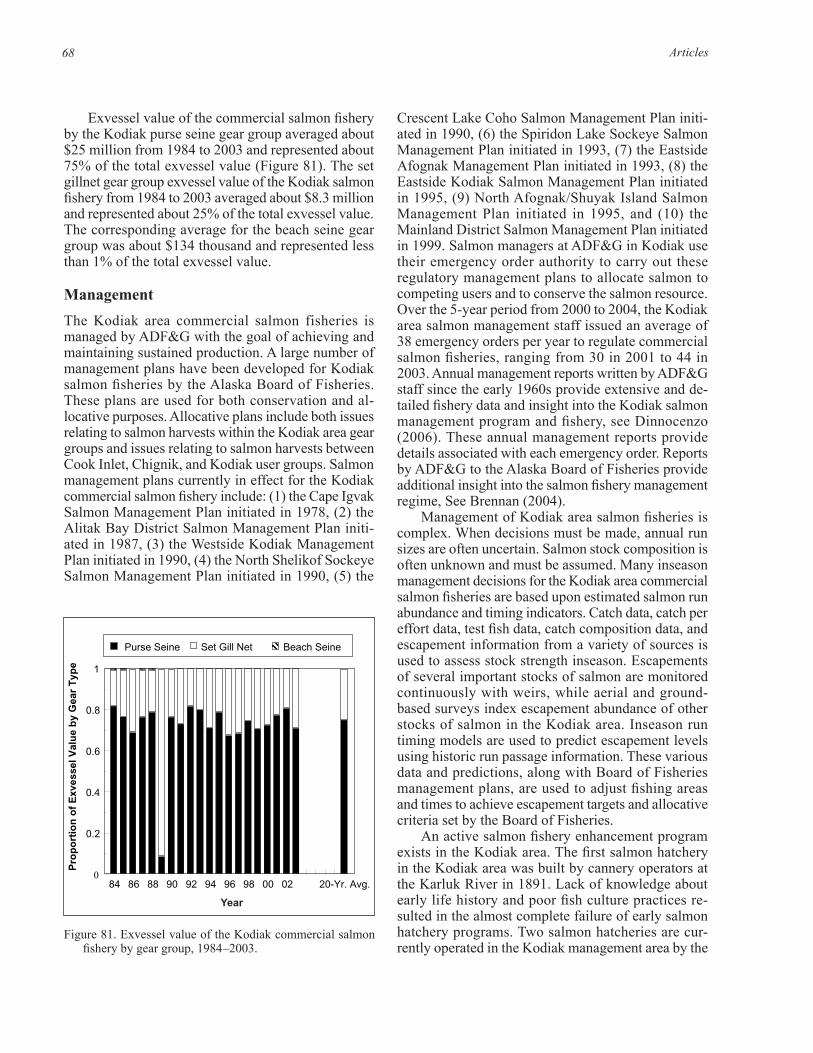
Exvessel ValueThe average annual exvessel value of the commercial salmon fishery in the Kodiak area from 1985 to 2004 was about $34.5 million, ranging from a low of about $14 million in 2002 to a high of about $105 million in 1988. Adjusted for inflation and expressed in 2004 dollars, the average annual exvessel value was about $47 million. Inflation-adjusted exvessel value ranged from a low of about $14.7 million in 2002 when about 21 million salmon were harvested to a high of about $167 million in 1988 when about 19 million salmon were harvested (Figure 79). As elsewhere in Alaska, exvessel value has trended downward during the last 15 years, although a minor upward trend is apparent since 2002. From 1985 to 2004, sockeye salmon ac-counted for 61% of the inflation adjusted total exvessel value, followed by pink salmon (29%), chum salmon (7%), coho salmon (3%), and Chinook salmon (less than 1%).
A substantial portion of the reduction in the exves-sel value of the commercial salmon fishery over the past 15 years is due to a large reduction in the price paid per pound to fishermen when they sell their catch.
For instance, in 1988 when exvessel value for sock-eye salmon peaked in the Kodiak commercial fishery, fishermen were paid an average of $2.71 per pound, whereas in 2002 when the lowest exvessel value oc-curred, fishermen were only paid an average price of $0.62 per pound (Figure 80).
Figure 79. Exvessel value of the Kodiak commercial salmon fishery, 1985 –2004, adjusted for inflation into 2004 dollars.
Figure KOD-6. Exvessel value of the Kodiak commercial salmon fishery, 1985-2004, adjusted for inflation into 2004 dollars.
Exvessel value-Kodiak (adjusted for inflation)
-
20
40
60
80
100
120
140
160
180
85 87 89 91 93 95 97 99 01 03Year
Millio
ns (
2004 D
ollars
)
SockeyePinkCohoChumChinook
Figure 80. Average price per pound for salmon commercially harvested in the Kodiak area, 1984 –2005.
Figure KOD-7. Average price per pound for salmon commercially harvested in the Kodiak area, 1984-2005.
84 86 88 90 92 94 96 98 00 02 040
0.5
1
1.5
2
2.5
3
3.5
Pri
ce p
er P
ou
nd
in D
olla
rs
Chinook Sockeye Coho Pink Chum
Year
Articles68 69The Commercial Salmon Fishery in Alaska • Clark, McGregor, Mecum, Krasnowski and Carroll
Exvessel value of the commercial salmon fishery by the Kodiak purse seine gear group averaged about $25 million from 1984 to 2003 and represented about 75% of the total exvessel value (Figure 81). The set gillnet gear group exvessel value of the Kodiak salmon fishery from 1984 to 2003 averaged about $8.3 million and represented about 25% of the total exvessel value. The corresponding average for the beach seine gear group was about $134 thousand and represented less than 1% of the total exvessel value.
ManagementThe Kodiak area commercial salmon fisheries is managed by ADF&G with the goal of achieving and maintaining sustained production. A large number of management plans have been developed for Kodiak salmon fisheries by the Alaska Board of Fisheries. These plans are used for both conservation and al-locative purposes. Allocative plans include both issues relating to salmon harvests within the Kodiak area gear groups and issues relating to salmon harvests between Cook Inlet, Chignik, and Kodiak user groups. Salmon management plans currently in effect for the Kodiak commercial salmon fishery include: (1) the Cape Igvak Salmon Management Plan initiated in 1978, (2) the Alitak Bay District Salmon Management Plan initi-ated in 1987, (3) the Westside Kodiak Management Plan initiated in 1990, (4) the North Shelikof Sockeye Salmon Management Plan initiated in 1990, (5) the
Crescent Lake Coho Salmon Management Plan initi-ated in 1990, (6) the Spiridon Lake Sockeye Salmon Management Plan initiated in 1993, (7) the Eastside Afognak Management Plan initiated in 1993, (8) the Eastside Kodiak Salmon Management Plan initiated in 1995, (9) North Afognak/Shuyak Island Salmon Management Plan initiated in 1995, and (10) the Mainland District Salmon Management Plan initiated in 1999. Salmon managers at ADF&G in Kodiak use their emergency order authority to carry out these regulatory management plans to allocate salmon to competing users and to conserve the salmon resource. Over the 5-year period from 2000 to 2004, the Kodiak area salmon management staff issued an average of 38 emergency orders per year to regulate commercial salmon fisheries, ranging from 30 in 2001 to 44 in 2003. Annual management reports written by ADF&G staff since the early 1960s provide extensive and de-tailed fishery data and insight into the Kodiak salmon management program and fishery, see Dinnocenzo (2006). These annual management reports provide details associated with each emergency order. Reports by ADF&G to the Alaska Board of Fisheries provide additional insight into the salmon fishery management regime, See Brennan (2004).
Management of Kodiak area salmon fisheries is complex. When decisions must be made, annual run sizes are often uncertain. Salmon stock composition is often unknown and must be assumed. Many inseason management decisions for the Kodiak area commercial salmon fisheries are based upon estimated salmon run abundance and timing indicators. Catch data, catch per effort data, test fish data, catch composition data, and escapement information from a variety of sources is used to assess stock strength inseason. Escapements of several important stocks of salmon are monitored continuously with weirs, while aerial and ground-based surveys index escapement abundance of other stocks of salmon in the Kodiak area. Inseason run timing models are used to predict escapement levels using historic run passage information. These various data and predictions, along with Board of Fisheries management plans, are used to adjust fishing areas and times to achieve escapement targets and allocative criteria set by the Board of Fisheries.
An active salmon fishery enhancement program exists in the Kodiak area. The first salmon hatchery in the Kodiak area was built by cannery operators at the Karluk River in 1891. Lack of knowledge about early life history and poor fish culture practices re-sulted in the almost complete failure of early salmon hatchery programs. Two salmon hatcheries are cur-rently operated in the Kodiak management area by the
Figure 81. Exvessel value of the Kodiak commercial salmon fishery by gear group, 1984 –2003.
Figure KOD-8. Exvessel value of the Kodiak commercial salmon fishery by gear group, 1984-2003.
84 86 88 90 92 94 96 98 00 02 20-Yr. Avg.0
0.2
0.4
0.6
0.8
1
Pro
po
rtio
n o
f E
xves
sel V
alu
e b
y G
ear
Typ
e
Purse Seine Set Gill Net Beach Seine
Year
Articles68 69The Commercial Salmon Fishery in Alaska • Clark, McGregor, Mecum, Krasnowski and Carroll
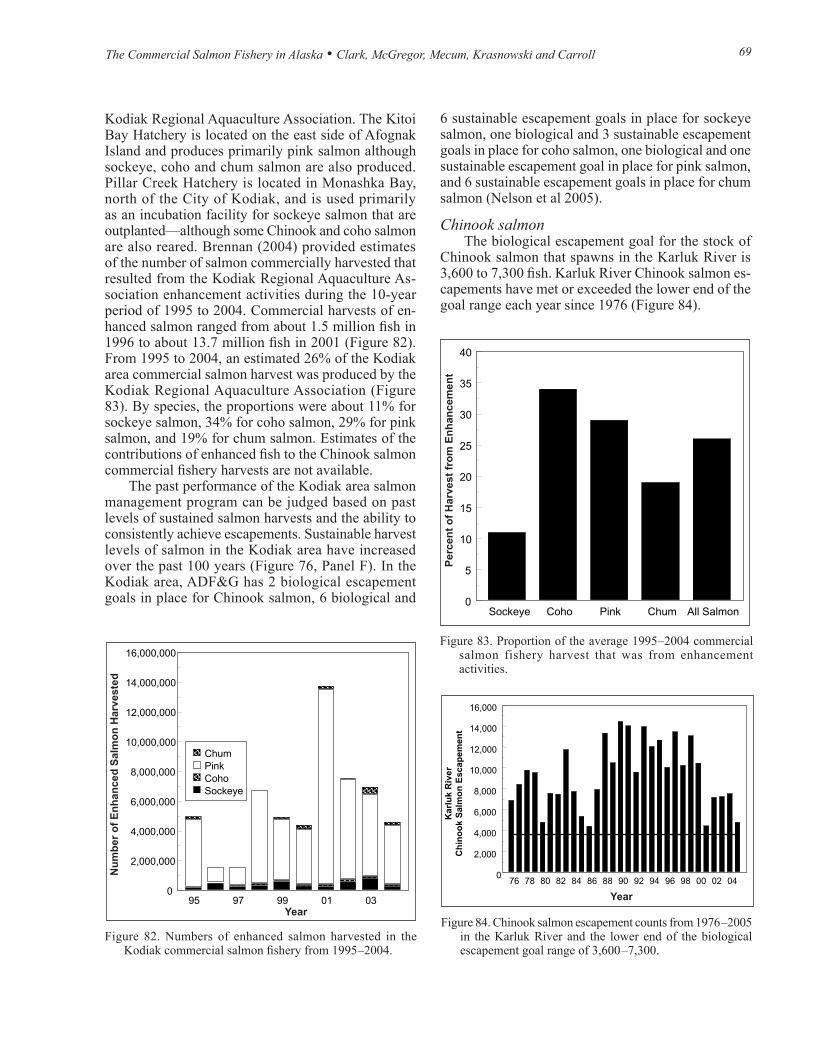
Kodiak Regional Aquaculture Association. The Kitoi Bay Hatchery is located on the east side of Afognak Island and produces primarily pink salmon although sockeye, coho and chum salmon are also produced. Pillar Creek Hatchery is located in Monashka Bay, north of the City of Kodiak, and is used primarily as an incubation facility for sockeye salmon that are outplanted—although some Chinook and coho salmon are also reared. Brennan (2004) provided estimates of the number of salmon commercially harvested that resulted from the Kodiak Regional Aquaculture As-sociation enhancement activities during the 10-year period of 1995 to 2004. Commercial harvests of en-hanced salmon ranged from about 1.5 million fish in 1996 to about 13.7 million fish in 2001 (Figure 82). From 1995 to 2004, an estimated 26% of the Kodiak area commercial salmon harvest was produced by the Kodiak Regional Aquaculture Association (Figure 83). By species, the proportions were about 11% for sockeye salmon, 34% for coho salmon, 29% for pink salmon, and 19% for chum salmon. Estimates of the contributions of enhanced fish to the Chinook salmon commercial fishery harvests are not available.
The past performance of the Kodiak area salmon management program can be judged based on past levels of sustained salmon harvests and the ability to consistently achieve escapements. Sustainable harvest levels of salmon in the Kodiak area have increased over the past 100 years (Figure 76, Panel F). In the Kodiak area, ADF&G has 2 biological escapement goals in place for Chinook salmon, 6 biological and
6 sustainable escapement goals in place for sockeye salmon, one biological and 3 sustainable escapement goals in place for coho salmon, one biological and one sustainable escapement goal in place for pink salmon, and 6 sustainable escapement goals in place for chum salmon (Nelson et al 2005).
Chinook salmonThe biological escapement goal for the stock of
Chinook salmon that spawns in the Karluk River is 3,600 to 7,300 fish. Karluk River Chinook salmon es-capements have met or exceeded the lower end of the goal range each year since 1976 (Figure 84).
Figure 82. Numbers of enhanced salmon harvested in the Kodiak commercial salmon fishery from 1995 –2004.
Figure 83. Proportion of the average 1995 –2004 commercial salmon fishery harvest that was from enhancement activities.
80
Figure Kod-2. Numbers of enhanced salmon harvested in the Kodiak commercial salmon fishery from 1995-2004.
95 97 99 01 030
2,000,000
4,000,000
6,000,000
8,000,000
10,000,000
12,000,000
14,000,000
16,000,000
ChumPinkCohoSockeye
Year
Num
ber o
f Enh
ance
d Sa
lmon
Har
vest
ed
Figure Kod-3. Proportion of the average 1995-2004 commercial salmon fishery harvest that was from enhancement activities.
Sockeye Coho Pink Chum All Salmon 0
5
10
15
20
25
30
35
40
Perc
ent o
f Har
vest
from
Enh
ance
men
t
Figure 84. Chinook salmon escapement counts from 1976 –2005 in the Karluk River and the lower end of the biological escapement goal range of 3,600 –7,300.
Figure Kod-9. Chinook salmon escapement counts from 1976-2005 in the Karluk River and the lower end of the biological escapement goal range of 3,600-7,300.
76 78 80 82 84 86 88 90 92 94 96 98 00 02 040
2,000
4,000
6,000
8,000
10,000
12,000
14,000
16,000
Kar
luk
Riv
er
Ch
ino
ok
Sal
mo
n E
scap
emen
t
Year
Articles70 71The Commercial Salmon Fishery in Alaska • Clark, McGregor, Mecum, Krasnowski and Carroll
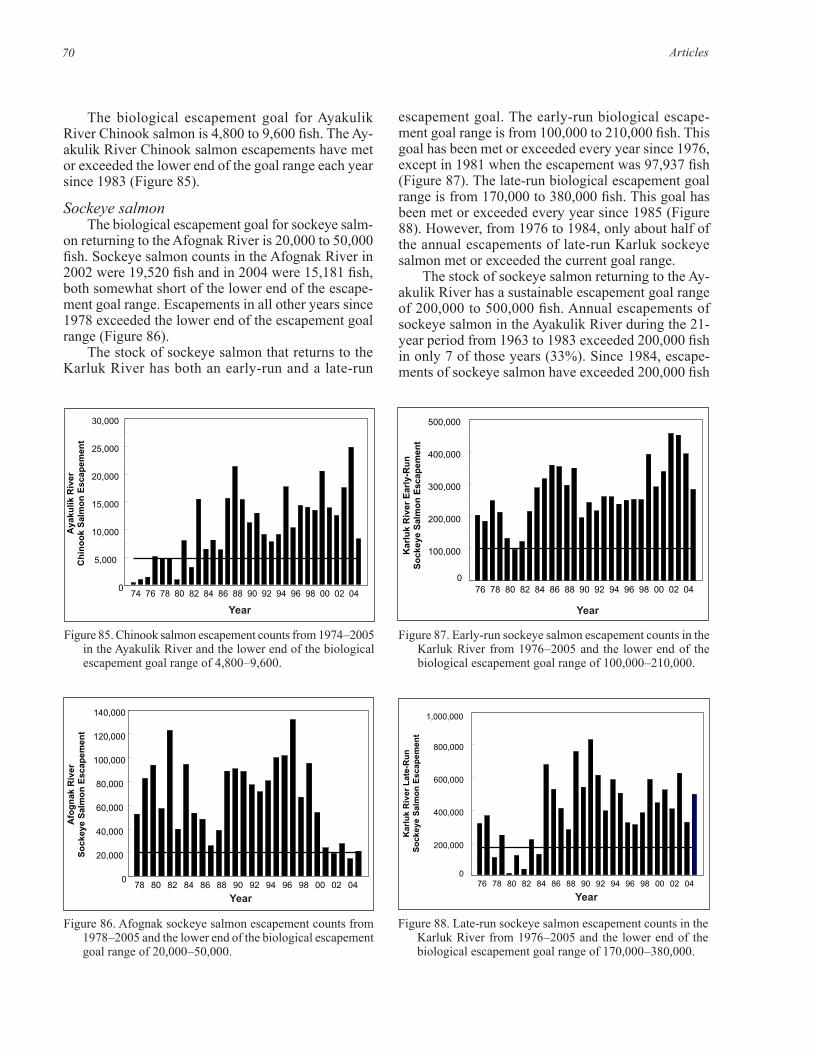
The biological escapement goal for Ayakulik River Chinook salmon is 4,800 to 9,600 fish. The Ay-akulik River Chinook salmon escapements have met or exceeded the lower end of the goal range each year since 1983 (Figure 85).
Sockeye salmonThe biological escapement goal for sockeye salm-
on returning to the Afognak River is 20,000 to 50,000 fish. Sockeye salmon counts in the Afognak River in 2002 were 19,520 fish and in 2004 were 15,181 fish, both somewhat short of the lower end of the escape-ment goal range. Escapements in all other years since 1978 exceeded the lower end of the escapement goal range (Figure 86).
The stock of sockeye salmon that returns to the Karluk River has both an early-run and a late-run
Figure 85. Chinook salmon escapement counts from 1974 –2005 in the Ayakulik River and the lower end of the biological escapement goal range of 4,800 –9,600.
Figure 86. Afognak sockeye salmon escapement counts from 1978 –2005 and the lower end of the biological escapement goal range of 20,000 –50,000.
Figure 87. Early-run sockeye salmon escapement counts in the Karluk River from 1976 –2005 and the lower end of the biological escapement goal range of 100,000 –210,000.
Figure Kod-10. Chinook salmon escapement counts from 1974-2005 in the Ayakulik River and the lower end of the biological escapement goal range of 4,800-9,600.
74 76 78 80 82 84 86 88 90 92 94 96 98 00 02 040
5,000
10,000
15,000
20,000
25,000
30,000
Aya
kulik
Riv
er
Ch
ino
ok
Sal
mo
n E
scap
emen
t
Year
Figure Kod-11. Afognak sockeye salmon escapement counts from 1978-2005 and the lower end of the biological escapement goal range of 20,000-50,000.
78 80 82 84 86 88 90 92 94 96 98 00 02 040
20,000
40,000
60,000
80,000
100,000
120,000
140,000
Afo
gn
ak R
iver
S
ock
eye
Sal
mo
n E
scap
emen
t
Year
Figure Kod-12. Early-run sockeye salmon escapement counts in the Karluk River from 1976-2005 and the lower end of the biological escapement goal range of 100,000-210,000.
76 78 80 82 84 86 88 90 92 94 96 98 00 02 04 0
Kar
luk
Riv
er E
arly
-Ru
n
So
ckey
e S
alm
on
Esc
apem
ent
100,000
200,000
300,000
400,000
500,000
Year
Figure 88. Late-run sockeye salmon escapement counts in the Karluk River from 1976 –2005 and the lower end of the biological escapement goal range of 170,000 –380,000.
Figure Kod-13. Late-run sockeye salmon escapement counts in the Karluk River from 1976-2005 and the lower end of the biological escapement goal range of 170,000-380,000.
76 78 80 82 84 86 88 90 92 94 96 98 00 02 040
200,000
400,000
600,000
800,000
Kar
luk
Riv
er L
ate-
Ru
nS
ock
eye
Sal
mo
n E
scap
emen
t
1,000,000
Year
escapement goal. The early-run biological escape-ment goal range is from 100,000 to 210,000 fish. This goal has been met or exceeded every year since 1976, except in 1981 when the escapement was 97,937 fish (Figure 87). The late-run biological escapement goal range is from 170,000 to 380,000 fish. This goal has been met or exceeded every year since 1985 (Figure 88). However, from 1976 to 1984, only about half of the annual escapements of late-run Karluk sockeye salmon met or exceeded the current goal range.
The stock of sockeye salmon returning to the Ay-akulik River has a sustainable escapement goal range of 200,000 to 500,000 fish. Annual escapements of sockeye salmon in the Ayakulik River during the 21-year period from 1963 to 1983 exceeded 200,000 fish in only 7 of those years (33%). Since 1984, escape-ments of sockeye salmon have exceeded 200,000 fish
Articles70 71The Commercial Salmon Fishery in Alaska • Clark, McGregor, Mecum, Krasnowski and Carroll
Figure 90. Upper Station counts of early-run sockeye salmon from 1969 –2005 and the lower end of the sustainable escapement goal range of 30,000 – 65,000.
Figure 91. Upper Station counts of late-run sockeye salmon from 1966 –2005 and the lower end of the biological escapement goal range of 120,000 –165,000.
Figure Kod-15. Upper Station counts of early-run sockeye salmon from 1969-2005 and the lower end of the sustainable escapement goal range of 30,000-65,000.
69 71 73 75 77 79 81 83 85 87 89 91 93 95 97 99 01 03 050
50,000
100,000
150,000
200,000
Up
per
Sta
tio
n E
arly
-Ru
n
So
cke y
e S
alm
on
Esc
a pem
ent
Year
94
Figure Kod-16. Upper Station counts of late-run sockeye salmon from 1966-2005 and the lower end of the biological escapement goal range of 120,000-165,000.
66 68 70 72 74 76 78 80 82 84 86 88 90 92 94 96 98 00 02 040
100,000
200,000
300,000
400,000
500,000
Upp
er S
tatio
n La
te-R
un
Soc
keye
Sal
mon
Esc
apem
ent
Year
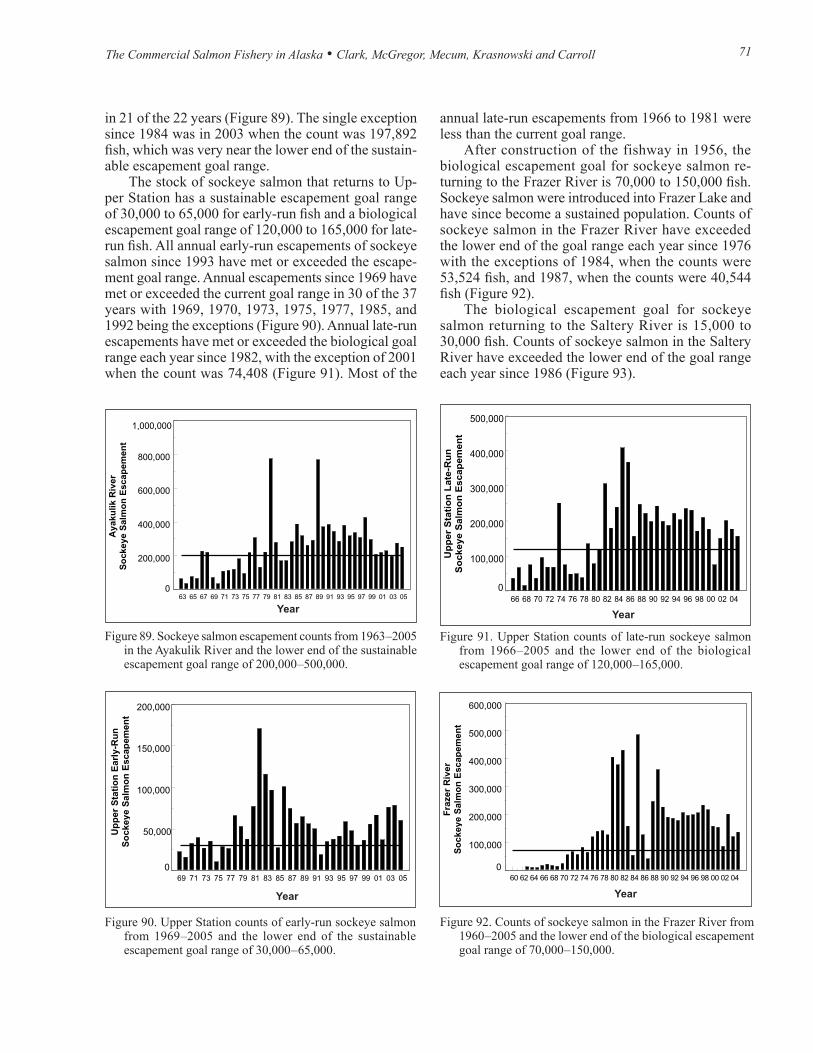
in 21 of the 22 years (Figure 89). The single exception since 1984 was in 2003 when the count was 197,892 fish, which was very near the lower end of the sustain-able escapement goal range.
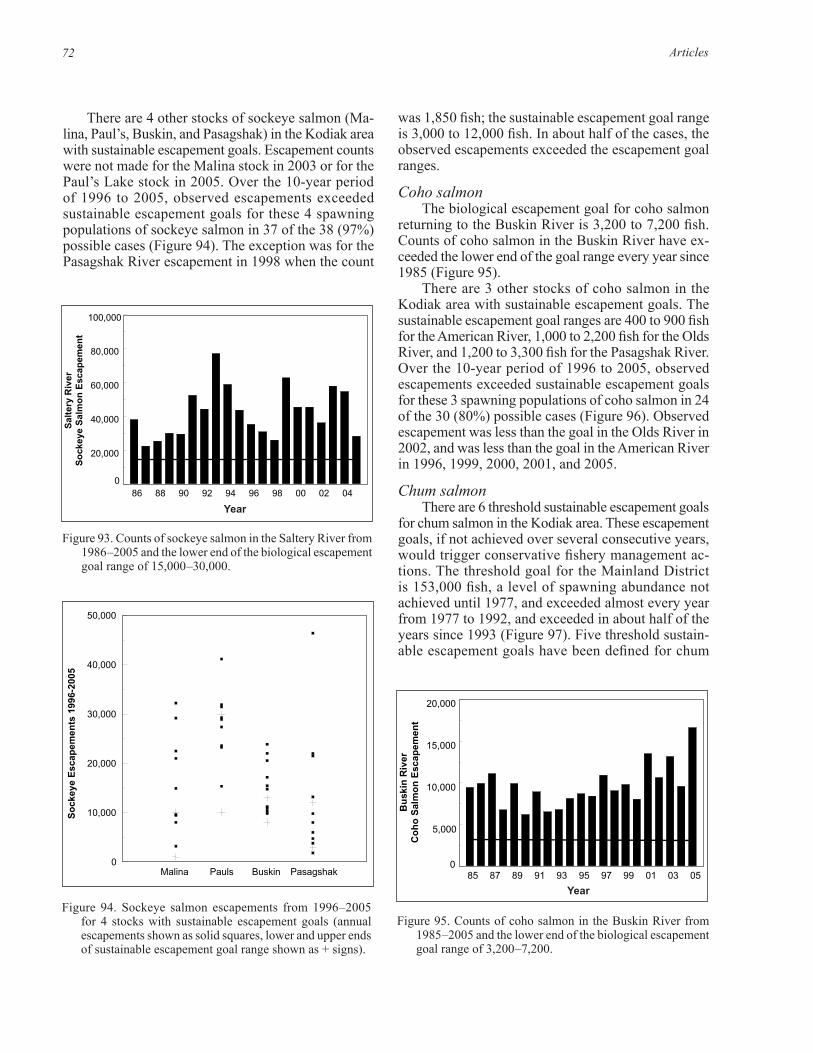
The stock of sockeye salmon that returns to Up-per Station has a sustainable escapement goal range of 30,000 to 65,000 for early-run fish and a biological escapement goal range of 120,000 to 165,000 for late-run fish. All annual early-run escapements of sockeye salmon since 1993 have met or exceeded the escape-ment goal range. Annual escapements since 1969 have met or exceeded the current goal range in 30 of the 37 years with 1969, 1970, 1973, 1975, 1977, 1985, and 1992 being the exceptions (Figure 90). Annual late-run escapements have met or exceeded the biological goal range each year since 1982, with the exception of 2001 when the count was 74,408 (Figure 91). Most of the
Figure 89. Sockeye salmon escapement counts from 1963 –2005 in the Ayakulik River and the lower end of the sustainable escapement goal range of 200,000 –500,000.
Figure Kod-14. Sockeye salmon escapement counts from 1963-2005 in the Ayakulik River and the lower end of the sustainable escapement goal range of 200,000-500,000.
63 65 67 69 71 73 75 77 79 81 83 85 87 89 91 93 95 97 99 01 03 050
200,000
400,000
600,000
800,000
Aya
kulik
Riv
er
So
ckey
e S
alm
on
Esc
apem
ent
1,000,000
Year
annual late-run escapements from 1966 to 1981 were less than the current goal range.
After construction of the fishway in 1956, the biological escapement goal for sockeye salmon re-turning to the Frazer River is 70,000 to 150,000 fish. Sockeye salmon were introduced into Frazer Lake and have since become a sustained population. Counts of sockeye salmon in the Frazer River have exceeded the lower end of the goal range each year since 1976 with the exceptions of 1984, when the counts were 53,524 fish, and 1987, when the counts were 40,544 fish (Figure 92).
The biological escapement goal for sockeye salmon returning to the Saltery River is 15,000 to 30,000 fish. Counts of sockeye salmon in the Saltery River have exceeded the lower end of the goal range each year since 1986 (Figure 93).
Figure 92. Counts of sockeye salmon in the Frazer River from 1960 –2005 and the lower end of the biological escapement goal range of 70,000 –150,000.
Figure Kod-17. Counts of sockeye salmon in the Frazer River from 1960-2005 and the lower end of the biological escapement goal range of 70,000-150,000.
60 62 64 66 68 70 72 74 76 78 80 82 84 86 88 90 92 94 96 98 00 02 040
100,000
200,000
300,000
400,000
500,000
600,000
Fra
zer
Riv
er
So
cke y
e S
alm
on
Esc
a pem
ent
Year
Articles72 73The Commercial Salmon Fishery in Alaska • Clark, McGregor, Mecum, Krasnowski and Carroll
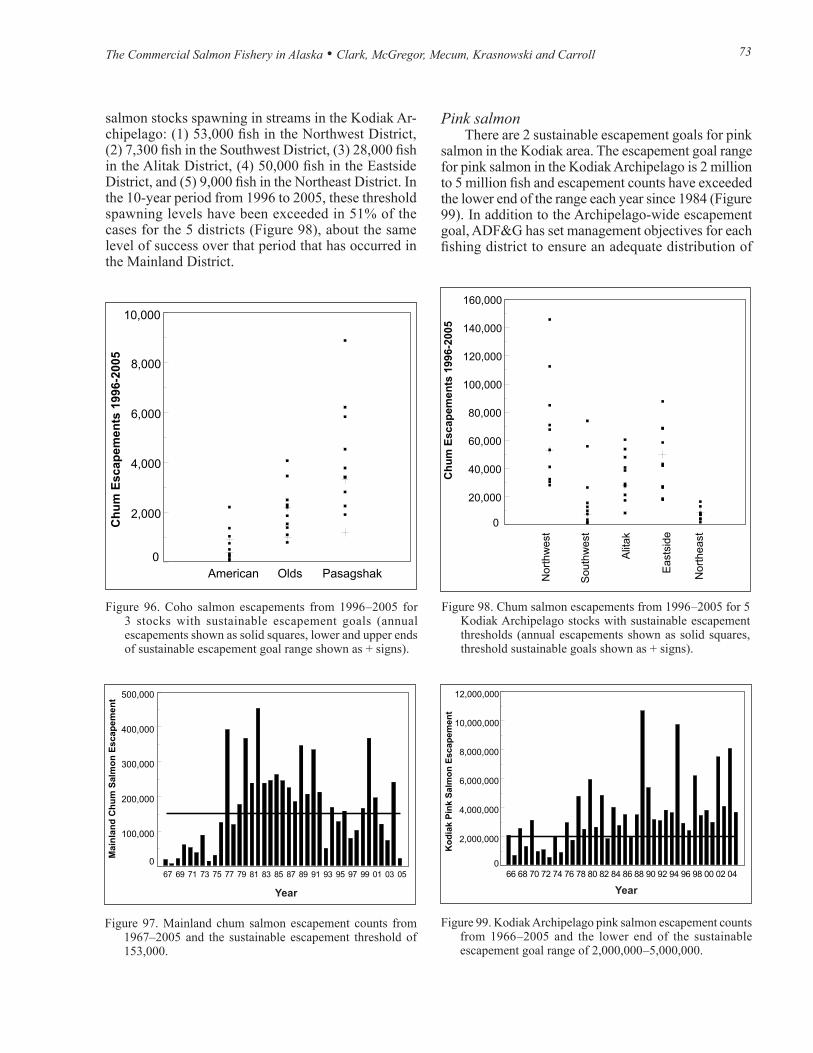
There are 4 other stocks of sockeye salmon (Ma-lina, Paul’s, Buskin, and Pasagshak) in the Kodiak area with sustainable escapement goals. Escapement counts were not made for the Malina stock in 2003 or for the Paul’s Lake stock in 2005. Over the 10-year period of 1996 to 2005, observed escapements exceeded sustainable escapement goals for these 4 spawning populations of sockeye salmon in 37 of the 38 (97%) possible cases (Figure 94). The exception was for the Pasagshak River escapement in 1998 when the count
was 1,850 fish; the sustainable escapement goal range is 3,000 to 12,000 fish. In about half of the cases, the observed escapements exceeded the escapement goal ranges.
Coho salmonThe biological escapement goal for coho salmon
returning to the Buskin River is 3,200 to 7,200 fish. Counts of coho salmon in the Buskin River have ex-ceeded the lower end of the goal range every year since 1985 (Figure 95).
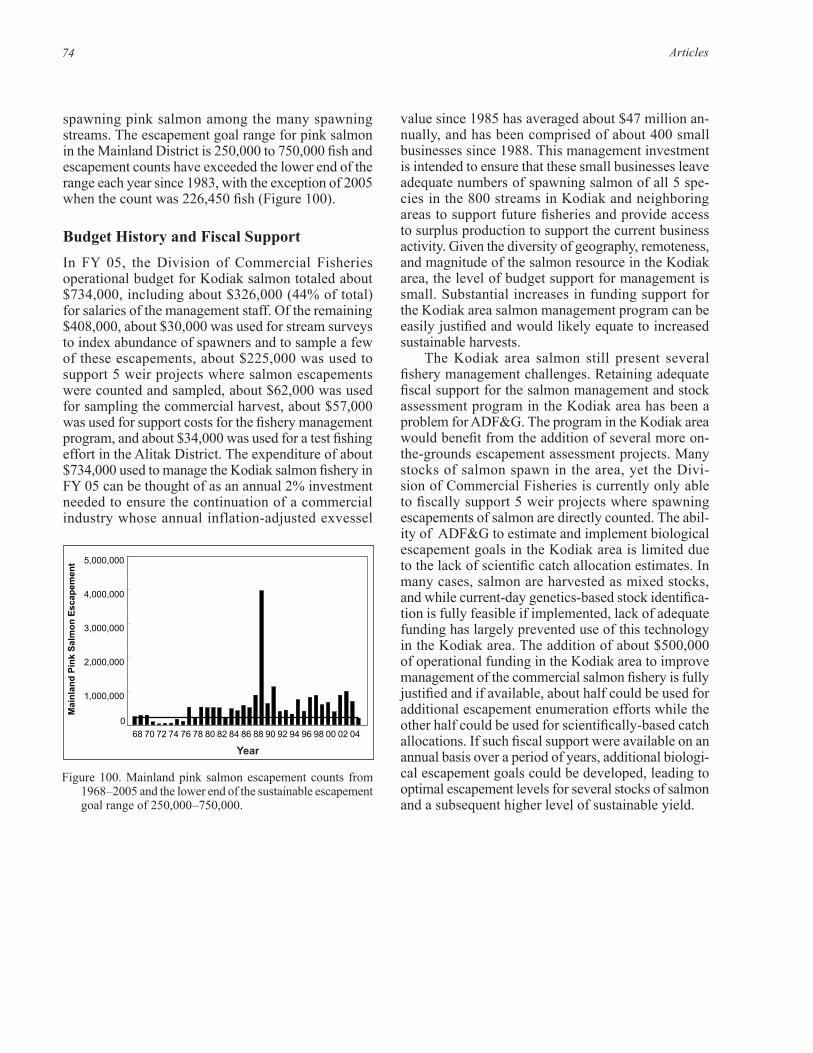
There are 3 other stocks of coho salmon in the Kodiak area with sustainable escapement goals. The sustainable escapement goal ranges are 400 to 900 fish for the American River, 1,000 to 2,200 fish for the Olds River, and 1,200 to 3,300 fish for the Pasagshak River. Over the 10-year period of 1996 to 2005, observed escapements exceeded sustainable escapement goals for these 3 spawning populations of coho salmon in 24 of the 30 (80%) possible cases (Figure 96). Observed escapement was less than the goal in the Olds River in 2002, and was less than the goal in the American River in 1996, 1999, 2000, 2001, and 2005.
Chum salmonThere are 6 threshold sustainable escapement goals
for chum salmon in the Kodiak area. These escapement goals, if not achieved over several consecutive years, would trigger conservative fishery management ac-tions. The threshold goal for the Mainland District is 153,000 fish, a level of spawning abundance not achieved until 1977, and exceeded almost every year from 1977 to 1992, and exceeded in about half of the years since 1993 (Figure 97). Five threshold sustain-able escapement goals have been defined for chum
Figure 93. Counts of sockeye salmon in the Saltery River from 1986 –2005 and the lower end of the biological escapement goal range of 15,000 –30,000.
Figure 94. Sockeye salmon escapements from 1996 –2005 for 4 stocks with sustainable escapement goals (annual escapements shown as solid squares, lower and upper ends of sustainable escapement goal range shown as + signs).
Figure 95. Counts of coho salmon in the Buskin River from 1985 –2005 and the lower end of the biological escapement goal range of 3,200 –7,200.
Figure Kod-18. Counts of sockeye salmon in the Saltery River from 1986-2005 and the lower end of the biological escapement goal range of 15,000-30,000.
86 88 90 92 94 96 98 00 02 04 0
20,000
40,000
60,000
80,000
100,000
Sal
tery
Riv
er
So
ckey
e S
alm
on
Esc
apem
ent
Year
97
Figure Kod-19. Sockeye salmon escapements from 1996-2005 for four stocks with sustainable escapement goals (annual escapements shown as solid squares, lower and upper ends of sustainable escapement goal range shown as + signs).
Malina Pauls Buskin Pasagshak0
10,000
20,000
30,000
40,000
50,000
Sock
eye
Esca
pem
ents
199
6-20
05
Figure Kod-20. Counts of coho salmon in the Buskin River from 1985-2005 and the lower end of the biological escapement goal range of 3,200-7,200.
85 87 89 91 93 95 97 99 01 03 05 0
5,000
10,000
15,000
20,000
Bu
skin
Riv
er
Co
ho
Sal
mo
n E
scap
emen
t
Year
Articles72 73The Commercial Salmon Fishery in Alaska • Clark, McGregor, Mecum, Krasnowski and Carroll
salmon stocks spawning in streams in the Kodiak Ar-chipelago: (1) 53,000 fish in the Northwest District, (2) 7,300 fish in the Southwest District, (3) 28,000 fish in the Alitak District, (4) 50,000 fish in the Eastside District, and (5) 9,000 fish in the Northeast District. In the 10-year period from 1996 to 2005, these threshold spawning levels have been exceeded in 51% of the cases for the 5 districts (Figure 98), about the same level of success over that period that has occurred in the Mainland District.
Pink salmonThere are 2 sustainable escapement goals for pink
salmon in the Kodiak area. The escapement goal range for pink salmon in the Kodiak Archipelago is 2 million to 5 million fish and escapement counts have exceeded the lower end of the range each year since 1984 (Figure 99). In addition to the Archipelago-wide escapement goal, ADF&G has set management objectives for each fishing district to ensure an adequate distribution of
Figure 96. Coho salmon escapements from 1996 –2005 for 3 stocks with sustainable escapement goals (annual escapements shown as solid squares, lower and upper ends of sustainable escapement goal range shown as + signs).
99
Figure Kod-21. Coho salmon escapements from 1996-2005 for three stocks with sustainable escapement goals (annual escapements shown as solid squares, lower and upper ends of sustainable escapement goal range shown as + signs).
American Olds Pasagshak0
2,000
4,000
6,000
8,000
10,000
Chu
m E
scap
emen
ts 1
996-
2005
Figure 97. Mainland chum salmon escapement counts from 1967–2005 and the sustainable escapement threshold of 153,000.
100
Figure Kod-22. Mainland chum salmon escapement counts from 1967-2005 and the sustainable escapement threshold of 153,000.
67 69 71 73 75 77 79 81 83 85 87 89 91 93 95 97 99 01 03 050
100,000
200,000
300,000
400,000
500,000
Mai
nlan
d C
hum
Sal
mon
Esc
apem
ent
Year
Figure 98. Chum salmon escapements from 1996 –2005 for 5 Kodiak Archipelago stocks with sustainable escapement thresholds (annual escapements shown as solid squares, threshold sustainable goals shown as + signs).
101
Figure Kod-23. Chum salmon escapements from 1996-2005 for five Kodiak Archipelago stocks with sustainable escapement thresholds (annual escapements shown as solid squares, threshold sustainable goals shown as + signs).
Northwest
Southwest
Alitak
Eastside
Northeast
0
20,000
40,000
60,000
80,000
100,000
120,000
140,000
160,000
Chu
m E
scap
emen
ts 1
996-
2005
Figure 99. Kodiak Archipelago pink salmon escapement counts from 1966 –2005 and the lower end of the sustainable escapement goal range of 2,000,000 –5,000,000.
102
Figure Kod-24. Kodiak Archipelago pink salmon escapement counts from 1966-2005 and the lower end of the sustainable escapement goal range of 2,000,000-5,000,000.
66 68 70 72 74 76 78 80 82 84 86 88 90 92 94 96 98 00 02 040
Kod
iak
Pink
Sal
mon
Esc
apem
ent
12,000,000
10,000,000
8,000,000
6,000,000
4,000,000
2,000,000
Year
Articles74
spawning pink salmon among the many spawning streams. The escapement goal range for pink salmon in the Mainland District is 250,000 to 750,000 fish and escapement counts have exceeded the lower end of the range each year since 1983, with the exception of 2005 when the count was 226,450 fish (Figure 100).
Budget History and Fiscal SupportIn FY 05, the Division of Commercial Fisheries operational budget for Kodiak salmon totaled about $734,000, including about $326,000 (44% of total) for salaries of the management staff. Of the remaining $408,000, about $30,000 was used for stream surveys to index abundance of spawners and to sample a few of these escapements, about $225,000 was used to support 5 weir projects where salmon escapements were counted and sampled, about $62,000 was used for sampling the commercial harvest, about $57,000 was used for support costs for the fishery management program, and about $34,000 was used for a test fishing effort in the Alitak District. The expenditure of about $734,000 used to manage the Kodiak salmon fishery in FY 05 can be thought of as an annual 2% investment needed to ensure the continuation of a commercial industry whose annual inflation-adjusted exvessel
Figure 100. Mainland pink salmon escapement counts from 1968 –2005 and the lower end of the sustainable escapement goal range of 250,000 –750,000.
103
Figure Kod-25. Mainland pink salmon escapement counts from 1968-2005 and the lower end of the sustainable escapement goal range of 250,000-750,000.
68 70 72 74 76 78 80 82 84 86 88 90 92 94 96 98 00 02 04 0
Mai
nlan
d Pi
nk S
alm
on E
scap
emen
t 5,000,000
4,000,000
3,000,000
2,000,000
1,000,000
Year
value since 1985 has averaged about $47 million an-nually, and has been comprised of about 400 small businesses since 1988. This management investment is intended to ensure that these small businesses leave adequate numbers of spawning salmon of all 5 spe-cies in the 800 streams in Kodiak and neighboring areas to support future fisheries and provide access to surplus production to support the current business activity. Given the diversity of geography, remoteness, and magnitude of the salmon resource in the Kodiak area, the level of budget support for management is small. Substantial increases in funding support for the Kodiak area salmon management program can be easily justified and would likely equate to increased sustainable harvests.
The Kodiak area salmon still present several fishery management challenges. Retaining adequate fiscal support for the salmon management and stock assessment program in the Kodiak area has been a problem for ADF&G. The program in the Kodiak area would benefit from the addition of several more on-the-grounds escapement assessment projects. Many stocks of salmon spawn in the area, yet the Divi-sion of Commercial Fisheries is currently only able to fiscally support 5 weir projects where spawning escapements of salmon are directly counted. The abil-ity of ADF&G to estimate and implement biological escapement goals in the Kodiak area is limited due to the lack of scientific catch allocation estimates. In many cases, salmon are harvested as mixed stocks, and while current-day genetics-based stock identifica-tion is fully feasible if implemented, lack of adequate funding has largely prevented use of this technology in the Kodiak area. The addition of about $500,000 of operational funding in the Kodiak area to improve management of the commercial salmon fishery is fully justified and if available, about half could be used for additional escapement enumeration efforts while the other half could be used for scientifically-based catch allocations. If such fiscal support were available on an annual basis over a period of years, additional biologi-cal escapement goals could be developed, leading to optimal escapement levels for several stocks of salmon and a subsequent higher level of sustainable yield.
75The Commercial Salmon Fishery in Alaska • Clark, McGregor, Mecum, Krasnowski and Carroll
CHIGNIK COMMERCIAL SALMON FISHERY
Area Description and Gear Types
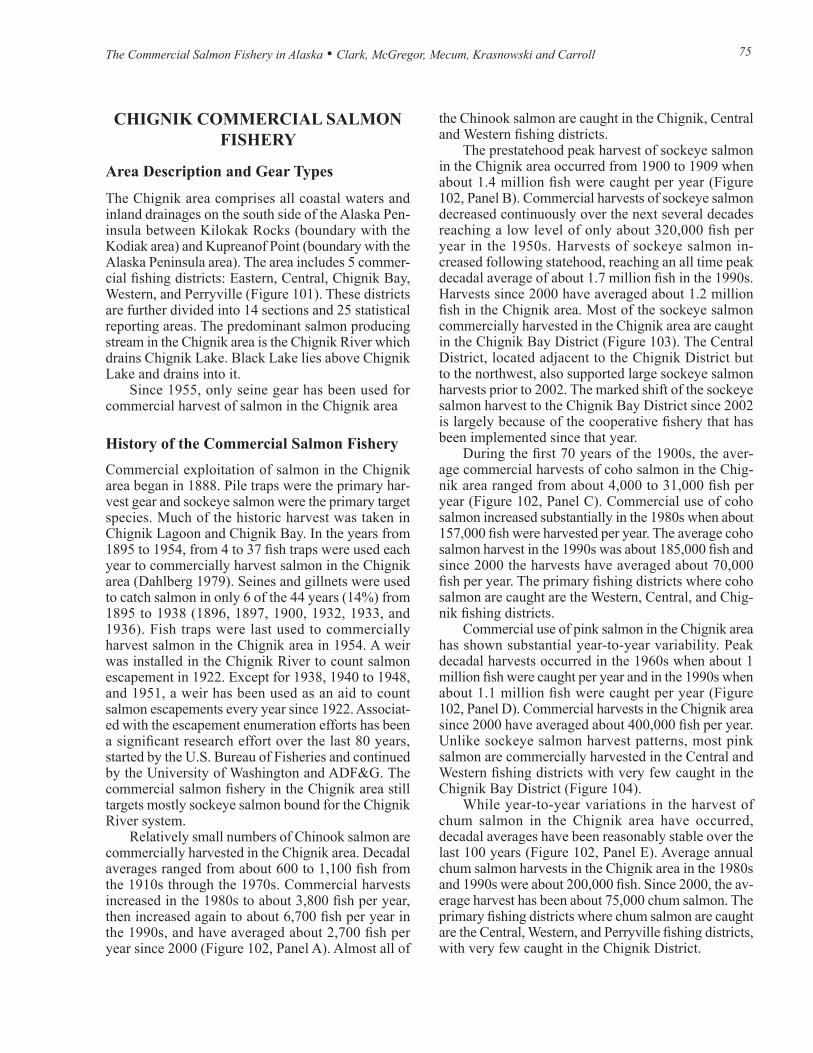
The Chignik area comprises all coastal waters and inland drainages on the south side of the Alaska Pen-insula between Kilokak Rocks (boundary with the Kodiak area) and Kupreanof Point (boundary with the Alaska Peninsula area). The area includes 5 commer-cial fishing districts: Eastern, Central, Chignik Bay, Western, and Perryville (Figure 101). These districts are further divided into 14 sections and 25 statistical reporting areas. The predominant salmon producing stream in the Chignik area is the Chignik River which drains Chignik Lake. Black Lake lies above Chignik Lake and drains into it.
Since 1955, only seine gear has been used for commercial harvest of salmon in the Chignik area
History of the Commercial Salmon FisheryCommercial exploitation of salmon in the Chignik area began in 1888. Pile traps were the primary har-vest gear and sockeye salmon were the primary target species. Much of the historic harvest was taken in Chignik Lagoon and Chignik Bay. In the years from 1895 to 1954, from 4 to 37 fish traps were used each year to commercially harvest salmon in the Chignik area (Dahlberg 1979). Seines and gillnets were used to catch salmon in only 6 of the 44 years (14%) from 1895 to 1938 (1896, 1897, 1900, 1932, 1933, and 1936). Fish traps were last used to commercially harvest salmon in the Chignik area in 1954. A weir was installed in the Chignik River to count salmon escapement in 1922. Except for 1938, 1940 to 1948, and 1951, a weir has been used as an aid to count salmon escapements every year since 1922. Associat-ed with the escapement enumeration efforts has been a significant research effort over the last 80 years, started by the U.S. Bureau of Fisheries and continued by the University of Washington and ADF&G. The commercial salmon fishery in the Chignik area still targets mostly sockeye salmon bound for the Chignik River system.
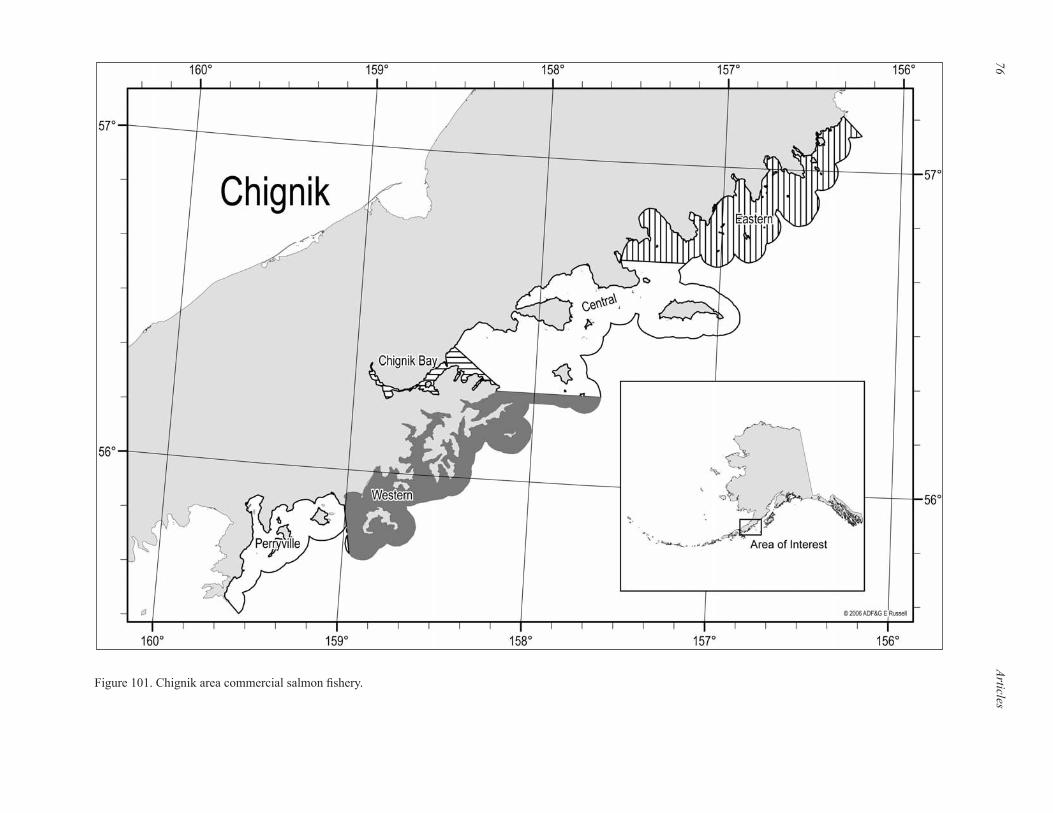
Relatively small numbers of Chinook salmon are commercially harvested in the Chignik area. Decadal averages ranged from about 600 to 1,100 fish from the 1910s through the 1970s. Commercial harvests increased in the 1980s to about 3,800 fish per year, then increased again to about 6,700 fish per year in the 1990s, and have averaged about 2,700 fish per year since 2000 (Figure 102, Panel A). Almost all of
the Chinook salmon are caught in the Chignik, Central and Western fishing districts.
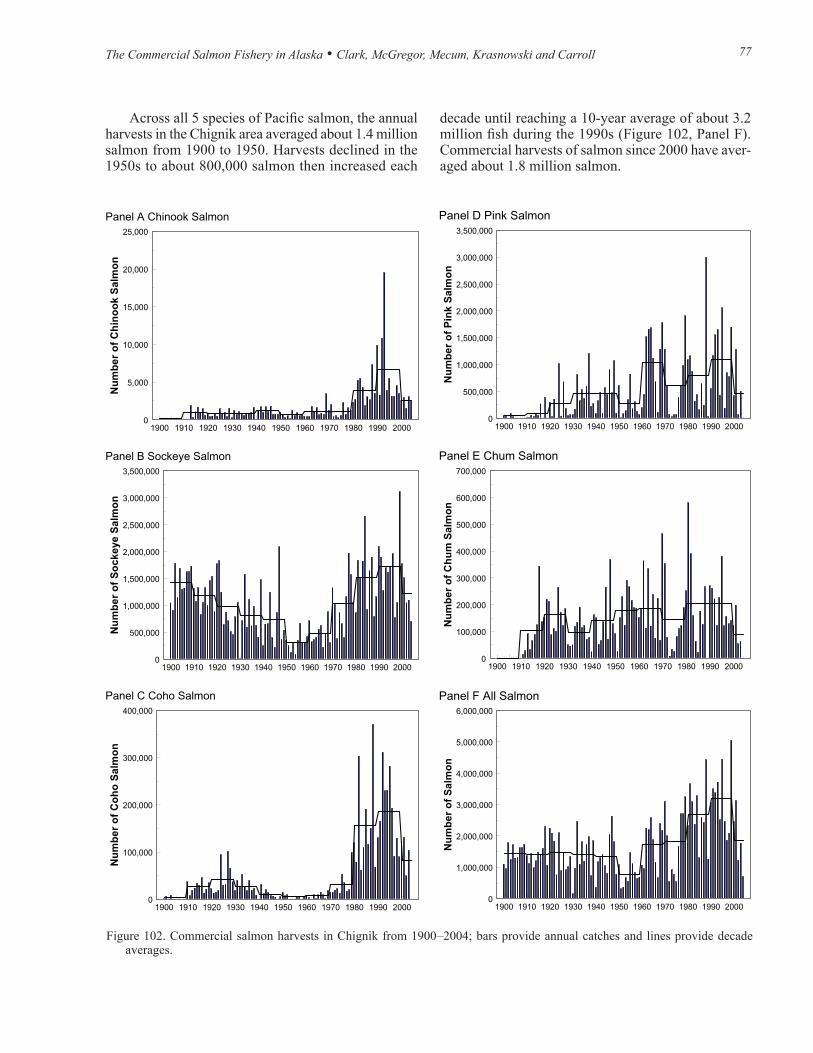
The prestatehood peak harvest of sockeye salmon in the Chignik area occurred from 1900 to 1909 when about 1.4 million fish were caught per year (Figure 102, Panel B). Commercial harvests of sockeye salmon decreased continuously over the next several decades reaching a low level of only about 320,000 fish per year in the 1950s. Harvests of sockeye salmon in-creased following statehood, reaching an all time peak decadal average of about 1.7 million fish in the 1990s. Harvests since 2000 have averaged about 1.2 million fish in the Chignik area. Most of the sockeye salmon commercially harvested in the Chignik area are caught in the Chignik Bay District (Figure 103). The Central District, located adjacent to the Chignik District but to the northwest, also supported large sockeye salmon harvests prior to 2002. The marked shift of the sockeye salmon harvest to the Chignik Bay District since 2002 is largely because of the cooperative fishery that has been implemented since that year.
During the first 70 years of the 1900s, the aver-age commercial harvests of coho salmon in the Chig-nik area ranged from about 4,000 to 31,000 fish per year (Figure 102, Panel C). Commercial use of coho salmon increased substantially in the 1980s when about 157,000 fish were harvested per year. The average coho salmon harvest in the 1990s was about 185,000 fish and since 2000 the harvests have averaged about 70,000 fish per year. The primary fishing districts where coho salmon are caught are the Western, Central, and Chig-nik fishing districts.
Commercial use of pink salmon in the Chignik area has shown substantial year-to-year variability. Peak decadal harvests occurred in the 1960s when about 1 million fish were caught per year and in the 1990s when about 1.1 million fish were caught per year (Figure 102, Panel D). Commercial harvests in the Chignik area since 2000 have averaged about 400,000 fish per year. Unlike sockeye salmon harvest patterns, most pink salmon are commercially harvested in the Central and Western fishing districts with very few caught in the Chignik Bay District (Figure 104).
While year-to-year variations in the harvest of chum salmon in the Chignik area have occurred, decadal averages have been reasonably stable over the last 100 years (Figure 102, Panel E). Average annual chum salmon harvests in the Chignik area in the 1980s and 1990s were about 200,000 fish. Since 2000, the av-erage harvest has been about 75,000 chum salmon. The primary fishing districts where chum salmon are caught are the Central, Western, and Perryville fishing districts, with very few caught in the Chignik District.
Articles76
77The C
omm
ercial Salmon Fishery in Alaska • C
lark, McG
regor, Mecum
, Krasnow
ski and Carroll
Figure 101. Chignik area commercial salmon fishery.
Articles76 77The Commercial Salmon Fishery in Alaska • Clark, McGregor, Mecum, Krasnowski and Carroll
104
Panel A Chinook Salmon
1900 1910 1920 1930 1940 1950 1960 1970 1980 1990 20000
5,000
10,000
15,000
20,000
25,000
Nu
mb
er o
f C
hin
oo
k S
alm
on
Panel B Sockeye Salmon
1900 1910 1920 1930 1940 1950 1960 1970 1980 1990 20000
500,000
1,000,000
1,500,000
2,000,000
2,500,000
3,000,000
3,500,000
Nu
mb
er o
f S
ock
eye
Sal
mo
n
Panel C Coho Salmon
1900 1910 1920 1930 1940 1950 1960 1970 1980 1990 20000
100,000
200,000
300,000
400,000
Nu
mb
er o
f C
oh
o S
alm
on
Figure 102. Commercial salmon harvests in Chignik from 1900 –2004; bars provide annual catches and lines provide decade averages.
decade until reaching a 10-year average of about 3.2 million fish during the 1990s (Figure 102, Panel F). Commercial harvests of salmon since 2000 have aver-aged about 1.8 million salmon.
105
Panel D Pink Salmon
1900 1910 1920 1930 1940 1950 1960 1970 1980 1990 20000
500,000
1,000,000
1,500,000
2,000,000
2,500,000
3,000,000
3,500,000
Nu
mb
er o
f P
ink
Sal
mo
nPanel E Chum Salmon
1900 1910 1920 1930 1940 1950 1960 1970 1980 1990 20000
100,000
200,000
300,000
400,000
500,000
600,000
700,000
Nu
mb
er o
f C
hu
m S
alm
on
Panel F All Salmon
1900 1910 1920 1930 1940 1950 1960 1970 1980 1990 20000
1,000,000
2,000,000
3,000,000
4,000,000
5,000,000
6,000,000
Nu
mb
er o
f S
alm
on
Figure CHIG-1. Commercial salmon harvests in Chignik from 1900-2004; bars provide annual catches and lines provide decade averages.
Across all 5 species of Pacific salmon, the annual harvests in the Chignik area averaged about 1.4 million salmon from 1900 to 1950. Harvests declined in the 1950s to about 800,000 salmon then increased each
Articles78 79The Commercial Salmon Fishery in Alaska • Clark, McGregor, Mecum, Krasnowski and Carroll
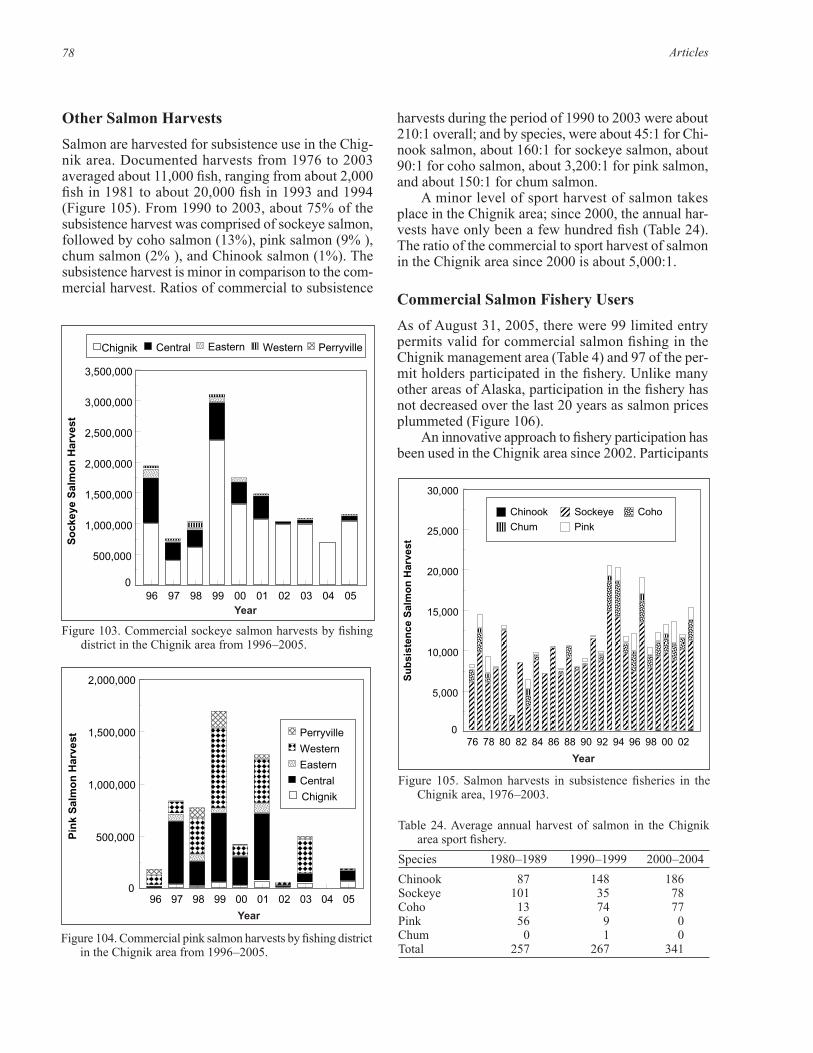
Other Salmon HarvestsSalmon are harvested for subsistence use in the Chig-nik area. Documented harvests from 1976 to 2003 averaged about 11,000 fish, ranging from about 2,000 fish in 1981 to about 20,000 fish in 1993 and 1994 (Figure 105). From 1990 to 2003, about 75% of the subsistence harvest was comprised of sockeye salmon, followed by coho salmon (13%), pink salmon (9% ), chum salmon (2% ), and Chinook salmon (1%). The subsistence harvest is minor in comparison to the com-mercial harvest. Ratios of commercial to subsistence
Figure 103. Commercial sockeye salmon harvests by fishing district in the Chignik area from 1996 –2005.
Figure 104. Commercial pink salmon harvests by fishing district in the Chignik area from 1996 –2005.Figure CHIG-3. Commercial pink salmon harvests by fishing district in the Chignik area
from 1996-2005.
96 97 98 99 00 01 02 03 04 050
500,000
1,000,000
1,500,000
2,000,000
Pin
k S
alm
on
Har
vest
Chignik
Central
Eastern
Western
Perryville
Year
Figure CHIG-2. Commercial sockeye salmon harvests by fishing district in the Chignik area from 1996-2005.
96 97 98 99 00 01 02 03 04 050
500,000
1,000,000
1,500,000
2,000,000
2,500,000
3,000,000
3,500,000
So
ckey
e S
alm
on
Har
vest
Chignik Central Eastern Western Perryville
Year
harvests during the period of 1990 to 2003 were about 210:1 overall; and by species, were about 45:1 for Chi-nook salmon, about 160:1 for sockeye salmon, about 90:1 for coho salmon, about 3,200:1 for pink salmon, and about 150:1 for chum salmon.
A minor level of sport harvest of salmon takes place in the Chignik area; since 2000, the annual har-vests have only been a few hundred fish (Table 24). The ratio of the commercial to sport harvest of salmon in the Chignik area since 2000 is about 5,000:1.
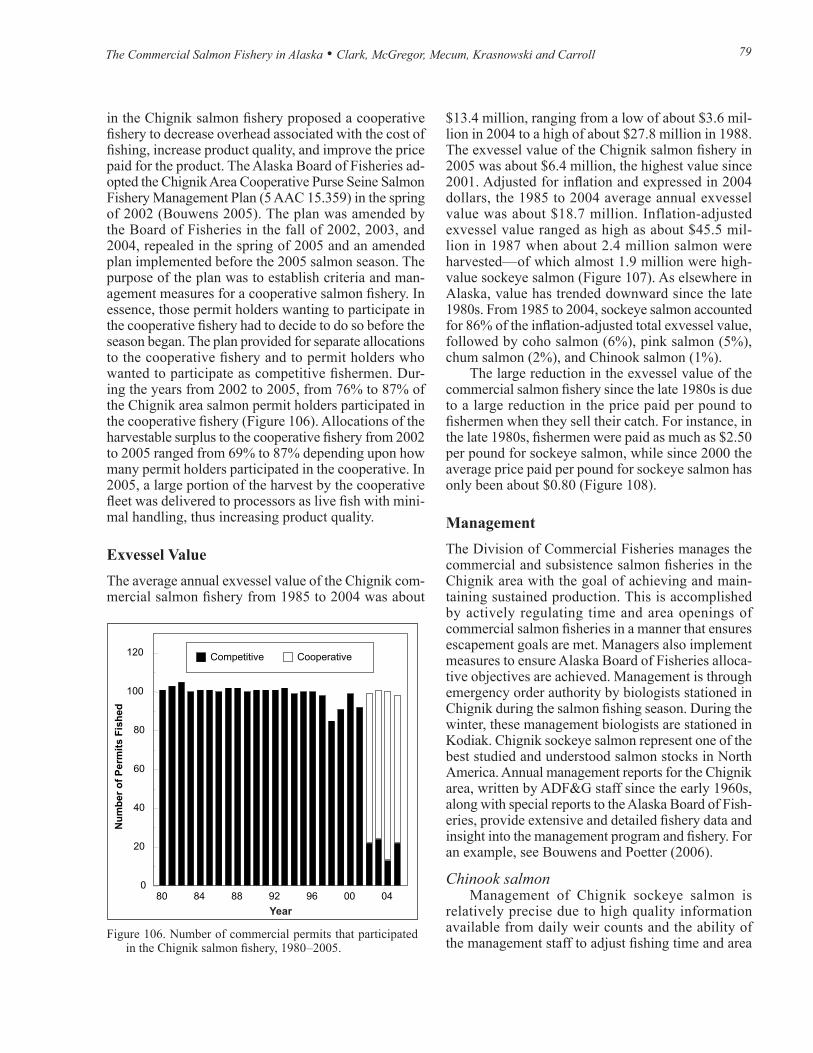
Commercial Salmon Fishery UsersAs of August 31, 2005, there were 99 limited entry permits valid for commercial salmon fishing in the Chignik management area (Table 4) and 97 of the per-mit holders participated in the fishery. Unlike many other areas of Alaska, participation in the fishery has not decreased over the last 20 years as salmon prices plummeted (Figure 106).
An innovative approach to fishery participation has been used in the Chignik area since 2002. Participants
Figure 105. Salmon harvests in subsistence fisheries in the Chignik area, 1976 –2003.
Figure CHIG-4. Salmon harvests in subsistence fisheries in the Chignik area, 1976-2003.
76 78 80 82 84 86 88 90 92 94 96 98 00 02 0
5,000
10,000
15,000
20,000
25,000
30,000
Su
bsi
sten
ce S
alm
on
Har
vest
Chinook Sockeye CohoChum Pink
Year
Table 24. Average annual harvest of salmon in the Chignik area sport fishery.
Species 1980 –1989 1990 –1999 2000 –2004Chinook 87 148 186Sockeye 101 35 78Coho 13 74 77Pink 56 9 0Chum 0 1 0Total 257 267 341
Articles78 79The Commercial Salmon Fishery in Alaska • Clark, McGregor, Mecum, Krasnowski and Carroll
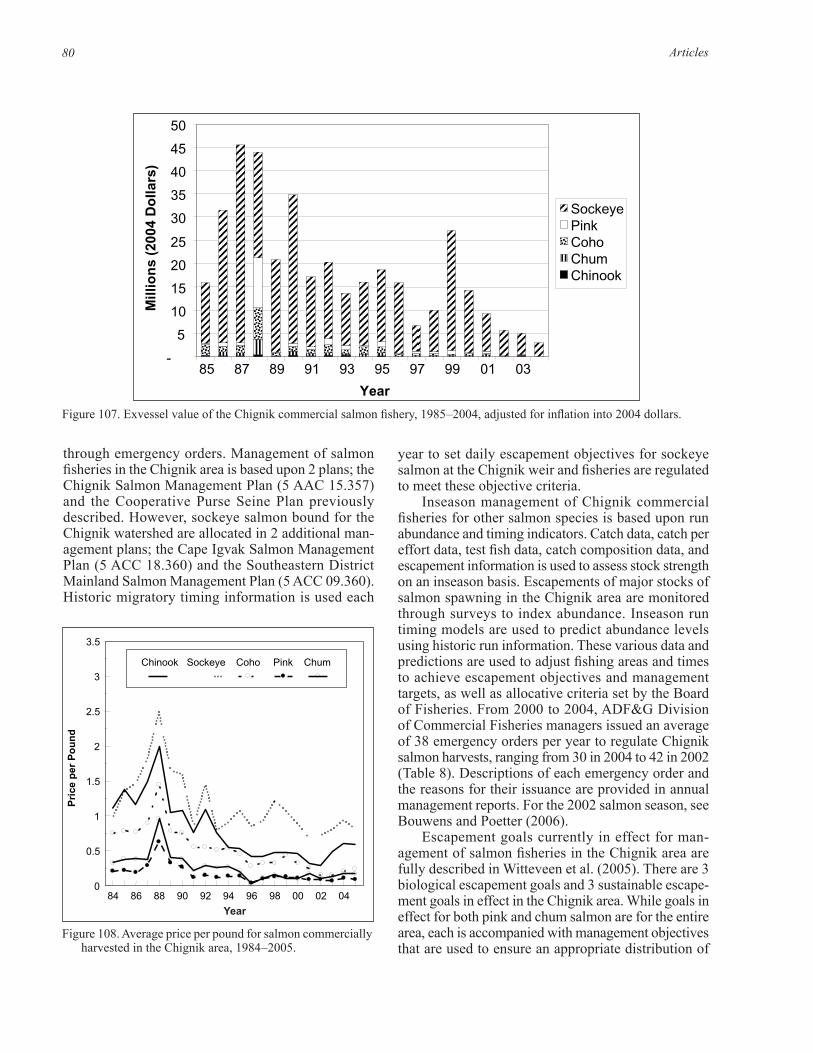
$13.4 million, ranging from a low of about $3.6 mil-lion in 2004 to a high of about $27.8 million in 1988. The exvessel value of the Chignik salmon fishery in 2005 was about $6.4 million, the highest value since 2001. Adjusted for inflation and expressed in 2004 dollars, the 1985 to 2004 average annual exvessel value was about $18.7 million. Inflation-adjusted exvessel value ranged as high as about $45.5 mil-lion in 1987 when about 2.4 million salmon were harvested— of which almost 1.9 million were high-value sockeye salmon (Figure 107). As elsewhere in Alaska, value has trended downward since the late 1980s. From 1985 to 2004, sockeye salmon accounted for 86% of the inflation-adjusted total exvessel value, followed by coho salmon (6%), pink salmon (5%), chum salmon (2%), and Chinook salmon (1%).
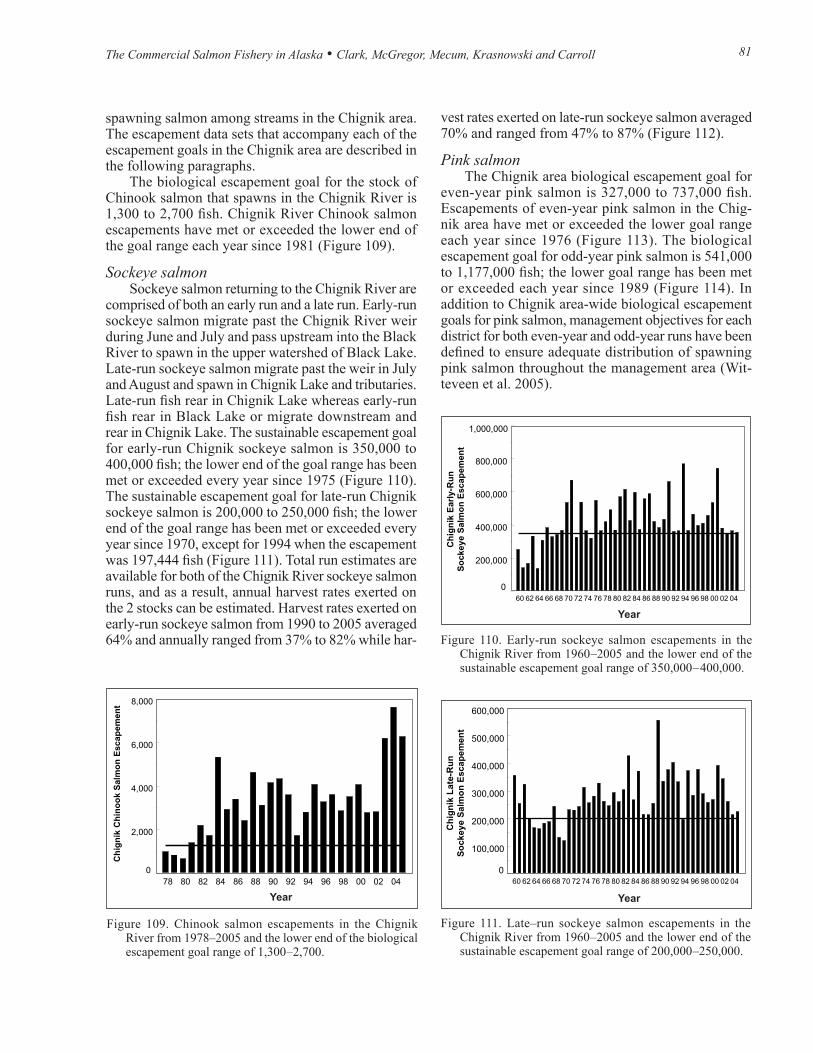
The large reduction in the exvessel value of the commercial salmon fishery since the late 1980s is due to a large reduction in the price paid per pound to fishermen when they sell their catch. For instance, in the late 1980s, fishermen were paid as much as $2.50 per pound for sockeye salmon, while since 2000 the average price paid per pound for sockeye salmon has only been about $0.80 (Figure 108).
ManagementThe Division of Commercial Fisheries manages the commercial and subsistence salmon fisheries in the Chignik area with the goal of achieving and main-taining sustained production. This is accomplished by actively regulating time and area openings of commercial salmon fisheries in a manner that ensures escapement goals are met. Managers also implement measures to ensure Alaska Board of Fisheries alloca-tive objectives are achieved. Management is through emergency order authority by biologists stationed in Chignik during the salmon fishing season. During the winter, these management biologists are stationed in Kodiak. Chignik sockeye salmon represent one of the best studied and understood salmon stocks in North America. Annual management reports for the Chignik area, written by ADF&G staff since the early 1960s, along with special reports to the Alaska Board of Fish-eries, provide extensive and detailed fishery data and insight into the management program and fishery. For an example, see Bouwens and Poetter (2006).
Chinook salmonManagement of Chignik sockeye salmon is
relatively precise due to high quality information available from daily weir counts and the ability of the management staff to adjust fishing time and area
Figure 106. Number of commercial permits that participated in the Chignik salmon fishery, 1980 –2005.
111
Figure Chig-7. Number of commercial permits that participated in the Chignik salmon fishery, 1980-2005.
80 84 88 92 96 00 040
20
40
60
80
100
120
Nu
mb
er o
f P
erm
its
Fis
hed
Competitive Cooperative
Year
in the Chignik salmon fishery proposed a cooperative fishery to decrease overhead associated with the cost of fishing, increase product quality, and improve the price paid for the product. The Alaska Board of Fisheries ad-opted the Chignik Area Cooperative Purse Seine Salmon Fishery Management Plan (5 AAC 15.359) in the spring of 2002 (Bouwens 2005). The plan was amended by the Board of Fisheries in the fall of 2002, 2003, and 2004, repealed in the spring of 2005 and an amended plan implemented before the 2005 salmon season. The purpose of the plan was to establish criteria and man-agement measures for a cooperative salmon fishery. In essence, those permit holders wanting to participate in the cooperative fishery had to decide to do so before the season began. The plan provided for separate allocations to the cooperative fishery and to permit holders who wanted to participate as competitive fishermen. Dur-ing the years from 2002 to 2005, from 76% to 87% of the Chignik area salmon permit holders participated in the cooperative fishery (Figure 106). Allocations of the harvestable surplus to the cooperative fishery from 2002 to 2005 ranged from 69% to 87% depending upon how many permit holders participated in the cooperative. In 2005, a large portion of the harvest by the cooperative fleet was delivered to processors as live fish with mini-mal handling, thus increasing product quality.
Exvessel ValueThe average annual exvessel value of the Chignik com-mercial salmon fishery from 1985 to 2004 was about
Articles80 81The Commercial Salmon Fishery in Alaska • Clark, McGregor, Mecum, Krasnowski and Carroll
Figure 107. Exvessel value of the Chignik commercial salmon fishery, 1985 –2004, adjusted for inflation into 2004 dollars.
Figure CHIG-5. Exvessel value of the Chignik commercial salmon fishery, 1985-2004, adjusted for inflation into 2004 dollars.
Exvessel value-Chignik (adjusted for inflation)
-
5
10
15
20
25
30
35
40
45
50
85 87 89 91 93 95 97 99 01 03
Year
Mill
ion
s (2
004
Do
llars
)
SockeyePinkCohoChumChinook
Figure 108. Average price per pound for salmon commercially harvested in the Chignik area, 1984 –2005.
Figure CHIG-6. Average price per pound for salmon commercially harvested in the Chignik area, 1984-2005.
84 86 88 90 92 94 96 98 00 02 04 0
0.5
1
1.5
2
2.5
3
3.5
Pri
ce p
er P
ou
nd
Chinook Sockeye Coho Pink Chum
Year
through emergency orders. Management of salmon fisheries in the Chignik area is based upon 2 plans; the Chignik Salmon Management Plan (5 AAC 15.357) and the Cooperative Purse Seine Plan previously described. However, sockeye salmon bound for the Chignik watershed are allocated in 2 additional man-agement plans; the Cape Igvak Salmon Management Plan (5 ACC 18.360) and the Southeastern District Mainland Salmon Management Plan (5 ACC 09.360). Historic migratory timing information is used each
year to set daily escapement objectives for sockeye salmon at the Chignik weir and fisheries are regulated to meet these objective criteria.
Inseason management of Chignik commercial fisheries for other salmon species is based upon run abundance and timing indicators. Catch data, catch per effort data, test fish data, catch composition data, and escapement information is used to assess stock strength on an inseason basis. Escapements of major stocks of salmon spawning in the Chignik area are monitored through surveys to index abundance. Inseason run timing models are used to predict abundance levels using historic run information. These various data and predictions are used to adjust fishing areas and times to achieve escapement objectives and management targets, as well as allocative criteria set by the Board of Fisheries. From 2000 to 2004, ADF&G Division of Commercial Fisheries managers issued an average of 38 emergency orders per year to regulate Chignik salmon harvests, ranging from 30 in 2004 to 42 in 2002 (Table 8). Descriptions of each emergency order and the reasons for their issuance are provided in annual management reports. For the 2002 salmon season, see Bouwens and Poetter (2006).
Escapement goals currently in effect for man-agement of salmon fisheries in the Chignik area are fully described in Witteveen et al. (2005). There are 3 biological escapement goals and 3 sustainable escape-ment goals in effect in the Chignik area. While goals in effect for both pink and chum salmon are for the entire area, each is accompanied with management objectives that are used to ensure an appropriate distribution of
Articles80 81The Commercial Salmon Fishery in Alaska • Clark, McGregor, Mecum, Krasnowski and Carroll
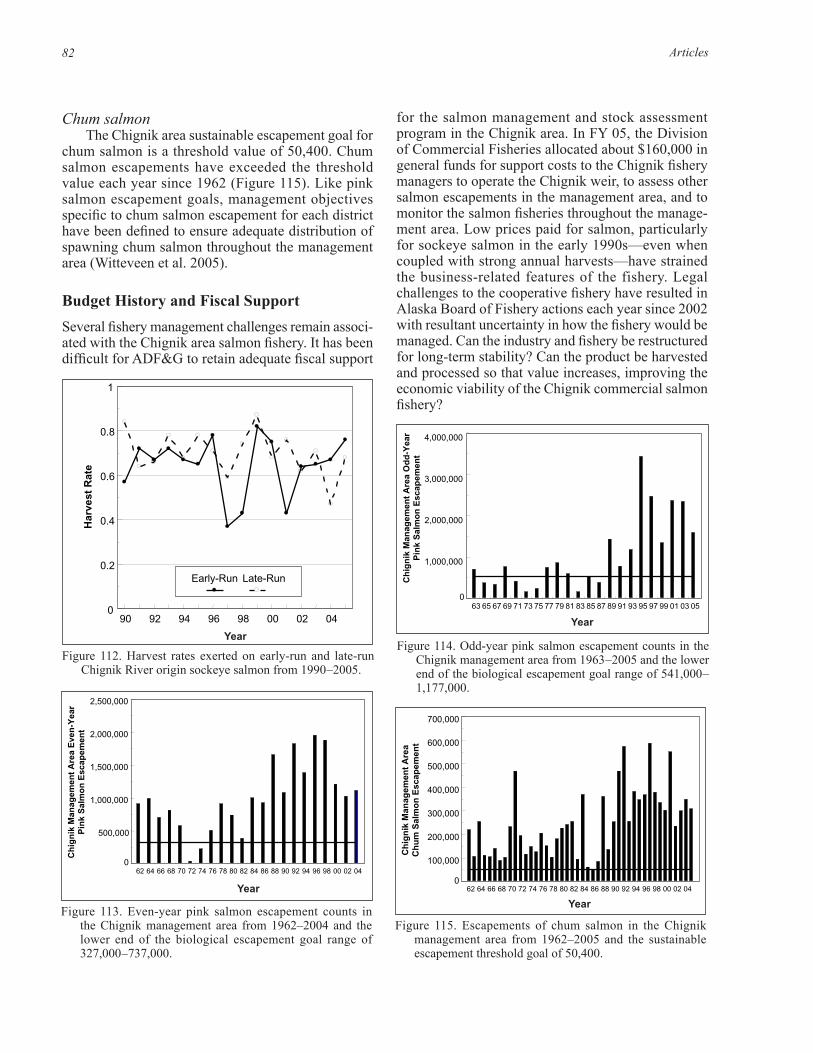
Figure 111. Late–run sockeye salmon escapements in the Chignik River from 1960 –2005 and the lower end of the sustainable escapement goal range of 200,000 –250,000.
114
Figure Chig-10. Late-run sockeye salmon escapements in the Chignik River from 1960-2005 and the lower end of the sustainable escapement goal range of 200,000-250,000.
60 62 64 66 68 70 72 74 76 78 80 82 84 86 88 90 92 94 96 98 00 02 040
100,000
200,000
300,000
400,000
500,000
600,000
Ch
ign
ik L
ate-
Ru
n
So
ckey
e S
alm
on
Esc
apem
ent
Year
spawning salmon among streams in the Chignik area. The escapement data sets that accompany each of the escapement goals in the Chignik area are described in the following paragraphs.
The biological escapement goal for the stock of Chinook salmon that spawns in the Chignik River is 1,300 to 2,700 fish. Chignik River Chinook salmon escapements have met or exceeded the lower end of the goal range each year since 1981 (Figure 109).
Sockeye salmonSockeye salmon returning to the Chignik River are
comprised of both an early run and a late run. Early-run sockeye salmon migrate past the Chignik River weir during June and July and pass upstream into the Black River to spawn in the upper watershed of Black Lake. Late-run sockeye salmon migrate past the weir in July and August and spawn in Chignik Lake and tributaries. Late-run fish rear in Chignik Lake whereas early-run fish rear in Black Lake or migrate downstream and rear in Chignik Lake. The sustainable escapement goal for early-run Chignik sockeye salmon is 350,000 to 400,000 fish; the lower end of the goal range has been met or exceeded every year since 1975 (Figure 110). The sustainable escapement goal for late-run Chignik sockeye salmon is 200,000 to 250,000 fish; the lower end of the goal range has been met or exceeded every year since 1970, except for 1994 when the escapement was 197,444 fish (Figure 111). Total run estimates are available for both of the Chignik River sockeye salmon runs, and as a result, annual harvest rates exerted on the 2 stocks can be estimated. Harvest rates exerted on early-run sockeye salmon from 1990 to 2005 averaged 64% and annually ranged from 37% to 82% while har-
vest rates exerted on late-run sockeye salmon averaged 70% and ranged from 47% to 87% (Figure 112).
Pink salmonThe Chignik area biological escapement goal for
even-year pink salmon is 327,000 to 737,000 fish. Escapements of even-year pink salmon in the Chig-nik area have met or exceeded the lower goal range each year since 1976 (Figure 113). The biological escapement goal for odd-year pink salmon is 541,000 to 1,177,000 fish; the lower goal range has been met or exceeded each year since 1989 (Figure 114). In addition to Chignik area-wide biological escapement goals for pink salmon, management objectives for each district for both even-year and odd-year runs have been defined to ensure adequate distribution of spawning pink salmon throughout the management area (Wit-teveen et al. 2005).
Figure 109. Chinook salmon escapements in the Chignik River from 1978–2005 and the lower end of the biological escapement goal range of 1,300 –2,700.
112
Figure Chig-8. Chinook salmon escapements in the Chignik River from 1978-2005 and the lower end of the biological escapement goal range of 1,300-2,700.
78 80 82 84 86 88 90 92 94 96 98 00 02 040
2,000
4,000
6,000
8,000
Ch
ign
ik C
hin
oo
k S
alm
on
Esc
apem
ent
Year
Figure 110. Early-run sockeye salmon escapements in the Chignik River from 1960 –2005 and the lower end of the sustainable escapement goal range of 350,000 – 400,000.
113
Figure Chig-9. Early-run sockeye salmon escapements in the Chignik River from 1960-2005 and the lower end of the sustainable escapement goal range of 350,000-400,000.
60 62 64 66 68 70 72 74 76 78 80 82 84 86 88 90 92 94 96 98 00 02 04
0
200,000
400,000
600,000
800,000
1,000,000
Ch
ign
ik E
arly
-Ru
n
So
ckey
e S
alm
on
Esc
apem
ent
Year
Articles82
Chum salmonThe Chignik area sustainable escapement goal for
chum salmon is a threshold value of 50,400. Chum salmon escapements have exceeded the threshold value each year since 1962 (Figure 115). Like pink salmon escapement goals, management objectives specific to chum salmon escapement for each district have been defined to ensure adequate distribution of spawning chum salmon throughout the management area (Witteveen et al. 2005).
Budget History and Fiscal SupportSeveral fishery management challenges remain associ-ated with the Chignik area salmon fishery. It has been difficult for ADF&G to retain adequate fiscal support
Figure 112. Harvest rates exerted on early-run and late-run Chignik River origin sockeye salmon from 1990 –2005.Figure Chig-11. Harvest rates exerted on early-run and late-run Chignik River origin
sockeye salmon from 1990-2005.
90 92 94 96 98 00 02 040
0.2
0.4
0.6
0.8
1
Har
vest
Rat
e
Early-Run Late-Run
Year
Figure 113. Even-year pink salmon escapement counts in the Chignik management area from 1962–2004 and the lower end of the biological escapement goal range of 327,000 –737,000.
116
Figure Chig-12. Even-year pink salmon escapement counts in the Chignik management area from 1962-2004 and the lower end of the biological escapement goal range of 327,000-737,000.
62 64 66 68 70 72 74 76 78 80 82 84 86 88 90 92 94 96 98 00 02 040
500,000
1,000,000
1,500,000
2,000,000
2,500,000
Ch
ign
ik M
anag
emen
t A
rea
Eve
n-Y
ear
Pin
k S
alm
on
Esc
apem
ent
Year
Figure 114. Odd-year pink salmon escapement counts in the Chignik management area from 1963 –2005 and the lower end of the biological escapement goal range of 541,000 –1,177,000.
117
Figure Chig-13. Odd-year pink salmon escapement counts in the Chignik management area from 1963-2005 and the lower end of the biological escapement goal range of 541,000-1,177,000.
63 65 67 69 71 73 75 77 79 81 83 85 87 89 91 93 95 97 99 01 03 050
1,000,000
2,000,000
3,000,000
4,000,000
Ch
ign
ik M
anag
emen
t A
rea
Od
d-Y
ear
Pin
k S
alm
on
Esc
apem
ent
Year
for the salmon management and stock assessment program in the Chignik area. In FY 05, the Division of Commercial Fisheries allocated about $160,000 in general funds for support costs to the Chignik fishery managers to operate the Chignik weir, to assess other salmon escapements in the management area, and to monitor the salmon fisheries throughout the manage-ment area. Low prices paid for salmon, particularly for sockeye salmon in the early 1990s—even when coupled with strong annual harvests—have strained the business-related features of the fishery. Legal challenges to the cooperative fishery have resulted in Alaska Board of Fishery actions each year since 2002 with resultant uncertainty in how the fishery would be managed. Can the industry and fishery be restructured for long-term stability? Can the product be harvested and processed so that value increases, improving the economic viability of the Chignik commercial salmon fishery?
Figure 115. Escapements of chum salmon in the Chignik management area from 1962–2005 and the sustainable escapement threshold goal of 50,400.
118
Figure Chig-14. Escapements of chum salmon in the Chignik management area from 1962-2005 and the sustainable escapement threshold goal of 50,400.
62 64 66 68 70 72 74 76 78 80 82 84 86 88 90 92 94 96 98 00 02 040
100,000
200,000
300,000
400,000
500,000
600,000
700,000
Ch
ign
ik M
anag
emen
t A
rea
Ch
um
Sal
mo
n E
scap
emen
t
Year
83The Commercial Salmon Fishery in Alaska • Clark, McGregor, Mecum, Krasnowski and Carroll
PENINSULA–ALEUTIANS COMMERCIAL SALMON FISHERY
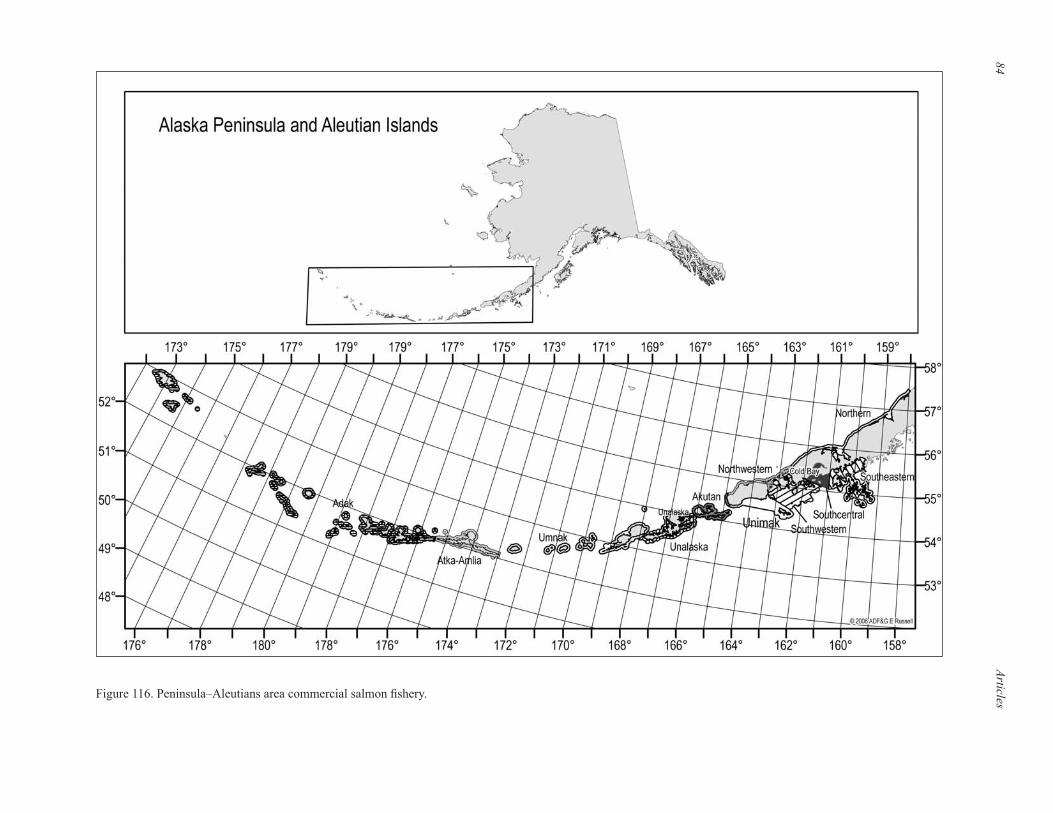
Area Description and Gear TypesThe Alaska Peninsula and Aleutian Islands manage-ment areas (collectively referred to as Area M) and the Atka–Amlia management area (Area F) are divided into 4 subareas. The 4 subareas are: (1) the North Pen-insula, consisting of Bering Sea waters extending west from Cape Menshikof to Cape Sarichef on Unimak Island, (2) the South Peninsula, consisting of Pacific Ocean waters extending west of Kupreanof Point to Scotch Cap on Unimak Island, (3) the Aleutian Islands, consisting of Bering Sea and Pacific Ocean waters of the Pribilof Islands and the Aleutian Islands west of Unimak Island but exclusive of the Atka–Amlia area, and (4) the Atka–Amlia area consisting of Bering Sea and Pacific Ocean waters extending west of Seguam Pass and east of Atka Pass (Figure 116).
Prior to statehood, fish traps were commonly used to commercially harvest salmon along the Alaska Pen-insula. Commercial fishing gear since then has been limited to purse seines, drift gillnets, and set gillnets.
History of the Commercial Salmon FisheryCommercial salmon fisheries along the Alaska Pen-insula first occurred in 1882 when canneries were constructed at Orzinski Bay and Thin Point Cove, but the earliest catch records only go back to 1906. The first commercial salmon catches recorded in the Aleutians occurred in 1911. Early harvests in the Peninsula–Aleutians were primarily sockeye salmon. Salmon harvested in the Peninsula–Aleutians commer-cial fishery include both local stocks and stocks pass-ing through the area as they migrate to natal streams in both Asia and North America. The Russell Creek Hatchery, located near Cold Bay, was built during the 1980s and was intended as a chum salmon production facility, but the facility was closed in 1992.
The peak prestatehood decadal harvest of Chinook salmon in the Peninsula–Aleutians commercial fishery occurred in the 1910s when about 19,500 fish were caught per year (Figure 117, Panel A). The peak post-statehood decadal harvest of Chinook salmon occurred in the 1980s when about 30,000 fish were caught per year. Average commercial harvests of Chinook salmon were about 20,800 fish in the 1990s, and about 10,800 fish since 2000.
Sockeye salmon commercial harvests during the 1960s in the Peninsula–Aleutians averaged about 827,000 fish (Figure 117, Panel B). Commercial har-
vests of sockeye salmon averaged about 1.2 million fish in the 1970s, about 4 million fish in the 1980s, about 5.1 million fish in the 1990s, and about 3.5 mil-lion fish since 2000 (Figure 117, Panel B). Only small numbers of sockeye salmon have been commercially harvested in the Aleutian Islands or Atka–Amlia ar-eas. From 1990 to 2004, the average annual harvest of sockeye salmon in the Aleutian Islands area was about 16,000 fish, while the average annual harvest for the Atka–Amlia area was only about 20 fish. From 1990 to 2004, on the other hand, the average annual harvests of sockeye salmon in the North and South Peninsula areas were about 2.2 million fish each (Figure 118).
Based upon tagging studies, a substantial portion of the sockeye salmon harvested in South Peninsula commercial fisheries in June are fish migrating to spawning grounds in Bristol Bay. From 1975 to 1999, the June fishery was managed based upon a percentage of the Bristol Bay sockeye salmon forecast (Unimak quota was 6.8% and Shumagin quota was 1.5%). It is believed that the harvest rates exerted on Bristol Bay sockeye salmon by the June South Peninsula fishery were less than 5% in most of those years, ranging from 0.8% to 7.2%.
The post-June fishery harvest of sockeye salmon likely includes substantial harvests of Chignik-origin fish. The Southeast District Management Plan is used to allocate the catch of Chignik-origin sockeye salmon between the South Peninsula and Chignik areas prior to July 25.
Annual average commercial harvests of coho salmon in the Peninsula–Aleutians ranged from about 23,000 to 163,000 fish from the 1910s to the 1970s (Figure 117, Panel C). Commercial harvests of coho salmon increased substantially since the 1970s with average harvests of 450,000 fish in the 1980s, 400,000 fish in the 1990s, and about 250,000 fish since 2000.
The peak prestatehood annual average commercial harvest of pink salmon in the Peninsula–Aleutians was about 5.8 million fish in the 1930s. Commercial har-vests dropped to an average level of about 2 million pink salmon per year in the 1950s, 1960s, and 1970s. Average annual harvest of pink salmon was about 6.5 million fish in the 1980s, about 8.2 million fish in the 1990s, and about 5.1 million fish since 2000 (Figure 117, Panel D). From 1990 to 2004, the Atka–Amlia area commercial harvest of pink salmon averaged about 600 fish while the average for the Aleutian Islands area was about 100,000 fish. Lack of markets has limited the harvest. Most of the commercially har-vested pink salmon have been taken in the South Pen-insula area with the 1990 to 2004 average being about 6.7 million fish (Figure 119). From 1990 to 2003, the
Articles84
85The C
omm
ercial Salmon Fishery in Alaska • C
lark, McG
regor, Mecum
, Krasnow
ski and Carroll
Figure 116. Peninsula–Aleutians area commercial salmon fishery.
Articles84 85The Commercial Salmon Fishery in Alaska • Clark, McGregor, Mecum, Krasnowski and Carroll
commercial harvest of pink salmon from the North Peninsula area averaged only about 80,000 fish.
The peak prestatehood decadal annual average commercial harvest of chum salmon in the Pen-insula–Aleutians was about 1.6 million fish in the 1930s. Thereafter, average harvest levels continued to decline until reaching about 620,000 fish per year in the 1970s (Figure 117, Panel E). Average annual harvests of chum salmon were about 2.1 million fish in the 1980s, about 1.3 million fish in the 1990s, and about 900,000 fish since 2000 (Figure 117, Panel E). From 1990 to 2004, the Atka–Amlia area commercial harvest of chum salmon only averaged about 60 fish while the average for the Aleutian Islands area was only about 200 chum salmon. Most of the commer-cially harvested chum salmon have been taken in the South Peninsula area, averaging about 1.1 million fish (Figure 120) from 1990 to 2004. Stock identification studies of the June chum salmon harvest in the South Peninsula area—in the 1980s with tags and in the 1990s with genetic based technology—demonstrated that the harvest was comprised of a wide mix of stocks from Asia and North America (Washington, Canadian, Southeast Alaska, Central Alaska, and Western Alas-ka). From 1990 to 2003, the commercial harvest of chum salmon from the North Peninsula area averaged only about 110,000 fish.
The all species commercial harvests of salmon in the Peninsula–Aleutians prior to statehood peaked in the 1930s at about 10 million fish (Figure 117, Panel F). Salmon harvests decreased to levels of about 3.6 million fish in the 1960s and about 4 million fish in the 1970s. Harvests from the Peninsula–Aleutians have been about 13.1 million fish in the 1980s, about 15.1 million fish in the 1990s and about 9.7 million fish since 2000 (Figure 117, Panel F).
Over the last several decades, the commercial salmon fishery in the Peninsula–Aleutians has become one of the most heavily regulated salmon fisheries in Alaska. Salmon fisheries in this part of Alaska have been intensely scrutinized and regulated through the Alaska Board of Fisheries process due to concerns from various user groups from other parts of Alaska. They are concerned because so many stocks of salmon pass through the area and are potentially subject to interception by these fisheries. For instance, for many years, the sockeye salmon harvests in the month of June were limited to a percentage of the annual fore-cast of abundance of Bristol Bay sockeye salmon. As another example, for many years a limit on the numbers of chum salmon that could be annually har-vested was placed on the fishery due to concerns for chum salmon in other parts of Western Alaska. The
ADF&G Division of Commercial Fisheries salmon managers in the Peninsula–Aleutians carefully track salmon harvest and escapement trends and regulate these fisheries according to Alaska Board of Fisher-ies approved management plans on an inseason basis. These salmon managers issue more emergency orders than any other salmon fishery in Alaska. From 2000 to 2004, these managers issued an average of 148 emergency orders per year for inseason management of Peninsula–Aleutian salmon fisheries, ranging from 111 emergency orders issued in 2004 to 173 emergency orders issued in 2002.
Other Salmon HarvestsThe ADF&G Division of Commercial Fisheries man-ages the Peninsula–Aleutians subsistence salmon fishery. The commercial fishery management staff issued one emergency order specific to the salmon subsistence fishery in the Peninsula–Aleutians area during the 5-year period from 2000 to 2004. Docu-mented harvests from 1985 to 2003 averaged about 30,000 fish and ranged from about 18,000 fish in 1985 to about 38,000 fish in 1997 (Figure 121). About 55% of the subsistence harvest was comprised of sockeye salmon, followed by coho salmon (22%), pink salmon (14%), chum salmon (8%), and Chinook salmon (1%). The subsistence harvest is minor in comparison to the commercial harvest; ratios of commercial to subsis-tence harvests during the period of 1985 to 2003 were about 430:1 overall; and by species, were about 50:1 for Chinook salmon, about 250:1 for sockeye salmon, about 60:1 for coho salmon, about 1,500:1 for pink salmon, and about 600:1 for chum salmon.
A minor level of sport harvest of salmon takes place in the Peninsula–Aleutians. Sport harvests in the Peninsula–Aleutians averaged about 11,000 fish during the 1980s and 1990s. Sport harvests in the Pen-insula–Aleutians since 2000 averaged about 8,000 fish (Table 25). The ratio of commercial to sport harvest of salmon in the Peninsula–Aleutians since 2000 has been about 1,000:1, and by species, has been about 20:1 for Chinook salmon, about 1,500:1 for sockeye salmon, about 70:1 for coho salmon, and about 3,000:1 for both pink and chum salmon.
Commercial Salmon Fishery UsersAs of August 31, 2005, there were 396 Area M limited entry permits valid for salmon fishing in the Penin-sula–Aleutians, 162 (41%) drift gillnet permits, 119 (30%) purse seine permits, and 115 (29%) set gillnet permits (Table 4). Participation by all 3 gear groups
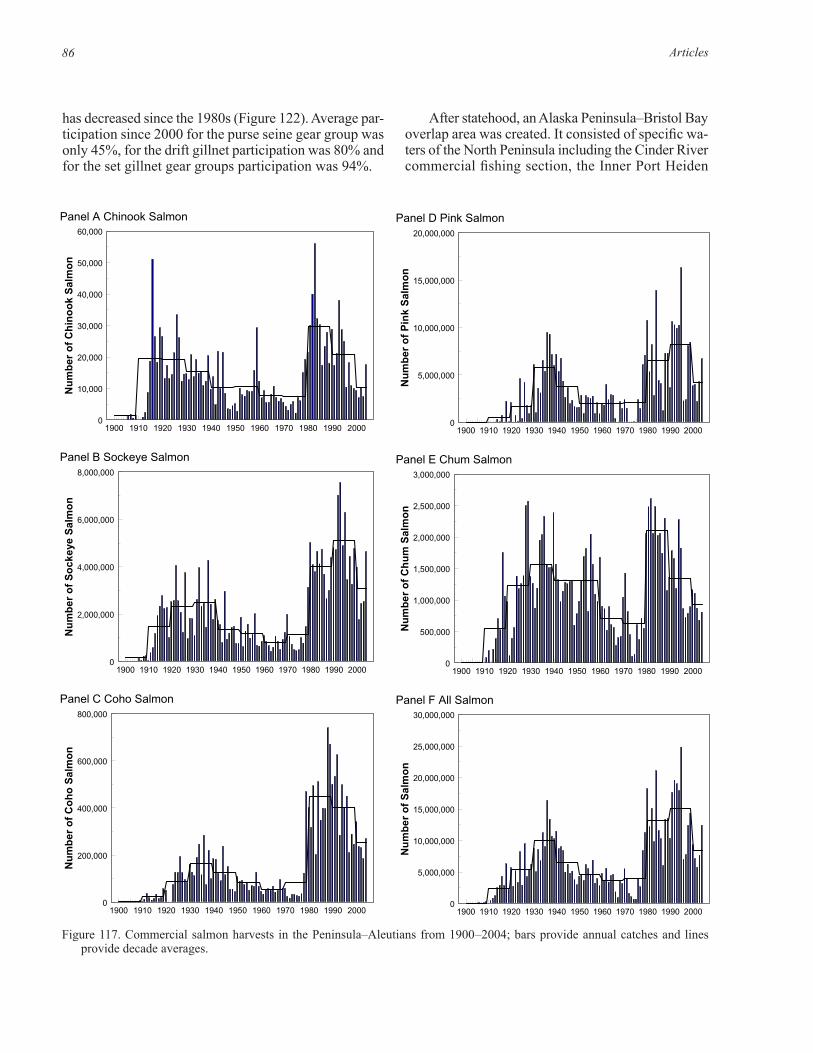
Articles86 87The Commercial Salmon Fishery in Alaska • Clark, McGregor, Mecum, Krasnowski and Carroll
has decreased since the 1980s (Figure 122). Average par-ticipation since 2000 for the purse seine gear group was only 45%, for the drift gillnet participation was 80% and for the set gillnet gear groups participation was 94%.
After statehood, an Alaska Peninsula–Bristol Bay overlap area was created. It consisted of specific wa-ters of the North Peninsula including the Cinder River commercial fishing section, the Inner Port Heiden
120
Panel D Pink Salmon
1900 1910 1920 1930 1940 1950 1960 1970 1980 1990 20000
5,000,000
10,000,000
15,000,000
20,000,000
Nu
mb
er o
f P
ink
Sal
mo
n
Panel E Chum Salmon
1900 1910 1920 1930 1940 1950 1960 1970 1980 1990 20000
500,000
1,000,000
1,500,000
2,000,000
2,500,000
3,000,000
Nu
mb
er o
f C
hu
m S
alm
on
Panel F All Salmon
1900 1910 1920 1930 1940 1950 1960 1970 1980 1990 20000
5,000,000
10,000,000
15,000,000
20,000,000
25,000,000
30,000,000
Nu
mb
er o
f S
alm
on
Figure PEN-1. Commercial salmon harvests in the Peninsula-Aleutians from 1900-2004; bars provide annual catches and lines provide decade averages.
Figure 117. Commercial salmon harvests in the Peninsula–Aleutians from 1900 –2004; bars provide annual catches and lines provide decade averages.
119
Panel A Chinook Salmon
1900 1910 1920 1930 1940 1950 1960 1970 1980 1990 20000
10,000
20,000
30,000
40,000
50,000
60,000
Nu
mb
er o
f C
hin
oo
k S
alm
on
Panel B Sockeye Salmon
1900 1910 1920 1930 1940 1950 1960 1970 1980 1990 20000
2,000,000
4,000,000
6,000,000
8,000,000
Nu
mb
er o
f S
ock
eye
Sal
mo
n
Panel C Coho Salmon
1900 1910 1920 1930 1940 1950 1960 1970 1980 1990 20000
200,000
400,000
600,000
800,000
Nu
mb
er o
f C
oh
o S
alm
on
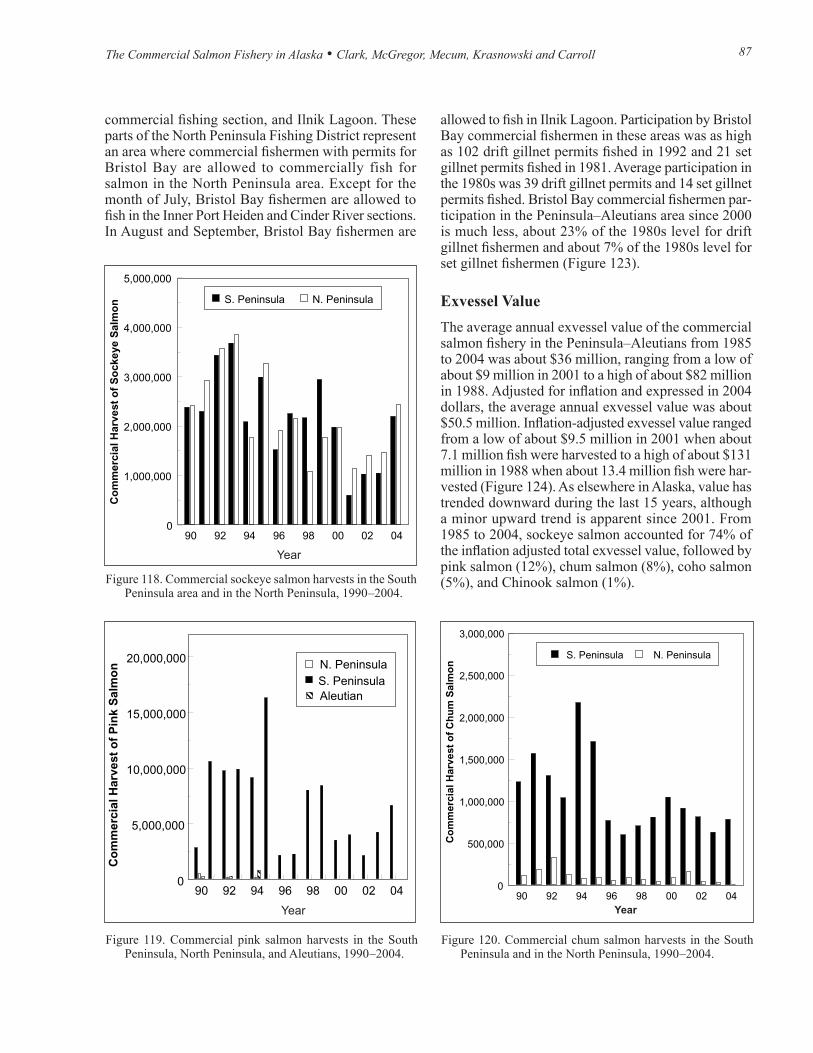
Articles86 87The Commercial Salmon Fishery in Alaska • Clark, McGregor, Mecum, Krasnowski and Carroll
Figure 118. Commercial sockeye salmon harvests in the South Peninsula area and in the North Peninsula, 1990 –2004.
Figure 119. Commercial pink salmon harvests in the South Peninsula, North Peninsula, and Aleutians, 1990 –2004.
121
Figure PEN-2. Commercial sockeye salmon harvests in the South Peninsula area and in the North Peninsula, 1990-2004.
90 92 94 96 98 00 02 04 0
1,000,000
2,000,000
3,000,000
4,000,000
5,000,000
Co
mm
erci
al H
arve
st o
f S
ock
eye
Sal
mo
n S. Peninsula N. Peninsula
Year
Figure PEN-3. Commercial pink salmon harvests in the South Peninsula, North Peninsula, and Aleutians, 1990-2004.
90 92 94 96 98 00 02 040
5,000,000
10,000,000
15,000,000
20,000,000
Co
mm
erci
al H
arve
st o
f P
ink
Sal
mo
n
S. PeninsulaN. Peninsula
Aleutian
Year
Figure 120. Commercial chum salmon harvests in the South Peninsula and in the North Peninsula, 1990 –2004.
123
Figure PEN-4. Commercial chum salmon harvests in the South Peninsula and in the North Peninsula, 1990-2004.
90 92 94 96 98 00 02 040
500,000
1,000,000
1,500,000
2,000,000
2,500,000
3,000,000
Co
mm
erci
al H
arve
st o
f C
hu
m S
alm
on
S. Peninsula N. Peninsula
Year
commercial fishing section, and Ilnik Lagoon. These parts of the North Peninsula Fishing District represent an area where commercial fishermen with permits for Bristol Bay are allowed to commercially fish for salmon in the North Peninsula area. Except for the month of July, Bristol Bay fishermen are allowed to fish in the Inner Port Heiden and Cinder River sections. In August and September, Bristol Bay fishermen are
allowed to fish in Ilnik Lagoon. Participation by Bristol Bay commercial fishermen in these areas was as high as 102 drift gillnet permits fished in 1992 and 21 set gillnet permits fished in 1981. Average participation in the 1980s was 39 drift gillnet permits and 14 set gillnet permits fished. Bristol Bay commercial fishermen par-ticipation in the Peninsula–Aleutians area since 2000 is much less, about 23% of the 1980s level for drift gillnet fishermen and about 7% of the 1980s level for set gillnet fishermen (Figure 123).
Exvessel ValueThe average annual exvessel value of the commercial salmon fishery in the Peninsula–Aleutians from 1985 to 2004 was about $36 million, ranging from a low of about $9 million in 2001 to a high of about $82 million in 1988. Adjusted for inflation and expressed in 2004 dollars, the average annual exvessel value was about $50.5 million. Inflation-adjusted exvessel value ranged from a low of about $9.5 million in 2001 when about 7.1 million fish were harvested to a high of about $131 million in 1988 when about 13.4 million fish were har-vested (Figure 124). As elsewhere in Alaska, value has trended downward during the last 15 years, although a minor upward trend is apparent since 2001. From 1985 to 2004, sockeye salmon accounted for 74% of the inflation adjusted total exvessel value, followed by pink salmon (12%), chum salmon (8%), coho salmon (5%), and Chinook salmon (1%).
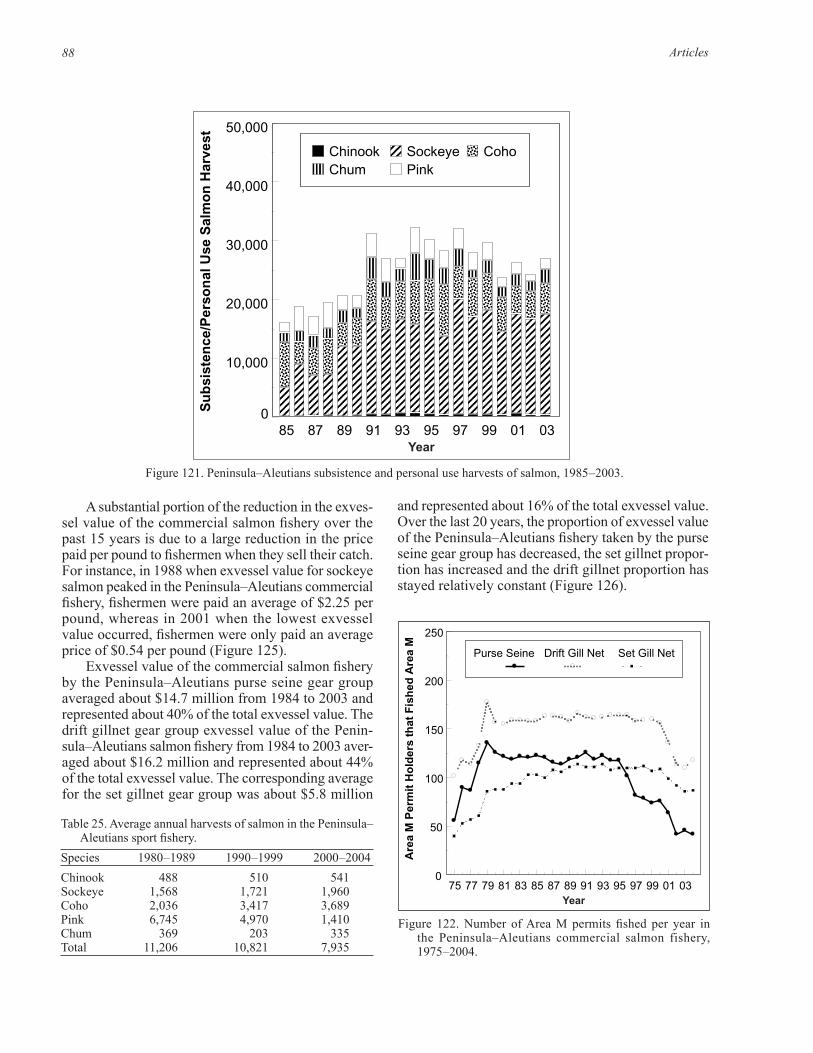
Articles88 89The Commercial Salmon Fishery in Alaska • Clark, McGregor, Mecum, Krasnowski and Carroll
Figure 122. Number of Area M permits fished per year in the Peninsula–Aleutians commercial salmon fishery, 1975 –2004.
Figure PEN-6. Number of Area M permits fished per year in the Peninsula-Aleutians commercial salmon fishery, 1975-2004.
75 77 79 81 83 85 87 89 91 93 95 97 99 01 030
50
100
150
200
250
Purse Seine Drift Gill Net Set Gill Net
Are
aM
Per
mit
Ho
lder
sth
atF
ish
edA
rea
M
Year
Table 25. Average annual harvests of salmon in the Peninsula–Aleutians sport fishery.
Species 1980 –1989 1990 –1999 2000 –2004Chinook 488 510 541Sockeye 1,568 1,721 1,960Coho 2,036 3,417 3,689Pink 6,745 4,970 1,410Chum 369 203 335Total 11,206 10,821 7,935
A substantial portion of the reduction in the exves-sel value of the commercial salmon fishery over the past 15 years is due to a large reduction in the price paid per pound to fishermen when they sell their catch. For instance, in 1988 when exvessel value for sockeye salmon peaked in the Peninsula–Aleutians commercial fishery, fishermen were paid an average of $2.25 per pound, whereas in 2001 when the lowest exvessel value occurred, fishermen were only paid an average price of $0.54 per pound (Figure 125).
Exvessel value of the commercial salmon fishery by the Peninsula–Aleutians purse seine gear group averaged about $14.7 million from 1984 to 2003 and represented about 40% of the total exvessel value. The drift gillnet gear group exvessel value of the Penin-sula–Aleutians salmon fishery from 1984 to 2003 aver-aged about $16.2 million and represented about 44% of the total exvessel value. The corresponding average for the set gillnet gear group was about $5.8 million
Figure 121. Peninsula–Aleutians subsistence and personal use harvests of salmon, 1985 –2003.
Figure PEN-5. Peninsula-Aleutians subsistence and personal use harvests of salmon, 1985-2003.
85 87 89 91 93 95 97 99 01 030
10,000
20,000
30,000
40,000
50,000
Su
bsi
sten
ce/P
erso
nal
Use
Sal
mo
n H
arve
st
Chinook Sockeye CohoChum Pink
Year
and represented about 16% of the total exvessel value. Over the last 20 years, the proportion of exvessel value of the Peninsula–Aleutians fishery taken by the purse seine gear group has decreased, the set gillnet propor-tion has increased and the drift gillnet proportion has stayed relatively constant (Figure 126).
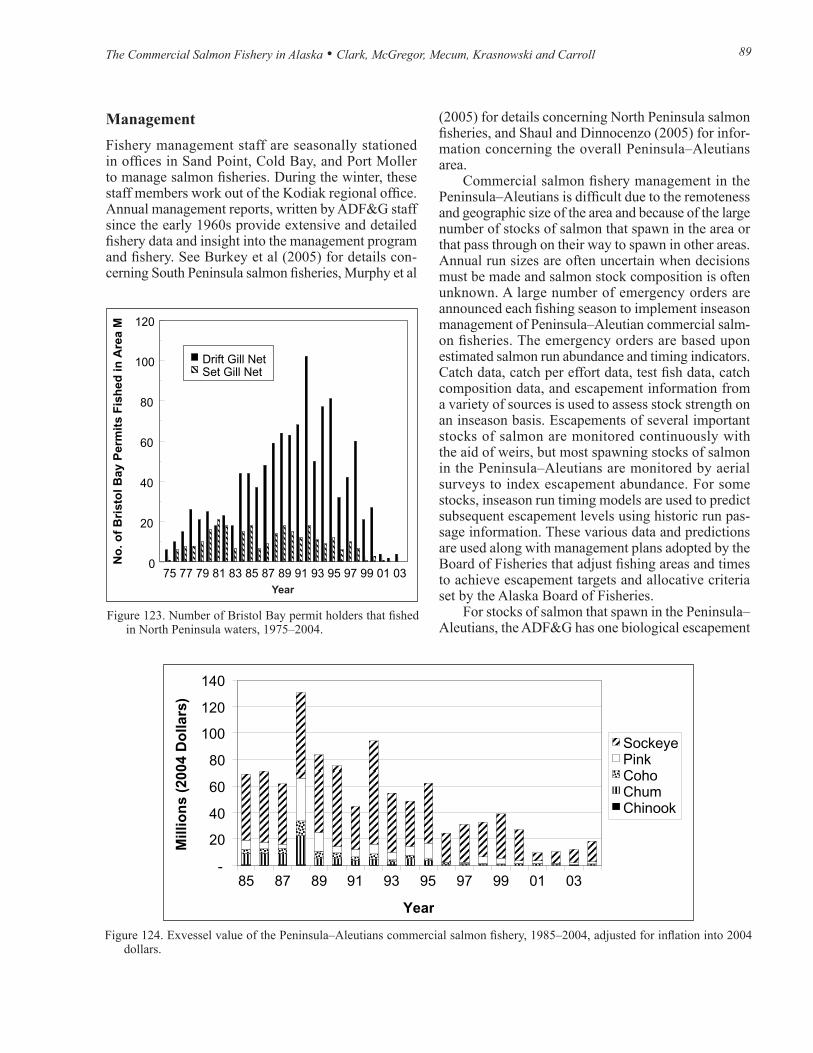
Articles88 89The Commercial Salmon Fishery in Alaska • Clark, McGregor, Mecum, Krasnowski and Carroll
Figure 123. Number of Bristol Bay permit holders that fished in North Peninsula waters, 1975–2004.
Figure PEN-7. Number of Bristol Bay permit holders that fished in North Peninsula waters, 1975-2004.
75 77 79 81 83 85 87 89 91 93 95 97 99 01 030
20
40
60
80
100
120
No
. of
Br i
sto
l Bay
Per
mit
s F
ish
ed in
Are
a M
Drift Gill NetSet Gill Net
Year
Figure 124. Exvessel value of the Peninsula–Aleutians commercial salmon fishery, 1985–2004, adjusted for inflation into 2004 dollars.
Figure PEN-8. Exvessel value of the Peninsula-Aleutians commercial salmon fishery, 1985-2004, adjusted for inflation into 2004 dollars.
Exvessel value-AK Peninsula/Aleutian Islands (adjusted for inflation)
-
20
40
60
80
100
120
140
85 87 89 91 93 95 97 99 01 03
Year
SockeyePinkCohoChumChinook
Mill
ion
s (2
004
Do
llars
)
ManagementFishery management staff are seasonally stationed in offices in Sand Point, Cold Bay, and Port Moller to manage salmon fisheries. During the winter, these staff members work out of the Kodiak regional office. Annual management reports, written by ADF&G staff since the early 1960s provide extensive and detailed fishery data and insight into the management program and fishery. See Burkey et al (2005) for details con-cerning South Peninsula salmon fisheries, Murphy et al
(2005) for details concerning North Peninsula salmon fisheries, and Shaul and Dinnocenzo (2005) for infor-mation concerning the overall Peninsula–Aleutians area.
Commercial salmon fishery management in the Peninsula–Aleutians is difficult due to the remoteness and geographic size of the area and because of the large number of stocks of salmon that spawn in the area or that pass through on their way to spawn in other areas. Annual run sizes are often uncertain when decisions must be made and salmon stock composition is often unknown. A large number of emergency orders are announced each fishing season to implement inseason management of Peninsula–Aleutian commercial salm-on fisheries. The emergency orders are based upon estimated salmon run abundance and timing indicators. Catch data, catch per effort data, test fish data, catch composition data, and escapement information from a variety of sources is used to assess stock strength on an inseason basis. Escapements of several important stocks of salmon are monitored continuously with the aid of weirs, but most spawning stocks of salmon in the Peninsula–Aleutians are monitored by aerial surveys to index escapement abundance. For some stocks, inseason run timing models are used to predict subsequent escapement levels using historic run pas-sage information. These various data and predictions are used along with management plans adopted by the Board of Fisheries that adjust fishing areas and times to achieve escapement targets and allocative criteria set by the Alaska Board of Fisheries.
For stocks of salmon that spawn in the Peninsula–Aleutians, the ADF&G has one biological escapement
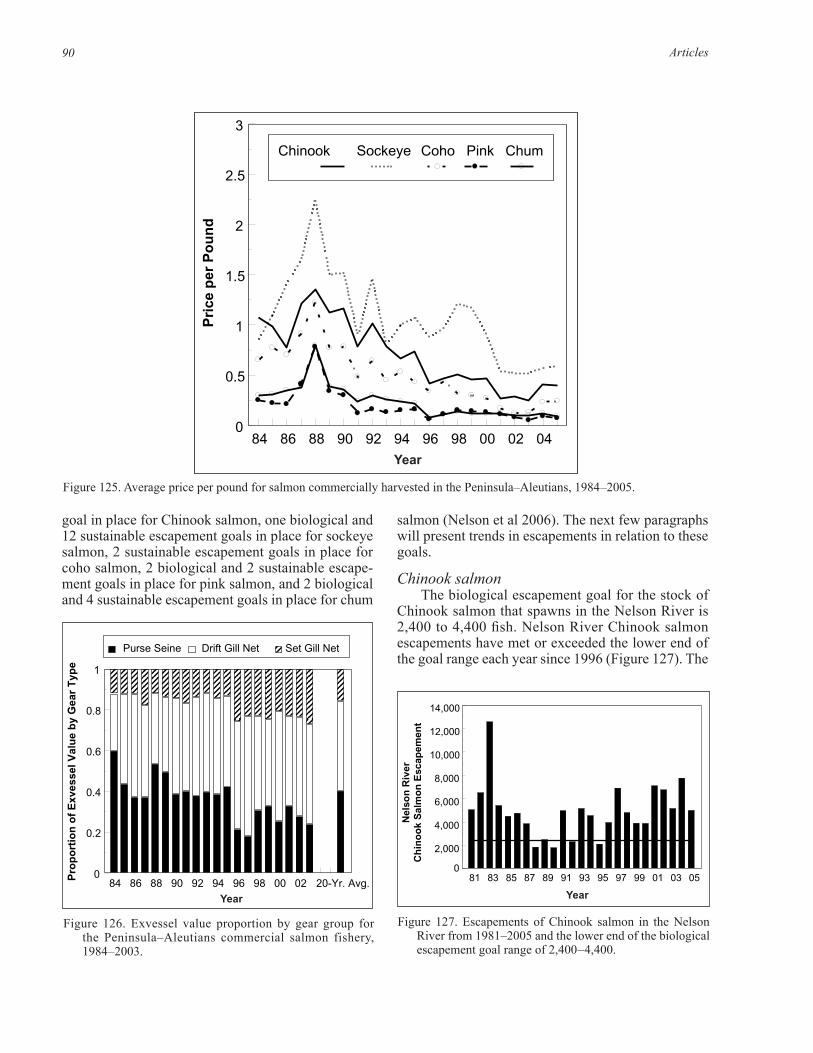
Articles90 91The Commercial Salmon Fishery in Alaska • Clark, McGregor, Mecum, Krasnowski and Carroll
Figure 127. Escapements of Chinook salmon in the Nelson River from 1981–2005 and the lower end of the biological escapement goal range of 2,400 – 4,400.
Figure Pen-11. Escapements of Chinook salmon in the Nelson River from 1981-2005 and the lower end of the biological escapement goal range of 2,400-4,400.
81 83 85 87 89 91 93 95 97 99 01 03 05 0
2,000
4,000
6,000
8,000
10,000
12,000
14,000
Nel
son
Riv
er
Ch
ino
ok
Sal
mo
n E
scap
emen
t
Year
Figure 126. Exvessel value proportion by gear group for the Peninsula–Aleutians commercial salmon fishery, 1984 –2003.
Figure PEN-10. Exvessel value proportion by gear group for the Peninsula-Aleutians commercial salmon fishery, 1984-2003.
84 86 88 90 92 94 96 98 00 02 20-Yr. Avg. 0
0.2
0.4
0.6
0.8
1
Pro
po
rtio
n o
f E
xves
sel V
alu
e b
y G
ear
Typ
e
Purse Seine Drift Gill Net Set Gill Net
Year
goal in place for Chinook salmon, one biological and 12 sustainable escapement goals in place for sockeye salmon, 2 sustainable escapement goals in place for coho salmon, 2 biological and 2 sustainable escape-ment goals in place for pink salmon, and 2 biological and 4 sustainable escapement goals in place for chum
Figure 125. Average price per pound for salmon commercially harvested in the Peninsula–Aleutians, 1984 –2005.Figure PEN-9. Average price per pound for salmon commercially harvested in the Peninsula-Aleutians, 1984-2005.
84 86 88 90 92 94 96 98 00 02 040
0.5
1
1.5
2
2.5
3
Pri
ce p
er P
ou
nd
Chinook Sockeye Coho Pink Chum
Year
salmon (Nelson et al 2006). The next few paragraphs will present trends in escapements in relation to these goals.
Chinook salmonThe biological escapement goal for the stock of
Chinook salmon that spawns in the Nelson River is 2,400 to 4,400 fish. Nelson River Chinook salmon escapements have met or exceeded the lower end of the goal range each year since 1996 (Figure 127). The
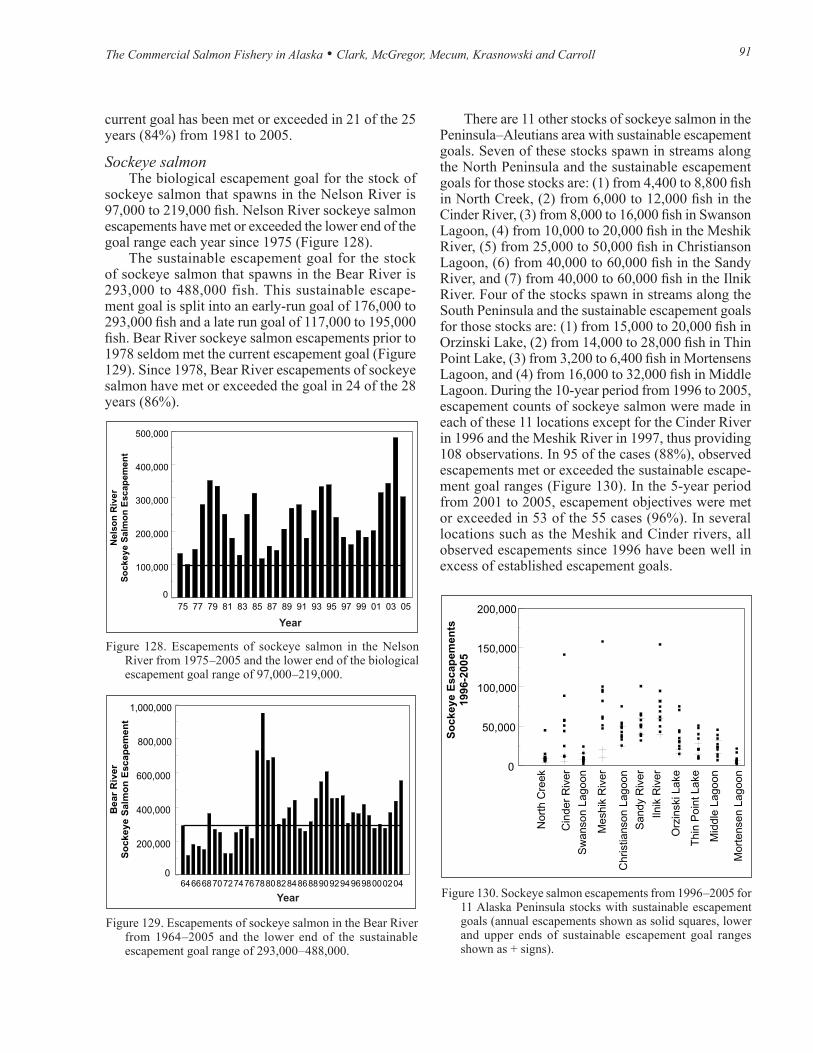
Articles90 91The Commercial Salmon Fishery in Alaska • Clark, McGregor, Mecum, Krasnowski and Carroll
Figure 128. Escapements of sockeye salmon in the Nelson River from 1975 –2005 and the lower end of the biological escapement goal range of 97,000 –219,000.
Figure Pen-12. Escapements of sockeye salmon in the Nelson River from 1975-2005 and the lower end of the biological escapement goal range of 97,000-219,000.
75 77 79 81 83 85 87 89 91 93 95 97 99 01 03 05 0
100,000
200,000
300,000
400,000
500,000
Nel
son
Riv
er
So
ckey
e S
alm
on
Esc
apem
ent
Year
Figure 129. Escapements of sockeye salmon in the Bear River from 1964 –2005 and the lower end of the sustainable escapement goal range of 293,000 – 488,000.
Figure Pen-13. Escapements of sockeye salmon in the Bear River from 1964-2005 and the lower end of the sustainable escapement goal range of 293,000-488,000.
64 66 68 70 727476788082848688909294969800 02 04 0
200,000
400,000
600,000
800,000
1,000,000
Bea
r R
iver
S
ock
eye
Sal
mo
n E
scap
emen
t
Year
current goal has been met or exceeded in 21 of the 25 years (84%) from 1981 to 2005.
Sockeye salmonThe biological escapement goal for the stock of
sockeye salmon that spawns in the Nelson River is 97,000 to 219,000 fish. Nelson River sockeye salmon escapements have met or exceeded the lower end of the goal range each year since 1975 (Figure 128).
The sustainable escapement goal for the stock of sockeye salmon that spawns in the Bear River is 293,000 to 488,000 fish. This sustainable escape-ment goal is split into an early-run goal of 176,000 to 293,000 fish and a late run goal of 117,000 to 195,000 fish. Bear River sockeye salmon escapements prior to 1978 seldom met the current escapement goal (Figure 129). Since 1978, Bear River escapements of sockeye salmon have met or exceeded the goal in 24 of the 28 years (86%).
There are 11 other stocks of sockeye salmon in the Peninsula–Aleutians area with sustainable escapement goals. Seven of these stocks spawn in streams along the North Peninsula and the sustainable escapement goals for those stocks are: (1) from 4,400 to 8,800 fish in North Creek, (2) from 6,000 to 12,000 fish in the Cinder River, (3) from 8,000 to 16,000 fish in Swanson Lagoon, (4) from 10,000 to 20,000 fish in the Meshik River, (5) from 25,000 to 50,000 fish in Christianson Lagoon, (6) from 40,000 to 60,000 fish in the Sandy River, and (7) from 40,000 to 60,000 fish in the Ilnik River. Four of the stocks spawn in streams along the South Peninsula and the sustainable escapement goals for those stocks are: (1) from 15,000 to 20,000 fish in Orzinski Lake, (2) from 14,000 to 28,000 fish in Thin Point Lake, (3) from 3,200 to 6,400 fish in Mortensens Lagoon, and (4) from 16,000 to 32,000 fish in Middle Lagoon. During the 10-year period from 1996 to 2005, escapement counts of sockeye salmon were made in each of these 11 locations except for the Cinder River in 1996 and the Meshik River in 1997, thus providing 108 observations. In 95 of the cases (88%), observed escapements met or exceeded the sustainable escape-ment goal ranges (Figure 130). In the 5-year period from 2001 to 2005, escapement objectives were met or exceeded in 53 of the 55 cases (96%). In several locations such as the Meshik and Cinder rivers, all observed escapements since 1996 have been well in excess of established escapement goals.
Figure 130. Sockeye salmon escapements from 1996 –2005 for 11 Alaska Peninsula stocks with sustainable escapement goals (annual escapements shown as solid squares, lower and upper ends of sustainable escapement goal ranges shown as + signs).
Figure Pen-14. Sockeye salmon escapements from 1996-2005 for eleven Alaska Peninsula stocks with sustainable escapement goals (annual escapements shown as solid squares, lower and upper ends of sustainable escapement goal ranges shown as + signs).
Nor
th C
reek
Cin
der
Riv
er
Sw
anso
n La
goon
Mes
hik
Riv
er
Chr
istia
nson
Lag
oon
San
dy R
iver
Ilnik
Riv
er
Orz
insk
i Lak
e
Thi
n P
oint
Lak
e
Mid
dle
Lago
on
Mor
tens
en L
agoo
n 0
50,000
100,000
150,000
200,000
So
ckey
e E
scap
emen
ts
1996
-200
5
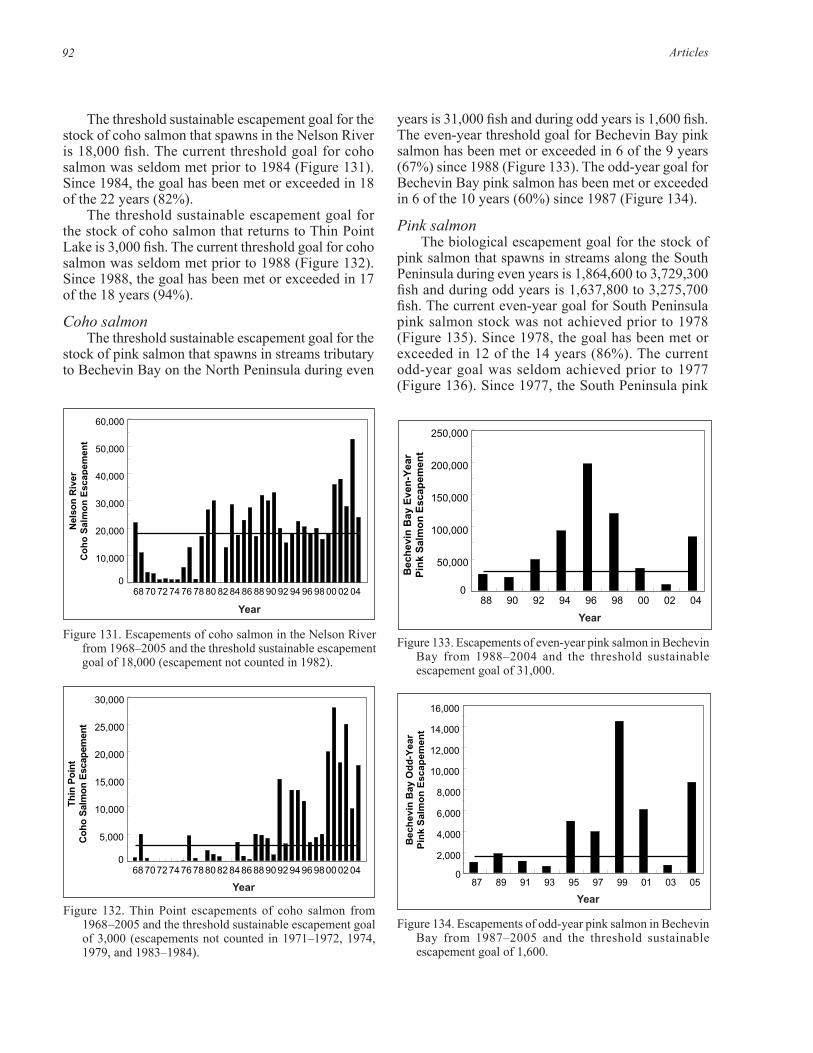
Articles92 93The Commercial Salmon Fishery in Alaska • Clark, McGregor, Mecum, Krasnowski and Carroll
The threshold sustainable escapement goal for the stock of coho salmon that spawns in the Nelson River is 18,000 fish. The current threshold goal for coho salmon was seldom met prior to 1984 (Figure 131). Since 1984, the goal has been met or exceeded in 18 of the 22 years (82%).
The threshold sustainable escapement goal for the stock of coho salmon that returns to Thin Point Lake is 3,000 fish. The current threshold goal for coho salmon was seldom met prior to 1988 (Figure 132). Since 1988, the goal has been met or exceeded in 17 of the 18 years (94%).
Coho salmonThe threshold sustainable escapement goal for the
stock of pink salmon that spawns in streams tributary to Bechevin Bay on the North Peninsula during even
Figure 131. Escapements of coho salmon in the Nelson River from 1968–2005 and the threshold sustainable escapement goal of 18,000 (escapement not counted in 1982).
Figure Pen-15. Escapements of coho salmon in the Nelson River from 1968-2005 and the threshold sustainable escapement goal of 18,000 (escapement not enumerated in 1982).
68 70 72 74 76 78 80 82 84 86 88 90 92 94 96 98 00 02 04 0
10,000
20,000
30,000
40,000
50,000
60,000
Nel
son
Riv
er
Co
ho
Sal
mo
n E
scap
emen
t
Year
Figure 133. Escapements of even-year pink salmon in Bechevin Bay from 1988–2004 and the threshold sustainable escapement goal of 31,000.
Figure Pen-17. Escapements of even-year pink salmon in Bechevin Bay from 1988-2004 and the threshold sustainable escapement goal of 31,000.
88 90 92 94 96 98 00 02 040
50,000
100,000
150,000
200,000
250,000
Bec
hev
in B
ay E
ven
-Yea
r P
ink
Sal
mo
n E
scap
emen
t
Year
Figure 132. Thin Point escapements of coho salmon from 1968 –2005 and the threshold sustainable escapement goal of 3,000 (escapements not counted in 1971–1972, 1974, 1979, and 1983–1984).
Figure Pen-16. Thin Point escapements of coho salmon from 1968-2005 and the threshold sustainable escapement goal of 3,000 (escapements not enumerated in 1971-1972, 1974, 1979, and 1983-1984).
68 70727476 7880828486889092 94969800 02040
5,000
10,000
15,000
20,000
25,000
30,000
Thin
Poi
nt
Co
ho
Sal
mo
n E
scap
emen
t
Year
Figure 134. Escapements of odd-year pink salmon in Bechevin Bay from 1987–2005 and the threshold sustainable escapement goal of 1,600.
Figure Pen-18. Escapements of odd-year pink salmon in Bechevin Bay from 1987-2005 and the threshold sustainable escapement goal of 1,600.
87 89 91 93 95 97 99 01 03 050
2,000
4,000
6,000
8,000
10,000
12,000
14,000
16,000
Bec
hev
in B
ay O
dd
-Yea
r P
ink
Sal
mo
n E
scap
emen
t
Year
years is 31,000 fish and during odd years is 1,600 fish. The even-year threshold goal for Bechevin Bay pink salmon has been met or exceeded in 6 of the 9 years (67%) since 1988 (Figure 133). The odd-year goal for Bechevin Bay pink salmon has been met or exceeded in 6 of the 10 years (60%) since 1987 (Figure 134).
Pink salmonThe biological escapement goal for the stock of
pink salmon that spawns in streams along the South Peninsula during even years is 1,864,600 to 3,729,300 fish and during odd years is 1,637,800 to 3,275,700 fish. The current even-year goal for South Peninsula pink salmon stock was not achieved prior to 1978 (Figure 135). Since 1978, the goal has been met or exceeded in 12 of the 14 years (86%). The current odd-year goal was seldom achieved prior to 1977 (Figure 136). Since 1977, the South Peninsula pink
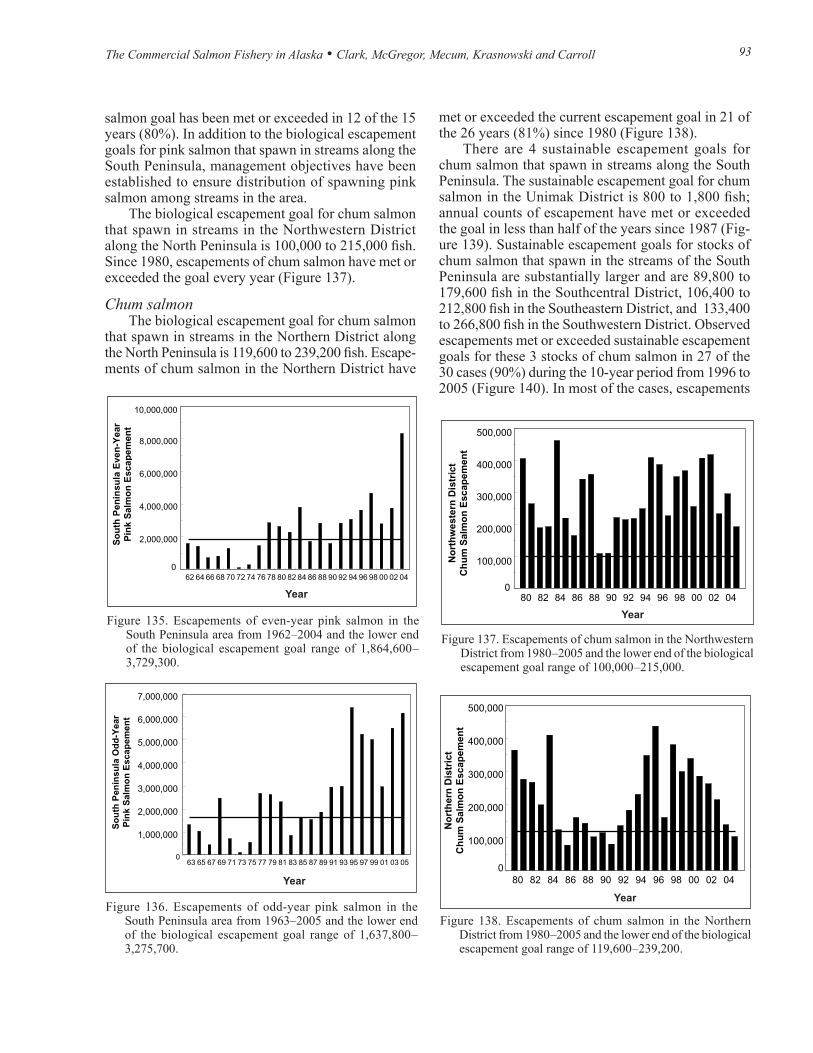
Articles92 93The Commercial Salmon Fishery in Alaska • Clark, McGregor, Mecum, Krasnowski and Carroll
Figure 135. Escapements of even-year pink salmon in the South Peninsula area from 1962–2004 and the lower end of the biological escapement goal range of 1,864,600 –3,729,300.
Figure Pen-19. Escapements of even-year pink salmon in the South Peninsula area from 1962-2004 and the lower end of the biological escapement goal range of 1,864,600-3,729,300.
62 64 66 68 70 72 74 76 78 80 82 84 86 88 90 92 94 96 98 00 02 040
2,000,000
4,000,000
6,000,000
8,000,000
10,000,000
So
uth
Pen
insu
la E
ven
-Yea
r P
ink
Sal
mo
n E
scap
emen
t
Year
Figure 136. Escapements of odd-year pink salmon in the South Peninsula area from 1963–2005 and the lower end of the biological escapement goal range of 1,637,800 –3,275,700.
Figure Pen-20. Escapements of odd-year pink salmon in the South Peninsula area from 1963-2005 and the lower end of the biological escapement goal range of 1,637,800-3,275,700.
63 65 67 69 71 73 75 77 79 81 83 85 87 89 91 93 95 97 99 01 03 050
1,000,000
2,000,000
3,000,000
4,000,000
5,000,000
6,000,000
7,000,000
So
uth
Pen
insu
la O
dd
-Yea
r P
ink
Sal
mo
n E
scap
emen
t
Year
Figure 137. Escapements of chum salmon in the Northwestern District from 1980 –2005 and the lower end of the biological escapement goal range of 100,000 –215,000.
Figure Pen-21. Escapements of chum salmon in the Northwestern District from 1980-2005 and the lower end of the biological escapement goal range of 100,000-215,000.
80 82 84 86 88 90 92 94 96 98 00 02 040
100,000
200,000
300,000
400,000
500,000
No
rth
wes
tern
Dis
tric
t C
hu
m S
alm
on
Esc
apem
ent
Year
salmon goal has been met or exceeded in 12 of the 15 years (80%). In addition to the biological escapement goals for pink salmon that spawn in streams along the South Peninsula, management objectives have been established to ensure distribution of spawning pink salmon among streams in the area.
The biological escapement goal for chum salmon that spawn in streams in the Northwestern District along the North Peninsula is 100,000 to 215,000 fish. Since 1980, escapements of chum salmon have met or exceeded the goal every year (Figure 137).
Chum salmonThe biological escapement goal for chum salmon
that spawn in streams in the Northern District along the North Peninsula is 119,600 to 239,200 fish. Escape-ments of chum salmon in the Northern District have
met or exceeded the current escapement goal in 21 of the 26 years (81%) since 1980 (Figure 138).
There are 4 sustainable escapement goals for chum salmon that spawn in streams along the South Peninsula. The sustainable escapement goal for chum salmon in the Unimak District is 800 to 1,800 fish; annual counts of escapement have met or exceeded the goal in less than half of the years since 1987 (Fig-ure 139). Sustainable escapement goals for stocks of chum salmon that spawn in the streams of the South Peninsula are substantially larger and are 89,800 to 179,600 fish in the Southcentral District, 106,400 to 212,800 fish in the Southeastern District, and 133,400 to 266,800 fish in the Southwestern District. Observed escapements met or exceeded sustainable escapement goals for these 3 stocks of chum salmon in 27 of the 30 cases (90%) during the 10-year period from 1996 to 2005 (Figure 140). In most of the cases, escapements
Figure 138. Escapements of chum salmon in the Northern District from 1980 –2005 and the lower end of the biological escapement goal range of 119,600 –239,200.
Figure Pen-22. Escapements of chum salmon in the Northern District from 1980-2005 and the lower end of the biological escapement goal range of 119,600-239,200.
80 82 84 86 88 90 92 94 96 98 00 02 040
100,000
200,000
300,000
400,000
500,000
No
rth
ern
Dis
tric
t C
hu
m S
alm
on
Esc
apem
ent
Year
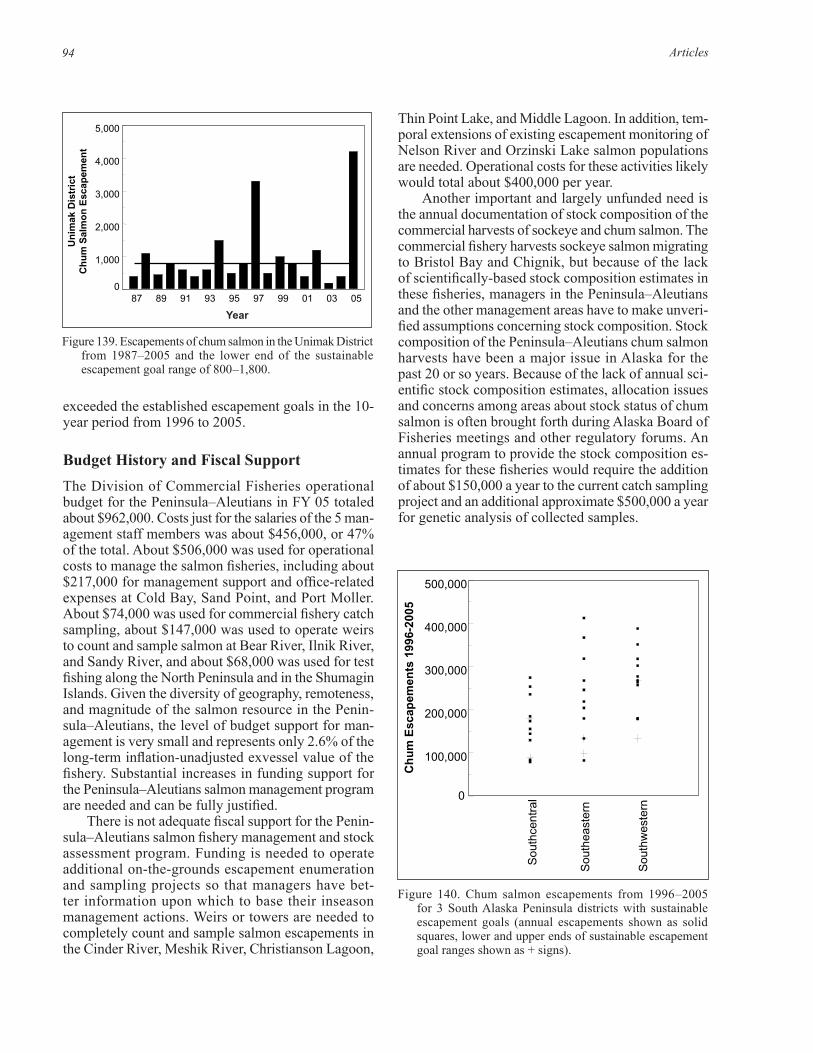
Articles94
exceeded the established escapement goals in the 10-year period from 1996 to 2005.
Budget History and Fiscal SupportThe Division of Commercial Fisheries operational budget for the Peninsula–Aleutians in FY 05 totaled about $962,000. Costs just for the salaries of the 5 man-agement staff members was about $456,000, or 47% of the total. About $506,000 was used for operational costs to manage the salmon fisheries, including about $217,000 for management support and office-related expenses at Cold Bay, Sand Point, and Port Moller. About $74,000 was used for commercial fishery catch sampling, about $147,000 was used to operate weirs to count and sample salmon at Bear River, Ilnik River, and Sandy River, and about $68,000 was used for test fishing along the North Peninsula and in the Shumagin Islands. Given the diversity of geography, remoteness, and magnitude of the salmon resource in the Penin-sula–Aleutians, the level of budget support for man-agement is very small and represents only 2.6% of the long-term inflation-unadjusted exvessel value of the fishery. Substantial increases in funding support for the Peninsula–Aleutians salmon management program are needed and can be fully justified.
There is not adequate fiscal support for the Penin-sula–Aleutians salmon fishery management and stock assessment program. Funding is needed to operate additional on-the-grounds escapement enumeration and sampling projects so that managers have bet-ter information upon which to base their inseason management actions. Weirs or towers are needed to completely count and sample salmon escapements in the Cinder River, Meshik River, Christianson Lagoon,
Figure 140. Chum salmon escapements from 1996 –2005 for 3 South Alaska Peninsula districts with sustainable escapement goals (annual escapements shown as solid squares, lower and upper ends of sustainable escapement goal ranges shown as + signs).Figure Pen-24. Chum salmon escapements from 1996-2005 for three South Alaska
Peninsula districts with sustainable escapement goals (annual escapements shown as solid squares, lower and upper ends of sustainable escapement goal ranges shown as + signs).
Sou
thce
ntra
l
Sou
thea
ster
n
Sou
thw
este
rn
0
100,000
200,000
300,000
400,000
500,000
Ch
um
Esc
apem
ents
199
6-20
05
Thin Point Lake, and Middle Lagoon. In addition, tem-poral extensions of existing escapement monitoring of Nelson River and Orzinski Lake salmon populations are needed. Operational costs for these activities likely would total about $400,000 per year.
Another important and largely unfunded need is the annual documentation of stock composition of the commercial harvests of sockeye and chum salmon. The commercial fishery harvests sockeye salmon migrating to Bristol Bay and Chignik, but because of the lack of scientifically-based stock composition estimates in these fisheries, managers in the Peninsula–Aleutians and the other management areas have to make unveri-fied assumptions concerning stock composition. Stock composition of the Peninsula–Aleutians chum salmon harvests have been a major issue in Alaska for the past 20 or so years. Because of the lack of annual sci-entific stock composition estimates, allocation issues and concerns among areas about stock status of chum salmon is often brought forth during Alaska Board of Fisheries meetings and other regulatory forums. An annual program to provide the stock composition es-timates for these fisheries would require the addition of about $150,000 a year to the current catch sampling project and an additional approximate $500,000 a year for genetic analysis of collected samples.
Figure 139. Escapements of chum salmon in the Unimak District from 1987–2005 and the lower end of the sustainable escapement goal range of 800 –1,800.
Figure Pen-23. Escapements of chum salmon in the Unimak District from 1987-2005 and the lower end of the sustainable escapement goal range of 800-1,800.
87 89 91 93 95 97 99 01 03 050
1,000
2,000
3,000
4,000
5,000
Un
imak
Dis
tric
t C
hu
m S
alm
on
Esc
apem
ent
Year
95The Commercial Salmon Fishery in Alaska • Clark, McGregor, Mecum, Krasnowski and Carroll
BRISTOL BAY COMMERCIAL SALMON FISHERY
Area Description and Gear TypesThe Division of Commercial Fisheries manages the commercial and subsistence salmon fisheries in Bristol Bay with the goal of achieving and maintaining sus-tained production. Salmon management in Bristol Bay is primarily directed at sockeye salmon that are com-mercially harvested by set and drift gillnet fishermen in the 5 discrete commercial fishing districts of Bristol Bay: the Ugashik, the Egegik, the Naknek–Kvichak, the Nushagak, and the Togiak (Figure 141). Chinook, chum, pink, and coho salmon are also harvested in Bristol Bay, but sockeye salmon are the mainstay of the fishery. There are no salmon hatcheries in Bristol Bay; a state hatchery operated for a few years in the late 1970s and early 1980s at Snake Lake, produced a few sockeye salmon and was subsequently closed. Unlike several of the other salmon fisheries, annual federal contracts to support major stock assessment and fishery management activities has not taken place to a significant degree in Bristol Bay.
History of the Commercial Salmon FisheryThe Bristol Bay salmon fishery is one of the most important commercial salmon fisheries in the world. Annual commercial harvests of salmon in Bristol Bay since statehood have averaged about 17 million sock-eye salmon (91.2% of all salmon), about 880,000 chum salmon (4.7%), about 550,000 pink salmon (3.0%), about 120,000 coho salmon (0.6%), and about 100,000 Chinook salmon (0.5%). Total annual commercial salmon harvests have averaged almost 19 million fish since 1959 ranging from a low of about 1.5 million salmon in 1973 to a high in 1995 of about 45 million salmon. Commercial harvests of sockeye salmon in Bristol Bay since 1959 have represented about 56% of the statewide commercial harvest of that species, ranging from a low of 17% in 1973 to a high of 81% in 1965. Annual management reports for Bristol Bay, written by ADF&G staff since the early 1960s provide extensive and detailed fishery data and insight into the management program and fishery. See Westing et al. (2005).
The prestatehood peak decadal commercial harvest of sockeye in Bristol Bay was in the 1910s when an an-nual average of about 17 million sockeye salmon was harvested. Average harvest of sockeye decreased to about 6 million in the 1950s. Average sockeye salmon harvests has been about 22 million fish in the 1980s,
28 million fish in the 1990s, and about 17 million fish so far in the 2000s (Figure 142, Panel B).
Harvests of Chinook salmon in Bristol Bay pre-dominantly occur in the Nushagak District because one of the largest runs of Chinook salmon in Alaska spawns in the Nushagak River. Harvests of Chinook increased from the 1940s through the mid-1980s and since then have generally decreased (Figure 142, Panel A), partially as a result of low prices. The price per pound in 1987 was $1.17, and the price per pound in 2004 was $0.37. Coho salmon are underused in Bris-tol Bay because these fish return in the fall after most commercial fishing has ceased. Further, prices paid for coho salmon are low, and the area transportation costs are high in this remote area. Harvest trends for coho salmon reflect market conditions, but are not reflec-tive of abundance (Figure 142, Panel C). In the 1980s, prices paid for coho salmon were relatively high—the price per pound in 1988 was $1.40 — and harvest sub-stantially increased. In 2004, fishermen were paid an average price of $0.31 per pound for coho salmon, which is only 22% of the price paid in the late 1980s. Bristol Bay supports large even-year pink salmon re-turns; escapements in the millions occur in rivers such as the Nushagak and Alagnak in some years. However, pink salmon are underused due to market conditions and low prices paid to fishermen—$0.09 per pound in 2004. Like coho salmon, pink salmon harvest trends (Figure 142, Panel D) are not indicative of abundance. Decadal average harvests of chum salmon in Bristol Bay have increased from a level of about 300,000 fish in the 1950s to a peak of about 1.4 million fish in the 1980s (Figure 142, Panel E). Harvests in the 1990s averaged about 820,000 fish and in the first half of the 2000s averaged about 670,000 fish. Fishermen were only paid $0.09 per pound for chum salmon in 2004.
Other Salmon HarvestsThe salmon subsistence fishery in Bristol Bay is one of the largest salmon subsistence fisheries in the State of Alaska (Figure 9). The recent 20-year average an-nual harvest in the Bristol Bay subsistence fishery was about 153,000 fish (Table 26). There has been a gradual reduction in the number of salmon harvested in the Bristol Bay subsistence fishery across the 20-year time period from 1983 to 2004 (Figure 143). Sockeye salmon represent about 80% of the subsistence harvest. While by Alaska standards the Bristol Bay subsistence fishery is large, the harvest is minor in comparison to the commercial harvest. The ratio of commercial harvest to subsistence harvest for Bristol Bay salmon during the last 20 years is about 160:1; sockeye salmon
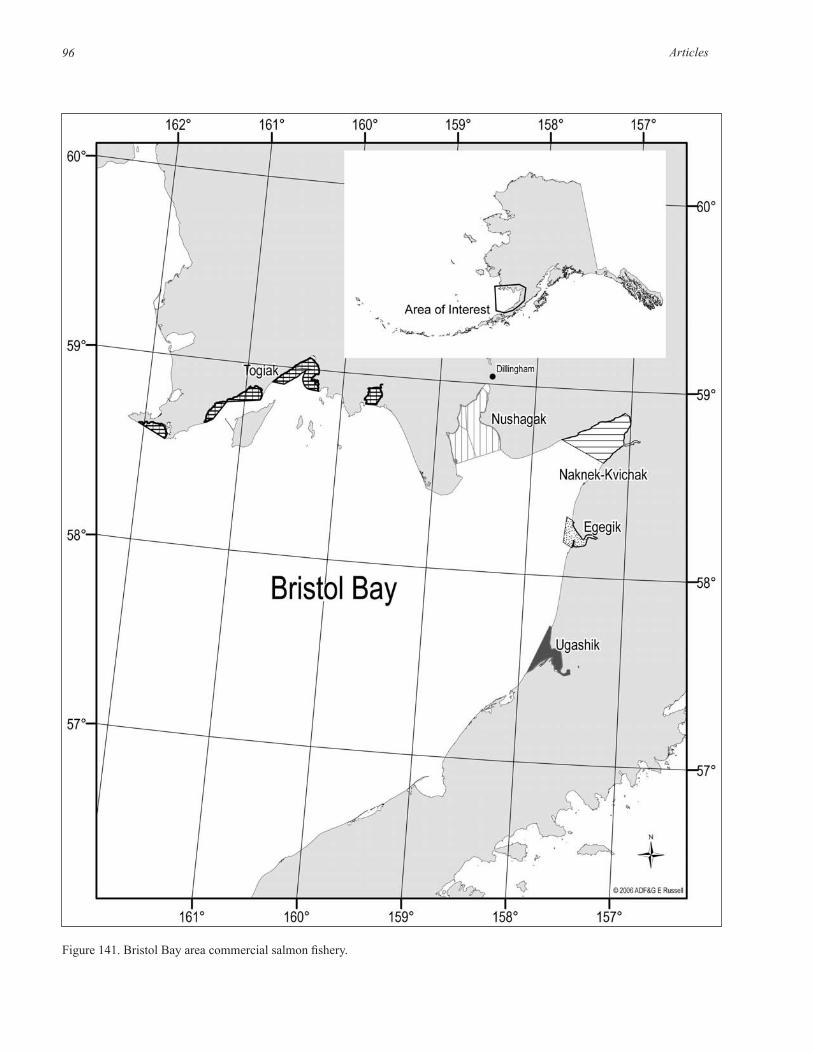
Articles96 97The Commercial Salmon Fishery in Alaska • Clark, McGregor, Mecum, Krasnowski and Carroll
Figure 141. Bristol Bay area commercial salmon fishery.
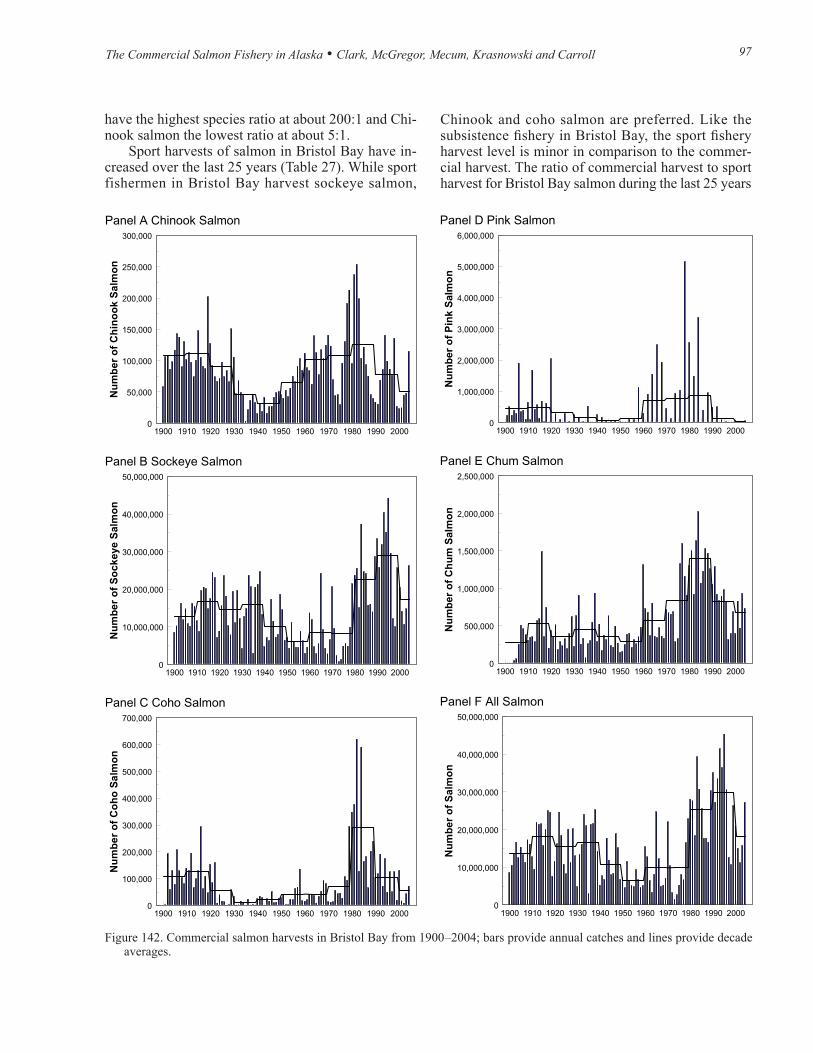
Articles96 97The Commercial Salmon Fishery in Alaska • Clark, McGregor, Mecum, Krasnowski and Carroll
have the highest species ratio at about 200:1 and Chi-nook salmon the lowest ratio at about 5:1.
Sport harvests of salmon in Bristol Bay have in-creased over the last 25 years (Table 27). While sport fishermen in Bristol Bay harvest sockeye salmon,
Chinook and coho salmon are preferred. Like the subsistence fishery in Bristol Bay, the sport fishery harvest level is minor in comparison to the commer-cial harvest. The ratio of commercial harvest to sport harvest for Bristol Bay salmon during the last 25 years
Figure 142. Commercial salmon harvests in Bristol Bay from 1900 –2004; bars provide annual catches and lines provide decade averages.
Panel A Chinook Salmon
1900 1910 1920 1930 1940 1950 1960 1970 1980 1990 20000
50,000
100,000
150,000
200,000
250,000
300,000
Nu
mb
er o
f C
hin
oo
k S
alm
on
Panel B Sockeye Salmon
1900 1910 1920 1930 1940 1950 1960 1970 1980 1990 20000
10,000,000
20,000,000
30,000,000
40,000,000
50,000,000
Nu
mb
er o
f S
ock
eye
Sal
mo
n
Panel C Coho Salmon
1900 1910 1920 1930 1940 1950 1960 1970 1980 1990 20000
100,000
200,000
300,000
400,000
500,000
600,000
700,000
Nu
mb
er o
f C
oh
o S
alm
on
Panel D Pink Salmon
1900 1910 1920 1930 1940 1950 1960 1970 1980 1990 20000
1,000,000
2,000,000
3,000,000
4,000,000
5,000,000
6,000,000
Nu
mb
er o
f P
ink
Sal
mo
nPanel E Chum Salmon
1900 1910 1920 1930 1940 1950 1960 1970 1980 1990 20000
500,000
1,000,000
1,500,000
2,000,000
2,500,000
Nu
mb
er o
f C
hu
m S
alm
on
Panel F All Salmon
1900 1910 1920 1930 1940 1950 1960 1970 1980 1990 20000
10,000,000
20,000,000
30,000,000
40,000,000
50,000,000
Nu
mb
er o
f S
alm
on
Figure BB1. Commercial salmon harvests in Bristol Bay from 1900-2004; bars provide annual catches and lines provide decade averages.
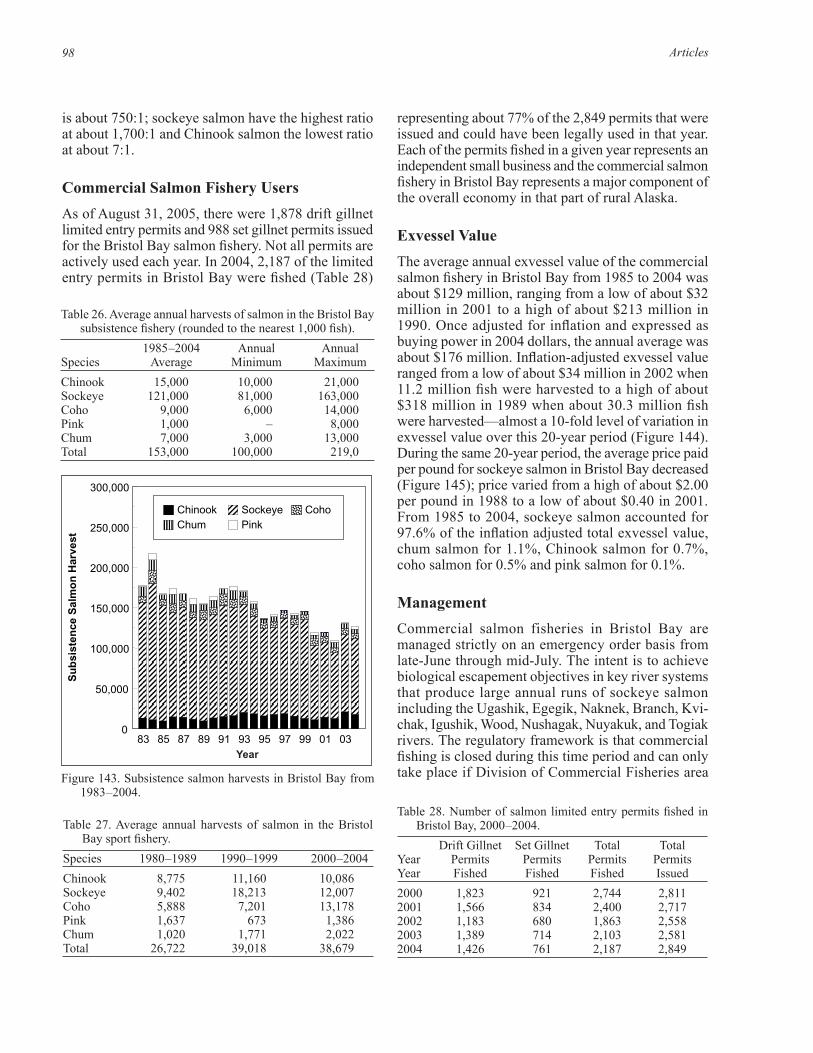
Articles98 99The Commercial Salmon Fishery in Alaska • Clark, McGregor, Mecum, Krasnowski and Carroll
Table 26. Average annual harvests of salmon in the Bristol Bay subsistence fishery (rounded to the nearest 1,000 fish).
1985 –2004 Annual AnnualSpecies Average Minimum MaximumChinook 15,000 10,000 21,000Sockeye 121,000 81,000 163,000Coho 9,000 6,000 14,000Pink 1,000 – 8,000Chum 7,000 3,000 13,000Total 153,000 100,000 219,0
Figure 143. Subsistence salmon harvests in Bristol Bay from 1983 –2004.
Figure BB2. Subsistence salmon harvests in Bristol Bay from 1983-2004.
83 85 87 89 91 93 95 97 99 01 030
50,000
100,000
150,000
200,000
250,000
300,000
Su
bsi
sten
ce S
alm
on
Har
vest
Chinook Sockeye CohoChum Pink
Year
is about 750:1; sockeye salmon have the highest ratio at about 1,700:1 and Chinook salmon the lowest ratio at about 7:1.
Commercial Salmon Fishery UsersAs of August 31, 2005, there were 1,878 drift gillnet limited entry permits and 988 set gillnet permits issued for the Bristol Bay salmon fishery. Not all permits are actively used each year. In 2004, 2,187 of the limited entry permits in Bristol Bay were fished (Table 28)
Table 27. Average annual harvests of salmon in the Bristol Bay sport fishery.
Species 1980 –1989 1990 –1999 2000 –2004Chinook 8,775 11,160 10,086Sockeye 9,402 18,213 12,007Coho 5,888 7,201 13,178Pink 1,637 673 1,386Chum 1,020 1,771 2,022Total 26,722 39,018 38,679
Table 28. Number of salmon limited entry permits fished in Bristol Bay, 2000 –2004.
Drift Gillnet Set Gillnet Total Total Year Permits Permits Permits PermitsYear Fished Fished Fished Issued2000 1,823 921 2,744 2,8112001 1,566 834 2,400 2,7172002 1,183 680 1,863 2,5582003 1,389 714 2,103 2,5812004 1,426 761 2,187 2,849
representing about 77% of the 2,849 permits that were issued and could have been legally used in that year. Each of the permits fished in a given year represents an independent small business and the commercial salmon fishery in Bristol Bay represents a major component of the overall economy in that part of rural Alaska.
Exvessel ValueThe average annual exvessel value of the commercial salmon fishery in Bristol Bay from 1985 to 2004 was about $129 million, ranging from a low of about $32 million in 2001 to a high of about $213 million in 1990. Once adjusted for inflation and expressed as buying power in 2004 dollars, the annual average was about $176 million. Inflation-adjusted exvessel value ranged from a low of about $34 million in 2002 when 11.2 million fish were harvested to a high of about $318 million in 1989 when about 30.3 million fish were harvested—almost a 10-fold level of variation in exvessel value over this 20-year period (Figure 144). During the same 20-year period, the average price paid per pound for sockeye salmon in Bristol Bay decreased (Figure 145); price varied from a high of about $2.00 per pound in 1988 to a low of about $0.40 in 2001. From 1985 to 2004, sockeye salmon accounted for 97.6% of the inflation adjusted total exvessel value, chum salmon for 1.1%, Chinook salmon for 0.7%, coho salmon for 0.5% and pink salmon for 0.1%.
Management Commercial salmon fisheries in Bristol Bay are managed strictly on an emergency order basis from late-June through mid-July. The intent is to achieve biological escapement objectives in key river systems that produce large annual runs of sockeye salmon including the Ugashik, Egegik, Naknek, Branch, Kvi-chak, Igushik, Wood, Nushagak, Nuyakuk, and Togiak rivers. The regulatory framework is that commercial fishing is closed during this time period and can only take place if Division of Commercial Fisheries area
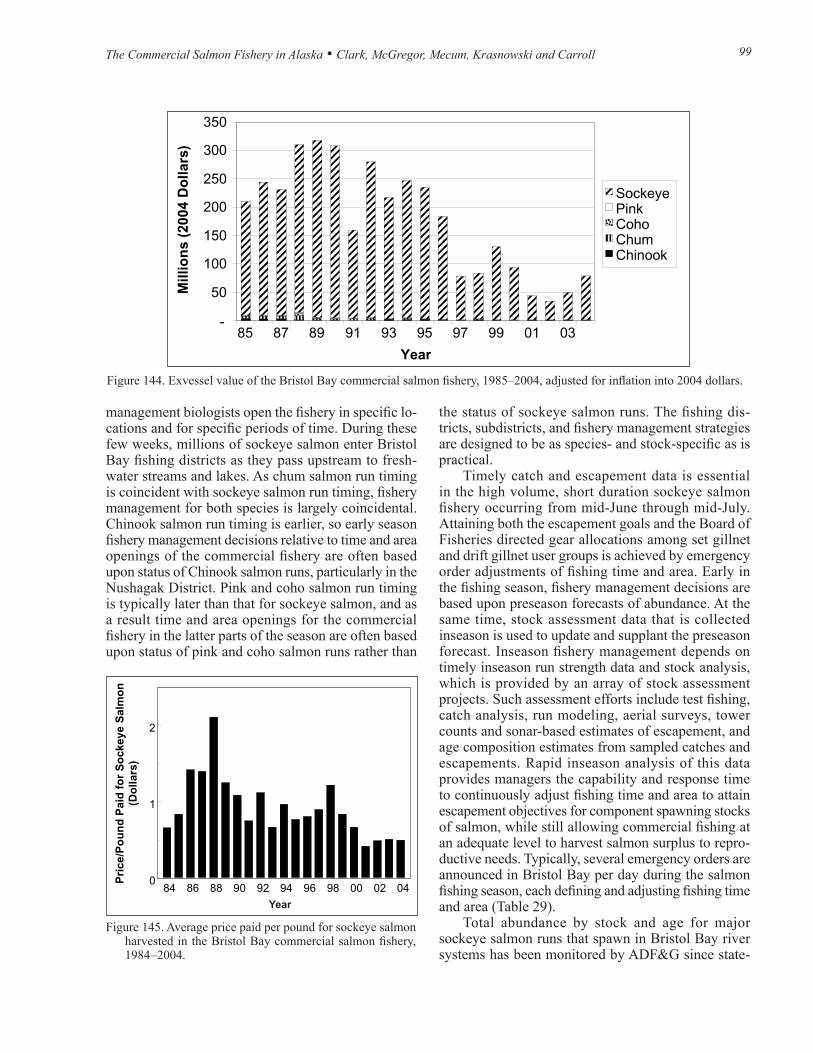
Articles98 99The Commercial Salmon Fishery in Alaska • Clark, McGregor, Mecum, Krasnowski and Carroll
Figure 145. Average price paid per pound for sockeye salmon harvested in the Bristol Bay commercial salmon fishery, 1984 –2004.
Figure BB4. Average price paid per pound for sockeye salmon harvested in the Bristol Bay commercial salmon fishery, 1984-2004.
84 86 88 90 92 94 96 98 00 02 040
1
2
Pri
ce/P
ou
nd
Pai
d f
or
So
ckey
e S
alm
on
(D
olla
rs)
Year
management biologists open the fishery in specific lo-cations and for specific periods of time. During these few weeks, millions of sockeye salmon enter Bristol Bay fishing districts as they pass upstream to fresh-water streams and lakes. As chum salmon run timing is coincident with sockeye salmon run timing, fishery management for both species is largely coincidental. Chinook salmon run timing is earlier, so early season fishery management decisions relative to time and area openings of the commercial fishery are often based upon status of Chinook salmon runs, particularly in the Nushagak District. Pink and coho salmon run timing is typically later than that for sockeye salmon, and as a result time and area openings for the commercial fishery in the latter parts of the season are often based upon status of pink and coho salmon runs rather than
Figure 144. Exvessel value of the Bristol Bay commercial salmon fishery, 1985–2004, adjusted for inflation into 2004 dollars.
Figure BB3. Exvessel value of the Bristol Bay commercial salmon fishery, 1985-2004, adjusted for inflation into 2004 dollars.
Exvessel value-Bristol Bay (adjusted for inflation)
-
50
100
150
200
250
300
350
85 87 89 91 93 95 97 99 01 03
Year
Mill
ion
s (2
004
Do
llars
)SockeyePinkCohoChumChinook
the status of sockeye salmon runs. The fishing dis-tricts, subdistricts, and fishery management strategies are designed to be as species- and stock-specific as is practical.
Timely catch and escapement data is essential in the high volume, short duration sockeye salmon fishery occurring from mid-June through mid-July. Attaining both the escapement goals and the Board of Fisheries directed gear allocations among set gillnet and drift gillnet user groups is achieved by emergency order adjustments of fishing time and area. Early in the fishing season, fishery management decisions are based upon preseason forecasts of abundance. At the same time, stock assessment data that is collected inseason is used to update and supplant the preseason forecast. Inseason fishery management depends on timely inseason run strength data and stock analysis, which is provided by an array of stock assessment projects. Such assessment efforts include test fishing, catch analysis, run modeling, aerial surveys, tower counts and sonar-based estimates of escapement, and age composition estimates from sampled catches and escapements. Rapid inseason analysis of this data provides managers the capability and response time to continuously adjust fishing time and area to attain escapement objectives for component spawning stocks of salmon, while still allowing commercial fishing at an adequate level to harvest salmon surplus to repro-ductive needs. Typically, several emergency orders are announced in Bristol Bay per day during the salmon fishing season, each defining and adjusting fishing time and area (Table 29).
Total abundance by stock and age for major sockeye salmon runs that spawn in Bristol Bay river systems has been monitored by ADF&G since state-
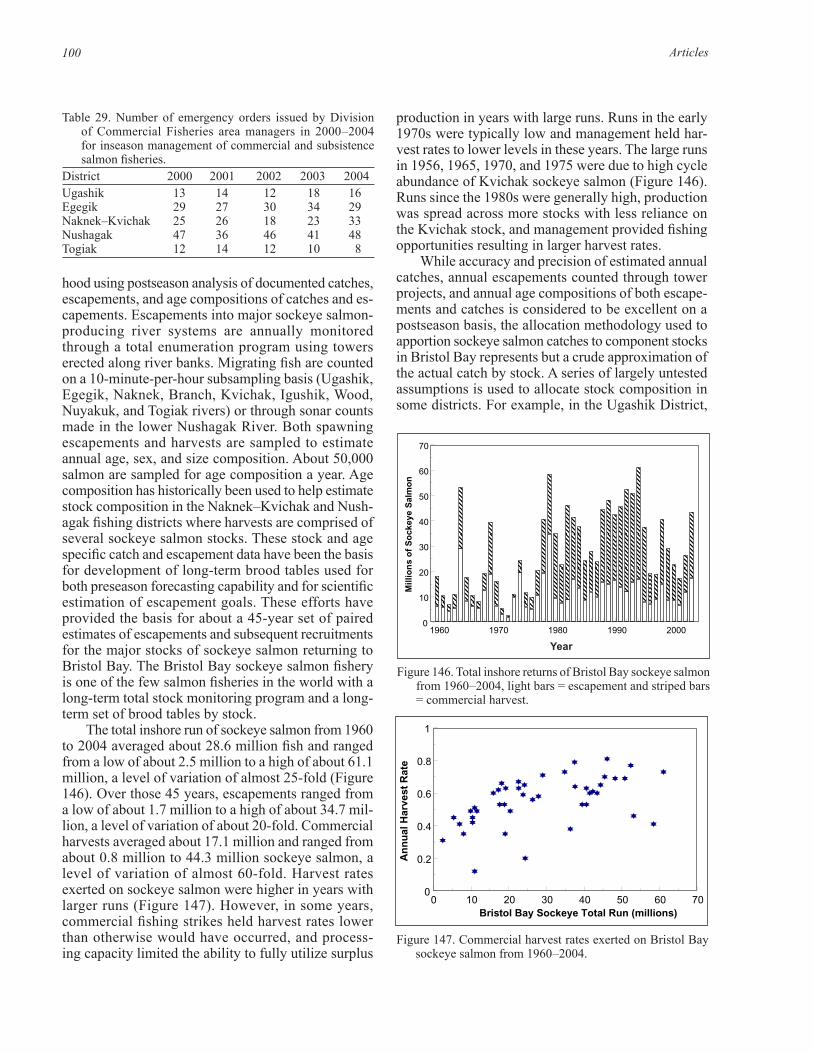
Articles100 101The Commercial Salmon Fishery in Alaska • Clark, McGregor, Mecum, Krasnowski and Carroll
hood using postseason analysis of documented catches, escapements, and age compositions of catches and es-capements. Escapements into major sockeye salmon-producing river systems are annually monitored through a total enumeration program using towers erected along river banks. Migrating fish are counted on a 10-minute-per-hour subsampling basis (Ugashik, Egegik, Naknek, Branch, Kvichak, Igushik, Wood, Nuyakuk, and Togiak rivers) or through sonar counts made in the lower Nushagak River. Both spawning escapements and harvests are sampled to estimate annual age, sex, and size composition. About 50,000 salmon are sampled for age composition a year. Age composition has historically been used to help estimate stock composition in the Naknek–Kvichak and Nush-agak fishing districts where harvests are comprised of several sockeye salmon stocks. These stock and age specific catch and escapement data have been the basis for development of long-term brood tables used for both preseason forecasting capability and for scientific estimation of escapement goals. These efforts have provided the basis for about a 45-year set of paired estimates of escapements and subsequent recruitments for the major stocks of sockeye salmon returning to Bristol Bay. The Bristol Bay sockeye salmon fishery is one of the few salmon fisheries in the world with a long-term total stock monitoring program and a long-term set of brood tables by stock.
The total inshore run of sockeye salmon from 1960 to 2004 averaged about 28.6 million fish and ranged from a low of about 2.5 million to a high of about 61.1 million, a level of variation of almost 25-fold (Figure 146). Over those 45 years, escapements ranged from a low of about 1.7 million to a high of about 34.7 mil-lion, a level of variation of about 20-fold. Commercial harvests averaged about 17.1 million and ranged from about 0.8 million to 44.3 million sockeye salmon, a level of variation of almost 60-fold. Harvest rates exerted on sockeye salmon were higher in years with larger runs (Figure 147). However, in some years, commercial fishing strikes held harvest rates lower than otherwise would have occurred, and process-ing capacity limited the ability to fully utilize surplus
production in years with large runs. Runs in the early 1970s were typically low and management held har-vest rates to lower levels in these years. The large runs in 1956, 1965, 1970, and 1975 were due to high cycle abundance of Kvichak sockeye salmon (Figure 146). Runs since the 1980s were generally high, production was spread across more stocks with less reliance on the Kvichak stock, and management provided fishing opportunities resulting in larger harvest rates.
While accuracy and precision of estimated annual catches, annual escapements counted through tower projects, and annual age compositions of both escape-ments and catches is considered to be excellent on a postseason basis, the allocation methodology used to apportion sockeye salmon catches to component stocks in Bristol Bay represents but a crude approximation of the actual catch by stock. A series of largely untested assumptions is used to allocate stock composition in some districts. For example, in the Ugashik District,
Table 29. Number of emergency orders issued by Division of Commercial Fisheries area managers in 2000 –2004 for inseason management of commercial and subsistence salmon fisheries.
District 2000 2001 2002 2003 2004Ugashik 13 14 12 18 16Egegik 29 27 30 34 29Naknek–Kvichak 25 26 18 23 33Nushagak 47 36 46 41 48Togiak 12 14 12 10 8
Figure 146. Total inshore returns of Bristol Bay sockeye salmon from 1960 –2004, light bars = escapement and striped bars = commercial harvest.Figure BB5. Total inshore returns of Bristol Bay sockeye salmon from 1960-2004, light
bars = escapement and striped bars = commercial harvest.
1960 1970 1980 1990 20000
10
20
30
40
50
60
70
Mill
ion
s o
f S
ock
eye
Sal
mo
n
Year
Figure 147. Commercial harvest rates exerted on Bristol Bay sockeye salmon from 1960 –2004.
Figure BB6. Commercial harvest rates exerted on Bristol Bay sockeye salmon from 1960-2004.
0 10 20 30 40 50 60 700
0.2
0.4
0.6
0.8
1
Bristol Bay Sockeye Total Run (millions)
An
nu
al H
arve
st R
ate
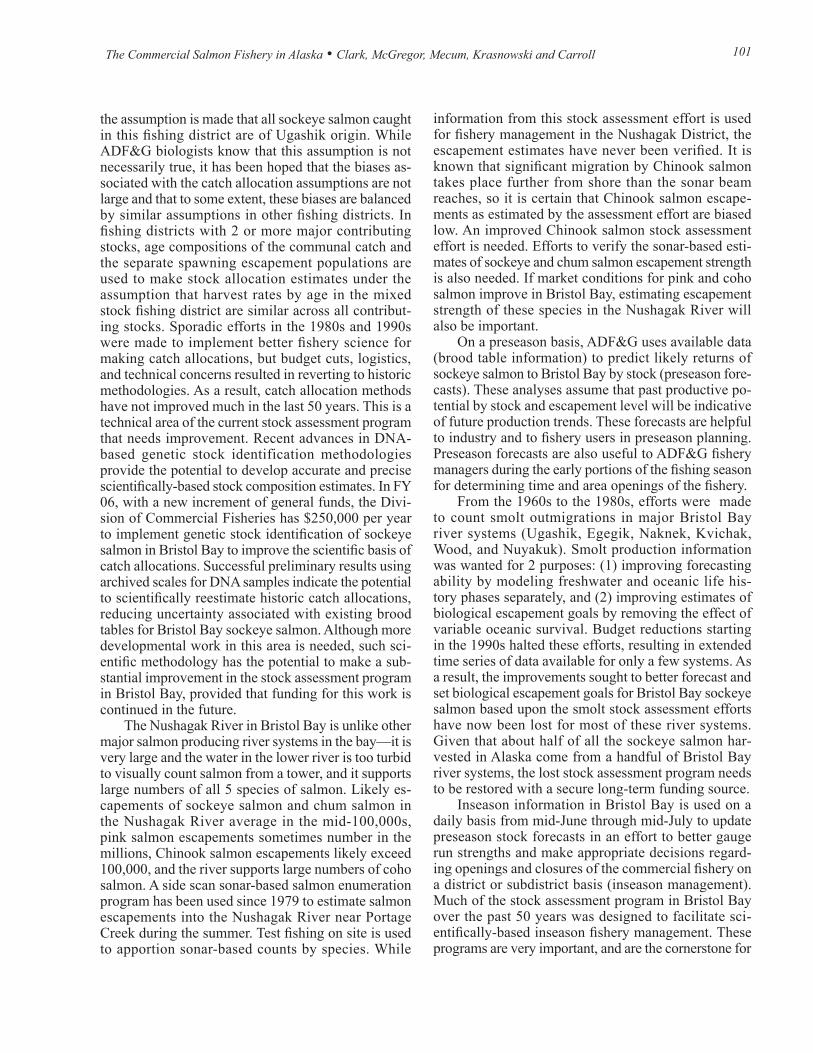
Articles100 101The Commercial Salmon Fishery in Alaska • Clark, McGregor, Mecum, Krasnowski and Carroll
the assumption is made that all sockeye salmon caught in this fishing district are of Ugashik origin. While ADF&G biologists know that this assumption is not necessarily true, it has been hoped that the biases as-sociated with the catch allocation assumptions are not large and that to some extent, these biases are balanced by similar assumptions in other fishing districts. In fishing districts with 2 or more major contributing stocks, age compositions of the communal catch and the separate spawning escapement populations are used to make stock allocation estimates under the assumption that harvest rates by age in the mixed stock fishing district are similar across all contribut-ing stocks. Sporadic efforts in the 1980s and 1990s were made to implement better fishery science for making catch allocations, but budget cuts, logistics, and technical concerns resulted in reverting to historic methodologies. As a result, catch allocation methods have not improved much in the last 50 years. This is a technical area of the current stock assessment program that needs improvement. Recent advances in DNA-based genetic stock identification methodologies provide the potential to develop accurate and precise scientifically-based stock composition estimates. In FY 06, with a new increment of general funds, the Divi-sion of Commercial Fisheries has $250,000 per year to implement genetic stock identification of sockeye salmon in Bristol Bay to improve the scientific basis of catch allocations. Successful preliminary results using archived scales for DNA samples indicate the potential to scientifically reestimate historic catch allocations, reducing uncertainty associated with existing brood tables for Bristol Bay sockeye salmon. Although more developmental work in this area is needed, such sci-entific methodology has the potential to make a sub-stantial improvement in the stock assessment program in Bristol Bay, provided that funding for this work is continued in the future.
The Nushagak River in Bristol Bay is unlike other major salmon producing river systems in the bay—it is very large and the water in the lower river is too turbid to visually count salmon from a tower, and it supports large numbers of all 5 species of salmon. Likely es-capements of sockeye salmon and chum salmon in the Nushagak River average in the mid-100,000s, pink salmon escapements sometimes number in the millions, Chinook salmon escapements likely exceed 100,000, and the river supports large numbers of coho salmon. A side scan sonar-based salmon enumeration program has been used since 1979 to estimate salmon escapements into the Nushagak River near Portage Creek during the summer. Test fishing on site is used to apportion sonar-based counts by species. While
information from this stock assessment effort is used for fishery management in the Nushagak District, the escapement estimates have never been verified. It is known that significant migration by Chinook salmon takes place further from shore than the sonar beam reaches, so it is certain that Chinook salmon escape-ments as estimated by the assessment effort are biased low. An improved Chinook salmon stock assessment effort is needed. Efforts to verify the sonar-based esti-mates of sockeye and chum salmon escapement strength is also needed. If market conditions for pink and coho salmon improve in Bristol Bay, estimating escapement strength of these species in the Nushagak River will also be important.
On a preseason basis, ADF&G uses available data (brood table information) to predict likely returns of sockeye salmon to Bristol Bay by stock (preseason fore-casts). These analyses assume that past productive po-tential by stock and escapement level will be indicative of future production trends. These forecasts are helpful to industry and to fishery users in preseason planning. Preseason forecasts are also useful to ADF&G fishery managers during the early portions of the fishing season for determining time and area openings of the fishery.
From the 1960s to the 1980s, efforts were made to count smolt outmigrations in major Bristol Bay river systems (Ugashik, Egegik, Naknek, Kvichak, Wood, and Nuyakuk). Smolt production information was wanted for 2 purposes: (1) improving forecasting ability by modeling freshwater and oceanic life his-tory phases separately, and (2) improving estimates of biological escapement goals by removing the effect of variable oceanic survival. Budget reductions starting in the 1990s halted these efforts, resulting in extended time series of data available for only a few systems. As a result, the improvements sought to better forecast and set biological escapement goals for Bristol Bay sockeye salmon based upon the smolt stock assessment efforts have now been lost for most of these river systems. Given that about half of all the sockeye salmon har-vested in Alaska come from a handful of Bristol Bay river systems, the lost stock assessment program needs to be restored with a secure long-term funding source.
Inseason information in Bristol Bay is used on a daily basis from mid-June through mid-July to update preseason stock forecasts in an effort to better gauge run strengths and make appropriate decisions regard-ing openings and closures of the commercial fishery on a district or subdistrict basis (inseason management). Much of the stock assessment program in Bristol Bay over the past 50 years was designed to facilitate sci-entifically-based inseason fishery management. These programs are very important, and are the cornerstone for
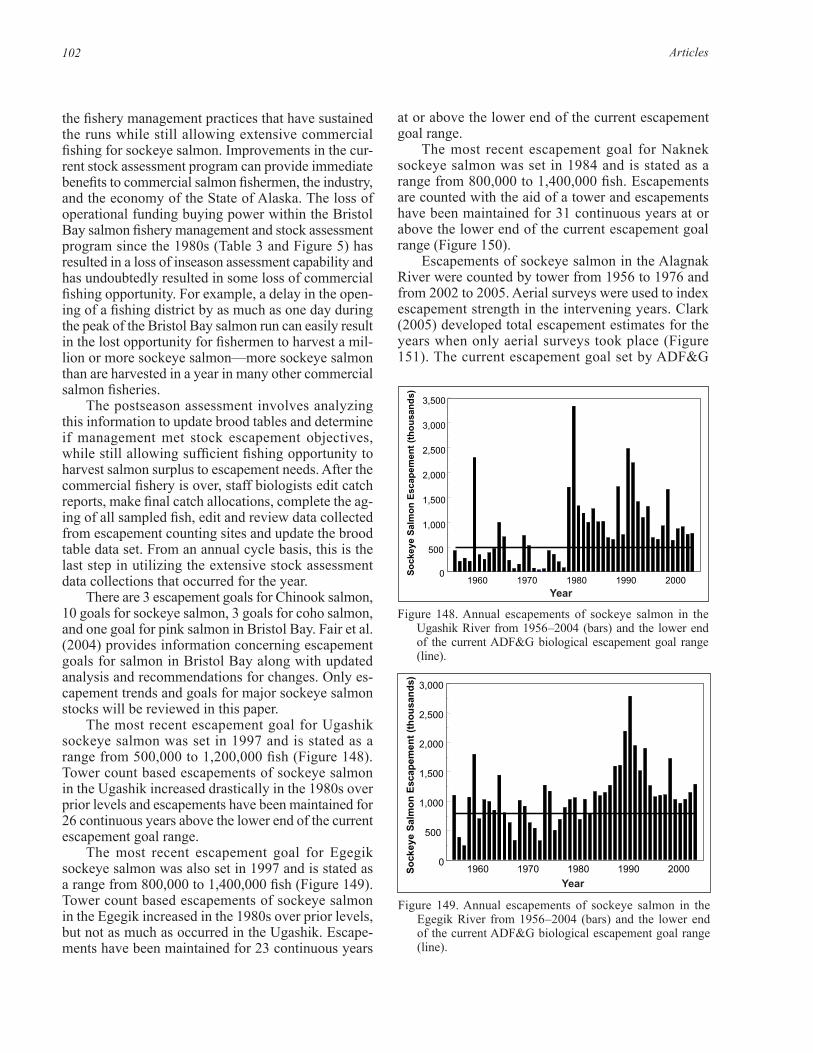
Articles102 103The Commercial Salmon Fishery in Alaska • Clark, McGregor, Mecum, Krasnowski and Carroll
the fishery management practices that have sustained the runs while still allowing extensive commercial fishing for sockeye salmon. Improvements in the cur-rent stock assessment program can provide immediate benefits to commercial salmon fishermen, the industry, and the economy of the State of Alaska. The loss of operational funding buying power within the Bristol Bay salmon fishery management and stock assessment program since the 1980s (Table 3 and Figure 5) has resulted in a loss of inseason assessment capability and has undoubtedly resulted in some loss of commercial fishing opportunity. For example, a delay in the open-ing of a fishing district by as much as one day during the peak of the Bristol Bay salmon run can easily result in the lost opportunity for fishermen to harvest a mil-lion or more sockeye salmon—more sockeye salmon than are harvested in a year in many other commercial salmon fisheries.
The postseason assessment involves analyzing this information to update brood tables and determine if management met stock escapement objectives, while still allowing sufficient fishing opportunity to harvest salmon surplus to escapement needs. After the commercial fishery is over, staff biologists edit catch reports, make final catch allocations, complete the ag-ing of all sampled fish, edit and review data collected from escapement counting sites and update the brood table data set. From an annual cycle basis, this is the last step in utilizing the extensive stock assessment data collections that occurred for the year.
There are 3 escapement goals for Chinook salmon, 10 goals for sockeye salmon, 3 goals for coho salmon, and one goal for pink salmon in Bristol Bay. Fair et al. (2004) provides information concerning escapement goals for salmon in Bristol Bay along with updated analysis and recommendations for changes. Only es-capement trends and goals for major sockeye salmon stocks will be reviewed in this paper.
The most recent escapement goal for Ugashik sockeye salmon was set in 1997 and is stated as a range from 500,000 to 1,200,000 fish (Figure 148). Tower count based escapements of sockeye salmon in the Ugashik increased drastically in the 1980s over prior levels and escapements have been maintained for 26 continuous years above the lower end of the current escapement goal range.
The most recent escapement goal for Egegik sockeye salmon was also set in 1997 and is stated as a range from 800,000 to 1,400,000 fish (Figure 149). Tower count based escapements of sockeye salmon in the Egegik increased in the 1980s over prior levels, but not as much as occurred in the Ugashik. Escape-ments have been maintained for 23 continuous years
at or above the lower end of the current escapement goal range.
The most recent escapement goal for Naknek sockeye salmon was set in 1984 and is stated as a range from 800,000 to 1,400,000 fish. Escapements are counted with the aid of a tower and escapements have been maintained for 31 continuous years at or above the lower end of the current escapement goal range (Figure 150).
Escapements of sockeye salmon in the Alagnak River were counted by tower from 1956 to 1976 and from 2002 to 2005. Aerial surveys were used to index escapement strength in the intervening years. Clark (2005) developed total escapement estimates for the years when only aerial surveys took place (Figure 151). The current escapement goal set by ADF&G
Figure 148. Annual escapements of sockeye salmon in the Ugashik River from 1956 –2004 (bars) and the lower end of the current ADF&G biological escapement goal range (line).
Figure 149. Annual escapements of sockeye salmon in the Egegik River from 1956 –2004 (bars) and the lower end of the current ADF&G biological escapement goal range (line).
Figure BB7. Annual escapements of sockeye salmon in the Ugashik River from 1956-2004 (bars) and the lower end of the current ADF&G biological escapement goal range (line).
1960 1970 1980 1990 2000 0
500
1,000
1,500
2,000
2,500
3,000
3,500S
ock
eye
Sal
mo
n E
scap
emen
t (t
ho
usa
nd
s)
Year
Figure BB8. Annual escapements of sockeye salmon in the Egegik River from 1956-2004 (bars) and the lower end of the current ADF&G biological escapement goal range (line).
1960 1970 1980 1990 2000 0
500
1,000
1,500
2,000
2,500
3,000
So
ckey
e S
alm
on
Esc
apem
ent
(th
ou
san
ds)
Year
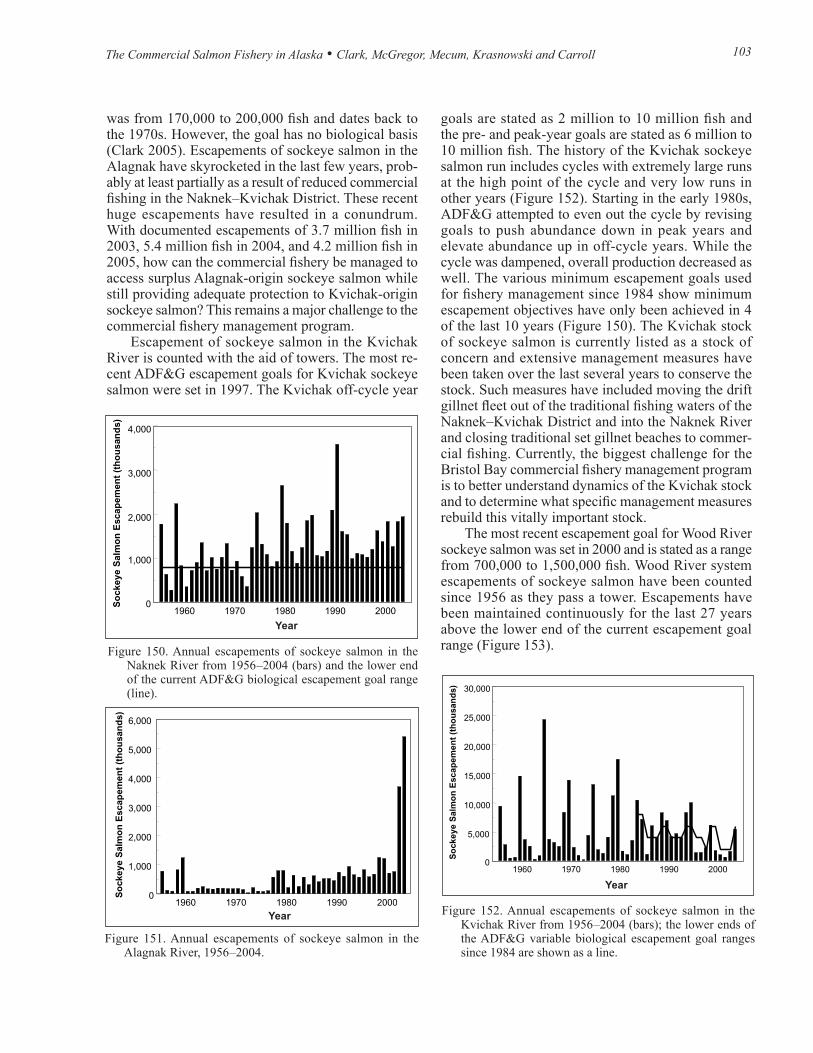
Articles102 103The Commercial Salmon Fishery in Alaska • Clark, McGregor, Mecum, Krasnowski and Carroll
Figure 151. Annual escapements of sockeye salmon in the Alagnak River, 1956 –2004.
Figure BB10. Annual escapements of sockeye salmon in the Alagnak River, 1956-2004.
1960 1970 1980 1990 20000
1,000
2,000
3,000
4,000
5,000
6,000
So
ckey
e S
alm
on
Esc
apem
ent
(th
ou
san
ds)
Year Figure 152. Annual escapements of sockeye salmon in the Kvichak River from 1956 –2004 (bars); the lower ends of the ADF&G variable biological escapement goal ranges since 1984 are shown as a line.
Figure BB11. Annual escapements of sockeye salmon in the Kvichak River from 1956-2004 (bars); the lower ends of the ADF&G variable biological escapement goal ranges since 1984 are shown as a line.
1960 1970 1980 1990 20000
5,000
10,000
15,000
20,000
25,000
30,000
So
ckey
e S
alm
on
Esc
apem
ent
(th
ou
san
ds)
Year
was from 170,000 to 200,000 fish and dates back to the 1970s. However, the goal has no biological basis (Clark 2005). Escapements of sockeye salmon in the Alagnak have skyrocketed in the last few years, prob-ably at least partially as a result of reduced commercial fishing in the Naknek–Kvichak District. These recent huge escapements have resulted in a conundrum. With documented escapements of 3.7 million fish in 2003, 5.4 million fish in 2004, and 4.2 million fish in 2005, how can the commercial fishery be managed to access surplus Alagnak-origin sockeye salmon while still providing adequate protection to Kvichak-origin sockeye salmon? This remains a major challenge to the commercial fishery management program.
Escapement of sockeye salmon in the Kvichak River is counted with the aid of towers. The most re-cent ADF&G escapement goals for Kvichak sockeye salmon were set in 1997. The Kvichak off-cycle year
goals are stated as 2 million to 10 million fish and the pre- and peak-year goals are stated as 6 million to 10 million fish. The history of the Kvichak sockeye salmon run includes cycles with extremely large runs at the high point of the cycle and very low runs in other years (Figure 152). Starting in the early 1980s, ADF&G attempted to even out the cycle by revising goals to push abundance down in peak years and elevate abundance up in off-cycle years. While the cycle was dampened, overall production decreased as well. The various minimum escapement goals used for fishery management since 1984 show minimum escapement objectives have only been achieved in 4 of the last 10 years (Figure 150). The Kvichak stock of sockeye salmon is currently listed as a stock of concern and extensive management measures have been taken over the last several years to conserve the stock. Such measures have included moving the drift gillnet fleet out of the traditional fishing waters of the Naknek–Kvichak District and into the Naknek River and closing traditional set gillnet beaches to commer-cial fishing. Currently, the biggest challenge for the Bristol Bay commercial fishery management program is to better understand dynamics of the Kvichak stock and to determine what specific management measures rebuild this vitally important stock.
The most recent escapement goal for Wood River sockeye salmon was set in 2000 and is stated as a range from 700,000 to 1,500,000 fish. Wood River system escapements of sockeye salmon have been counted since 1956 as they pass a tower. Escapements have been maintained continuously for the last 27 years above the lower end of the current escapement goal range (Figure 153). Figure 150. Annual escapements of sockeye salmon in the
Naknek River from 1956 –2004 (bars) and the lower end of the current ADF&G biological escapement goal range (line).
Figure BB9. Annual escapements of sockeye salmon in the Naknek River from 1956-2004 (bars) and the lower end of the current ADF&G biological escapement goal range (line).
1960 1970 1980 1990 2000 0
1,000
2,000
3,000
4,000
So
ckey
e S
alm
on
Esc
apem
ent
(th
ou
san
ds)
Year
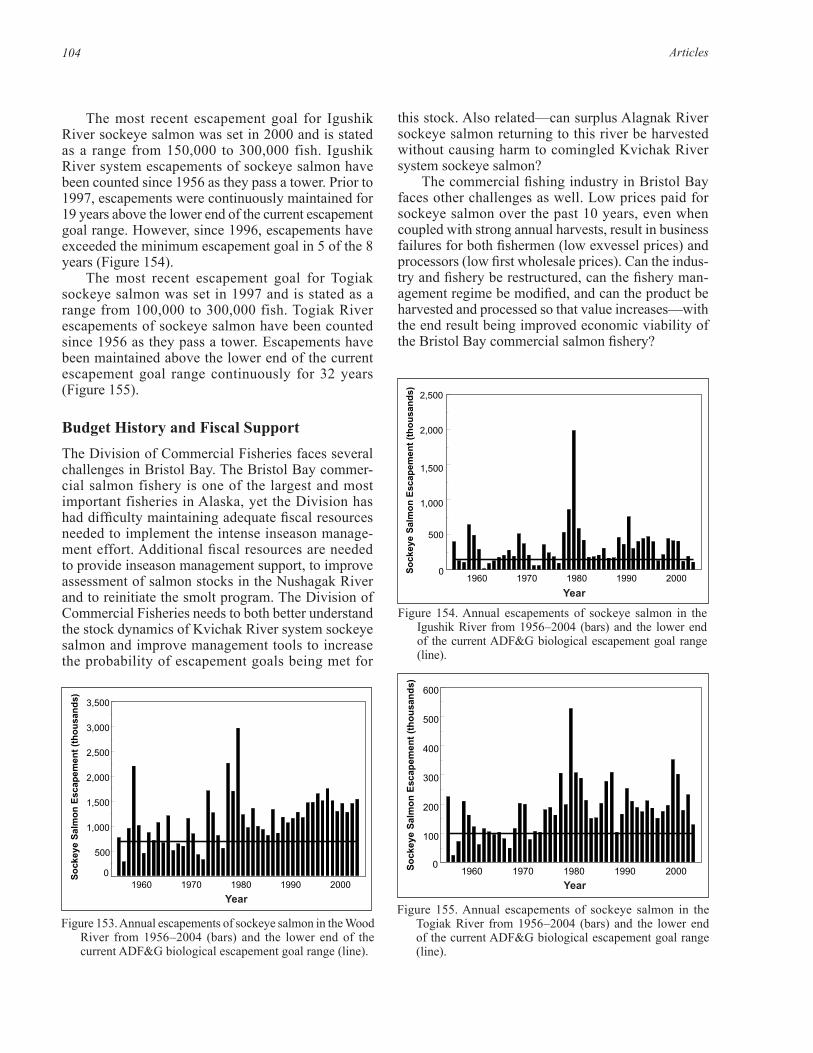
Articles104
The most recent escapement goal for Igushik River sockeye salmon was set in 2000 and is stated as a range from 150,000 to 300,000 fish. Igushik River system escapements of sockeye salmon have been counted since 1956 as they pass a tower. Prior to 1997, escapements were continuously maintained for 19 years above the lower end of the current escapement goal range. However, since 1996, escapements have exceeded the minimum escapement goal in 5 of the 8 years (Figure 154).
The most recent escapement goal for Togiak sockeye salmon was set in 1997 and is stated as a range from 100,000 to 300,000 fish. Togiak River escapements of sockeye salmon have been counted since 1956 as they pass a tower. Escapements have been maintained above the lower end of the current escapement goal range continuously for 32 years (Figure 155).
Budget History and Fiscal SupportThe Division of Commercial Fisheries faces several challenges in Bristol Bay. The Bristol Bay commer-cial salmon fishery is one of the largest and most important fisheries in Alaska, yet the Division has had difficulty maintaining adequate fiscal resources needed to implement the intense inseason manage-ment effort. Additional fiscal resources are needed to provide inseason management support, to improve assessment of salmon stocks in the Nushagak River and to reinitiate the smolt program. The Division of Commercial Fisheries needs to both better understand the stock dynamics of Kvichak River system sockeye salmon and improve management tools to increase the probability of escapement goals being met for
this stock. Also related—can surplus Alagnak River sockeye salmon returning to this river be harvested without causing harm to comingled Kvichak River system sockeye salmon?
The commercial fishing industry in Bristol Bay faces other challenges as well. Low prices paid for sockeye salmon over the past 10 years, even when coupled with strong annual harvests, result in business failures for both fishermen (low exvessel prices) and processors (low first wholesale prices). Can the indus-try and fishery be restructured, can the fishery man-agement regime be modified, and can the product be harvested and processed so that value increases—with the end result being improved economic viability of the Bristol Bay commercial salmon fishery?
Figure 153. Annual escapements of sockeye salmon in the Wood River from 1956 –2004 (bars) and the lower end of the current ADF&G biological escapement goal range (line).
Figure BB12. Annual escapements of sockeye salmon in the Wood River from 1956-2004 (bars) and the lower end of the current ADF&G biological escapement goal range (line).
1960 1970 1980 1990 2000 0
500
1,000
1,500
2,000
2,500
3,000
3,500
So
ckey
e S
alm
on
Esc
apem
ent
(th
ou
san
ds)
Year
Figure 154. Annual escapements of sockeye salmon in the Igushik River from 1956 –2004 (bars) and the lower end of the current ADF&G biological escapement goal range (line).
Figure 155. Annual escapements of sockeye salmon in the Togiak River from 1956 –2004 (bars) and the lower end of the current ADF&G biological escapement goal range (line).
Figure BB13. Annual escapements of sockeye salmon in the Igushik River from 1956-2004 (bars) and the lower end of the current ADF&G biological escapement goal range (line).
1960 1970 1980 1990 2000 0
500
1,000
1,500
2,000
2,500
So
ckey
e S
alm
on
Esc
apem
ent
(th
ou
san
ds)
Year
Figure BB14. Annual escapements of sockeye salmon in the Togiak River from 1956-2004 (bars) and the lower end of the current ADF&G biological escapement goal range (line).
1960 1970 1980 1990 2000 0
100
200
300
400
500
600
So
ckey
e S
alm
on
Esc
apem
ent
(th
ou
san
ds)
Year


