Download - ARENA update on large scale solar
1
NSW Renewable Energy Investment Briefing
Ian Kay – CFO ARENA
25 May 2016

2
The large scale solar market has come a long way in 5 years
0
100
200
300
400
500
600
700
800
0
50
100
150
200
250
300
2012 2013 2014 2015 2016 2017* 2018
Large Scale Solar Developments in Australia (MW)
Non-ARENA Funded (LHS) ARENA Funded (LHS) Cumulative (RHS)
2012 – Greenough River Solar Farm built. Financed by Synergy, GE and the WA government
* Projects to be announced

3
With the state governments leading the initial charge
0
100
200
300
400
500
600
700
800
0
50
100
150
200
250
300
2012 2013 2014 2015 2016 2017* 2018
Large Scale Solar Developments in Australia (MW)
Non-ARENA Funded (LHS) ARENA Funded (LHS) Cumulative (RHS)
2014 – Royalla Solar Farm built by FRV as part of ACT Government Solar Auction
* Projects to be announced

4
AGL stepping in for Australia’s first major deployment
0
100
200
300
400
500
600
700
800
0
50
100
150
200
250
300
2012 2013 2014 2015 2016 2017* 2018
Large Scale Solar Developments in Australia (MW)
Non-ARENA Funded (LHS) ARENA Funded (LHS) Cumulative (RHS)
2015 – AGL’s Nyngan Solar Farm comes online with NSW Government support
* Projects to be announced

5
2014 and 2015 were lean years for the industry
0
100
200
300
400
500
600
700
800
0
50
100
150
200
250
300
2012 2013 2014 2015 2016 2017* 2018
Large Scale Solar Developments in Australia (MW)
Non-ARENA Funded (LHS) ARENA Funded (LHS) Cumulative (RHS)
2016 – Broken Hill, Moree Solar Farm, Mugga Lane, Normanton and Sunshine Coast
* Projects to be announced

6
But the path to parity has been forged in perseverance
0
100
200
300
400
500
600
700
800
0
50
100
150
200
250
300
2012 2013 2014 2015 2016 2017* 2018
Large Scale Solar Developments in Australia (MW)
Non-ARENA Funded (LHS) ARENA Funded (LHS) Cumulative (RHS)
Clare Solar Farm
2017 – Barcaldine and Clare Solar Farms announced
* Projects to be announced

7
The market is clearly exceeding all expectations
0
100
200
300
400
500
600
700
800
0
50
100
150
200
250
300
2012 2013 2014 2015 2016 2017* 2018
Large Scale Solar Developments in Australia (MW)
Non-ARENA Funded (LHS) ARENA Funded (LHS) Cumulative (RHS)
ARENA LSS Round 2018 – ARENA’s large scale solar competitive round expected to exceed by 25%
* Projects to be announced

8
Measuring the ripple effect is difficult, only hindsight is a useful yardstick
$80 – $100
BREE 2012
$210 – $300
LC
OE
$/M
Wh
2010 2015 2020
ACT FIT *
$110 - $130
Australian LCOE trajectory
* Normalised for capital structure advantages associated with 20 year FIT
ARENA
current
portfolio
Short term target
wind parity
$140 - $170
Were we too conservative?

9
The large scale solar round was launched in a difficult environment Consultations began in mid 2015 before the round was launched in September 2015.
200+ registrations, 80+ applicants, 22 shortlisted parties and ?? winners

10
Shared knowledge is an invaluable commodity
1.5
1.7
1.9
2.1
2.3
2.5
2.7$
/W
Average Total Capital Costs per Watt of Installed Capacity (DC and AC)
Capital Costs (DC) per Watt Capital Costs (AC) per Watt
Average AC Average Australia Wind
Source: ARENA
Solar capital costs now below wind
11
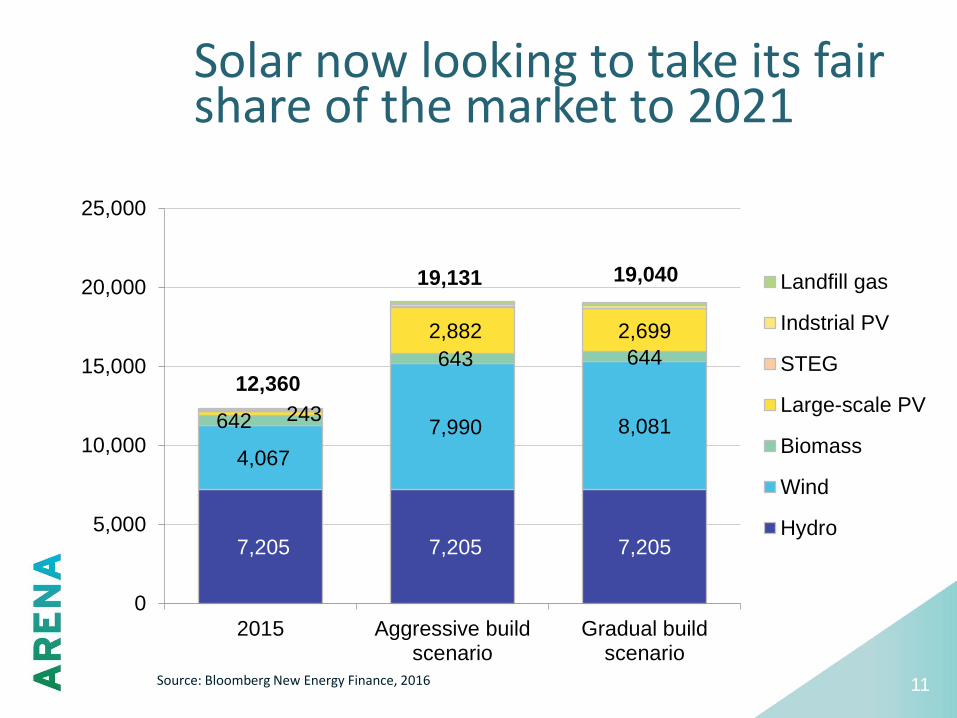
Solar now looking to take its fair share of the market to 2021
Source: Bloomberg New Energy Finance, 2016
7,205 7,205 7,205
4,067
7,990 8,081 642
643 644
243
2,882 2,699
12,360
19,131 19,040
0
5,000
10,000
15,000
20,000
25,000
2015 Aggressive buildscenario
Gradual buildscenario
Landfill gas
Indstrial PV
STEG
Large-scale PV
Biomass
Wind
Hydro

12
Thank you
Questions?

13
Find out more at arena.gov.au
ARENA at LinkedIn
@ARENA_aus on Twitter
Subscribe to updates: arena.gov.au/subscribe


