Artificial Intelligence Techniques based
modeling of Bicycle Level of Service for
Urban Road Segments
VEERA LEELA MANUSHA
Department of Civil Engineering
National Institute of Technology Rourkela

Artificial Intelligence Techniques based Modeling of Bicycle Level of
Service for Urban Road Segments
A thesis submitted to National Institute of Technology, Rourkela
in partial fulfilment for the award of the degree
Master of Technology
in
Civil Engineering
by
Veera Leela Manusha
(Roll .No- 214CE3084)
Under the guidance of
Prof. P.K.Bhuyan
Department of Civil Engineering
National Institute of Technology Rourkela
May 2016

Department of Civil Engineering
National Institute of Technology Rourkela
May, 2016
Certificate of Examination
Roll Number: 214CE3084
Name: Veera Leela Manusha
Title of Project: Artificial Intelligence Techniques Based Modeling of Bicycle Level of
Service for Urban Road Segments
This is to certify that the thesis mentioned above submitted by VEERA LEELA
MANUSHA (214CE3084) in the partial fulfillment of the requirement for the degree of
Master of Technology in Civil Engineering at National Institute of Technology Rourkela is
a reliable work carried out by her under my supervision and guidance.
Place: NIT Rourkela Dr. P. K. Bhuyan
Date: Department of Civil Engineering
NIT, Rourkela
iii
Department of Civil Engineering
National Institute of Technology Rourkela
Prof. Prasanta Kumar Bhuyan
Assistant Professor
May, 2016
Supervisor’s Certificate
This is to certify that the thesis mentioned above submitted by V. Leela Manusha
(214CE3084) in the partial fulfillment of the requirement for the degree of Master of
Technology in Civil Engineering at National Institute of Technology Rourkela is a reliable
work carried out by him under my supervision and guidance.
Place: NIT Rourkela Prof. P.K.Bhuyan
Date: Department of Civil Engineering
NIT, Rourkela

iv
DECLARATION OF ORIGINALITY
I hereby declare that this submission is entirely belongs to my own work done during the
course of Master’s Degree and I assure to the best of my knowledge that this work does not
contain any piece of work that was taken directly from the work done by any researcher in
the past nor it was taken from any article that was published in the past. This work was not
submitted to any other university for the award of any other degree.
VEERA LEELA MANUSHA

v
Acknowledgement
I express my sincere gratitude and sincere thanks to Prof. P. K. Bhuyan for his guidance
and constant encouragement and support during the course of my Research work. I truly
appreciate the values of his esteemed guidance and encouragement from the beginning to
the end of this work, his knowledge and accompany at the time of crisis remembered
lifelong.
I sincerely thank to our Director Prof. S. K. Sarangi, and all the authorities of the institute
for providing nice academic environment and other facilities in the NIT campus, I express
my sincere thanks to faculty members of transportation group, Prof. Uzzal Chattaraj, Prof.
Mahabir Panda for their useful discussion, suggestions and continuous encouragement and
motivation. Also I would like to thanks all Professors of Civil Engineering Department who
are directly and indirectly helped us.
I express my gratitude to Ph.D. scholar Sambit Kumar Beura who extended his arms to a
greater extent in helping me to continue my work throughout the course. He played a vital
role in the process of my work which helped me to complete my work in time. I am also
thankful to our lab staff members who were ready at any time to donate their effort. I also
thank my fellow students in supporting me throughout the course.
At last but not the list, I thank to all those who are directly or indirectly associated in
completion of this Research work.
Date:
Place:
Veera Leela Manusha
M. Tech (Civil)
Roll No -214CE3084
Transportation Engineering

vi
Abstract
Bicycle is one of the key methods of transportation in a creating nation like India. There is
no wellbeing to bicyclists in the blended movement and rapid moving vehicles.
Subsequently we ought to stress on them by considering components influencing bicyclists
solace in arranging and plan stage itself. In India there is heterogeneous activity where we
discover collaborations amongst bikes and vehicles. Since no systems are accessible there
is a need to build up a technique that gives the see solace level of bicyclists on street sections
in fair sized urban communities. In this study BLOS Model is created utilizing three systems
in particular Artificial Neural Networks (ANN) and Multi Gene Genetic Programming
Methods (MGGP) and Multi linear Regression (MLR). General 59 section information is
utilized for investigation which is gathered from Rourkela, Bhubaneswar and Rajahmundry.
Eight noteworthy information parameters are considered in the models BLOS model
conditions are created for every one of the three strategies. Affectability Analysis is done to
decide the vital parameters exceptionally influencing the BLOS. Exhibitions of these
models have been tried as far as a few factual parameters. In present study MGGP based
BLOS model has great execution contrasted with ANN and MLR strategies.
Key words: Midsized cities, Road segments, Bicycle Level of Service, Heterogeneous
traffic flow, Artificial intelligence technique.
vii
Table of contents
Certificate of Examination .................................................................................................... ii
Supervisor’s Certificate ....................................................................................................... iii
Acknowledgement ................................................................................................................ v
Abstract ................................................................................................................................ vi
Table of contents ................................................................................................................ vii
CHAPTER 1 ......................................................................................................................... 1
Introduction .......................................................................................................................... 1
1.1 General ........................................................................................................................ 1
1.2 Problem Statement ...................................................................................................... 1
1.3 Objective of the study ................................................................................................. 2
1.4 Organization of report ................................................................................................. 2
CHAPTER 3 ......................................................................................................................... 5
Methodology ......................................................................................................................... 5
3.1General ......................................................................................................................... 5
3.2Artificial neural network .............................................................................................. 5
3.3Genetic Programming .................................................................................................. 6
CHAPTER 4 ......................................................................................................................... 9
Data collection ...................................................................................................................... 9
4.1General ......................................................................................................................... 9
4.2Study Area ................................................................................................................... 9
4.3Data collection ........................................................................................................... 10
4.3.1Field Data Collection .......................................................................................... 10
CHAPTER 5 ....................................................................................................................... 13
Results and Discussion ....................................................................................................... 13
5.1General ....................................................................................................................... 13
5.2Model development ................................................................................................... 13
5.3ANN model ................................................................................................................ 13
5.4GP model ................................................................................................................... 14

viii
5.5 MLR model ............................................................................................................... 14
5.6Ranges of BLOS Categories ...................................................................................... 14
Summary and Conclusions ................................................................................................. 15
6.1Conclusions ................................................................................................................ 15
6.2Future Scope .............................................................................................................. 15
References ....................................................................................................................... 16

1
CHAPTER 1
Introduction
1.1 General:
Since most recent five years the volume of mechanized vehicles has hugely expanded on
street fragments of urban India with a yearly development rate of approximately 10.16 rate.
In India, step by step states of streets are deteriorating. Since most recent five years there is
a yearly development rate of 10.16 percent in the normal increment of vehicles. Because of
expansion in movement there is activity blockage, increment in clamor and air
contamination, and increment in mishap rates. Numerous mischances are happening in India
because of blended activity and rapid moving vehicles. We need a methodology in area use
arranging itself to cutoff interest for private transport. Existing street space ought to be
overseen proficiently. Due consideration ought to be given to natural insurance. The method
of transport which is exceptionally maintainable gives high availability furthermore
portability to the street clients in an eco-accommodating way. Thus one ought to build green
mode decision. Non-mechanized vehicles like people on foot and bikes must be supported.
They are cost productive, eco-accommodating and reduce fuel utilization.
Henceforth there is a need to shield the bicyclists from danger elements. The offer of bike
outings from general excursions has additionally declined now a days. It is because of the
absence of solace being given by the geometric condition to their travel. We have to give a
protected foundation to non-mechanized vehicles. Isolation of street space ought to be
accomplished for both bicyclists and walkers by giving both bike paths and walkways.
1.2 Problem Statement:
Bicyclists are the appealing mode for low wage family units furthermore effectively
available for short treks. Henceforth we ought to accentuate on them by considering
components influencing bicyclists solace in arranging and outline stage itself. In India there
is heterogeneous movement where we discover associations amongst bikes and vehicles.
There are no spatial allotment or cycle tracks independently for bicyclists. Thus we can't
have any significant bearing the bike level of administration models of created nations in
our nation as they have homogeneous movement. Since no systems are accessible an
2
approach is to be created that gives the see solace level of bicyclists on street sections in
moderate sized urban communities.
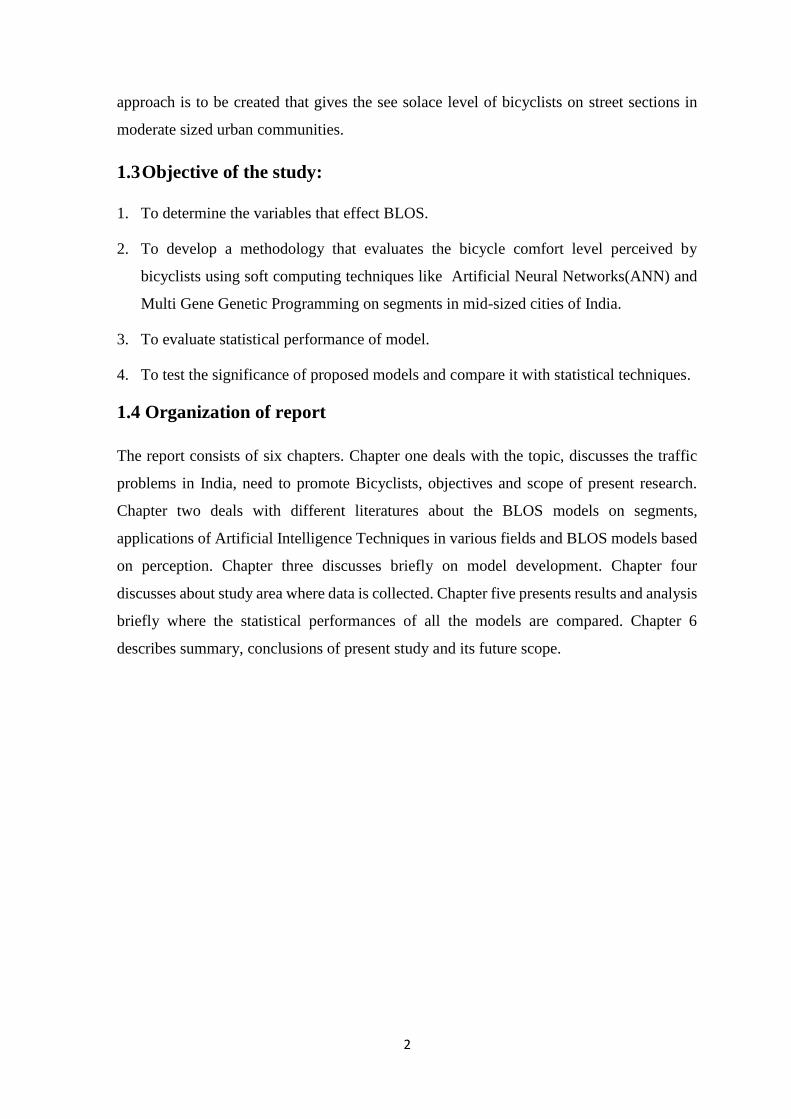
1.3 Objective of the study:
1. To determine the variables that effect BLOS.
2. To develop a methodology that evaluates the bicycle comfort level perceived by
bicyclists using soft computing techniques like Artificial Neural Networks(ANN) and
Multi Gene Genetic Programming on segments in mid-sized cities of India.
3. To evaluate statistical performance of model.
4. To test the significance of proposed models and compare it with statistical techniques.
1.4 Organization of report
The report consists of six chapters. Chapter one deals with the topic, discusses the traffic
problems in India, need to promote Bicyclists, objectives and scope of present research.
Chapter two deals with different literatures about the BLOS models on segments,
applications of Artificial Intelligence Techniques in various fields and BLOS models based
on perception. Chapter three discusses briefly on model development. Chapter four
discusses about study area where data is collected. Chapter five presents results and analysis
briefly where the statistical performances of all the models are compared. Chapter 6
describes summary, conclusions of present study and its future scope.
3
CHAPTER 2
Literature Review
2.1General
As per HCM 2010, level of service is characterized as a subjective measure that portrays
operational attributes of a driver inside an activity stream considering the view of drivers or
travellers. LOS idea is initially presented in 1965. Levels speak to scope of working
conditions characterized by measures of adequacy (MOE). In 1985, HCM concentrated on
bike sways on mechanized vehicle limit. In 2000, HCM LOS depends on bike rate, deferral
and deterrent where as in 2010, LOS depends on explorer's observation whose Score range
1-6.
2.2Selection of variables affecting BLOS on segments
The geometric elements of roadway and movement attributes that are exceedingly affecting
bicyclists are considered and different models are created. Davis (1987) managed the
security of bicyclists in view of the roadway qualities. The creator created Bicycle Safety
Index Rating (BSIR) model to assess BLOS. The created model comprises of two divisions.
The previous is Roadway Segment Index which is a component of parameters like width of
outside through path, state of asphalt, path number, area conditions and speed limits. The
latter is Intersection Evaluation Index (IEI) which relies on upon signalization sort, all out
number of vehicular activity and other geometric elements. Different parameters like slope,
substantial vehicles rate and street markings are not considered in BSIR model. RSI Model
is altered and roadway condition Index (RCI) model is proposed by Epperson (1994) which
is named as Epperson-Davis Model. The model concentrated on restricted fragments having
vehicles moving with fast and subsequently it altered path width by increasing it with rate
limit. Later Davis (1995) made corrections to RSI display and created Bicycle
reasonableness Rating (BSR). The creator finished up, the fundamental components to
decide fulfilment level of bicyclists is number of vehicles and their pace. Landis (1994)
dealt with methods to overcome the problem of extensive subjectivity used in assessing the
variables that are used at that period and hence developed Bicycle Interaction Hazard Score
(BIHS). Additional variables namely land use (LU) and curb cut frequency (CCF) are used
in model. Mozer (1994) presented two variables in his model namely pedestrian volume

4
factor and non-motorized volume during peak hours. Jensen (2007) managed the fulfilment
level of bicyclists and a model is proposed to assess LOS on sections. Taking into account
six level scale, the bike clients of Denmark have given evaluations extending from
'A'(highly fulfilled) to 'F'(highly dissatisfied).The presence of bike path and its width has
much effect on BLOS. In this model, nature of asphalt and states of climate are not
considered. Matters and Cechvala (2014) created BLOS on urban roadways by considering
the applicable strategy delineated in HCM(2010).Multimodal LOS extending is utilized by
the creator to assess LOS amongst "A" and 'F'.A affectability examination was conveyed to
decide the most influencing info variables. From a few information sources like aeronautical
photos number of overwhelming vehicles, pace of activity, aggregate number of vehicles,
and number of paths are gathered. The disadvantage of the model is there is no thought of
directional segment.
2.3Application of Artificial Intelligence Techniques
Muduli and Das (2014), concentrated how to assess liquefaction of soil utilizing MGGP
which is a manmade brainpower strategy by leading standard infiltration test. The creator
considered an aggregate information set of 227.Also creating models utilizing MGGP,
ANN, and some measurable techniques he thought about 3 models as far as factual criteria
and watched that the execution is more in MGGP contrasted with different models. Muduli
et al (2015) built up the models for foreseeing the limit of inspire of a suction caisson in
soils like earth. The creator created model utilizing ANN.
Semeida (2012) managed components of roadway and posted rate restricts that are for the
most part influencing the operational velocity on expressways. In this paper creator
performed examination utilizing Regression and ANN on both desert and farming
parkways. At last the creator closed in respect of R2 and RMSE, ANN gives the best
execution. Semeida (2013) created limit and level of administration models on roadways of
Egypt utilizing two systems in particular Artificial Neural Networks and Regression on both
desert and Agricultural expressways. Information is gathered from 45 different locales to
create models. The creator inferred that ANN gives best execution contrasted with relapse.

5
CHAPTER 3
Methodology
3.1General
In this section, different techniques to be specific Artificial Neural Networks (ANN) and
Multi Gene Genetic Programming (MGGP) that are utilized to create BLOS model on
portions of fair sized urban communities are examined quickly. The present study manages
the choice of system structure, preparing calculation and learning rules in ANN where as in
MGGP the arrangement is spoken to as tree structure which is clarified.
3.2Artificial neural network
In machine learning and subjective science, counterfeit neural systems (ANNs) are a group
of models propelled by natural neural systems (the focal sensory systems of creatures,
specifically the cerebrum) which are utilized to gauge or surmised capacities that can rely
on upon an expansive number of inputs and are by and large obscure. A structure having ‘n’
inputs and ‘m’ neurons is a single layer network. The input space of n dimension is being
mapped to output space of m dimension. The algorithm that we use for a single neuron can
be applied to train the network. Linear problems mainly use this type of networks. Nonlinear
data sets are not solved by single layer network. Hence for those cases multi-layer network
structure should be preferred.
In multi-layer network neurons are not connected directly to output. It has some hidden
layers in between them. Those layers are treated as hyper planes which increases capacity
in separating a network. To train the hidden layers feed forward back propagation Algorithm
is used in this study. The main principle is the data feeded to input layer, which is forwarded
to all the hidden layers and the output from each hidden layer is calculated and finally output
is obtained. To minimize the error obtained in the output layer, back propagation principle
is applied where error is propagated back based on weights of connection to find out the
change in weight. During training of each sample the above process is repeated. The above
process carried in a cycle during training is called epoch. The error obtained in the output
layer decides epoch number when it has to be stopped. Figure 5.1 shows the network
structure of ANN used in the present study to determine BLOS.

6
The size of changes in weight are determined by learning coefficient (n). The learning
process is slow if n value is less. Changes in weights will be more if n value is large so that
desired minimum will be missed. In general n value between 0.05 and 2 is highly desirable.
Adaptive learning is an extensive technique. Initially high n value helps in avoiding local
minima, later on decrease in n value prevents crossing the obtained minimum. All the inputs
influences momentum (a) which causes changes in weights. The range preferable is 0-1.
Due to momentum for certain data training is carried out fast but some other data there is
no change.
Figure 3.1 Artificial Intelligence Neural Network Nodes
3.3Genetic Programming:
In computerized reasoning, hereditary programming (GP) is a strategy whereby PC projects
are encoded as an arrangement of qualities that are then altered (advanced) utilizing a
transformative calculation (regularly a hereditary calculation). The outcome is a PC
program ready to perform well in a predefined errand. Frequently confounded to be a sort
of hereditary calculation, GP can to be sure be seen as a use of hereditary calculations to
issues where every individual is a PC program. The strategies used to encode a PC program
in a manufactured chromosome and to assess its wellness as for the predefined assignment
are focal in the GP system and still the subject of dynamic examination.

7
In 1954, spearheading chip away at what is today known as simulated life was completed
by Nils Aall Barricelli utilizing the early PCs. In the 1960s and mid 1970s, developmental
calculations turned out to be broadly perceived as advancement strategies. Ingo Rechenberg
and his gathering could take care of complex building issues through advancement
techniques as archived in his 1971 Ph.D. postulation and the subsequent 1973 book. John
Holland was exceedingly persuasive amid the 1970s. The foundation of developmental
calculations in mainstream researchers permitted, by then, the principal solid strides to
examine the GP thought.
In 1964, Lawrence J. Fogel, one of the most punctual professionals of the GP philosophy,
connected developmental calculations to the issue of finding limited state automata. Later
GP-related work became out of the learning classifier framework group, which created sets
of inadequate guidelines portraying ideal strategies for Markov choice procedures. In
1981Richard Forsyth developed tree guidelines to arrange coronary illness. The principal
articulation of cutting edge "tree-based" hereditary programming (that is, procedural
dialects sorted out in tree-construct structures and worked with respect to by reasonably
characterized GA-administrators) was given by Nichael L. Cramer (1985). This work was
later significantly extended by John R. Koza, a primary advocate of GP who has
spearheaded the utilization of hereditary programming in different complex enhancement
and hunt issues. Gianna Giavelli, an understudy of Koza's, later spearheaded the utilization
of hereditary programming as a strategy to model DNA expression.
In the 1990s, GP was primarily used to take care of generally straightforward issues since
it is computationally serious. As of late GP has delivered numerous novel and exceptional
results in zones, for example, quantum registering, electronic configuration, diversion
playing, digital terrorism counteractive action, sorting, and looking, because of upgrades in
GP innovation and the exponential. These outcomes incorporate the replication or
advancement of a few post-year-2000 creations. GP has been connected to equipment and
PC programs.

8
Figure 3.2 Example of a GP tree structure

9
CHAPTER 4
Data collection
4.1General:
The objective of the information gathering is to make and perform an arrangement
of overviews that can be reliably and dependably actualized over all modes. To accomplish
the point of this concentrate all the geometric and activity related parameters (Quantitative
information) influencing the level of administration of bikes are gathered. Aside from the
field information, video and Questionnaire overview are conveyed to assess the apparent
level of administration gave by the streets to bicyclists. In the present section, study zone
and methodology to gather information is talked about in point of interest. Likewise the
parameters gathered are introduced.
4.2Study Area:
The site to be overviewed ought to be such that it ought to incorporate all the
properties those are exceptionally influencing solace level of bicyclists. All the fragments
giving abnormal state of administration that are brilliant and the roadways with low quality
of administration are incorporated into present study. The related information required for
the present examination is gathered from Bhubaneswar (29 fragments), Rourkela (19
portions) and Rajahmundry (11 sections).
Figure 4.1: Study area showing Rourkela, Rajahmundry and Bhubaneswar
10
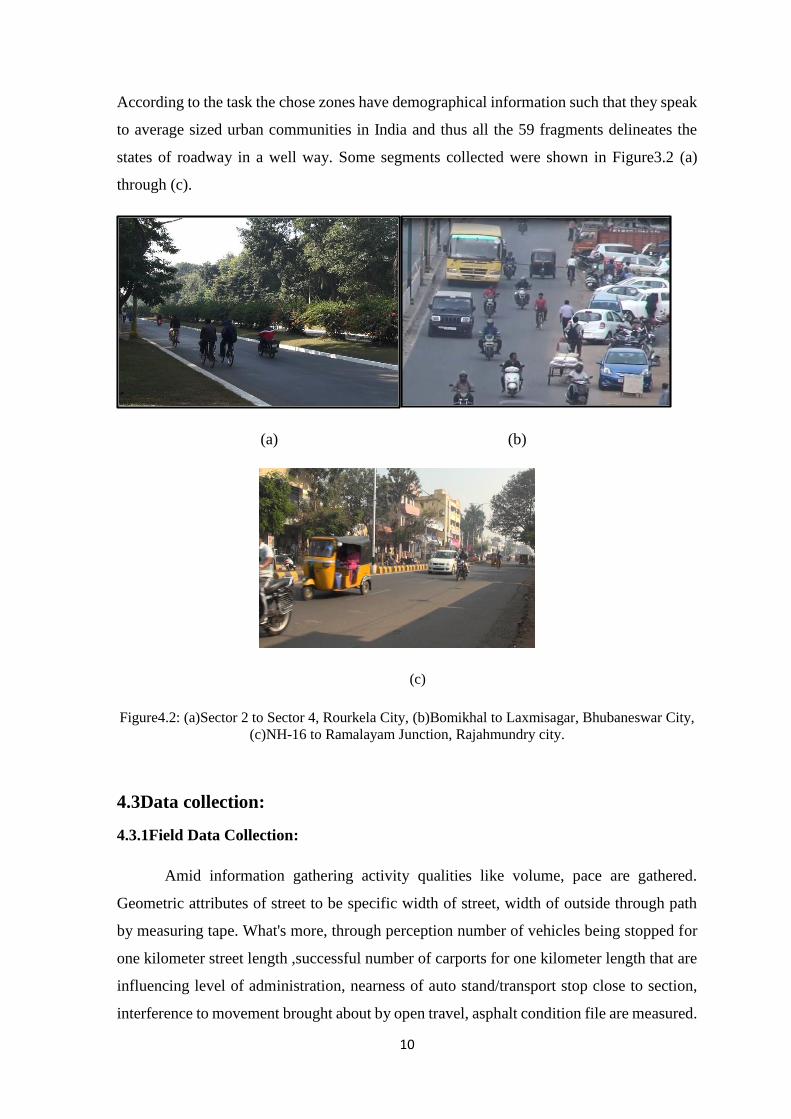
According to the task the chose zones have demographical information such that they speak
to average sized urban communities in India and thus all the 59 fragments delineates the
states of roadway in a well way. Some segments collected were shown in Figure3.2 (a)
through (c).
(a) (b)
(c)
Figure4.2: (a)Sector 2 to Sector 4, Rourkela City, (b)Bomikhal to Laxmisagar, Bhubaneswar City,
(c)NH-16 to Ramalayam Junction, Rajahmundry city.
4.3Data collection:
4.3.1Field Data Collection:
Amid information gathering activity qualities like volume, pace are gathered.
Geometric attributes of street to be specific width of street, width of outside through path
by measuring tape. What's more, through perception number of vehicles being stopped for
one kilometer street length ,successful number of carports for one kilometer length that are
influencing level of administration, nearness of auto stand/transport stop close to section,
interference to movement brought about by open travel, asphalt condition file are measured.

11
From each portion camcorders are utilized to gather the activity information by putting them
along the halfway of section. Amid times of top hours, for around two hours video is
gathered for each segment. Using radar firearm spot rates of vehicles are gathered crest.
(a) Tripod Stand (b) Video Camera
(c) Radar Gun (d) Measuring Tape
Figure 4.3 (a) Tripod Stand, (b) Video Camera, (c) Radar Gun, (d) Measuring Tape
Different geometrical estimations were completed with the assistance of measuring tapes.
The asphalt states of the sections were evaluated by taking after five point rating
framework. As the point of the present study is to decide the solace level offered by the
roadway to bicyclists taking into account every one of the parameters of roadway,
observation study is conveyed to decide the recognition rating.
To convey a discernment overview, a survey is readied. In the Questionnaire suburbanites
of individual portions are requested that rate the Questions on a five point scale, the
minimum quality extending from unequivocally differ to the most elevated worth being
firmly concur. Through the street side meeting, rating is gathered from more than 590

12
respondents (i.e. no less than 10 members for 59 fragments) lastly comfort rating assessed
for those portions.
13
CHAPTER 5
Results and Discussion
5.1General
In the present study, BLOS models are developed using three techniques namely Artificial
Neural Networks (ANN), Multi Gene Genetic Programming (MGGP) and Multiple
Stepwise Regression. Performances of these models have been evaluated.
5.2Model development
Eight significant input parameters are inputted in the Form Pearson’s correlation analysis,
these parameters are observed to have high influence on satisfaction levels perceived by
bicyclists on Indian road segments. Hence these parameters are used for developing several
prediction models in this study. Randomly selected 70% of data (i.e. 41 segments) are used
for model training and remaining 30% (i.e. 18 segments) for model testing.
5.3ANN model
In the present study, two ANN models are produced and the best model is acquired. The
yield parameter having a solitary hub is BLOS. A solitary concealed layer is considered in
the present study subsequent to any nonstop capacity can be approximated. The move
capacity utilized as a part of the covered up and yield layer neurones is digression hyperbolic
capacity (tanh).
The BLOS model created utilizing BRNN strategy is appeared as a part of condition 5.1
through 5.8. The estimations of parameters to be inputted in condition 5.1 through 5.3 are
standardized in the extent [0, 1]. The denormalized estimation of anticipated BLOS score
can be discovered utilizing condition 5.9.
Equations and table left blank for publication purpose.
Sensitivity Analysis is carried using Garson’s algorithm and connection weight
approach and results are shown in table 5.3 and 5.4.
Table left blank for publication purpose

14
According to Garson’s algorithm, relative importance of all eight input parameters in ANN
models are shown in figure 5.3 (a) and (b).
Figure left blank for publication purpose
5.4GP model
A BLOS model has been developed using Genetic Programming (MGGP) technique
is shown in equation 5.38.
Equation left blank for publication process
Figure 5.8 shows the performance of MGGP Model.
Fig left blank for publication purpose
MGGP model had a good correlation with BLOS model compared to statistical technique.
Based on error criteria, the performance of this model is good compared to ANN Models.
5.5 MLR model
MLR model is shown in equation (5.39)
Equation left blank for publication purpose.
5.6Ranges of BLOS Categories:
Ranges of BLOS are defined using clustering technique and shown in figure 5.10.
Figure5.6: Ranging of LOS
0 1 2 3 4 5 6 70
0.5
1
1.5
2
2.5
3
3.5
4
4.5
5
BLOS Score
BLO
S Sc
ore
LOS F >= 3.51
LOS E > 3.31-3.51
LOS D >3.1-3.31
LOS C 2.84-3.1
LOS B 2.44-2.84
LOS A <= 2.44

15
CHAPTER-6
Summary and Conclusions
6.1Conclusions
Soft computing Techniques namely ANN and MGGP have better performance compared to
statistical technique. MLR is used to develop BLOS model in present study and also MGGP
has more generalization compared to ANN.
6.2Future Scope
i. Comfort level of bicyclists is likewise influenced by inclination and sight
separations which are not considered in present concentrate, along these lines BLOS
models can be produced by considering these two parameters.
ii. Further information ought to be gathered from urban communities having high
differential movement to re-enact both great to the most exceedingly terrible states
of activity.
iii. BLOS models can be produced utilizing other Artificial Intelligence procedures and
are thought about as far as measurable execution.

16
References
Das, S. K., & Basudhar, P. K. (2008). Prediction of residual friction angle of clays using artificial
neural network. Engineering Geology, 100(3), 142-145.
Davis, J. (1987). “Bicycle safety evaluation.” Auburn University, City of Chattanooga, and
Chattanooga-Hamilton County Regional Planning Commission, Chattanooga, TN.
Davis, J. (1995). “Bicycle Test Route Evaluation for Urban Road Conditions.”Transportation
Congress: Civil Engineers-Key to the World Infrastructure.American Society of Civil Engineers,
San Diego, CA, pp. 1063-1076.
Dixon, L. (1996). “Bicycle and pedestrian level-of-service performance measures and standards for
congestion management systems.”Transportation Research Record, 1538, pp. 1-9.
Eddy, N. (1996) “Developing a Level of Service for Bicycle Use.” Pro Bike/Pro Walk 96 Resource
Book. Proceedings of the Ninth International Conference on Bicycle and Pedestrian Programs
Resource Book, Bicycle Federation of America and Pedestrian Federation of America, pp. 310-314.
Epperson, B. (1994). “Evaluating Suitability of Roadways for Bicycle Use: Toward a Cycling Level-
of-Service Standard.”Transportation Research Record, 1438, TRB, National Research Council,
Washington, DC, pp. 9-16.
HCM (2010). “Highway Capacity Manual.”Transportation Research Board, Washington, D.C.
Landis, B. W. (1994). “Bicycle Interaction Hazard Score: A Theoretical Model.” Transportation
Research Record, 1438, TRB, National Research Council, Washington, DC, pp. 3-8.
Landis, B. W., Vattikuti, V. R. and Brannick, M. T. (1997). “Real-Time Human Perceptions: Toward
a Bicycle Level of Service.” 76th annual meeting of Transportation Research Board, 1578, Paper
No. 970428, TRB, Washington, D.C., pp. 119-126.
Matters, B. and Cechvala, M. (2014). “Bicycle Level of Service for Urban
Streets.”http://www.madisonareampo.org/planning/documents/3_BLOSwrite-up.pdf
Mozer, D. (1994). “Calculating multi-mode levels-of-service.”International Bicycle Fund, Seattle,
WA.
Semeida, A. M. (2013). Impact of highway geometry and posted speed on operating speed at multi-
lane highways in Egypt. Journal of advanced research, 4(6), 515-523.


