© 2014 Woodhead Publishing Limited
62
3 Assessing the significance of corrosion
in onshore oil and gas pipelines
P. HOPKINS , Penspen Limited, UK
DOI : 10.1533/9780857099266.1.62
Abstract : Oil and gas currently provide 54% of the world’s primary energy needs, 1 and these energy forms rely, mainly, on pipelines for their transportation. Accordingly, there are over 3 500 000 km of high pressure oil and gas pipelines around the world. These pipelines were built many years ago: inevitably they have corroded, and will continue to corrode. Accordingly, it is essential that this corrosion is detected, assessed and rectifi ed. This chapter covers the assessment of corrosion in onshore (underground) pipelines. It presents a state-of-the-art review, with both recommendations and insights into the various assessment methods available today.
Key words : corrosion, pipelines, assessment.
3.1 Introduction
Oil and gas currently provide 54% of the world’s primary * energy needs, 1
and there are over 50 years’ supplies of proven and recoverable reserves
of oil and gas. 2 These energy forms rely, mainly, on pipelines for their trans-
portation. Accordingly, there are over 3 500 000 km of high pressure oil and
gas pipelines around the world, 3 Fig. 3.1. Most of these pipelines were built
many years ago: they started life in perfect condition, well protected against
corrosion using external coating and cathodic protection (CP). But as the
pipeline ages, its coating may also age, and then corrosion can commence.
This ageing, and the problems it brings, can restrict the future use of these
pipelines as they are prepared for the next 50 years of service.
Pipelines are a very safe form of transportation and have a very good
safety record; 4 however, corrosion is a major cause of failure in both onshore
(underground) and offshore pipelines. Figure 3.2 5 shows failure data from
the USA over a 20 year period (1993–2012) on its 500 000 mile (800 000 km)
network of onshore hazardous (e.g., petroleum and petroleum products)
* All energy consumed by end users, excluding electricity, but including the energy con-sumed at electric utilities to generate electricity.

Assessing corrosion in onshore oil and gas pipelines 63
liquid pipelines and natural gas pipelines. Corrosion is not the major fail-
ure cause: ‘material failures’, such as weld failures, and ‘excavation damage’,
where pipelines are impacted by earth moving equipment, piling machines,
etc., are also major causes of failure. However, these corrosion failures can
have deadly consequences, 6 (see Table 3.1), 7 and cause property damage
of over $US20 million/annum in the USA. 8 This chapter will explain the
problem of corrosion in onshore pipelines and how it is detected, and then
go into the details of how corrosion is assessed to determine if it requires
repair or not.
3.1 Transmission pipeline being constructed.
Table 3.1 Consequences of pipeline failures in USA (1993–2012) 7
Natural gas Liquid pipelines
Fatalities Casualties Fatalities Casualties
Corrosion 13 4 1 18
Excavation damage 15 51 12 38
Incorrect operation 0 9 9 20
Material/weld/equipment
failure
8 71 4 12
Natural force 0 2 0 1
Other outside force 0 13 3 5
All other causes 6 38 10 43

64 Underground pipeline corrosion
3.2 Corrosion in onshore pipelines
The USA’s National Association of Corrosion Engineers (NACE) defi nes
corrosion as: ‘ The deterioration of a material, usually a metal, which results from a reaction with its environment ’. Therefore, corrosion is a time depen-
dent, environmentally-assisted mechanism that causes a metal to deteriorate
by reaction with its environment. Pipeline design and operation aim to mini-
mise corrosion, but inevitably a pipeline can contain external corrosion, due
to a breakdown of the coating and/or the CP system; or internal corrosion,
due to the fl uid in the pipeline containing corrosive elements. Figure 3.3 is
an example of corrosion on an operating pipeline.
Corrosion is created within an electrochemical cell, Fig. 3.4. A pipe-
line’s electrolyte is the surrounding soil (for onshore pipelines), and water
(for subsea pipelines), Fig. 3.4. Corrosion is an oxidation process, and the
10%
16%
21%
20%
2%
24%
11%
6%
23%
All other causes
All other causes
Corrosion
Corrosion
Excavation damage
Excavation damage
Incorrect operation
Incorrect operation
Material failure
Material failure
Natural force
Natural force
Other outside force
Other outside force
13%
10%
38%
4%2%
3.2 Causes of pipelines failures in onshore USA pipelines (liquid (top)
and natural gas (bottom)).

Assessing corrosion in onshore oil and gas pipelines 65
3.3 Pipelines are surrounded by earth that can lead to external
corrosion.
Ion flow
Electrolyte
Cathode
– ions
Electron flow
+ ionsAnode
CorrosionPit
Cathodearea (–)
Anodearea (+)Electron
flow, 2e
Electrolyte
3.4 Electrochemical cell (top), and electrochemical cell in pipeline
(bottom).

66 Underground pipeline corrosion
oxidation of a metal is corrosion. The iron (Fe) is changed, with removal of
electrons (oxidation) at the anode (Fig. 3.4):
Fe F 2e2→ +Fe2+ −2e+ [3.1]
The electrons produced and lost during oxidation move through the metal
to another location, where they are consumed in a reaction that produces
hydroxyl ions at the cathode (Fig. 3.4):
2H O O 4e 4OH2 2O O+ +O2O → −4OH− → [3.2]
This corrosion can cause pipeline failures, Section 3.1, including deadly
ruptures. 6
3.3 Detecting corrosion
Corrosion can be detected in onshore pipelines using a variety of methods,
but the most common are:
excavation; •
above-ground surveys; and •
internal inspection using in-line tools. •
Pipeline excavation is the most thorough method of detecting and measur-
ing corrosion, but it is usually the most expensive inspection technique. It
is generally used as a last resort, as it may require pressure reduction, with
operational cost implications.
Above-ground surveys (Table 3.2) can be used to infer the presence of
corrosion by monitoring CP and coating condition. Inspection methods
include:
Table 3.2 Above-ground CP/coating surveys for onshore pipelines
Type of survey Survey technique Type of
survey
Soil survey Soil resistivity.
Soil chemical analysis.
Soil survey
Coating survey Pearson.
Signal attenuation (Cscan).
Current mapper.
DCVG (can also indicate CP status).
Coating
survey
CP survey CP monitoring data e.g., off potentials.
Close interval potential (can also indicate
coating status).
CP survey

Assessing corrosion in onshore oil and gas pipelines 67
CP checks. •
Direct current voltage gradient (DCVG) detects coating defects in bur-•
ied pipelines by measuring the voltage gradients in the soil from the CP
system.
Pearson survey (similar to DCVG, but uses AC). •
Close interval potential surveys (CIPS) measure the pipe-to-soil poten-•
tial (voltage) to determine CP coverage.
We can also internally inspect and monitor our pipelines using tools that
move along with the product fl ow. These tools are known as in-line inspec-
tion vehicles, or pigs, Fig. 3.7. These tools can reliably detect both internal
and external corrosion, and accurately size the corrosion. These tools have
been used since the 1960s, and are now in common use in most liquid and
gas pipelines.
3.4 Preventing corrosion
Corrosion requires four factors to be present for it to occur (Fig. 3.4):
an anode; •
a cathode; •
a metallic path connecting the anode and cathode; •
an electrolyte. •
If any of these factors is not present, or prevented (e.g., coating a pipeline
to prevent contact with the electrolyte), then corrosion cannot occur. As
Fig. 3.6 shows, corrosion results in:
Metal loss (the corrosion defect can have a smooth or irregular profi le, •
and possibly contain blunt or sharp features).
Cracking. •
Environmental cracks, caused by a corrosive environment. •
Environmentally-assisted cracking includes stress corrosion cracking,
sulphide stress corrosion cracking, and hydrogen induced cracking. This
chapter will focus on assessing blunt corrosion, but will briefl y cover the
assessment of cracks; readers who want to assess cracking in pipelines
should refer to the more detailed literature (e.g., see References 9–11).
3.4.1 Preventing external corrosion
External coatings are our primary protection against external corrosion:
Fig. 3.5 gives examples of popular coatings used on pipelines. Pipelines
are constructed using (typically) 12 m lengths of ‘line pipe’. The line pipe is

68 Underground pipeline corrosion
usually coated at a factory before delivery to the construction site. Factory
coatings are excellent, but they will never be perfect. If we lose the protec-
tive coatings around the pipeline, the pipeline will be exposed to the envi-
ronment. This environment (soil or seawater) will contain water and oxygen,
which will cause corrosion if there is no coating protection.
Therefore, to enhance protection, operators began installing CP systems.
Our CP system will protect areas of our pipeline where our coating is faulty.
Hence, we need to check to see that our CP system is functioning correctly.
The pipe coating condition tends to deteriorate with time; this causes an
increased CP current requirement. Cathodically protected pipelines are
equipped with permanent test stations, where electronic leads are attached
to the pipeline to measure the pipe-to-soil potential. This potential should
be suffi ciently cathodic to ensure adequate corrosion protection, but not so
cathodic as to produce coating damage and/or hydrogen embrittlement.
3.4.2 Preventing internal corrosion
For corrosion to occur in a pipeline, there must be liquid water present, and the
water must wet the wall of the pipe: internal corrosion generally cannot occur
in a pipeline unless there is an electrolyte to complete the corrosion cell. Water
or other aqueous materials (such as glycols from dehydration processes) are
needed to form the electrolyte. Also, other chemicals usually must be present:
for example, carbon dioxide (CO 2 ) for the formation of dilute organic and
inorganic acids; or, sulphur for the formation of acid or growth of bacteria.
Once introduced, the corrosive materials may continue to damage the pipeline
until they are removed, or until they are consumed in corrosion reactions.
We can prevent internal corrosion by:
treating the product prior to entry into the line (e.g., removing water), •
and checking quality;
3. Polyethylene2. Adhesive
1. FBE
Line pipeLine pipe
Fusion bonded epoxy (FBE)
3.5 Examples of external coatings on pipelines (fusion bonded epoxy
(left), ‘3 layer’ (right)).

Assessing corrosion in onshore oil and gas pipelines 69
cleaning the line to remove corrosion debris; •
mixing chemicals to ‘inhibit’ (slow down) any corrosion; •
lining the line pipe with a corrosion resistant alloy; •
using biocides in the pipeline to inhibit the corrosive actions of microbes •
that cause microbiologically infl uenced corrosion (MIC), and thereby
reduce or eliminate MIC.
We can also include a ‘corrosion allowance’ (increased thickness of line
pipe) to accommodate in-service, predictable, corrosion.
3.5 Assessment of corrosion
Corrosion assessment is important, as inspection methods can now easily
detect its presence and size: there is therefore an increasing need to deter-
mine its severity rather than continuously to excavate and repair. This
section will cover all the major methods for assessing corrosion. 12–15 Any
assessment of a defect in a structure is called an engineering critical assess-
ment (ECA): these assessments use fracture mechanics principles. 10,11 These
ECAs are sometimes called ‘fi tness-for-purpose’ assessments. Fitness-for-
purpose, in a defect assessment context, means that a particular structure
is considered adequate for its purpose, provided the conditions for failure
are not reached. 10 It is based on a detailed technical assessment of the sig-
nifi cance of the defect. This term, however, has different legal implications
in different countries, 16 and local and national legislation/regulations may
not permit certain types of defects to be assessed by fi tness-for-purpose
methods, or may mandate specifi c limits. Such issues should always be con-
sidered before an assessment. It is better to refer to the fi tness-for-purpose
assessment of a defect simply as an ‘assessment’.
3.5.1 The development of modern assessment methodology
Fracture mechanics provides scientifi c understanding of the behaviour of
defects in structures. The effect of defects on structures was studied as long ago
as the fi fteenth century by Leonardo da Vinci, but prior to 1950 failure reports
of engineering structures did not usually consider the presence of cracks: cracks
were considered unacceptable in terms of quality, and there seemed little pur-
pose in emphasising this. Additionally, it was not possible to apply the early
fracture mechanics work of pioneers such as Griffi th to engineering materials,
since it was applicable only to perfectly elastic materials, i.e. it was not directly
applicable to engineering materials such as line pipe, which exhibit plasticity.
The 1950s and 1960s were periods where the safety of transmission pipe-
lines was of interest, primarily in the USA. Early workers on pipeline defects

70 Underground pipeline corrosion
were faced with problems; 17–22 pipelines were thin walled, increasingly made
of tough materials, and exhibited extensive plasticity before failure. The
fracture mechanics methods (using stress intensity factor, K ) at that time
used linear elastic theories that could not reliably be applied to the failure
of defective pipelines, as they would have needed: 4
quantitative fracture toughness data, including measures of initiation •
and tearing (only simple impact energy (e.g., Charpy V-notch) values
were available);
a measure of constraint (this concept was not quantifi able in the 1960s, •
other than by testing);
a predictive model for both the fracture and the plastic collapse of a •
defect in a thin-walled pipe.
Workers 17–22 at the Battelle Memorial Institute in Columbus, Ohio,
decided to develop methods based on existing fracture mechanics models,
but they overcame the above defi ciencies in fracture mechanics knowl-
edge by a combination of expert engineering assumptions and calibrating
their methods against the results of full-scale tests. Over a 12 year period,
up to 1973, 19 over 300 full-scale tests were completed, but the main focus
was on:
92 tests on axially orientated artifi cial through-wall defects; and, •
48 tests on axially orientated artifi cial part-wall defects (machined •
V-shaped notches).
These defects are reasonable models of corrosion in pipelines (Fig. 3.6).
The workers noted that line pipe containing defects tended to fail in a duc-
tile manner, and fi nal failure was by collapse, although very low toughness
Bluntcorrosion Cracking
3.6 Shape of defects cause by corrosion, and ‘blunt’ corrosion (right) in
a pipeline.

Assessing corrosion in onshore oil and gas pipelines 71
line pipe could fail in a brittle manner. The Battelle workers concluded that
two basic distinctions could be made:
‘Toughness dependent’ – these tests failed at lower stresses (pressures). •
To predict the failure stress of these tests, a measure of the material
toughness was required (e.g., the upper shelf Charpy impact energy).
‘Strength dependent’ – these tests failed at higher stresses. To predict •
the failure stress of these tests, only a measure of the material’s tensile
properties was needed.
The work at Battelle led to the development of strength (fl ow stress 19 )
dependent, and toughness dependent, through-wall and part-wall defect
equations. Flow stress was a concept introduced by Battelle to help model
the complex plastic fl ow and work hardening associated with structural col-
lapse. Flow strength is a notional material property, with a value between
yield strength and ultimate tensile strength. 19
The Battelle workers produced equations 19 that could predict when a
through-wall defect (Fig. 3.8) would extend in length (‘rupture’):
Kc
CA
E Mcv2
2 28
12
8 2c 2cπ
σ 22
π
σ 22
π σMMσ
θ= = ⎛⎝⎝⎝⎛⎛ ⎞
⎠⎞⎞⎠⎠
ln se tθ⎛⎝⎛
c⎛⎛⎝⎝⎛⎛⎛⎛ ⎞
⎠⎞⎞⎞⎞⎠⎠⎞⎞⎞⎞
oughness dependent [3.3]
Mc
Rt
c
Rt= ⎛
⎝⎜⎛⎛⎝⎝
⎞⎠⎟⎞⎞⎠⎠
− ⎛⎝⎜⎛⎛⎝⎝
⎞⎠⎟⎞⎞⎠⎠
1 0+ 3142
0 000842
2 4⎛ ⎞2
.⎝⎝⎝ ⎠⎠⎠
.314 0 [3.4]
σ σθσσ M 1 strength dependent [3.5]
3.7 Smart pig (left), and corrosion in a pipeline (right). Smart pig image
courtesy and copyright of Rosen.

72 Underground pipeline corrosion
In parallel, the Battelle workers produced an equation 19 that could predict
the pipeline hoop stress when a part-wall defect (Fig. 3.8) failed:
Kc
C AE Mc v P2
2 28
1
8 2c 2cπ
σπ
σπ σMMP
σθ= = ⎛
⎝⎝⎝⎛⎛ ⎞
⎠⎞⎞⎠⎠
ln se tP θ⎛⎝
c ⎜⎛⎛⎝⎝
⎞⎠⎟⎞⎞⎠⎠
oughness dependent [3.6]
Md t M
d tP =( )
−⎡
⎣⎢⎡⎡
⎣⎣
⎤
⎦⎥⎤⎤
⎦⎦
1 1d t− (1
[3.7]
σ σθσσ −( )
⎡
⎣⎢⎡⎡
⎣⎣
⎤
⎦⎥⎤⎤
⎦⎦
1
(1−d t
d tdstrength dependent [3.8]
A
Through-wall defect
Part-wall defect
Axialextent
t
d2c (or l)
3.8 Through-wall and part-wall defects in line pipe, and equivalent
corrosion defect (bottom).
Assessing corrosion in onshore oil and gas pipelines 73
D outside diameter of pipe ( R = D /2 = radius) t pipe wall thickness E elastic modulus M Folias factor R radius of pipe d part-wall defect depth σ θ hoop (circumferential) stress at failure (or σ f ) 2c defect axial length Cv upper shelf Charpy V-notch impact energy A area of Charpy specimen fracture surface σ̄ fl ow stress (function of σ u (ultimate tensile strength) and σ y
(yield strength))
3.6 Particular corrosion assessment methods
The two corrosion assessment methods we are going to summarise require
our line pipe to be ductile. ‘Ductile’ means the material:
has passed the ‘drop weight tear test’ (DWTT) test criteria; •
is on the Charpy toughness ‘upper shelf’; i.e., 100% shear area. •
Line pipe that meets contemporary specifi cations 23 would satisfy these crite-
ria, but because corrosion is blunt, the methods are applicable to lower Charpy
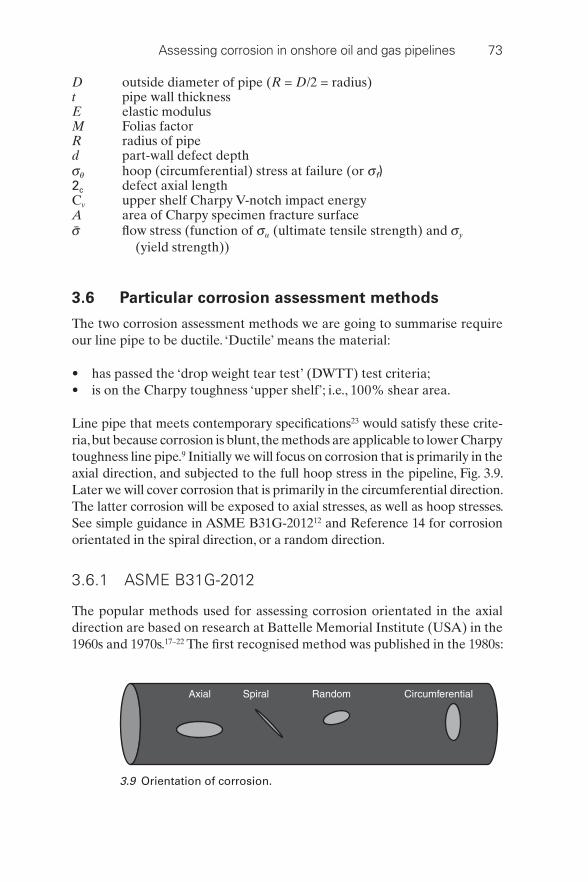
toughness line pipe. 9 Initially we will focus on corrosion that is primarily in the
axial direction, and subjected to the full hoop stress in the pipeline, Fig. 3.9.
Later we will cover corrosion that is primarily in the circumferential direction.
The latter corrosion will be exposed to axial stresses, as well as hoop stresses.
See simple guidance in ASME B31G-2012 12 and Reference 14 for corrosion
orientated in the spiral direction, or a random direction.
3.6.1 ASME B31G-2012
The popular methods used for assessing corrosion orientated in the axial
direction are based on research at Battelle Memorial Institute (USA) in the
1960s and 1970s. 17–22 The fi rst recognised method was published in the 1980s:
Axial Spiral Random Circumferential
3.9 Orientation of corrosion.

74 Underground pipeline corrosion
the pipeline industry then identifi ed a need for standardised guidelines for
the assessment of corrosion in pipelines. In 1984 ASME produced ASME
B31G (now 12 ) for assessing corrosion defects, using the early Battelle work.
ASME B31G considers corrosion in pipelines under internal pressure load-
ing only: it does not cover external loads.
ASME B31G-2012 is applicable to pipelines and bends containing:
metal loss due to corrosion or grinding; •
metal loss that affects longitudinal or helical electric seam welds or •
circumferential electric welds.
Note that the welds must be of sound quality. 12 ASME B31G-2012 now
gives the user a choice of four assessment levels, each with decreasing con-
servatism, Table 3.3. There are also choices of methods within Levels 1–3. It
is not intended to cover these levels in detail, as they have been summarised
before (e.g., see References 4, 9), but it is suffi cient to say that the ASME
B31G-2012 standard is the benchmark standard for the assessment of cor-
rosion in line pipe. This standard allows large areas of corrosion to safely
remain in an operational pipeline.
3.6.2 DNV-RP-F101
The Norwegian organisation DNV has published guidance on assessing
corrosion in line pipe. 15 DNV-RP-F101 is based on full-scale tests and
numerical analyses of corrosion defects, 24,25 and gives guidance on the
assessment of:
Table 3.3 Various assessment levels in ASME B31G-2012
ASME B31G-2012 Method
Level 0 Acceptance levels given in tables and based on the
methods in the 1984 version of the standard.
Level 1 Acceptance levels are calculated using the
methods in the 1984 version of the standard.
Acceptance levels are calculated using the
methods in Reference 13
Acceptance levels are calculated using the
methods in Reference 11
Level 2 Acceptance levels are calculated using the
methods in Reference 14
Acceptance levels are calculated using the
methods in Reference 11
Level 3 ‘Detailed’ (e.g., fi nite element stress) analysis.

Assessing corrosion in onshore oil and gas pipelines 75
single defects and interacting defects; •
complex-shaped defects (i.e., assessing the actual profi le of the defect); and, •
combined loading. •
It is not applicable to line pipe grades above X80, or to cracks, and corrosion
defect depth must be ≤ 85% wall thickness. The hoop stress to cause failure
is given by:
σ σθσσ −⎛⎝⎜⎛⎛⎝⎝
⎞⎠⎟⎞⎞⎠⎠uσ d t
d td Q1
1 1− d t [3.9]
Qc
Dt= ⎛
⎝⎜⎛⎛⎝⎝
⎞⎠⎟⎞⎞⎠⎠
1 0+ 312
2
. [3.10]
These equations are similar to the original Battelle equations (Equation
[3.8]). DNV-RP-F101 incorporates safety factors by calculating a safe work-
ing pressure:
P FxPFF fPPswPP [3.11]
where P f is the failure pressure obtained from Equation [3.9], and F = total
usage factor = F 1 F 2 . F 1 = modelling factor = 0.9, F 2 = operational usage fac-
tor (normally taken as equal to the ‘design factor’ taken from the pipeline’s
design standard).
DNV has said: 25 ‘ For old pipelines, or pipelines where the material might
not have suffi cient ductility, the… DNV… criteria should not be used.
Modern pipeline steel materials normally have suffi cient toughness to
expect plastic collapse failure.’ ‘Plastic collapse’ means the remaining liga-
ment below the corrosion defect can tolerate ultimate tensile strength, see
Equation [3.9]. Line pipe will collapse if the toughness is very high, but…
what is ‘high’, and will older line pipe collapse? Modern line pipe is of very
high toughness (Table 3.4), and should fail by plastic collapse, but older
steels do not have high toughness. 26
Table 3.4 Typical Charpy (CVN) toughness in line pipe over 7 decades 27
Decade 1950s 1960s 1970s 1980s 1990s
Grade X42/52 X52/60 X60/65 X65/70 X75
Typical CVN,
J (ft lb)
27 (20) 41 (30) 54 (40) 88 (65) 109 (80)

76 Underground pipeline corrosion
The standard itself states that its methods should not be applied to line pipe
steel materials with Charpy values less than 27 J (20 ft lb f), see Table 3.4. For
the weld, a minimum full size Charpy value of 30 J is recommended. Reference
27 supports this 27 J (20 ft lb) limit for plastic collapse: line pipe toughness
less than this value may not be able to support plastic collapse. Therefore,
a lower bound toughness to support plastic collapse of corrosion defects in
line pipe material is ≥ 27 J ( ≥ 20 ft lb). There are higher estimates in the litera-
ture: plastic collapse can be expected with a minimum toughness of 82–102 J
(60–75 ft lb), 28 which is similar to another estimate of 90 J (68 ft lb). 26
3.6.3 Comparison of corrosion assessment methods
Reference 9 compares the assessment methods detailed above. The meth-
ods were assessed against a large body of full-scale test data. The predicted
to actual failure pressures ( P a / P f ) are presented in Table 3.5. RSTRENG
gives the most accurate predictions, P a / P f .
3.7 Particular issues in corrosion assessment
This chapter has so far focussed on single corrosion defects, blunt (not sharp,
Fig. 3.6) orientated in the axial direction in line pipe material. This section
discusses other types of corrosion.
3.7.1 Corrosion on welds
It is now generally considered that longitudinal corrosion across seam welds
(other than ‘autogenous’ – a welding procedure that does not use fi ller metal
such as electric resistance welded line pipe) can be treated as corrosion in
‘parent plate’ (i.e. as though the corrosion is in the line pipe), and this is
Table 3.5 Comparison of corrosion assessment methods 9
Assessment method P a / P f P a / P f (all data except early
Grade B tests)
Mean Standard
deviation
Mean Standard
deviation
ASME B31G (Level 1) 1.330 0.468 1.347 0.479
Modifi ed B31G 13 1.184 0.285 1.194 0.289
‘RSTRENG’ 14 1.170 0.177 1.188 0.168
DNV-RP F101 15 1.178 0.318 1.205 0.309
PCORR 35,36 1.191 0.310 1.220 0.301
API 579 11 1.436 0.407 1.465 0.403

Assessing corrosion in onshore oil and gas pipelines 77
supported by test data (e.g., see Reference 29). Accordingly, standards (e.g.,
see References 10, 12, 15) allow the assessment of corrosion on welds, pro-
vided the weld mechanical properties are similar or superior to the line pipe,
and the weld must be free from other defects.
3.7.2 Assessing corrosion in the circumferential direction
We have covered methods for assessing corrosion primarily in the axial
direction (Fig. 3.8). We can now consider the assessment of corrosion in the
circumferential direction, Fig. 3.9. Internal pressure induces a hoop stress
and an axial stress: the axial stress is between 30% and 50% of the hoop
stress, depending on the pipeline end restraints. Thermal loads, ground or
pipe movement, loss of support (e.g., spanning), bends, supports, etc., can
induce additional axial and/or bending stresses. Hence, axial stress, not hoop
stress, may be the major stress acting on the corrosion defect. Therefore, we
need an assessment method to assess corrosion in a pipeline subjected to
high axial loads – if the corrosion is primarily in the circumferential direc-
tion, or if the corrosion has extensive width.
Kastner et al . 30 published a failure criterion for a circumferential part-wall
defect subject to internal pressure, axial and/or bending loads. This is now
the most popular method for assessing circumferential corrosion. The axial
stress at failure ( σ f ) is given by:
σσ
ηηπ β
fσ=
( )π β− β [ ]η+ [ ]η− ( )ββ2[ [3.12]
and fl ow stress is the average of σ u and σ y
β
η
=
= −
cR
dt
1
Note that safety factors must be applied to this predicted axial stress at
failure, and metal loss having a signifi cant circumferential extent and acted
on by high longitudinal stresses in compression could be susceptible to wrin-
kling or buckling.
Corrosion with both axial extent and circumferential extent can fail due
to hoop stress and axial stress. Under pressure loading only, the axial dimen-
sion is the critical dimension, and unless the circumferential length > axial
length, you do not need to consider the circumferential failure. 14 However,

78 Underground pipeline corrosion
if you have very high* external loads (e.g., mining subsidence or spanning)
you must conduct the two calculations – failure under pressure loading (e.g.,
ASME B31G-2012), and failure due to the axial loads (Equation [3.12]).
3.7.3 Assessing group of corrosion defects
Corrosion often occurs in groups (colonies), Figs. 3.3 and 3.10. The failure
stress of a corrosion defect can be reduced by the presence of another corro-
sion defect. When the failure stress of an individual defect is reduced by the
presence of a neighbouring defect, we say that the defects ‘interact’. ASME
B31G-2012 explains interaction: ‘ Corrosion may occur such that multi-
ple areas of metal loss are closely spaced longitudinally or transversely. If
spaced suffi ciently closely, the metal loss areas may interact so as to result
in failure at a lower pressure than would be expected based on an analysis
of the separate fl aws’.
If the defects interact, we have to assess the defects as a single defect of
length and width equal to the total dimensions, and a depth equal to the
maximum depth of the group. The new total length, width and maximum
depth has to be input into our failure equations. Various standards (e.g., see
References 12, 15) give interaction rules. ASME B31G-2012 states:
Flaws are considered interacting if they are spaced longitudinally or circumfer-
entially from each other within a distance of three times the wall thickness (3t).
Interacting fl aws should be evaluated as a single fl aw combined from all inter-
acting fl aws. Flaws are considered non-interacting if spaced outside of the above
dimensions. Non-interacting fl aws should be evaluated as separate fl aws.
3.7.4 Assessing cracks
A crack is a very sharp defect, and it is a planar (two-dimensional) defect.
ASME B31.8S-2012 31 states that a crack is a… ‘ very narrow, elongated defect
3.10 Corrosion colonies on a weld (left) and in line pipe (right).

Assessing corrosion in onshore oil and gas pipelines 79
caused by mechanical splitting into two parts ’. The occurrence of cracking is
generally an indication of:
a difference between the conditions expected at the design stage and the •
actual operating conditions (e.g., fatigue);
poor fabrication, manufacturing, or construction control procedures; or, •
some other poor practice, or an unexpected event. •
If you detect cracking in your pipeline, it is usually:
in or around welds (e.g., cracks caused by poor welding); or, •
in the welds or line pipe, and environmentally created (e.g., stress corro-•
sion cracking); or,
in fi ttings. •
In this section we focus on cracks created by a corrosive environment
in the line pipe and its weld. We have assessment methods for cracks in
pipelines (e.g. see References 9–11, 32–36), but cracks are diffi cult both to
detect and to size, leading to uncertainties in their assessment. Cracks also
grow quickly if the environmental conditions are favourable (e.g., if corro-
sion is present, or the structure is fatigued). This growth can be diffi cult to
predict and calculate, again adding to uncertainties in crack assessment.
Therefore, we treat cracks with extreme caution, and do not generally
assess them: we try to either prevent them, or detect and repair.
We cannot use the models we have used to assess corrosion (Section 3.6),
as these methods are applicable to blunt defects, where the blunt defects
fail by ‘net section collapse’: net section collapse can be considered fail-
ure when the average stress in the remaining ligament below the defect
reaches the fl ow stress of the material (Equation [3.8])
Net section col-
lapse is the same as plastic collapse if the fl ow stress equals the ultimate
tensile stress.
Generally, in net section collapse, failure is not preceded by the devel-
opment of a slowly tearing crack at the base of the blunt defect. Even if
some tearing does occur, the strain hardening of the material and/or the
redistribution of stress during the yielding will ensure that the ligament
does not fail until the fl ow stress level is reached. 9 Blunt defects, such as
corrosion, do not easily tear through the remaining ligament (as they are
blunt). This allows the average stress in the ligament to reach the fl ow
stress.
A crack can cause tearing at its tip, and this tearing can continue through
the ligament. This tearing crack can prevent the stress in the ligament
reaching the fl ow stress, and this can lead to a failure stress lower than

80 Underground pipeline corrosion
predicted by blunt defect models. The toughness of the line pipe now plays
a key role: 9
This net section will not collapse if the toughness is low, as low toughness •
material will allow the crack to tear quickly and easily. Low toughness
can lower the failure stress of a defect in a pipeline, but predicting the
failure pressure of a longitudinally-orientated crack in a pipeline is rel-
atively easy for very brittle (low toughness) material: we can use linear
elastic fracture mechanics (see References 10 and 11).
Predicting the failure pressure of a defect in very tough material is rela-•
tively easy: we can use equations such as those we use for assessing blunt
defects such as corrosion (Equation [3.8]).
The task of predicting failure pressures for cracks in materials with •
toughness between these two extreme values (e.g., some line pipe mate-
rials made before 1980 and some made after that time) is more diffi cult.
The crack assessment methods (detailed in Table 3.6) are all based on
Equation [3.6]. They have been compared; for example:
A 2009 • 37 publication compared the predicted failure stresses using the
‘ln sec’ formula, PAFFC, CorLAS, and BSI 7910 (see Table 3.6) with
the failure stresses of real cracks. The methods generally gave conserva-
tive results, but diffi culties in modelling the irregular crack shapes found
in the fi eld, and the differing toughness correlations/assumptions in the
methods, ensured scatter in the predictions. CorLAS showed superior
agreement between its predictions and the observed failure stresses.
A 2010 • 38 publication concluded that cracks failing by ductile tearing in
line pipe can be assessed using a variety of methods. API 579 showed
very good agreement with experimental results; BSI 7910 was the most
conservative method; and the ln sec formula provided conservative col-
lapse pressure predictions.
Table 3.6 Assessment methods for cracks in pipelines
Method for assessing cracks
API 579 11 General fracture mechanics method.
BSI 7910 10 General fracture mechanics
method.
Battelle’s ‘ln sec’ formula 9 Pipeline-specifi c, developed at
Battelle.
‘PAFFC’ 33,34 Pipeline-specifi c (software)
developed at Battelle in the USA.
‘CorLAS’ 35,36 Pipeline-specifi c (software)
developed at DNV in the USA.

Assessing corrosion in onshore oil and gas pipelines 81
It should be noted that the toughness needed to use documents such as BSI
7910 and API 579 is measured in terms of stress intensity factor, or J inte-
gral, or crack tip opening displacement (CTOD). This is a problem, as we
do not usually have these fracture toughness measures for our pipeline. We
usually have only a Charpy value of toughness. Hence, BSI 7910 and API
579 use simple correlations between Charpy and J, CTOD, etc. These cor-
relations introduce inaccuracies in the calculations. 32
Finally, note that if a crack in a pipeline is subjected to cyclic stresses, or
continued exposure to the corrosive environment, it can grow rapidly. API
579 and BSI 7910 give further guidance on this time-dependent growth.
Also, we must be careful when assessing a crack as the following:
the strength and toughness of the weld is rarely known; •
the shape of the weld will introduce stress concentrations; •
residual stresses could lower the failure stress; •
the shape of the crack will be irregular; and, the crack will be diffi cult to •
size and detect.
3.8 Conclusion
Corrosion can cause metal loss defects, but pipelines can tolerate large areas
of corrosion, as:
the corrosion is blunt; and, •
the line pipe usually has suffi cient ductility and toughness to tolerate the •
corrosion.
We have many methods for assessing blunt corrosion in pipelines. They have
their origins in the work at Battelle in the 1960s and 1970s. ASME B31G-2012
presents various methods for assessing corrosion. Cracking caused by corro-
sion should be treated with caution, as the occurrence of cracking is generally
an indication of a difference between the conditions expected at the design
stage and the actual operating conditions. The cracking is diffi cult to assess, and
any subsequent growth in a corrosive environment is very diffi cult to predict.
3.9 References 1. Anon. (2012), ‘ Key World Energy Statistics ’, International Energy Agency
(IEA). Paris, France.
2. Anon. (2012), ‘ BP Statistical Review of World Energy June 2012 ’, BP, London,
UK. bp.com/statisticalreview.
3. M. Mohitpour, M. McManus and W. Trefanenko (2002), ‘Trends in Pipeline
Integrity Inspection and Rehabilitation Techniques’, Proceedings of 4th
International Pipeline Conference 29 September –3 October 2002, Calgary,
Alberta, Canada, Paper IPC2002-27035.


