
Asset allocation: optimising returns in a low return environment
Glyn OwenOctober 2010
RMB Asset Management International Limited (Company Registration No. 3733094) is authorised and regulated by the Financial Services Authority and is a member of the FirstRand Group, and has its registered office at Twenty Gracechurch Street, London, EC3V 0BG
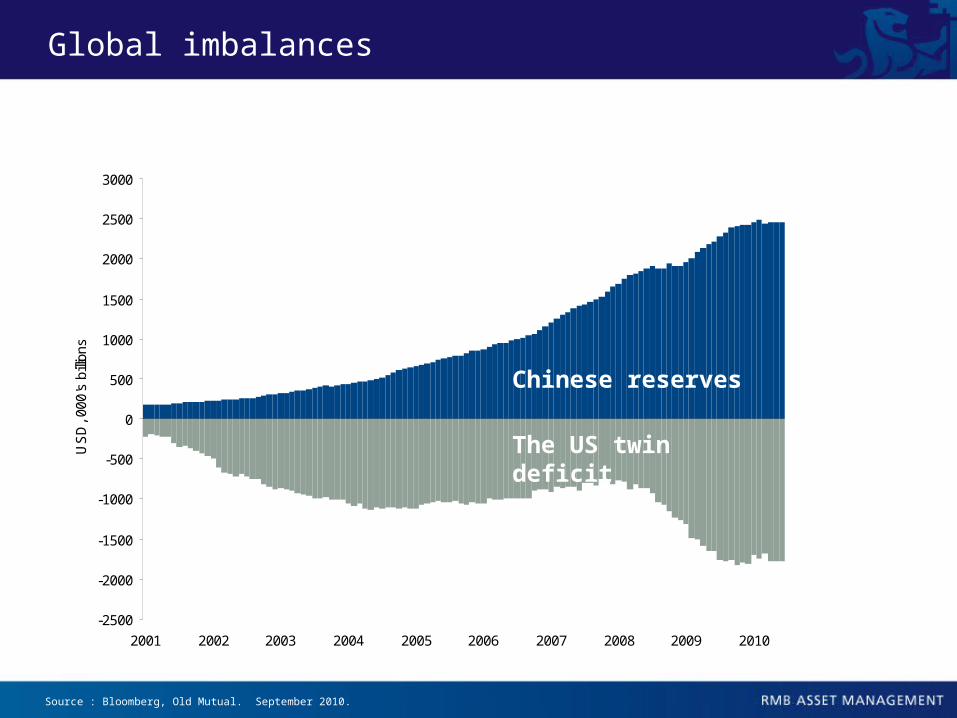
Global imbalances
Source : Bloomberg, Old Mutual. September 2010.
-2500
-2000
-1500
-1000
-500
0
500
1000
1500
2000
2500
3000
2001 2002 2003 2004 2005 2006 2007 2008 2009 2010
US
D, 0
00's
billi
ons
Chinese reserves
The US twin deficit

If we go down they come with us
Source : Bloomberg. September 2010.
Chinese reserves
The US twin deficit
30
35
40
45
50
55
60
65
70
75
2004 2005 2006 2007 2008 2009 2010-2%
-1%
0%
1%
2%
3%
4%
5% ISM PMI (Manufacturing)
US Imports from China

But does superior GDP growth lead to market outperformance?
Source : Bloomberg, Old Mutual. September 2010.
0
20
40
60
80
100
120
Sep 07 Dec 07 Mar 08 Jun 08 Sep 08 Dec 08 Mar 09 Jun 09 Sep 09 Dec 09 Mar 10 Jun 10
Inde
x le
vel (
Reb
ased
)
SHANGHAI SE COMPOSITE NIKKEI 225

Still too much debt
Source : Bloomberg, BCA Research. September 2010.
100%
120%
140%
160%
180%
Non-federal debt as a % of GDP
30%
40%
50%
60%
70%
80%
Federal debt as a % of GDP
60%
80%
100%
120%
140%
Mar 80 Mar 82 Mar 84 Mar 86 Mar 88 Mar 90 Mar 92 Mar 94 Mar 96 Mar 98 Mar 00 Mar 02 Mar 04 Mar 06 Mar 08 Mar 10
Household debt as a % ofpersonal disposable income

6
It’s a two speed world……
Source: Bloomberg, Sarasin & Partners, IMF and WEO September 2010
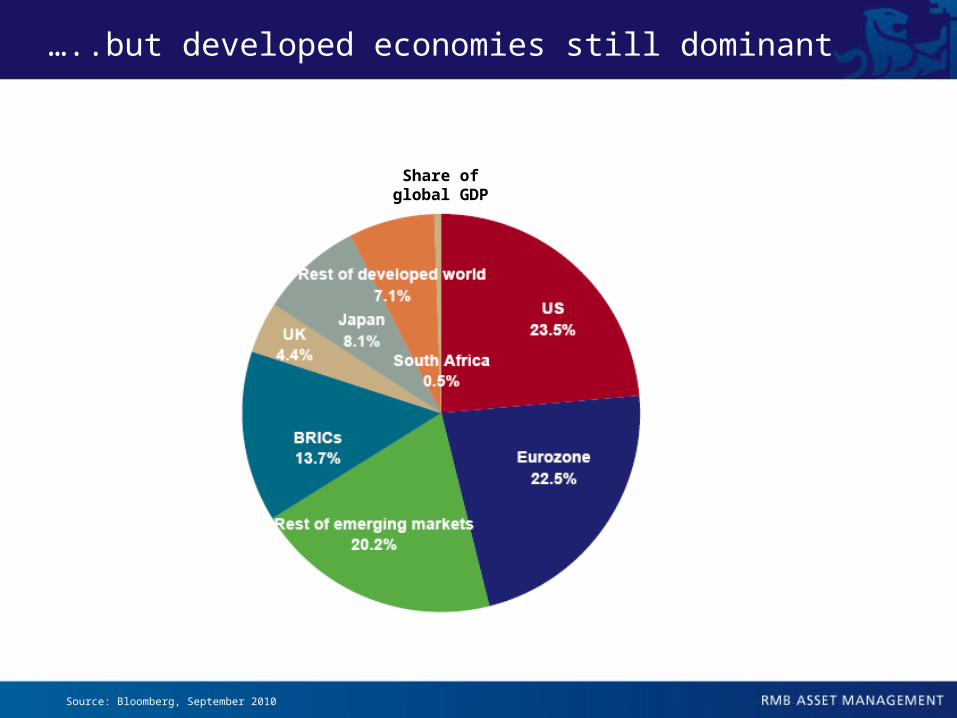
…..but developed economies still dominant
Source: Bloomberg, September 2010
Share of global GDP

Global real money growth – pushing on a string
Source: Schroders. September 2010.

90
100
110
120
130
140
150
160
170
180
190
200
Dec95
Dec96
Dec97
Dec98
Dec99
Dec00
Dec01
Dec02
Dec03
Dec04
Dec05
Dec06
Dec07
Dec08
Dec09
Re
turn
(R
eb
ase
d)
EM Currency Index versus 50:50 USD:EUR Cash
Any bets on this reversing?
Source : Bloomberg, Investec Asset Management. September 2010.
EM currency index vs. 50:50 USD / EUR

10 year Government bond yields – US, UK, Germany
Source : Bloomberg. September 2010.
0.0%
1.0%
2.0%
3.0%
4.0%
5.0%
6.0%
7.0%
30/0
6/20
00
30/1
2/20
00
30/0
6/20
01
30/1
2/20
01
30/0
6/20
02
30/1
2/20
02
30/0
6/20
03
30/1
2/20
03
30/0
6/20
04
30/1
2/20
04
30/0
6/20
05
30/1
2/20
05
30/0
6/20
06
30/1
2/20
06
30/0
6/20
07
30/1
2/20
07
30/0
6/20
08
30/1
2/20
08
30/0
6/20
09
30/1
2/20
09
30/0
6/20
10
UK US GERMANY

Market expectations of inflation are falling
-1.5
-1.0
-0.5
0.0
0.5
1.0
1.5
2.0
2.5
3.0
3.5
Jan 05 Jul 05 Jan 06 Jul 06 Jan 07 Jul 07 Jan 08 Jul 08 Jan 09 Jul 09 Jan 10 Jul 10
%
US Breakeven 5 Year
Source : Bloomberg. September 2010.

G7 implied forward rates ex. Japan
Source : Bloomberg. September 2010.
2
2.5
3
3.5
4
4.5
5
5.5
6
6.5
Se
p-0
0
Ma
r-0
1
Se
p-0
1
Ma
r-0
2
Se
p-0
2
Ma
r-0
3
Se
p-0
3
Ma
r-0
4
Se
p-0
4
Ma
r-0
5
Se
p-0
5
Ma
r-0
6
Se
p-0
6
Ma
r-0
7
Se
p-0
7
Ma
r-0
8
Se
p-0
8
Ma
r-0
9
Se
p-0
9
Ma
r-1
0
%
G7 ex. Japan Forward Rates
Market Implied Official Rates in 5 Years Time
Market Implied 5 Year Yields in 5 Years Time

US existing home sales
Source: Bloomberg, September 201013
0.00
1.00
2.00
3.00
4.00
5.00
6.00
7.00
8.00
Dec00
Dec01
Dec02
Dec03
Dec04
Dec05
Dec06
Dec07
Dec08
Dec09
US Existing Homes Sales SAAR

US unemployment
Source : Bloomberg. September 2010.
Unemployment in the US
0
1
2
3
4
5
6
7
8
9
10
Feb-07 Aug-07 Feb-08 Aug-08 Feb-09 Aug-09 Feb-10 Aug-10
Ra
te (
%)

Industrial production
Source: Bloomberg. September 2010.
-50
-40
-30
-20
-10
0
10
20
30
40
Jan 90 Jan 92 Jan 94 Jan 96 Jan 98 Jan 00 Jan 02 Jan 04 Jan 06 Jan 08 Jan 10
Le
ve
l
US Industrial Production UK Industrial Production
Germany Industrial Production Japan Industrial Production

10 year Government bond yields – PIGS
Source : Bloomberg. September 2010.
0.0%
2.0%
4.0%
6.0%
8.0%
10.0%
12.0%
Jun04
Dec04
Jun05
Dec05
Jun06
Dec06
Jun07
Dec07
Jun08
Dec08
Jun09
Dec09
Jun10
PORTUGAL IRELAND GREECE SPAIN

Liquidity conditions have stabilized
Source : Bloomberg. September 2010.
-0.5%
0.0%
0.5%
1.0%
1.5%
2.0%
2.5%
3.0%
3.5%
4.0%
Jan 07 Jul 07 Jan 08 Jul 08 Jan 09 Jul 09 Jan 10 Jul 10
US LIBOR - OIS Spread Euro LIBOR - OIS Spread UK LIBOR - OIS Spread

Credit spreads
Source: Bloomberg. September 2010.
0.00
100.00
200.00
300.00
400.00
500.00
600.00
700.00
Jan 94 Jan 95 Jan 96 Jan 97 Jan 98 Jan 99 Jan 00 Jan 01 Jan 02 Jan 03 Jan 04 Jan 05 Jan 06 Jan 07 Jan 08 Jan 09 Jan 10
US
Inve
stm
ent
Gra
de
Sp
read
s
0.00
300.00
600.00
900.00
1200.00
1500.00
1800.00
2100.00
US
Hig
h Y
ield
Sp
read
s
US Investment Grade Spreads US High Yield Spreads

Corporate sector in excellent shape
Corporates are sitting on a mountain of cash
Source: RMB Asset Management, BCA. September 2010

M&A activity

Consumer confidence Germany
Source: Bloomberg. September 2010.

German business confidence also strong
-150
-100
-50
0
50
100
Aug00
Aug01
Aug02
Aug03
Aug04
Aug05
Aug06
Aug07
Aug08
Aug09
Aug10
Lev
el (
Ger
man
y Z
WE
)
Source: Bloomberg. September 2010.

Fiscal consolidation
Source: IMF, Economist, Eurostat. September 2010.
0.8
1.3 1.3 1.3
1.5
1.9
2.5
0.0
0.5
1.0
1.5
2.0
2.5
3.0
Spain'96-03
Italy '91-97
UK '94-00
Germany'05-07
US '94-98
Canada'93-97
Sweden'94-98
1.5 1.6
1.8
2.0
2.22.3
0.0
0.5
1.0
1.5
2.0
2.5
3.0
Portgual'11-14
UK '11-14US '11-13Spain '11-13
Greece'10-14
Ireland'10-14
Historical fiscal rebalancing Projected fiscal rebalancing
Historical precedent suggests economies can shrug off some fiscal rebalancing… but there is a limit
Ireland, Greece and likely Spain will be significantly impacted by fiscal cuts
With 2012 election looming US likely to push spending cuts back

Source : Bloomberg. September 2010.
Equity valuations provide strong support

Equities…… the income asset class?
Source : Bloomberg. September 2010.
Dividend Yld (%)
10 Year Gov Bond Yld (%)
Investment Grade Corp
Bond Yld (%)
Dow Jones Industrial Average 2.60 2.54 3.68
S&P 500 1.97 2.54 3.68
FTSE All-Share 3.19 2.99 5.05
FTSE 100 3.30 2.99 5.05
Euro Stoxx 50 4.03 2.32 3.26
Nikkei 225 1.75 0.96 0.66

Dividend yields higher than corporate bond yields
Source : Bloomberg. September 2010.
Dividend Yld (%)
Corporate Bond Yld (%)
Banco Santander 6.45 4.16
Chevron Corp 3.51 2.95
Commonwealth Bank of Australia 8.14 7.06
Deutsche Telecom 7.73 3.59
E.ON AG 6.42 3.20
ENI 6.27 3.46
France Telecom 8.76 3.25
GDF Suez 8.69 2.99
General Electric 2.96 4.31
GlaxoSmith Kline 5.03 2.91
MacDonalds 3.28 3.83
Microsoft 2.61 2.99
National Australia Bank 8.40 3.99
Nestle SA 3.07 1.44
Novartis AG-REG 3.79 3.05
Petro China 3.67 3.95
Roche Holding 4.44 3.22
Sanofi-Aventis 4.89 3.05
Tesco 3.07 3.91
Total SA 5.92 4.18
Vodafone 5.27 4.09

Where is investor money flowing…….?
Source : EPFR Global. September 2010.
+USD560 billion

Emerging bubble?
Source : EPFR Global. September 2010.

0
20
40
60
80
100
120
140
160
Jun08
Aug08
Oct08
Dec08
Feb09
Apr09
Jun09
Aug09
Oct09
Dec09
Feb10
Apr10
Jun10
Aug10
Inde
x le
vel (
Reb
ased
)
GOLD SPOT $/OZ JPY-USD X-RATE
Gold: not the only game in town?
Source : Bloomberg. September 2010.
Gold 4.4%
Yen 2.6%
Volatility

Inflation protection: gold vs. TIPS
Source : Bloomberg. September 2010.
80
85
90
95
100
105
110
115
Nov 09 Dec 09 Jan 10 Feb 10 Mar 10 Apr 10 May 10 Jun 10 Jul 10 Aug 10
Inde
x le
vel (
Reb
ased
)
GOLD SPOT $/OZ TSY INFL IX N/B
Gold 3.1%
TIPS 2.0%
Volatility
INFL LINKED BONDS

31
But gold could run further……
Source: Ned Davis September 2010
(COD201007061A_C)
105 115 126 137 150 164 179 195 213 233 254 277 303 330 360 393 429 469 512 558 609 665 726 792 865 943
1030112412261338146015941739189820712260
105 115 126 137 150 164 179 195 213 233 254 277 303 330 360 393 429 469 512 558 609 665 726 792 865 943
1030112412261338146015941739189820712260( ) 1970 Gold Bullion (1/16/1970 - 11/11/1981)
( ) 2001 Gold Bullion (2/15/2001 - 7/02/2010) (Lines indexed to 100 at start.)
Concept Courtesy of Boeckh Investment Letter
M J S D
2002
M J S D
2003
M J S D
2004
M J S D
2005
M J S D
2006
M J S D
2007
M J S D
2008
M J S D
2009
M J S D
2010
M J S D
2011
M J S D
2012
M J S D
M J S D
1971
M J S D
1972
M J S D
1973
M J S D
1974
M J S D
1975
M J S D
1976
M J S D
1977
M J S D
1978
M J S D
1979
M J S D
1980
M J S D
1981
M J S
Gold Bullion Cycles - 1970 vs. 2001
1970 Gold Cycle
( )
2001 Gold Cycle
( )
Daily Data (Log Scale)
Copyright 2010 Ned Davis Research, Inc. Further distribution prohibited without prior permission. All Rights Reserved. . www.ndr.com/vendorinfo/ . For data vendor disclaimers refer to www.ndr.com/copyright.htmlSee NDR Disclaimer at
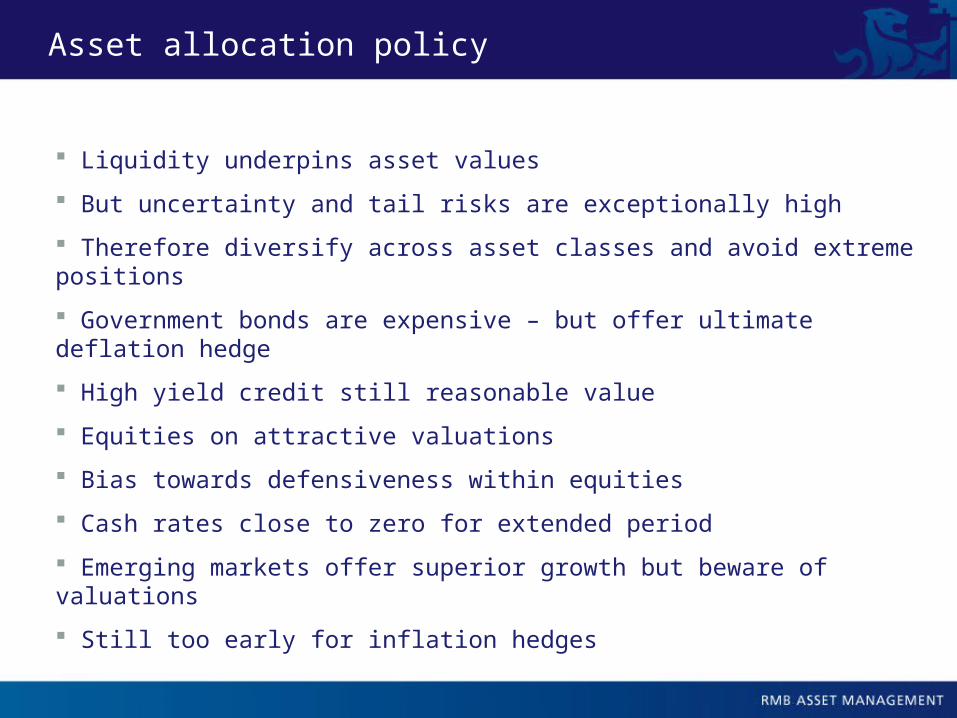
Asset allocation policy
Liquidity underpins asset values
But uncertainty and tail risks are exceptionally high
Therefore diversify across asset classes and avoid extreme positions
Government bonds are expensive – but offer ultimate deflation hedge
High yield credit still reasonable value
Equities on attractive valuations
Bias towards defensiveness within equities
Cash rates close to zero for extended period
Emerging markets offer superior growth but beware of valuations
Still too early for inflation hedges

33
RMB Asset Management is the trading name for RMB Asset Management International Limited. This document does not constitute an offer or solicitation to any person in any jurisdiction in which it is not authorised or permitted, or to anyone who would be an unlawful recipient, and is only intended for use by original recipients and addressees. The original recipient is solely responsible for any actions in further distributing this document, and should be satisfied in doing so that there is no breach of local legislation or regulation. The information is intended solely for use by our clients or prospective clients, and should not be reproduced or distributed except via original recipients acting as professional intermediaries. This document is not for distribution in the United States.Prospective investors should inform themselves and if need be take appropriate advice regarding applicable legal, taxation and exchange control regulations in countries of their citizenship, residence or domicile which may be relevant to the acquisition, holding, transfer, redemption or disposal of any investments herein solicited.Any opinions expressed herein are those at the date this material is issued. Data, models and other statistics are sourced from our own records, unless otherwise stated herein. We believe that the information contained is from reliable sources, but we do not guarantee the relevance, accuracy or completeness thereof. Unless provided under UK law, RMB Asset Management does not accept liability for irrelevant, inaccurate or incomplete information contained, or for the correctness of opinions expressed. We caution that the value of investments in discretionary accounts, and the income derived, may fluctuate and it is possible that an investor may incur losses, including a loss of the principal invested. Past performance is not generally indicative of future performance. Investors whose reference currency differs from that in which the underlying assets are invested may be subject to exchange rate movements that alter the value of their investments.
Important notes

34
Our investment mandates in alternative strategies and hedge funds permit us to invest in unregulated funds that may be highly volatile. Although alternative strategies funds will seek to follow a wide diversification policy, these funds may be subject to sudden and/or large falls in value. The illiquid nature of the underlying funds is such that alternative strategies funds deal infrequently and require longer notice periods for redemptions. These Investments are therefore not readily realisable. If an alternative strategies fund fails to perform, it may not be possible to realise the investment without further loss in value. These unregulated funds may engage in the short selling of securities or may use a greater degree of gearing than is permitted for regulated funds (including the ability to borrow for a leverage strategy). A relatively small price movement may result in a disproportionately large movement in the investment value. The purpose of gearing is to achieve higher returns associated with larger investment exposures, but has concomitant exposure to loss if positive performance is not achieved. Reliable information about the value of an investment in an alternative strategies fund may not be available (other than at the fund’s infrequent valuation points). Under our multi-management arrangements, we selectively appoint underlying sub-investment managers and funds to actively manage underlying asset holdings in the pursuit of achieving mandated performance objectives. Annual investment management fees are payable both to the multimanager and the manager of the underlying assets at rates contained in the offering documents of the relevant portfolios (and may involve performance fees where expressly indicated therein). RMB Asset Management International Limited (Company Registration No. 3733094) is authorised and regulated by the Financial Services Authority and is a member of the FirstRand Group, and has its registered office at 20 Gracechurch Street, London EC3V 0BG. © RMB Asset Management International Limited 2010
Important notes


