Assistant Rodica-Oana IONITA, PhD
E-mail:[email protected]
The Bucharest University of Economic Studies
Professor Dumitra STANCU
E-mail: [email protected]
Technical University of Civil Engineering of Bucharest
EARLY WARNING MODELS FOR DEBT CRISES – CASE STUDY
FOR ROMANIA, CZECH REPUBLIC AND HUNGARY
Abstract. This paper aims to achieve those early warning indicators of
debt crises in Romania, Czech Republic and Hungary in the period 1999, 4th
quarter up to 2013, 4th quarter. Starting from three type of indicators: external
indicators related to capital account, external indicators related to current
account and domestic indicators, we have computed a database of potential
leading indicators containing twelve indicators for Romania, as follows: Real
effective exchange rate from trend , Relative change of exports, Relative change of
imports, Terms of trade, Current account balance as % of GDP, The relative
change of foreign reserves, Capital account balance as % of GDP, Net external
debt as % of GDP, Government debt as % of GDP, Unemployment rate, Industrial
production growth, Net International investment position as % of GDP. This
research aim to observe which of the potential leading indicators used in the
analysis are significant in explaining the incidence of currency instability periods
and give us a warning regardless any negative trends in the macroeconomic or
financial activity, affecting the national or the global situation. Using
econometrics techniques, we have determined those indicators which are
econometrically significantly in explaining the appearance of debt crises.
Weighting their role in explaining currency crisis, we have composed the early
warning index of debt crises. The evaluation results suggest that there is a range
of leading indicators which gave us a warning signal regarding any instability
periods of debt crises which occur in the economy.
Keywords: warning, currency crises, leading indicators.
JEL classification: G01, E5
1. Introduction
The purpose of this paper is to capture those indicators whose behavior
can reveal some information about the occurrence of a debt crisis.
Rodica – Oana Ionita, Dumitra Stancu
_________________________________________________________________
Therefore, we computed a database containing three types of indicators: external
indicators related to current account, external indicators related to capital account
and domestic indicators. The database was collected for the period 1999 fourth
quarter until 2013 fourth quarter for Romania. Analysing their behaviour and
taking notes about the literature review in the field, we could assess the role of
each indicator in determining a positive or negative role in the appearance of a
debt crisis. Therefore, we identified those variables which gave us a warning
regarding the appearance of a debt crisis and we computed an indicator of debt
crisis warning for Romania. This indicator was validated through the fact that it
was appropriate for detection of the last debt crisis of Romania.
The paper is organized as follows: Second section presents us the Literature
review. Third section presents the Database. Fourth section presents the
Methodology used and the results. Fifth section presents the Conclusions.
2. Literature review
The analysis of Stephen G. Cecchetti, Marion Kohler and Christian Upper based on
40 systemic banking crises emphasizes that last financial crises is computed from a
wide range of economic factors. The paper “This Time is Different: A Panoramic
View of Eight Centuries of Financial Crises” includes African, Asian, European,
Latin American countries, North America and Oceania, in the period 1800-2006
and threat external debt, domestic default, banking crises, currency crashes and
inflation excesses, by constructing a composite index of financial instability that is
multidimensional, concluding that “financial crises are more a way of life affecting
all”.
Another paper of Carmen M. Reinhart and Kenneth S. Rogoff is focused on
banking crises and highlights that crises are more severe for the financial centers
like UK, USA and France. They analyze for the first time in the literature the role
of “housing prices” variables and find similarities of the behavior of frequency and
duration of banking crises between developed and middle-income countries,
highlighting that most countries experience a surge in debt in the wake of a
financial crisis, with real central government debt increasing 86% on average
during the three years following the crisis. Some Romanian economists used a set
of prudential indicators and the aggregate monetary balance sheet to find out that
the level of risk was manageable, even that accelerated during 2009 and 2010 and
that the exposure of Romania’s banks to foreign funds constituted an important
source of risk. Professor Albulescu Claudiu Tiberiu build an early warning system
based on the banking ratings deterioration using CAAMPL approach for the period
1998 – 2006 and concluded that rating downgrade and calculation of probability of
banking financial distress can be determined through an early warning system.
Last crisis revealed important aspects in the current global architecture and official
mechanism that facilitate global financial instability. Current crises emphasizes that
the surveillance for crises prevention must be more rigorous, with a better
incorporation of financial sector and regulatory issues, with better information
Early Warning Models for Debt Crises – Case Study for Romania, Czech Republic
and Hungary
_______________________________________________________________ regarding cross-border spillover and systemic risks. If prior to the current crises
were considered just vulnerabilities in emerging market economies because they
are supposed to be more fragile, now there are taken in consideration the
vulnerabilities in advanced economies too, because they could create broader
distress through cross border linkages.
3. Database
The database contains three types of indicators: external indicators related to
current account, external indicators related to capital account and domestic
indicators. It was collected from Eurostat Database for Romania analysing the
period 1999 fourth quarter until 2013 fourth quarter, on a quarterly basis. The
rationale for which the indicators where quarterly collected it was that they could
give us a warning at least few quarters before the event happened. Firstly, we
started the model by collecting monthly indicators, but because not all the
indicators were available in monthly frequency, thus could make us narrow our
view obtained through the database collected. We have also considered that an
annually database wouldn’t help us, because it is very difficult to find those
indicators which gave us a warning with years before the event happened, existing
the possibility to omit those indicators which really gave us warning with months
or quarter before.
Therefore, we chose to use quarterly data for a better efficiency of the issued
signals consisting in the fact that allows timely reaction from the decision factors,
as policy makers.
The indicators used are presented in the bellow table.
Table 1.Indicators
Type of indicator Indicator
External indicator (current account) Real effective exchange rate
from trend
External indicator (current account) Relative change of exports
External indicator (current account) Relative change of imports
External indicator (current account) Terms of trade
External indicator (current account) Current account balance as %
of GDP
External indicator (capital account) The relative change of foreign
reserves
External indicator (capital account) Capital account balance as % of
GDP
Domestic indicator Net external debt as % of GDP
Domestic indicator Government debt as % of GDP
Rodica – Oana Ionita, Dumitra Stancu
_________________________________________________________________
Domestic indicator Unemployment rate
Domestic indicator Industrial production growth
Domestic indicator Net International investment
position as % of GDP
Source: Eurostat Database
Analyzing their behavior and taking notes about the literature review in the field,
we could assess the role of each indicator in determining a positive or negative
role in the appearance of a debt crisis.
4. Methodology
4.1 Hypothesis of research
The main hypothesis of the research represents the fact that there are potential
leading indicators which could gave us warning signals regarding the appearance
of a debt crises. If the behaviour of some indicators is analysed in the context of
the specific economy, we can identify some vulnerabilities and threats which
could have a negative effect against the economy of a country.
Therefore, in the following pages we have review the behaviour of the potential
leading indicators:
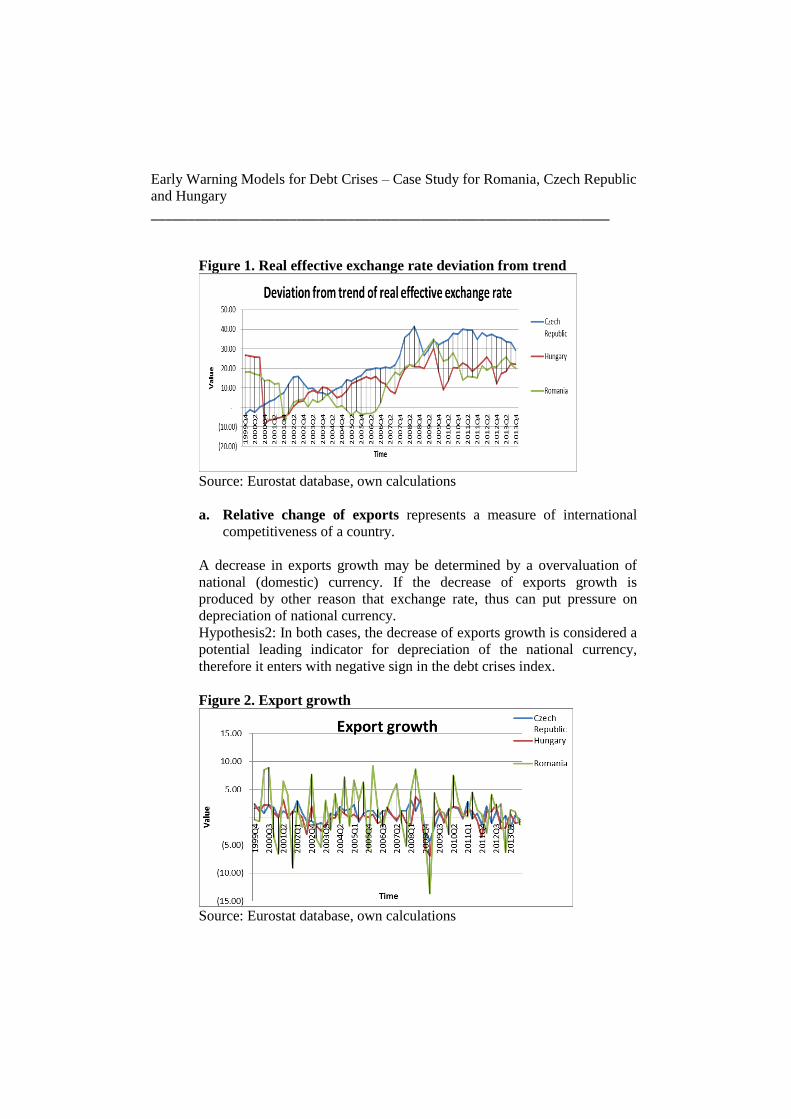
a. Real effective exchange rate from trend represents a measure of
international competitiveness of each country. It is used a proxy in order
to determine the over or under evaluation.
Hypothesis1.1: An overvalued real exchange rate represents a high
probability of appearance of currency crisis. Therefore, we have
considered that an increase of real effective exchange rate represents a
higher probability of appearance of currency crisis, therefore, enters with
positive sign in the debt crises debt index.
Hypothesis1.2: An undervalued real exchange rate represents a lower
probability of appearance of currency crisis.
Early Warning Models for Debt Crises – Case Study for Romania, Czech Republic
and Hungary
_______________________________________________________________
Figure 1. Real effective exchange rate deviation from trend
Source: Eurostat database, own calculations
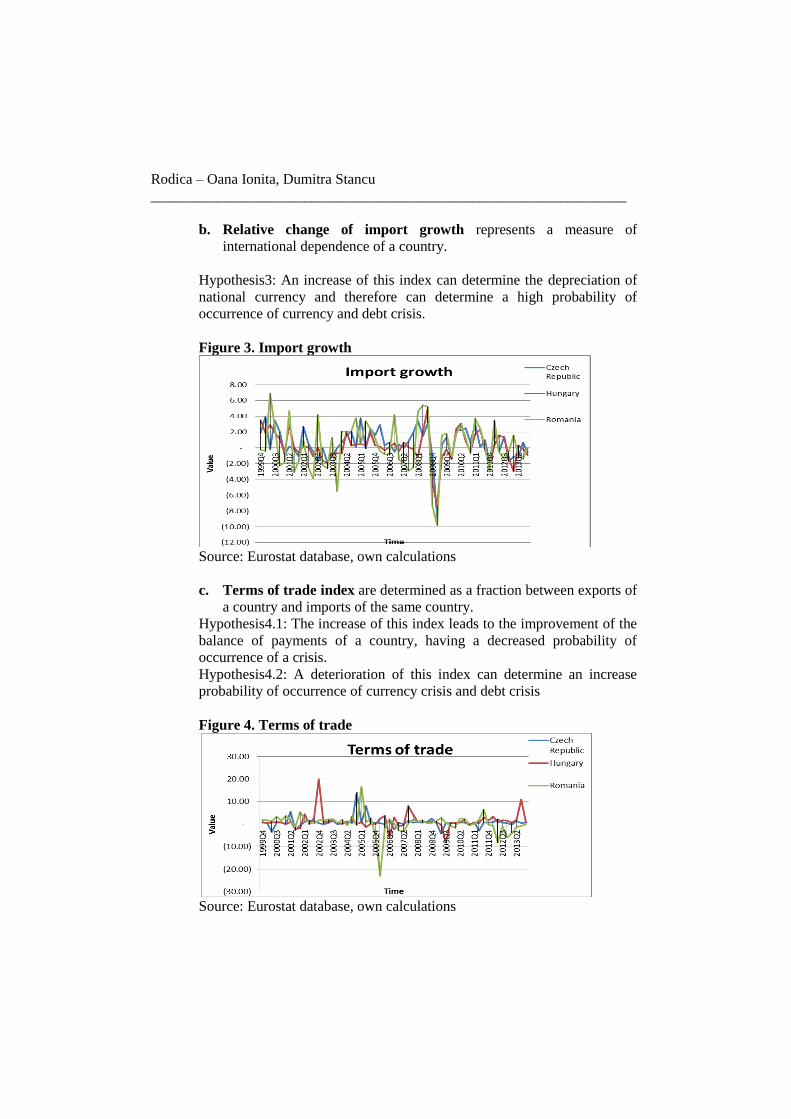
a. Relative change of exports represents a measure of international
competitiveness of a country.
A decrease in exports growth may be determined by a overvaluation of
national (domestic) currency. If the decrease of exports growth is
produced by other reason that exchange rate, thus can put pressure on
depreciation of national currency.
Hypothesis2: In both cases, the decrease of exports growth is considered a
potential leading indicator for depreciation of the national currency,
therefore it enters with negative sign in the debt crises index.
Figure 2. Export growth
Source: Eurostat database, own calculations
Rodica – Oana Ionita, Dumitra Stancu
_________________________________________________________________
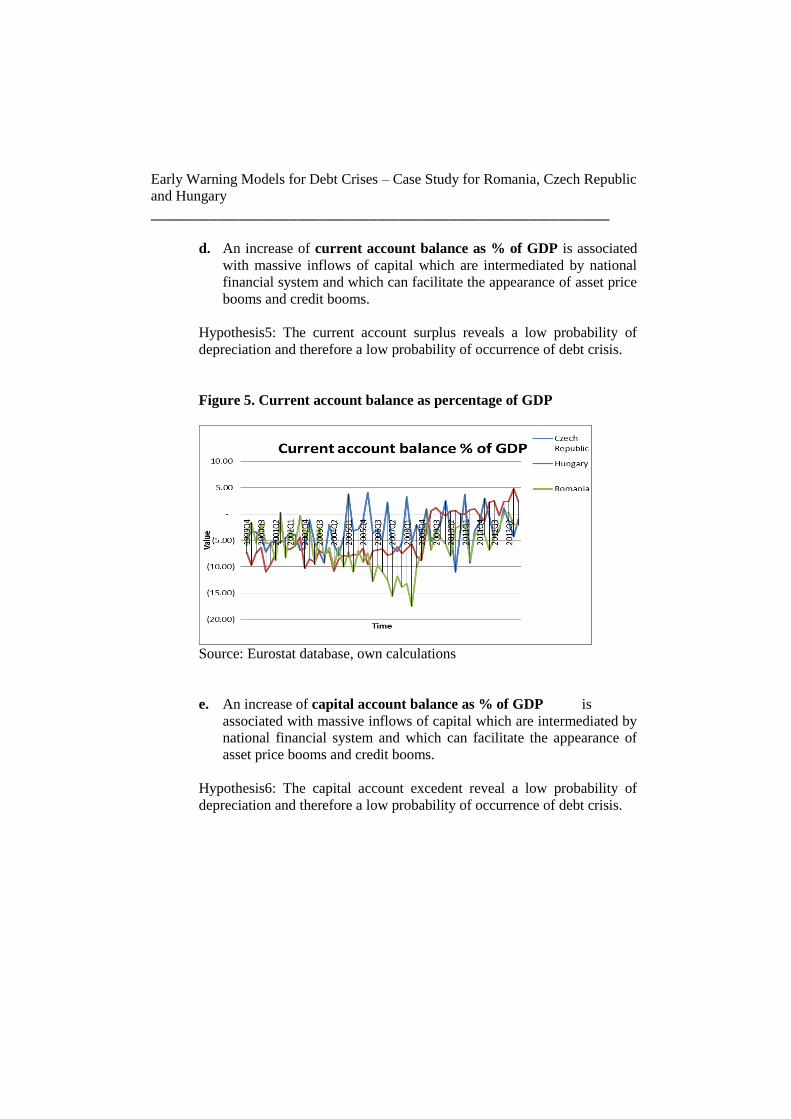
b. Relative change of import growth represents a measure of
international dependence of a country.
Hypothesis3: An increase of this index can determine the depreciation of
national currency and therefore can determine a high probability of
occurrence of currency and debt crisis.
Figure 3. Import growth
Source: Eurostat database, own calculations
c. Terms of trade index are determined as a fraction between exports of
a country and imports of the same country.
Hypothesis4.1: The increase of this index leads to the improvement of the
balance of payments of a country, having a decreased probability of
occurrence of a crisis.
Hypothesis4.2: A deterioration of this index can determine an increase
probability of occurrence of currency crisis and debt crisis
Figure 4. Terms of trade
Source: Eurostat database, own calculations
Early Warning Models for Debt Crises – Case Study for Romania, Czech Republic
and Hungary
_______________________________________________________________
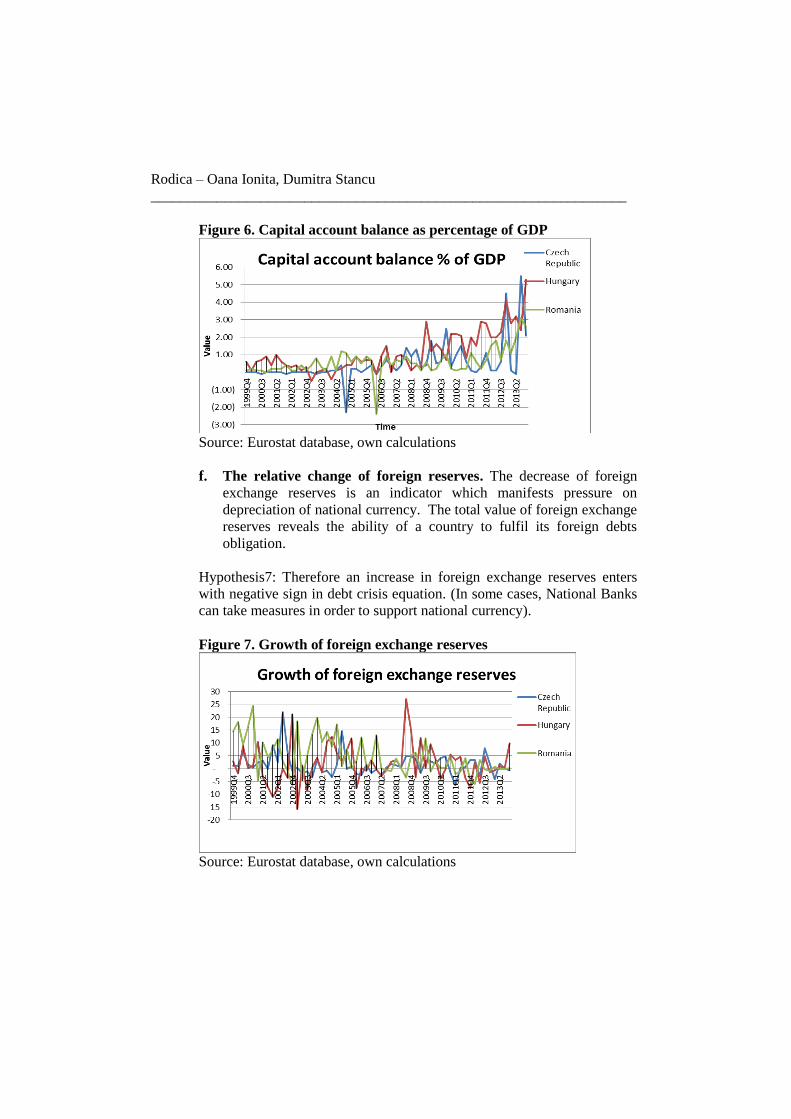
d. An increase of current account balance as % of GDP is associated
with massive inflows of capital which are intermediated by national
financial system and which can facilitate the appearance of asset price
booms and credit booms.
Hypothesis5: The current account surplus reveals a low probability of
depreciation and therefore a low probability of occurrence of debt crisis.
Figure 5. Current account balance as percentage of GDP
Source: Eurostat database, own calculations
e. An increase of capital account balance as % of GDP is
associated with massive inflows of capital which are intermediated by
national financial system and which can facilitate the appearance of
asset price booms and credit booms.
Hypothesis6: The capital account excedent reveal a low probability of
depreciation and therefore a low probability of occurrence of debt crisis.
Rodica – Oana Ionita, Dumitra Stancu
_________________________________________________________________
Figure 6. Capital account balance as percentage of GDP
Source: Eurostat database, own calculations
f. The relative change of foreign reserves. The decrease of foreign
exchange reserves is an indicator which manifests pressure on
depreciation of national currency. The total value of foreign exchange
reserves reveals the ability of a country to fulfil its foreign debts
obligation.
Hypothesis7: Therefore an increase in foreign exchange reserves enters
with negative sign in debt crisis equation. (In some cases, National Banks
can take measures in order to support national currency).
Figure 7. Growth of foreign exchange reserves
Source: Eurostat database, own calculations
Early Warning Models for Debt Crises – Case Study for Romania, Czech Republic
and Hungary
_______________________________________________________________
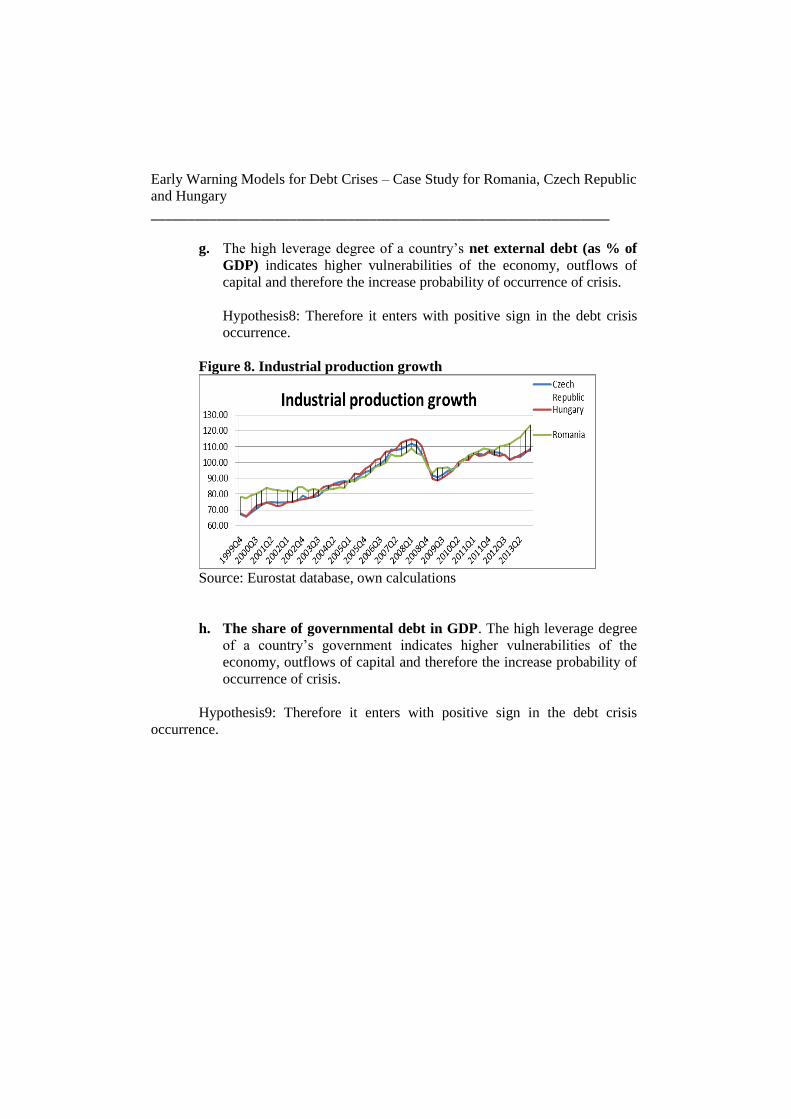
g. The high leverage degree of a country’s net external debt (as % of
GDP) indicates higher vulnerabilities of the economy, outflows of
capital and therefore the increase probability of occurrence of crisis.
Hypothesis8: Therefore it enters with positive sign in the debt crisis
occurrence.
Figure 8. Industrial production growth
Source: Eurostat database, own calculations
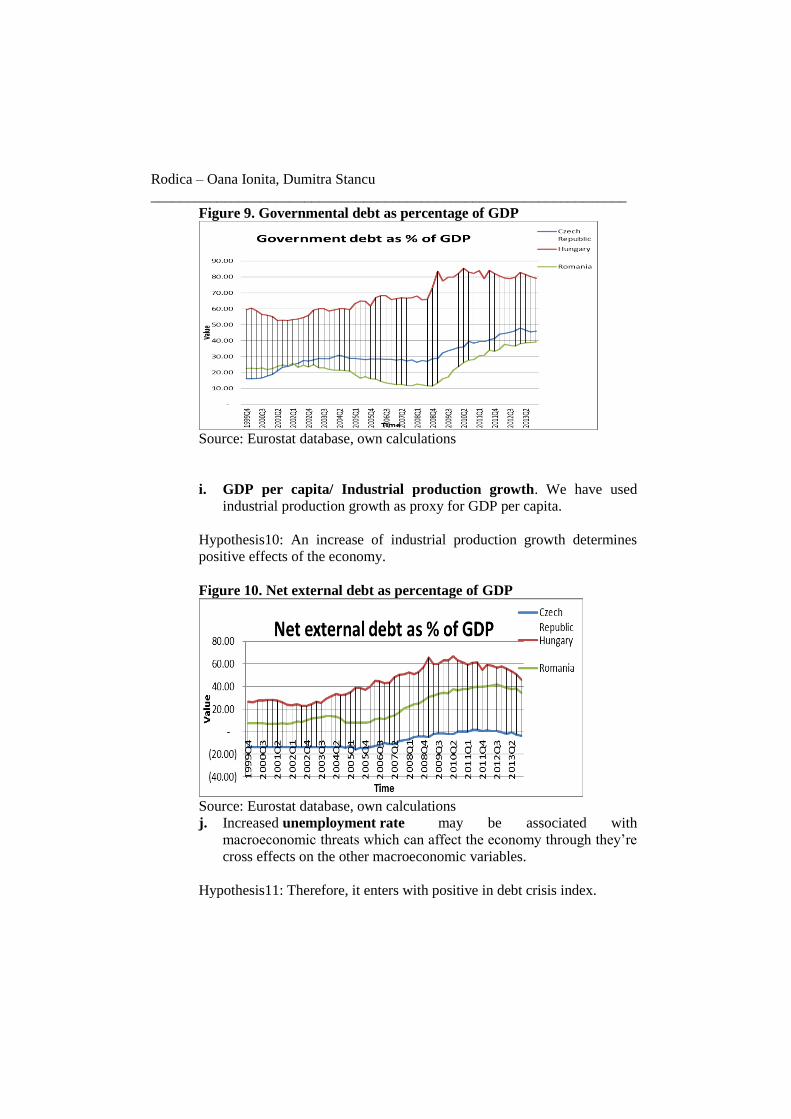
h. The share of governmental debt in GDP. The high leverage degree
of a country’s government indicates higher vulnerabilities of the
economy, outflows of capital and therefore the increase probability of
occurrence of crisis.
Hypothesis9: Therefore it enters with positive sign in the debt crisis
occurrence.
Rodica – Oana Ionita, Dumitra Stancu
_________________________________________________________________
Figure 9. Governmental debt as percentage of GDP
Source: Eurostat database, own calculations
i. GDP per capita/ Industrial production growth. We have used
industrial production growth as proxy for GDP per capita.
Hypothesis10: An increase of industrial production growth determines
positive effects of the economy.
Figure 10. Net external debt as percentage of GDP
Source: Eurostat database, own calculations
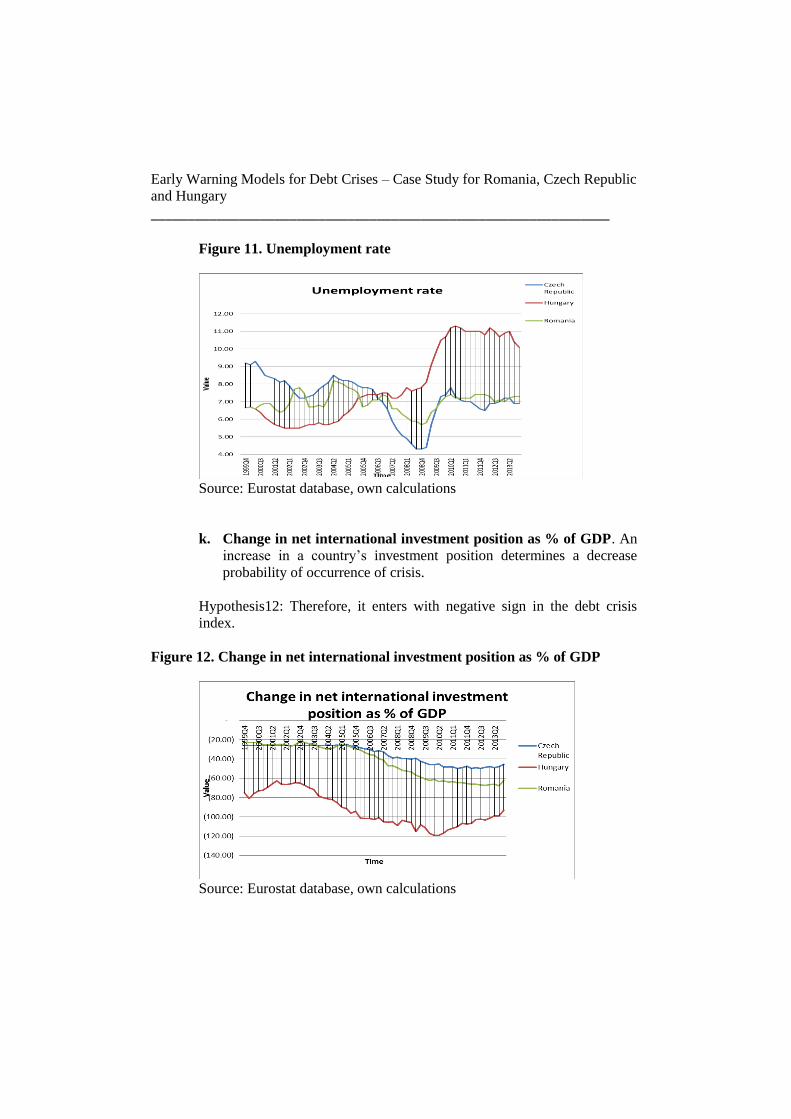
j. Increased unemployment rate may be associated with
macroeconomic threats which can affect the economy through they’re
cross effects on the other macroeconomic variables.
Hypothesis11: Therefore, it enters with positive in debt crisis index.
Early Warning Models for Debt Crises – Case Study for Romania, Czech Republic
and Hungary
_______________________________________________________________
Figure 11. Unemployment rate
Source: Eurostat database, own calculations
k. Change in net international investment position as % of GDP. An
increase in a country’s investment position determines a decrease
probability of occurrence of crisis.
Hypothesis12: Therefore, it enters with negative sign in the debt crisis
index.
Figure 12. Change in net international investment position as % of GDP
Source: Eurostat database, own calculations
Rodica – Oana Ionita, Dumitra Stancu
_________________________________________________________________
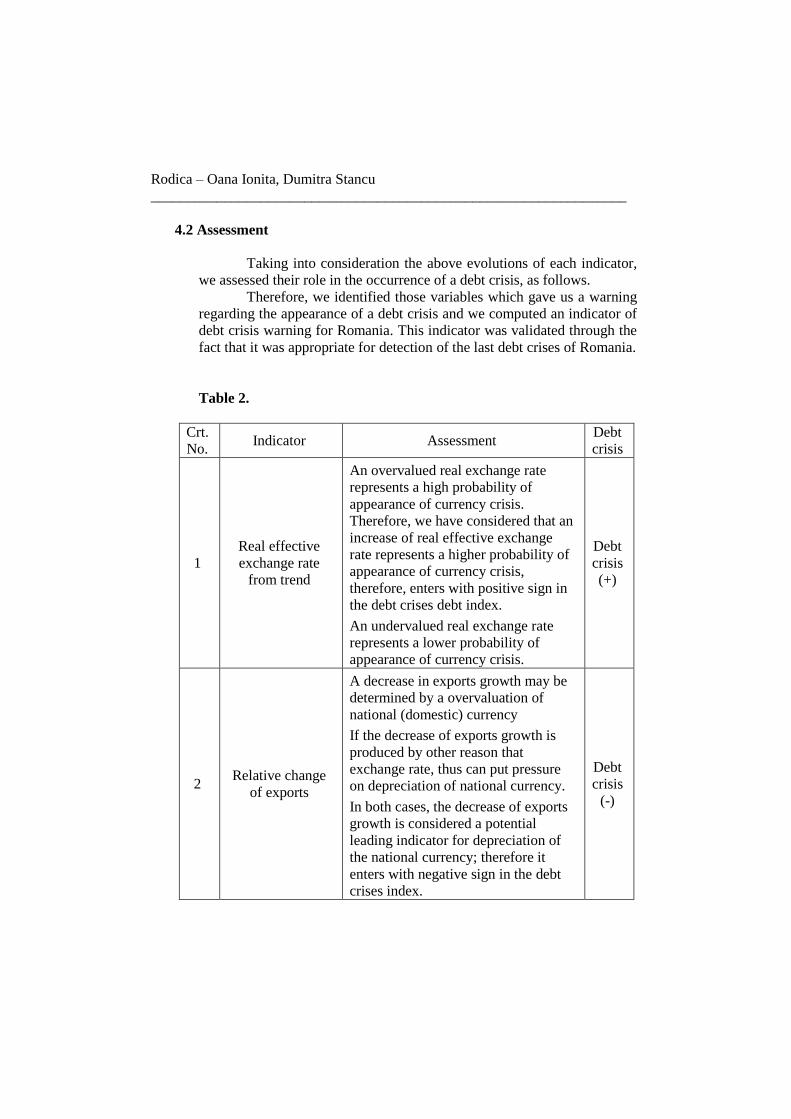
4.2 Assessment
Taking into consideration the above evolutions of each indicator,
we assessed their role in the occurrence of a debt crisis, as follows.
Therefore, we identified those variables which gave us a warning
regarding the appearance of a debt crisis and we computed an indicator of
debt crisis warning for Romania. This indicator was validated through the
fact that it was appropriate for detection of the last debt crises of Romania.
Table 2.
Crt.
No. Indicator Assessment
Debt
crisis
1
Real effective
exchange rate
from trend
An overvalued real exchange rate
represents a high probability of
appearance of currency crisis.
Therefore, we have considered that an
increase of real effective exchange
rate represents a higher probability of
appearance of currency crisis,
therefore, enters with positive sign in
the debt crises debt index.
An undervalued real exchange rate
represents a lower probability of
appearance of currency crisis.
Debt
crisis
(+)
2 Relative change
of exports
A decrease in exports growth may be
determined by a overvaluation of
national (domestic) currency
If the decrease of exports growth is
produced by other reason that
exchange rate, thus can put pressure
on depreciation of national currency.
In both cases, the decrease of exports
growth is considered a potential
leading indicator for depreciation of
the national currency; therefore it
enters with negative sign in the debt
crises index.
Debt
crisis
(-)
Early Warning Models for Debt Crises – Case Study for Romania, Czech Republic
and Hungary
_______________________________________________________________
3 Relative change
of import growth
An increase of this index can
determine the depreciation of national
currency and therefore can determine
a high probability of occurrence of
currency and debt crisis.
Debt
crisis
(+)
4 Terms of trade
The index is determined as a fraction
between exports of a country and
imports of the same country.
The increase of this index leads to the
improvement of the balance of
payments of a country, having a
decreased probability of occurrence
of a crisis.
A deterioration of this index can
determine an increase probability of
occurrence of currency crisis and debt
crisis.
Debt
crisis
(-)
5
Current account
balance as % of
GDP
An increase of current account
balance as % of GDP is associated
with massive inflows of capital which
are intermediated by national
financial system and which can
facilitate the appearance of asset price
booms and credit booms.
The current account surplus reveals a
low probability of depreciation and
therefore a low probability of
occurrence of debt crisis.
Debt
crisis
(-)
6
Capital account
balance as % of
GDP
An increase of capital account
balance as % of GDP is associated
with massive inflows of capital which
are intermediated by national
financial system and which can
facilitate the appearance of asset price
booms and credit booms.
The capital account surplus reveals a low
probability of depreciation and therefore
a low probability of occurrence of debt
crisis.
Debt
crisis
(-)
Rodica – Oana Ionita, Dumitra Stancu
_________________________________________________________________
7
The relative
change of foreign
reserves
The decrease of foreign exchange
reserves is an indicator which
manifests pressure on depreciation of
national currency. The total value of
foreign exchange reserves reveals the
ability of a country to fulfil its foreign
debts obligation.
Therefore an increase in foreign
exchange reserves enters with
negative sign in debt crisis equation.
In some cases, National Banks can
take measures in order to support
national currency.
Debt
crisis
(-)
8 Net external debt
as % of GDP
The high leverage degree of a
country’s net external debt indicates
higher vulnerabilities of the economy,
outflows of capital and therefore the
increase probability of occurrence of
crisis.
Therefore it enters with positive sign
in the debt crisis occurrence.
Debt
crisis
(+)
9
The share of
governmental
debt in GDP
The high leverage degree of a
country’s government indicates
higher vulnerabilities of the economy,
outflows of capital and therefore the
increase probability of occurrence of
crisis.
Therefore it enters with positive sign
in the debt crisis occurrence.
Debt
crisis
(+)
10
GDP per capita/
Industrial
production
growth
We have used as proxy for GDP per
capita – industrial production growth.
An increase of industrial production
growth determines positive effects of
the economy.
Debt
crisis
(-)
11 Unemployment
rate
Increased unemployment rates may be
associated with macroeconomic threats
which can affect the economy through
they’re cross effects on the other
macroeconomic variables. Therefore, it
enters with positive in debt crisis index.
Debt
crisis
(+)
Early Warning Models for Debt Crises – Case Study for Romania, Czech Republic
and Hungary
_______________________________________________________________
12
Change in net
international
investment
position as % of
GDP
An increase in a country’s investment
position determines a decrease
probability of occurrence of crisis.
Therefore, it enters with negative sign
in the debt crisis index.
Debt
crisis
(-)
4.3 Computation of the debt crisis index
Therefore we have computed an index which contains each of the above
indicators, with positive or negative sign depending on their role in explaining
the appearance of a debt crisis, according to the table assessment. We expect
that an increase of this value to reflect a cost against the economy, thus
representing a distress situation, therefore a debt crisis period.
The equation of Debt Crisis Index (which is defined in the same way for the
three countries in research) is presented below:
n
i
n
I
n
i
n
i
n
i
n
i
n
i
GRTRESTAGDPCAGDPTTIMPEXPREER1 1 1 1 1 1 1
=DCI
n
i
n
i
n
i
n
i
n
i
NINTINVINDPRODUNEMPGOVGDPNDEBT11 1 1
Where:
DCI = Debt Crisis Index
i=1, n = time (expressed in quarters)
REER = Real effective exchange rate from trend
EXP = Relative change of exports
IMP = Relative change of imports
TT = Terms of trade
CAGDP = Current account balance as % of GDP
TAGDP = Capital account balance as % of GDP
GRTRES =Relative change of foreign reserves
NDEBT = Net external debt as % of GDP
GOVGDP = Government debt as % of GDP
UNEMP = Unemployment rate
INDPROD = Industrial production growth
NINTINV = Net International investment position as % of GDP
Rodica – Oana Ionita, Dumitra Stancu
_________________________________________________________________
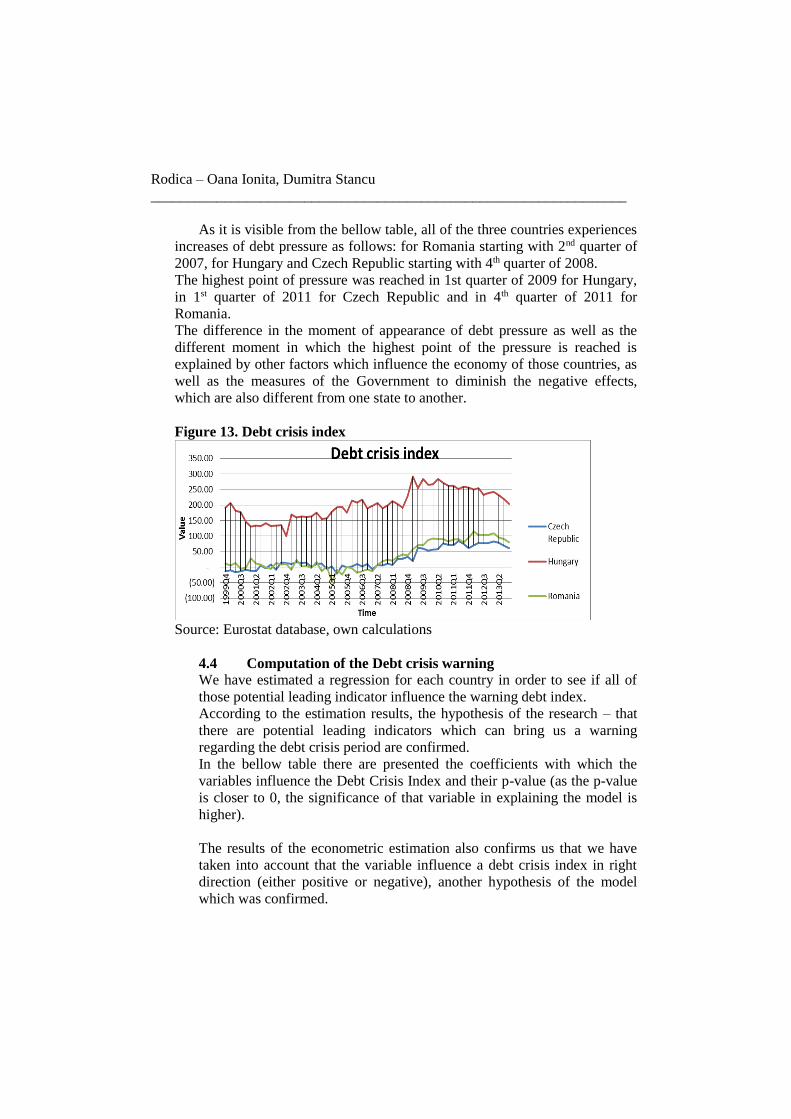
As it is visible from the bellow table, all of the three countries experiences
increases of debt pressure as follows: for Romania starting with 2nd quarter of
2007, for Hungary and Czech Republic starting with 4th quarter of 2008.
The highest point of pressure was reached in 1st quarter of 2009 for Hungary,
in 1st quarter of 2011 for Czech Republic and in 4th quarter of 2011 for
Romania.
The difference in the moment of appearance of debt pressure as well as the
different moment in which the highest point of the pressure is reached is
explained by other factors which influence the economy of those countries, as
well as the measures of the Government to diminish the negative effects,
which are also different from one state to another.
Figure 13. Debt crisis index
Source: Eurostat database, own calculations
4.4 Computation of the Debt crisis warning
We have estimated a regression for each country in order to see if all of
those potential leading indicator influence the warning debt index.
According to the estimation results, the hypothesis of the research – that
there are potential leading indicators which can bring us a warning
regarding the debt crisis period are confirmed.
In the bellow table there are presented the coefficients with which the
variables influence the Debt Crisis Index and their p-value (as the p-value
is closer to 0, the significance of that variable in explaining the model is
higher).
The results of the econometric estimation also confirms us that we have
taken into account that the variable influence a debt crisis index in right
direction (either positive or negative), another hypothesis of the model
which was confirmed.
Early Warning Models for Debt Crises – Case Study for Romania, Czech Republic
and Hungary
_______________________________________________________________
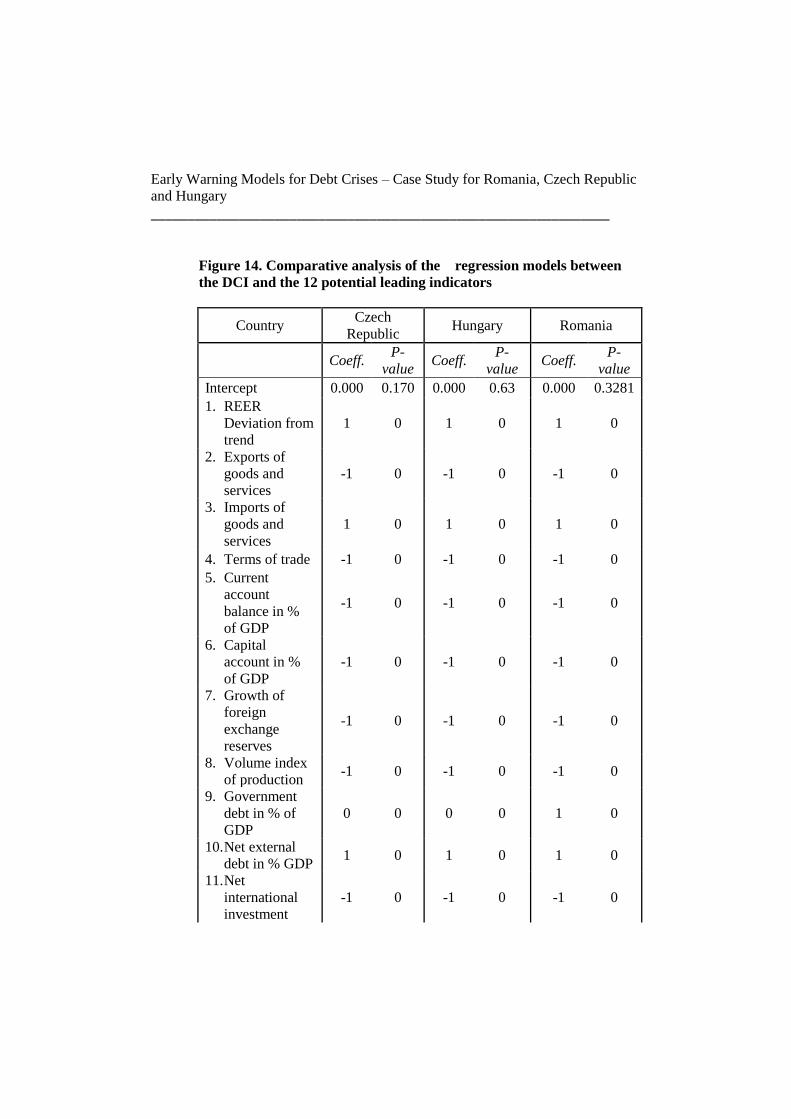
Figure 14. Comparative analysis of the regression models between
the DCI and the 12 potential leading indicators
Country Czech
Republic Hungary Romania
Coeff. P-
value Coeff.
P-
value Coeff.
P-
value
Intercept 0.000 0.170 0.000 0.63 0.000 0.3281
1. REER
Deviation from
trend
1 0 1 0 1 0
2. Exports of
goods and
services
-1 0 -1 0 -1 0
3. Imports of
goods and
services
1 0 1 0 1 0
4. Terms of trade -1 0 -1 0 -1 0
5. Current
account
balance in %
of GDP
-1 0 -1 0 -1 0
6. Capital
account in %
of GDP
-1 0 -1 0 -1 0
7. Growth of
foreign
exchange
reserves
-1 0 -1 0 -1 0
8. Volume index
of production -1 0 -1 0 -1 0
9. Government
debt in % of
GDP
0 0 0 0 1 0
10. Net external
debt in % GDP 1 0 1 0 1 0
11. Net
international
investment
-1 0 -1 0 -1 0
Rodica – Oana Ionita, Dumitra Stancu
_________________________________________________________________
position in %
of GDP -
quarterly data
12. Unemploymen
t rate 1 0 1 0 1 0
* Semnificant at 1%
** Semnificant at 5%
***Semnificant at 10%
Please see the results of regression performed for all countries included in
the research. Adjusted R2 is if 97,67% for Czech Republic and Hungary
and 100% for Romania, this meaning that the models are described in high
proportion by the potential leading indicators. Thus is on one side
explained by the fact that, we have analysed at this step the econometric
influence of the potential variables which have been already included in
the definition of the Crisis Debt Index. In a prior research, where other
few variables (macroeconomic and financial variables) were added, the
explanatory power of the models decreased at about 70%, because not all
of them where important in explaining the occurrence of a debt crisis.
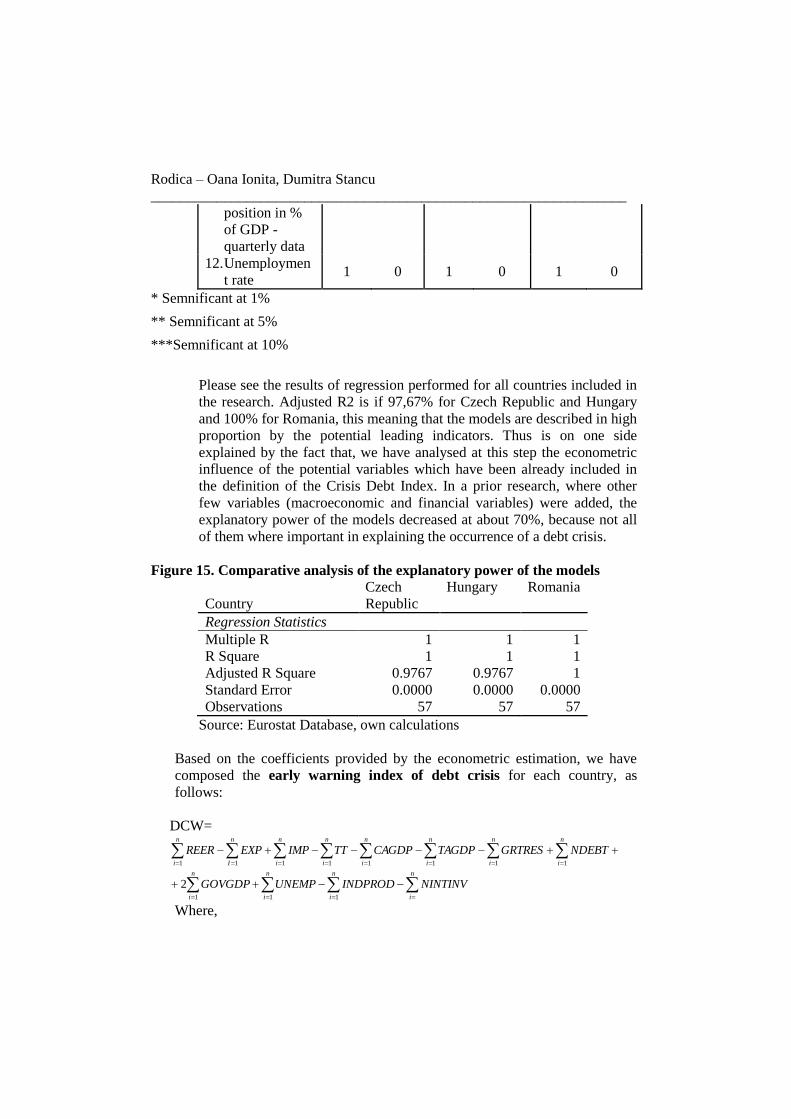
Figure 15. Comparative analysis of the explanatory power of the models
Country
Czech
Republic
Hungary Romania
Regression Statistics
Multiple R 1 1 1
R Square 1 1 1
Adjusted R Square 0.9767 0.9767 1
Standard Error 0.0000 0.0000 0.0000
Observations 57 57 57
Source: Eurostat Database, own calculations
Based on the coefficients provided by the econometric estimation, we have
composed the early warning index of debt crisis for each country, as
follows:
DCW=
n
i
n
I
n
i
n
i
n
i
n
i
n
i
n
i
NDEBTGRTRESTAGDPCAGDPTTIMPEXPREER1 1 1 1 1 1 1 1
n
i
n
i
n
i
n
i
NINTINVINDPRODUNEMPGOVGDP11 1
2
Where,
Early Warning Models for Debt Crises – Case Study for Romania, Czech Republic
and Hungary
_______________________________________________________________
DCW= Debt Crisis Warning
In this case the debt crisis warning surprise a highest cost against the
economy, thus being increased by the coefficient of the government debt,
revealing the fact that the government debt indicator is one of the most
important in revealing a warning regarding the probable occurrence of a debt
crisis.
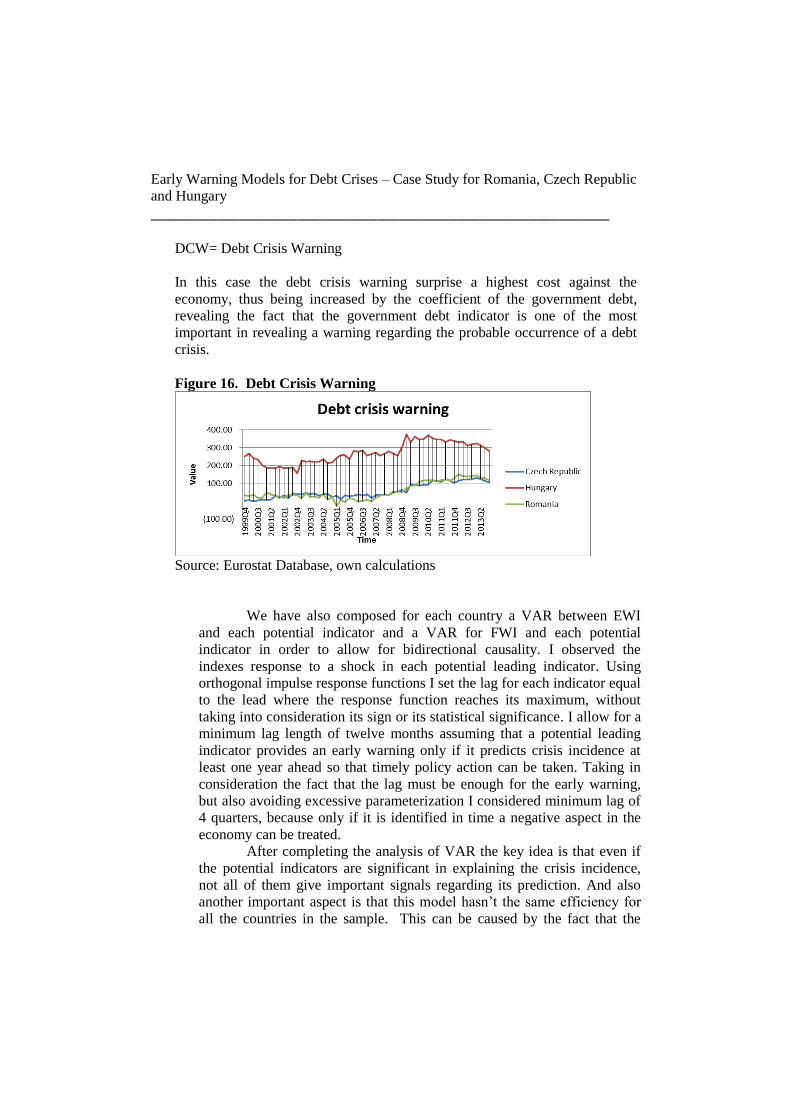
Figure 16. Debt Crisis Warning
Source: Eurostat Database, own calculations
We have also composed for each country a VAR between EWI
and each potential indicator and a VAR for FWI and each potential
indicator in order to allow for bidirectional causality. I observed the
indexes response to a shock in each potential leading indicator. Using
orthogonal impulse response functions I set the lag for each indicator equal
to the lead where the response function reaches its maximum, without
taking into consideration its sign or its statistical significance. I allow for a
minimum lag length of twelve months assuming that a potential leading
indicator provides an early warning only if it predicts crisis incidence at
least one year ahead so that timely policy action can be taken. Taking in
consideration the fact that the lag must be enough for the early warning,
but also avoiding excessive parameterization I considered minimum lag of
4 quarters, because only if it is identified in time a negative aspect in the
economy can be treated.
After completing the analysis of VAR the key idea is that even if
the potential indicators are significant in explaining the crisis incidence,
not all of them give important signals regarding its prediction. And also
another important aspect is that this model hasn’t the same efficiency for
all the countries in the sample. This can be caused by the fact that the
Rodica – Oana Ionita, Dumitra Stancu
_________________________________________________________________
crisis manifested different in those countries both at indicators levels and
direct consequences at the economy level. The main important leading
indicators are GDP growth rate, real effective exchange rate from trend and
external debt.
According to the analysis, there are some significant variables
which are very important in explaining the occurrence of a debt crisis
which give important signals to policy makers in order to limit potential
damages which can appear through such a crisis. In the future, a special
attention should be granted to permanently monitoring potential leading
indicators, reacting to the signals received and include those indicators in
the policy measures undertaken, in order to cover all the areas of the
economy and to protect against potential risks.
5. Conclusions
This analysis reveals the hypothesis of the research, that there are
potential leading indicators which gave us a warning in identifying the
moments of debt crisis pressure of the economy. Summarizing the main
results, we found that debt crisis/ instability warning signals come at
various horizons.
Another important aspect to mention is that this model – as it is
defined - hasn’t the same efficiency for all the countries in the sample.
There are variables which are significant in explaining the debt crisis of
one country, even that for the other country they have not such impact.
One explanation for that fact can be the decisions taken in each country,
which can differ both as measures taken, but also as effects needed to be
achieved.
REFERENCES
[1]Arellano, C. and N.R. Kocherlakota (2008), Internal Debt Crises and
Sovereign Defaults; Working Paper 13794;
[2]Babecy, J., T. Havranek, J. Mateju, M. Rusnak, K. Smidkova, B. Vasicek
(2011), Early Warning Indicators of Economic Crises-Evidence from a Panel of
Developed Countries. Working Paper Series, National Bank of Czech;
[3]Berg,A., E. Borensztein and C. Pattilo (2004), Assessing Early Warning
Systems: How Have They Worked in Practice?; IMF Working Paper/04/52;
[4]Cecchetti, S.G., M. Kohler and C. Upper (2009),Financial Crises and
Economic Activity; NBER Working Paper Series;
[5]DeLong,J.B. (2009), The Financial Crisis of 2007-2009: Understanding its
Causes, Consequences-and its Possible Cures;
[6]www.Eurostatdatabase.com
Early Warning Models for Debt Crises – Case Study for Romania, Czech Republic
and Hungary
_______________________________________________________________ [7]Isarescu, Mugur (2006), Contributions to the Theory of Macroeconomic
Stabilization, Reflections of Economic Stabilization; Governor of the National
Bank of Romania;
[8]International Monetary Fund www.imf.com
[9]Ionita, Rodica, Oana (2012), Disertation : Early warning indicators of
economic crises;
[10]Krugman, P. (1979), A Model of Balance-of-Payments Crises; Journal of
Money,Credit and Banking 11(3), pp. 311–325;
[11]Krugman,P. (2000), The Return of Depression Economics;
[12]Kaminsky, G., S. Lizondo and C. Reinhart (1998), Leading Indicators of
Currency Crises. http://ideas.repec.org/p/pra/mprapa/6981.html; [13]Menegatti,C.and N.Roubini (2006), Vulnerabilities in Central and
Southern Europe;
[14]National Bank of Romania, monthly reports http://www.bnro.ro/Publicatii-
periodice-204.aspx
[15]Reinhart, C.M. and K.S. Rogoff(2008), This Time is Different: A
Panoramic view of eight Centuries of Financial Crises; NBER Working Paper.


