
Press Release from the Atlas Copco Group
Atlas Copco Group Center
Atlas Copco AB Visitors address: Telephone: +46 8 743 8000 A Public Company (publ)
SE-105 23 Stockholm Sickla Industriväg 19 www.atlascopcogroup.com Reg. No: 556014-2720
Sweden Nacka Reg. Office Nacka
October 20, 2016
Atlas Copco Third-quarter report 2016 (unaudited)
Organic order growth, solid profit and strong cash flow Order growth for all business areas
Orders increased 11% to MSEK 26 696 (24 149), organic growth of 7%
Revenues increased 3% to MSEK 26 528 (25 723), unchanged organically
Adjusted operating profit of MSEK 5 189 (5 239), corresponding to a margin of 19.6% (20.4)
Reported operating profit at MSEK 5 023 (5 313), including change in provision for long-term incentive
program MSEK -166 (+74)
Profit before tax amounted to MSEK 4 716 (5 042)
Profit for the period was MSEK 3 391 (3 806)
Basic earnings per share were SEK 2.78 (3.12)
Strong operating cash flow at MSEK 4 958 (4 621)
Vacuum Technique - New business area in 2017
MSEK 2016 2015 2016 2015
Orders received 26 696 24 149 11% 77 351 76 394 1%
Revenues 26 528 25 723 3% 75 103 76 579 -2%
Operating profit 5 023 5 313 -5% 13 968 14 904 -6%
– as a percentage of revenues 18.9 20.7 18.6 19.5
Profit before tax 4 716 5 042 -6% 13 133 14 179 -7%
– as a percentage of revenues 17.8 19.6 17.5 18.5
Profit for the period 3 391 3 806 -11% 9 487 10 693 -11%
Basic earnings per share, SEK 2.78 3.12 7.80 8.78
Diluted earnings per share, SEK 2.76 3.10 7.79 8.72
Return on capital employed, % 25 27
July - September January - September
Near-term demand outlook The overall demand for the Group is expected to remain at current level.
Previous near-term demand outlook (published July 15, 2016):
The overall demand for the Group is expected to remain at current level.

Atlas Copco – Q3 2016 2 (18)
Atlas Copco Group Summary of nine-month resultsOrders received in the first nine months of 2016 increased
by 1% to MSEK 77 351 (76 394), corresponding to 2%
organic increase. Structural changes added 2%, and the
currency effect was -3%. Revenues were MSEK 75 103
(76 579), corresponding to 1% organic decline.
Operating profit was MSEK 13 968 (14 904). The
operating margin was 18.6% (19.5). The negative impact of
changes in exchange rates was MSEK 805.
Profit before tax was MSEK 13 133 (14 179), corresponding
to a margin of 17.5% (18.5). Profit for the period totaled
MSEK 9 487 (10 693). Basic and diluted earnings per share
were SEK 7.80 (8.78) and 7.79 (8.72) respectively.
Operating cash flow before acquisitions, divestments and
dividends totaled MSEK 11 572 (11 600).
Review of the third quarterMarket development
The order volumes for equipment increased compared to the
previous year, with significant growth for vacuum
equipment, and growth for industrial tools and industrial
compressors. The order volumes also increased for mining
equipment and it was slightly higher for construction
equipment. Gas and process compressors, however, had
lower order intake.
The service business for the industrial sector continued
to grow, while the closures and downsizing of mines at the
end of 2015 and early 2016 continued to have a negative
impact on the mining service business where volumes
decreased. Low activity in the construction industry also
affected the service activity for construction.
Geographically, a positive year-on-year order
development was achieved in all regions.
Geographic distribution of orders received
%, July - Sep. 2016 Orders Received Change*
North America 23 +1
South America 7 +1
Europe 29 +7
Africa/Middle East 9 +22
Asia 28 +20
Australia 4 +42
Atlas Copco Group 100 +11
Atlas Copco Group
*Change in orders received compared to the previous
year in local currency, %.
Sales bridge
Orders
MSEK received Revenues
2015 24 149 25 723
Structural change, % +4 +3
Currency, % +0 +0
Price, % +0 +0
Volume, % +7 +0
Total, % +11 +3
2016 26 696 26 528
July - September
Orders, revenues and operating profit margin
0%
5%
10%
15%
20%
25%
30%
0
5 000
10 000
15 000
20 000
25 000
30 000
Q12014
Q22014
Q32014
Q42014
Q12015
Q22015
Q32015
Q42015
Q12016
Q22016
Q32016
Orders received, MSEK Revenues, MSEK
Operating margin, % Adjusted operating margin, %
Geographic distribution of orders received
Compressor Industrial Mining and Rock Construction Atlas Copco
%, July - Sep. 2016 Technique Technique Excavation Tech. Technique Group
North America 20 31 23 23 23
South America 4 4 14 7 7
Europe 28 39 24 35 29
Africa/Middle East 8 1 16 11 9
Asia/Australia 40 25 23 24 32
100 100 100 100 100

Atlas Copco – Q3 2016 3 (18)
Revenues, profits and returns
Revenues increased 3% to MSEK 26 528 (25 723) and were
unchanged organically. Acquisitions contributed with 3%,
and currency was unchanged.
The operating profit decreased to MSEK 5 023 (5 313)
and includes a change in provision for share-related long-
term incentive programs, reported in Common Group
Functions of MSEK -166 (+74).
The adjusted operating profit amounted to MSEK 5 189
(5 239), corresponding to a margin of 19.6% (20.4). The
operating margin was negatively affected by dilutions from
acquisitions and currency. The net currency effect compared
to previous year was MSEK -75.
Net financial items were MSEK -307 (-271). Interest net
was MSEK -221 (-193). Other financial items were MSEK
-86 (-78), negatively affected by costs related to repurchase
of the remaining MUSD 506 of a MUSD 800 bond with
maturity in 2017.
Profit before tax amounted to MSEK 4 716 (5 042),
corresponding to a margin of 17.8 % (19.6).
Profit for the period totaled MSEK 3 391 (3 806). Basic
and diluted earnings per share were SEK 2.78 (3.12) and
SEK 2.76 (3.10) respectively.
The return on capital employed during the last 12
months was 25% (27). Return on equity was 22% (29). The
Group uses a weighted average cost of capital (WACC) of
8.0% as an investment and overall performance benchmark.
European Commission’s decision on Belgium’s tax
rulings
On January 11, 2016, the European Commission announced
its decision that Belgian tax rulings granted to companies
with regard to “Excess Profit” shall be considered as illegal
state aid and that unpaid taxes should be paid to the Belgian
state. On May 31, 2016, Atlas Copco submitted an appeal
for annulment of the decision to the European Court of
Justice in Luxembourg (ECJ). The Belgian government and
a number of other companies have filed similar appeals.
On June 29, 2016, Atlas Copco paid MEUR 239
(MSEK 2 250) in order to stop interest charges from
accruing. The amount covered the potential liability for the
years 2010-2014 and reduced the MEUR 300 provision
made in Q4 2015. MEUR 61 is kept as a provision for 2015.
The money will be returned if the appeal in ECJ is
successful. It will likely take several years until the
judgment with the final decision from ECJ is passed.
Operating cash flow and investments
Operating cash surplus reached MSEK 6 398 (6 168).
Working capital decreased by MSEK 1 166 (558), primarily
due to lower inventory. Net investments in rental equipment
were MSEK 268 (181). Net investments in property, plant
and equipment were MSEK 321 (-89). Previous year
includes a property sale and leaseback of premises in
Sweden amounting to MSEK 420.
In total, operating cash flow, adjusted for currency
hedges of loans, reached MSEK 4 958 (4 621, adjusted for
the above property sale).
Net indebtedness
The Group’s net indebtedness, adjusted for the fair value of
interest rate swaps, amounted to MSEK 17 154 (15 988), of
which MSEK 4 622 (2 542) was attributable to post-
employment benefits. The increase in post-employment
benefits is primarily due to the acquisition of Leybold. The
Group has an average maturity of 5.9 years on interest-
bearing liabilities. During the quarter, a 10-year MEUR 500
bond was issued at 0.645% interest rate with the primary
purpose of repurchasing debt originally maturing in Q2
2017. The second and last installment of the annual
dividend, MSEK 3 834, will be paid in November 2016 and
is recorded as a liability. The net debt/EBITDA ratio was
0.7 (0.7). The net debt/equity ratio was 34% (34).
Acquisition and divestment of own shares
During the quarter, 1 008 323 A shares were divested for a
net value of MSEK 246. These transactions are in
accordance with mandates granted by the Annual General
Meeting and relate to the Group’s long-term incentive
programs.
Vacuum Technique - New business area 2017
Since the acquisition of Edwards Group in January 2014, the
vacuum business has been growing. Several acquisitions
have been made, including Leybold and CSK. During the
quarter, the Group announced a fifth business area. The new
business area will be operational as from January 1, 2017.
Restated figures are provided at:
http://www.atlascopcogroup.com/investor-relations
Employees On September 30, 2016, the number of employees was
45 463 (43 295). The number of consultants/external
workforce was 3 321 (3 005). For comparable units, the total
workforce decreased by 632 from September 30, 2015.
Revenues and operating profit – bridge
Volume, price, One-time items Share based
MSEK Q3 2016 mix and other Currency Acquisitions LTI programs Q3 2015
Atlas Copco Group
Revenues 26 528 -120 30 895 - 25 723
Operating profit 5 023 -40 -75 65 -240 5 313
% 18.9% 33.3% 20.7%

Atlas Copco – Q3 2016 4 (18)
Compressor Technique
MSEK 2016 2015 2016 2015
Orders received 12 680 11 022 15% 36 552 34 257 7%
Revenues 12 932 11 875 9% 35 553 34 386 3%
Operating profit 2 905 2 709 7% 7 901 7 704 3%
– as a percentage of revenues 22.5 22.8 22.2 22.4
Return on capital employed, % 39 38
July - September January - September
• Record order intake and revenues, supported by volume growth and acquisitions
• Organic growth for service, vacuum and industrial compressors, but significant drop for gas and process compressors
• The acquisitions of Leybold and CSK were completed
Sales bridge
Orders
MSEK received Revenues
2015 11 022 11 875
Structural change, % +7 +7
Currency, % +0 +0
Price, % +0 +0
Volume, % +8 +2
Total, % +15 +9
2016 12 680 12 932
July - September
Industrial compressors
The order volumes for industrial compressors increased
compared to the previous year, with a relatively better
development for large compressors compared to smaller
compressors.
The order volumes increased in North America and in
Asia, with growth in both India and China, while volumes in
Europe were negative.
Compressor service
The compressor service business continued to achieve
organic growth in nearly all markets.
Gas and process compressors
The order volume decreased compared to the previous year
and sequentially, with negative development in North
America and in Asia.
Vacuum solutions The order volumes for vacuum solutions were significantly
higher compared to the previous year and grew sequentially.
The order intake year-on-year was higher in all major
regions, with Asia as the main contributor to the growth.
Acquisitions
Two acquisitions were completed in August, Schneider
Druckluft, and CSK Inc. Schneider Druckluft, a German
designer and producer of professional compressed air
solutions, had revenues in 2015 of about MSEK 250 and has
about 110 employees. CSK Inc., a South Korean exhaust
management system supplier had revenues in 2015 of about
MSEK 870 and has about 400 employees.
The vacuum business of OC Oerlikon Corporation
(Leybold), with 1 600 employees and revenues in 2015 of
about MSEK 3 150, was acquired in September.
Innovation
The series of variable speed medium compressor models
were extended. The new compressors deliver unsurpassed
efficiency in a space-saving upright format. With these
models, more industrial air users will get the opportunity to
have energy saving compressors with the latest technology.
Revenues and profitability
Revenues increased 9% to a record MSEK 12 932 (11 875),
corresponding to an organic growth of 2%.
Operating profit also reached a record of MSEK 2 905
(2 709), corresponding to a margin of 22.5 % (22.8). The
margin was supported by volume, but negatively affected by
dilution from acquisitions and by currency. Return on
capital employed (last 12 months) was 39% (38).
Orders, revenues and operating profit margin
0%
5%
10%
15%
20%
25%
30%
0
2 500
5 000
7 500
10 000
12 500
15 000
Q12014
Q22014
Q32014
Q42014
Q12015
Q22015
Q32015
Q42015
Q12016
Q22016
Q32016
Orders received, MSEK Revenues, MSEK
Operating margin, % Adjusted operating margin, %
Atlas Copco – Q3 2016 5 (18)
Industrial Technique
MSEK 2016 2015 2016 2015
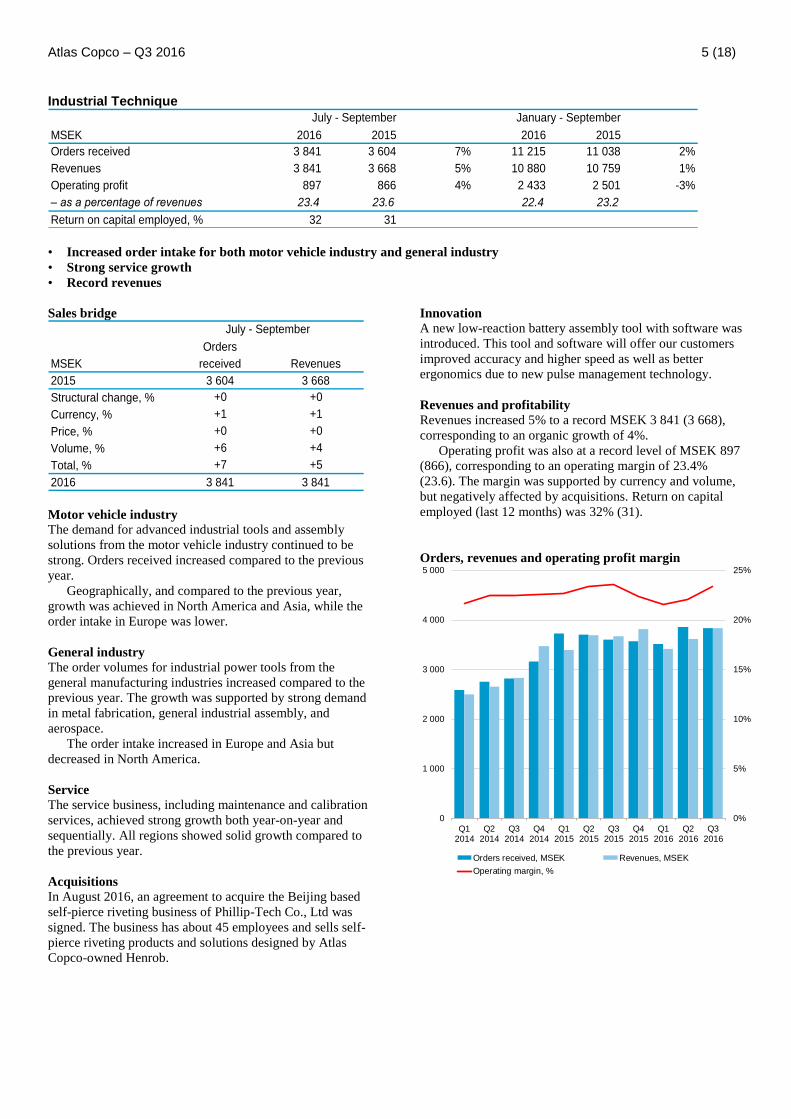
Orders received 3 841 3 604 7% 11 215 11 038 2%
Revenues 3 841 3 668 5% 10 880 10 759 1%
Operating profit 897 866 4% 2 433 2 501 -3%
– as a percentage of revenues 23.4 23.6 22.4 23.2
Return on capital employed, % 32 31
July - September January - September
• Increased order intake for both motor vehicle industry and general industry
• Strong service growth
• Record revenues
Sales bridge
Orders
MSEK received Revenues
2015 3 604 3 668
Structural change, % +0 +0
Currency, % +1 +1
Price, % +0 +0
Volume, % +6 +4
Total, % +7 +5
2016 3 841 3 841
July - September
Motor vehicle industry
The demand for advanced industrial tools and assembly
solutions from the motor vehicle industry continued to be
strong. Orders received increased compared to the previous
year.
Geographically, and compared to the previous year,
growth was achieved in North America and Asia, while the
order intake in Europe was lower.
General industry
The order volumes for industrial power tools from the
general manufacturing industries increased compared to the
previous year. The growth was supported by strong demand
in metal fabrication, general industrial assembly, and
aerospace.
The order intake increased in Europe and Asia but
decreased in North America.
Service
The service business, including maintenance and calibration
services, achieved strong growth both year-on-year and
sequentially. All regions showed solid growth compared to
the previous year.
Acquisitions
In August 2016, an agreement to acquire the Beijing based
self-pierce riveting business of Phillip-Tech Co., Ltd was
signed. The business has about 45 employees and sells self-
pierce riveting products and solutions designed by Atlas
Copco-owned Henrob.
Innovation A new low-reaction battery assembly tool with software was
introduced. This tool and software will offer our customers
improved accuracy and higher speed as well as better
ergonomics due to new pulse management technology.
Revenues and profitability
Revenues increased 5% to a record MSEK 3 841 (3 668),
corresponding to an organic growth of 4%.
Operating profit was also at a record level of MSEK 897
(866), corresponding to an operating margin of 23.4%
(23.6). The margin was supported by currency and volume,
but negatively affected by acquisitions. Return on capital
employed (last 12 months) was 32% (31).
Orders, revenues and operating profit margin
0%
5%
10%
15%
20%
25%
0
1 000
2 000
3 000
4 000
5 000
Q12014
Q22014
Q32014
Q42014
Q12015
Q22015
Q32015
Q42015
Q12016
Q22016
Q32016
Orders received, MSEK Revenues, MSEK
Operating margin, %

Atlas Copco – Q3 2016 6 (18)
Mining and Rock Excavation Technique
MSEK 2016 2015 2016 2015
Orders received 6 644 6 077 9% 18 766 19 696 -5%
Revenues 6 212 6 481 -4% 18 072 20 107 -10%
Operating profit 1 163 1 296 -10% 3 070 3 830 -20%
– as a percentage of revenues 18.7 20.0 17.0 19.0
Return on capital employed, % 31 34
July - September January - September
Increased order intake for mining equipment and consumables
Service business down year-on-year, but somewhat up sequentially
Increased operating margin sequentially
Sales bridge
Orders
MSEK received Revenues
2015 6 077 6 481
Structural change, % +0 +0
Currency, % -1 +0
Price, % +0 +0
Volume, % +10 -4
Total, % +9 -4
2016 6 644 6 212
July - September
Mining equipment
The order volumes for mining equipment increased
compared to the previous year, even when adjusted for
cancellations in Q3 2015, and also improved sequentially.
Geographically, the order intake increased most in
Africa and South America, while it decreased in North
America.
Civil engineering equipment The order intake for equipment for infrastructure projects
was largely unchanged.
Service and consumables
The service and spare parts business decreased compared to
the previous year and was negatively affected by several
closed or downsized mines at the end of 2015 and early
2016. Sequentially, service orders increased somewhat.
Service order intake was higher in Asia, Europe, and
Australia, but lower in North and South America compared
to the previous year.
Order volumes for consumables increased somewhat
sequentially and compared to the previous year, supported
by increases in most mining markets.
Innovation Several new products were introduced in connection with
MINExpo International in September 2016. A few of the
products introduced were:
A new 65 tons mine truck that increases productivity for
our customers. The truck comes ready for automation
with capabilities of monitoring production data in real
time. When equipped with the Certiq software, machine
data can be collected and utilized to optimize operation
and maintenance.
A new compact mining and tunneling drill rig with
intelligent control systems and high productivity.
A cab-less drill rig for autonomous drilling.
Revenues and profitability
Revenues were MSEK 6 212 (6 481), corresponding to an
organic decline of 4%.
Operating profit was MSEK 1 163 (1 296),
corresponding to a margin of 18.7% (20.0). The margin was
negatively affected by currency and volume. Return on
capital employed (last 12 months) was 31% (34).
Orders, revenues and operating profit margin
0%
3%
6%
9%
12%
15%
18%
21%
24%
0
1 000
2 000
3 000
4 000
5 000
6 000
7 000
8 000
Q12014
Q22014
Q32014
Q42014
Q12015
Q22015
Q32015
Q42015
Q12016
Q22016
Q32016
Orders received, MSEK Revenues, MSEK
Operating margin, % Adjusted operating margin, %
Atlas Copco – Q3 2016 7 (18)
Construction Technique
MSEK 2016 2015 2016 2015
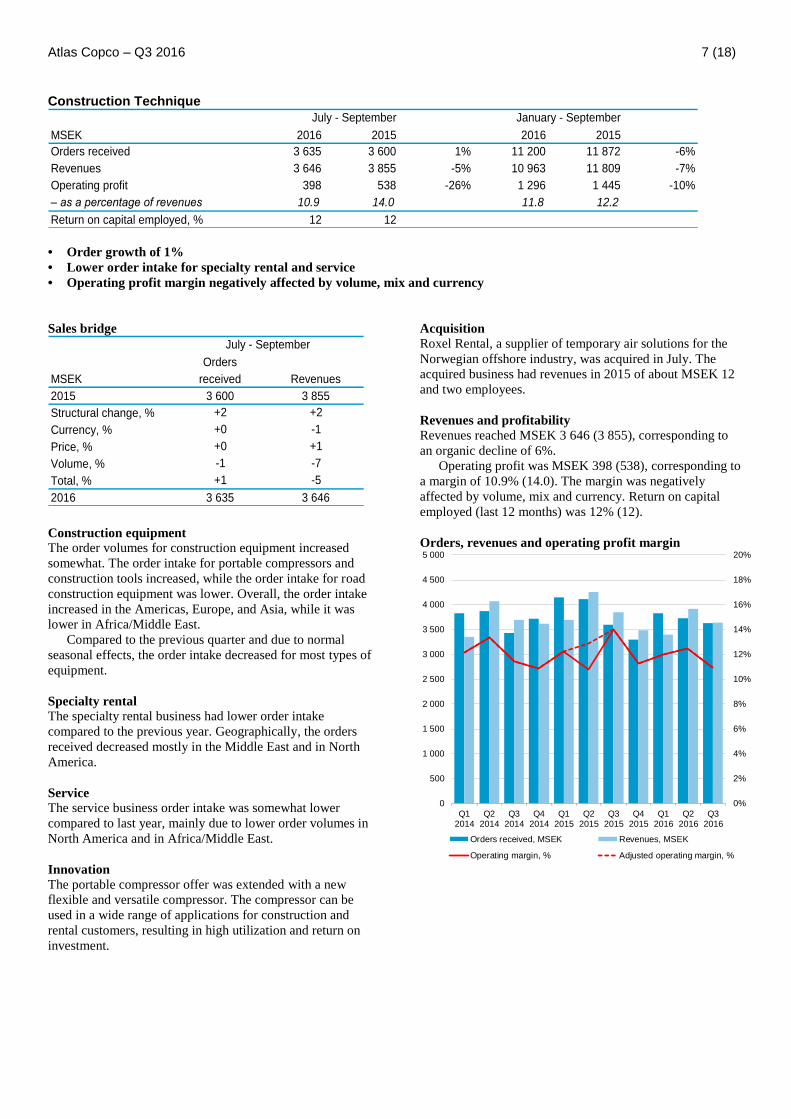
Orders received 3 635 3 600 1% 11 200 11 872 -6%
Revenues 3 646 3 855 -5% 10 963 11 809 -7%
Operating profit 398 538 -26% 1 296 1 445 -10%
– as a percentage of revenues 10.9 14.0 11.8 12.2
Return on capital employed, % 12 12
July - September January - September
• Order growth of 1%
• Lower order intake for specialty rental and service
• Operating profit margin negatively affected by volume, mix and currency
Sales bridge
Orders
MSEK received Revenues
2015 3 600 3 855
Structural change, % +2 +2
Currency, % +0 -1
Price, % +0 +1
Volume, % -1 -7
Total, % +1 -5
2016 3 635 3 646
July - September
Construction equipment
The order volumes for construction equipment increased
somewhat. The order intake for portable compressors and
construction tools increased, while the order intake for road
construction equipment was lower. Overall, the order intake
increased in the Americas, Europe, and Asia, while it was
lower in Africa/Middle East.
Compared to the previous quarter and due to normal
seasonal effects, the order intake decreased for most types of
equipment.
Specialty rental
The specialty rental business had lower order intake
compared to the previous year. Geographically, the orders
received decreased mostly in the Middle East and in North
America.
Service
The service business order intake was somewhat lower
compared to last year, mainly due to lower order volumes in
North America and in Africa/Middle East.
Innovation
The portable compressor offer was extended with a new
flexible and versatile compressor. The compressor can be
used in a wide range of applications for construction and
rental customers, resulting in high utilization and return on
investment.
Acquisition
Roxel Rental, a supplier of temporary air solutions for the
Norwegian offshore industry, was acquired in July. The
acquired business had revenues in 2015 of about MSEK 12
and two employees.
Revenues and profitability
Revenues reached MSEK 3 646 (3 855), corresponding to
an organic decline of 6%.
Operating profit was MSEK 398 (538), corresponding to
a margin of 10.9% (14.0). The margin was negatively
affected by volume, mix and currency. Return on capital
employed (last 12 months) was 12% (12).
Orders, revenues and operating profit margin
0%
2%
4%
6%
8%
10%
12%
14%
16%
18%
20%
0
500
1 000
1 500
2 000
2 500
3 000
3 500
4 000
4 500
5 000
Q12014
Q22014
Q32014
Q42014
Q12015
Q22015
Q32015
Q42015
Q12016
Q22016
Q32016
Orders received, MSEK Revenues, MSEK
Operating margin, % Adjusted operating margin, %

Atlas Copco – Q3 2016 8 (18)
Accounting principles
The consolidated accounts of the Atlas Copco Group are
prepared in accordance with International Financial
Reporting Standards (IFRS). The description of the
accounting principles and definitions are found in the annual
report 2015. The interim report is prepared in accordance
with IAS 34 Interim Financial Reporting. Non-IFRS
measures are also presented in the report since they are
considered to be important supplemental measures of the
company´s performance. For further information on how
these measures have been calculated, please visit:
http://www.atlascopcogroup.com/investor-relations
Risks and factors of uncertainty
Market risks
The demand for Atlas Copco’s equipment and services is
affected by changes in the customers’ investment and
production levels. A widespread financial crisis and
economic downturn affects the Group negatively both in
terms of revenues and profitability. However, the Group’s
sales are well diversified with customers in many industries
and countries around the world, which limits the risk.
Financial risks
Atlas Copco is subject to currency risks, interest rate risks,
tax risks, and other financial risks. In line with the overall
goals with respect to growth, return on capital, and
protecting creditors, Atlas Copco has adopted a policy to
control the financial risks to which the Group is exposed. A
financial risk management committee meets regularly to
manage and follow up financial risks, in line with the policy.
Production risks
Many components are sourced from sub-suppliers. The
availability is dependent on the sub-suppliers and if they
have interruptions or lack capacity, this may adversely affect
production. To minimize these risks, Atlas Copco has
established a global network of sub-suppliers, which means
that in most cases there are more than one sub-supplier that
can supply a certain component.
Atlas Copco is also directly and indirectly exposed to
raw material prices. Cost increases for raw materials and
components often coincide with strong end-customer
demand and can partly be offset by increased sales to
mining customers and partly compensated for by increased
market prices.
Acquisitions
Atlas Copco has the ambition to grow all its business areas,
primarily through organic growth, complemented by
selected acquisitions. The integration of acquired businesses
is a difficult process and it is not certain that every
integration will be successful. Therefore, costs related to
acquisitions can be higher and/or synergies can take longer
to materialize than anticipated.
For further information, see the annual report 2015.
Forward-looking statements
Some statements in this report are forward-looking, and the
actual outcome could be materially different. In addition to
the factors explicitly discussed, other factors could have a
material effect on the actual outcome. Such factors include,
but are not limited to, general business conditions,
fluctuations in exchange rates and interest rates, political
developments, the impact of competing products and their
pricing, product development, commercialization and
technological difficulties, interruptions in supply, and major
customer credit losses.
Atlas Copco AB
Atlas Copco AB and its subsidiaries are sometimes referred
to as the Atlas Copco Group, the Group or Atlas Copco.
Atlas Copco AB is also sometimes referred to as Atlas
Copco. Any mentioning of the Board of Directors or the
Directors refers to the Board of Directors of Atlas Copco
AB.

Atlas Copco – Q3 2016 9 (18)
Consolidated income statement
Sep. 30 Sep. 30 Sep. 30 Sep. 30 Sep. 30 Sep. 30 Dec. 31
MSEK 2016 2015 2016 2015 2016 2015 2015
Revenues 26 528 25 723 75 103 76 579 100 685 101 939 102 161
Cost of sales -16 144 -15 440 -45 694 -46 517 -61 208 -62 268 -62 031
Gross profit 10 384 10 283 29 409 30 062 39 477 39 671 40 130
Marketing expenses -2 834 -2 650 -8 190 -8 213 -10 975 -10 817 -10 998
Administrative expenses -1 798 -1 401 -4 972 -4 728 -6 598 -6 209 -6 354
Research and development costs -796 -870 -2 352 -2 437 -3 202 -3 225 -3 287
Other operating income and expenses 67 -49 73 220 90 255 237
Operating profit 5 023 5 313 13 968 14 904 18 792 19 675 19 728
- as a percentage of revenues 18.9 20.7 18.6 19.5 18.7 19.3 19.3
Net financial items -307 -271 -835 -725 -1 015 -1 060 -905
Profit before tax 4 716 5 042 13 133 14 179 17 777 18 615 18 823
- as a percentage of revenues 17.8 19.6 17.5 18.5 17.7 18.3 18.4
Income tax expense -1 325 -1 236 -3 646 -3 486 -7 260 -4 587 -7 100
Profit for the period 3 391 3 806 9 487 10 693 10 517 14 028 11 723
Profit attributable to
- owners of the parent 3 389 3 805 9 481 10 687 10 511 14 020 11 717
- non-controlling interests 2 1 6 6 6 8 6
Basic earnings per share, SEK 2.78 3.12 7.80 8.78 8.64 11.52 9.62
Diluted earnings per share, SEK 2.76 3.10 7.79 8.72 8.62 11.45 9.58
Basic weighted average number
of shares outstanding, millions 1 216.7 1 217.8 1 216.1 1 217.6 1 216.3 1 217.5 1 217.4
Diluted weighted average number
of shares outstanding, millions 1 217.5 1 218.4 1 216.5 1 219.0 1 216.8 1 218.9 1 218.7
Key ratios
Equity per share, period end, SEK 42 38 38
Return on capital employed, 12 month values, % 25 27 27
Return on equity, 12 month values, % 22 29 24
Debt/equity ratio, period end, % 34 34 32
Equity/assets ratio, period end, % 44 44 45
Number of employees, period end 45 463 43 295 43 114
3 months ended 9 months ended 12 months ended

Atlas Copco – Q3 2016 10 (18)
Consolidated statement of comprehensive income
Sep. 30 Sep. 30 Sep. 30 Sep. 30 Sep. 30 Sep. 30 Dec. 31
MSEK 2016 2015 2016 2015 2016 2015 2015
Profit for the period 3 391 3 806 9 487 10 693 10 517 14 028 11 723
Other comprehensive income
Items that will not be reclassified to profit or loss
Remeasurements of defined benefit pension plans -439 223 -703 118 -159 -42 662
Income tax relating to items that will not be reclassified 102 -51 162 -20 58 27 -124
-337 172 -541 98 -101 -15 538
Items that may be reclassified subsequently to profit or loss
Translation differences on foreign operations 1 294 -199 2 647 -152 1 429 2 700 -1 370
Hedge of net investments in foreign operations 196
Cash flow hedges -22 -27 -22 62 -16 47 68
Income tax relating to items that may be reclassified 241 222 560 -156 259 272 -457
1 135 -360 2 304 -50 1 276 2 575 -1 078
Other comprehensive income for the period, net of tax 798 -188 1 763 48 1 175 2 560 -540
Total comprehensive income for the period 4 189 3 618 11 250 10 741 11 692 16 588 11 183
Total comprehensive income attributable to
- owners of the parent 4 182 3 617 11 241 10 727 11 687 16 562 11 173
- non-controlling interests 7 1 9 14 5 26 10
-396 -444-356
12 months ended
681
9 months ended
-881
3 months ended
-378

Atlas Copco – Q3 2016 11 (18)
Consolidated balance sheet
MSEK Sep. 30, 2016 Sep. 30, 2015 Dec. 31, 2015
Intangible assets 39 370 33 789 33 520
Rental equipment 3 102 3 077 3 076
Other property, plant and equipment 10 064 9 069 8 947
Financial assets and other receivables 2 240 2 075 2 305
Deferred tax assets 2 058 1 893 1 823
Total non-current assets 56 834 49 903 49 671
Inventories 18 462 18 261 16 906
Trade and other receivables 28 201 26 817 25 985
Other financial assets 1 675 1 674 1 576
Cash and cash equivalents 10 785 8 279 8 861
Assets classified as held for sale 10 41 11
Total current assets 59 133 55 072 53 339
TOTAL ASSETS 115 967 104 975 103 010
Equity attributable to owners of the parent 50 433 46 529 46 591
Non-controlling interests 69 162 159
TOTAL EQUITY 50 502 46 691 46 750
Borrowings 23 306 22 372 21 888
Post-employment benefits 4 622 2 542 2 225
Other liabilities and provisions 1 865 1 624 1 595
Deferred tax liabilities 1 235 1 292 1 497
Total non-current liabilities 31 028 27 830 27 205
Borrowings 1 548 1 020 1 101
Trade payables and other liabilities 31 093 27 842 26 481
Provisions 1 796 1 592 1 473
Total current liabilities 34 437 30 454 29 055
TOTAL EQUITY AND LIABILITIES 115 967 104 975 103 010 Fair value of derivatives and borrowings The carrying value and fair value of the Group’s outstanding derivatives and borrowings are shown in the tables below. The fair
values of bonds are based on level 1 and the fair values of derivatives and other loans are based on level 2 in the fair value
hierarchy. Compared to 2015, no transfers have been made between different levels in the fair value hierarchy for derivatives and
borrowings and no significant changes have been made to valuation techniques, inputs or assumptions.
Outstanding derivative instruments recorded to fair value
MSEK Sep. 30, 2016 Dec. 31, 2015
Non-current assets and liabilities
Assets 3 102
Liabilities 148 134
Current assets and liabilities
Assets 162 324
Liabilities 208 190
Carrying value and fair value of borrowings
MSEK Sep. 30, 2016 Sep. 30, 2016 Dec. 31, 2015 Dec. 31, 2015
Carrying value Fair value Carrying value Fair value
Bonds 15 642 16 741 17 199 18 408
Other loans 9 212 9 379 5 790 5 920
24 854 26 120 22 989 24 328

Atlas Copco – Q3 2016 12 (18)
Consolidated statement of changes in equity
MSEK
owners of the
parent
non-controlling
interests Total equity
Opening balance, January 1, 2016 46 591 159 46 750
Changes in equity for the period
Total comprehensive income for the period 11 241 9 11 250
Dividends* -7 659 -13 -7 672
Change of non-controlling interests -67 -86 -153
Acquisition and divestment of own shares 311 - 311
Share-based payments, equity settled 16 - 16
Closing balance, September 30, 2016 50 433 69 50 502
MSEK
owners of the
parent
non-controlling
interests Total equity
Opening balance, January 1, 2015 50 575 178 50 753
Changes in equity for the period
Total comprehensive income for the period 11 173 10 11 183
Dividends -7 305 -29 -7 334
Redemption of shares -7 305 - -7 305
Acquisition and divestment of own shares -453 - -453
Share-based payments, equity settled -94 - -94
Closing balance, December 31, 2015 46 591 159 46 750
MSEK
owners of the
parent
non-controlling
interests Total equity
Opening balance, January 1, 2015 50 575 178 50 753
Changes in equity for the period
Total comprehensive income for the period 10 727 14 10 741
Dividends -7 311 -30 -7 341
Redemption of shares -7 305 - -7 305
Acquisition and divestment of own shares -56 - -56
Share-based payments, equity settled -101 - -101
Closing balance, September 30, 2015 46 529 162 46 691
Equity attributable to
Equity attributable to
Equity attributable to
* The annual dividend of which the first installment of MSEK 3 830 has been paid in May 2016 and the
second installment will be paid in November 2016. This latter has been recorded as a liability.

Atlas Copco – Q3 2016 13 (18)
Consolidated statement of cash flows
MSEK 2016 2015 2016 2015
Cash flows from operating activities
Operating profit 5 023 5 313 13 968 14 904
Depreciation, amortization and impairment (see below) 1 111 1 148 3 188 3 242
Capital gain/loss and other non-cash items 264 -293 185 -513
Operating cash surplus 6 398 6 168 17 341 17 633
Net financial items received/paid -448 130 -357 -1 182
Taxes paid -1 270 -1 266 -6 269 1) -3 437
Pension funding and payment of pension to
employees -57 7 -94 66
Change in working capital 1 166 558 1 720 218
Investments in rental equipment -361 -301 -901 -953
Sale of rental equipment 93 120 324 337
Net cash from operating activities 5 521 5 416 11 764 12 682
Cash flows from investing activities
Investments in property, plant and equipment -345 -392 -958 -1 219
Sale of property, plant and equipment 24 481 82 538
Investments in intangible assets -262 -235 -817 -814
Sale of intangible assets 3 13 6 16
Acquisition of subsidiaries and associated companies -3 692 -115 -4 656 -1 772 2)
Sale of subsidiaries - - - 43
Other investments, net -71 -31 -239 116
Net cash from investing activities -4 343 -279 -6 582 -3 092
Cash flows from financing activities
Dividends paid - - -3 830 -3 651
Dividends paid to non-controlling interest -1 -30 -13 -30
Acquisition of non-controlling interest -67 - -67 -
Redemption of shares - - - -7 305
Repurchase and sales of own shares 246 17 311 -56
Change in interest-bearing liabilities 244 -3 078 32 552
Net cash from financing activities 422 -3 091 -3 567 -10 490
Net cash flow for the period 1 600 2 046 1 615 -900
Cash and cash equivalents, beginning of the period 8 891 6 301 8 861 9 404
Exchange differences in cash and cash equivalents 294 -68 309 -225
Cash and cash equivalents, end of the period 10 785 8 279 10 785 8 279
Depreciation, amortization and impairment
Rental equipment 250 263 732 778
Other property, plant and equipment 414 419 1 209 1 246
Intangible assets 447 466 1 247 1 218
Total 1 111 1 148 3 188 3 2421)
Includes tax payment in Belgium of MSEK 2 250 see page 3. 2)
Includes deferred consideration for acquisitions made in 2014.
Calculation of operating cash flow
MSEK 2016 2015 2016 2015
Net cash flow for the period 1 600 2 046 1 615 -900
Add back:
Change in pensions - - -
Change in interest-bearing liabilities -244 3 078 -32 -552
Repurchase and sales of own shares -246 -17 -311 56
Dividends paid - - 3 830 3 651
Dividends paid to non-controlling interest 1 30 13 30
Acquisition of non-controlling interest 67 - 67 -
Redemption of shares - - - 7 305
Acquisitions and divestments 3 692 115 4 656 1 729
Investments of cash liquidity - - - -
Currency hedges of loans 88 -211 -516 701
Divestment of property - -420 - -420
Tax payment related to Belgian tax rulings - - 2 250 -
Operating cash flow 4 958 4 621 11 572 11 600
July - September January - September
July - September January - September

Atlas Copco – Q3 2016 14 (18)
Revenues by business area
2014 2015 2016
MSEK (by quarter) Q1 Q2 Q3 Q4 Q1 Q2 Q3 Q4 Q1 Q2 Q3
Compressor Technique 9 409 10 353 10 718 11 685 11 049 11 462 11 875 11 851 10 692 11 929 12 932
- of which external 9 361 10 307 10 682 11 653 10 951 11 378 11 806 11 793 10 611 11 847 12 870
- of which internal 48 46 36 32 98 84 69 58 81 82 62
Industrial Technique 2 505 2 650 2 827 3 468 3 394 3 697 3 668 3 819 3 417 3 622 3 841
- of which external 2 493 2 636 2 816 3 454 3 382 3 684 3 656 3 806 3 406 3 611 3 830
- of which internal 12 14 11 14 12 13 12 13 11 11 11
Mining and Rock
Excavation Technique 6 251 6 396 6 449 6 622 6 756 6 870 6 481 6 558 5 736 6 124 6 212
- of which external 6 237 6 373 6 398 6 618 6 724 6 856 6 451 6 527 5 723 6 111 6 204
- of which internal 14 23 51 4 32 14 30 31 13 13 8
Construction Technique 3 354 4 068 3 692 3 625 3 698 4 256 3 855 3 491 3 402 3 915 3 646
- of which external 3 272 3 971 3 621 3 558 3 634 4 136 3 762 3 408 3 310 3 825 3 572
- of which internal 82 97 71 67 64 120 93 83 92 90 74
Common Group functions/
Eliminations -96 -119 -96 -40 -152 -174 -156 -137 -110 -152 -103
Atlas Copco Group 21 423 23 348 23 590 25 360 24 745 26 111 25 723 25 582 23 137 25 438 26 528 Operating profit by business area
2014 2015 2016
MSEK (by quarter) Q1 Q2 Q3 Q4 Q1 Q2 Q3 Q4 Q1 Q2 Q3
Compressor Technique 1 915 2 219 2 369 2 471 2 392 2 603 2 709 2 620 2 296 2 700 2 905
- as a percentage of revenues 20.4 21.4 22.1 21.1 21.6 22.7 22.8 22.1 21.5 22.6 22.5
Industrial Technique 543 595 636 783 770 865 866 854 737 799 897
- as a percentage of revenues 21.7 22.5 22.5 22.6 22.7 23.4 23.6 22.4 21.6 22.1 23.4
Mining and Rock
Excavation Technique
1 071 1 155 856 1 225 1 276 1 258 1 296 1 163 866 1 041 1 163
- as a percentage of revenues 17.1 18.1 13.3 18.5 18.9 18.3 20.0 17.7 15.1 17.0 18.7
Construction Technique 406 545 422 395 450 457 538 394 408 490 398
- as a percentage of revenues 12.1 13.4 11.4 10.9 12.2 10.7 14.0 11.3 12.0 12.5 10.9
Common Group functions/
Eliminations -175 -175 -138 -103 -369 -111 -96 -207 -137 -255 -340
Operating profit 3 760 4 339 4 145 4 771 4 519 5 072 5 313 4 824 4 170 4 775 5 023
- as a percentage of revenues 17.6 18.6 17.6 18.8 18.3 19.4 20.7 18.9 18.0 18.8 18.9
Net financial items -158 -165 -266 -335 -232 -222 -271 -180 -173 -355 -307
Profit before tax 3 602 4 174 3 879 4 436 4 287 4 850 5 042 4 644 3 997 4 420 4 716
- as a percentage of revenues 16.8 17.9 16.4 17.5 17.3 18.6 19.6 18.2 17.3 17.4 17.8
Key figures by quarter
2014 2015 2016
SEK Q1 Q2 Q3 Q4 Q1 Q2 Q3 Q4 Q1 Q2 Q3
Basic earnings per share 2.27 2.64 2.37 2.74 2.66 3.00 3.12 0.85 2.39 2.62 2.78
Diluted earnings per share 2.27 2.64 2.36 2.73 2.65 2.96 3.10 0.85 2.38 2.62 2.76
Equity per share 35 33 37 42 45 35 38 38 40 37 42
Operating cash flow per share 1.53 2.55 3.35 4.01 2.87 2.86 3.80 4.40 2.57 2.87 4.07
%
Return on capital employed,
12 months value 26 25 25 24 24 25 27 27 26 27 25
Return on equity, 12 months value 32 31 30 28 27 28 29 24 24 24 22
Debt/equity ratio, period end 37 51 44 30 26 48 34 32 25 34 34
Equity/assets ratio, period end 45 43 45 48 49 41 44 45 46 43 44
Number of employees, period end 43 846 43 937 44 243 44 056 43 866 43 584 43 295 43 114 43 274 43 118 45 463
Atlas Copco – Q3 2016 15 (18)
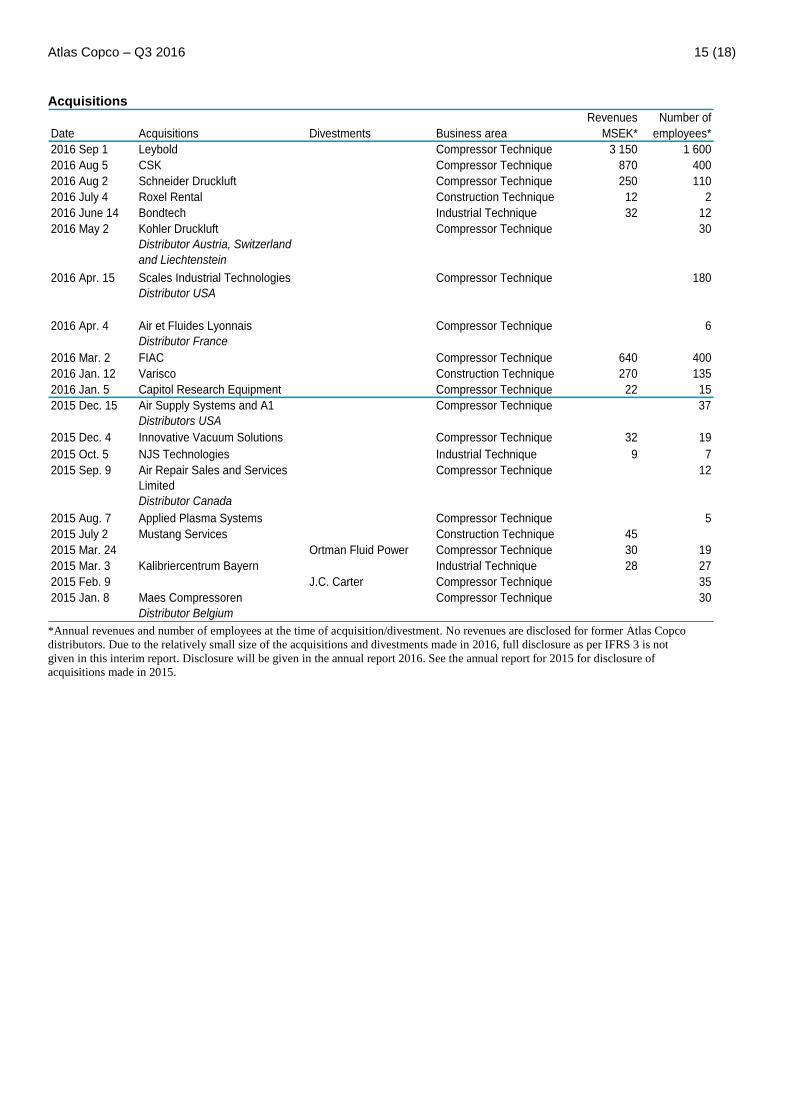
Acquisitions
Revenues Number of
Date Acquisitions Divestments Business area MSEK* employees*
2016 Sep 1 Leybold Compressor Technique 3 150 1 600
2016 Aug 5 CSK Compressor Technique 870 400
2016 Aug 2 Schneider Druckluft Compressor Technique 250 110
2016 July 4 Roxel Rental Construction Technique 12 2
2016 June 14 Bondtech Industrial Technique 32 12
2016 May 2 Kohler Druckluft
Distributor Austria, Switzerland
and Liechtenstein
Compressor Technique 30
2016 Apr. 15 Scales Industrial Technologies
Distributor USA
Compressor Technique 180
2016 Apr. 4 Air et Fluides Lyonnais
Distributor France
Compressor Technique 6
2016 Mar. 2 FIAC Compressor Technique 640 400
2016 Jan. 12 Varisco Construction Technique 270 135
2016 Jan. 5 Capitol Research Equipment Compressor Technique 22 15
2015 Dec. 15 Air Supply Systems and A1
Distributors USA
Compressor Technique 37
2015 Dec. 4 Innovative Vacuum Solutions Compressor Technique 32 19
2015 Oct. 5 NJS Technologies Industrial Technique 9 7
2015 Sep. 9 Air Repair Sales and Services
Limited
Distributor Canada
Compressor Technique 12
2015 Aug. 7 Applied Plasma Systems Compressor Technique 5
2015 July 2 Mustang Services Construction Technique 45
2015 Mar. 24 Ortman Fluid Power Compressor Technique 30 19
2015 Mar. 3 Kalibriercentrum Bayern Industrial Technique 28 27
2015 Feb. 9 J.C. Carter Compressor Technique 35
2015 Jan. 8 Maes Compressoren
Distributor Belgium
Compressor Technique 30
*Annual revenues and number of employees at the time of acquisition/divestment. No revenues are disclosed for former Atlas Copco
distributors. Due to the relatively small size of the acquisitions and divestments made in 2016, full disclosure as per IFRS 3 is not
given in this interim report. Disclosure will be given in the annual report 2016. See the annual report for 2015 for disclosure of
acquisitions made in 2015.

Atlas Copco – Q3 2016 16 (18)
Parent company Income statement
MSEK 2016 2015 2016 2015
Administrative expenses -175 -110 -433 -409
Other operating income and expenses 41 23 113 99
Operating profit/loss -134 -87 -320 -310
Financial income and expenses 387 352 2 348 5 415
Profit/loss before tax 253 265 2 028 5 105
Income tax 94 146 277 220
Profit/loss for the period 347 411 2 305 5 325
July - September January - September
Balance sheet
Sep. 30 Sep. 30 Dec. 31
MSEK 2016 2015 2015
Total non-current assets 111 237 94 606 111 026
Total current assets 8 347 5 328 7 331
TOTAL ASSETS 119 584 99 934 118 357
Total restricted equity 5 785 5 785 5 785
Total non-restricted equity 29 429 28 418 34 469
TOTAL EQUITY 35 214 34 203 40 254
Total provisions 368 347 267
Total non-current liabilities 53 186 43 713 49 197
Total current liabilities 30 816 21 671 28 639
TOTAL EQUITY AND LIABILITIES 119 584 99 934 118 357
Assets pledged 259 249 279
Contingent liabilities 8 185 8 025 7 846
Accounting principles
Atlas Copco AB is the ultimate Parent Company of the Atlas Copco Group. The financial statements of Atlas Copco AB have
been prepared in accordance with the Swedish Annual Accounts Act and the accounting standard RFR 2, Accounting for Legal
Entities. The same accounting principles and methods of computation are followed in the interim financial statements as compared
with the most recent annual financial statements. See also accounting principles, page 8.
Atlas Copco – Q3 2016 17 (18)
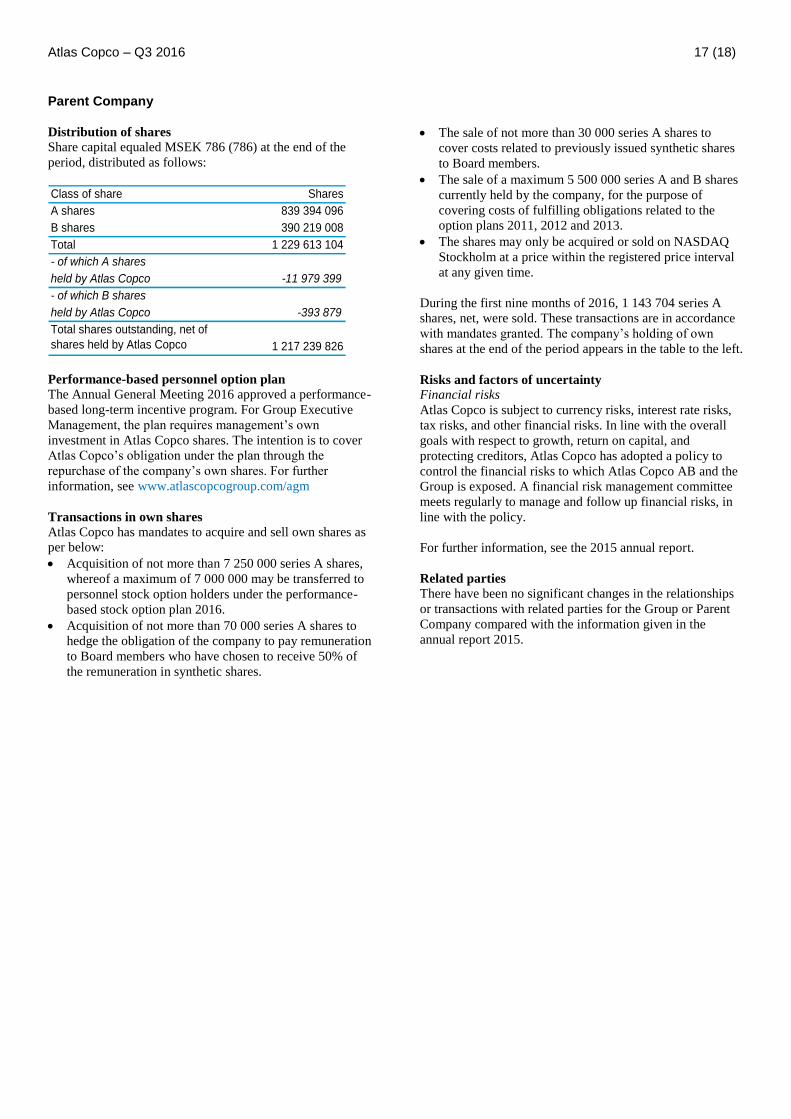
Parent Company Distribution of shares
Share capital equaled MSEK 786 (786) at the end of the
period, distributed as follows:
Class of share Shares
A shares 839 394 096
B shares 390 219 008
Total 1 229 613 104
- of which A shares
held by Atlas Copco -11 979 399
- of which B shares
held by Atlas Copco -393 879
1 217 239 826
Total shares outstanding, net of
shares held by Atlas Copco
Performance-based personnel option plan
The Annual General Meeting 2016 approved a performance-
based long-term incentive program. For Group Executive
Management, the plan requires management’s own
investment in Atlas Copco shares. The intention is to cover
Atlas Copco’s obligation under the plan through the
repurchase of the company’s own shares. For further
information, see www.atlascopcogroup.com/agm
Transactions in own shares
Atlas Copco has mandates to acquire and sell own shares as
per below:
Acquisition of not more than 7 250 000 series A shares,
whereof a maximum of 7 000 000 may be transferred to
personnel stock option holders under the performance-
based stock option plan 2016.
Acquisition of not more than 70 000 series A shares to
hedge the obligation of the company to pay remuneration
to Board members who have chosen to receive 50% of
the remuneration in synthetic shares.
The sale of not more than 30 000 series A shares to
cover costs related to previously issued synthetic shares
to Board members.
The sale of a maximum 5 500 000 series A and B shares
currently held by the company, for the purpose of
covering costs of fulfilling obligations related to the
option plans 2011, 2012 and 2013.
The shares may only be acquired or sold on NASDAQ
Stockholm at a price within the registered price interval
at any given time.
During the first nine months of 2016, 1 143 704 series A
shares, net, were sold. These transactions are in accordance
with mandates granted. The company’s holding of own
shares at the end of the period appears in the table to the left.
Risks and factors of uncertainty
Financial risks
Atlas Copco is subject to currency risks, interest rate risks,
tax risks, and other financial risks. In line with the overall
goals with respect to growth, return on capital, and
protecting creditors, Atlas Copco has adopted a policy to
control the financial risks to which Atlas Copco AB and the
Group is exposed. A financial risk management committee
meets regularly to manage and follow up financial risks, in
line with the policy.
For further information, see the 2015 annual report.
Related parties
There have been no significant changes in the relationships
or transactions with related parties for the Group or Parent
Company compared with the information given in the
annual report 2015.

Atlas Copco – Q3 2016 18 (18)
This is Atlas Copco Atlas Copco is a world-leading provider of sustainable
productivity solutions. The Group serves customers with
innovative compressors, vacuum solutions and air treatment
systems, construction and mining equipment, power tools
and assembly systems. Atlas Copco develops products and
service focused on productivity, energy efficiency, safety
and ergonomics. The company was founded in 1873, is
based in Stockholm, Sweden, and has a global reach
spanning more than 180 countries. In 2015, Atlas Copco had
revenues of BSEK 102 (BEUR 11) and more than 43 000
employees.
Business areas
Atlas Copco has four business areas. The business areas are
responsible for developing their respective operations by
implementing and following up on strategies and objectives
to achieve sustainable, profitable growth.
The Compressor Technique business area provides
industrial compressors, vacuum solutions, gas and process
compressors and expanders, air and gas treatment equipment
and air management systems. The business area has a global
service network and innovates for sustainable productivity
in the manufacturing, oil and gas, and process industries.
Principal product development and manufacturing units are
located in Belgium, the United States, China, South Korea,
Germany, Italy and the United Kingdom.
The Industrial Technique business area provides industrial
power tools and systems, industrial assembly solutions,
quality assurance products, software and service through a
global network. The business area innovates for sustainable
productivity for customers in the automotive and general
industries, maintenance and vehicle service. Principal
product development and manufacturing units are located in
Sweden, Germany, the United States, United Kingdom,
France and Japan.
The Mining and Rock Excavation Technique business
area provides equipment for drilling and rock excavation, a
complete range of related consumables and service through
a global network. The business area innovates for
sustainable productivity in surface and underground mining,
infrastructure, civil works, well drilling and geotechnical
applications. Principal product development and
manufacturing units are located in Sweden, the United
States, Canada, China and India.
The Construction Technique business area provides
construction and demolition tools, portable compressors,
pumps and generators, lighting towers, and compaction and
paving equipment. The business area offers specialty rental
and provides service through a global network. Construction
Technique innovates for sustainable productivity in
infrastructure, civil works, oil and gas, energy, drilling and
road construction projects. Principal product development
and manufacturing units are located in Belgium, Germany,
Sweden, the United States, China, India and Brazil.
Vision, mission and strategy
The Atlas Copco Group’s vision is to become and remain
First in Mind—First in Choice® of its customers and other
principal stakeholders. The mission is to achieve
sustainable, profitable growth. Sustainability plays an
important role in Atlas Copco’s vision and it is an integral
aspect of the Group’s mission. An integrated sustainability
strategy, backed by ambitious goals, helps the company
deliver greater value to all its stakeholders in a way that is
economically, environmentally and socially responsible.
For further information
• Analysts and investors
Daniel Althoff, Investor Relations Manager
Phone: +46 8 743 95 97 or +46 768 99 95 97
• Media
Ola Kinnander, Media Relations Manager
Phone: +46 8 743 8060 or +46 70 347 2455
Conference call
A conference call for investors, analysts and media will be
held on October 20, at 3.00 PM CEST.
The dial-in numbers are:
• Sweden: +46 8 566 426 90
• UK: +44 20 300 898 06
• US: +1 855 753 2235
The conference call will be broadcasted live via the Internet.
Please visit our website for link and presentation material:
http://www.atlascopcogroup.com/investor-relations
The webcast and a recorded audio presentation will be
available on our homepage following the call.
Report on Q4 2016
The report on Q4 2016 will be published on January 27,
2017.
Capital Markets Day 2016
Atlas Copco will host its annual Capital Markets Day on
November 15, 2016, in Antwerp, Belgium. Please see:
http://www.atlascopcogroup.com/CMD2016
Annual General Meeting 2017
The Annual General Meeting for Atlas Copco AB will be
held April 26, 2017 at 4 PM CEST in Aula Medica, Nobels
väg 6, Solna, Sweden.
This information is information that Atlas Copco AB is obliged to make public pursuant to the EU Market Abuse Regulation and the Securities Markets Act. The information was submitted for publication, through the agency of the contact person set out above, at 12.00 CEST on October 20, 2016


