
AUSTRALIAN HOTEL
MARKET UPDATE
Trading, Development and Investment
July 2015

2
1. Australian Hotel Markets Snapshot 1
2. Snapshot per Key Australian Market 2
3. Australian Hotel Development Pipeline 12
4. New Zealand Update 13
5. Australian Hotel Sales 14
6. Australian Hotel Yields 15
7. Australian Outlook Until Dec 2015 17
8. CBRE Hotels Services 18
TABLE OF CONTENTS

3
% Change
Adelaide -2.0%
Brisbane +0.1%
Cairns +10.9%
Canberra / ACT +2.0%
Darwin -9.1%
Gold Coast +8.5%
Hobart +3.3%
Melbourne +3.1%
Perth -3.1%
Sydney +4.0%
AUSTRALIAN HOTEL MARKETS SNAPSHOT
Australia +2.9%
Source: STR Global, CBRE Hotels
Page 1
OCC & ADR CHANGE VS LAST YEAR (Year Ending June 2015 vs 2014)
Note: in transition means one indicator (OCC or ADR) is positive and the other negative
REVPAR
Year Ending June 2015
vs 2014
% Change
-4.6%
-5.6%
+10.2%
+6.8%
-12.7%
+8.0%
+5.2%
+3.8%
-2.9%
+6.9%
+3.4%
REVPAR
YTD June 2015
vs 2014
Adelaide
Brisbane
Cairns
Canberra/
ACT
Melbourne
Perth
Sydney
Gold Coast
Darwin
Hobart
-11%
-9%
-7%
-5%
-3%
-1%
1%
3%
5%
7%
9%
11%
-11% -9% -7% -5% -3% -1% 1% 3% 5% 7% 9% 11%
%∆
A
DR vs Last Year
%∆ OCC vs Last Year
GROWTH
DECLINE
IN TRANSITION
IN TRANSITION
While the fundamentals in many of Australia’s traditional property asset classes are benign, the dynamic characteristics of the hospitality market continue to place the hotel sector
under the investment spotlight.
The major Australian markets grew by 4.4% in the last year measured by Rooms Revenue. This trend reinforces the shift in Australia's economic activity away from a reliance on
mining to a services based economy. All markets grew with the exception of Perth and Darwin on this metric; however, their performance was well in advance of the correction
being experienced in other industries. The resort markets of Cairns and Gold Coast continued to grow on fundamentals.
In terms of hotel performance, supply surges in Adelaide, Brisbane and Darwin have affected performance. Hotels in the investment favourite markets of Sydney and Melbourne
continue to be solid performers. Canberra, Brisbane and Darwin are in transition and Adelaide has spent its growth pennies while Hobart continues to make strong deposits.
RevPAR growth
RevPAR decline

4
PERFORMANCE (Year Ending Jun 2015)
Source: STR Global, CBRE Hotels
1Based on visitor nights
Source: TRA, CBRE Hotels VFR: Visiting friends and relatives
Selected Recent Openings (in Last 12 Months)
ibis Adelaide 3.5 311 keys Jul-2014
Quest on King William 4 105 keys Aug-2014
Art Series Watson Hotel 4 84 keys Nov-2014
Mayfair Hotel 4 170 keys Jan-2015
SUPPLY (YE Jun 2015)
Existing Hotels, Motels and Serviced Apartments: 109 (8,226 rooms)
Dominant Source Markets1
1. Victoria
2. New South Wales
3. South Australia
ADELAIDE
ADR
AU$149.27
OCC
77.6%
VS. 2014
-2.0%
41%
37%
15%
7%
Purpose of Visit1
Holiday
Business
VFR
Other
Length of Stay
2.9 days
Visitors (‘000): 1,098.10
Visitor Nights (‘000): 3,139.10
Page 2
Room demand generators for the Adelaide market appear to provide a stable foundation.
Adelaide features several major events annually which provide good yielding opportunities
and that showcase the city to a wider international market. In CBRE Hotels’ view, trading
outcomes over the next 12 months will largely reflect limited growth at or around CPI in
RevPAR terms. However, new room supply entering the Adelaide CBD market in the next two
years has the potential to dilute existing demand amongst greater supply and hence lead to
decreased occupancy and/or discounting of room rates. Alternatively, the additional supply
will provide uplift to room rates (each being a new venue) and attract demand which exists in
the market but is unsatisfied due to occupancy constraints. CBRE Hotels anticipates that not
all the new room supply mooted for this market will come to fruition and whilst those
developments which are completed will ‘stretch’ the market, the overall dip in general market
outcomes will be short-lived.
REVPAR
AU$115.79
77%
23%
Visitor Nights
Domestic International
87%
13%
Visitor Arrivals
DEMAND for Hotels, Motels and Serviced Apartments (YE Dec 2014)
Source: STR Global, CBRE Hotels
Selected Projects Likely to Proceed
Holiday Inn Express Adelaide 4 245 keys Apr-2017
Aloft Adelaide (New Mayfield) 4.5 200 keys Jan-2018
Lester Hotel 4.5 244 keys 2018
Selected Mooted Projects
Sheraton Adelaide 4.5 160 keys May-2019
Sofitel Adelaide 5 252 keys Jun-2019
Source: STR Global, CBRE Hotels
Q3 2014
vs '13
Q4 2014
vs '13
Q1 2015
vs '14
Q2 2015
vs '14
-7%
-5%
-3%
-1%
1%
3%
5%
7%
-7% -5% -3% -1% 1% 3% 5% 7%
%∆
A
DR vs Last Year
%∆ OCC vs Last Year
GROWTH
DECLINE
IN TRANSITION
IN TRANSITION
Note: in transition
means one
indicator (OCC or
ADR) is positive
and the other
negative
OCC & ADR CHANGE VS LAST YEAR Note: OCC tracks horizontally and ADR vertically
RevPAR growth
RevPAR decline

5
PERFORMANCE (Year Ending Jun 2015)
Source: STR Global, CBRE Hotels
2Based on visitor nights
Source: TRA, CBRE Hotels VFR: Visiting friends and relatives
Selected Recent Openings (in Last 12 Months)
NEXT Hotel1&2
4 304 keys Sep-2014
Capri by Fraser 4.5 239 keys Mar-2015
SUPPLY (YE Jun 2015)
Existing Hotels, Motels and Serviced Apartments: 205 (15,636 rooms)
Dominant Source Markets2
1. Queensland
2. New South Wales
3. Victoria
BRISBANE
ADR
AU$185.27
OCC
76.1%
VS. 2014
+0.1% Length of Stay
2.5 days
Page 3
The Brisbane hotel market has seen reduced corporate demand from the mining sector and
Government; however, looking forward CBRE Hotels expects continued growth in demand off
the back of strong growth forecasts for domestic and international visitors. The Brisbane
Council's moratorium on infrastructure charges for hotel development approved prior to June
2015 has seen an influx of supply with a number of projects recently completed, under
construction and approved. Hotel performance for the financial year ending 2015 was
boosted by the G20 in November 2014. STR Global results for the 6 months to June 2015,
however, indicate rooms available increased by 7.8% over the same period in 2014, whilst
rooms sold increased by 4.3%, resulting in a decline of 3.3% in occupancy. Over the same
period, room rate declined by 2.4% with RevPAR reflecting a fall of 5.6%. It is anticipated that
ongoing supply will exceed demand for the medium term resulting in lower occupancy levels
and further decline in RevPAR.
REVPAR
AU$141.07
Source: STR Global, CBRE Hotels 1Rebrand / Refurbishment
2Extension
Selected Properties Under Construction
Rydges RNA Hotel 4 208 keys Jan-2016
Holiday Inn Express 4 226 keys Jun-2016
ibis Brisbane 3.5 368 keys Sep-2016
Selected Projects Likely to Proceed
Emporium Southpoint 5 142 keys Dec-2016
111 Mary Street 5 316 keys Dec-2017
W Brisbane 5 305 keys Apr-2018
42 James Street 5 165 keys Sep-2018
DEMAND for Hotels, Motels and Serviced Apartments (YE Dec 2014)
Visitors (‘000): 2,095.97
Visitor Nights (‘000): 5,253.97
43%
35%
11%
11%
Purpose of Visit2
Business
Holiday
VFR
Other
72%
28%
Visitor Nights
Domestic International
81%
19%
Visitor Arrivals
Source: STR Global, CBRE Hotels
Note: in transition
means one
indicator (OCC or
ADR) is positive
and the other
negative
OCC & ADR CHANGE VS LAST YEAR Note: OCC tracks horizontally and ADR vertically
Q3 2014
vs '13
Q4 2014
vs '13
Q1 2015
vs '14
Q2 2015
vs '14
-13%
-11%
-9%
-7%
-5%
-3%
-1%
1%
3%
5%
7%
9%
11%
13%
-13%-11%-9% -7% -5% -3% -1% 1% 3% 5% 7% 9% 11%13%
%∆
A
DR vs Last Year
%∆ OCC vs Last Year
GROWTH
DECLINE
IN TRANSITION
IN TRANSITION
RevPAR growth
RevPAR decline

6
PERFORMANCE (Year Ending Jun 2015)
Source: STR Global, CBRE Hotels
1Based on visitor nights
Source: TRA, CBRE Hotels VFR: Visiting friends and relatives
Selected Mooted Projects
Aquis Great Barrier Reef Resort
(8 luxury resorts)
5 7,500 keys 2020
SUPPLY (YE Jun 2015)
Existing Hotels, Motels and Serviced Apartments: 93 (7,465 rooms)
Dominant Source Markets1
1. Queensland
2. New South Wales
3. China
CAIRNS
ADR
AU$128.35
OCC
77.0%
VS. 2014
+10.9% Length of Stay
3.5 days
Page 4
Cairns is currently one of the best performers in the market, exceeding market
expectations and recording a strong recovery from a low base. Cairns had the highest
RevPAR growth in Australia for the year ending June 2015 and improved occupancy
levels; however, ADR and RevPAR remain well below other destinations. Cairns is
currently witnessing a strong rebound in international and domestic tourist arrival
numbers as a result of increased air capacity into the region, especially from Asia. There
are a lack of developments in the pipeline but recent transactions including the Pullman
Cairns International and Pacific Hotel Cairns reflect renewed interest in existing
properties and an increase in value levels.
REVPAR
AU$98.77
Source: STR Global, CBRE Hotels
OCC & ADR CHANGE VS LAST YEAR Note: OCC tracks horizontally and ADR vertically
DEMAND for Hotels, Motels and Serviced Apartments (YE Dec 2014)
Visitors (‘000): 943.68
Visitor Nights (‘000): 3,304.71
55% 45%
Visitor Nights
Domestic International
53% 47%
Visitor Arrivals
77%
12%
8% 3%
Purpose of Visit1
Holiday
Business
VFR
Other
Source: STR Global, CBRE Hotels
Note: in transition
means one
indicator (OCC or
ADR) is positive
and the other
negative
Q3 2014
vs '13
Q4 2014
vs '13
Q1 2015
vs '14
Q2 2015
vs '14
-11%
-9%
-7%
-5%
-3%
-1%
1%
3%
5%
7%
9%
11%
-11% -9% -7% -5% -3% -1% 1% 3% 5% 7% 9% 11%
%∆
A
DR vs Last Year
%∆ OCC vs Last Year
GROWTH
DECLINE
IN TRANSITION
IN TRANSITION
RevPAR growth
RevPAR decline
7
PERFORMANCE (Year Ending Jun 2015)
Source: STR Global, CBRE Hotels
2Based on visitor nights
Source: TRA, CBRE Hotels VFR: Visiting friends and relatives
Selected Recent Openings (in Last 12 Months)
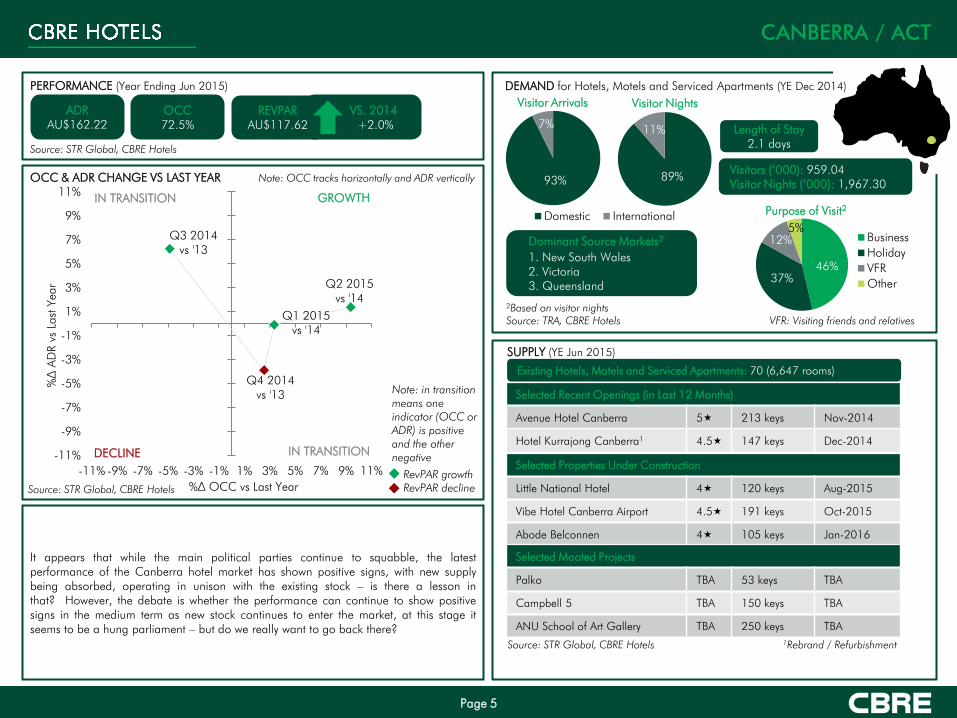
Avenue Hotel Canberra 5 213 keys Nov-2014
Hotel Kurrajong Canberra1
4.5 147 keys Dec-2014
SUPPLY (YE Jun 2015)
Existing Hotels, Motels and Serviced Apartments: 70 (6,647 rooms)
Dominant Source Markets2
1. New South Wales
2. Victoria
3. Queensland
CANBERRA / ACT
ADR
AU$162.22
OCC
72.5%
VS. 2014
+2.0% Length of Stay
2.1 days
Page 5
It appears that while the main political parties continue to squabble, the latest
performance of the Canberra hotel market has shown positive signs, with new supply
being absorbed, operating in unison with the existing stock – is there a lesson in
that? However, the debate is whether the performance can continue to show positive
signs in the medium term as new stock continues to enter the market, at this stage it
seems to be a hung parliament – but do we really want to go back there?
REVPAR
AU$117.62
Source: STR Global, CBRE Hotels 1Rebrand / Refurbishment
Selected Properties Under Construction
Little National Hotel 4 120 keys Aug-2015
Vibe Hotel Canberra Airport 4.5 191 keys Oct-2015
Abode Belconnen 4 105 keys Jan-2016
Selected Mooted Projects
Palko TBA 53 keys TBA
Campbell 5 TBA 150 keys TBA
ANU School of Art Gallery TBA 250 keys TBA
OCC & ADR CHANGE VS LAST YEAR Note: OCC tracks horizontally and ADR vertically
DEMAND for Hotels, Motels and Serviced Apartments (YE Dec 2014)
Visitors (‘000): 959.04
Visitor Nights (‘000): 1,967.30
46%
37%
12%
5%
Purpose of Visit2
Business
Holiday
VFR
Other
93%
7%
Visitor Arrivals
89%
11%
Visitor Nights
Domestic International
Source: STR Global, CBRE Hotels
Note: in transition
means one
indicator (OCC or
ADR) is positive
and the other
negative
Q3 2014
vs '13
Q4 2014
vs '13
Q1 2015
vs '14
Q2 2015
vs '14
-11%
-9%
-7%
-5%
-3%
-1%
1%
3%
5%
7%
9%
11%
-11% -9% -7% -5% -3% -1% 1% 3% 5% 7% 9% 11%
%∆
A
DR vs Last Year
%∆ OCC vs Last Year
GROWTH
DECLINE
IN TRANSITION
IN TRANSITION
RevPAR growth
RevPAR decline

8
PERFORMANCE (Year Ending Jun 2015)
Source: STR Global, CBRE Hotels
2Based on visitor nights
Source: TRA, CBRE Hotels VFR: Visiting friends and relatives
Selected Recent Openings (in Last 12 Months)
Argus Apartments Darwin 4.5 101 keys Jun-2015
Ramada Suites Zen Quarter1 4 218 keys Jul-2015
SUPPLY (YE Jun 2015)
Existing Hotels, Motels and Serviced Apartments: 41 (4,696 rooms)
Dominant Source Markets2
1. New South Wales
2. Northern Territory
3. Victoria
DARWIN
ADR
AU$184.60
OCC
69.4%
VS. 2014
-9.1% Length of Stay
4.4 days
Page 6
While strong demand levels have produced high occupancies and escalating room rates
due to large projects such as the INPEX Ichthys LNG, the recent contraction in mining
activity has been noticeable. With a number of hotel developments mooted for the
Darwin Tourism Region, coupled with the market coming off a period of unprecedented
growth, CBRE Hotels believe it is more likely hotels will focus on holding occupancies
with pressure on any future rate growth in the short term.
REVPAR
AU$128.15
Source: STR Global, CBRE Hotels 1Rebrand / Refurbishment
2Extension
Selected Properties Under Construction
Rydges Palmerston 4 200 keys Sep-2015
Top End 105 Mitchell Street
4.5 100 keys 2016
Club Tropical Resort Darwin2 4 104 TBA
Selected Projects Likely to Proceed
85 Mitchell Street TBA 200 keys Jan-2017
Casuarina Shell Site TBA 175 keys 2018
Gateway Shopping Centre TBA 195 keys 2019
OCC & ADR CHANGE VS LAST YEAR Note: OCC tracks horizontally and ADR vertically
DEMAND for Hotels, Motels and Serviced Apartments (YE Dec 2014)
Visitors (‘000): 412.89
Visitor Nights (‘000): 1,831.35
40%
40%
6%
14%
Purpose of Visit2
Holiday
Business
VFR
Other
87%
13%
Visitor Arrivals
80%
20%
Visitor Nights
Domestic International
Source: STR Global, CBRE Hotels
Note: in transition
means one
indicator (OCC or
ADR) is positive
and the other
negative
Q3 2014
vs '13
Q4 2014
vs '13
Q1 2015
vs '14
Q2 2015
vs '14
-11%
-9%
-7%
-5%
-3%
-1%
1%
3%
5%
7%
9%
11%
-11% -9% -7% -5% -3% -1% 1% 3% 5% 7% 9% 11%
%∆
A
DR vs Last Year
%∆ OCC vs Last Year
GROWTH
DECLINE
IN TRANSITION
IN TRANSITION
RevPAR growth
RevPAR decline

9
PERFORMANCE (Year Ending Jun 2015)
Source: STR Global, CBRE Hotels
2Based on visitor nights
Source: TRA, CBRE Hotels VFR: Visiting friends and relatives
SUPPLY (YE Jun 2015)
Existing Hotels, Motels and Serviced Apartments: 171 (17,096 rooms)
Dominant Source Markets2
1. Queensland
2. New South Wales
3. Victoria
GOLD COAST
ADR
AU$170.39
OCC
71.9%
VS. 2014
+8.5% Length of Stay
3.6 days
Page 7
After an extended period of minimal growth in supply and demand, due to softer
economic and competitive conditions, the Gold Coast market is seeing a return to form
with the second highest RevPAR growth in the country behind Cairns driven by a recovery
in both domestic and international visitor numbers. This recovery has buoyed investor
confidence, with a number of recent transactions reflecting strong growth in value levels.
The upcoming 2018 Commonwealth Games will see an expansion of infrastructure
including major upgrades to the airport and will spotlight the destination. The Gold
Coast hotel market has enjoyed relatively stable supply over the last five years and going
forward, the supply outlook looks relatively benign. Increased demand from both
domestic and international visitors is expected to result in continual growth in both
occupancy and ADR over the short and medium term.
REVPAR
AU$122.44
OCC & ADR CHANGE VS LAST YEAR Note: OCC tracks horizontally and ADR vertically
DEMAND for Hotels, Motels and Serviced Apartments (YE Dec 2014)
Visitors (‘000): 1,973.00
Visitor Nights (‘000): 7,142.75
Selected Properties Under Construction
Jupiter's Casino Hotel2 5 75 Nov-2017
Jewel Luxury Resort 5 153 Dec-2018
Selected Mooted Projects
Orchid Avenue Short Term
Accommodation Building
TBA 178 2018
Source: STR Global, CBRE Hotels 2Extension
82%
10%
6% 2%
Purpose of Visit2
Holiday
Business
VFR
Other
74%
26%
Visitor Nights
Domestic International
75%
25%
Visitor Arrivals
Source: STR Global, CBRE Hotels
Note: in transition
means one
indicator (OCC or
ADR) is positive
and the other
negative
Q3 2014
vs '13
Q4 2014
vs '13
Q1 2015
vs '14
Q2 2015
vs '14
-7%
-5%
-3%
-1%
1%
3%
5%
7%
-7% -5% -3% -1% 1% 3% 5% 7%
%∆
A
DR vs Last Year
%∆ OCC vs Last Year
GROWTH
DECLINE
IN TRANSITION
IN TRANSITION
RevPAR growth
RevPAR decline

10
PERFORMANCE (Year Ending Jun 2015)
Source: STR Global, CBRE Hotels
1Based on visitor nights
Source: TRA, CBRE Hotels VFR: Visiting friends and relatives
Selected Properties Under Construction
Macquarie Wharf Shed Hotel 4.5 114 keys Dec-2016
Crowne Plaza Hobart 4.5 187 keys Oct-2017
SUPPLY (YE Jun 2015)
Existing Hotels, Motels and Serviced Apartments: 53 (2,807 rooms)
Dominant Source Markets1
1. Victoria
2. New South Wales
3. Tasmania
HOBART
ADR
AU$160.60
OCC
79.3%
VS. 2014
+3.3% Length of Stay
2.8 days
Page 8
’Steady as she goes’ is probably an apt term for the Hobart market outlook in the short term.
Demand generators key to this market should continue to provide seasonal yet consistent
opportunities in the market. There are several potential hotel developments that may be
completed in the medium term which should be absorbed into the market without any great
effect on overall market outcomes. The Government’s commitment to increase funding for
tourism marketing is anticipated to underpin visitation growth from both mainland Australia
and inbound internationals. Room supply over the long term must be tinged with economic
reality. New rooms mooted in the medium term represent an increase of around 50% on
current stock levels; in CBRE Hotels’ view the market would struggle to absorb this supply
volume despite visitation growth expectations. Inevitably, market forces should prevail
meaning that not all mooted developments will proceed.
REVPAR
AU$127.29
Source: STR Global, CBRE Hotels
Selected Mooted Projects
Macquarie Street Hotel
4 296 keys Aug-2016
HOMO at MONA 4 90 keys May-2017
Former Roberts Building 4 80 keys Aug-2017
OCC & ADR CHANGE VS LAST YEAR Note: OCC tracks horizontally and ADR vertically
DEMAND for Hotels, Motels and Serviced Apartments (YE Dec 2014)
Visitors (‘000): 630.12
Visitor Nights (‘000): 1,751.58
70%
17%
12% 1%
Purpose of Visit1
Holiday
Business
VFR
Other
83%
17%
Visitor Nights
Domestic International
87%
13%
Visitor Arrivals
Source: STR Global, CBRE Hotels
Note: in transition
means one
indicator (OCC or
ADR) is positive
and the other
negative
Q3 2014
vs '13
Q4 2014
vs '13
Q1 2015
vs '14
Q2 2015
vs '14
-11%
-9%
-7%
-5%
-3%
-1%
1%
3%
5%
7%
9%
11%
-11% -9% -7% -5% -3% -1% 1% 3% 5% 7% 9% 11%
%∆
A
DR vs Last Year
%∆ OCC vs Last Year
GROWTH
DECLINE
IN TRANSITION
IN TRANSITION
RevPAR growth
RevPAR decline

11
PERFORMANCE (Year Ending Jun 2015)
Source: STR Global, CBRE Hotels
1Based on visitor nights
Source: TRA, CBRE Hotels VFR: Visiting friends and relatives
Selected Recent Openings (in Last 12 Months)
Wyndham Hotel 4 86 keys Dec-2014
BreakFree on Collins1
4 193 keys Jun-2015
SUPPLY (YE Jun 2015)
Existing Hotels, Motels and Serviced Apartments: 366 (32,032 rooms)
Dominant Source Markets1
1. New South Wales
2. Victoria
3. Queensland
MELBOURNE
ADR
AU$186.67
OCC
81.7%
VS. 2014
+3.1% Length of Stay
2.9 days
Page 9
The short term outlook for Melbourne is for continued room demand growth. However,
given the high levels of occupancy currently experienced, this growth is expected to be
somewhat constrained over the next two years due to a lack of additional rooms. As a
consequence, the new supply which will enter the market between 2017 and 2019 is
expected to have only a small negative impact on occupancy. ADR growth is anticipated
to remain subdued largely as a consequence of a cost conscious corporate sector;
average annual growth is expected to increase at or around CPI levels.
REVPAR
AU$152.54
Source: STR Global, CBRE Hotels 1Rebrand / Refurbishment
Selected Properties Under Construction
QT Hotel Melbourne 4 188 keys May-2016
Peppers Docklands 4.5 87 keys Dec-2016
Selected Projects Likely to Proceed
Parkroyal Docklands 5 281 keys Jul-2017
Four Points Docklands 4 320 keys Jan-2017
Aloft Melbourne 4.5 312 keys Aug-2017
80 Collins Street 5 250 keys Sep-2018
Crown Resorts Hotel 4.5 408 keys Jun-2019
OCC & ADR CHANGE VS LAST YEAR Note: OCC tracks horizontally and ADR vertically
DEMAND for Hotels, Motels and Serviced Apartments (YE Dec 2014)
Visitors (‘000): 4,997.70
Visitor Nights (‘000): 14,557.96
47%
36%
10%
7%
Purpose of Visit1
Holiday
Business
VFR
Other
80%
20%
Visitor Arrivals
67%
33%
Visitor Nights
Domestic International
Source: STR Global, CBRE Hotels
Note: in transition
means one
indicator (OCC or
ADR) is positive
and the other
negative
Q3 2014
vs '13
Q4 2014
vs '13
Q1 2015
vs '14
Q2 2015
vs '14
-9%
-7%
-5%
-3%
-1%
1%
3%
5%
7%
9%
-9% -7% -5% -3% -1% 1% 3% 5% 7% 9%
%∆
A
DR vs Last Year
%∆ OCC vs Last Year
GROWTH
DECLINE
IN TRANSITION
IN TRANSITION
RevPAR growth
RevPAR decline

12
PERFORMANCE (Year Ending Jun 2015)
Source: STR Global, CBRE Hotels
1Based on visitor nights
Source: TRA, CBRE Hotels VFR: Visiting friends and relatives
Selected Recent Openings (in Last 12 Months)
Alex Hotel 4 74 keys May-2015
SUPPLY (YE Jun 2015)
Existing Hotels, Motels and Serviced Apartments: 101 (10,367 rooms)
Dominant Source Markets1
1. Western Australia
2. New South Wales
3. Victoria
PERTH
ADR
AU$198.99
OCC
82.5%
VS. 2014
-3.1% Length of Stay
3.5 days
Page 10
Despite the slowdown in respect of the mining and resource sectors of the economy,
demand has remained strong with airlines, hotels, wholesalers etc. now actively targeting
the leisure, groups and events segments with a reduction in ADR being used as a
demand generator. CBRE Hotels has identified there is the potential to add some
5,000+ new rooms over the next three years; however, CBRE Hotels are of the view that
economic reality will ensure a more rational development schedule with the likely supply
equating to some 2,500+ new rooms. Whilst there are a number of new hotels coming
on line, these venues will spend significant expense in respect of marketing, which CBRE
Hotels feel can limit forecast declines in occupancy and ADR. The opening of the new
Perth Stadium in early 2018, coupled with a planned substantial WA Tourism campaign
should also assist to induce demand levels.
REVPAR
AU$164.25
Source: STR Global, CBRE Hotels
Selected Properties Under Construction
Como The Treasury 5 48 keys Sep-2015
Crown Towers Burswood 5 522 keys Dec-2016
Sage Hotel 4 101 keys Mar-2016
Westin Hotel 5 362 keys Jan-2017
DoubleTree Perth 4 205 keys Jan-2017
Selected Projects Likely to Proceed
DoubleTree Perth Waterfront 4 247 keys Jun-2016
AVANI Hotel Perth City Link 4.5 250 keys Oct-2017
Ritz Carlton Perth 5 204 keys Jan-2018
OCC & ADR CHANGE VS LAST YEAR Note: OCC tracks horizontally and ADR vertically
DEMAND for Hotels, Motels and Serviced Apartments (YE Dec 2014)
Visitors (‘000): 1,180.30
Visitor Nights (‘000): 4,156.42
43%
37%
12%
8%
Purpose of Visit1
Business
Holiday
VFR
Other
78%
22%
Visitor Arrivals
62% 38%
Visitor Nights
Domestic International
Source: STR Global, CBRE Hotels
Note: in transition
means one
indicator (OCC or
ADR) is positive
and the other
negative
Q3 2014
vs '13
Q4 2014
vs '13
Q1 2015
vs '14
Q2 2015
vs '14
-6%
-4%
-2%
0%
2%
4%
6%
-6% -4% -2% 0% 2% 4% 6%
%∆
A
DR vs Last Year
%∆ OCC vs Last Year
GROWTH
DECLINE
IN TRANSITION
IN TRANSITION
RevPAR growth
RevPAR decline

13
PERFORMANCE (Year Ending Jun 2015)
Source: STR Global, CBRE Hotels
2Based on visitor nights
Source: TRA, CBRE Hotels VFR: Visiting friends and relatives
Selected Recent Openings (in Last 12 Months)
The Langham1
5 96 keys Dec-2014
SUPPLY (YE Jun 2015)
Existing Hotels, Motels and Serviced Apartments: 353 (38,048 rooms)
Dominant Source Markets2
1. New South Wales
2. Victoria
3. Queensland
SYDNEY
ADR
AU$204.16
OCC
84.5%
VS. 2014
+4.0% Length of Stay
3.0 days
Page 11
The Sydney market is continuing to show signs of strong growth with both occupancies
and ADR now at record levels. With minimal new supply, occupancies are likely to
remain high with room rate growth at inflationary levels at least. CBRE Hotels
understand that a number of the existing hotels are planning refurbishment programs
over the next few years, which will have a direct impact on the market during constrained
periods. The refurbished products will re-enter the market with expectations of achieving
high ADR levels, which should also flow through the market.
REVPAR
AU$172.56
Selected Properties Under Construction
Greenland Primus Hotel 5 173 keys 2016
Four Points by Sheraton2 4 222 keys 2016
The Tank Stream St Giles 4 282 keys 2016
Sofitel Sydney – ICC 5 616 keys 2017
Selected Projects Likely to Proceed
Crown Sydney – Barangaroo 5 350 keys 2019
OCC & ADR CHANGE VS LAST YEAR Note: OCC tracks horizontally and ADR vertically
DEMAND for Hotels, Motels and Serviced Apartments (YE Dec 2014)
Visitors (‘000): 5,442.63
Visitor Nights (‘000): 16,470.14
Source: STR Global, CBRE Hotels 1Rebrand / Refurbishment
2Extension
Selected Properties Exiting Market
The Menzies Hotel 4 -446 keys 2016
Mercure Potts Point 4 -227 keys 2016
47%
36%
9%
8%
Purpose of Visit2
Holiday
Business
VFR
Other
55%
45%
Visitor Nights
Domestic International
71%
29%
Visitor Arrivals
Source: STR Global, CBRE Hotels
Note: in transition
means one
indicator (OCC or
ADR) is positive
and the other
negative
Q3 2014
vs '13
Q4 2014
vs '13
Q1 2015
vs '14
Q2 2015
vs '14
-8%
-6%
-4%
-2%
0%
2%
4%
6%
8%
-8% -6% -4% -2% 0% 2% 4% 6% 8%
%∆
A
DR vs Last Year
%∆ OCC vs Last Year
GROWTH
DECLINE
IN TRANSITION
IN TRANSITION
RevPAR growth
RevPAR decline

14
AUSTRALIAN HOTEL DEVELOPMENT PIPELINE
Source: STR Global, CBRE Hotels
It is interesting to note that there are approximately 2,500 rooms proposed for each of the City Markets, however, the overall net increase of stock varies significantly.
The limited availability of sites within Sydney, coupled with the removal of existing stock is expected to have minimal effects on demand, whereas the other major cities
could potentially see a surge in supply that will test the strength of demand in these cities. Whilst the local Governments in each of the cities have been actively
encouraging the development of new hotels, the owners of these products will be relying on the tourism markets of their respective states and Tourism Australia to help
facilitate demand to ensure the viability of the venues.
Page 12
Key Australian Markets
City Markets Greater City Regions Markets
(including City and Surrounds)
1Net percentage increase on existing supply in respective markets
Note: 'Likely to Proceed' are based on CBRE's estimates of developments more than 50% likely of occurring (not including rebrands) and opening
before Jan 2019. City was selected for Brisbane, Melbourne, Perth and Sydney due to their size.
0
500
1,000
1,500
2,000
2,500
3,000
3,500
Adelaide Cairns Canberra /
ACT
Darwin Gold
Coast
Hobart
Num
ber of Room
s
Under Construction Likely to Proceed To Be Removed
-1,000
-500
0
500
1,000
1,500
2,000
2,500
3,000
3,500
Brisbane
City
Melbourne
City
Perth
City
Sydney
City
Num
ber of Room
s
Under Construction Likely to Proceed To Be Removed
+23.5%1
+14.8%1
+33.1%1
+6.6%1
+8.4%1
+0.0%1
+6.3%1
+17.3%1
+1.3%1
+10.7%1

15
NEW ZEALAND UPDATE
Double-digit RevPAR growth in all key New Zealand
markets (except for Christchurch)
Page 13
The positive news stories emanating from the wider New Zealand economy
and the property market in particular also ring true for the hotel market with
all key performance indicators showing strong growth through 2014 and the
first half of 2015.
Nationwide occupancy levels continued their strong upward trend finishing at
77.5% year to date June 2015 and at 76.1% year ending June 2015. This is
at par with the previous peak of 76% achieved in the 12 months to October
2004.
ADR levels have shown overall growth of 6.6% to the year ending June 2015
compared to 2014, reaching NZ$148.67. This is a new record that is nearly
equivalent to the peak in 2012 associated to the Rugby World Cup.
The combination of strong occupancy and ADR growth have resulted in a
12.4% RevPAR increase for the year ending June 2015. At NZ$113.20,
RevPAR has eclipsed the level achieved during the Rugby World Cup and
further growth is expected through the remaining months of 2015.
% Change
Auckland +11.6%
Christchurch +9.1%
Queenstown +13.5%
Wellington +12.5%
New Zealand +12.4%
REVPAR
Year Ending June 2015 vs 2014
% Change
+12.4%
N/A
+16.8%
+15.2%
+14.4%
REVPAR
YTD June 2015 vs 2014
Source: STR Global, CBRE Hotels
OCC & ADR CHANGE VS LAST YEAR (Year Ending June 2015 vs 2014)
Note: in transition means one indicator (OCC or ADR) is positive and the other negative
Auckland
Wellington
Christchurch
Queenstown
-11%
-9%
-7%
-5%
-3%
-1%
1%
3%
5%
7%
9%
11%
-11% -9% -7% -5% -3% -1% 1% 3% 5% 7% 9% 11%
%∆
A
DR vs Last Year
%∆ OCC vs Last Year
GROWTH
DECLINE
IN TRANSITION
IN TRANSITION
RevPAR growth
RevPAR decline

16
AUSTRALIAN HOTEL SALES
Sales volumes for hotel investment in Australia in 2014 reached AU$2 billion, the highest level ever recorded.
Year to date performance has been particularly strong, already surpassing over AU$1 billion in sales, however, might not reach 2014 levels predominately due
to the limited availability of stock.
The surge in investment activity has been particularly focused on quality hotels, with those based in Sydney being highly sought. With major transactions
including the Shangri-La in 2012, the Four Seasons in 2013, the Sheraton on the Park in 2014 and The Westin Sydney in 2015.
Page 14
0
10
20
30
40
50
60
0
500
1,000
1,500
2,000
2,500
200
3
200
4
200
5
200
6
200
7
200
8
200
9
201
0
201
1
201
2
201
3
201
4
YTD
Jun 20
15
Num
ber of H
ote
l Sale
s
Tota
l H
ote
l Sale
s (A
U$
m
illion)
Total Hotel Sales vs Number of Hotels Sold
Total Hotel Sales Total Number of Hotels Sold
Source: CBRE Hotels

17
AUSTRALIAN HOTEL YIELDS
There has been a notable tightening in the yield profile in the year to date performance, with a significant number of large transactions being completed with initial
yields below 6.50%. Traditionally, yields below 6.00% were for underperforming properties with significant upside or for trophy assets such as the Park Hyatt Sydney,
which is reflected in the previous low point in 2007.
The surge of capital emanating from the Asian countries seeking a safe haven in Australia is unprecedented. Asian buyers who understand and respect hotel assets as
an alternate asset class, typically having a long term investment decision, are also prepared to accept lower returns in the short term.
CBRE Hotels note that the yield compression is not only evident in major core destinations such as Sydney but has also been prevalent in places such as the Gold Coast
and Cairns.
Page 15
5.00%
6.00%
7.00%
8.00%
9.00%
10.00%
200
3
200
4
200
5
200
6
200
7
200
8
200
9
201
0
201
1
201
2
201
3
201
4
YTD
Jun 20
15
Initial Yield to Stabilised Yield Gap
Initial Yield Stabilised Yield
Source: CBRE Hotels

18
Initial Yields YTD 2015 (Notable Sales)
Surfers Paradise Marriott
Resort & Spa
Yield: ~6.0%
Hilton Sydney
Yield: 6.3%
Westend Hotel Sydney
Yield: 6.8%
Bounce Hotel Sydney
Yield: 7.8%
Quest Dubbo
Yield: 8.7%
Rendezvous Hotel Brisbane
on George
Yield: 6.3%
Hilton Surfers Paradise
Hotel
Yield: ~6.0%
The Westin Sydney
Yield: 4.2%
Crowne Plaza Surfers
Paradise
Yield: 5.5%
Pullman Cairns
International
Yield: 7.0%
AUSTRALIAN HOTEL YIELDS
The yield profile in a number of year to date transaction highlights investor appetite for assets located in both corporate and leisure destinations. The sale of the prime
Sydney assets are a reflection of investors wanting to acquire hotels located in a major global destination which has a strong market outlook. The yield profile for the
transactions in leisure based destinations, such as the Gold Coast and Cairns, indicate purchasers are expecting continued room rate growth in the short to medium term.
Page 16
Source: CBRE Hotels
4% 5% 6% 7% 8% 9%

19
The Australian hotel market
continues to perform
strongly with occupancies
maintaining an upward
trend, aided by the weaker
Australian dollar. Arrivals
from China are increasing
but the traditional inbound
markets remain New
Zealand, the United
Kingdom and the United
States, while domestic
demand remains dominant.
The operating environment
in major city markets in
recent years has been
characterised by ‘full house’
occupancies exceeding
80%, strong ADR growth
and limited new supply.
AUSTRALIAN OUTLOOK UNTIL DEC 2015
Page 17
Underpinning this position of strength has been Australia’s economic growth that has averaged
almost 3% per annum for the last seven years. As the Australian economy transitions from
mining investment to export production and the Australian dollar falls to levels that support the
balance of trade position and tourist visitations, market fundamentals are positioned to support
solid longer term performance well into the future.
Investors continued to display a robust appetite for hotel properties in
Australia with strong sales setting record yields and price points.
The shortage of saleable good quality
and well located assets continues to boost
pricing. Buyers from Asia were very active
over the course of 2014 and YTD 2015,
accounting for virtually all deals for assets
priced over AU$50 million. Domestic
buyers – primarily high net worth
individuals – are generally focusing on
assets below AU$40 million as they feel
competition at the upper end of the
market is too strong at present. Recent
major transactions include the AU$445
million acquisition of the five-star Westin
Hotel in Sydney. The deal set a new
record for a price per room of a hotel
with over 300 rooms in Australia.
The outlook for the remainder of 2015 is
positive with strong trading conditions in
the short to medium term and a large
volume of capital chasing deals,
particularly in the key Sydney and
Melbourne markets.

20
CBRE HOTELS SERVICES
Page 18
For more information,
please contact:
CBRE HOTELS
AUSTRALIA
KEN SMITH
Regional Director, Pacific
O: +61 2 9333 3422
M: +61 413 025 442
Level 21, 363 George Street
Sydney NSW 2000
www.cbrehotels.com
Please click on any of the above icons for more information on CBRE Hotels services.
THROUGHOUT THIS PUBLICATION SOURCE: STR GLOBAL, LTD. REPUBLICATION OR OTHER RE-USE OF
THIS DATA WITHOUT THE EXPRESS WRITTEN PERMISSION OF STR GLOBAL IS STRICTLY PROHIBITED.


