
AXA EquitableProtection Report – December 2007 - 1
AXA EQUITABLE PROTECTION REPORTLife Insurance needs and realities
Results for USA (with international comparison)

AXA Equitable Protection Report –December 2007 - 2
Table of content
Introduction to the AXA Equitable Protection Report
Methodology
Analysis
Life stage explanation
Part 1: Sample description
Part 2.A: Attitudes towards Life risks
Part 2.B: Behaviors and habits against Life risks
Part 3: Product ownership and habits
Part 4: Theoretical insurance gap
Part 5: Conclusions
Appendices

AXA Equitable Protection Report –December 2007 - 3
Introduction to the AXA Equitable Protection Report An international survey of Life Insurance needs and realities
Life Insurance habits vary in function of population segments and countries.
Which are attitudes towards life risks? What are the usages and habits? How properly are people insured against what they call “life
risks”? How are particular segments not insured?
The AXA Equitable Protection Report analyses these phenomena and tries to bring insights into a subject which might be of crucial importance for large parts of population

AXA Equitable Protection Report –December 2007 - 4
Methodology
People aged 25-65, working and not working (students being excluded)For Non-working, additional question to know if there is at least one income earner in the household (QI: Do you have an income in your household). If not the respondent was excluded.
Sample is national representative in terms of gender, age, occupation status and region.
Next to the USA, 10 countries were involved: Australia, Belgium, France, Germany, Hong-Kong, Italy, Japan, Spain, Switzerland, and the UK. Interviews are comparable.
Fieldwork: Computer Assisted Telephone Interviews (CATI) methodology.
Fieldwork dates: from the 28th March to the 24th of May 2007.
In this survey we introduced the notion of “life risks”, under which we mean: serious illness, disability, death, long-term unemployment, serious car accidents, etc…
By Life insurance we mean an insurance that pays a lump sum or periodic payments as from an agreed age and/or a lump sum or periodic payments to specified beneficiaries when you die = term-life insurance.

AXA Equitable Protection Report –December 2007 - 5
Analysis
Brackets evaluation: all amount or percentage will be presented on a range of brackets; in order to determine the values of the bracket we apply the following rules:
for the smallest bracket we took 0.75 of the bracket value (e.g. “Less than 25,000” bracket was evaluated at 18,750)
for the highest bracket we took 1.5 of the bracket value (e.g. “More than 1,000,000” was evaluated at 1,500,000)
for all other brackets we took the average (e.g. “From 25,000 to 50,000” was evaluated at 37,500)
Minimum bases: base between 30 and 59 will have to be analysed with caution, we will
present it as follows (n= 35*). base under 29 will not be analysed because of too low base, and we will
present it as follows (n= 25**).
Significances are calculated with a 10% risk level.
AXA Equitable Protection Report –December 2007 - 6
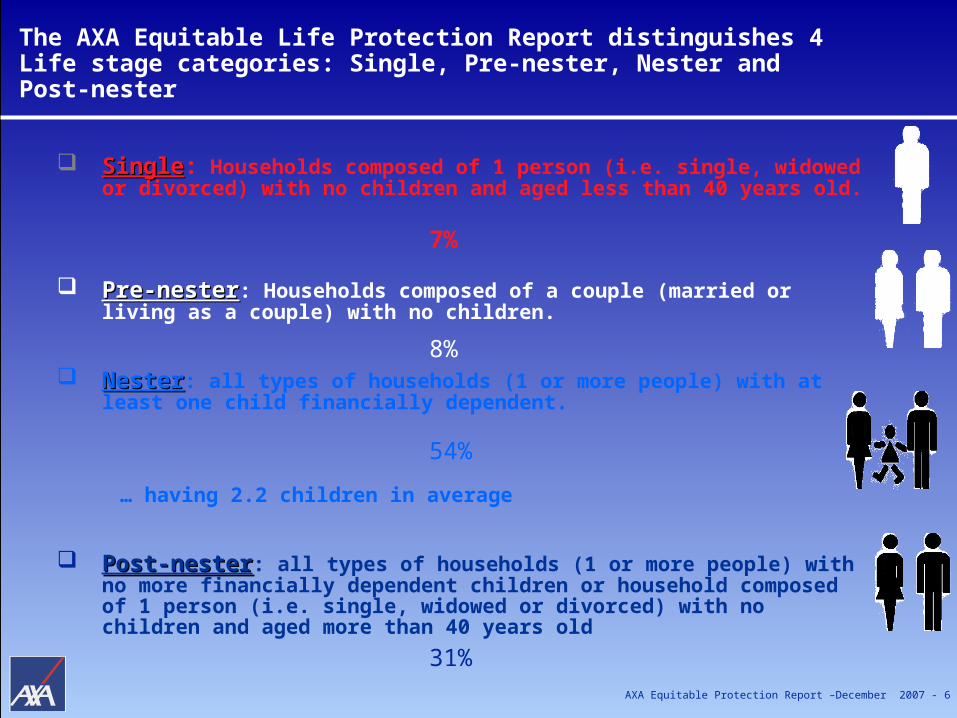
The AXA Equitable Life Protection Report distinguishes 4 Life stage categories: Single, Pre-nester, Nester and Post-nester
SingleSingle: Households composed of 1 person (i.e. single, widowed or divorced) with no children and aged less than 40 years old.
Pre-nesterPre-nester: Households composed of a couple (married or living as a couple) with no children.
NesterNester: all types of households (1 or more people) with at least one child financially dependent.
… having 2.2 children in average
Post-nesterPost-nester: all types of households (1 or more people) with no more financially dependent children or household composed of 1 person (i.e. single, widowed or divorced) with no children and aged more than 40 years old
7%
8%
54%
31%

AXA Equitable Protection Report –December 2007 - 7
Part 1: Sample description: national representation of population aged 25-65

AXA Equitable Protection Report –December 2007 - 8
Male
48%
Female
52%
21%
27%
27%
25%
21%
27%
27%
24%
55-65 years old
45-54 years old
35-44 years old
25-34 years old
Male Female
Gender and Age
QA: Are you….?QB: We are looking to research people within a specific age range, so could you please give me your age?
Average 44.1 y.o. 44.2 y.o.
Base n=172 n=188
Gender
Age
Base : n= 360
AXA Equitable Protection Report –December 2007 - 9
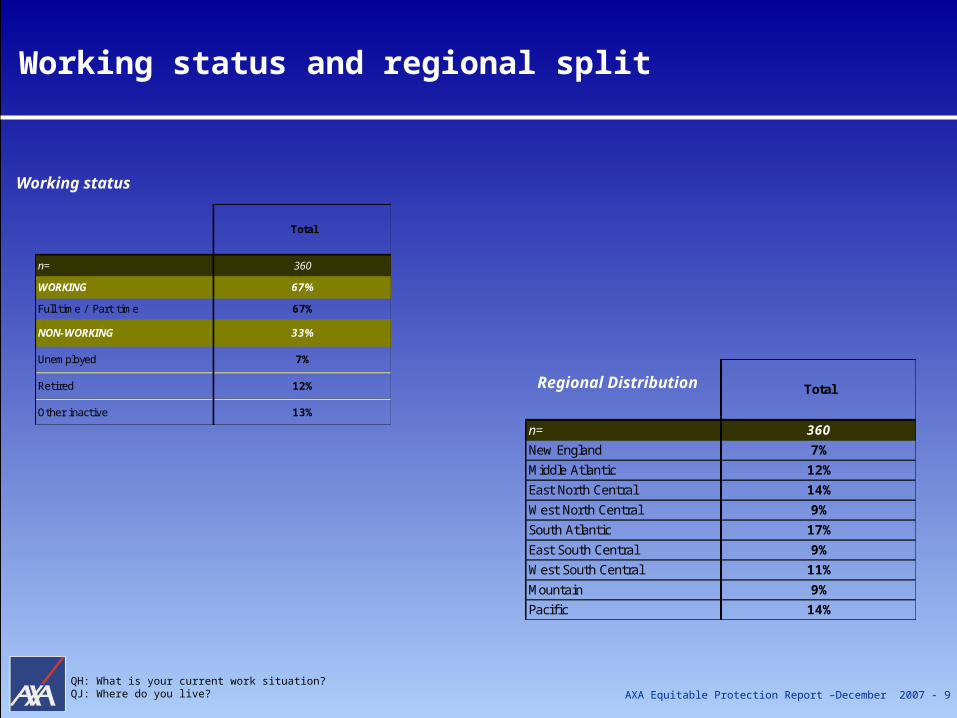
Total
n= 360
New England 7%
Middle Atlantic 12%
East North Central 14%
West North Central 9%
South Atlantic 17%
East South Central 9%
West South Central 11%
Mountain 9%
Pacific 14%
Working status and regional split
QH: What is your current work situation?QJ: Where do you live?
Working status
Regional Distribution
Total
n= 360
WORKING 67%
Full time / Part time 67%
NON-WORKING 33%
Unemployed 7%
Retired 12%
Other inactive 13%

AXA Equitable Protection Report –December 2007 - 10
Part 2: Attitudes & Behaviors
2.A Attitudes towards Life risks

AXA Equitable Protection Report –December 2007 - 11
What do you care about …?For U.S. adults 25 to 65 years old, their health is the most important of the things asked about, but their own financial situation is also very important – especially being prepared for their retirement, saving money and home ownership.
Base : n= 360 * Specific item for France
Top 2 marks 10 & 9
Mid 3 marks 8 & 7 & 6
Bot 5marks 1->5
Mean
9.3 8.4 8.1 8.1 7.5 5.18.7
Q1: I am now going to read you some statements. Using a scale from 1 to 10 where 10 means that this statement is “very important to you” and 1 means that this statement is “not at all important to you”. Please use the scores in-between in order to grade your opinion. Could you please tell me how important you consider…?
8.6
4%9% 10%
15%20% 17%
21%
66%
16%
23%29% 18%
13%
32%
38%
23%
80%
68%61%
67% 67%
51%
41%
11%
Health Financial situationof your retirement
Saving money Home ownership Ensuring one'schildren's future
Reduce financialburden
Career Indulging yourself

AXA Equitable Protection Report –December 2007 - 12
What do you care about …?Among those who have financially dependent children (Nesters), a very high level of importance is placed on ensuring their children’s future – nearly as important as their own health.
Significantly superior to Total Significantly inferior to Total
Q1: I am now going to read you some statements. Using a scale from 1 to 10 where 10 means that this statement is “very important to you” and 1 means that this statement is “not at all important to you”. Please use the scores in-between in order to grade your opinion. Could you please tell me how important you consider…?
Total Male Female SinglePre-
nesterNester
Nester male
Nester female
Post-nester
Feeling very well insured
Feeling somewhat
insured
Feeling not well
insuredn= 360 172 188 27** 29** 193 95 98 112 156 146 58*
Health 9.3 9.0 9.5 9.4 9.1 9.6 9.2 9.3 9.3 9.2
Financial situation of your retirement
8.7 8.5 8.9 8.6 8.5 8.6 9.1 8.7 8.8 8.5
Saving money 8.6 8.3 8.9 8.7 8.5 9.0 8.6 8.6 8.5 8.5
Home ownership 8.4 8.3 8.6 8.8 8.5 9.2 7.9 8.3 8.4 8.7
Reduce financial burden 8.1 7.9 8.3 8.3 8.3 8.2 7.8 7.9 8.3 8.4
Ensuring one's children's future
8.1 7.9 8.3 9.2 9.0 9.4 6.7 7.7 8.2 9.0
Career 7.5 7.6 7.4 7.8 7.8 7.7 6.8 7.3 7.5 7.8
Indulging yourself 5.1 5.1 5.2 4.7 4.4 5.0 5.7 5.2 5.1 4.9
While those who do not feel they are well insured differ little from others in the importance placed on most of the aspects of their lives, they place much more importance on ensuring their children’s future than do others.

AXA Equitable Protection Report –December 2007 - 13
What do you care about …?
Overall, their own health is most important to all, although other
aspects of their lives are also important and differ by life stage.
Those with financially dependent children place a high level of
importance on ensuring their children’s future.
Home ownership and saving money also rank high on most
people’s priority lists.
In contrast, self-indulgence has much lower importance across all
life-stages.
AXA Equitable Protection Report –December 2007 - 14
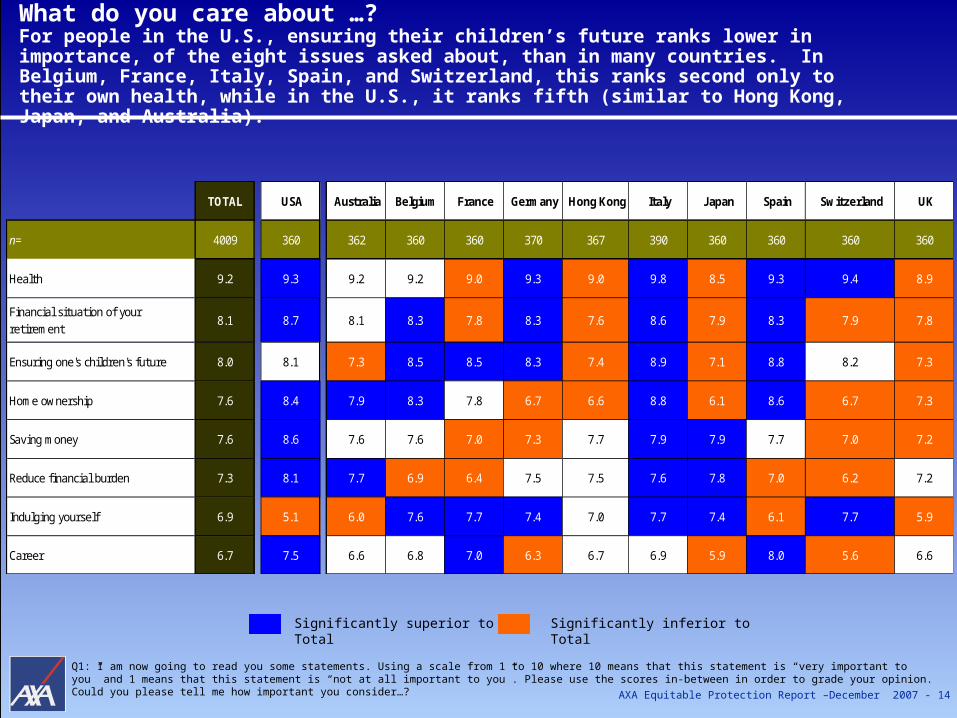
What do you care about …? For people in the U.S., ensuring their children’s future ranks lower in importance, of the eight issues asked about, than in many countries. In Belgium, France, Italy, Spain, and Switzerland, this ranks second only to their own health, while in the U.S., it ranks fifth (similar to Hong Kong, Japan, and Australia).
Q1: I am now going to read you some statements. Using a scale from 1 to 10 where 10 means that this statement is “very important to you” and 1 means that this statement is “not at all important to you”. Please use the scores in-between in order to grade your opinion. Could you please tell me how important you consider…?
TOTAL USA Australia Belgium France Germany Hong Kong Italy Japan Spain Switzerland UK
n= 4009 360 362 360 360 370 367 390 360 360 360 360
Health 9.2 9.3 9.2 9.2 9.0 9.3 9.0 9.8 8.5 9.3 9.4 8.9
Financial situation of your retirement
8.1 8.7 8.1 8.3 7.8 8.3 7.6 8.6 7.9 8.3 7.9 7.8
Ensuring one's children's future 8.0 8.1 7.3 8.5 8.5 8.3 7.4 8.9 7.1 8.8 8.2 7.3
Home ownership 7.6 8.4 7.9 8.3 7.8 6.7 6.6 8.8 6.1 8.6 6.7 7.3
Saving money 7.6 8.6 7.6 7.6 7.0 7.3 7.7 7.9 7.9 7.7 7.0 7.2
Reduce financial burden 7.3 8.1 7.7 6.9 6.4 7.5 7.5 7.6 7.8 7.0 6.2 7.2
Indulging yourself 6.9 5.1 6.0 7.6 7.7 7.4 7.0 7.7 7.4 6.1 7.7 5.9
Career 6.7 7.5 6.6 6.8 7.0 6.3 6.7 6.9 5.9 8.0 5.6 6.6
Significantly superior to Total Significantly inferior to Total

AXA Equitable Protection Report –December 2007 - 15
Which life accidents might happen to them…?Serious illness is seen as the most likely of the negative events asked about, followed by car accidents, with Americans rating their likelihood 5.3 and 4.9 on a 10-point scale. Serious financial problems are judged the third most likely (4.1), nearly identical to the likelihood of natural disasters (4.0), crime (3.8) and unemployment (3.8).
Base : n= 360
Top 2 marks 10 & 9
Mid 3 marks 8 & 7 & 6
Bot 5marks 1->5
Mean
5.3 4.14.9 4.0 3.83.8 3.4 3.33.4 2.2
Q58: Here is a list of risks that could happen to you in life. For each of these, please tell me to what extent you think these risks might happen to you personally, using a scale from 1 to 10 where 10 means that it “certainly will happen to you” and 1 means that it will “certainly not happen to you at all”. Please use the scores in-between to grade your opinion.
63%72%
79% 79%75%
82% 86% 83%89%
96%
26%
22%15% 17%
16%
14%10% 12%
8%2%
11%6% 6% 4%
9%4% 4% 5% 3% 2%
Serious illness Serious car
accident
Serious
financial
problems
Natural
disaster / env.
risks
Crime /
aggression
Unemployment Domestic or
sports
accidents
Work accidents Terrorism Plane crash

AXA Equitable Protection Report –December 2007 - 16
Which life accidents might happen to them…?Those who feel they are not well insured believe that serious financial problems and unemployment could happen to them - higher than do those who feel better insured.
Significantly superior to Total Significantly inferior to Total
Q58: Here is a list of risks that could happen to you in life. For each of these, please tell me to what extent you think these risks might happen to you personally, using a scale from 1 to 10 where 10 means that it “certainly will happen to you” and 1 means that it will “certainly not happen to you at all”. Please use the scores in-between to grade your opinion.
Total Male Female SinglePre-
nesterNester
Nester male
Nester female
Post-nester
Feeling very well insured
Feeling somewhat
insured
Feeling not well
insured
n= 360 172 188 27** 29** 193 95 98 112 156 146 58*
Serious illness 5.3 4.9 5.6 5.0 4.6 5.3 5.9 5.2 5.4 5.3
Serious car accident 4.9 4.8 4.9 4.9 4.8 5.0 4.7 4.7 5.0 5.0
Serious financial problems 4.1 3.8 4.4 4.0 3.8 4.2 4.1 3.2 4.5 5.4
Natural disaster / env. risks 4.0 3.7 4.2 4.1 3.8 4.3 3.8 3.8 3.9 4.5
Crime / aggression 3.8 3.5 4.1 3.8 3.3 4.2 3.9 3.8 3.8 3.9
Unemployment 3.8 3.6 4.1 4.0 3.6 4.4 3.6 3.0 4.1 5.5
Domestic or sports accidents 3.4 3.5 3.3 3.3 3.3 3.3 3.2 3.2 3.6 3.2
Work accidents 3.4 3.8 3.1 3.4 3.7 3.1 3.3 3.0 3.8 3.5
Terrorism 3.3 3.0 3.6 3.2 2.7 3.6 3.3 3.1 3.5 3.3
Plane crash 2.2 2.3 2.1 2.2 2.2 2.2 2.1 2.0 2.5 2.0

AXA Equitable Protection Report –December 2007 - 17
Which life accidents might happen to them?
Health, which ranks first in importance, is a source of worry for people. Serious illness ranks first in terms of likelihood of the negative events asked about in the survey, followed by serious car accidents. Financial problems, natural disasters, crime and unemployment rank next in the likelihood people attach to these events.
Feelings about the adequacy of their insurance coverage are related to Americans beliefs about the likelihood of serious financial problems and unemployment. The less well insured they feel they are, the more likely they believe that one of these two things will happen to them.

AXA Equitable Protection Report –December 2007 - 18
Which life accidents might happen to them …? /In all 11 countries studied, serious illness or car accidents ranked first or second in people’s ratings of the likelihood of these events happening to them. At or near the bottom of the list, for all countries, were plane accidents and terrorism.
Q58: Here is a list of risks that could happen to you in life. For each of these, please tell me to what extent you think these risks might happen to you personally, using a scale from 1 to 10 where 10 means that it “certainly will happen to you” and 1 means that it will “certainly not happen to you at all”. Please use the scores in-between to grade your opinion.
Significantly superior to Total Significantly inferior to Total
TOTAL USA Australia Belgium France Germany Hong Kong Italy Japan Spain Switzerland UK
n= 4009 360 362 360 360 370 367 390 360 360 360 360
Serious illness 5.6 5.3 5.0 5.9 6.4 5.9 4.8 5.6 6.0 5.0 6.0 5.1
Serious car accident 5.5 4.9 4.7 6.2 6.9 6.2 4.4 5.7 6.1 5.1 6.2 4.7
Serious financial problems 4.2 4.1 3.6 4.3 4.7 4.4 4.1 4.3 4.3 3.9 4.3 4.0
Domestic or sports accidents 4.2 3.4 3.4 4.4 5.0 4.9 3.8 4.3 4.6 3.6 5.1 3.4
Unemployment 4.1 3.8 3.1 3.6 4.6 4.7 4.4 4.1 4.3 3.9 4.3 4.1
Natural disaster / env. risks 4.1 4.0 3.4 3.9 4.4 4.3 4.2 4.4 5.3 3.5 4.6 3.3
Crime / aggression 3.9 3.8 3.8 4.4 4.2 4.1 3.6 4.3 3.9 2.8 4.2 4.2
Work accidents 3.8 3.4 3.2 3.7 4.7 4.3 3.4 3.6 4.0 3.8 4.4 3.4
Terrorism 3.2 3.3 2.8 3.2 3.4 3.4 2.5 3.4 3.1 3.5 3.0 3.2
Plane crash 2.8 2.2 2.6 2.9 2.8 2.9 3.0 2.9 3.0 2.4 3.3 2.8
Serious financial problems, which ranked third in likeliness ratings in the U.S., with a rating of 4.1, was rated as likely or more so by people in all counties other than Australia (3.6) and Spain (3.9).
AXA Equitable Protection Report –December 2007 - 19
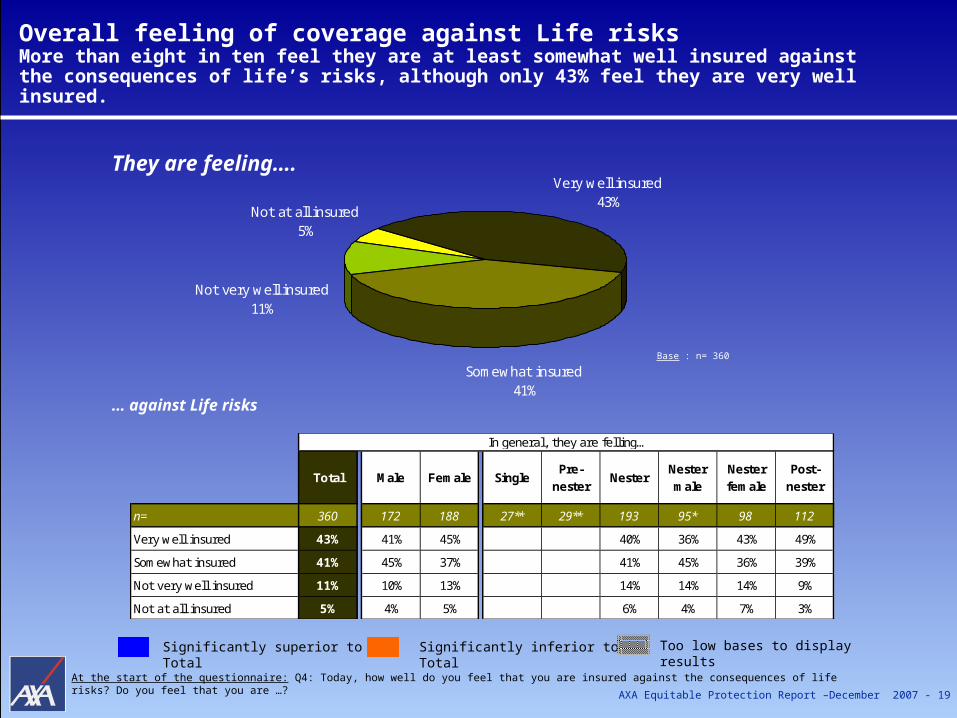
Very well insured43%
Not at all insured5%
Somewhat insured41%
Not very well insured11%
Significantly inferior to Total
Overall feeling of coverage against Life risksMore than eight in ten feel they are at least somewhat well insured against the consequences of life’s risks, although only 43% feel they are very well insured.
Base : n= 360
At the start of the questionnaire: Q4: Today, how well do you feel that you are insured against the consequences of life risks? Do you feel that you are …?
Significantly superior to Total
… against Life risks
Total Male Female SinglePre-
nesterNester
Nester male
Nester female
Post-nester
n= 360 172 188 27** 29** 193 95* 98 112
Very well insured 43% 41% 45% 40% 36% 43% 49%
Somewhat insured 41% 45% 37% 41% 45% 36% 39%
Not very well insured 11% 10% 13% 14% 14% 14% 9%
Not at all insured 5% 4% 5% 6% 4% 7% 3%
In general, they are felling…
Too low bases to display results
They are feeling….
AXA Equitable Protection Report –December 2007 - 20
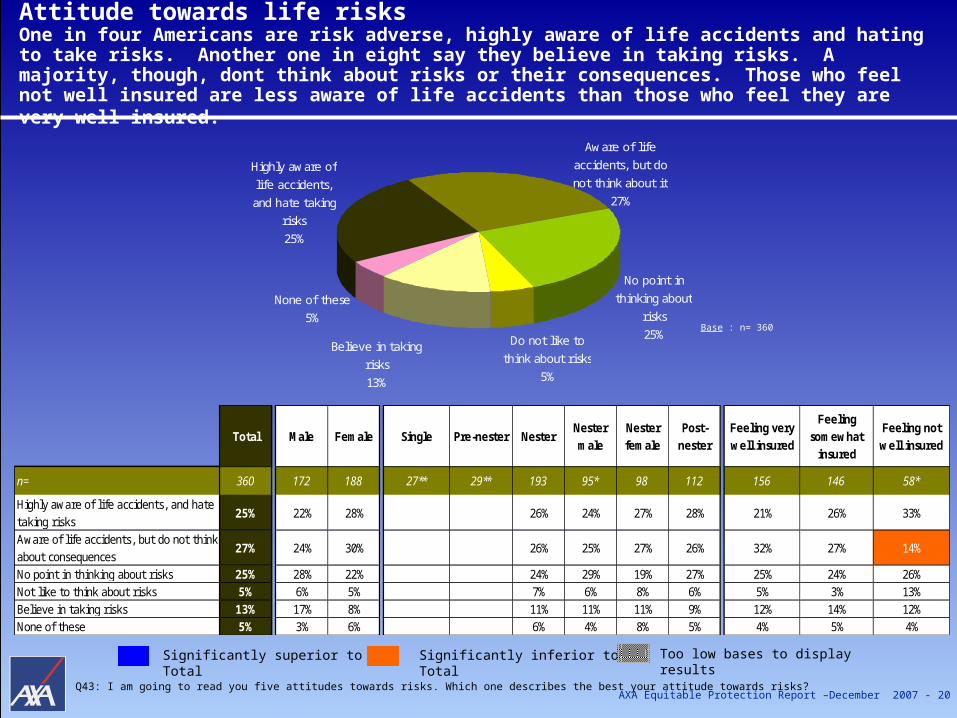
Attitude towards life risksOne in four Americans are risk adverse, highly aware of life accidents and hating to take risks. Another one in eight say they believe in taking risks. A majority, though, dont think about risks or their consequences. Those who feel not well insured are less aware of life accidents than those who feel they are very well insured.
Q43: I am going to read you five attitudes towards risks. Which one describes the best your attitude towards risks?
None of these
5%
Believe in taking
risks
13%
Do not like to
think about risks
5%
No point in
thinking about
risks
25%
Aware of life
accidents, but do
not think about it
27%
Highly aware of
life accidents,
and hate taking
risks
25%
Total Male Female Single Pre-nester NesterNester male
Nester female
Post-nester
Feeling very well insured
Feeling somewhat
insured
Feeling not well insured
n= 360 172 188 27** 29** 193 95* 98 112 156 146 58*
Highly aware of life accidents, and hate taking risks
25% 22% 28% 26% 24% 27% 28% 21% 26% 33%
Aware of life accidents, but do not think about consequences
27% 24% 30% 26% 25% 27% 26% 32% 27% 14%
No point in thinking about risks 25% 28% 22% 24% 29% 19% 27% 25% 24% 26%Not like to think about risks 5% 6% 5% 7% 6% 8% 6% 5% 3% 13%Believe in taking risks 13% 17% 8% 11% 11% 11% 9% 12% 14% 12%None of these 5% 3% 6% 6% 4% 8% 5% 4% 5% 4%
Base : n= 360
Significantly inferior to TotalSignificantly superior to Total Too low bases to display results
AXA Equitable Protection Report –December 2007 - 21
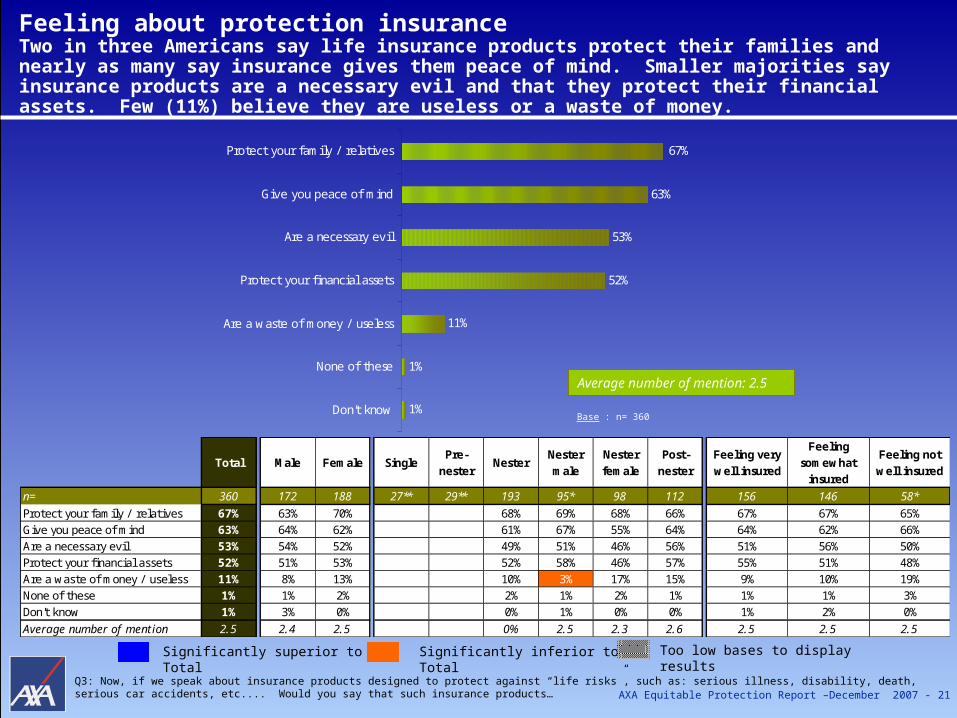
Feeling about protection insuranceTwo in three Americans say life insurance products protect their families and nearly as many say insurance gives them peace of mind. Smaller majorities say insurance products are a necessary evil and that they protect their financial assets. Few (11%) believe they are useless or a waste of money.
Base : n= 360
Q3: Now, if we speak about insurance products designed to protect against “life risks”, such as: serious illness, disability, death, serious car accidents, etc.... Would you say that such insurance products…
Average number of mention: 2.5
Significantly inferior to TotalSignificantly superior to Total Too low bases to display results
1%
1%
11%
52%
53%
63%
67%
Don't know
None of these
Are a waste of money / useless
Protect your financial assets
Are a necessary evil
Give you peace of mind
Protect your family / relatives
Total Male Female SinglePre-
nesterNester
Nester male
Nester female
Post-nester
Feeling very well insured
Feeling somewhat
insured
Feeling not well insured
n= 360 172 188 27** 29** 193 95* 98 112 156 146 58*
Protect your family / relatives 67% 63% 70% 68% 69% 68% 66% 67% 67% 65%Give you peace of mind 63% 64% 62% 61% 67% 55% 64% 64% 62% 66%Are a necessary evil 53% 54% 52% 49% 51% 46% 56% 51% 56% 50%Protect your financial assets 52% 51% 53% 52% 58% 46% 57% 55% 51% 48%Are a waste of money / useless 11% 8% 13% 10% 3% 17% 15% 9% 10% 19%None of these 1% 1% 2% 2% 1% 2% 1% 1% 1% 3%Don't know 1% 3% 0% 0% 1% 0% 0% 1% 2% 0%
Average number of mention 2.5 2.4 2.5 0% 2.5 2.3 2.6 2.5 2.5 2.5

AXA Equitable Protection Report –December 2007 - 22
Attitude towards life risks / Feelings about protection insurance Attitudes towards life risks: Americans are less averse to risks than people in most countries, and are more likely than others to say they believe in taking risks.
TOTAL USA Australia Belgium France Germany Hong Kong Italy J apan Spain Switzerland UK
n= 4009 360 362 360 360 370 367 390 360 360 360 360Highly aware of life accidents, and hate taking risks
31% 25% 29% 22% 34% 38% 18% 36% 29% 51% 18% 34%
Aware of life accidents, but do not think about it 27% 27% 31% 23% 21% 37% 24% 22% 38% 23% 24% 28%
No point in thinking about risks 25% 25% 25% 40% 30% 13% 36% 10% 26% 9% 41% 23%
Not like to think about risks 7% 5% 5% 7% 6% 9% 10% 11% 4% 12% 7% 6%
Believe in taking risks 8% 13% 5% 7% 8% 2% 12% 20% 2% 4% 10% 7%
None of these 2% 5% 4% 2% 1% 1% 1% 1% 2% 1% 1% 0%
Attitude towards life risks
Q43: I am going to read you five attitudes towards risks. Which one describes the best your attitude towards risks?
Significantly superior to Total Significantly inferior to Total
TOTAL USA Australia Belgium France Germany Hong Kong Italy J apan Spain Switzerland UK
n= 4009 360 362 360 360 370 367 390 360 360 360 360
Give you peace of mind 60% 63% 52% 57% 54% 66% 69% 33% 76% 79% 56% 59%
Protect your family / relatives 65% 67% 49% 73% 76% 71% 74% 35% 74% 75% 68% 56%
Protect your financial assets 45% 52% 38% 47% 47% 49% 56% 13% 37% 62% 48% 45%
Are a necessary evil 43% 53% 37% 44% 65% 44% 58% 23% 17% 48% 46% 41%
Are a waste of money / useless 15% 11% 19% 10% 19% 10% 15% 14% 11% 18% 15% 20%
None of these 2% 1% 2% 1% 2% 1% 4% 4% 4% 1% 2% 2%
Don't know 1% 1% 0% 1% 0% 1% 0% 1% 1% 1% 0% 2%
Average number of mention 2.3 2.5 2.0 2.3 2.6 2.4 2.7 1.2 2.1 2.8 2.3 2.2
Feelings about protection insurance
Q3: Now, if we speak about insurance products designed to protect against “life risks”, such as: serious illness, disability, death, serious car accidents, etc.... Would you say that such insurance products…
Feelings about protection insurance: Americans are more likely than those in most other countries to feel that insurance products are a necessary evil, but they are also somewhat less likely than average to consider them a waste of money.

AXA Equitable Protection Report –December 2007 - 23
Part 2: Attitudes & Behaviors
2.B Behaviors and habits against Life risks
AXA Equitable Protection Report –December 2007 - 24
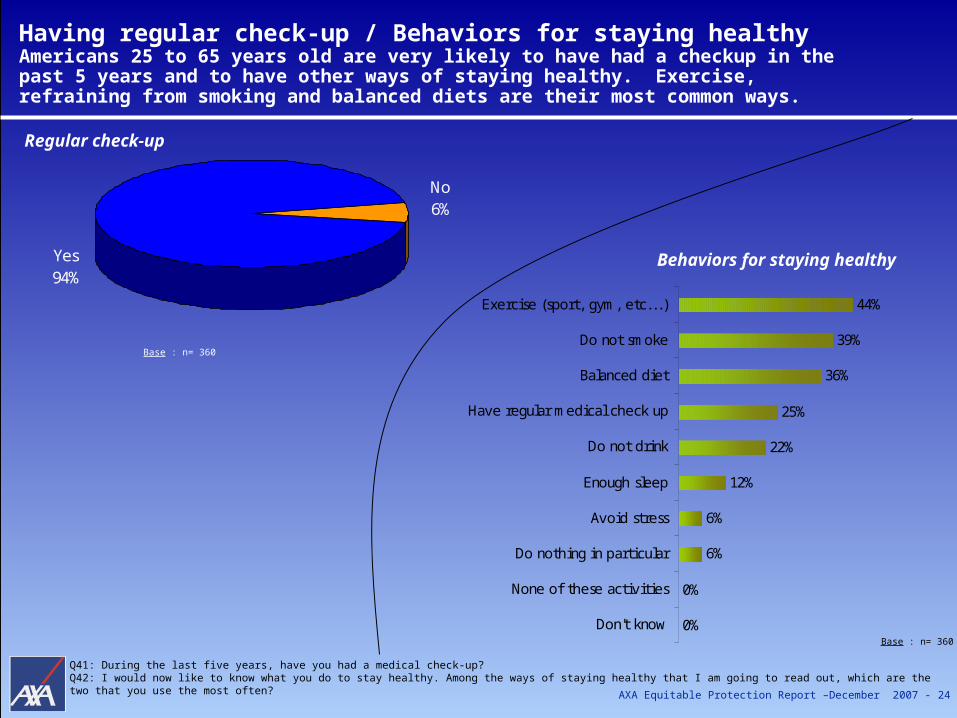
Having regular check-up / Behaviors for staying healthyAmericans 25 to 65 years old are very likely to have had a checkup in the past 5 years and to have other ways of staying healthy. Exercise, refraining from smoking and balanced diets are their most common ways.
Base : n= 360
Base : n= 360
Q41: During the last five years, have you had a medical check-up? Q42: I would now like to know what you do to stay healthy. Among the ways of staying healthy that I am going to read out, which are the two that you use the most often?
0%
0%
6%
6%
12%
22%
25%
36%
39%
44%
Don't know
None of these activities
Do nothing in particular
Avoid stress
Enough sleep
Do not drink
Have regular medical check up
Balanced diet
Do not smoke
Exercise (sport, gym, etc...)
No6%
Yes94%
Regular check-up
Behaviors for staying healthy

AXA Equitable Protection Report –December 2007 - 25
Having regular check-up / Behaviors for staying healthyThose who feel very well insured are more likely than others to have had a checkup in the past 5 years. Nester females are more likely to maintain a balanced diet to stay healthy. Those who feel they are not well insured are more likely than others to say they do nothing in particular to stay healthy.
Significantly superior to Total Significantly inferior to Total
Total Male Female SinglePre-
nesterNester
Nester male
Nester female
Post-nester
Feeling very well insured
Feeling somewhat
insured
Feeling not well
insured
n= 360 172 188 27** 29** 193 95* 98 112 156 146 58*
Yes 94% 90% 97% 95% 93% 96% 96% 98% 91% 89%
No 6% 10% 3% 5% 7% 4% 4% 2% 9% 11%
Total Male Female SinglePre-
nesterNester
Nester male
Nester female
Post-nester
Feeling very well insured
Feeling somewhat
insured
Feeling not well
insured
n= 360 172 188 27** 29** 193 95* 98 112 156 146 58*
Exercise (sport, gym, etc...) 44% 49% 41% 42% 43% 42% 41% 46% 51% 23%
Do not smoke 39% 39% 39% 39% 41% 38% 37% 44% 38% 28%
Balanced diet 36% 31% 40% 42% 36% 49% 28% 36% 36% 34%
Have regular medical check up 25% 23% 27% 25% 25% 25% 30% 24% 27% 25%
Do not drink 22% 23% 20% 26% 30% 22% 17% 19% 23% 26%
Enough sleep 12% 13% 12% 9% 9% 10% 19% 12% 9% 19%
Do nothing in particular 6% 5% 6% 5% 6% 5% 7% 4% 2% 18%
Avoid stress 6% 7% 4% 2% 2% 1% 9% 3% 8% 6%
None of these activities * 0% 0% 0% 0% 1% 0% 1% 0% 0%
Don't know * 0% 0% 0% 0% 0% 1% 0% 0% 0%
Regular check-up
Behaviours for staying healthy
Q41: During the last five years, have you had a medical check-up? Q42: I would now like to know what you do to stay healthy. Among the ways of staying healthy that I am going to read out, which are the two that you use the most often?
AXA Equitable Protection Report –December 2007 - 26
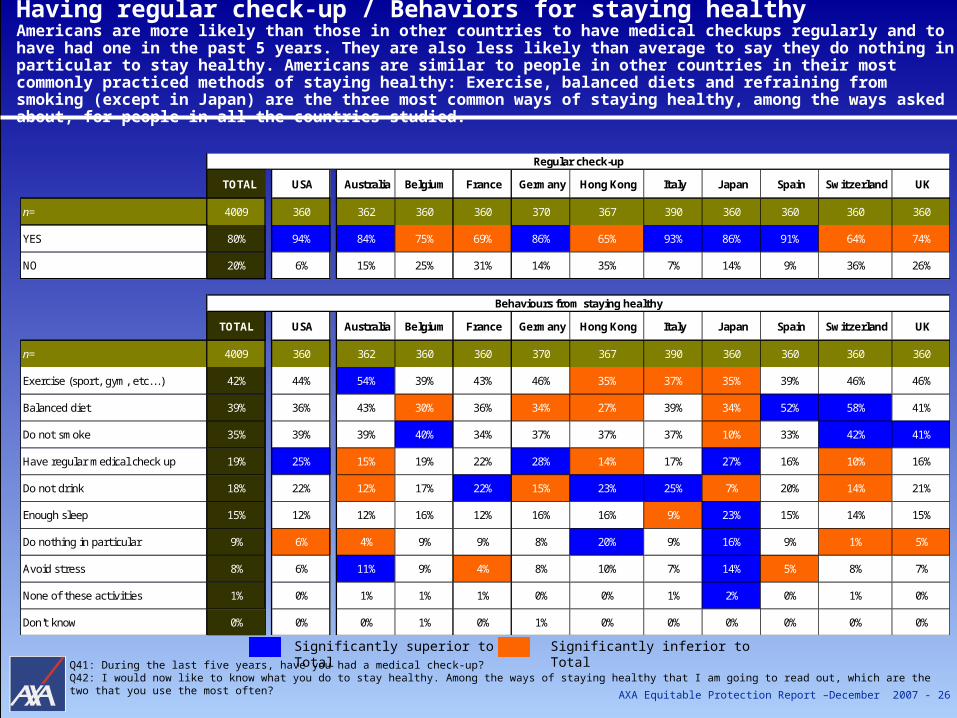
Having regular check-up / Behaviors for staying healthy Americans are more likely than those in other countries to have medical checkups regularly and to have had one in the past 5 years. They are also less likely than average to say they do nothing in particular to stay healthy. Americans are similar to people in other countries in their most commonly practiced methods of staying healthy: Exercise, balanced diets and refraining from smoking (except in Japan) are the three most common ways of staying healthy, among the ways asked about, for people in all the countries studied.
Significantly superior to Total Significantly inferior to TotalQ41: During the last five years, have you had a medical check-up? Q42: I would now like to know what you do to stay healthy. Among the ways of staying healthy that I am going to read out, which are the two that you use the most often?
TOTAL USA Australia Belgium France Germany Hong Kong Italy Japan Spain Switzerland UK
n= 4009 360 362 360 360 370 367 390 360 360 360 360
YES 80% 94% 84% 75% 69% 86% 65% 93% 86% 91% 64% 74%
NO 20% 6% 15% 25% 31% 14% 35% 7% 14% 9% 36% 26%
TOTAL USA Australia Belgium France Germany Hong Kong Italy Japan Spain Switzerland UK
n= 4009 360 362 360 360 370 367 390 360 360 360 360
Exercise (sport, gym, etc...) 42% 44% 54% 39% 43% 46% 35% 37% 35% 39% 46% 46%
Balanced diet 39% 36% 43% 30% 36% 34% 27% 39% 34% 52% 58% 41%
Do not smoke 35% 39% 39% 40% 34% 37% 37% 37% 10% 33% 42% 41%
Have regular medical check up 19% 25% 15% 19% 22% 28% 14% 17% 27% 16% 10% 16%
Do not drink 18% 22% 12% 17% 22% 15% 23% 25% 7% 20% 14% 21%
Enough sleep 15% 12% 12% 16% 12% 16% 16% 9% 23% 15% 14% 15%
Do nothing in particular 9% 6% 4% 9% 9% 8% 20% 9% 16% 9% 1% 5%
Avoid stress 8% 6% 11% 9% 4% 8% 10% 7% 14% 5% 8% 7%
None of these activities 1% 0% 1% 1% 1% 0% 0% 1% 2% 0% 1% 0%
Don't know 0% 0% 0% 1% 0% 1% 0% 0% 0% 0% 0% 0%
Regular check-up
Behaviours from staying healthy

AXA Equitable Protection Report –December 2007 - 27
Frequently25%
Rarely17%
Occasionally53%
Never5%
Thinking about life risksThree out of four think about the consequences of life risks at least occasionally and one out of four think about these frequently. Death and financial hardship are life risks that large majorities say they have though about.
Q5: Generally speaking, how much have you thought about the consequences of life risks? By “life risks” we mean serious illness, disability, death, long-term unemployment, serious car accidents, etc....Q6: When you think about the consequences of life risks, do you think about their impact on …?Q8: Which of the following consequences of life risks have you already thought about? Have you thought about…
AND ABOUT
Base : n= 360
Base : n= 343
Base : n= 343
Thinking about Life risks…
53%
66%
73%
79%
86%
Downsizing your
standard of living
Temporary disability
Permanent disability
Financial hardship
Death
THEI
R CONSE
QUENCES
FOR
* Only asked to divroced or personv being part of a blended family
59%
26%
59%
95%
95%
Other people
Your previous
partner*
Yourself
Your children
Your partner

AXA Equitable Protection Report –December 2007 - 28
Thinking about life risksThose who feel they are not well insured are more likely than others to think about life risks frequently.
Significantly superior to Total Significantly inferior to Total Not asked Too low bases to display resultsQ5: Generally speaking, how much have you thought about the consequences of life risks? By “life risks” we mean serious illness, disability, death, long-term unemployment, serious car accidents, etc....Q6: When you think about the consequences of life risks, do you think about their impact on …?Q8: Which of the following consequences of life risks have you already thought about? Have you thought about…
Total Male Female SinglePre-
nesterNester
Nester
male
Nester
female
Post-
nester
Feeling very well
insured
Feeling somewh
at insured
Feeling not well insured
n= 360 172 188 27** 29** 193 95* 98 112 156 146 58*
Frequently 25% 23% 27% 26% 21% 30% 26% 22% 22% 40%
Occasionally 53% 49% 57% 49% 48% 51% 51% 57% 58% 32%
Rarely 17% 20% 15% 19% 20% 18% 20% 18% 14% 20%
Rarely 5% 8% 1% 6% 11% 1% 3% 3% 5% 7%
n= 343 158 185 24** 29** 182 84* 98 108 151 138 54*
Your partner 95% 100% 91% 96% 100% 92% 94% 96% 95% 96%
Your children 95% 97% 93% 0% 99% 100% 98% 87% 94% 95% 95%
Yourself 59% 53% 64% 55% 48% 61% 58% 56% 66% 47%
Your previous partner* 26% 32% 21% 35% 17% 19%
Other people 59% 53% 64% 58% 48% 67% 55% 57% 63% 53%
None 2% 2% 2% 1% 0% 1% 5% 2% 1% 2%
n= 343 158 185 24** 29** 182 84* 98 108 151 138 54*
Death 86% 86% 86% 87% 85% 89% 84% 88% 89% 74%
Financial hardship 79% 79% 80% 82% 82% 82% 69% 75% 86% 75%
Permanent disability 73% 71% 74% 75% 73% 76% 70% 74% 73% 69%
Temporary disability 66% 65% 67% 69% 67% 71% 64% 68% 67% 56%
Downsizing your standard of living 53% 52% 54% 52% 47% 55% 51% 49% 57% 54%
Nothing 2% 2% 2% 1% 1% 1% 5% 3% 1% 3%
Average number of mention 3.6 3.5 3.6 3.6 3.5 3.7 3.4 3.6 3.7 3.3
Thinking about life risks
Their consequences for …
Thinking about* Only asked to divroced or personv being part of a blended family

AXA Equitable Protection Report –December 2007 - 29
Thinking About Life Risks
Americans do think about the consequences of life risks and, for those with families, especially the consequences on their families.
Death and financial hardship are the life risks the largest numbers of people have already thought about and large majorities have thought about permanent and temporary disabilities as well.
Nearly all of those with spouses or partners say it is the impact on their spouse/partner they think about. Nearly all of those with children say it is the impact on their children they think about.
The insurance that might give people peace of mind, may be most lacking for those who think most about these risks. Those who feel they are not well insured are more likely than others to think about life risks frequently.

AXA Equitable Protection Report –December 2007 - 30
Thinking about life risks Americans are more likely than those in other countries to have thought about their deaths, financial hardships and disabilities. They also think about life risks more frequently than people in other countries.
TOTAL USA Australia Belgium France Germany Hong Kong Italy Japan Spain Switzerland UK
n= 4009 360 362 360 360 370 367 390 360 360 360 360
Frequently 20% 25% 17% 21% 19% 38% 5% 29% 9% 20% 15% 22%Occasionally 46% 53% 50% 49% 43% 43% 40% 38% 66% 45% 37% 48%Rarely 26% 17% 28% 26% 27% 16% 40% 22% 23% 28% 37% 21%Never 8% 5% 6% 4% 11% 4% 15% 11% 1% 7% 11% 9%
TOTAL USA Australia Belgium France Germany Hong Kong Italy Japan Spain Switzerland UK
n= 3702 343 342 344 322 357 311 348 355 334 320 326
Your children 92% 95% 88% 93% 92% 94% 86% 94% 88% 95% 95% 93%Your partner 90% 95% 92% 90% 88% 94% 87% 89% 91% 88% 87% 92%Yourself 66% 59% 50% 63% 66% 79% 84% 83% 69% 65% 56% 56%Your previous partner* 16% 26% 12% 14% 14% 26% 6%Other people 55% 59% 50% 58% 51% 46% 62% 57% 43% 64% 60% 55%None 4% 2% 6% 3% 5% 2% 9% 3% 3% 4% 3% 3%
TOTAL USA Australia Belgium France Germany Hong Kong Italy Japan Spain Switzerland UK
n= 3702 343 342 344 322 357 311 348 355 334 320 326
Death 73% 86% 74% 69% 74% 74% 59% 70% 72% 69% 73% 83%Financial hardship 65% 79% 67% 59% 64% 74% 61% 66% 63% 57% 55% 71%Temporary disability 62% 66% 64% 64% 70% 68% 47% 55% 70% 54% 62% 62%Permanent disability 59% 73% 63% 54% 69% 69% 38% 54% 57% 48% 65% 58%Downsizing your standard of living 57% 53% 44% 59% 67% 67% 53% 59% 66% 54% 55% 43%None 6% 2% 6% 6% 5% 2% 11% 5% 8% 9% 6% 3%Average number of mention 3.4 3.6 3.1 3.1 3.4 4.2 3.2 3.1 3.3 2.8 3.1 3.9
Thinking about life risks
Their consequences for …
Thinking about …
Significantly inferior to TotalSignificantly superior to Total Too low bases to display results
Q5: Generally speaking, how much have you thought about the consequences of life risks? By “life risks” we mean serious illness, disability, death, long-term unemployment, serious car accidents, etc....Q6: When you think about the consequences of life risks, do you think about their impact on …?Q8: Which of the following consequences of life risks have you already thought about? Have you thought about…
* Only asked to divroced or personv being part of a blended family

AXA Equitable Protection Report –December 2007 - 31
35%
23%
27%
30%
49%
44%
65%
87%
None
A tax advisor oraccountant
An attorney / lawyer
A financial advisor
Your friends
An insurance agent /broker
Your family
Your partner*
only in passing
31% never
13%
in detail
56%
With whom do they talk about life risks..?People are more likely to have spoken to family members than to others about the consequences of life risks. Six in ten have spoken about them with their spouse or partner (87% of those who have a spouse or partner) and nearly two thirds have spoken about them with their families. Even among those who have a spouse or partner, though, only a little more than half have talked about these risks in detail. Fewer than half have talked about them to a financial professional. The insurance agent / broker is the professional who is cited mostly.
Base : n= 360
Q9: Have you talked about the consequences of life risks with your partner?Q10: Have you talked about the consequences of life risks with …?
Base : n= 248
How do they talk of it with their partner / spouse ?
Talking about life risks with …
*
* Only asked to people living in couple
With professional
63%
With loved ones84% (for those
not living in couple)
90% (for those living in couple)

AXA Equitable Protection Report –December 2007 - 32
With whom do they talk about life risks..?Those who feel very well insured are much more likely to have spoken with others (both with loved ones and professionals) about the consequences of life risks than are those who do not feel well insured.
Significantly superior to Total Significantly inferior to Total
Q9: Have you talked about the consequences of life risks with your partner?Q10: Have you talked about the consequences of life risks with …?
Not asked
* Only asked to people living in couple
Total Male Female SinglePre-
nesterNester
Nester male
Nester female
Post-nester
Feeling very well insured
Feeling somewhat
insured
Feeling not well insured
n= 360 172 188 27** 29** 193 95* 98 112 156 146 58*
Your partner* 87% 83% 91% 89% 83% 94% 88% 94% 84% 65%
Your family 65% 63% 67% 69% 70% 67% 59% 74% 59% 56%
An insurance agent / broker 49% 44% 53% 53% 48% 58% 42% 65% 42% 20%
Your friends 44% 35% 52% 46% 40% 53% 38% 49% 40% 41%
A financial advisor 30% 26% 35% 31% 27% 35% 32% 41% 26% 13%
A tax advisor or accountant 23% 23% 24% 22% 22% 22% 27% 35% 17% 8%
An attorney / lawyer 27% 26% 28% 31% 29% 33% 26% 35% 20% 25%
None 11% 15% 7% 8% 11% 5% 13% 4% 15% 21%
Talking about life risks with …

AXA Equitable Protection Report –December 2007 - 33
With whom do they talk about life risks..? Compared with people in other countries on average, Americans are more likely to talk with both family and professionals about the consequences of life risks.
Significantly superior to Total Significantly inferior to Total
Q9: Have you talked about the consequences of life risks with your partner?Q10: Have you talked about the consequences of life risks with …?
TOTAL USA Australia Belgium France Germany Hong Kong Italy Japan Spain Switzerland UK
n= 4009 360 362 360 360 370 367 390 360 360 360 360
Your partner* 78% 87% 82% 81% 79% 84% 42% 81% 79% 84% 83% 78%
Your family 56% 65% 45% 56% 54% 74% 30% 56% 70% 58% 61% 49%
Your friends 43% 44% 33% 48% 47% 55% 25% 53% 40% 51% 51% 32%
An insurance agent / broker 42% 49% 24% 48% 48% 66% 25% 49% 28% 38% 53% 38%
A financial advisor 25% 30% 33% 22% 34% 26% 6% 25% 14% 17% 27% 40%
A notary / solicitor 15% 27% 18% 20% 18% 18% 2% 7% 4% 0% 11% 22%
A tax advisor or accountant 15% 23% 23% 16% 17% 16% 0% 15% 8% 15% 17% 17%
None 16% 11% 17% 12% 13% 6% 45% 11% 12% 15% 13% 17%
* Only asked to people living in couple
AXA Equitable Protection Report –December 2007 - 34
Part 3: Product ownership & habits

AXA Equitable Protection Report –December 2007 - 35
Protection insurance ownership (provided by the employer and/or personally purchased)About eight in ten say they have term-life insurance and an equal number have health insurance. Disability insurance is less common (about half) and only about one fourth have long-term care insurance.
Base : n= 360
Q11: I am now going to read you a list of insurance products. Please tell me the ones your employer has taken out for you? Q14: Apart from the ones maybe provided by your company, have you personally taken out any of the following insurance products? Have you PERSONALLY taken out …Q15:I am now going to read you a list of insurance products. Please tell me the ones you have taken out personally? Have you PERSONALLY taken out…
16%
27%
33%
36%
16%
3%
7%
6%
14%
34%
8%
12%
13%
31%
32%
73%
54%
48%
19%
18%
Long term care insurance
Long-term disability insurance
Short-term disability insurance
Health, medical, hospitalisationinsurance
Life insurance
Provided by employer insurance only Provided by employer + personal insurance Personal insurance only None

AXA Equitable Protection Report –December 2007 - 36
Protection insurance ownership (provided by the employer and/or personally purchased)Ownership of all types of insurance is lower among those who feel they are not well insured than among others: Fewer than half of this group has term-life insurance, only six in ten have health insurance, and even fewer have disability or long-term care insurance.
Q11: I am now going to read you a list of insurance products. Please tell me the ones your employer has taken out for you? Q14: Apart from the ones maybe provided by your company, have you personally taken out any of the following insurance products? Have you PERSONALLY taken out …Q15:I am now going to read you a list of insurance products. Please tell me the ones you have taken out personally? Have you PERSONALLY taken out…
Significantly inferior to TotalSignificantly superior to Total Too low bases to display results
Total Male Female SinglePre-
nesterNester
Nester male
Nester female
Post-nester
Feeling very well insured
Feeling somewhat
insured
Feeling not well
insuredn= 360 172 188 27** 29** 193 95* 98 112 156 146 58*
Life insurance 82% 86% 78% 85% 90% 81% 81% 95% 82% 47%
Health, medical, hospitalisation insurance
81% 85% 76% 82% 87% 77% 80% 86% 83% 61%
Disability insurance 60% 65% 56% 63% 64% 62% 52% 67% 62% 38%
Short-term disability insurance 52% 54% 51% 54% 52% 55% 46% 62% 50% 32%
Long-term disability insurance 46% 50% 42% 48% 53% 43% 41% 55% 44% 26%
Long term care insurance 27% 27% 27% 28% 28% 27% 27% 38% 20% 16%
Average number of product individually owned
2.9 3.0 2.7 3.0 3.1 2.8 2.7 3.4 2.8 1.8
Protection insurance ownership

AXA Equitable Protection Report –December 2007 - 37
Personal protection insurance ownershipTwo thirds have purchased life insurance themselves, whether their employer provides any or not, and 44% have purchased health insurance. Far fewer have purchased any of the other insurance products asked about. Those who feel very well insured are more likely than others to have purchased life insurance for themselves.
Q11: I am now going to read you a list of insurance products. Please tell me the ones your employer has taken out for you? Q14: Apart from the ones maybe provided by your company, have you personally taken out any of the following insurance products? Have you PERSONALLY taken out …Q15:I am now going to read you a list of insurance products. Please tell me the ones you have taken out personally? Have you PERSONALLY taken out…
Significantly inferior to TotalSignificantly superior to Total Too low bases to display results
Total Male Female SinglePre-
nesterNester
Nester male
Nester female
Post-nester
Feeling very well insured
Feeling somewhat
insured
Feeling not well
insured
n= 360 172 188 27** 29** 193 95* 98 112 156 146 58*
Life insurance 66% 71% 62% 71% 74% 67% 64% 82% 64% 29%
Health, medical, hospitalisation insurance
44% 44% 44% 41% 39% 43% 43% 48% 45% 33%
Temporary disability insurance 19% 18% 21% 21% 19% 23% 20% 19% 19% 22%
Permanent disability insurance 19% 22% 15% 19% 23% 15% 18% 23% 17% 10%
Long term care insurance 10% 10% 11% 7% 6% 8% 16% 19% 6% 0%
Average number of product individually owned
1.6 1.7 1.5 1.6 1.6 1.6 1.6 1.9 1.5 0.9
Personal ownership protection insurance

AXA Equitable Protection Report –December 2007 - 38
Protection insurance ownership (the more equipped whatever the products) Americans are more likely to be covered by employer-provided insurance (health, life, and disabilty) than are people in the countries in the survey on average.
Significantly superior to Total Significantly inferior to Total
Not asked
TOTAL USA Australia Belgium France Germany Hong Kong Italy Japan Spain Switzerland UK
n= 4009 360 362 360 360 370 367 390 360 360 360 360
Health, medical, hospitalisation insuranceAt least one insurance 69% 81% 59% 88% 91% 85% 65% 34% 83% 51% 82% 40%Provided by employer insurance only 15% 36% 4% 22% 26% 18% 11% 12% 2% 23% 0% 15%Personal insurance only 40% 31% 48% 46% 41% 44% 34% 15% 68% 14% 82% 18%Provided by employer + Personal insurance only 14% 14% 7% 21% 24% 24% 20% 8% 13% 13% 0% 8%None 31% 19% 41% 12% 9% 15% 35% 66% 17% 49% 18% 60%
Life insuranceAt least one insurance 64% 82% 51% 71% 66% 53% 67% 45% 88% 53% 58% 71%
Provided by employer insurance only 9% 15% 10% 11% 18% 4% 5% 6% 1% 13% 13% 8%Personal insurance only 40% 32% 33% 47% 28% 44% 50% 32% 74% 26% 31% 42%Provided by employer + Personal insurance only 15% 34% 8% 13% 20% 5% 12% 7% 14% 15% 14% 21%None 36% 18% 49% 29% 34% 47% 33% 55% 12% 47% 42% 29%
DisabilityAt least one insurance 54% 60% 48% 39% 64% 71% 45% 39% 64% 48% 78% 40%Provided by employer insurance only 16% 33% 17% 17% 24% 3% 7% 9% 3% 21% 35% 12%Personal insurance only 25% 16% 24% 14% 21% 56% 24% 21% 46% 15% 19% 19%Provided by employer + Personal insurance only 13% 12% 8% 8% 20% 12% 14% 9% 16% 12% 24% 9%None 46% 40% 52% 61% 36% 29% 55% 61% 36% 53% 22% 60%
Supplementary pensionn= 2927 360 360 370 367 390 360 360 360
At least one insurance 48% 66% 59% 71% 24% 34% 41% 45% 44%Provided by employer insurance only 13% 13% 30% 11% 7% 6% 15% 5% 16%Personal insurance only 24% 35% 16% 39% 13% 19% 21% 28% 17%Provided by employer + Personal insurance only 11% 18% 13% 22% 4% 8% 5% 11% 11%None 52% 34% 41% 29% 76% 66% 59% 55% 56%
Long term unemployment insurancen= 2917 360 360 367 390 360 360 360 360
At least one insurance 15% 6% 18% 3% 5% 17% 3% 52% 20%Provided by employer insurance only 5% 0% 9% 3% 3% 12% 0% 11% 5%Personal insurance only 8% 6% 6% 30% 1% 3% 3% 34% 12%Provided by employer + Personal insurance only 2% 0% 2% 0% 1% 2% 0% 7% 3%None 85% 94% 82% 97% 95% 83% 97% 48% 80%

AXA Equitable Protection Report –December 2007 - 39
Protection insurance ownership (the least equipped whatever the products) Compared with other countries, the U.S. on average, is not lower in their ownership of any of the insurance prodcuts. Since they are more likely to receive at least some insurance from their employers, they are less likely to have only insurance products they purchased themselves.
Significantly superior to Total Significantly inferior to Total
Not asked
TOTAL USA Australia Belgium France Germany Hong Kong Italy Japan Spain Switzerland UK
n= 4009 360 362 360 360 370 367 390 360 360 360 360
Health, medical, hospitalisation insuranceAt least one insurance 69% 81% 59% 88% 91% 85% 65% 34% 83% 51% 82% 40%Provided by employer insurance only 15% 36% 4% 22% 26% 18% 11% 12% 2% 23% 0% 15%Personal insurance only 40% 31% 48% 46% 41% 44% 34% 15% 68% 14% 82% 18%Provided by employer + Personal insurance only 14% 14% 7% 21% 24% 24% 20% 8% 13% 13% 0% 8%None 31% 19% 41% 12% 9% 15% 35% 66% 17% 49% 18% 60%
Life insuranceAt least one insurance 64% 82% 51% 71% 66% 53% 67% 45% 88% 53% 58% 71%Provided by employer insurance only 9% 15% 10% 11% 18% 4% 5% 6% 1% 13% 13% 8%Personal insurance only 40% 32% 33% 47% 28% 44% 50% 32% 74% 26% 31% 42%Provided by employer + Personal insurance only 15% 34% 8% 13% 20% 5% 12% 7% 14% 15% 14% 21%None 36% 18% 49% 29% 34% 47% 33% 55% 12% 47% 42% 29%
DisabilityAt least one insurance 54% 60% 48% 39% 64% 71% 45% 39% 64% 48% 78% 40%Provided by employer insurance only 16% 33% 17% 17% 24% 3% 7% 9% 3% 21% 35% 12%Personal insurance only 25% 16% 24% 14% 21% 56% 24% 21% 46% 15% 19% 19%Provided by employer + Personal insurance only 13% 12% 8% 8% 20% 12% 14% 9% 16% 12% 24% 9%None 46% 40% 52% 61% 36% 29% 55% 61% 36% 53% 22% 60%
Supplementary pensionn= 2927 360 360 370 367 390 360 360 360
At least one insurance 48% 66% 59% 71% 24% 34% 41% 45% 44%Provided by employer insurance only 13% 13% 30% 11% 7% 6% 15% 5% 16%Personal insurance only 24% 35% 16% 39% 13% 19% 21% 28% 17%Provided by employer + Personal insurance only 11% 18% 13% 22% 4% 8% 5% 11% 11%None 52% 34% 41% 29% 76% 66% 59% 55% 56%
Long term unemployment insurancen= 2917 360 360 367 390 360 360 360 360
At least one insurance 15% 6% 18% 3% 5% 17% 3% 52% 20%Provided by employer insurance only 5% 0% 9% 3% 3% 12% 0% 11% 5%Personal insurance only 8% 6% 6% 0% 1% 3% 3% 34% 12%Provided by employer + Personal insurance only 2% 0% 2% 0% 1% 2% 0% 7% 3%None 85% 94% 82% 97% 95% 83% 97% 48% 80%

AXA Equitable Protection Report –December 2007 - 40
0%
4%
6%
8%
13%
33%
39%
75%
Don't know
None of the reasons
Avoid dipping into your
savings
Bought it with a mortgage
Recommended by a
professional adviser
Preserve your / your family
standard of living
Have peace of mind
Protect your family or
yourself
1%
17%
4%
4%
10%
11%
12%
20%
20%
Don't know
None of these reasons
Event among loved ones
Serious personal illness experience
Advice by a professional
Bought a house/ apartment
First job/ job promotion/ additional revenues
Marriage
/ additional child
Reasons for subscribing to life insurance and triggersAmong those who have individually-purchased life insurance, the most common reason is to protect their families or themselves (75%). The birth of a child and marriage are the events that most frequently prompted them to buy life insurance.
Base : n= 239
Base : n= 239
Q18: You told me that you have personally taken out a life insurance what were the main reasons for taking this out?Q19: Do you remember what led you to take-out your first individual life insurance? Was it?
The 2 main reasons
The first trigger

AXA Equitable Protection Report –December 2007 - 41
Reasons for subscribing to life insurance and triggersWomen are more likely than men to say it was the birth of a child that led them to purchase life insurance.
Q18: You told me that you have personally taken out a life insurance what were the main reasons for taking this out?Q19: Do you remember what led you to take-out your first individual life insurance? Was it?
The 2 main reasons Total Male Female SinglePre-
nesterNester
Nester male
Nester female
Post-nester
Feeling very well insured
Feeling somewhat
insured
Feeling not well insured
n= 239 123 116 11** 21** 136 70* 66* 71 128 94 17**
Protect your family or yourself 75% 74% 76% 81% 80% 82% 69% 68% 83%
Have peace of mind 39% 31% 47% 35% 32% 38% 43% 40% 40%
Avoid dipping into your savings 6% 7% 4% 5% 5% 5% 9% 5% 4%
Preserve your / your family standard of living
33% 37% 27% 35% 41% 29% 25% 41% 25%
Recommended by a professional 13% 13% 13% 13% 11% 15% 9% 16% 9%
Bought it with a mortgage 8% 11% 6% 10% 13% 6% 6% 8% 6%
None of the reasons 4% 4% 3% 0% 0% 0% 7% 2% 7%
Don't know 0% 0% 0% 0% 0% 0% 0% 0% 0%
The first trigger Total Male Female SinglePre-
nesterNester
Nester male
Nester female
Post-nester
Feeling very well insured
Feeling somewhat
insured
Feeling not well insured
n= 239 123 116 11** 21** 136 70* 66* 71 128 94 17**
First child / additional child 20% 13% 28% 24% 14% 34% 20% 15% 22%Marriage 20% 24% 16% 16% 13% 20% 26% 18% 24%First job/ job promotion/ additional. revenues
12% 15% 10% 9% 12% 5% 10% 14% 11%
Bought a house/ apartment 11% 14% 9% 15% 21% 7% 7% 13% 10%Advice by a professional 10% 10% 10% 13% 15% 12% 5% 11% 10%Event among loved ones 4% 2% 5% 2% 1% 4% 4% 5% 3%Serious personal illness experience 4% 3% 5% 4% 3% 4% 5% 4% 5%None of these reasons 17% 17% 18% 16% 17% 15% 21% 19% 15%Don't know 1% 2% 0% 1% 2% 0% 1% 1% 1%

AXA Equitable Protection Report –December 2007 - 42
Reasons for subscribing to a life insurance and triggers Compared with other countries surveyed, Americans on average, are more likely to say the reason they bought life insurance was to protect their families and themselves and less likely to say the main reason was a mortgage. Their purchase was also more likely to have been triggerd by the birth of a child or a marriage.
Q18: You told me that you have personally taken out a life insurance what were the main reasons for taking this out?Q19: Do you remember what led you to take-out your first individual life insurance? Was it?
TOTAL USA Australia Belgium France Germany Hong Kong Italy Japan Spain Switzerland UK
n= 2185 239 146 216 173 180 228 154 315 146 163 225
Protect your family or yourself 60% 75% 55% 37% 61% 66% 72% 57% 72% 47% 50% 51%
Have peace of mind 32% 39% 25% 16% 31% 25% 34% 32% 54% 32% 22% 28%
Preserve your / your family standard of living
23% 33% 18% 18% 18% 29% 21% 14% 30% 13% 30% 18%
Bought it with a mortgage 20% 8% 10% 47% 24% 15% 2% 8% 5% 53% 14% 41%
Recommended by a professional adviser
13% 13% 15% 13% 18% 14% 14% 13% 8% 16% 15% 11%
Avoid dipping into your savings 7% 6% 3% 9% 1% 9% 12% 10% 6% 3% 11% 5%
None of the reasons 3% 4% 5% 4% 3% 2% 4% 5% 2% 3% 4% 1%
Part of your personal insurance 1% 0% 8% 0% 0% 0% 0% 0% 0% 0% 0% 0%
Don't know 0% 0% 0% 1% 1% 0% 0% 0% 0% 0% 2% 1%
Significantly superior to Total Significantly inferior to Total
TOTAL USA Australia Belgium France Germany Hong Kong Italy Japan Spain Switzerland UK
n= 2185 239 146 216 173 180 228 154 315 146 163 225
Bought a house / apartment 22% 11% 17% 51% 25% 28% 4% 6% 1% 55% 15% 40%
Advice by a professional 20% 10% 14% 11% 13% 19% 35% 32% 29% 16% 22% 14%
First child / additional child 11% 20% 16% 4% 32% 8% 10% 8% 7% 3% 13% 8%
Marriage 10% 20% 9% 7% 7% 6% 12% 3% 14% 5% 11% 6%
First job / job promotion / additional revenues
10% 12% 10% 2% 1% 13% 9% 6% 27% 3% 2% 8%
Event among loved ones 4% 4% 1% 3% 9% 1% 6% 9% 1% 2% 2% 4%
Experience of personal serious illness
2% 4% 1% 2% 3% 2% 0% 1% 3% 1% 2% 4%
None of these reasons 18% 17% 16% 17% 9% 21% 23% 34% 15% 14% 29% 8%
Don't know 3% 1% 3% 2% 1% 2% 2% 1% 2% 1% 4% 8%
AXA Equitable Protection Report –December 2007 - 43
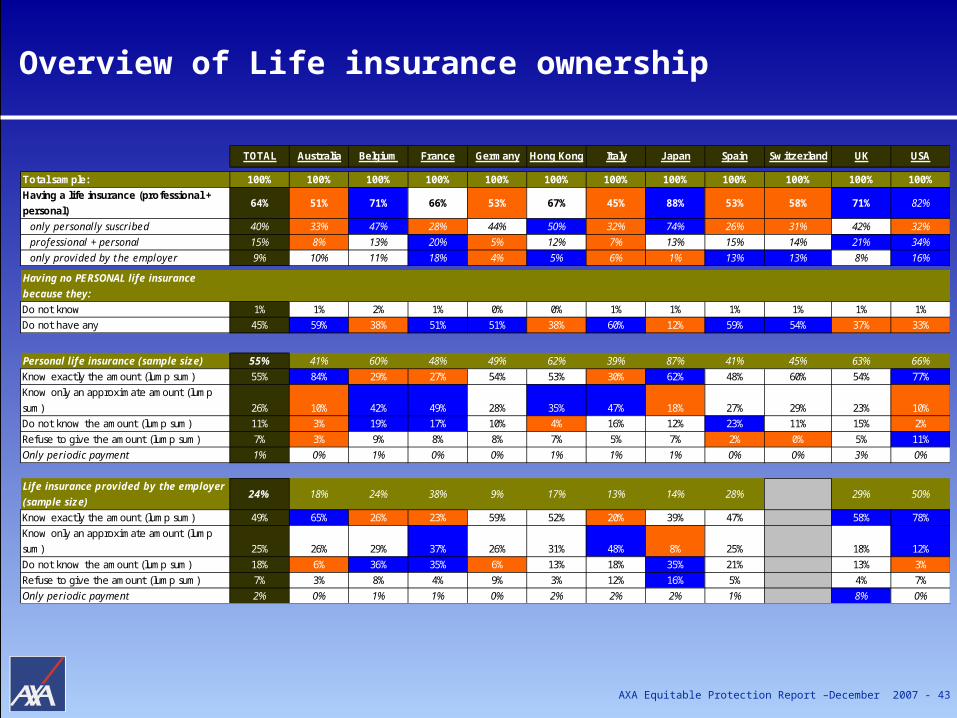
Overview of Life insurance ownership
TOTAL Australia Belgium France Germany Hong Kong Italy J apan Spain Switzerland UK USA
Total sample: 100% 100% 100% 100% 100% 100% 100% 100% 100% 100% 100% 100%
Having a life insurance (professional +
personal)64% 51% 71% 66% 53% 67% 45% 88% 53% 58% 71% 82%
only personally suscribed 40% 33% 47% 28% 44% 50% 32% 74% 26% 31% 42% 32%
professional + personal 15% 8% 13% 20% 5% 12% 7% 13% 15% 14% 21% 34%
only provided by the employer 9% 10% 11% 18% 4% 5% 6% 1% 13% 13% 8% 16%
Having no PERSONAL life insurance
because they:
Do not know 1% 1% 2% 1% 0% 0% 1% 1% 1% 1% 1% 1%
Do not have any 45% 59% 38% 51% 51% 38% 60% 12% 59% 54% 37% 33%
Personal life insurance (sample size) 55% 41% 60% 48% 49% 62% 39% 87% 41% 45% 63% 66%
Know exactly the amount (lump sum) 55% 84% 29% 27% 54% 53% 30% 62% 48% 60% 54% 77%
Know only an approximate amount (lump
sum) 26% 10% 42% 49% 28% 35% 47% 18% 27% 29% 23% 10%
Do not know the amount (lump sum) 11% 3% 19% 17% 10% 4% 16% 12% 23% 11% 15% 2%
Refuse to give the amount (lump sum) 7% 3% 9% 8% 8% 7% 5% 7% 2% 0% 5% 11%
Only periodic payment 1% 0% 1% 0% 0% 1% 1% 1% 0% 0% 3% 0%
Life insurance provided by the employer
(sample size)24% 18% 24% 38% 9% 17% 13% 14% 28% 29% 50%
Know exactly the amount (lump sum) 49% 65% 26% 23% 59% 52% 20% 39% 47% 58% 78%
Know only an approximate amount (lump
sum) 25% 26% 29% 37% 26% 31% 48% 8% 25% 18% 12%
Do not know the amount (lump sum) 18% 6% 36% 35% 6% 13% 18% 35% 21% 13% 3%
Refuse to give the amount (lump sum) 7% 3% 8% 4% 9% 3% 12% 16% 5% 4% 7%
Only periodic payment 2% 0% 1% 1% 0% 2% 2% 2% 1% 8% 0%

AXA Equitable Protection Report –December 2007 - 44
13%
29%
1%
1%
1%
2%
2%
2%
3%
3%
4%
5%
18%
26%
Don't know
Other
Too complicated
No insurance company propose it
No insurance company approached me
Having assets to cover it instead
Do not feel concerned about it yet
Never thought about it
Do not know the products
I don't care / it's a waste of money
Do not need it
Having no dependants
Too expensive
Having life insurance provided by my company
Base : n= 121
Q16: Why have you not taken out any INDIVIDUAL LIFE INSURANCE?
Reasons for not purchasing life insuranceAmong those who have not purchased individual life insurance on their own, the most common reason for not purchasing it was having life insurance provided by their employer (26%). The second most common reason was that they felt it was too expensive (18%).
AXA Equitable Protection Report –December 2007 - 45
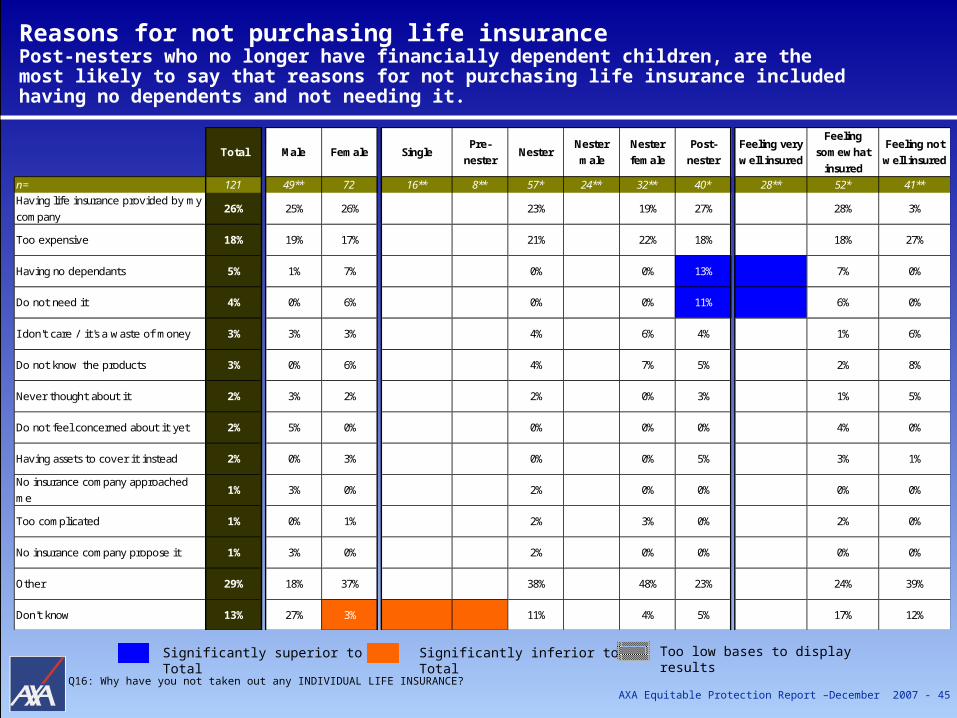
Reasons for not purchasing life insurancePost-nesters who no longer have financially dependent children, are the most likely to say that reasons for not purchasing life insurance included having no dependents and not needing it.
Q16: Why have you not taken out any INDIVIDUAL LIFE INSURANCE?
Total Male Female SinglePre-
nesterNester
Nester
male
Nester
female
Post-
nester
Feeling very
well insured
Feeling
somewhat
insured
Feeling not
well insured
n= 121 49** 72 16** 8** 57* 24** 32** 40* 28** 52* 41**Having life insurance provided by my
company26% 25% 26% 23% 19% 27% 28% 3%
Too expensive 18% 19% 17% 21% 22% 18% 18% 27%
Having no dependants 5% 1% 7% 0% 0% 13% 7% 0%
Do not need it 4% 0% 6% 0% 0% 11% 6% 0%
I don't care / it's a waste of money 3% 3% 3% 4% 6% 4% 1% 6%
Do not know the products 3% 0% 6% 4% 7% 5% 2% 8%
Never thought about it 2% 3% 2% 2% 0% 3% 1% 5%
Do not feel concerned about it yet 2% 5% 0% 0% 0% 0% 4% 0%
Having assets to cover it instead 2% 0% 3% 0% 0% 5% 3% 1%
No insurance company approached
me1% 3% 0% 2% 0% 0% 0% 0%
Too complicated 1% 0% 1% 2% 3% 0% 2% 0%
No insurance company propose it 1% 3% 0% 2% 0% 0% 0% 0%
Other 29% 18% 37% 38% 48% 23% 24% 39%
Don't know 13% 27% 3% 11% 4% 5% 17% 12%
Significantly inferior to TotalSignificantly superior to Total Too low bases to display results

AXA Equitable Protection Report –December 2007 - 46
Reasons for not purchasing life insurance People in the U.S. who have not purchased individual life insurance are more likely than those in other countries to say they did not purchase it because their employer provides life insurance. They are less likely than those in other countries to say their reasons included that they did not need it, that they had never thought of it, or that they do not feel concerned about it yet.
Significantly superior to Total Significantly inferior to Total
Q16: Why have you not taken out any INDIVIDUAL LIFE INSURANCE?
TOTAL USA Australia Belgium France Germany Hong Kong Italy Japan Spain Switzerland UK
n= 1824 121 216 144 187 190 139 236 45* 214 197 135
Do not need it 22% 4% 23% 20% 21% 23% 22% 17% 31% 22% 34% 21%
Too expensive 20% 18% 27% 11% 16% 26% 16% 28% 29% 14% 16% 23%
Never thought about it 19% 2% 12% 18% 25% 10% 25% 36% 9% 31% 16% 10%
Having life insurance provided by my company
10% 26% 7% 19% 15% 6% 3% 5% 2% 12% 4% 9%
Do not feel concerned about it yet 9% 2% 5% 6% 20% 10% 4% 11% 20% 6% 8% 11%
I don't care / it's a waste of money 7% 3% 7% 5% 9% 7% 11% 8% 13% 6% 4% 7%
Having life insurance linked to a mortgage 3% 0% * 9% 3% 3% 1% 1% 4% 5% 1% 6%
Do not know the products 3% 3% 2% 3% 2% 5% 2% 6% 9% 2% 3% 2%
Having assets to cover it instead 3% 2% 4% 5% 2% 6% 1% 0% 7% 1% 5% 4%
Having no dependants 3% 5% 4% 6% 3% 3% 1% 1% 4% 0% 4% 7%
Too complicated 2% 1% 0% 1% 2% 3% 1% 3% 9% 1% 1% 2%
Covered by the government 2% 0% 0% 2% 1% 4% 2% 0% 2% 5% 2% 1%
No insurance company propose it 1% 1% 0% 1% 1% 2% 0% 0% 2% 1% 0% 0%
Other 15% 29% 7% 18% 12% 22% 24% 2% 31% 14% 15% 13%
Don't know 4% 13% 4% 8% 2% 7% 2% 0% 0% 2% 6% 4%

AXA Equitable Protection Report –December 2007 - 47
Reasons for purchasing disability insuranceThe most common reasons for Americans purchasing disability insurance are to protect their families or themselves and to have peace of mind.
TEMPORARY disability insurance
PERMANENT disability insurance
0%
0%
7%
27%
30%
55%
60%
Don't know
None of the reasons
Recommended by a professional adviser
Preserve your standard of living, thestandard of living of your family
Avoid dipping into your savings
Protect your family or yourself
Have peace of mind
0%
0%
2%
11%
11%
29%
54%
70%
Don't know
None of the reasons
Bought it with a mortgage
Avoid dipping into your savings
Recommended by a professional adviser
Preserve your standard of living, thestandard of living of your family
Have peace of mind
Protect your family or yourself
Base : n= 40* Base : n= 37*
Q18a: You told me that you have personally taken out a TEMPORARY disability insurance what were the main reasons for taking this out? Q18b: You told me that you have personally taken out a PERMANENT disability insurance what were the main reasons for taking this out?

AXA Equitable Protection Report –December 2007 - 48
Reasons for not purchasing individual disability insuranceFor those who have not purchased individual disabilty insurance, the most common reason is that they had this insurance through their employers. Other reasons included it being too expensive or that they had never thought about it.
Q17: Why have you not taken out any disability insurance?
10%
20%
2%
2%
2%
3%
5%
12%
14%
34%
Don't know
Other
Don't feel concerned about it yet
Having assets to cover it instead
Don't care / waste of money
Do not know the products
I don't need it
I have never thought about it
Too expensive
Having disability insurance provided by my company
Base : n= 183

AXA Equitable Protection Report –December 2007 - 49
Reasons for not purchasing individual disability insuranceFor those who feel very well insured but have not purchased individual disability insurance, the most common reason is that their employer provides this insurance.
Q17: Why have you not taken out any disability insurance?
Total Male Female SinglePre-
nesterNester
Nester male
Nester female
Post-nester
Feeling very well insured
Feeling somewhat
insured
Feeling not well insured
n= 183 94* 89 22** 18** 96 51* 45* 46* 75 81* 27**Having disability insurance provided by my company
34% 34% 34% 33% 34% 31% 41% 53% 27%
Too expensive 14% 17% 12% 14% 13% 15% 17% 4% 20%
Never thought about it 12% 16% 8% 11% 12% 10% 4% 7% 20%
Do not need it 5% 1% 10% 4% 0% 8% 11% 9% 4%
Do not know the products 3% 5% 1% 5% 7% 2% 0% 0% 2%
I don't care / it's a waste of money 2% 3% 1% 0% 0% 0% 6% 1% 2%
Do not feel concerned about it yet 2% 1% 4% 3% 3% 4% 3% 2% 4%
Having assets to cover it instead 2% 3% 1% 2% 4% 0% 4% 2% 2%
Too complicated 1% 1% 1% 2% 3% 2% 0% 0% 3%
Covered by the government 1% 1% 1% 1% 1% 0% 3% 1% 1%
No insurance company approached me
1% 0% 2% 1% 0% 2% 1% 0% 1%
Other 20% 17% 23% 21% 21% 21% 14% 16% 25%
Don't know 10% 8% 12% 13% 13% 12% 5% 6% 7%
Significantly inferior to TotalSignificantly superior to Total Too low bases to display results
AXA Equitable Protection Report –December 2007 - 50
Part 4: Theoretical Insurance Gap
In order to allow for international comparison, a common Gap formula was designed to be applicable for all respondents

AXA Equitable Protection Report –December 2007 - 51
Determining the amount of household death coverage needed = "Pure Need "
Number of dependant: for each dependant child: 1for each dependant adults (except spouse/partner): 1
Capital Needs Income Needs
Income Multiple (depending on
personal situation)
Current Annual Gross Household Income x
Uninsured Household Debt
(Mortgage, Student Loans, Consumer
Loans, Other)
+=
Amount of Coverage Needed =
1
1
1
1
Single, No dependants
3 + 2 * Number of dependants361+
4 + 2 * Number of dependants451-60
5 + 2 * Number of dependants541-50
6 + 2 * Number of dependants6Under 40
With Dependants (regardless of marital status)
Married or Partnered, No Dependants
Age
(if married or partnered, use age of younger spouse)
1
1
1
1
Single, No Dependants
3 + 2 * Number of Dependants361+
4 + 2 * Number of Dependants451-60
5 + 2 * Number of Dependants541-50
6 + 2 * Number of Dependants6Under 40
With Dependants (regardless of marital status)
Married or Partnered, No Dependants
Age
(if married or partnered, use age of younger spouse)
+=

AXA Equitable Protection Report –December 2007 - 52
Determining the amount of the gap in death coverage
Existing Household Life Insurance+
Other Household Liquid Assets (obtained from survey responses)
Amount of Household Coverage Needed (“Pure Need”)
as per previous slide
Gap In Household Coverage =
-=

AXA Equitable Protection Report –December 2007 - 53
Based on input from Survey respondents
Personal Situation:•Age (of both spouses)
•Single or Married/Partnered
• Number of Dependants
Current Annual Gross Household Income
Bracket
Uninsured Household Debt Bracket
(Includes Mortgage, Student Loans, Consumer
Loans, Other)
Other Household Liquid Assets Available
(Bracket)
Existing Household Life Insurance Coverage
(Bracket)

AXA Equitable Protection Report –December 2007 - 54
Explanation of Insurance Gap
AMOUNT OF UNINSURED
HOUSEHOLD DEBT / LOAN
CURRENT ANNUAL GROSS INCOME *
(HOUSEHOLD)+ X
NUMBER OF DEPENDANT
MULTIPLIER **=
COVERAGE NEED
-
LIFE INSURANCE,
EXISTING COVERAGE +
= INSURANCE GAP
Which implies that:
A positive insurance gap means that the respondent is “under equipped” in terms of protection products and or in terms of available assets and it is under insuring his or her need.
A negative or zero value means that there is no insurance gap: the respondent has chosen for more than the minimum coverage (as it is always possible in life coverage) or has enough liquid assets, or both.
COVERAGE NEED
( )
LIQUID ASSETS+( )
The insurance is calculated as follows:
* Where people are used to evaluate in net monthly income:For USA: we apply the following formula: net estimation of the respondent * 12 months
** Cf definition from table of page 57

AXA Equitable Protection Report –December 2007 - 55-1 000 000
-500 000
0
500 000
1 000 000
1 500 000
Mean: - 271,928 US$ 81,632 US$ 299,647 US$ 754,740 US$
No Gap 1st tercile = Gap +
2nd tercile = Gap ++
3rd tercile = Gap +++
Calculated Insurance GapThe gap could be calculated for 213 people surveyed, or 59% of interviewees
Have an insurance
gap69%
No insurance gap31%
AXA Equitable Protection Report –December 2007 - 56
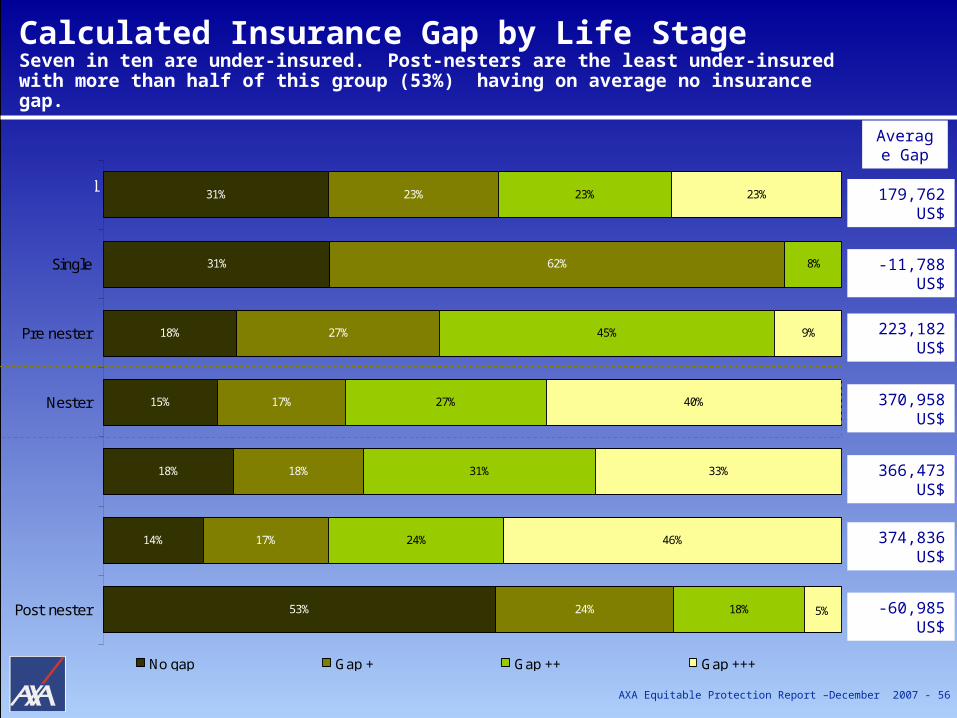
Calculated Insurance Gap by Life StageSeven in ten are under-insured. Post-nesters are the least under-insured with more than half of this group (53%) having on average no insurance gap.
179,762 US$
-11,788 US$
223,182 US$
366,473 US$
374,836 US$
-60,985 US$
370,958 US$
Average Gap
53%
14%
18%
15%
18%
31%
31%
24%
17%
18%
17%
27%
62%
23%
18%
24%
31%
27%
45%
8%
23%
46%
33%
40%
9%
5%
23%
Post nester
Nester
Pre nester
Single
No gap Gap + Gap ++ Gap +++
Total
Nester female
Nester male

AXA Equitable Protection Report –December 2007 - 57
Calculated Insurance Gap by Life Stage
-1 000 000
-500 000
0
500 000
1 000 000
1 500 000
Singlen= 13*
-1 000 000
-500 000
0
500 000
1 000 000
1 500 000
Pre-Nestern= 11*
-1 000 000
-500 000
0
500 000
1 000 000
1 500 000
Nestern= 110
-1 500 000
-1 000 000
-500 000
0
500 000
1 000 000
1 500 000
Post-Nestern= 79

AXA Equitable Protection Report –December 2007 - 58
Composition of Insurance Gap GroupsThe group with no insurance gap is comprised primarily of post-nesters who no longer have dependent children. The group with the widest gap is comprised primarily of nesters, who do have financially dependent children.
-271,928 US$
81,632 US$
299,647 US$
754,740 US$
Average Gap
2%
16%
6%
90%
60%
39%
26%
2%
10%
6%
3%
8%
28%
39%
65%
Gap +++
Gap ++
Gap +
No gap
Single Nester Pre nester Post nester

AXA Equitable Protection Report –December 2007 - 59
Calculated insurance gap vs feeling of being well insured or notPeople who feel they are not well insured have the largest insurance gap, averaging a gap of $214,000…
Average Gap
164,801 US$
181,812 US$
214,416 US$
179,762 US$
12%
33%
36%
31%
34%
21%
21%
23%
38%
23%
18%
23%
16%
23%
25%
23%
Not well + Not at all insured
Somewhat insured
Very well insured
Total
No gap Gap + Gap ++ Gap +++

AXA Equitable Protection Report –December 2007 - 60
Calculated insurance gap vs feeling of being well insured or not… But a lot of people feeling very well insured have an important insurance gap.
-271,928 US$
81,632 US$
299,647 US$
754,740 US$
Average Gap
10%
24%
22%
6%
45%
44%
41%
46%
45%
32%
37%
48%
Gap +++
Gap ++
Gap +
No gap
Not well + Not at all insured Somewhat insured Very well insured

AXA Equitable Protection Report –December 2007 - 61
The Calculated Insurance GapThree countries with quite a large proportion of people showing a gap: Belgium, Hong Kong and Switzerland
15%
15%
20%
23%
25%
28%
29%
29%
31%
36%
24%
86%
85%
85%
80%
77%
75%
72%
71%
71%
69%
64%
76%
14%Belgium (178)
Switzerland (227)
Hong Kong (156)
Germany (191)
Japan (156)
France (227)
Italy (169)
UK (178)
Spain (191)
USA (225)
Australia (225)
Total (2241)
Having no Gap Having a Gap

AXA Equitable Protection Report –December 2007 - 62
Overall analysis for the Gap
On average, Americans 25 to 65 years of age have an insurance gap of $179,762, though the size of that gap varies across life stages.
Nesters, who have dependent children, have on average the highest gap ($370,958) while post-nesters have none on average.

AXA Equitable Protection Report –December 2007 - 63
Part 5: Conclusions

AXA Equitable Protection Report –December 2007 - 64
Key Findings in America
A. There is a serious lack of knowledge regarding financial coverage needs in case of death.
B. There is still an high level of underinsurance on individual’s most precious assets: life. Close to 70 percent of Americans have an insurance gap (which compares favorably to the survey average of 76 percent), and it averages an amount of $180,000 or 127.000 € which is somewhat lower than the survey average of 150,000 €
C. The level of underinsurance is particularly high among the most needing segment, i.e. the nesters with an average gap of $371,000.
D. A dissonance was observed between feeling and being actually very well covered, as still 64 percent of those claiming to feel very well insured do have an insurance gap.

AXA Equitable Protection Report –December 2007 - 65
Appendices
Statistical differences rules
Details about Gap profiles
Details about Gap calculation elements

AXA Equitable Protection Report –December 2007 - 66
Analysis of information
Brackets evaluation: all amounts or percentages will be presented in a range of brackets; in order to determine the values of the brackets we apply the following rules:
for the smallest bracket we took 0.75 of the bracket value (e.g. “Less than 25,000” bracket was evaluated at 18,750)
for the highest bracket we took 1.5 of the bracket value (e.g. “More than 1,000,000” was evaluated at 1,500,000)
for all other brackets we took the average (e.g. “From 25,000 to 50,000” was evaluated at 37,500)
Minimum bases: base between 30 and 59 was analyzed with caution. It is presented as
follows (n= 35*). base under 29 was not analyzed because it was too low. It is presented
as follows (n= 25**).
Significances are calculated with a 10 percent risk level.

AXA Equitable Protection Report –December 2007 - 67
Appendix: Gap descriptionThose with the largest insurance gap have higher gross income than do Americans with lower or no gaps.
In terms of Annual Gross Income
Total NO GAP GAP + GAP ++ GAP +++
n= 225 58* 53* 56* 58*
Under $25,000 10% 13% 25% 5% 0%$25,000 to 50,000 22% 25% 20% 41% 2%$50,000 to 75,000 32% 28% 35% 35% 30%$75,000 to 100,000 16% 14% 15% 11% 23%$100,000 to 150,000 14% 13% 5% 8% 30%$150,000 to 250,000 5% 7% 0% 0% 13%$250,000 to 500,000 1% 1% 0% 0% 2%More than $500,000 0% 0% 0% 0% 0%
In terms of Debts / Loans insured / not insured
Total NO GAP GAP + GAP ++ GAP +++
n= 225 58* 53* 56* 58*
Yes, having loans all insured 37% 42% 38% 38% 32%Yes, having loans not insured 36% 27% 18% 41% 56%No, having no loan 22% 30% 34% 17% 6%
Don't know 5% 1% 10% 4% 6%
Significantly superior to Total Significantly inferior to Total

AXA Equitable Protection Report –December 2007 - 68
Appendix: Gap descriptionSimilarly, that high insurance gap group has higher levels of assets.
In terms of Available assets…
Total NO GAP GAP + GAP ++ GAP +++
n= 218 57* 52* 53* 56*
No assets 2% 0% 3% 3% 3%
Less than $25,000 21% 12% 31% 29% 14%
$25,000 to 50,000 8% 7% 14% 7% 5%
$50,001 to 100,000 15% 6% 13% 29% 14%
$100,001 to 250,000 29% 33% 22% 16% 44%
$250,001 to 500,000 17% 20% 16% 14% 18%
Significantly superior to Total Significantly inferior to Total

AXA Equitable Protection Report –December 2007 - 69
Total NO GAP GAP + GAP ++ GAP +++
n= 225 58* 53* 56* 58*
Frequently 23% 13% 26% 33% 19%
Occasionally 54% 59% 46% 52% 58%
Rarely 17% 25% 20% 11% 12%
Never 6% 3% 8% 5% 10%
n= 211 57* 48* 54* 52*
Your children 97% 96% 98% 97% 99%
Your partner 98% 95% 100% 100% 99%
Yourself 55% 48% 63% 56% 55%
Your previous partner* 31%
Other people 60% 47% 83% 48% 67%
n= 211 57* 48* 54* 52*
Death 85% 80% 93% 80% 87%
Financial hardship 83% 75% 88% 87% 85%
Permanent disability 70% 69% 72% 66% 74%
Temporary disability 66% 68% 64% 62% 68%
Downsizing your standard of
living56% 65% 60% 51% 47%
Appendix: Gap descriptionThose who have the highest gap seem to speak the least to professionals
Total NO GAP GAP + GAP ++ GAP +++
n= 225 58* 53* 56* 58*
Your partner* 86% 88% 76% 93% 88%
Your family 67% 69% 65% 60% 74%
An insurance agent / broker 48% 56% 37% 48% 51%
Your friends 48% 45% 51% 43% 52%
A financial advisor 27% 41% 17% 17% 32%
A notary / solicitor 25% 34% 22% 22% 22%
A tax advisor or accountant 15% 27% 13% 10% 10%
None 17% 15% 22% 20% 11%
With whom do they talk of Life risks…
Base too low to display resultsSignificantly superior to Total Significantly inferior to Total
* only asked to people living as a couple
Q5: Generally speaking, how much have you thought about the consequences of life risks? By “life risks” we mean serious illness, disability, death, long-term unemployment, serious car accidents, etc....Q6: When you think about the consequences of life risks, do you think about their impact on …?Q8: Which of the following consequences of life risks have you already thought about? Have you thought about…Q10: Have you talked about the consequences of life risks with …?
* Only asked to divroced or personv being part of a blended family

AXA Equitable Protection Report –December 2007 - 70
Total NO GAP GAP + GAP ++ GAP +++
n= 225 58* 53* 56* 58*
YES 43% 59% 30% 41% 41%NO 57% 41% 70% 59% 59%
NO, not have yet made one 34% 26% 30% 32% 49%NO, not thought about it 12% 6% 16% 19% 6%NO, not concerning you yet 8% 7% 16% 4% 5%NO, not legally necessary 0% 0% 2% 0% 0%NO, not a very pleasant thought 3% 2% 6% 4% 0%
Total NO GAP GAP + GAP ++ GAP +++
n= 225 58* 53* 56* 58*
YES 70% 60% 74% 72% 73%NO 30% 40% 26% 28% 27%
Appendix: Gap description
Total NO GAP GAP + GAP ++ GAP +++
n= 225 58* 53* 56* 58*
Highly aware of life accidents, and hate taking risks
25% 22% 11% 31% 35%
No point in thinking about risks
27% 30% 33% 24% 23%
Aware of life accidents, but do not think about it
28% 16% 35% 32% 29%
I believe in taking risks 7% 13% 7% 6% 3%Not like to think about risks
8% 8% 12% 7% 4%
None of these 5% 11% 2% 1% 6%
Attitudes towards Life risks….
Significantly superior to Total Significantly inferior to Total
Having made a will / Why not?
Family support in case of life risk experience
Q43: I am going to read you five attitudes towards risks. Which one describes the best your attitude towards risks?
Q59: Have you made a will?Q37: If you were to experience a serious life risk, do you believe that you would be financially supported by your family or your relatives?

AXA Equitable Protection Report –December 2007 - 71
Appendix: Gap description
Total NO GAP GAP + GAP ++ GAP +++
n= 225 58* 53* 56* 58*
Protect your family / relatives 69% 64% 67% 64% 79%
Give you peace of mind 65% 59% 66% 59% 77%Are a necessary evil 48% 52% 42% 45% 53%Protect your financial assets 52% 50% 48% 44% 65%Are a waste of money / useless
10% 4% 16% 18% 4%
None of these 1% 0% 3% 2% 1%Don't know 0% 0% 0% 0% 0%
Feeling about protection insurance products…?
Significantly superior to Total Significantly inferior to Total
Q3: Now, if we speak about insurance products designed to protect against “life risks”, such as: serious illness, disability, death, serious car accidents, etc.... Would you say that such insurance products…

AXA Equitable Protection Report –December 2007 - 72
Appendix: Gap description
Total NO GAP GAP + GAP ++ GAP +++
n= 225 58* 53* 56* 58*
Life insurance 80% 92% 70% 74% 83%Health, medical, hospitalisation insurance
78% 86% 61% 87% 77%
Temporary disability insurance 50% 57% 41% 50% 52%
Permanent disability insurance 44% 55% 25% 43% 50%
Long term care insurance 24% 32% 16% 29% 17%
Average number of product owned
2.9 3.2 2.1 2.8 2.8
Product ownership (provided by the employer and/or personally subscribed)
Individual product ownership
Total NO GAP GAP + GAP ++ GAP +++
n= 225 58* 53* 56* 58*
Life insurance 65% 71% 65% 55% 68%
Health, medical, hospitalisation insurance
43% 40% 41% 56% 36%
Temporary disability insurance 20% 18% 13% 23% 24%
Permanent disability insurance 18% 17% 11% 19% 25%
Long term care insurance 10% 14% 9% 10% 6%
Average number of product individually owned
1.6 1.6 1.4 1.6 1.6
Q11: I am now going to read you a list of insurance products. Please tell me the ones your employer has taken out for you? Q14: Apart from the ones maybe provided by your company, have you personally taken out any of the following insurance products? Have you PERSONALLY taken out …Q15:I am now going to read you a list of insurance products. Please tell me the ones you have taken out personally? Have you PERSONALLY taken out…

AXA Equitable Protection Report –December 2007 - 73
Appendix: Gap description
Reasons for not purchasing life insurance
T68Total NO GAP GAP +
GAP ++ /
GAP +++
n= 79 17** 18** 44**
Having life insurance provided by my
company22% 20%
Too expensive 22% 23%
Having no dependants 2% 0%
Do not need it 3% 0%
Do not care / it's a waste of money 4% 4%
Do not know the products 3% 5%
Never thought about it 3% 4%
Do not feel concerned about it yet 3% 0%
Having assets to cover it instead 1% 0%
Too complicated 1% 2%
No insurance company propose it 0% 0%
No insurance company approached me 0% 0%
Don't know 12% 14%
Other 31% 33%
Too low bases to display results
Q16: Why have you not taken out any INDIVIDUAL LIFE INSURANCE?

AXA Equitable Protection Report –December 2007 - 74
Appendix: Gap description
The 2 main reasons
Total NO GAP GAP + GAP ++ GAP +++
n= 145 41* 34** 31** 39**
Protect your family or yourself 78% 77% 70% 89% 76%Have peace of mind 32% 27% 35% 32% 34%Preserve your standard of living, the standard of living of your family
35% 37% 24% 39% 40%
Recommended by a professional adviser
10% 9% 5% 12% 14%
Bought it with a mortgage 11% 8% 6% 14% 17%Avoid dipping into your savings 5% 5% 9% 5% 1%None of the reasons 5% 7% 12% 0% 0%Don't know 0% 0% 0% 0% 0% The first trigger to purchase an
individual life insurance policy
Total NO GAP GAP + GAP ++ GAP +++
n= 145 41 34* 31* 39*
Mariage 16% 19% 1% 15% 28%First child birth 22% 18% 24% 22% 23%First job/ job promotion/ add. revenues
12% 16% 16% 12% 4%
Bought a house/ apartment 14% 4% 18% 11% 25%Advice by a professional 10% 14% 8% 7% 11%Event among loved ones 5% 5% 12% 2% 0%Serious personal illness 5% 4% 5% 14% 0%None of these reasons 14% 19% 13% 14% 9%Don't know 1% 0% 3% 3% 0%
Q18: You told me that you have personally taken out a life insurance what were the main reasons for taking this out?Q19: Do you remember what led you to take-out your first individual life insurance? Was it?

AXA Equitable Protection Report –December 2007 - 75
Appendix: Gap description
Total NO GAP GAP +GAP ++ / GAP +++
n= 145 41* 34** 70*
A precise evaluation of your financial needs
64%58% 66% 66%
The amount of the premium 46% 33% 45% 55%A recommendation from an advisor 37% 34% 45% 35%The amount of your debts 28% 34% 22% 28%The default level of cover provided by the policy 25% 14% 34% 27%
Criteria of choice for Life insurance
Q25: Did you decide on your life insurance cover according to?

AXA Equitable Protection Report –December 2007 - 76
No74%Yes
26%
Married, living in
a couple
69%
Widowed
4%
Single, living
alone
14%
Divorced
8%
Single, living with
parents
5%
1%
0%
3%
18%
78%
20 years or more
15 - 20 years
10 - 15 years
5 - 10 years
5 years or less
Household status for the Gap formula - Marital Status
Age difference with the partner
Blended family
Base : n= 248
Base : n= 360
Base : n= 248
QC: Are you….?QE: Are you part of a blended family, meaning you or your partner has children from a previous unionQF: What is the age of your partner…?
Marital status
Average ag difference: 3.7 years

AXA Equitable Protection Report –December 2007 - 77
50%
10%
0%
30%
Other people
Your partner's
parents
Both of your parents
One of your parents
None
44% At least one child
and no adult
46%
At least one adult
and no child
3%
At least one child
and one adult
7%
2%
27%
46%
41%
41%
More than 25y.o.
From 18 to 25y.o.
From 11 to 17y.o.
From 5 to 10 y.o.
Under 5 y.o.
Household status for the Gap formula - Dependant people
Q48: How many children financially depend on you? Q49: How many are… Q50: Among the following people, please indicate those that are financially dependant on you
Base : n= 36
At least one child
53%At least one adult
10%
Base : n= 193
Base : n= 360
0.5
0.6
0.7
0.3
0.0
Average number of children
Total 2.2
Average number of adult dependant:
1.1

AXA Equitable Protection Report –December 2007 - 78
Financials for the Gap formula - Household Income
Base : n= 360
Q62: What is the annual gross income of your household?
Base : n= 288
Average household income:
82,356$
Refusal
6%
Agree to
answer
80%Don't know
14%
0%
1%
6%
12%
13%
24%
16%
8%
More than $500,000
$250,000 to 500,000
$150,000 to 250,000
$100,000 to 150,000
$75,000 to 100,000
$50,000 to 75,000
$25,000 to 50,000
Under $25,000
Annual gross income

AXA Equitable Protection Report –December 2007 - 79
Refusal
14%
No assets
2%
On bracket
38%
Spontaneous
36%
Don't know
7%
3%
6%
17%
28%
15%
9%
20%
2%
More than $1 Million
$500,001 to 1,000,000
$250,001 to 500,000
$100,001 to 250,000
$50,001 to 100,000
$25,000 to 50,000
Less than $25,000
No assets
Financials for the Gap formula – Available Household Assets
Base : n= 360
Base : n= 237
Average household assets: $ 217,003
Q38: Do you know, even approximately, the total amount of your household available assets (stocks, shares, financial investments, life insurance…)?Q39: Can you give me your best estimate of the amount of your available assets?Q40: Would you estimate that this amount is…?
Estimation of available assets Amount of available assets

AXA Equitable Protection Report –December 2007 - 80
Having loans ALL
insured
36%
Having no loan at
all
26%
Having loans NOT
insured
34%
Financials for the Gap formula - Debts / Loans
Q51: Do you have any loans, for example, property loans, consumer credit, student loans or any other loans? Q52: And are all these loans insured in case of your death or disability?Q53: Do you know, even if only approximately, the amount that you still have to pay back for the loans / credits which are not insured in case of your death or disability? Q54/55: Would you estimate that this amount is…?
Base : n= 360
Total Male Female SinglePre-
nesterNester
Nester male
Nester female
Post-nester
Feeling very well insured
Feeling somewhat
insured
Feeling not well
insured
n= 360 172 188 27** 29** 193 95* 98 112 156 146 58*
Having loans ALL insured 36% 34% 38% 43% 42% 44% 30% 49% 32% 10%
Having loans NOT insured 34% 36% 32% 39% 43% 35% 24% 25% 41% 37%
Having no loan at all 26% 27% 24% 13% 11% 15% 43% 21% 23% 44%
Significantly superior to Total Significantly inferior to Total
Insured loans

AXA Equitable Protection Report –December 2007 - 81
Financials for the Gap formula - Debts / Loans
Q51: Do you have any loans, for example, property loans, consumer credit, student loans or any other loans? Q52: And are all these loans insured in case of your death or disability?Q53: Do you know, even if only approximately, the amount that you still have to pay back for the loans / credits which are not insured in case of your death or disability? Q54/55: Would you estimate that this amount is…?
TOTAL USA Australia Belgium France Germany Hong Kong Italy Japan Spain Switzerland UK
n= 4009 360 362 360 360 370 367 390 360 360 360 360
Yes, having loans all insured 34% 36% 32% 52% 53% 34% 11% 23% 16% 50% 29% 44%
Yes, having loans not insured 15% 34% 23% 5% 5% 10% 15% 8% 14% 7% 20% 20%
No, having no loan 50% 26% 41% 43% 42% 56% 74% 68% 70% 43% 51% 36%
Significantly superior to Total Significantly inferior to Total

AXA Equitable Protection Report –December 2007 - 82
Financials for the Gap formula - Average amount of loans not insured
4%
7%
0%
0%
5%
18%
17%
12%
38%
Don't know
Refusal
More than $1 Million
$500,001 to 1,000,000
$250,001 to 500,000
$100,001 to 250,000
$50,001 to 100,000
$25,000 to 50,000
Less than $25,000
Base : n= 122
Average amount of loans not insured: $ 84,483
Q54/55: Would you estimate that this amount is…?
Significantly inferior to TotalSignificantly superior to Total Base too low to display results
Total Male Female SinglePre-
nesterNester
Nester male
Nester female
Post-nester
Feeling very well
insured
Feeling somewh
at insured
Feeling not well insured
n= 122 62* 59* 9** 11** 75* 41** 35** 27* 39* 61* 22**Less than $25,000 38% 36% 41% 36% 35% 37% 28% 36%$25,000 to 50,000 12% 12% 13% 10% 9% 10% 15% 10%$50,001 to 100,000 17% 24% 10% 15% 19% 10% 13% 25%$100,001 to 250,000 18% 12% 24% 23% 16% 30% 22% 20%$250,001 to 500,000 5% 8% 1% 7% 12% 0% 9% 3%$500,001 to 1,000,000 0% 0% 0% 0% 0% 0% 0% 0%More than $1 Million 0% 0% 0% 0% 0% 0% 0% 0%Refusal 7% 4% 9% 5% 2% 8% 11% 3%Don't know 4% 5% 3% 6% 6% 5% 2% 2%
Average amount of loan not insured $84 483 $92 806 $75 745 $100 989 $116 785 $82 728 $110 097 $85 761


