
1
BAE SYSTEMS Presentation
6 March 2006
2
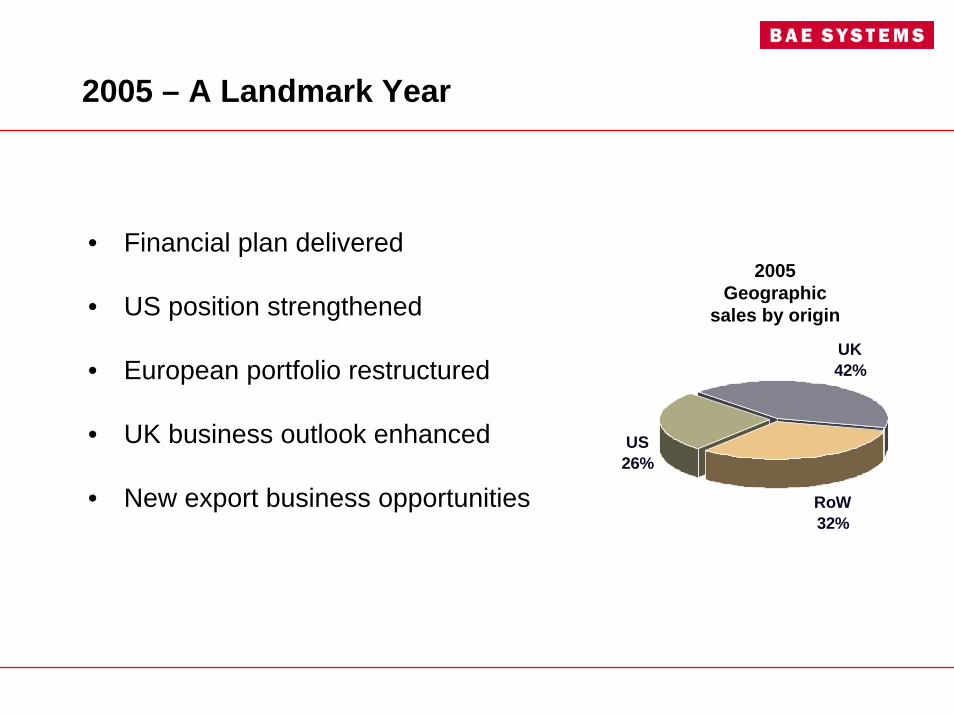
2005 – A Landmark Year
• Financial plan delivered
• US position strengthened
• European portfolio restructured
• UK business outlook enhanced
• New export business opportunities RoW32%
US26%
UK42%
2005 Geographic
sales by origin

3
Financial Performance
18%18%
12%
21% 23%
8%
2005 Sales
2005 EBITA
• Good project execution
• Improved terms of trade
• Acquisitions successfully integrated
• All sectors delivering 11%35%
9%27%
3%
15%
Electronics, Intelligence & SupportLand & ArmamentsProgrammesCustomer Solutions & SupportIntegrated Systems & PartnershipsCommercial Aerospace
A strong portfolio of performing businesses
*
*
* Includes United Defense from 24 June 05

4
Delivering the US strategy
0
1000
2000
3000
4000
5000
6000
7000
8000
9000
2000 2001 2002 2003 2004 2005
• Successful acquisition record– 13 US businesses integrated since 2000
• Good organic growth– 7% in 2005
• United Defense– Delivering global land strategy
US Sales growthUS Sales growth
$ UDI
BAE Systems is the 7th largest US defense supplier

5
US market environment
• Quadrennial Defense Review– Defence investment priorities reaffirmed– No big surprises
• 2007 budget allocation– Good growth maintained– Land sector benefit from supplemental awards
0
100
200
300
400
500
600
2006 2007 2008 2009 2010 2011
Budget Supplementals
US Defence budget outlook
Conservative planning assumptions despite continued market growth

6
European business Portfolio
• EuroSystems – UK sensor systems and EW activities sold – AMS restructured– Integrated System Technologies formed
• Saab– Gripen marketing re-aligned– Shareholding reduced
• Atlas– Sale agreed
• MBDA – Performing well
• Airbus – Performing well – Strong order intake
7
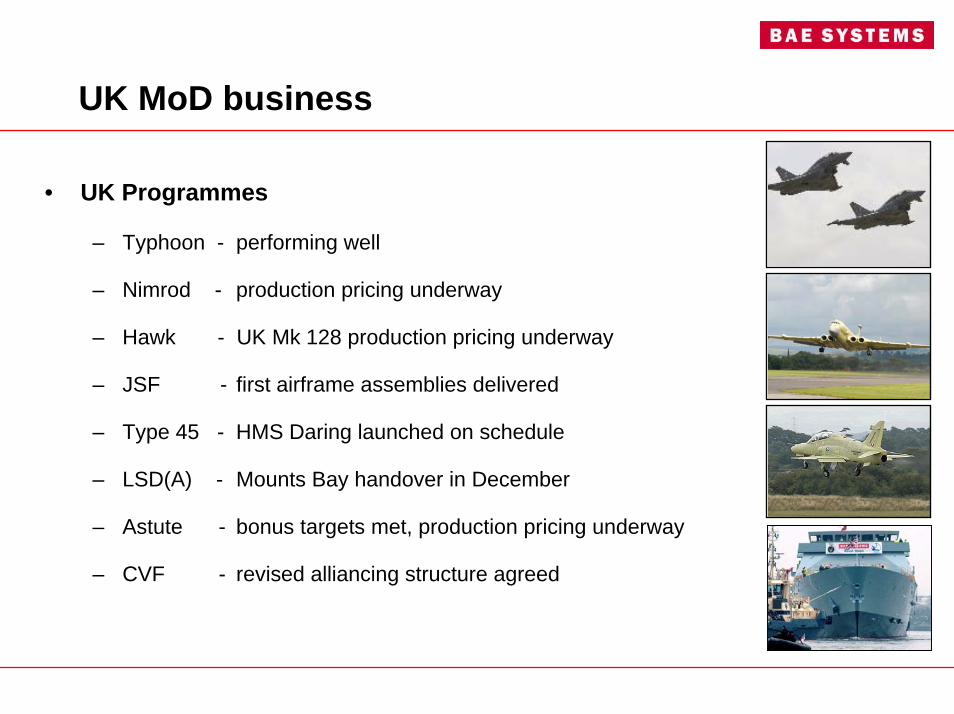
UK MoD business
• UK Programmes
– Typhoon - performing well
– Nimrod - production pricing underway
– Hawk - UK Mk 128 production pricing underway
– JSF - first airframe assemblies delivered
– Type 45 - HMS Daring launched on schedule
– LSD(A) - Mounts Bay handover in December
– Astute - bonus targets met, production pricing underway
– CVF - revised alliancing structure agreed
8
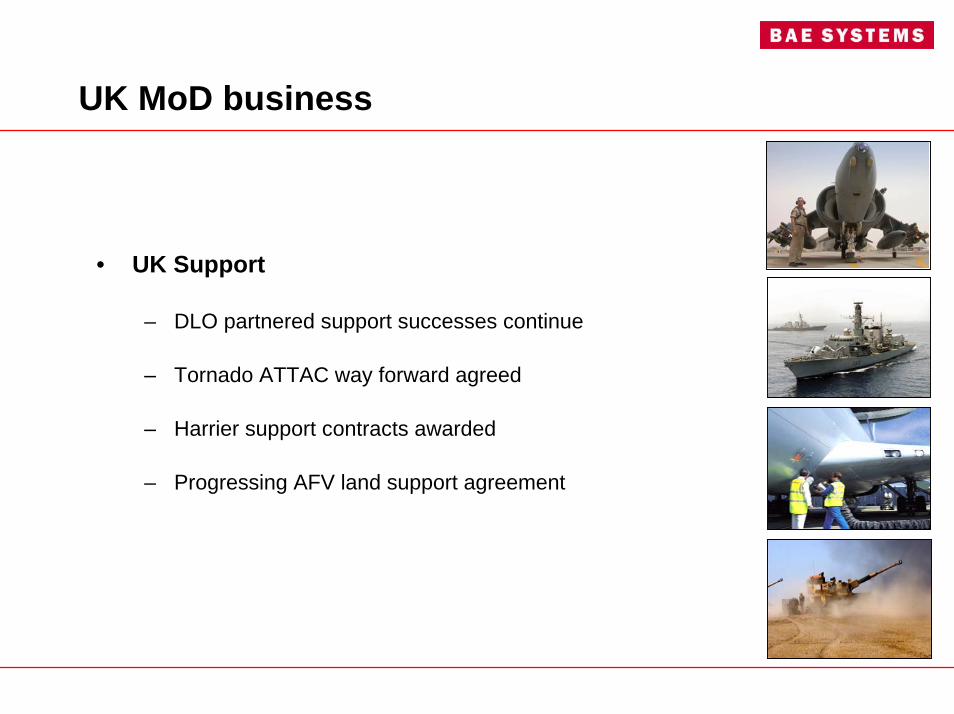
UK MoD business
• UK Support
– DLO partnered support successes continue
– Tornado ATTAC way forward agreed
– Harrier support contracts awarded
– Progressing AFV land support agreement

9
UK Defence Industrial Strategy
• Defence Industrial Strategy published in December following extensive consultation with industry
• Recognises need for partnership between industry and MoD
• Identifies key UK technologies required to deliver capability
• Recognises need for UK control of key offshore technologies
• DIS calls for more transparent dialogue between MoD and industry on investment in skills and technologies
• To align industrial capability with demand – end ‘boom & bust’
• To sustain high level system integration skills in UK
• To ensure healthy, innovative and profitable UK industry
• Primary responsibility is to support the UK’s armed forces and deliver value for money solutions

10
George Rose

11
Financial Highlights
• Sales - Continuing
• EBITA* - Continuing Underlying
• - Discontinued
• Underlying earnings per share **
• Net cash flow from operating activities
• Net debt
• Order book
• Dividend per share
£15,411m
£1,226m
£(24)m
22.5p
£2,099m
£1,277m
£59.8bn
10.3p
* Earnings before amortisation and impairment of intangible assets, finance costs and taxation.** Continuing operations, excluding amortisation of intangible assets, non-cash finance mvts and uplift in
acquired inventories

12
Income Statement - Continuing Operations
2005 Reported
2004Reported
2005Underlying
2004Underlying
15,4111,182
441,226
(215)14
(210)
(299)(2)
715
13,2221,016
61,022
(176)(24)
-(21)
(221)
(266)(1)
534
15,4111,182
(215)
(122)(262)
583
13,2221,016
(176)
(110)(273)
457
SalesEBITA *
Profit in acquired inventoriesUnderlying EBITA
Finance Costsadd back : Pension Interest
Mark to MarketPreference Dividends
Underlying Finance Costs
Amortisation/ImpairmentTaxMinority InterestsProfit
* Earnings before amortisation and impairment of intangible assets, finance costs and taxation £ millions

13
Balance Sheet
31/12/05
8,217
1,922
1,730
(4,829)
(4,101)
1,012
(7)
137
(1,277)
2,804
31/12/04
6,115
1,901
1,535
(3,884)
(3,210)
876
-
-
(668)
2,665
6,115
1,901
2,305
(3,907)
(3,210)
882
(48)
-
(951)
3,087
01/01/05
Intangible fixed assets
Tangible fixed assets
Investments
Working capital
Retirement benefit obligation
Tax assets & liabilities
Financial assets & liabilities
Assets held for resale
Net debt
Net assets
£ millions
14
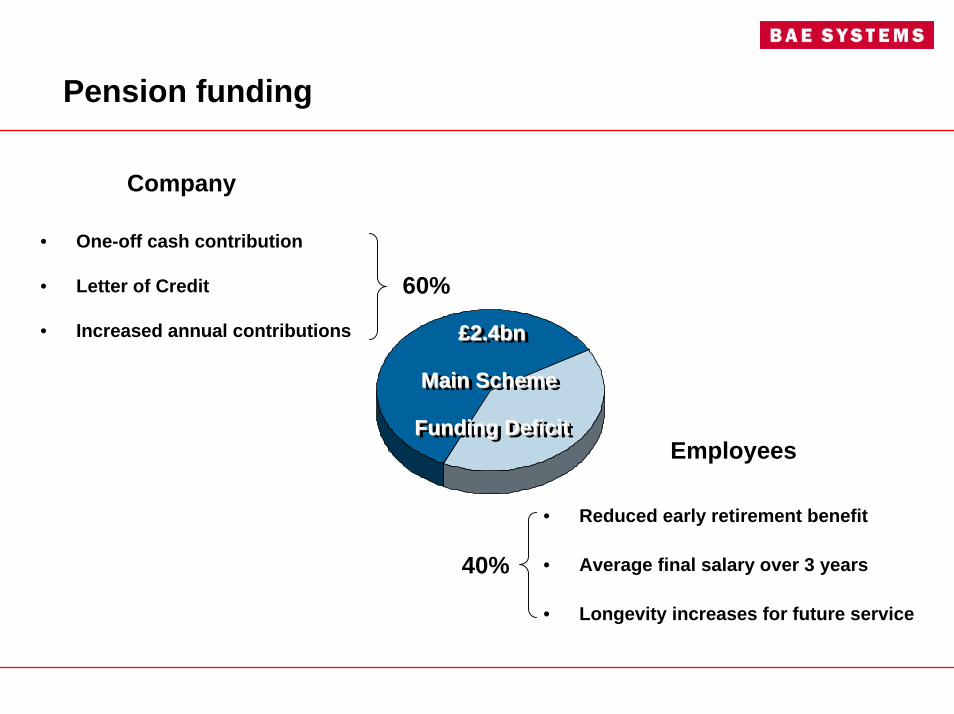
Pension funding
Company
• One-off cash contribution
• Letter of Credit
• Increased annual contributions
• Reduced early retirement benefit
• Average final salary over 3 years
• Longevity increases for future service
60%
40%
Employees
£2.4bn
Main Scheme
Funding Deficit
££2.4bn2.4bn
Main Scheme Main Scheme
Funding DeficitFunding Deficit

15
Operating Business Cash Flow
2005
2,099(250)
881,937
32316828585017
327(3)
(30)1,937
Cash flow from operating activitiesCapital expenditure (net) & financial investmentDividends from equity accounted investments
Operating business cash flow
Electronics, Intelligence & SupportLand & ArmamentsProgrammesCustomer Solutions & SupportIntegrated Systems & PartnershipsCommercial AerospaceHQ and other businessesDiscontinued businesses
Operating business cash flow
£ millions

16
Movement in Net Debt
(668)
(283)
(951)
1,937
(179)
(315)
(1,836)
373
(52)(219)(35)
(1,277)
2005
Net Debt 31.12.04
IAS 32 & 39 opening balance adjustments
Opening Net Debt
Operating business cash flow
Interest, preference dividend and taxation
Equity dividends paid
Acquisitions and disposals (including acquired cash/loans)
Proceeds from issue of share capital
Non-cash movements
Foreign currency translation
Movement in cash on customers’ account
Closing Net Debt 31.12.05
£ millions

17
Sales by Business Group
Integrated Systems &
Partnerships12%
Customer Solutions &
Support18%
Programmes18%
Commercial Aerospace
21%
Land & Armaments
8%
Electronics, Intelligence &
Support23%
*
* Includes United Defense from 24 June 05

18
Electronics, Intelligence & Support
2005
£3,697m
£324m
8.8.%
£3.5bn
£323m
2004
£3,063m
£256m
8.4%
£3.1bn
£190m
Sales
EBITA
Margin
Order book
Cash flow

19
Electronics, Intelligence & Support
2005
$6,726m
$590m
8.8%
$6.0bn
$588m
2004
$5,613m
$469m
8.4%
$6.0bn
$348m
Sales
EBITA
Margin
Order book
Cash flow

20
Land & Armaments
2005
£1,270m
£42m
£86m
6.8%
£4.4bn
£168m
2004
£482m
£(8)m
£(2)m
(0.4)%
£2.2bn
£60m
Sales
EBITA
Underlying EBITA
Underlying Margin
Order book
Cash flow

21
Land & Armaments
2005
$2,311m
$76m
$156m
6.8%
$7.6bn
$306m
2004
$883m
$(15)m
$(4)m
(0.4)%
$4.2bn
$110m
Sales
EBITA
Underlying EBITA
Underlying Margin
Order book
Cash flow

22
Programmes
2005
£2,819m
£133m
4.7%
£12.3bn
£285m
2004
£2,219m
£10m
0.5%
£13.0bn
£442m
Sales
EBITA
Margin
Order book
Cash flow

23
Customer Solutions & Support
2005
£2,923m
£419m
14.3%
£5.0bn
£850m
2004
£2,856m
£497m
17.4%
£4.6bn
£1,102m
Sales
EBITA
Margin
Order book
Cash flow
24
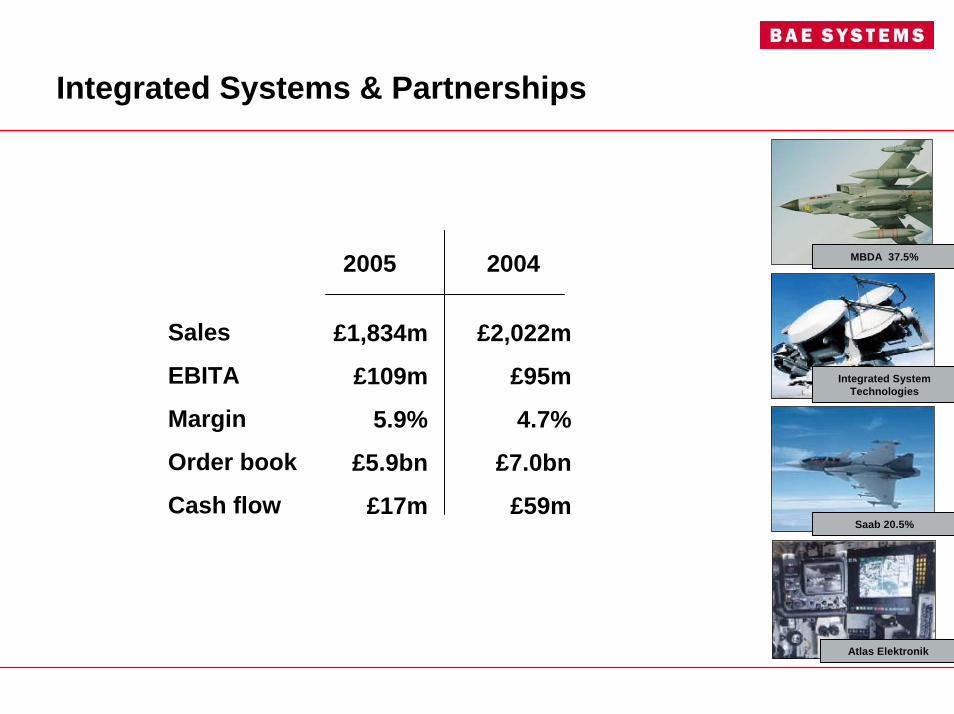
Integrated Systems & Partnerships
Saab 20.5%
Integrated System Technologies
Atlas Elektronik
MBDA 37.5%2005
£1,834m
£109m
5.9%
£5.9bn
£17m
2004
£2,022m
£95m
4.7%
£7.0bn
£59m
Sales
EBITA
Margin
Order book
Cash flow

25
Commercial Aerospace
2005
£3,232m
£179m
5.5%
£29.5bn
£327m
2004
£2,924m
£201m
6.9%
£20.9bn
£226m
Sales
EBITA
Margin
Order book
Cash flow

26
Financial Highlights
• Sales - Continuing
• EBITA* - Continuing Underlying
• - Discontinued
• Margin
• Underlying earnings per share **
• Net cash flow from operating activities
• Net debt
• Order book
• Dividend per share
£15,411m
£1,226m
£(24)m
8.0%
22.5p
£2,099m
£1,277m
£59.8bn
10.3p
* Earnings before amortisation and impairment of intangible assets, finance costs and taxation** Continuing operations, excluding amortisation of intangible assets, non-cash finance mvts and uplift in
acquired inventories
27
Summary

28
Top ten objectives - 2005
1. Deliver operational performance plan
2. Enhance focus on internal processes
3. Continue to grow US position
4. Progress US / UK technology sharing
5. Progress business in Kingdom of Saudi Arabia
6. Continue to address terms of trade with UK MoD
7. Continue to grow support business
8. Finalise consultations on pension schemes
9. Integration of UK AMS and C4ISR business
10. Pursue export opportunities
Achieved
Centre for Performance Excellence
UDI acquisition
Progressing slowly
Typhoon
Defence Industrial Strategy
Delivering growth and savings
Good progress
Successfully completed
Record order book

29
Top ten objectives - 2006
1. Deliver 2006 financial targets
2. Ensure application of mandated business processes
3. Increase focus on schedule and cost commitments
4. Continue to grow US business
5. Implementation of UK Defence Industrial Strategy
6. Focus on key export opportunities
7. Progress business in Kingdom of Saudi Arabia
8. Continue to grow support business
9. Implement way forward on pension schemes
10. Drive to performance culture
30
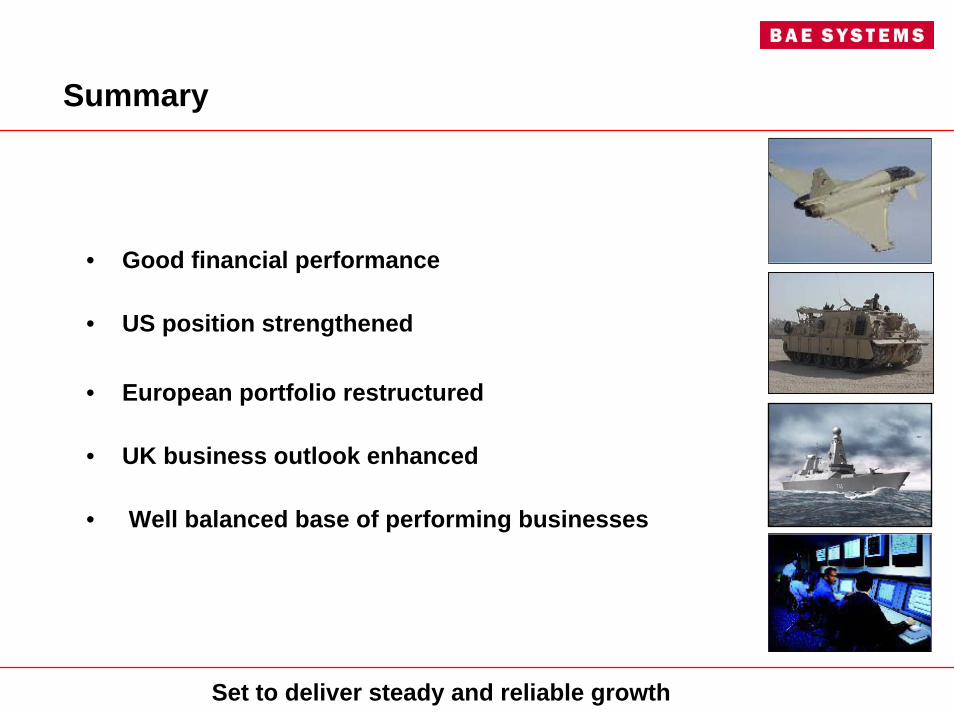
Summary
• Good financial performance
• US position strengthened
• European portfolio restructured
• UK business outlook enhanced
• Well balanced base of performing businesses
Set to deliver steady and reliable growth

Handouts

32
1,18244
1,226
(215)14-
(210)
(262)(13)
-(1)
(23)(299)
(2)
7153,18322.5p
EBITA- Add back fair value on acquired inventories
Interest- exclude pension financing credit- exclude market value movements on instruments- preference dividends restatement
Tax - impact of fair value on acquired inventories- impact of pension financing credit- impact of market value movements on instruments- exclude tax on intangibles
Minority Interests
Underlying earningsWeighted average number of shares in issueUnderlying earnings per share
Underlying Earnings per ShareContinuing Operations
2005
1,0166
1,022
(176)(24)
-(21)
(221)
(273)(2)
9--
(266)
(1)
5343,05817.4p
2004
£ millions

33
Basic & Diluted EPS - Continuing Operations
2005 2004
581-
581
3,183
18.3p
456(21)
435
3,058
14.2p
Profit for the period Preference dividends
Profit for the period after preference dividends
Weighted average number of shares used in calculating EPS
Basic Earnings per Share (IAS 33)
58127
608
3,332
18.2p
456(21)
435
3,058
14.2p
Profit for the period Preference dividends
Profit for the period after adjusting for preference dividends
Weighted average number of shares used in calculating EPS
Diluted Earnings per Share (IAS 33)
£ millions

34
Financial Income:-Interest IncomeNet present value adjustmentsExpected return on pension scheme assetsNet gain on remeasurement of financial instruments at fair value Other fair value movementsForeign exchange gains
Financial Expense:-On bank loans, overdrafts, finance leases, bonds, preference debt and other financial instrumentsFacility FeesNet present value adjustmentsInterest charge on pension scheme liabilitiesNet loss on remeasurement of financial instruments at fair valueNet loss on remeasurement of embedded derivatives at fair valueForeign exchange losses
Finance Costs (excluding equity accounted investments)Share of Finance Costs of equity accounted investments *
£ millions
2005
123 23
632159
59228
(310)(10)(25)
(633)(75)
(217)(158)
(204)(11)
(215)
2004
Finance Costs
5710
542---
(226)-
(11)(521)
---
(149)(27)
(176)
(A)(B)(C)
(D)(E)(F)
Note : underlying earnings restatement for mark to market = (A)+(B)+(C)+(D)+(E)+(F)

35
Retirement Benefit Obligations
Deficit in defined benefit pension plans at 1 Jan 2005
Transfers arising on acquisitions
Actual return on assets above expected return
Increase in liabilities due to changes in assumptions
Other movements
Deficit in defined benefit pension plans at 31 Dec 2005
US Healthcare plans
Allocated to equity accounted investments
Group’s share of IAS 19 deficit
(4,339)(89)
1,138(2,100)
84(5,306)
(52)1,210
(4,148)
£ millions

36
Operating Cash FlowOperating Cash Flow
1,182(24)
(373)402(41)
202
16(98)
9954(4)
8642,099
2005
EBITA*
Discontinued Operations
Less share of equity accounted investments
Add depreciation
Gain on disposal of fixed assets
Loss on disposal of business
Impairment of other investments
Cost of equity-settled employee share schemes
Movements in retirement benefit obligations
Movements in liability provisions
Movements in inventories
Movements in trade and other receivables
Movements in trade and other payables
Cash flow from operating activities £ millions* Earnings before amortisation and impairment of intangible assets, finance costs and taxation

37
Working Capital MovementsReconciliation to Cash Flow
Cash FlowOther **Mvt Acq/Dis * F/X
485
1,877912
2,789
(7,006)(432)
(7,438)
(343)(375)(718)
(4,882)53
(4,829)
1/1/0531/12/05
498
2,126500
2,626
(6,090)(464)
(6,554)
(250)(245)(495)
(3,925)18
(3,907)
13
(163)
884
223
957(35)922
(4)
120
70
(99)
2
(75)
13
(8)
43
114
(103)
(17)
54
(4)
864
99
Inventories (A)
Receivables - currentReceivables - non currentTotal receivables (B)
Payables - currentPayables - non currentTotal payables *** (C)
Liability provisions - currentLiability provisions - non currentTotal liability provisions (D)
Working capital per cash flowCash on customers’ account (E)Working capital per balance sheet ****
* Includes Assets Held for Resale** includes movement on Interest Receivable/Payable balances*** includes cash on customers’ account**** equals A+B+C+D+E
£ millions

38
Performance by Business Group
3,6973,697
1,2701,270
2,8192,819
2,9232,923
1,8341,834
3,2323,232
6969
(433)(433)
15,41115,411
Sales
324324
42 42
133 133
419419
109109
179179
(24)(24)
--
1,1821,182
EBITA *
Electronics, Intelligence & Support
Land & Armaments
Programmes
Customer Solutions & Support
Integrated Systems & Partnerships
Commercial Aerospace
HQ and other businesses
Intra-group
Total £ millions
* Earnings before amortisation and impairment of intangible assets, finance costs and taxation £ millions


