Download - Bb Education on Tour | Blackboard Learning Analytics | Chris Eske, Platform Sales, Bb Analytics


Not a Destination but a Journey!ANZ TLC, August 2014
Chris Eske Analytics Specialist
Blackboard International
Analytics to inform Continual Improvement
Big Data & the Experience of Lingnan University, Hong Kong to implement Blackboard Analytics
Chris Eske
Terence Kwok

12 Months On!Bb On Tour, February 2015
Chris Eske Analytics Specialist
Blackboard International
Using Analytics As a Catalyst for Change
“training for online course development and
instruction has become data-driven – and
faculty have proven responsive to the new
availability of rich information on both
student outcomes and effective pedagogy.
The data from Blackboard Analytics has
stimulated faculty adoption of the new
approach to blended programs.”
Kendall St. Hilaire, Administrative Director of Indian River State College’s
Using Analytics As a Catalyst for Change
Dr Freeman Hrabowski – President UMBC
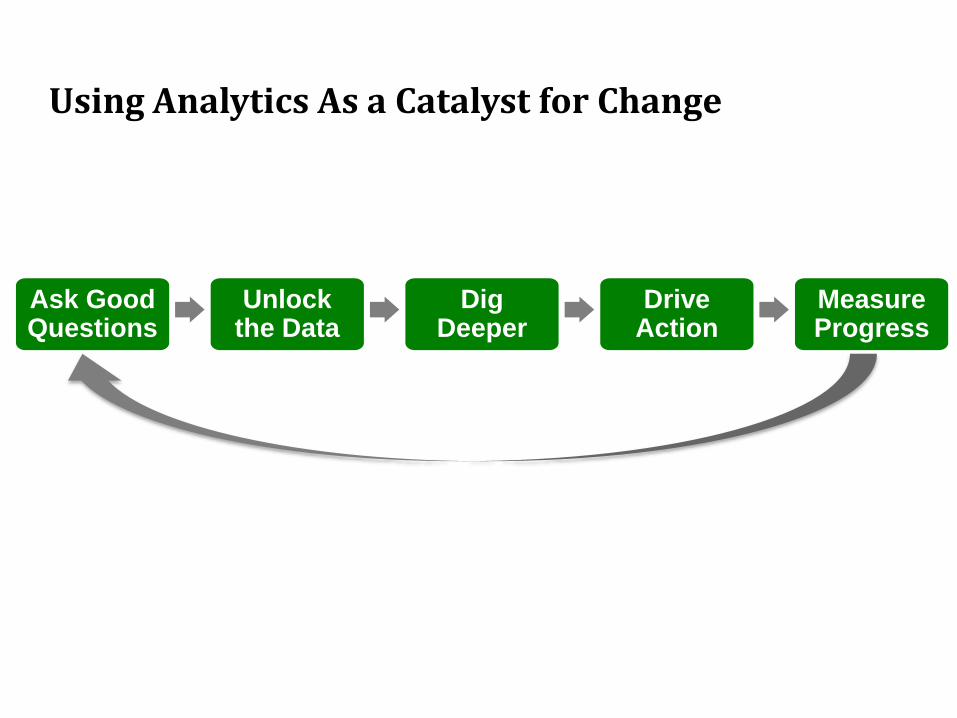
Using Analytics As a Catalyst for Change
Ask Good Questions
Unlock the Data
Dig Deeper
Drive Action
Measure Progress

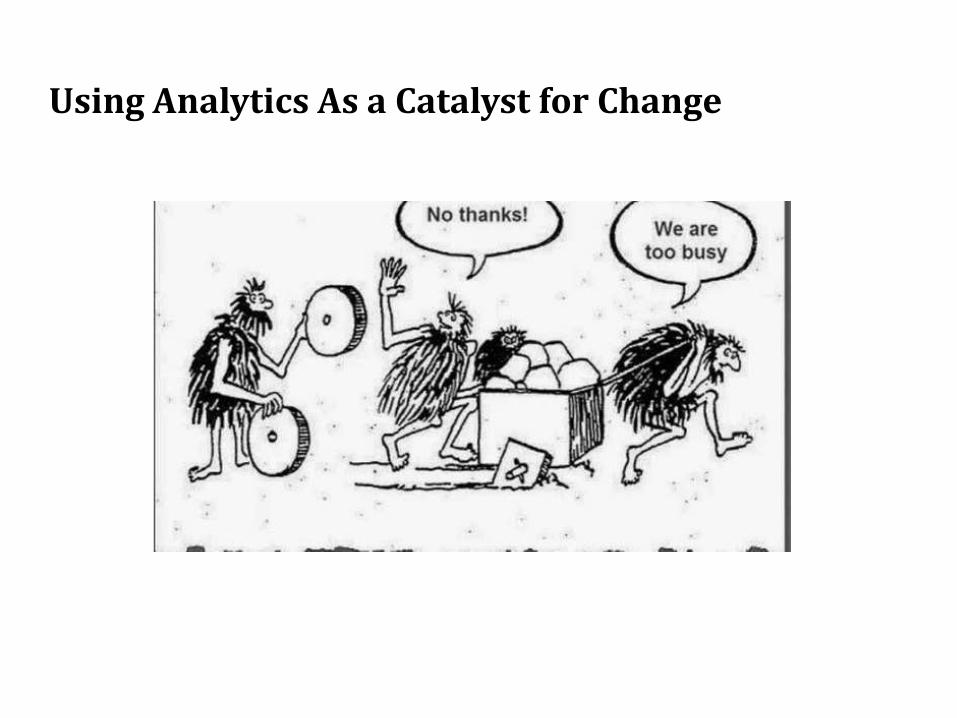
Using Analytics As a Catalyst for Change
Using Analytics As a Catalyst for Change

Using Analytics As a Catalyst for Change
“Analytics pays back $13.01
for every dollar spent”
Nucleus Research
Document 0204 Sep 2014
Using Analytics As a Catalyst for Change
NMC Horizon Report: 2015 Higher Education Edition
Using Analytics As a Catalyst for Change
NMC Horizon Report: 2015 Higher Education Edition
Growing Focus on Measuring Learning Mid-Term Trend: Driving Ed Tech adoption in higher education

Power of Analytics

Cost of the LMS

Cost of the LMS
License, Infrastructure and dedicated IT staff - $600kEd Tech Academic Support Staff - $3.2million
Cost of the LMS
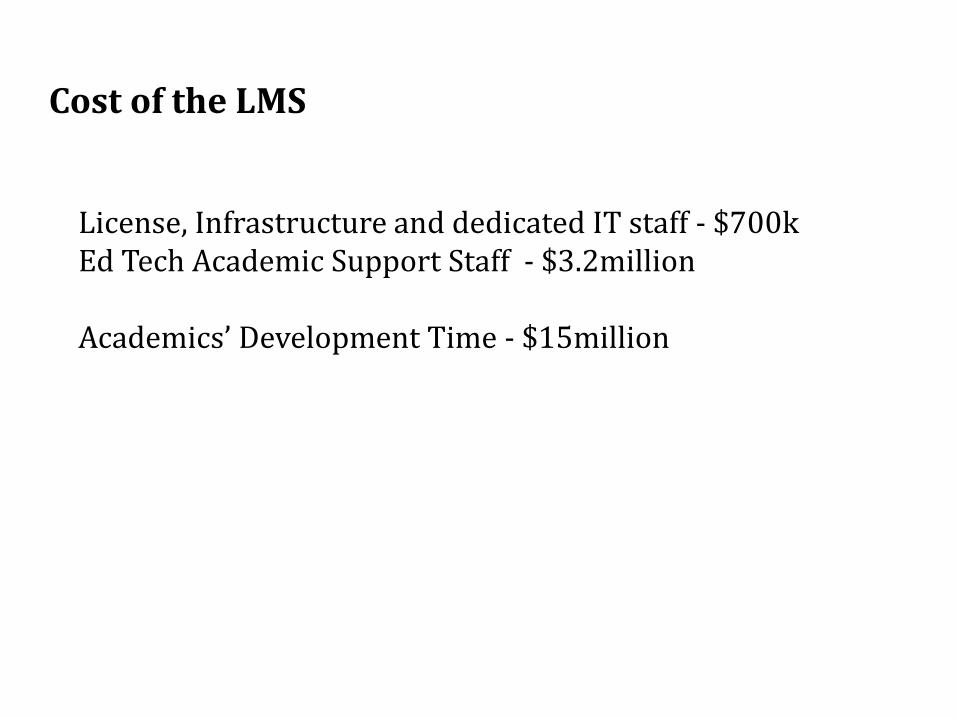
License, Infrastructure and dedicated IT staff - $700kEd Tech Academic Support Staff - $3.2million
Academics’ Development Time - $15million
Cost of the LMS
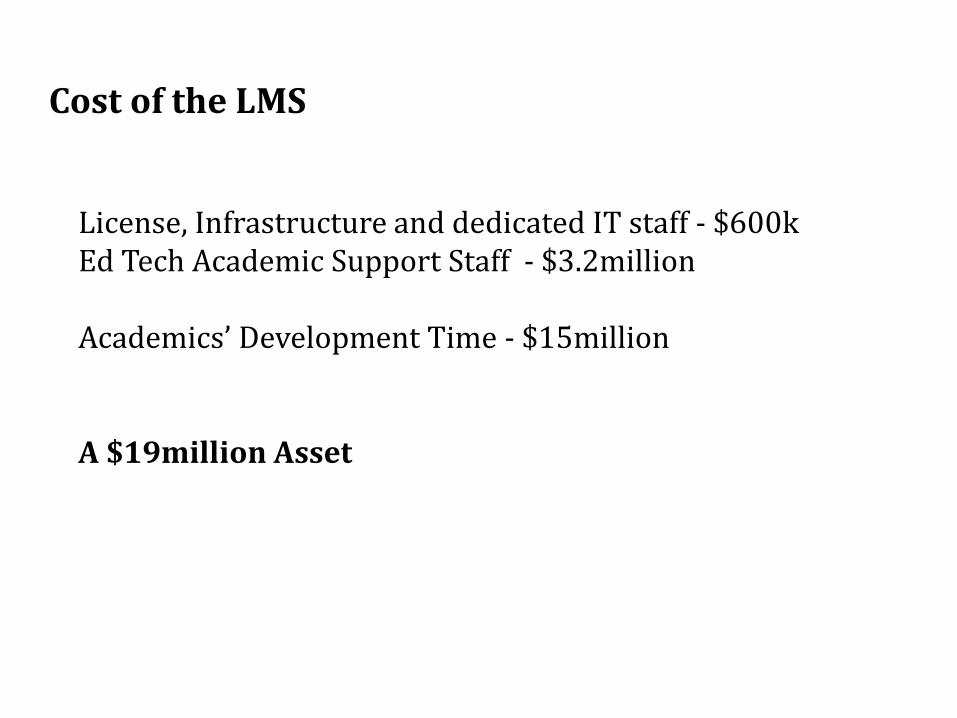
License, Infrastructure and dedicated IT staff - $600kEd Tech Academic Support Staff - $3.2million
Academics’ Development Time - $15million
A $19million Asset

Student Influences and Effects

Student Influences and Effects

Student Influences and Effects
Student Influences and Effects
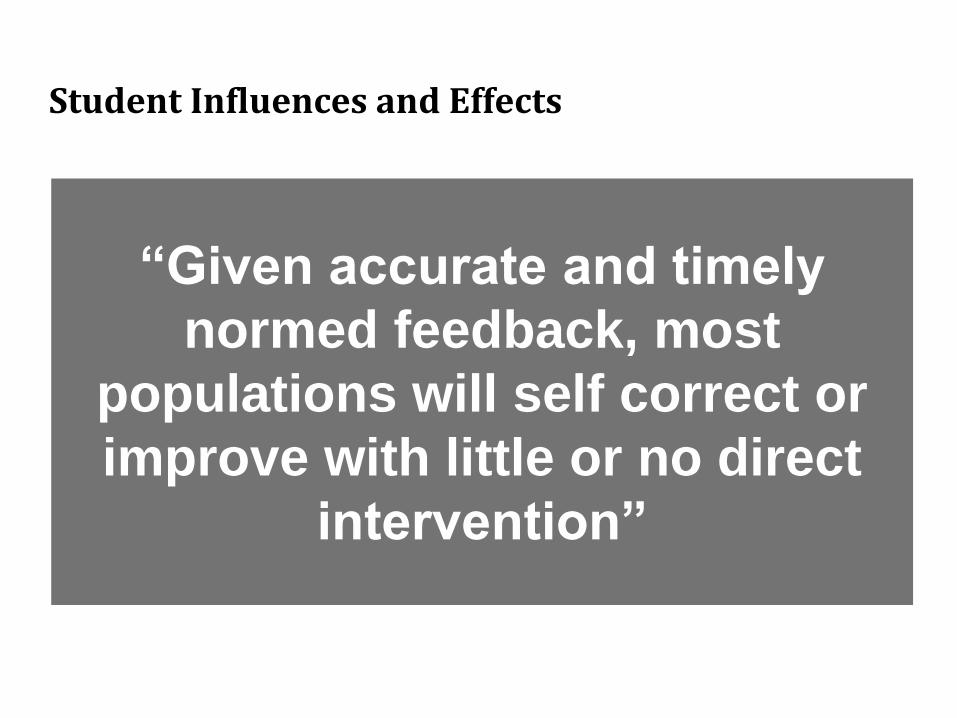
“Given accurate and timely
normed feedback, most
populations will self correct or
improve with little or no direct
intervention”
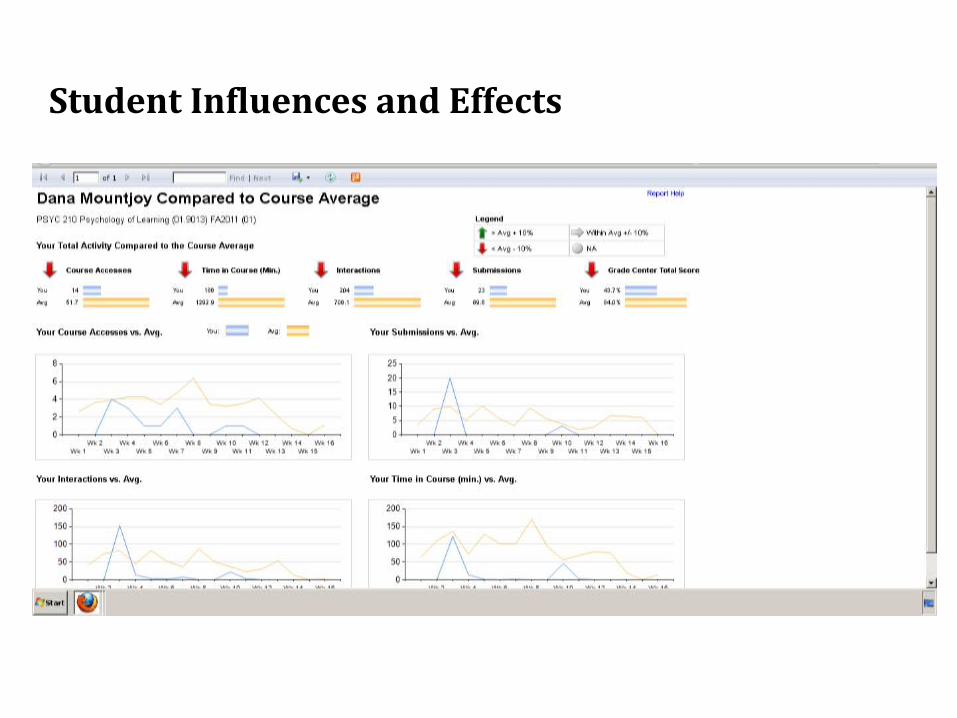
Student Influences and Effects
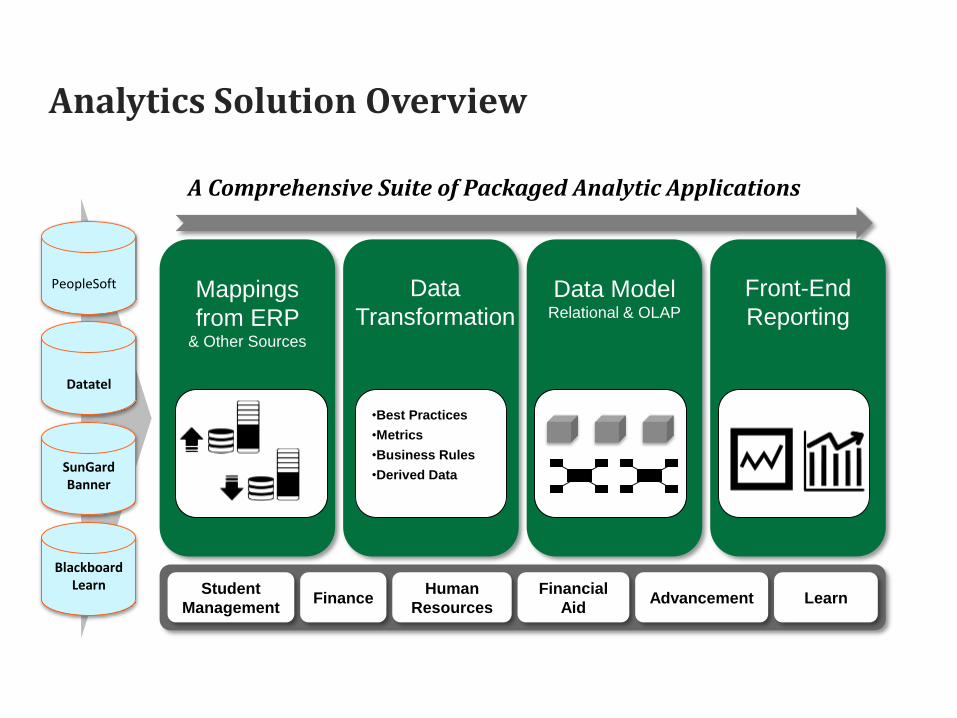
Analytics Solution Overview
Student
ManagementFinance
Human
Resources
Financial
AidAdvancement
PeopleSoft
Datatel
SunGard Banner
BlackboardLearn
Mappings
from ERP & Other Sources
Data
TransformationData Model
Relational & OLAP
Front-End
Reporting
•Best Practices
•Metrics
•Business Rules
•Derived Data
A Comprehensive Suite of Packaged Analytic Applications
Learn
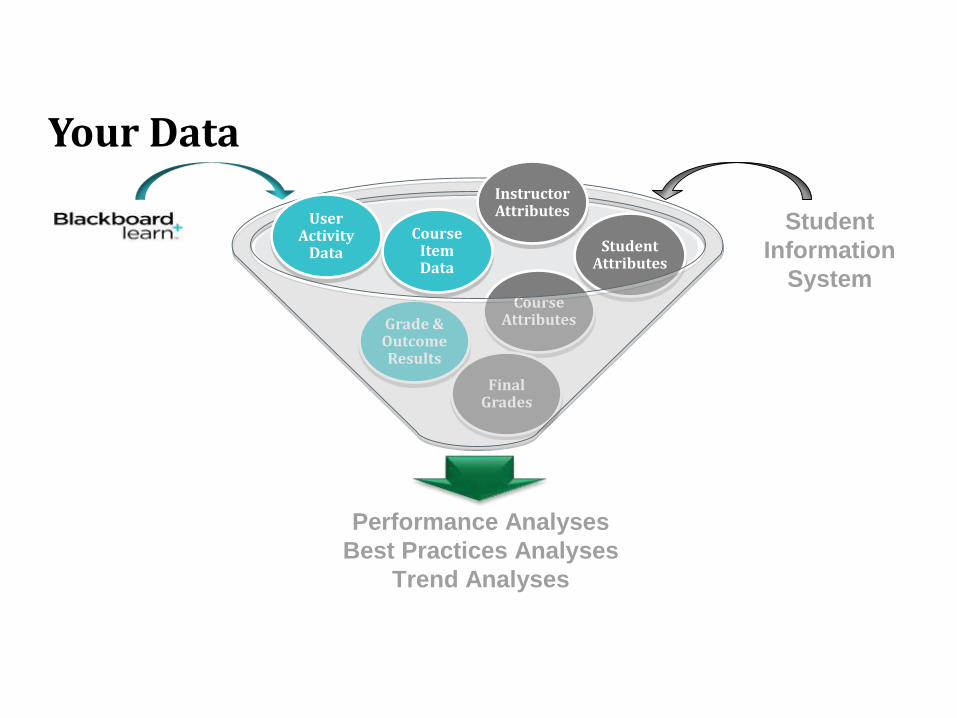
Your Data
Grade & Outcome Results
Course Attributes
Student Attributes
Final Grades
Student
Information
System
Performance Analyses
Best Practices Analyses
Trend Analyses
Instructor AttributesUser
Activity Data
Course Item Data
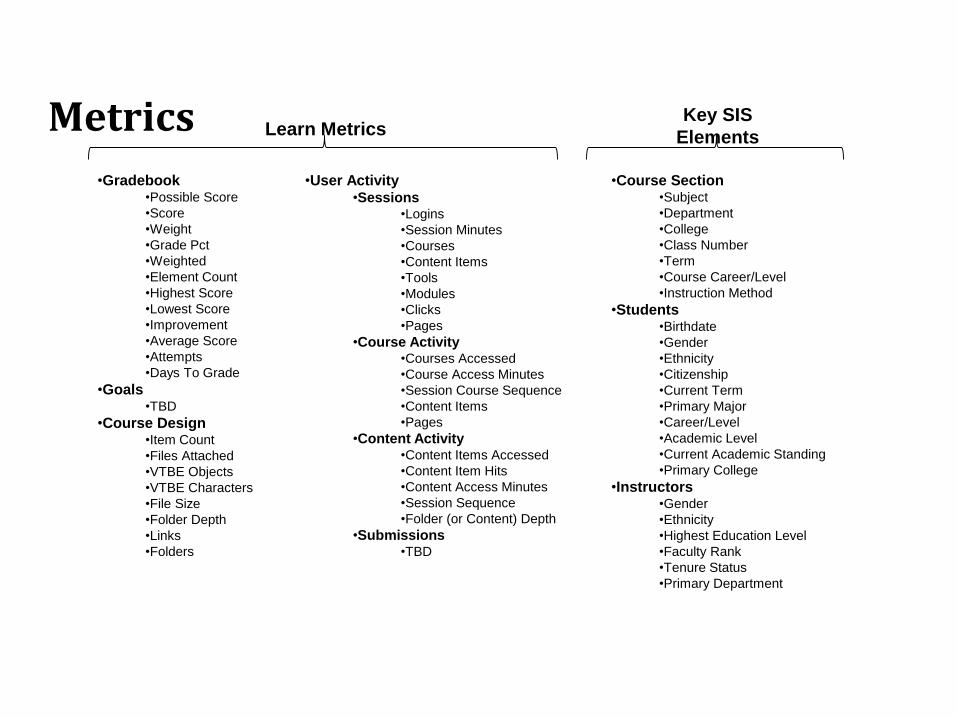
Metrics
•Gradebook•Possible Score
•Score
•Weight
•Grade Pct
•Weighted
•Element Count
•Highest Score
•Lowest Score
•Improvement
•Average Score
•Attempts
•Days To Grade
•Goals•TBD
•Course Design•Item Count
•Files Attached
•VTBE Objects
•VTBE Characters
•File Size
•Folder Depth
•Links
•Folders
•Course Section•Subject
•Department
•College
•Class Number
•Term
•Course Career/Level
•Instruction Method
•Students•Birthdate
•Gender
•Ethnicity
•Citizenship
•Current Term
•Primary Major
•Career/Level
•Academic Level
•Current Academic Standing
•Primary College
•Instructors•Gender
•Ethnicity
•Highest Education Level
•Faculty Rank
•Tenure Status
•Primary Department
•User Activity•Sessions
•Logins
•Session Minutes
•Courses
•Content Items
•Tools
•Modules
•Clicks
•Pages
•Course Activity•Courses Accessed
•Course Access Minutes
•Session Course Sequence
•Content Items
•Pages
•Content Activity•Content Items Accessed
•Content Item Hits
•Content Access Minutes
•Session Sequence
•Folder (or Content) Depth
•Submissions•TBD
Learn MetricsKey SIS
Elements
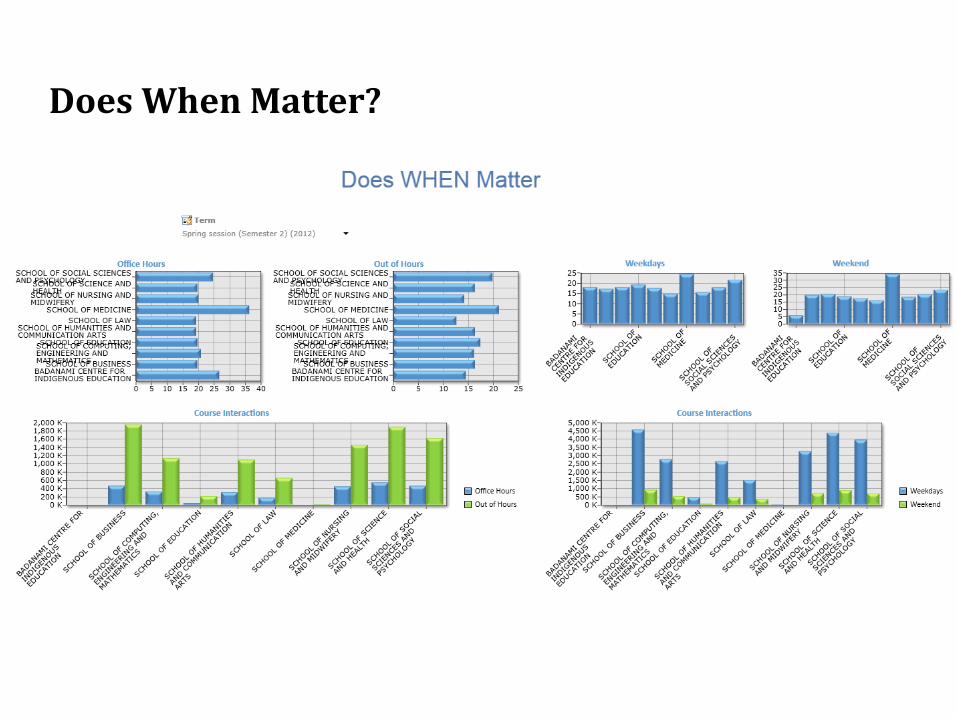
Does When Matter?
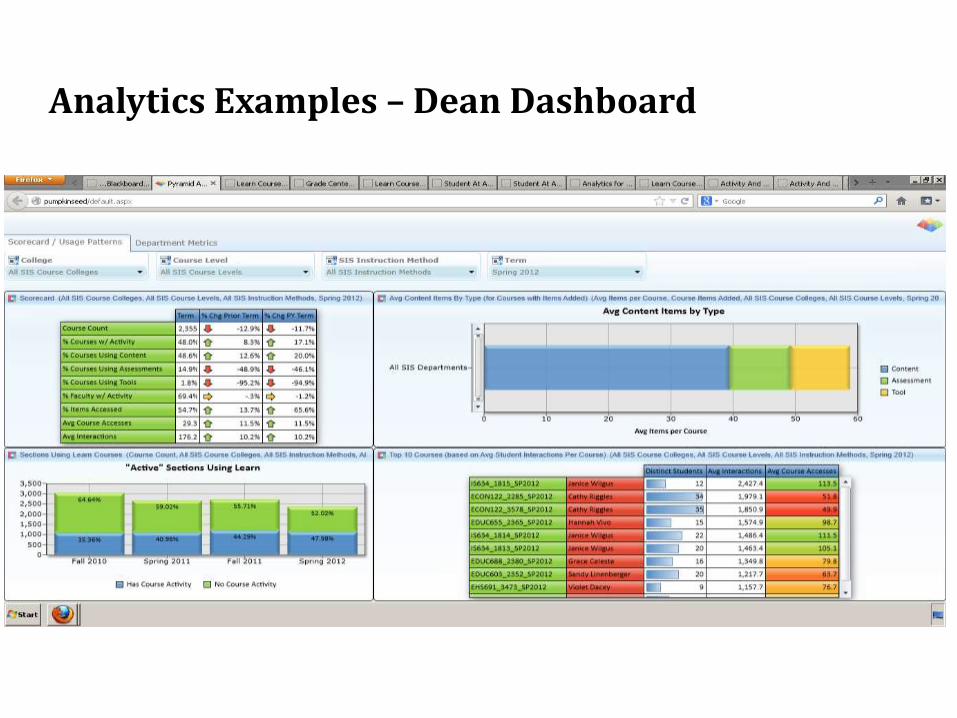
Analytics Examples – Dean Dashboard

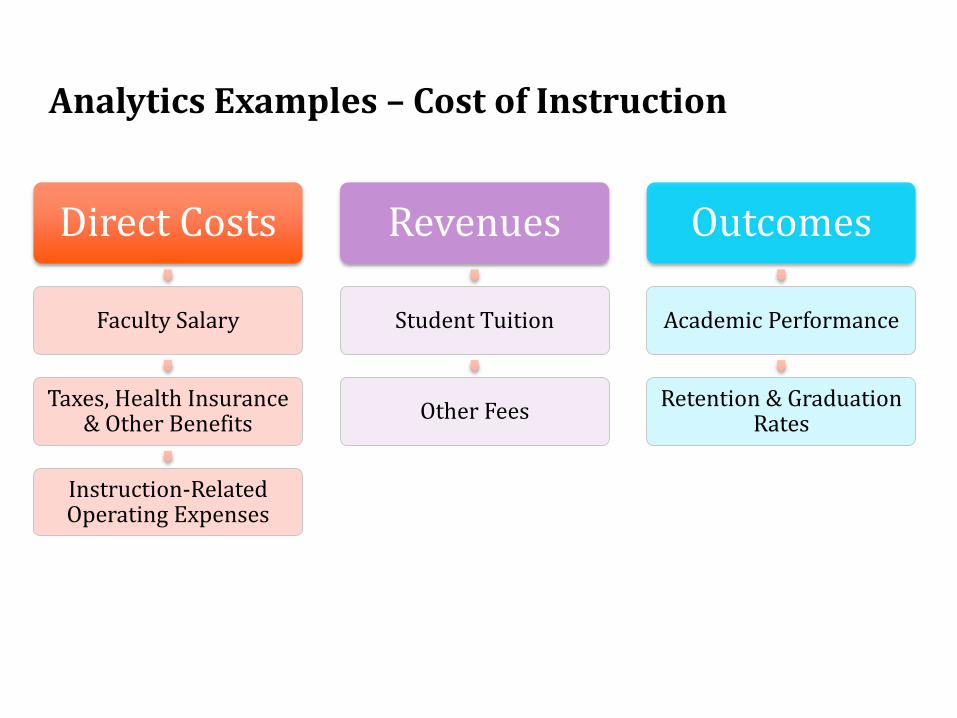
Analytics Examples – Cost of Instruction
Analytics Examples – Cost of Instruction
Direct Costs
Faculty Salary
Taxes, Health Insurance & Other Benefits
Instruction-Related Operating Expenses
Revenues
Student Tuition
Other Fees
Outcomes
Academic Performance
Retention & Graduation Rates
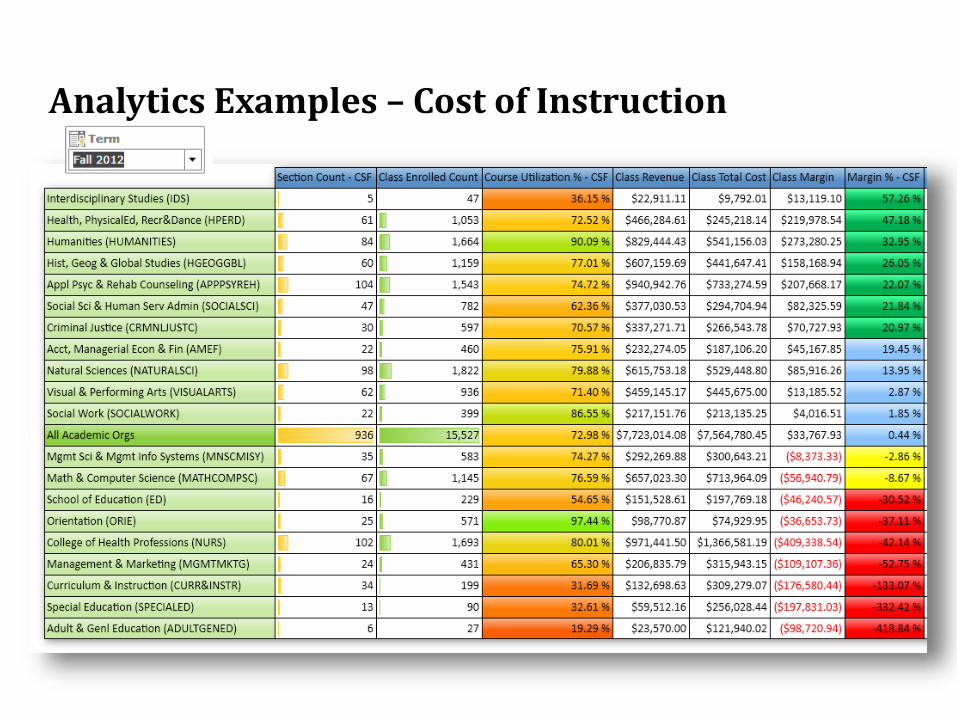
Analytics Examples – Cost of Instruction

“If data is cool, & analysis is powerful,
Using Analytics As a Catalyst for Change
“If data is cool, & analysis is powerful, then action driven by analysis is
transformative.”
Using Analytics As a Catalyst for Change