
www.markettrack.com
Market Track Best Practice Series
Best Practices: Consumer Insights and Market ResearchActionable insights for retailers and manufacturers that address common challenges
Key Takeaways• Measurepromotionalvolumetrendsacross
allmediatypesduringkeysellingseasonsfromyeartoyeartoidentifycompetitivepatternsthatwillhelpyoupredicthowyourcompetitionwillpromote,andgovernchangestoyourownvolumestrategy.
• Understandwhereyourcompetitionhaspriceditemsontheirpromotionalfeaturepages(printfrontpage,websitehomepage,etc.)overthecourseofamulti-yearperiodtohelpplanyourownpromotionalpricingcalendarthataccountsforwhencompetitivepricesarelikelytochange.
• Retailersfluctuatethepromotionofdifferentcategoriesthroughouttheyeardependingonthedemandforcertaincategoriesatspecifictimes.Tocombatcompetitivepromotedproductassortment,youshouldhaveknowledgeofwhenyourcompetitorstendtopromotedifferentcategoriesandmoldtheproductassortmentacrossyourpromotionalmediatypesaroundcompetitivepatterns.
neofthemostcommonbusinessissuesretailersandmanufacturersfaceisthestruggletomakeuseofallthedatatheyhaveattheirdisposal.Retailersareinundatedwithmassiveamountsofdata,capturingeverythingfromsalesnumberstoweatherpatternstocompetitiveandcausaldata.Onitsown,thedatameansverylittletoaDirectorofMarketingoraPricing
Manager—datafirstneedstobemined,analyzed,andsummarizedintoactionableinsights.Consumerinsightsandmarketresearchteamsareresponsiblefortransformingexpansivedataintosomethingdigestiblefordecision-makers.
Consumerinsightsmanagersandmarketresearchmanagerscanbeseenasthecompassthatprovidesgeneraldirectiontoadvertising,marketing,merchandising,andpricingteamsatretailers,andsalesandmarketingteamsatmanufacturers.Effectivecollaborationbetweentheseteamsiskeyincreatingapromotionalplanthatbothreachestheirtargetshopperswithadifferentiatedvaluemessage,andalignswiththeircorporatestrategy.Fromdevelopingacross-channelpromotionalscheduleondowntopickingspecificproductsandpricepointstopopulatethatschedule,variousteamsmustworktogethertoexecutethatprocess.Theseteamsrelyontheirconsumerinsightsandmarketresearchteamstoprovidetheinformationandinsightstheyneedtobestperformtheirresponsibilities.
InthisissueofMarketTrack’sBestPracticeSeries,wewillarmconsumerinsightsandmarketresearchteamswiththetoolstheywillneedtodrawthemostactionabletrends,stories,andinsightsoutofMarketTrack’scompetitivecross-channelpromotionaldata.Wewillexaminebestpracticesinunderstandinghowpromotionalvolumeistrendinginbothprintanddigitalmedia,whichretailersareincreasingordecreasingtheirpromotedpricingovertime,whichcategoriesandbrandsareseeingsharechanges,andwhattheimplicationsofthesetrendsarewithregardtoaretailer’sormanufacturer’spromotionalstrategy.
O
2 Market Track Best Practice Series
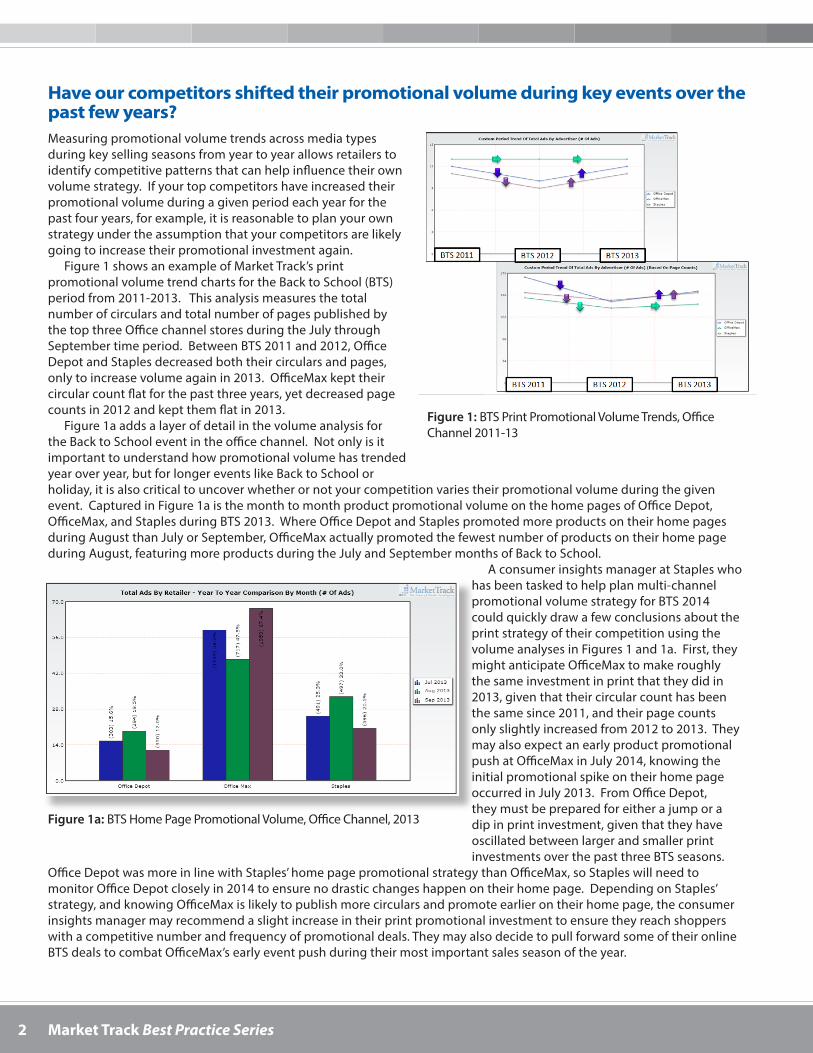
Measuringpromotionalvolumetrendsacrossmediatypesduringkeysellingseasonsfromyeartoyearallowsretailerstoidentifycompetitivepatternsthatcanhelpinfluencetheirownvolumestrategy.Ifyourtopcompetitorshaveincreasedtheirpromotionalvolumeduringagivenperiodeachyearforthepastfouryears,forexample,itisreasonabletoplanyourownstrategyundertheassumptionthatyourcompetitorsarelikelygoingtoincreasetheirpromotionalinvestmentagain.
Figure1showsanexampleofMarketTrack’sprintpromotionalvolumetrendchartsfortheBacktoSchool(BTS)periodfrom2011-2013.ThisanalysismeasuresthetotalnumberofcircularsandtotalnumberofpagespublishedbythetopthreeOfficechannelstoresduringtheJulythroughSeptembertimeperiod.BetweenBTS2011and2012,OfficeDepotandStaplesdecreasedboththeircircularsandpages,onlytoincreasevolumeagainin2013.OfficeMaxkepttheircircularcountflatforthepastthreeyears,yetdecreasedpagecountsin2012andkeptthemflatin2013.
Figure1aaddsalayerofdetailinthevolumeanalysisfortheBacktoSchooleventintheofficechannel.Notonlyisitimportanttounderstandhowpromotionalvolumehastrendedyearoveryear,butforlongereventslikeBacktoSchoolorholiday,itisalsocriticaltouncoverwhetherornotyourcompetitionvariestheirpromotionalvolumeduringthegivenevent.CapturedinFigure1aisthemonthtomonthproductpromotionalvolumeonthehomepagesofOfficeDepot,OfficeMax,andStaplesduringBTS2013.WhereOfficeDepotandStaplespromotedmoreproductsontheirhomepagesduringAugustthanJulyorSeptember,OfficeMaxactuallypromotedthefewestnumberofproductsontheirhomepageduringAugust,featuringmoreproductsduringtheJulyandSeptembermonthsofBacktoSchool.
AconsumerinsightsmanageratStapleswhohasbeentaskedtohelpplanmulti-channelpromotionalvolumestrategyforBTS2014couldquicklydrawafewconclusionsabouttheprintstrategyoftheircompetitionusingthevolumeanalysesinFigures1and1a.First,theymightanticipateOfficeMaxtomakeroughlythesameinvestmentinprintthattheydidin2013,giventhattheircircularcounthasbeenthesamesince2011,andtheirpagecountsonlyslightlyincreasedfrom2012to2013.TheymayalsoexpectanearlyproductpromotionalpushatOfficeMaxinJuly2014,knowingtheinitialpromotionalspikeontheirhomepageoccurredinJuly2013.FromOfficeDepot,theymustbepreparedforeitherajumporadipinprintinvestment,giventhattheyhaveoscillatedbetweenlargerandsmallerprintinvestmentsoverthepastthreeBTSseasons.
OfficeDepotwasmoreinlinewithStaples’homepagepromotionalstrategythanOfficeMax,soStapleswillneedtomonitorOfficeDepotcloselyin2014toensurenodrasticchangeshappenontheirhomepage.DependingonStaples’strategy,andknowingOfficeMaxislikelytopublishmorecircularsandpromoteearlierontheirhomepage,theconsumerinsightsmanagermayrecommendaslightincreaseintheirprintpromotionalinvestmenttoensuretheyreachshopperswithacompetitivenumberandfrequencyofpromotionaldeals.TheymayalsodecidetopullforwardsomeoftheironlineBTSdealstocombatOfficeMax’searlyeventpushduringtheirmostimportantsalesseasonoftheyear.
Have our competitors shifted their promotional volume during key events over the past few years?
Figure 1:BTSPrintPromotionalVolumeTrends,OfficeChannel2011-13
Figure 1a:BTSHomePagePromotionalVolume,OfficeChannel,2013
3The Power of Market Intelligence
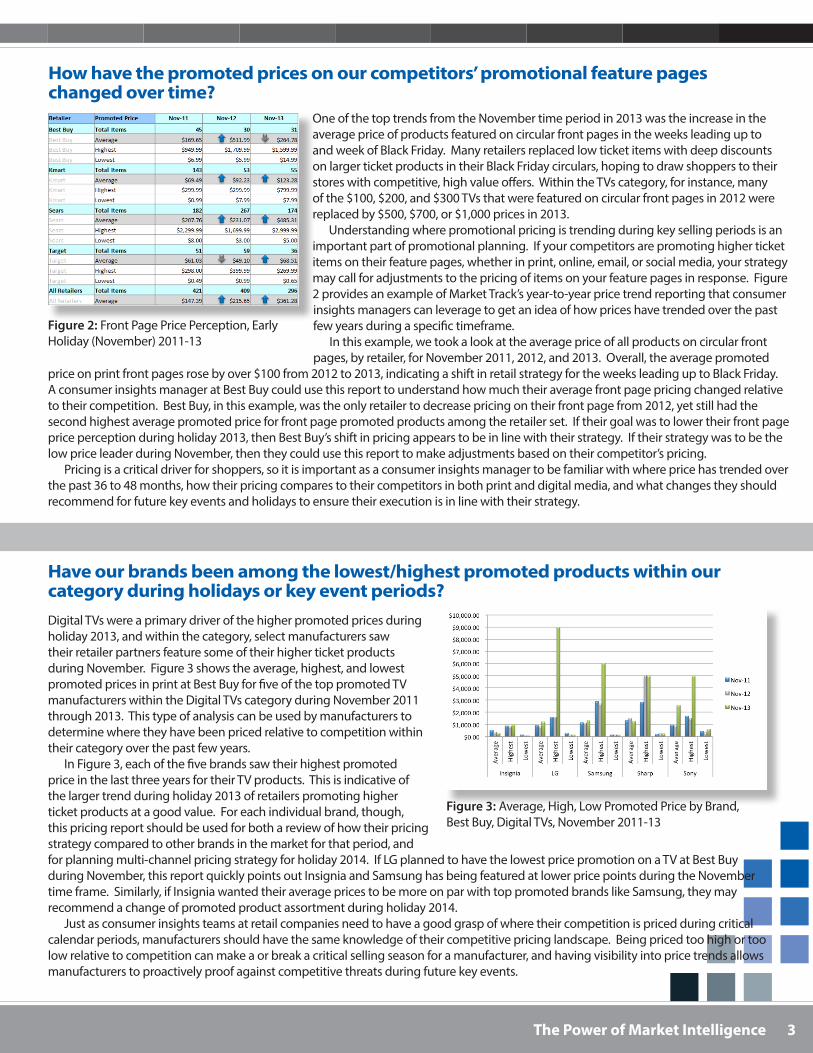
OneofthetoptrendsfromtheNovembertimeperiodin2013wastheincreaseintheaveragepriceofproductsfeaturedoncircularfrontpagesintheweeksleadinguptoandweekofBlackFriday.ManyretailersreplacedlowticketitemswithdeepdiscountsonlargerticketproductsintheirBlackFridaycirculars,hopingtodrawshopperstotheirstoreswithcompetitive,highvalueoffers.WithintheTVscategory,forinstance,manyofthe$100,$200,and$300TVsthatwerefeaturedoncircularfrontpagesin2012werereplacedby$500,$700,or$1,000pricesin2013.
Understandingwherepromotionalpricingistrendingduringkeysellingperiodsisanimportantpartofpromotionalplanning.Ifyourcompetitorsarepromotinghigherticketitemsontheirfeaturepages,whetherinprint,online,email,orsocialmedia,yourstrategymaycallforadjustmentstothepricingofitemsonyourfeaturepagesinresponse.Figure2providesanexampleofMarketTrack’syear-to-yearpricetrendreportingthatconsumerinsightsmanagerscanleveragetogetanideaofhowpriceshavetrendedoverthepastfewyearsduringaspecifictimeframe.
Inthisexample,wetookalookattheaveragepriceofallproductsoncircularfrontpages,byretailer,forNovember2011,2012,and2013.Overall,theaveragepromoted
priceonprintfrontpagesrosebyover$100from2012to2013,indicatingashiftinretailstrategyfortheweeksleadinguptoBlackFriday.AconsumerinsightsmanageratBestBuycouldusethisreporttounderstandhowmuchtheiraveragefrontpagepricingchangedrelativetotheircompetition.BestBuy,inthisexample,wastheonlyretailertodecreasepricingontheirfrontpagefrom2012,yetstillhadthesecondhighestaveragepromotedpriceforfrontpagepromotedproductsamongtheretailerset.Iftheirgoalwastolowertheirfrontpagepriceperceptionduringholiday2013,thenBestBuy’sshiftinpricingappearstobeinlinewiththeirstrategy.IftheirstrategywastobethelowpriceleaderduringNovember,thentheycouldusethisreporttomakeadjustmentsbasedontheircompetitor’spricing.
Pricingisacriticaldriverforshoppers,soitisimportantasaconsumerinsightsmanagertobefamiliarwithwherepricehastrendedoverthepast36to48months,howtheirpricingcomparestotheircompetitorsinbothprintanddigitalmedia,andwhatchangestheyshouldrecommendforfuturekeyeventsandholidaystoensuretheirexecutionisinlinewiththeirstrategy.
How have the promoted prices on our competitors’ promotional feature pages changed over time?
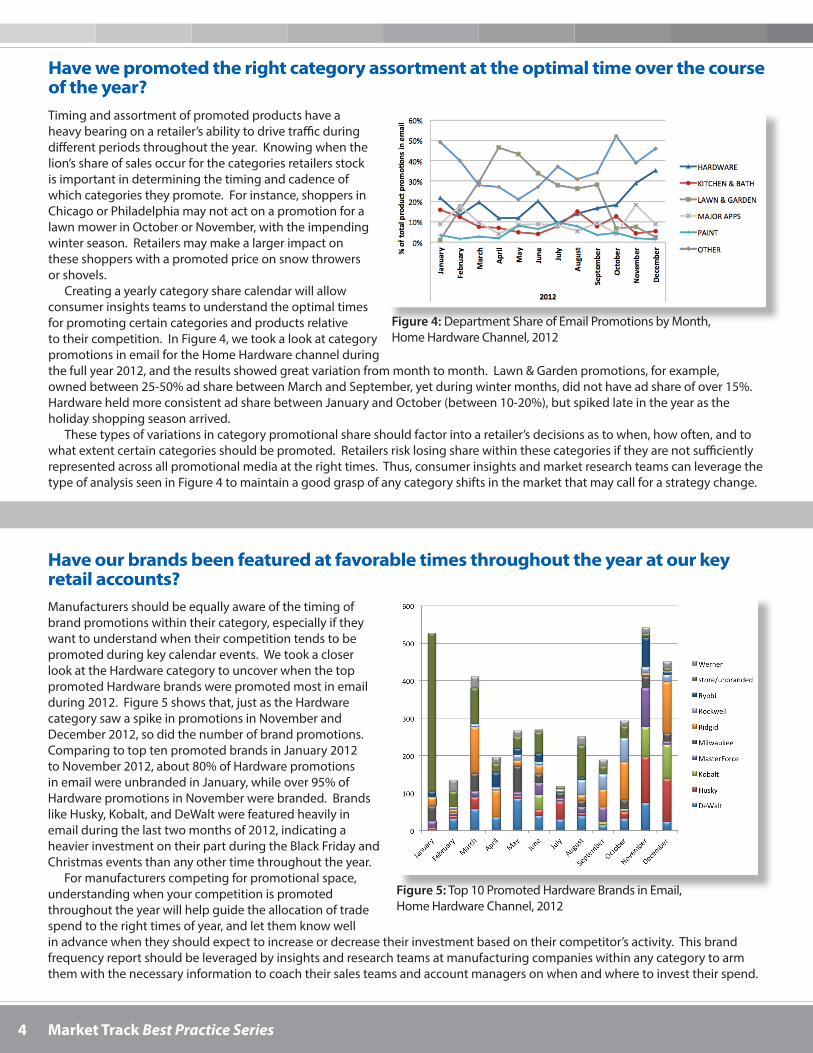
DigitalTVswereaprimarydriverofthehigherpromotedpricesduringholiday2013,andwithinthecategory,selectmanufacturerssawtheirretailerpartnersfeaturesomeoftheirhigherticketproductsduringNovember.Figure3showstheaverage,highest,andlowestpromotedpricesinprintatBestBuyforfiveofthetoppromotedTVmanufacturerswithintheDigitalTVscategoryduringNovember2011through2013.Thistypeofanalysiscanbeusedbymanufacturerstodeterminewheretheyhavebeenpricedrelativetocompetitionwithintheircategoryoverthepastfewyears.
InFigure3,eachofthefivebrandssawtheirhighestpromotedpriceinthelastthreeyearsfortheirTVproducts.Thisisindicativeofthelargertrendduringholiday2013ofretailerspromotinghigherticketproductsatagoodvalue.Foreachindividualbrand,though,thispricingreportshouldbeusedforbothareviewofhowtheirpricingstrategycomparedtootherbrandsinthemarketforthatperiod,andforplanningmulti-channelpricingstrategyforholiday2014.IfLGplannedtohavethelowestpricepromotiononaTVatBestBuyduringNovember,thisreportquicklypointsoutInsigniaandSamsunghasbeingfeaturedatlowerpricepointsduringtheNovembertimeframe.Similarly,ifInsigniawantedtheiraveragepricestobemoreonparwithtoppromotedbrandslikeSamsung,theymayrecommendachangeofpromotedproductassortmentduringholiday2014.
Justasconsumerinsightsteamsatretailcompaniesneedtohaveagoodgraspofwheretheircompetitionispricedduringcriticalcalendarperiods,manufacturersshouldhavethesameknowledgeoftheircompetitivepricinglandscape.Beingpricedtoohighortoolowrelativetocompetitioncanmakeaorbreakacriticalsellingseasonforamanufacturer,andhavingvisibilityintopricetrendsallowsmanufacturerstoproactivelyproofagainstcompetitivethreatsduringfuturekeyevents.
Have our brands been among the lowest/highest promoted products within our category during holidays or key event periods?
Figure 2:FrontPagePricePerception,EarlyHoliday(November)2011-13
Figure 3:Average,High,LowPromotedPricebyBrand,BestBuy,DigitalTVs,November2011-13
4 Market Track Best Practice Series
Manufacturersshouldbeequallyawareofthetimingofbrandpromotionswithintheircategory,especiallyiftheywanttounderstandwhentheircompetitiontendstobepromotedduringkeycalendarevents.WetookacloserlookattheHardwarecategorytouncoverwhenthetoppromotedHardwarebrandswerepromotedmostinemailduring2012.Figure5showsthat,justastheHardwarecategorysawaspikeinpromotionsinNovemberandDecember2012,sodidthenumberofbrandpromotions.ComparingtotoptenpromotedbrandsinJanuary2012toNovember2012,about80%ofHardwarepromotionsinemailwereunbrandedinJanuary,whileover95%ofHardwarepromotionsinNovemberwerebranded.BrandslikeHusky,Kobalt,andDeWaltwerefeaturedheavilyinemailduringthelasttwomonthsof2012,indicatingaheavierinvestmentontheirpartduringtheBlackFridayandChristmaseventsthananyothertimethroughouttheyear.
Formanufacturerscompetingforpromotionalspace,understandingwhenyourcompetitionispromotedthroughouttheyearwillhelpguidetheallocationoftradespendtotherighttimesofyear,andletthemknowwellinadvancewhentheyshouldexpecttoincreaseordecreasetheirinvestmentbasedontheircompetitor’sactivity.Thisbrandfrequencyreportshouldbeleveragedbyinsightsandresearchteamsatmanufacturingcompanieswithinanycategorytoarmthemwiththenecessaryinformationtocoachtheirsalesteamsandaccountmanagersonwhenandwheretoinvesttheirspend.
Timingandassortmentofpromotedproductshaveaheavybearingonaretailer’sabilitytodrivetrafficduringdifferentperiodsthroughouttheyear.Knowingwhenthelion’sshareofsalesoccurforthecategoriesretailersstockisimportantindeterminingthetimingandcadenceofwhichcategoriestheypromote.Forinstance,shoppersinChicagoorPhiladelphiamaynotactonapromotionforalawnmowerinOctoberorNovember,withtheimpendingwinterseason.Retailersmaymakealargerimpactontheseshopperswithapromotedpriceonsnowthrowersorshovels.
Creatingayearlycategorysharecalendarwillallowconsumerinsightsteamstounderstandtheoptimaltimesforpromotingcertaincategoriesandproductsrelativetotheircompetition.InFigure4,wetookalookatcategorypromotionsinemailfortheHomeHardwarechannelduringthefullyear2012,andtheresultsshowedgreatvariationfrommonthtomonth.Lawn&Gardenpromotions,forexample,ownedbetween25-50%adsharebetweenMarchandSeptember,yetduringwintermonths,didnothaveadshareofover15%.HardwareheldmoreconsistentadsharebetweenJanuaryandOctober(between10-20%),butspikedlateintheyearastheholidayshoppingseasonarrived.
Thesetypesofvariationsincategorypromotionalshareshouldfactorintoaretailer’sdecisionsastowhen,howoften,andtowhatextentcertaincategoriesshouldbepromoted.Retailersrisklosingsharewithinthesecategoriesiftheyarenotsufficientlyrepresentedacrossallpromotionalmediaattherighttimes.Thus,consumerinsightsandmarketresearchteamscanleveragethetypeofanalysisseeninFigure4tomaintainagoodgraspofanycategoryshiftsinthemarketthatmaycallforastrategychange.
Have we promoted the right category assortment at the optimal time over the course of the year?
Figure 4:DepartmentShareofEmailPromotionsbyMonth,HomeHardwareChannel,2012
Have our brands been featured at favorable times throughout the year at our key retail accounts?
Figure 5:Top10PromotedHardwareBrandsinEmail,HomeHardwareChannel,2012


